
Lake Expansion under the Groundwater Contribution in Qaidam Basin, China

Abstract
:
1. Introduction
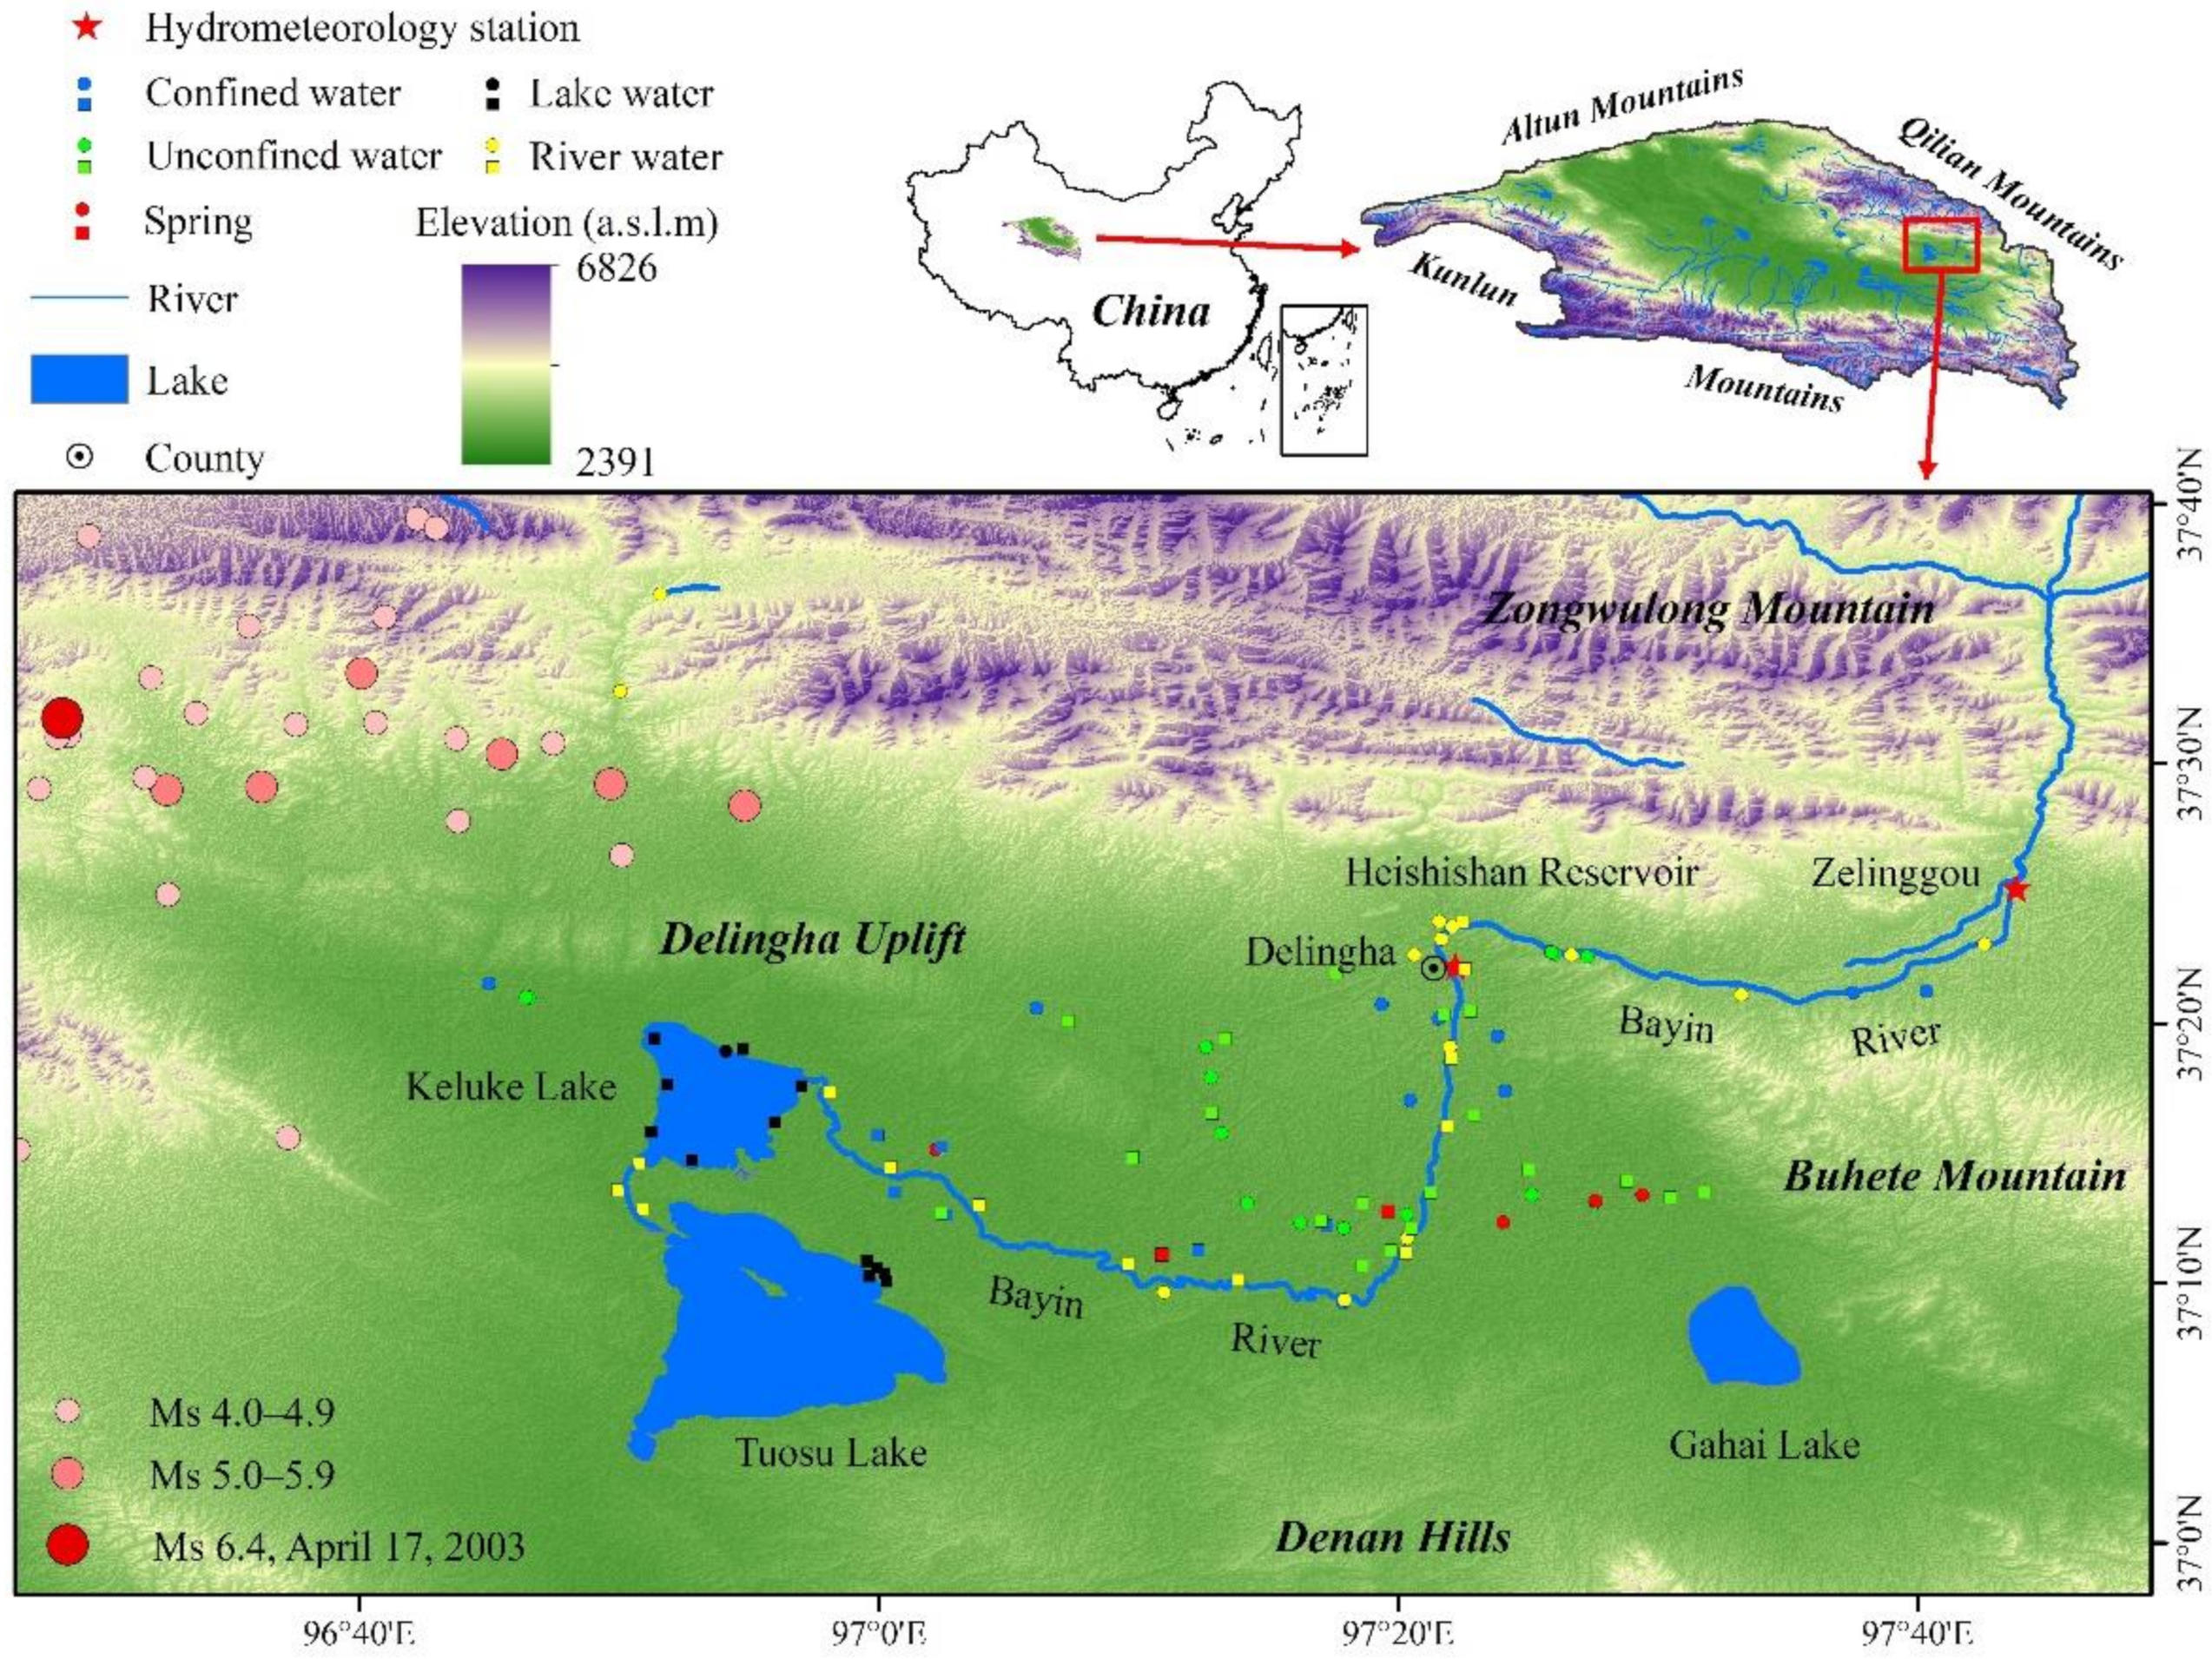
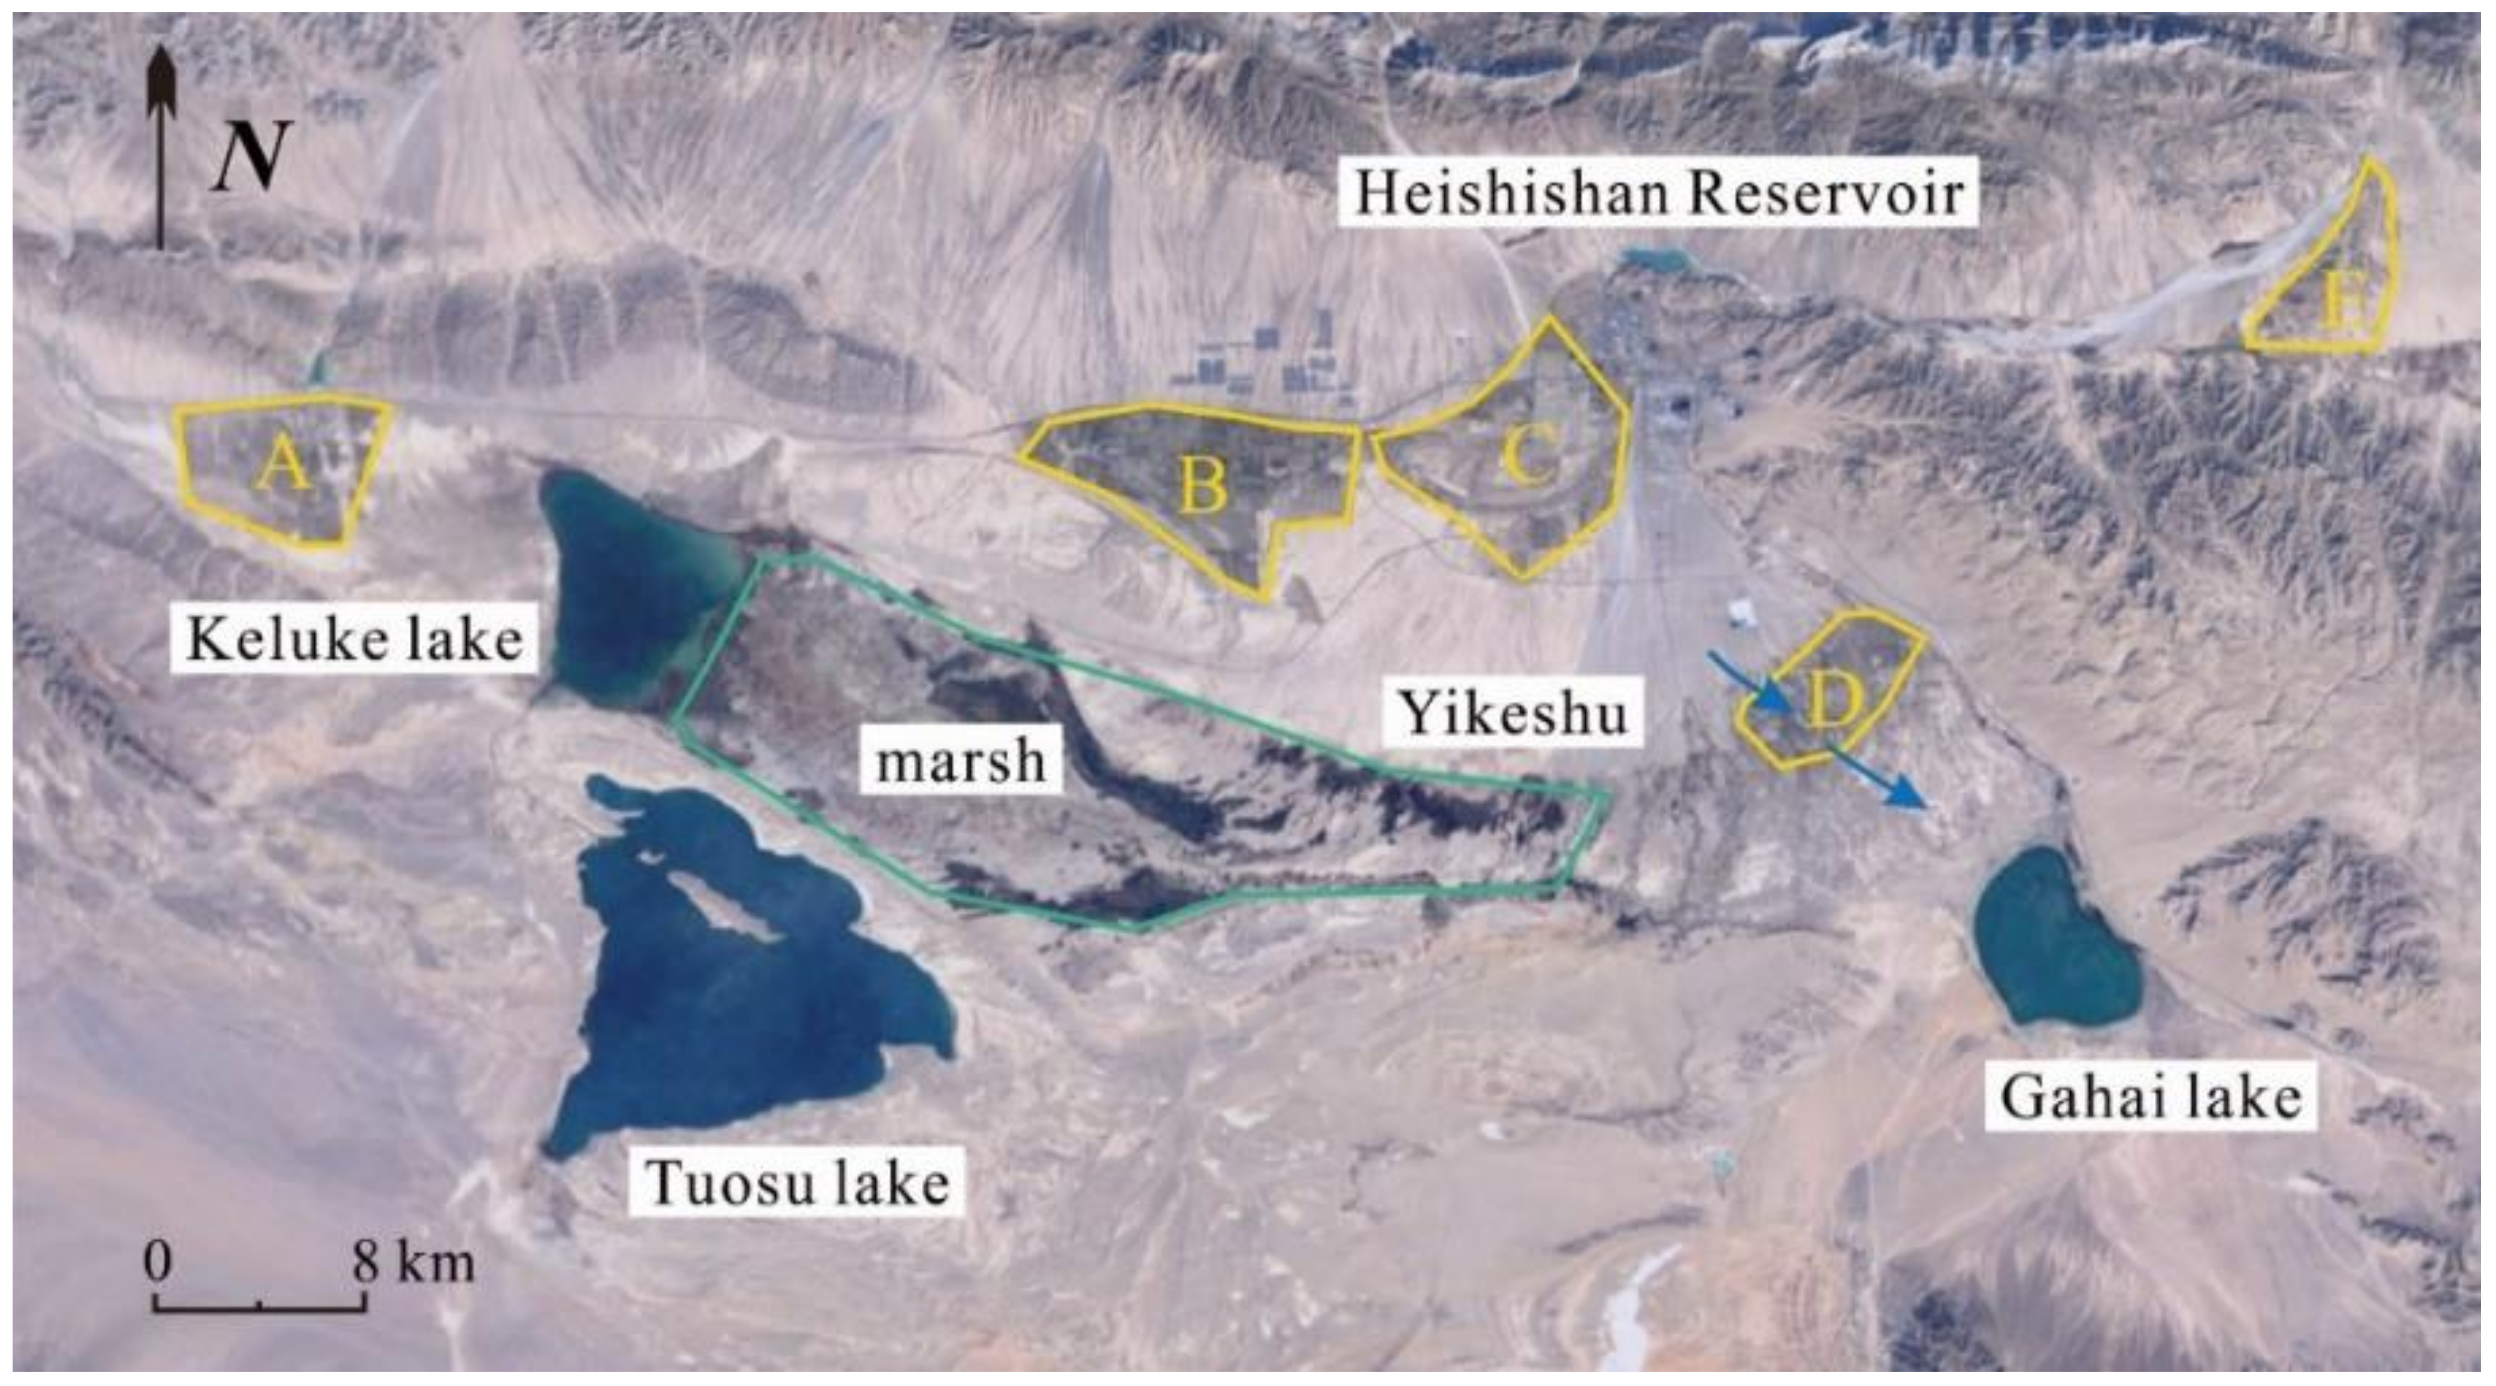
2. Study Region
3. Methods
3.1. Landsat Data and Lake Surface Area Extraction
3.2. Hydrological and Meteorological Monitoring Data
3.3. Penman–Monteith Model
3.4. Sampling and Isotope Measurements
4. Results
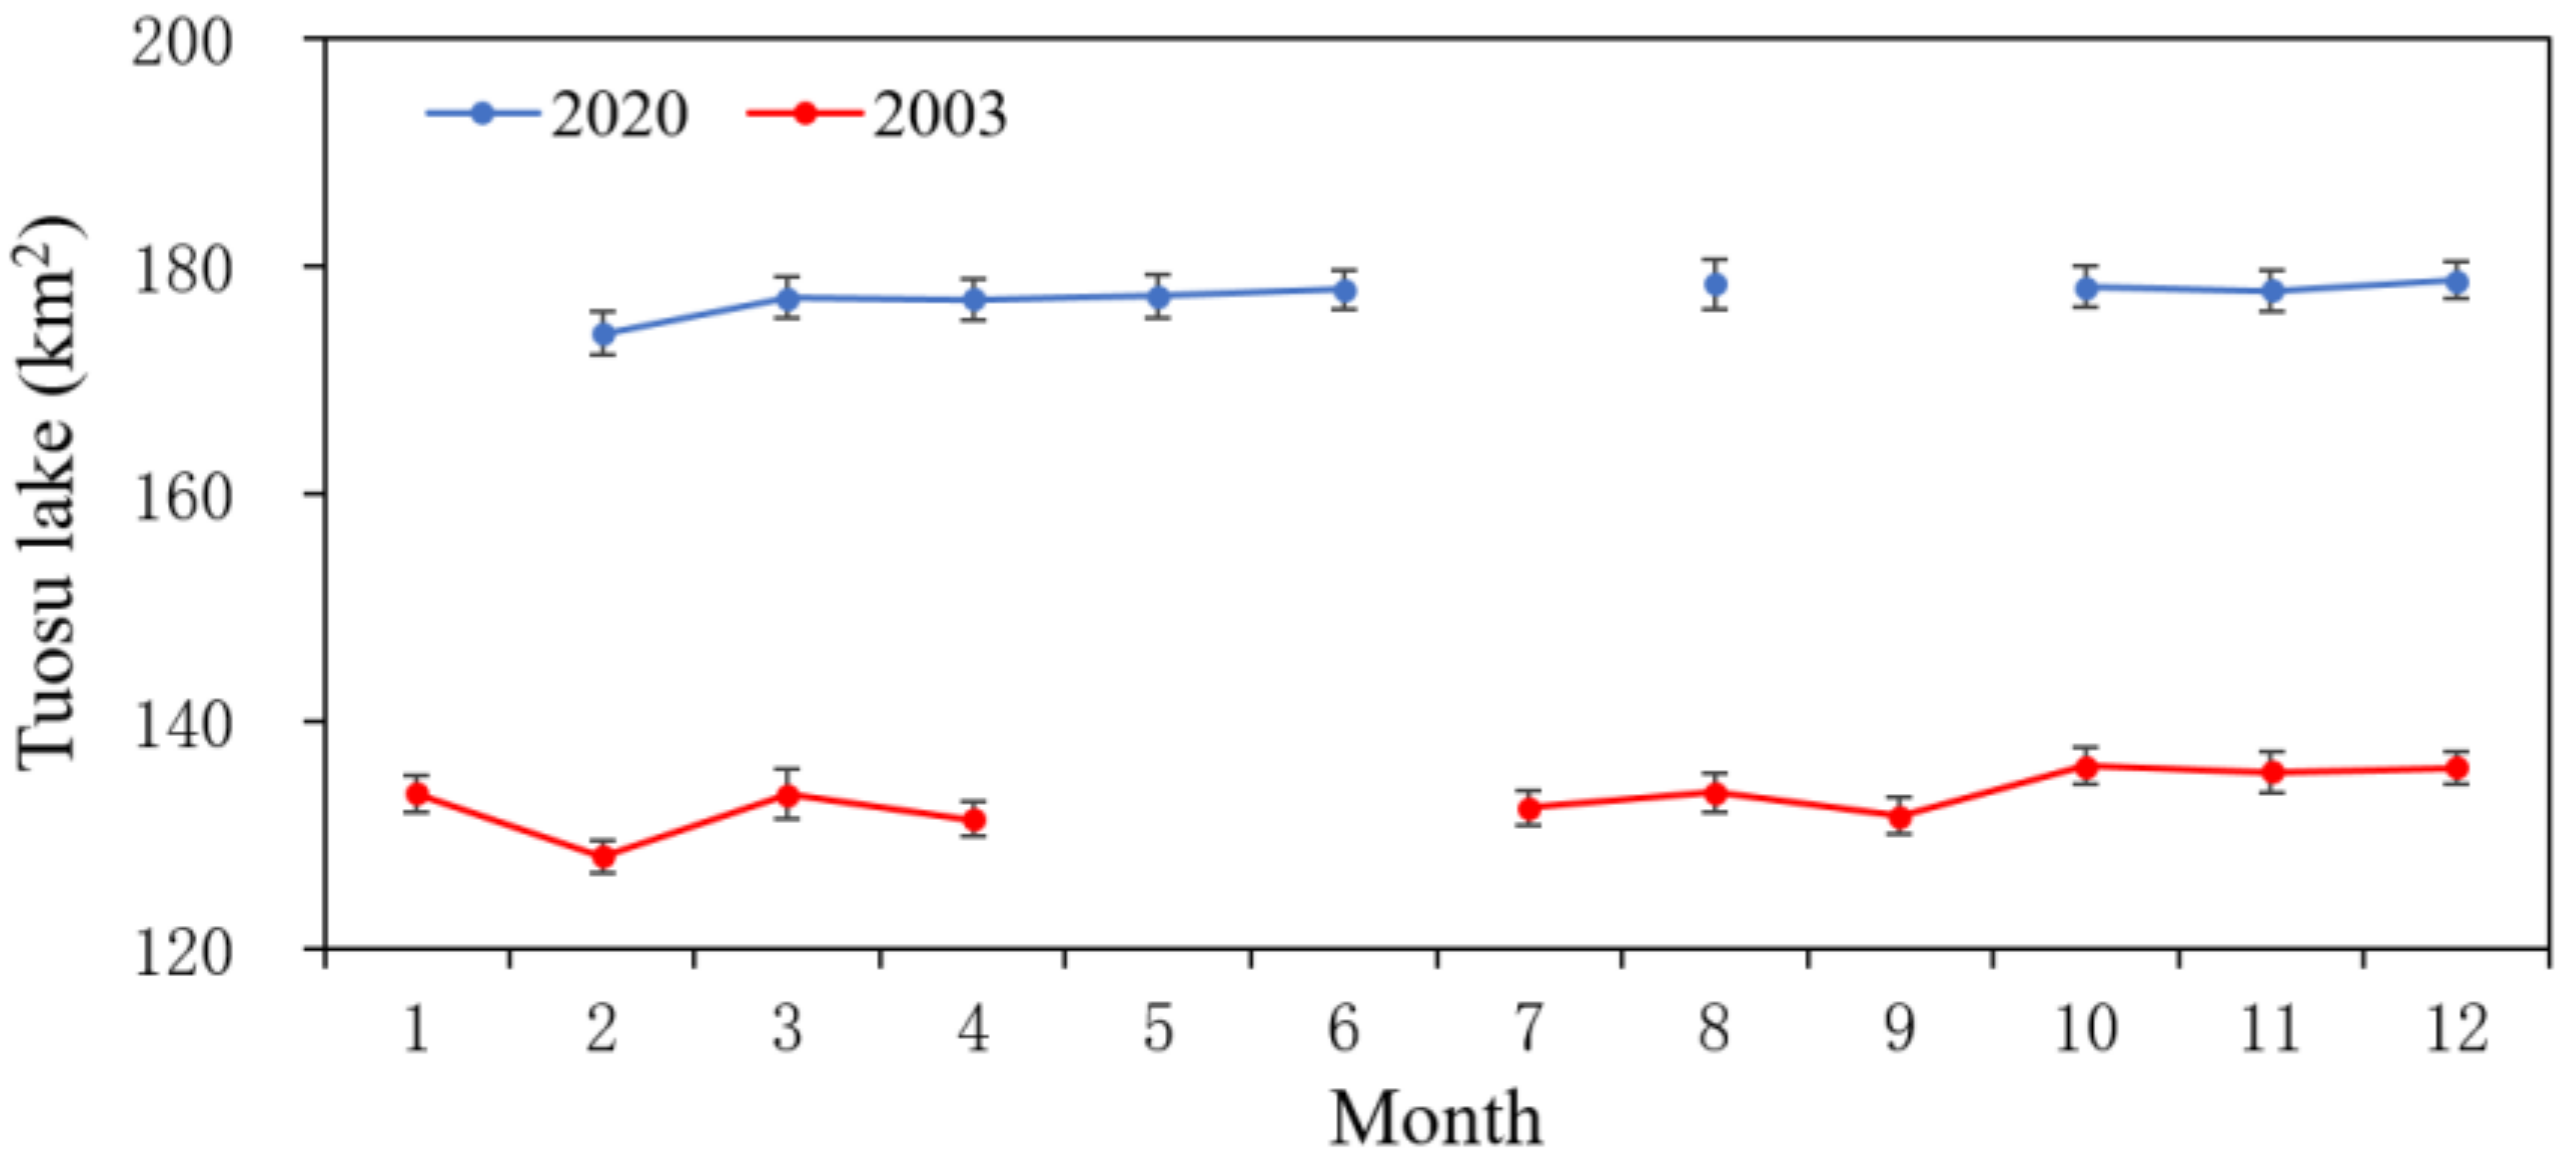
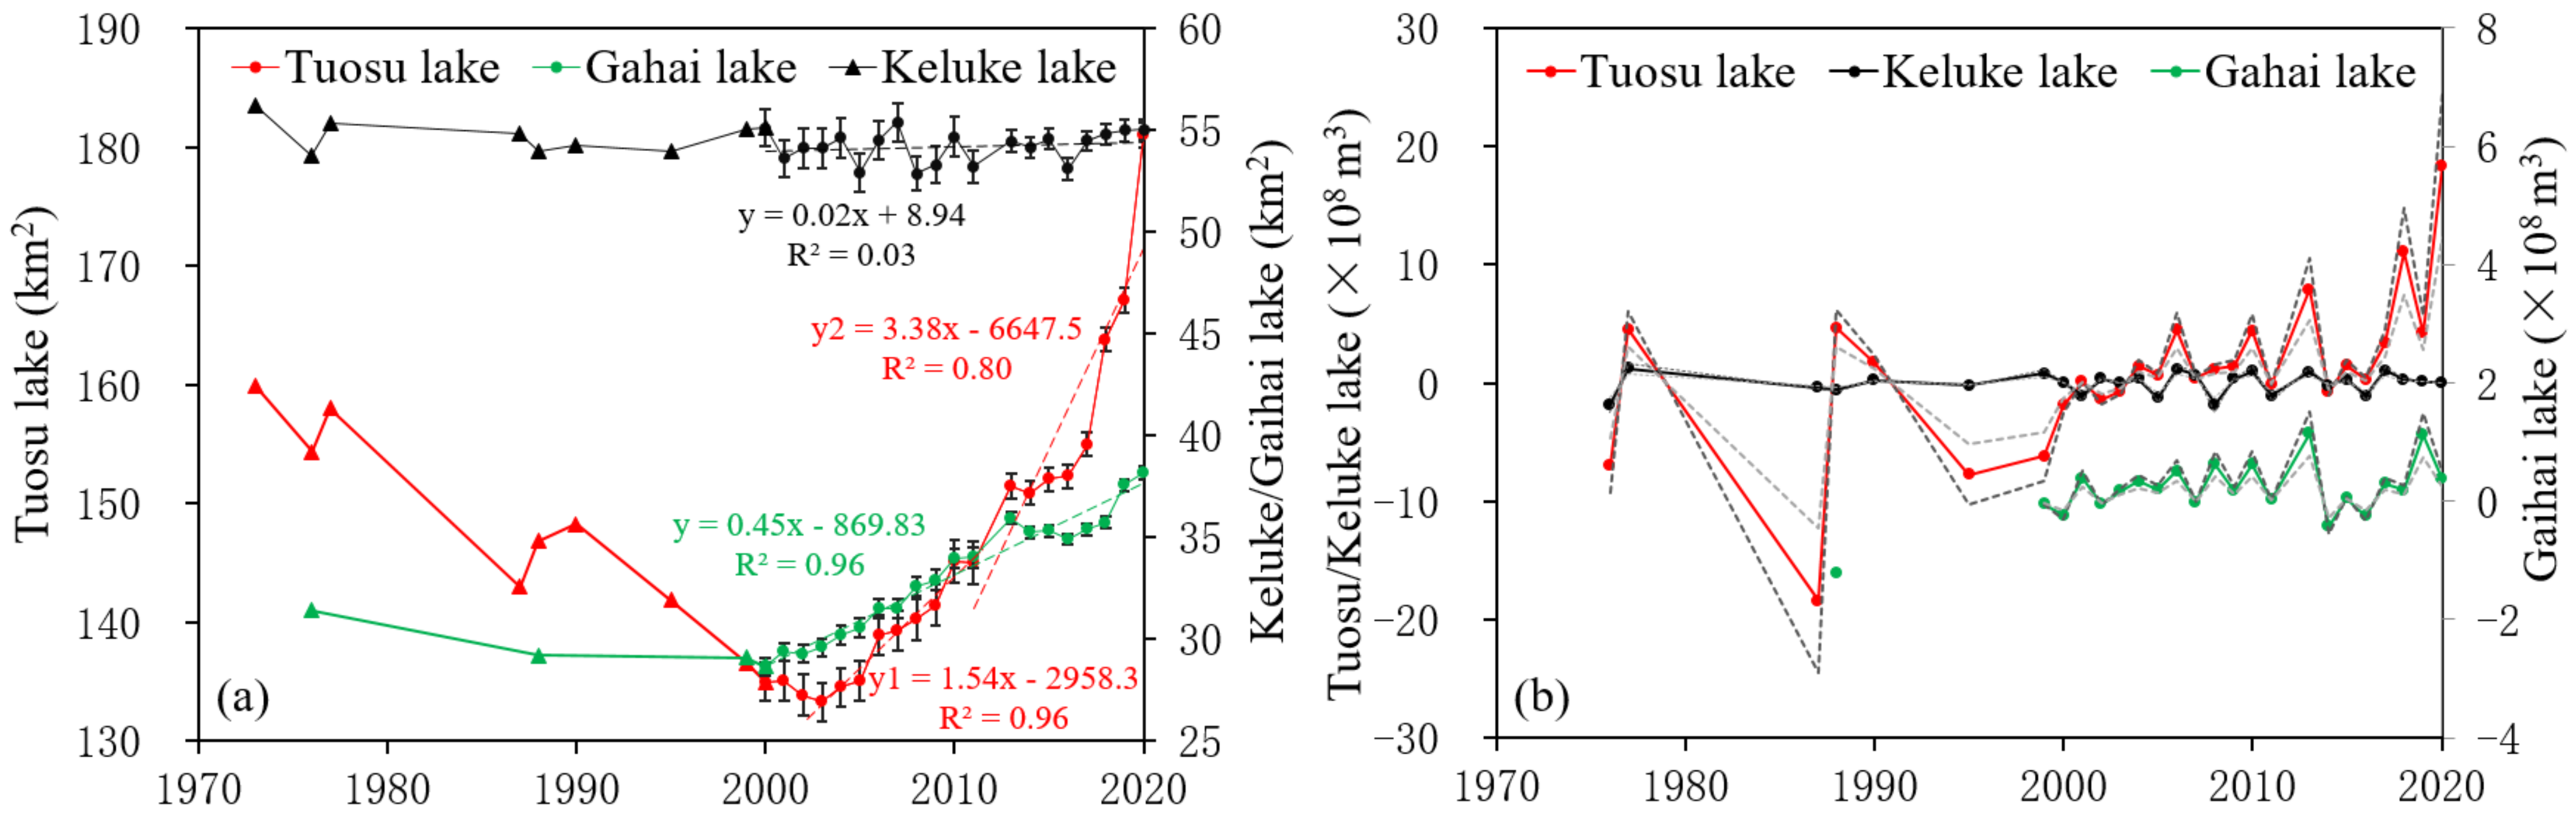
4.1. Long-Term Changes in Lake Surface Area
4.2. Lake Evaporation Calculated by the Improved Penman–Monteith Model
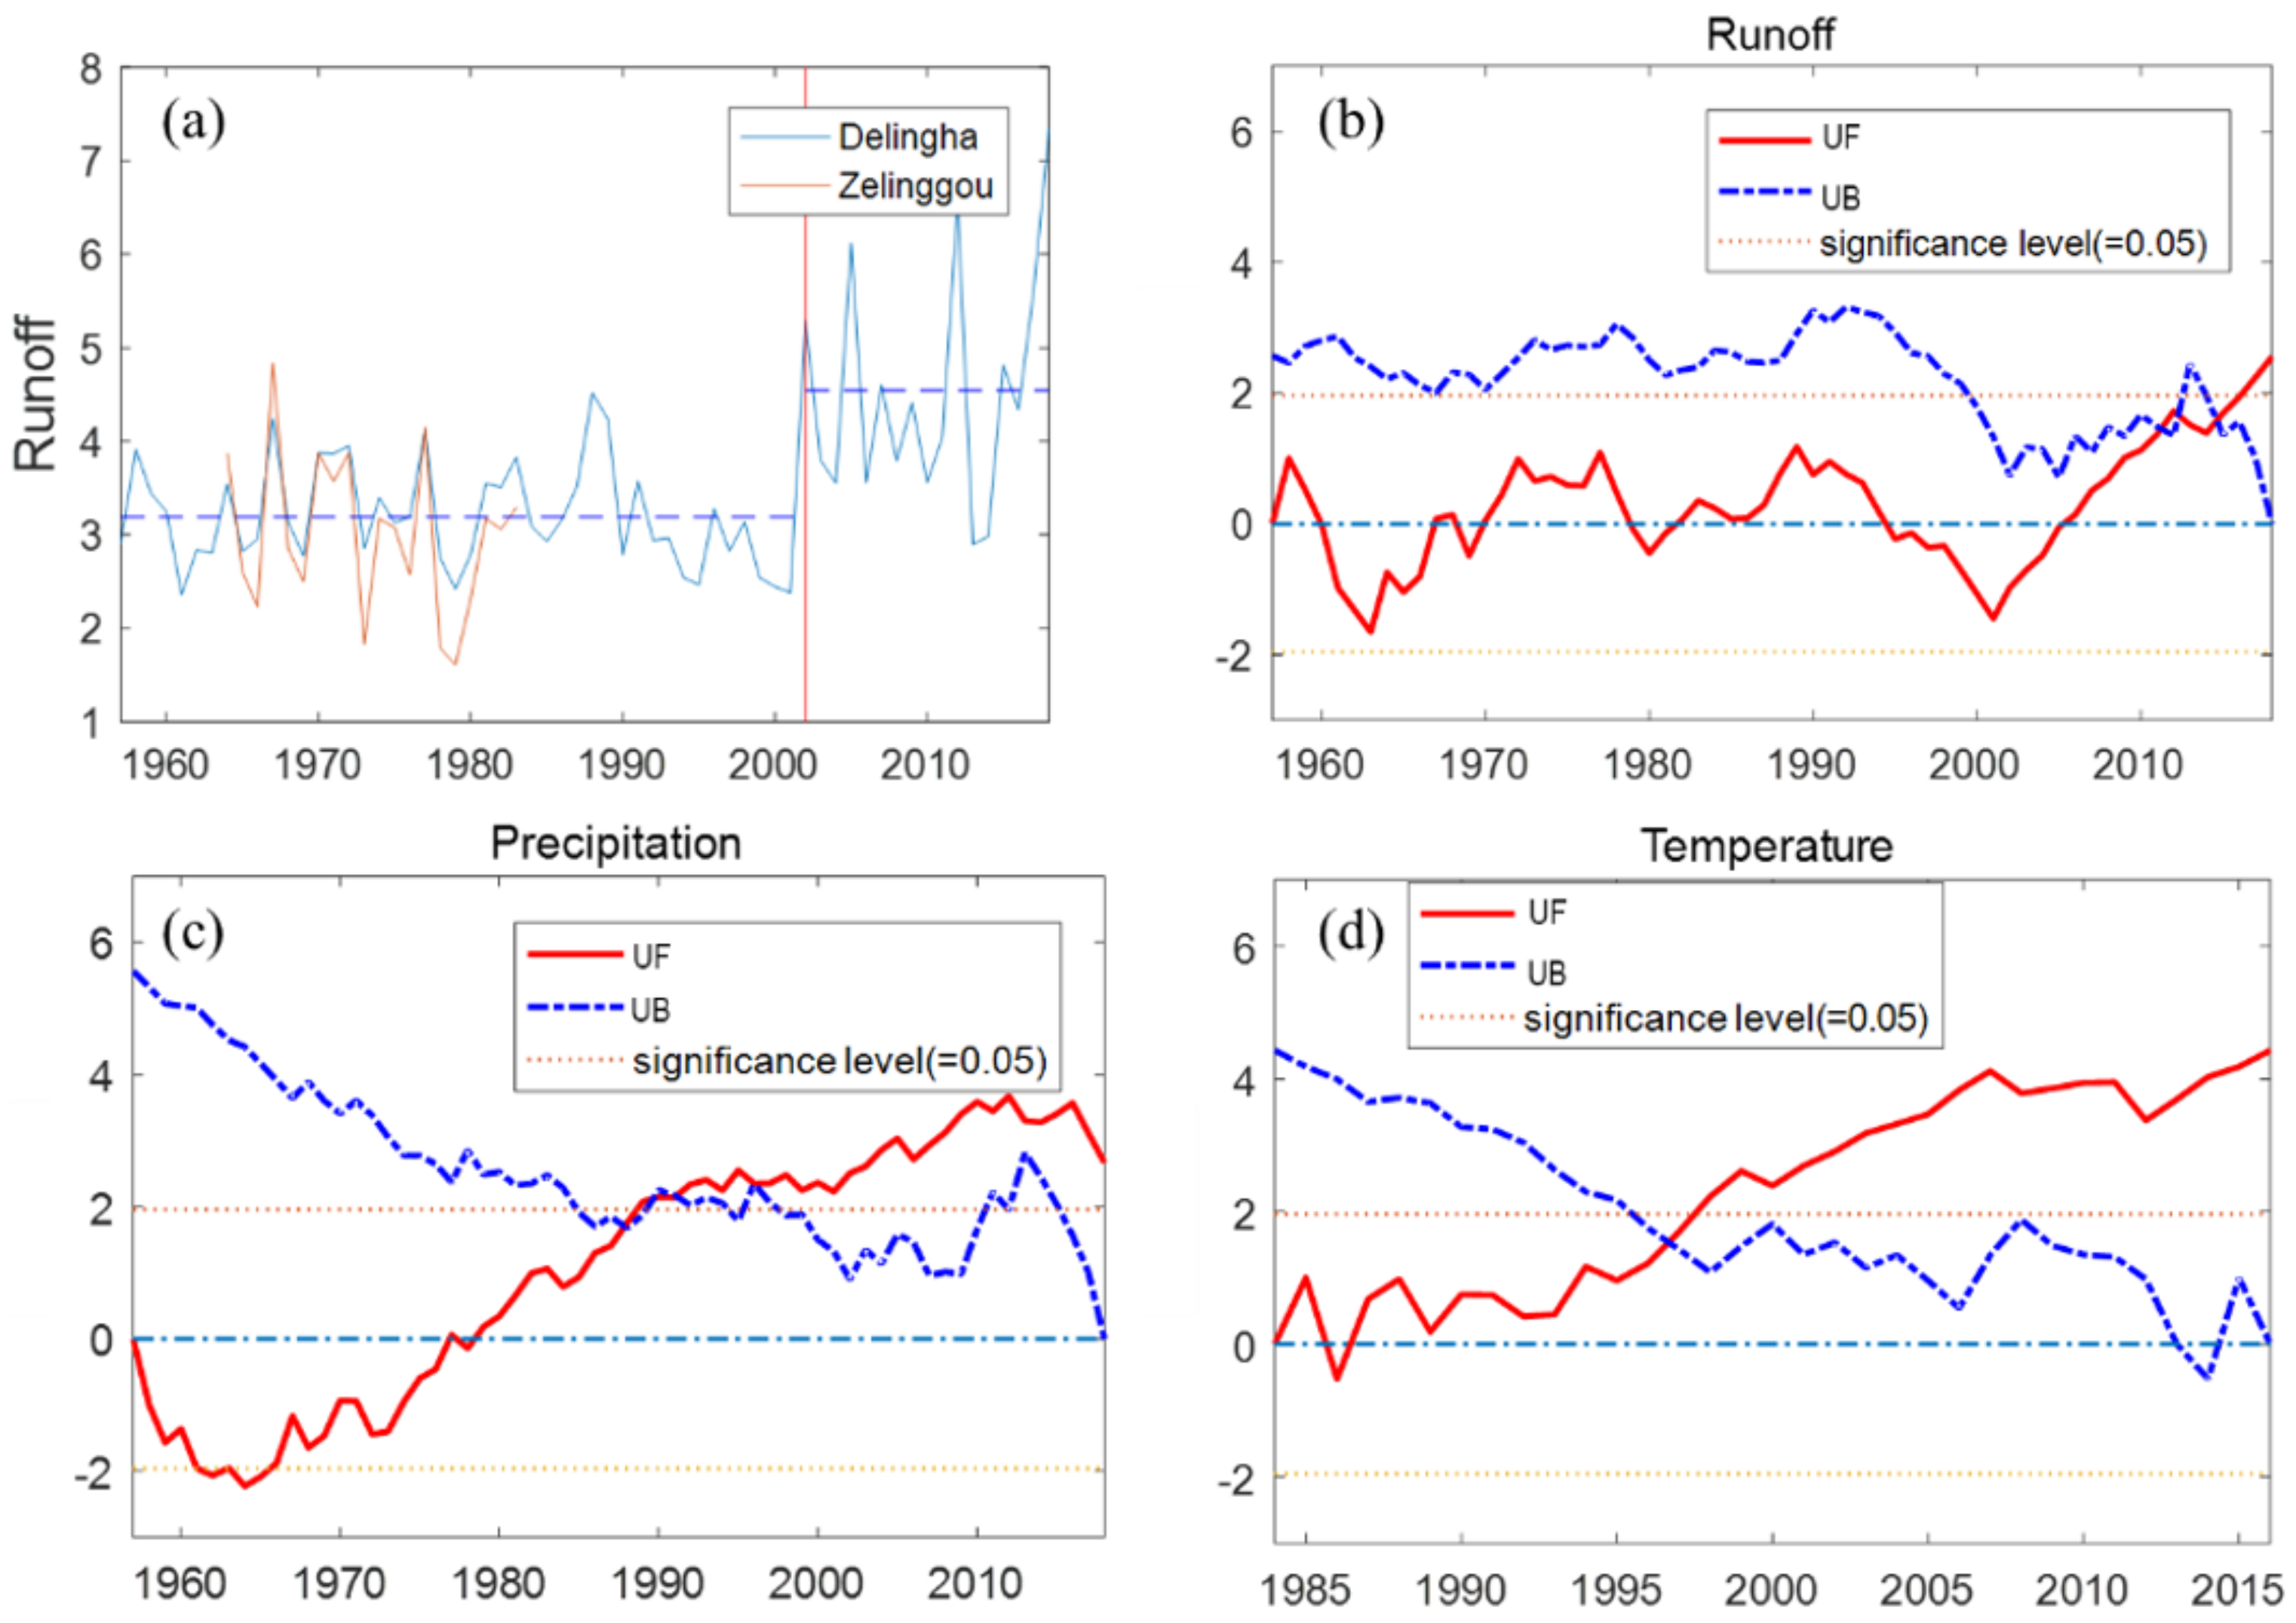
4.3. Annual Hydrometeorological Trends
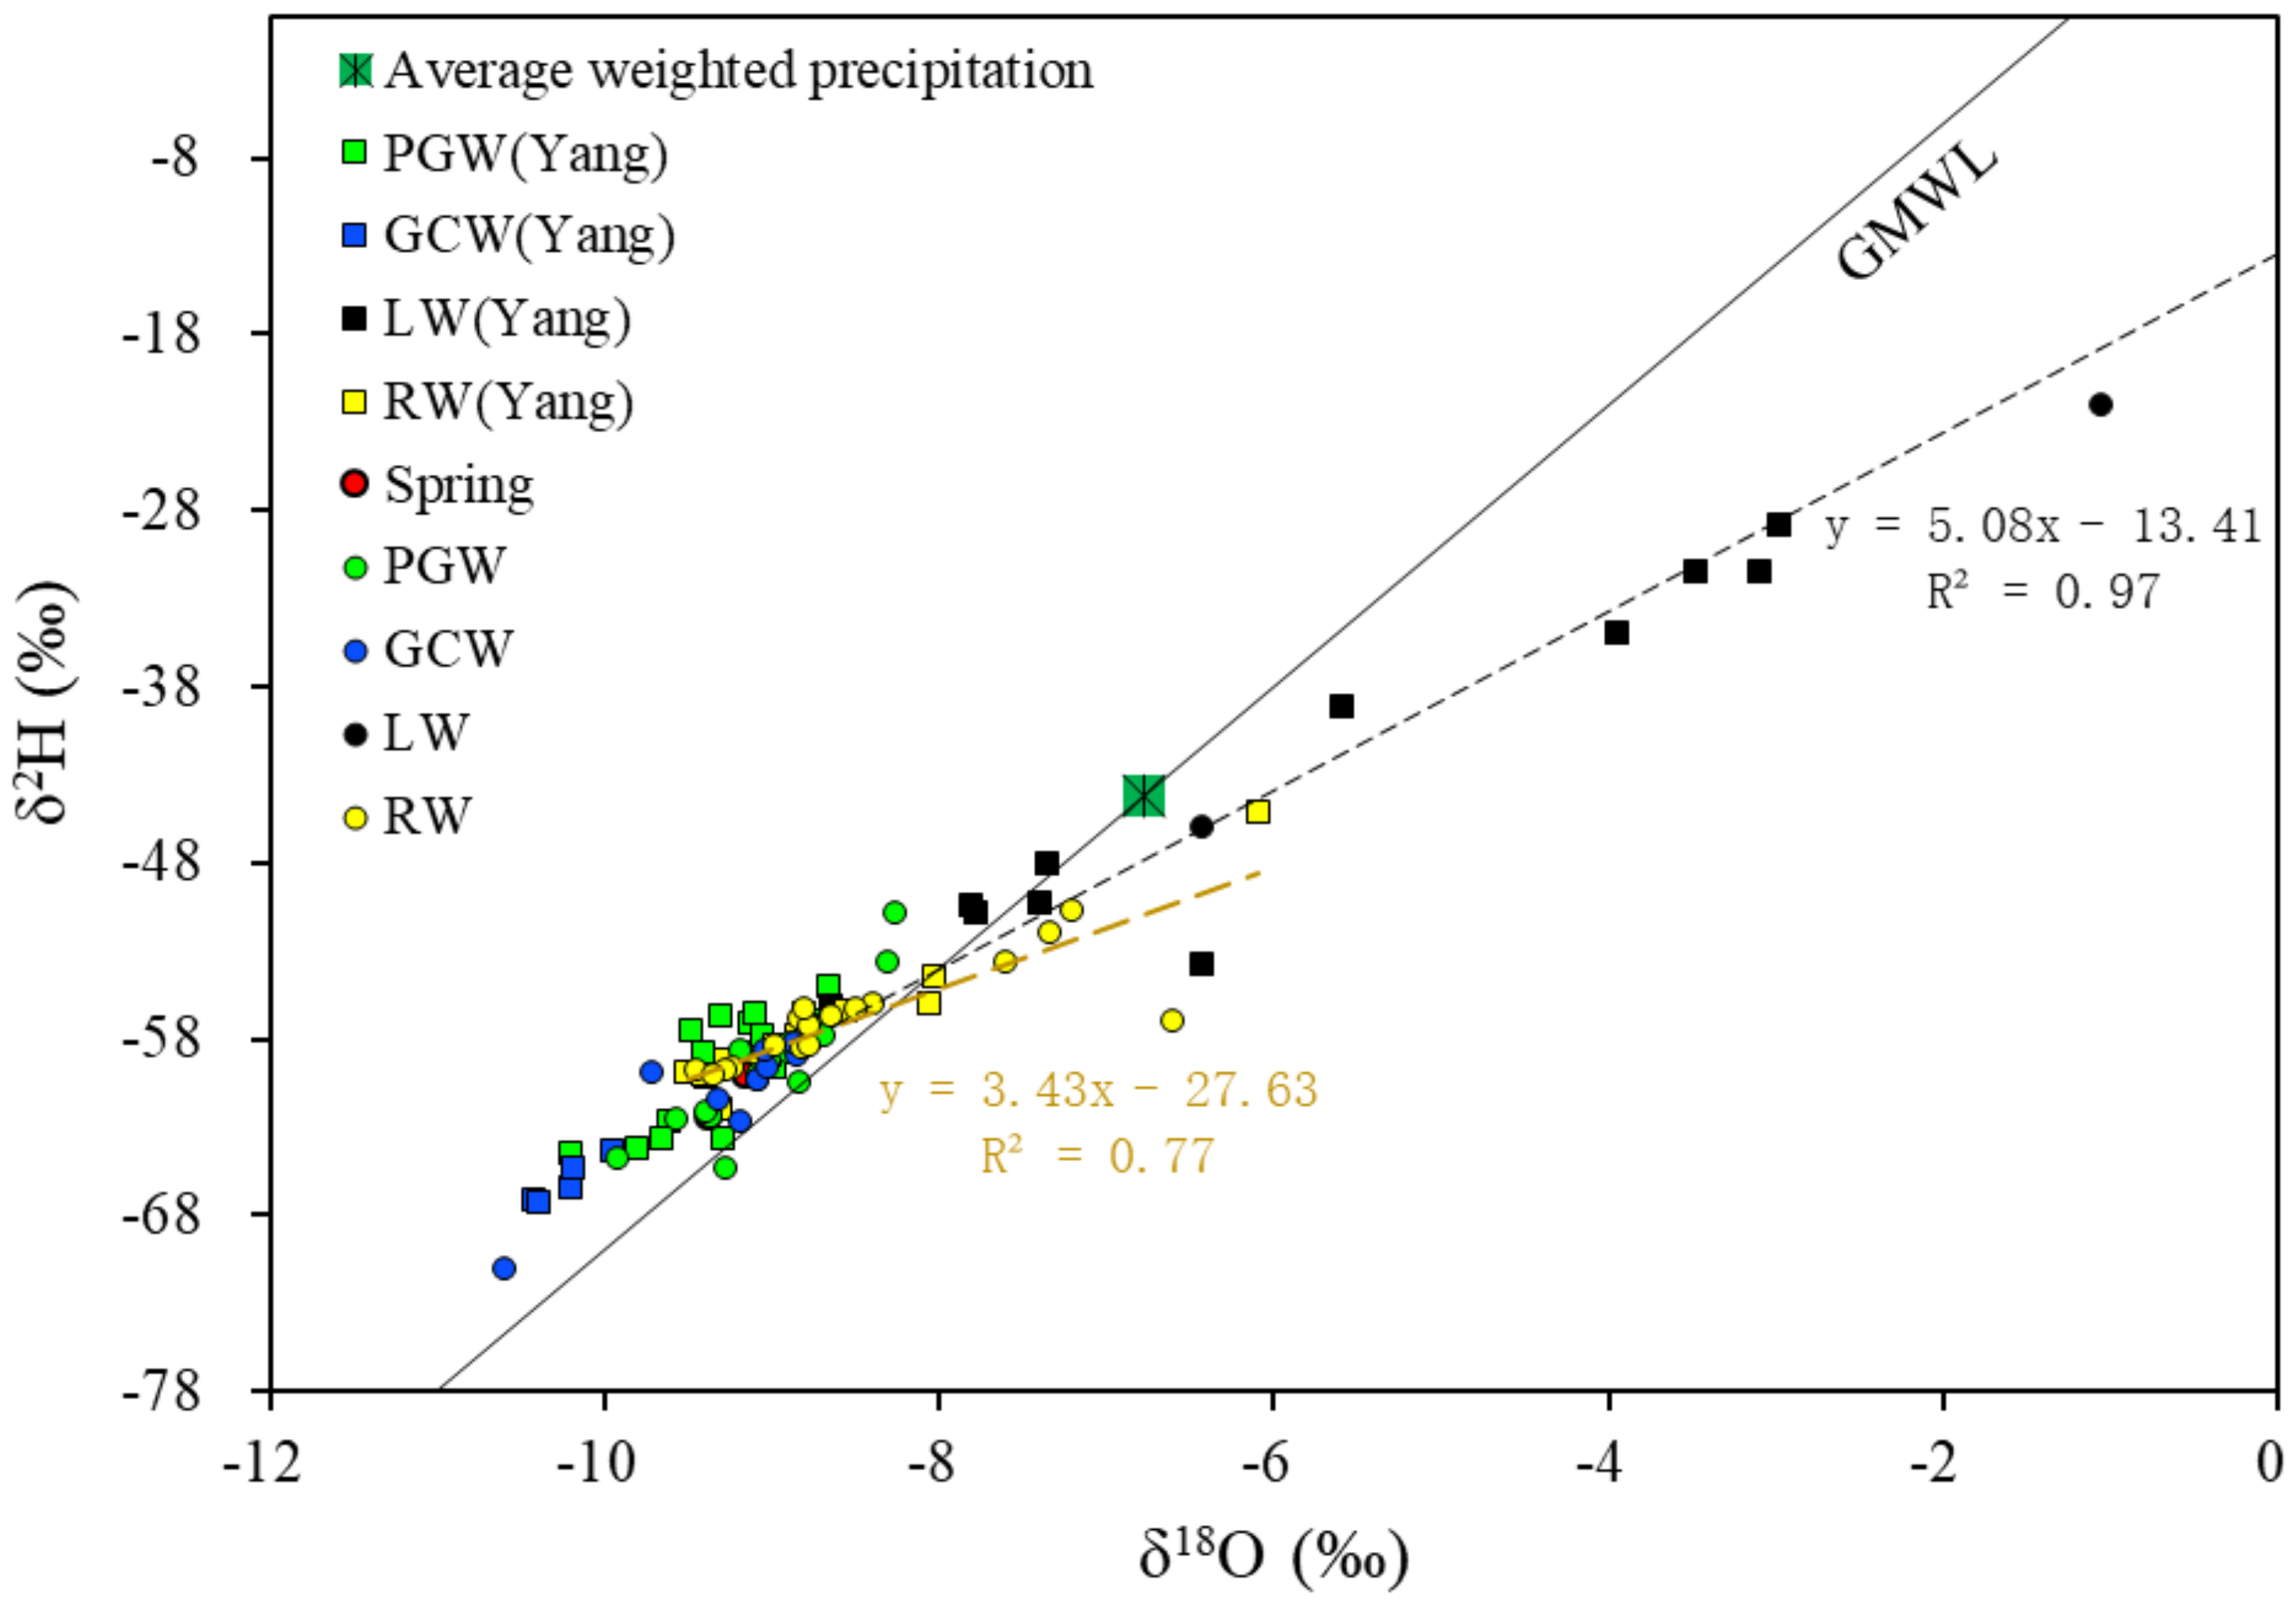
4.4. Isotopic Characteristics of Surface Water, Groundwater, and Spring Water
5. Discussion
5.1. Potential Causes of Lake Expansion
5.2. Sources of Groundwater Contribution to Lakes
5.3. Uncertainty in Lake Evaporation Calculations
5.4. Mitigating the Environmental Effects of Lake Expansion
6. Conclusions
Author Contributions
Funding
Institutional Review Board Statement
Informed Consent Statement
Data Availability Statement
Acknowledgments
Conflicts of Interest
References
- Yang, K.; Wang, J.; Lei, Y.; Chen, Y.; Zhu, L.; Ding, B.; Qin, J. Quantifying evaporation and its decadal change for Lake Nam Co, central Tibetan Plateau. J. Geophys. Res. Atmos. 2016, 121, 7578–7591. [Google Scholar] [CrossRef]
- Wang, X.; Gong, P.; Zhao, Y.; Xu, Y.; Cheng, X.; Niu, Z.; Luo, Z.; Huang, H.; Sun, F.; Li, X. Water-level changes in China’s large lakes determined from ICESat/GLAS data. Remote Sens. Environ. 2013, 132, 131–144. [Google Scholar] [CrossRef]
- Zhang, G.; Yao, T.; Xie, H.; Zhang, K.; Zhu, F. Lakes’ state and abundance across the Tibetan Plateau. Chin. Sci. Bull. 2014, 59, 3010–3021. [Google Scholar] [CrossRef]
- Zhang, G.; Xie, H.; Kang, S.; Yi, D.; Ackley, S.F. Monitoring lake level changes on the Tibetan Plateau using ICESat altimetry data (2003–2009). Remote Sens. Environ. 2011, 115, 1733–1742. [Google Scholar] [CrossRef]
- Lei, Y.; Yao, T.; Bird, B.W.; Yang, K.; Zhai, J.; Sheng, Y. Coherent lake growth on the central Tibetan Plateau since the 1970s: Characterization and attribution. J. Hydrol. 2013, 483, 61–67. [Google Scholar] [CrossRef]
- Lei, Y.; Yang, K.; Wang, B.; Sheng, Y.; Bird, B.W.; Zhang, G.; Tian, L. Response of inland lake dynamics over the Tibetan Plateau to climate change. Clim. Change 2014, 125, 281–290. [Google Scholar] [CrossRef]
- Song, C.; Huang, B.; Richards, K.; Ke, L.; Phan, V.H. Accelerated lake expansion on the Tibetan Plateau in the 2000s: Induced by glacial melting or other processes? Water Resour. Res. 2014, 50, 3170–3186. [Google Scholar] [CrossRef] [Green Version]
- Li, X.Y.; Xu, H.Y.; Sun, Y.L.; Zhang, D.S.; Yang, Z.P. Lake-level change and water balance analysis at lake Qinghai, West China during recent decades. Water Resour. Manag. 2007, 21, 1505–1516. [Google Scholar] [CrossRef]
- Tan, H.; Zhang, Y.; Rao, W.; Guo, H.; Ta, W.; Lu, S.; Cong, P. Rapid groundwater circulation inferred from temporal water dynamics and isotopes in an arid system. Hydrol. Process. 2021, 35, e14225. [Google Scholar] [CrossRef]
- Wiebe, A.J.; Conant, B.; Rudolph, D.L.; Korkka-Niemi, K. An approach to improve direct runoff estimates and reduce uncertainty in the calculated groundwater component in water balances of large lakes. J. Hydrol. 2015, 531, 655–670. [Google Scholar] [CrossRef]
- Yang, N.; Zhou, P.; Wang, G.; Zhang, B.; Shi, Z.; Liao, F.; Li, B.; Chen, X.; Guo, L.; Dang, X.; et al. Hydrochemical and isotopic interpretation of interactions between surface water and groundwater in Delingha, Northwest China. J. Hydrol. 2021, 598, 126243. [Google Scholar] [CrossRef]
- Yong, B.; Wang, C.Y.; Chen, J.; Chen, J.; Barry, D.A.; Wang, T.; Li, L. Missing water from the Qiangtang Basin on the Tibetan Plateau. Geology 2021, 49, 867–872. [Google Scholar] [CrossRef]
- Wen, G.; Wang, W.; Duan, L.; Gu, X.; Li, Y.; Zhao, J. Quantitatively evaluating exchanging relationship between river water and groundwater in Bayin River Basin of northwest China using hydrochemistry and stable isotope. Arid Land Geogr. 2018, 41, 734–743. [Google Scholar]
- Qin, B.; Qun, H. Evaluation of the climatic change impacts on the inland lake—A case study of Lake Qinghai, China. Clim. Change 1998, 39, 695–714. [Google Scholar] [CrossRef]
- McJannet, D.L.; Cook, F.J.; Burn, S. Comparison of techniques for estimating evaporation from an irrigation water storage. Water Resour. Res. 2013, 49, 1415–1428. [Google Scholar] [CrossRef]
- McJannet, D.L.; Webster, I.T.; Cook, F.J. An area-dependent wind function for estimating open water evaporation using land-based meteorological data. Environ. Model. Softw. 2012, 31, 76–83. [Google Scholar] [CrossRef]
- Rodrigues, I.S.; Costa, C.A.G.; Lima Neto, I.E.; Hopkinson, C. Trends of evaporation in Brazilian tropical reservoirs using remote sensing. J. Hydrol. 2021, 598, 126473. [Google Scholar] [CrossRef]
- Li, W.; Brunner, P.; Hendricks Franssen, H.J.; Li, Z.; Wang, Z.; Zhang, Z.; Wang, W. Potential evaporation dynamics over saturated bare soil and an open water surface. J. Hydrol. 2020, 590, 125140. [Google Scholar] [CrossRef]
- Altho, D.; Neiva, L.; David, D.; Couto, H. Improving methods for estimating small reservoir evaporation in the Brazilian Savanna. Agric. Water Manag. 2019, 216, 105–112. [Google Scholar] [CrossRef]
- Zhang, G.; Yao, T.; Shum, C.K.; Yi, S.; Yang, K.; Xie, H.; Feng, W.; Bolch, T.; Wang, L.; Behrangi, A.; et al. Lake volume and groundwater storage variations in Tibetan Plateau’s endorheic basin. Geophys. Res. Lett. 2017, 44, 5550–5560. [Google Scholar] [CrossRef]
- Yang, K.; Yao, F.; Wang, J.; Luo, J.; Shen, Z.; Wang, C.; Song, C. Recent dynamics of alpine lakes on the endorheic Changtang Plateau from multi-mission satellite data. J. Hydrol. 2017, 552, 633–645. [Google Scholar] [CrossRef]
- Xiao, Y.; Shao, J.; Frape, S.K.; Cui, Y.; Dang, X.; Wang, S.; Ji, Y. Groundwater origin, flow regime and geochemical evolution in arid endorheic watersheds: A case study from the Qaidam Basin, northwestern China. Hydrol. Earth Syst. Sci. 2018, 22, 4381–4400. [Google Scholar] [CrossRef] [Green Version]
- Zhang, B.; Zhao, D.; Zhou, P.; Qu, S.; Liao, F.; Guangcai, W. Hydrochemical Characteristics of Groundwater and Dominant Water—Rock Interactions in the Delingha. Water 2020, 12, 836. [Google Scholar] [CrossRef] [Green Version]
- Yao, F.; Wang, J.; Yang, K.; Wang, C.; Walter, B.A.; Crétaux, J.F. Lake storage variation on the endorheic Tibetan Plateau and its attribution to climate change since the new millennium. Environ. Res. Lett. 2018, 13, 064011. [Google Scholar] [CrossRef]
- Ma, Y.; Xu, N.; Sun, J.; Wang, X.H.; Yang, F.; Li, S. Estimating water levels and volumes of lakes dated back to the 1980s using Landsat imagery and photon-counting lidar datasets. Remote Sens. Environ. 2019, 232, 111287. [Google Scholar] [CrossRef]
- Xu, N.; Ma, Y.; Zhang, W.; Wang, X.H. Surface-Water-Level Changes during 2003-2019 in Australia Revealed by ICESat/ICESat-2 Altimetry and Landsat Imagery. IEEE Geosci. Remote Sens. Lett. 2021, 18, 1129–1133. [Google Scholar] [CrossRef]
- Paul, F.; Barrand, N.E.; Baumann, S.; Berthier, E.; Bolch, T.; Casey, K.; Frey, H.; Joshi, S.P.; Konovalov, V.; Le Bris, R.; et al. On the accuracy of glacier outlines derived from remote-sensing data. Ann. Glaciol. 2013, 54, 171–182. [Google Scholar] [CrossRef] [Green Version]
- Storey, J.C.; Choate, M.J. Landsat-5 bumper-mode geometric correction. IEEE Trans. Geosci. Remote Sens. 2004, 42, 2695–2703. [Google Scholar] [CrossRef]
- Guan, W.; Cao, B.; Pan, B.; Chen, R.; Shi, M.; Li, K.; Zhao, X.; Sun, X. Updated Surge-Type Glacier Inventory in the West Kunlun Mountains, Tibetan Plateau, and Implications for Glacier Change. J. Geophys. Res. Earth Surf. 2022, 127, e2021JF006369. [Google Scholar] [CrossRef]
- Minora, U.; Bocchiola, D.; D’Agata, C.; Maragno, D.; Mayer, C.; Lambrecht, A.; Vuillermoz, E.; Senese, A.; Compostella, C.; Smiraglia, C.; et al. Glacier Area Stability in the Central Karakoram National Park (Pakistan) in 2001–2010: The “Karakoram Anomaly” in the Spotlight. Prog. Phys. Geogr. 2016, 40, 629–660. [Google Scholar] [CrossRef]
- Du, Y.; Liu, B.; He, W.; Zhou, J.; Duan, S. Analysis on the variation and cause of the lake area in Qaidam Basin from 1976 to 2017. J. Glaciol. Geocryol. 2018, 40, 1275–1284. [Google Scholar] [CrossRef] [Green Version]
- Liu, X.; Wen, Z.; Shu, L.; Lu, C.; Liu, B.; He, H. Analysis of surface area changes of Keluke and Tuosu lakes over past 40 years and influencing factors. Water Resour. Prot. 2014, 30, 28–33+63. [Google Scholar]
- Guo, L.; Wu, Y.; Zheng, H.; Zhang, B.; Wen, M. An Integrated Dataset of Daily Lake Surface Temperature Over Tibetan Plateau (LSWT_TPv1) (1978~2017); National Tibetan Plateau Data Center: Beijing, China, 2021. [Google Scholar]
- Haginoya, S.; Fujii, H.; Kuwagata, T.; Xu, J.; Ishigooka, Y.; Kang, S.; Zhang, Y. Air-Lake interaction features found in heat and water exchanges over Nam Co on the Tibetan Plateau. Sci. Online Lett. Atmos. 2009, 5, 172–175. [Google Scholar] [CrossRef] [Green Version]
- Zhu, L.P.; Xie, M.P.; Wu, Y.H. Quantitative analysis of lake area variations and the influence factors from 1971 to 2004 in the Nam Co basin of the Tibetan Plateau. Chin. Sci. Bull. 2010, 55, 1294–1303. [Google Scholar] [CrossRef]
- Monteith, J.L. Evaporation and Environment. The Stage and Movement of Water in Living Organisms. In Proceedings of the Symposia of the Society for Experimental Biology; The Company of Biologists: Cambridge, UK, 1965. [Google Scholar]
- Penman, H.L. Natural Evaporation from Open Water, Bare Soil and Grass. Proc. R. Soc. Lond. Ser. A 1948, 193, 120–145. [Google Scholar]
- Priestley, C.; Taylor, R.J. On the Assessment of Surface Heat Flux and Evaporation Using Large Scale Parameters. Mon. Weather. Rev. 1972, 100, 81–92. [Google Scholar] [CrossRef]
- De Bruin, H.A.R.; Keijman, J.Q. The Priestley-Taylor Evaporation Model Applied to a Large, Shallow Lake in the Netherlands. J. Appl. Meteorol. Climatol. 1979, 18, 898–903. [Google Scholar] [CrossRef] [Green Version]
- Rosenberry, D.O.; Winter, T.C.; Buso, D.C.; Likens, G.E. Comparison of 15 evaporation methods applied to a small mountain lake in the northeastern USA. J. Hydrol. 2007, 340, 149–166. [Google Scholar] [CrossRef]
- Tian, L.; Yao, T.; MacClune, K.; White, J.W.C.; Schilla, A.; Vaughn, B.; Vachon, R.; Ichiyanagi, K. Stable isotopic variations in west China: A consideration of moisture sources. J. Geophys. Res. Atmos. 2007, 112, 1–12. [Google Scholar] [CrossRef]
- Clarke, I.; Fritz, P. Environmental Isotope in Hydrogeology; Springer: Berlin/Heidelberg, Germany, 1997. [Google Scholar] [CrossRef]
- Chen, J.; Wang, C.-Y.; Tan, H.; Rao, W.; Liu, X.; Sun, X. New lakes in the Taklamakan Desert. Geophys. Res. Lett. 2012, 39, 22402. [Google Scholar] [CrossRef]
- Chen, J.S.; Wang, C.Y. Rising springs along the Silk Road. Geology 2009, 37, 243–246. [Google Scholar] [CrossRef]
- Zhang, X.; Shi, Y.; Yao, T. Variation of δ 18O in precipitation over the Northeastern Tibetan Plateau. Sci. China Ser. B 1995, 38, 540–547. [Google Scholar]
- Salamon, T. Subglacial conditions and Scandinavian Ice Sheet dynamics at the coarse-grained substratum of the fore-mountain area of southern Poland. Quat. Sci. Rev. 2016, 151, 72–87. [Google Scholar] [CrossRef]
- Post, V.E.A.; Groen, J.; Kooi, H.; Person, M.; Ge, S.; Edmunds, W.M. Offshore fresh groundwater reserves as a global phenomenon. Nature 2013, 504, 71–78. [Google Scholar] [CrossRef]
- Zongyu, C.; Jixiang, Q.; Jianming, X.; Jiaming, X.; Hao, Y.; Yunju, N. Paleoclimatic interpretation of the past 30 ka from isotopic studies of the deep confined aquifer of the North China plain. Appl. Geochem. 2003, 18, 997–1009. [Google Scholar] [CrossRef]
- Currell, M.J.; Cartwright, I.; Bradley, D.C.; Han, D. Recharge history and controls on groundwater quality in the Yuncheng Basin, north China. J. Hydrol. 2010, 385, 216–229. [Google Scholar] [CrossRef]
- Gates, J.B.; Edmunds, W.M.; Darling, W.G.; Ma, J.; Pang, Z.; Young, A.A. Conceptual model of recharge to southeastern Badain Jaran Desert groundwater and lakes from environmental tracers. Appl. Geochem. 2008, 23, 3519–3534. [Google Scholar] [CrossRef] [Green Version]
- Wang, T.; Chen, J.; Zhang, C.; Zhan, L.; Li, L. 14C-Dating Model for Groundwater Affected by CO2 Inputs From Deep Underground Formations. Water Resour. Res. 2020, 56, 2–12. [Google Scholar] [CrossRef]
- Wang, T.; Chen, J.; Zhang, C. Estimation of fossil groundwater mass fraction accounting for endogenic carbon input across California. J. Hydrol. 2021, 595, 126034. [Google Scholar] [CrossRef]
- Wang, C.; Wang, C.; Manga, M. Coseismic release of water from mountains Evidence from the 1999 (Mw = 7.5) Chi-Chi, Taiwan, earthquake. Geology 2004, 32, 769–772. [Google Scholar] [CrossRef] [Green Version]
- Muir-Wood, R.; King, G. Hydrological signatures of earthquake strain. J. Geophys. Res. Solid Earth 1993, 98, 22035. [Google Scholar] [CrossRef]
- Rojstaczer, S.; Michel, R.; Wolf, S. Permeability enhancement in the shallow crust as a cause of earthquake-induced hydrological changes. Nature 1995, 373, 237–239. [Google Scholar] [CrossRef]
- Manga, M.; Wang, C.-Y. Earthquake hydrology. In Treatise on Geophysics; Schubert, G., Ed.; California Institute of Technology: Pasadena, CA, USA, 2007; pp. 293–320. [Google Scholar]
- Wang, B.; Ma, Y.; Su, Z.; Wang, Y.; Ma, W. Quantifying the evaporation amounts of 75 high-elevation large dimictic lakes on the Tibetan Plateau. Sci. Adv. 2020, 6, eaay8558. [Google Scholar] [CrossRef] [PubMed]
- Zhao, Z.; Chen, H. Study on Control and Exploration Schemes of Groundwater Level Rising in Gahai Lake Delingha City of Qinghai Province. Site Investig. Sci. Technol. 2014, 45–48. [Google Scholar]


| Index | Time | Data Source | Index | Time | Data Source |
|---|---|---|---|---|---|
| 1 | 26 May 2000 | Landsat 5(TM) | 11 | 2010/7/27 | Landsat 5(TM) |
| 2 | 2 July 2001 | Landsat 5(TM) | 12 | 2011/7/14 | Landsat 5(TM) |
| 3 | 5 July 2002 | Landsat 5(TM) | 13 | 2013/6/1 | Landsat 8(OLI) |
| 4 | 10 September 2003 | Landsat 5(TM) | 14 | 2014/8/23 | Landsat 8(OLI) |
| 5 | 27 August 2004 | Landsat 5(TM) | 15 | 2015/8/10 | Landsat 8(OLI) |
| 6 | 13 July 2005 | Landsat 5(TM) | 16 | 2016/9/29 | Landsat 8(OLI) |
| 7 | 1 August 2006 | Landsat 5(TM) | 17 | 2017/7/14 | Landsat 8(OLI) |
| 8 | 21 September 2007 | Landsat 5(TM) | 18 | 2018/10/5 | Landsat 8(OLI) |
| 9 | 5 July 2008 | Landsat 5(TM) | 19 | 2019/5/1 | Landsat 8(OLI) |
| 10 | 9 August 2009 | Landsat 5(TM) | 20 | 2020/10/10 | Landsat 8(OLI) |
| Sam. No. | Type | Latitude (N) | Longitude (E) | Depth (m) | δ2H (‰) | δ18O (‰) | 3H (TU) |
|---|---|---|---|---|---|---|---|
| R01 | RW | 37°23′15″ | 97°21′39″ | −58.6 | −8.81 | 14.0 | |
| R02 | RW | 37°23′43″ | 97°22′04″ | −58.4 | −8.76 | ||
| R03 | RW | 37°23′55″ | 97°21′35″ | −52.1 | −7.34 | ||
| R07 | RW | 37°22′38″ | 97°26′40″ | −57.1 | −6.60 | ||
| R09 | RW | 37°21′06″ | 97°33′12″ | −56.9 | −8.82 | 17.8 | |
| R10 | RW | 37°21′11″ | 97°37′31″ | −58.4 | −8.97 | 11.6 | |
| R12 | RW | 37°23′03″ | 97°42′34″ | −56.7 | −8.63 | 16.7 | |
| R22 | RW | 37°19′06″ | 97°21′59″ | −57.4 | −8.77 | ||
| R25 | RW | 37°11′44″ | 97°20′21″ | −56.3 | −8.80 | ||
| R31 | RW | 37°09′21″ | 97°17′56″ | −56.1 | −8.39 | ||
| R33 | RW | 37°9′39″ | 97°10′58″ | −56.3 | −8.49 | ||
| R36 | RW | 37°15′07″ | 97°02′14″ | −50.8 | −7.20 | ||
| R39 | RW | 37°32′47″ | 96°50′03″ | −59.6 | −9.23 | ||
| R40 | RW | 37°32′47″ | 96°50′03″ | −59.8 | −9.26 | ||
| R41 | RW | 37°41′14″ | 96°31′03″ | −53.6 | −7.59 | ||
| R43 | RW | 37°36′31″ | 96°51′35″ | −59.8 | −9.44 | ||
| R47 | RW | 37°22′38″ | 97°20′37″ | −60.1 | −9.34 | ||
| L37 | LW | 37°18′56″ | 96°54′07″ | −46.1 | −6.42 | ||
| L42 | LW | 37°43′32″ | 96°28′43″ | −22.1 | −1.05 | ||
| G17 | SW | 37°12′20″ | 97°24′02″ | −58.3 | −8.82 | 11.2 | |
| G18 | SW | 37°13′10″ | 97°27′36″ | −60.0 | −9.16 | 11.9 | |
| G20 | SW | 37°13′24″ | 97°29′24″ | −62.4 | −9.38 | 5.0 | |
| G35 | SW | 37°15′08″ | 97°02′12″ | −66.6 | −10.08 | 3.7 | |
| G26 | PGW | 37°12′07″ | 97°17′54″ | 0.26 | −58.2 | −8.89 | 9.0 |
| G19 | PGW | 37°13′07″ | 97°27′35″ | 0.6 | −57.8 | −8.68 | |
| G27 | PGW | 37°12′18″ | 97°16′14″ | 1.2 | −60.0 | −9.08 | |
| G24 | PGW | 37°12′38″ | 97°20′20″ | 1.4 | −62.5 | −9.36 | |
| G16 | PGW | 37°13′24″ | 97°25′08″ | 1.9 | −60.5 | −8.82 | 9.1 |
| G08 | PGW | 37°22′33″ | 97°27′16″ | 2.0 | −42.0 | ||
| G28 | PGW | 37°13′05″ | 97°14′11″ | 3.5 | −58.7 | −9.19 | |
| G05 | PGW | 37°22′40″ | 97°26′00″ | 3.8 | −62.2 | −9.39 | 15.1 |
| G45 | PGW | 37°20′59″ | 96°46′32″ | 26.4 | −53.6 | −8.31 | |
| G44 | PGW | 37°21′00″ | 96°46′25″ | 27.6 | −50.8 | −8.26 | 11.8 |
| G29 | PGW | 37°15′46″ | 97°13′12″ | 12.0 | −64.8 | −9.92 | 5.5 |
| G30 | PGW | 37°17′55″ | 97°12′47″ | 14.9 | −62.5 | −9.56 | |
| G34 | PGW | 37°19′05″ | 97°12′36″ | 18.2 | −58.8 | −8.88 | 9.6 |
| G06 | PGW | 37°22′44″ | 97°25′54″ | 20.0 | −65.4 | −9.28 | |
| G23 | CGW | 37°17′02″ | 97°20′28″ | 31.8 | −58.9 | −8.84 | 10.9 |
| G15 | CGW | 37°17′23″ | 97°24′07″ | 40.4 | −60.3 | −9.08 | |
| G11 | CGW | 37°21′14″ | 97°40′20″ | 50.0 | −71.1 | −10.60 | 1.3 |
| G14 | CGW | 37°19′31″ | 97°23′49″ | 63.3 | −58.2 | −8.86 | |
| G04 | CGW | 37°22′45″ | 97°25′51″ | 65.0 | −60.4 | −9.08 | 15.6 |
| Time | Runoff | Precipitation | Temperature | Evaporation | Lake Surface Area | |
|---|---|---|---|---|---|---|
| Average | Before 2003 | 3.2 | 171 | 4.3 | 1341.8 | 148.6 |
| After 2003 | 4.5 | 229 | 5.1 | 1343.0 | 146.5 | |
| Variation | Whole time | 1.3 | 58 | 0.8 | 1.1 | −2.1 |
| Variation ratio | Whole time | 40.6% | 34.1% | 18.6% | 0.09% | −1.4% |
| Variation rate | Before 2003 | −0.002 | 2.279 | 0.068 | 3.087 | −0.867 |
| After 2003 | 0.092 | −0.777 | 0.034 | 3.080 | 2.190 | |
| Whole time | 0.024 | 2.083 | 0.051 | 0.858 | 0.131 |
Publisher’s Note: MDPI stays neutral with regard to jurisdictional claims in published maps and institutional affiliations. |
© 2022 by the authors. Licensee MDPI, Basel, Switzerland. This article is an open access article distributed under the terms and conditions of the Creative Commons Attribution (CC BY) license (https://creativecommons.org/licenses/by/4.0/).
Share and Cite
Zhang, X.; Chen, J.; Chen, J.; Ma, F.; Wang, T. Lake Expansion under the Groundwater Contribution in Qaidam Basin, China. Remote Sens. 2022, 14, 1756. https://doi.org/10.3390/rs14071756
Zhang X, Chen J, Chen J, Ma F, Wang T. Lake Expansion under the Groundwater Contribution in Qaidam Basin, China. Remote Sensing. 2022; 14(7):1756. https://doi.org/10.3390/rs14071756
Chicago/Turabian StyleZhang, Xi, Jiaqi Chen, Jiansheng Chen, Fenyan Ma, and Tao Wang. 2022. "Lake Expansion under the Groundwater Contribution in Qaidam Basin, China" Remote Sensing 14, no. 7: 1756. https://doi.org/10.3390/rs14071756
APA StyleZhang, X., Chen, J., Chen, J., Ma, F., & Wang, T. (2022). Lake Expansion under the Groundwater Contribution in Qaidam Basin, China. Remote Sensing, 14(7), 1756. https://doi.org/10.3390/rs14071756