Article

Determining the Capability of the Tree-Based Pipeline Optimization Tool (TPOT) in Mapping Parthenium Weed Using Multi-Date Sentinel-2 Image Data

Discipline of Geography and Environmental Science, School of Agricultural Earth and Environmental Sciences, University of KwaZulu-Natal, Private Bag X01, Scottsville, Pietermaritzburg 3201, South Africa
*
Author to whom correspondence should be addressed.
Remote Sens. 2022, 14(7), 1687; https://doi.org/10.3390/rs14071687
Submission received: 26 February 2022 / Revised: 24 March 2022 / Accepted: 29 March 2022 / Published: 31 March 2022
(This article belongs to the Section Biogeosciences Remote Sensing)

Abstract

:
The Tree-based Pipeline Optimization Tool (TPOT) is a state-of-the-art automated machine learning (AutoML) approach that automatically generates and optimizes tree-based pipelines using a genetic algorithm. Although it has been proven to outperform commonly used machine techniques, its capability to handle high-dimensional datasets has not been investigated. In vegetation mapping and analysis, multi-date images are generally high-dimensional datasets that contain embedded information, such as phenological and canopy structural properties, known to enhance mapping accuracy. However, without the implementation of a robust classification algorithm or a feature selection tool, the large sets and the presence of redundant variables in multi-date images can impede accurate and efficient landscape classification. Hence, this study sought to test the efficacy of the TPOT on a multi-date Sentinel-2 image to optimize the classification accuracies of a landscape infested by a noxious invasive plant species, the parthenium weed (Parthenium hysterophorus). Specifically, the models created from the multi-date image, using the TPOT and an algorithm system that combines feature selection and the TPOT, dubbed “ReliefF-Svmb-EXT-TPOT”, were compared. The results showed that the TPOT could perform well on data with large feature sets, but at a computational cost. The overall accuracies were 91.9% and 92.6% using the TPOT and ReliefF-Svmb-EXT-TPOT models, respectively. The study findings are crucial for automated and accurate mapping of parthenium weed using high-dimensional geospatial datasets with limited human intervention.

1. Introduction

Invasive plant species (IPSs) are pervasive globally, causing significant adverse impacts on social and ecological systems. Parthenium weed (Parthenium hysterophorus) is one of the most prolific IPSs that adversely affects animal and human health, agricultural productivity, rural livelihoods, local and national economies, and the environment [1]. In South Africa, it constitutes a threat to the globally recognized biodiversity hotspots, such as the Maputaland-Pondoland-Albany hotspot and the Isimangaliso Wetland Park in Eastern Cape and KwaZulu-Natal, respectively. Hence, it is necessary to cost effectively determine its spatial distribution as a first step towards mitigating its spread [2].
The Sentinel-2 sensor provides open-source image data with a wide swath (290 km), and a relatively high spatial resolution (up to 10 m) and spectral resolution (13 bands). Moreover, Sentinel-2 data have a six-day global revisit, valuable for improved vegetation mapping. Vuolo et al. [3], for instance, showed that additional multi-temporal Sentinel-2 image data increased the classification accuracies of nine crop types during the 2016 and 2017 cropping season in Austria; this was an improvement attributed to embedded information, such as the phenological and canopy structure [4]. Nevertheless, without a robust classifier and/or feature selection method, the correlated or redundant variables created from multi-date imagery can impede accurate and efficient classification of a landscape. In this regard, we hypothesize that an automated machine learning (AutoML) approach, such as the Tree-based Pipeline Optimization Tool (TPOT), together with feature selection, can considerably enhance multi-date Sentinel-2 image maps to depict the weed’s accurate spatial representation.
The Tree-based Pipeline Optimization Tool (TPOT) is a state-of-the-art automated machine learning (AutoML) approach that was developed by Olson and Moore to maximize classification accuracies on supervised classification tasks [5]. The adoption of the TPOT limits human intervention by automating the algorithm search and optimization. Previous studies have proven that the TPOT could create more accurate models than conventional machine learning techniques [5,6]. For example, Sohn et al. [7] found that an improved version of the TPOT, the Tree-based Pipeline Optimization Tool—Multifactor Dimensionality Reduction (TPOT-MDR), outperformed a tuned logistic regression and XGBoost classifiers. However, AutoML, such as the TPOT, is relatively new to the remote sensing community. Furthermore, although TPOT seems promising for geospatial image processing, it requires a lot of time to determine an optimized pipeline [8]. For instance, with its default parameters (i.e., 100 generations with a population size of 100), the TPOT evaluates 10,000 pipeline configurations to find the recommended pipeline. This makes the TPOT impractical for high-dimensional datasets. Hence, feature selection, as a preprocessing step to TPOT implementation, would be crucial to overcome this limitation. Feature selection algorithms are typically classified into three groups, namely, filters, wrappers and embedded. Hybrid feature selection methods generally use the strength of the filter and wrapper feature selection methods. Typically, the first feature dimension of data is reduced by using a filter method, followed by a wrapper method for the selection of the optimal feature subset [9]. These approaches are usually faster than wrapper-based methods, yield better accuracies than filter methods and select fewer features [10,11]. For example, Kiala et al. [12] and Robnik-Šikonja and Kononenko [13] found that ReliefF, a filter method, and svm-b, a wrapper method, could select a small subset of optimal features and yield high classification accuracies, respectively. Embedded ExtraTrees (EXT), a modified version of the Random Forest (RF) classifier, was found to be faster and more accurate than RF [14]. In this study, a hybrid feature selection method, dubbed “ReliefF-Smvb-EXT”, was developed to serve as a preprocessing step to the TPOT. Hence, this study sought to assess the efficacy of the TPOT on the multi-date Sentinel-2 image, to optimize the classification accuracies. Specifically, we compared the models created from the multi-date image, using the TPOT, and optimal bands selected from the multi-date image, using an algorithm system that combines ReliefF-Smvb-EXT and the TPOT. Ultimately, this study provides a novel approach that is useful for reducing the redundancy on high-dimensional datasets, without compromising the mapping accuracy of parthenium-infested landscapes.

2. Materials and Methods
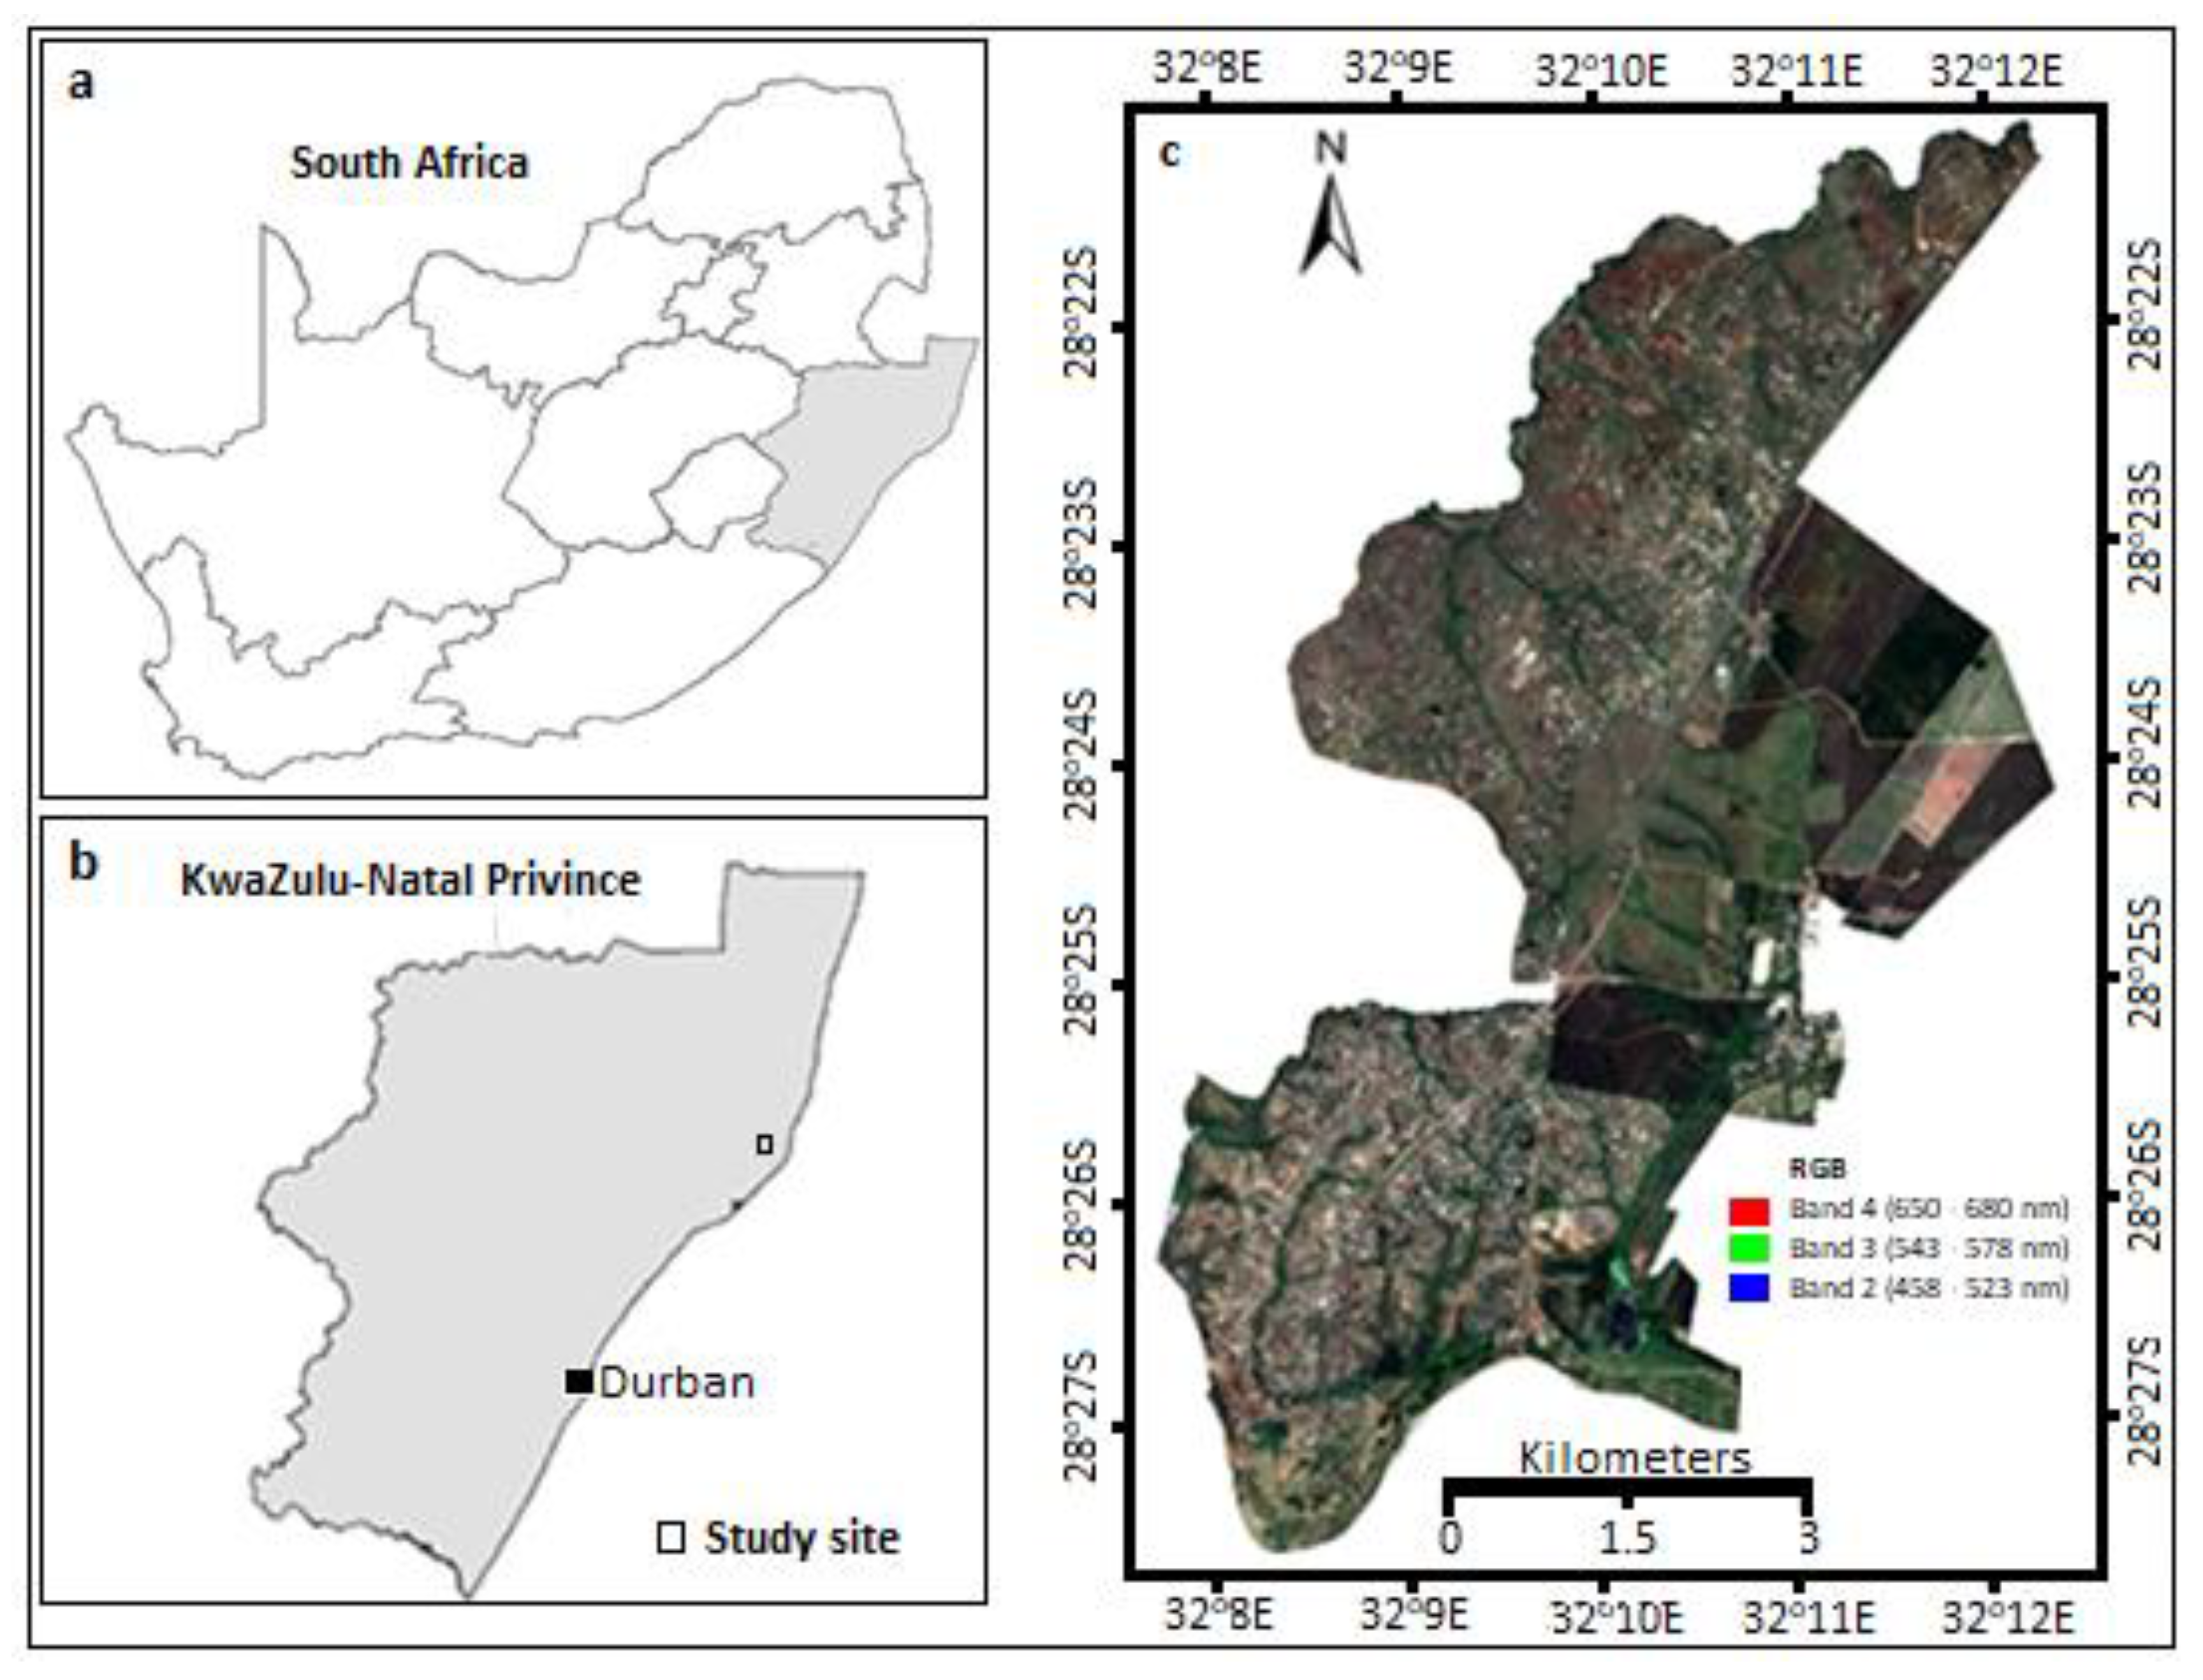
2.1. The Study Area

The study site is in the Mtubatuba municipality within the KwaZulu-Natal province of South Africa (Figure 1). The entire study area is 129 km2, with a significant parthenium weed infestation. The basalt, sand, and mudstone geological formations underly the study site [15]. The area lies within a subtropical climate with a 21.5 °C and 600 to 1250 mm annual average temperature and rainfall, respectively. Predominant land uses include commercial agriculture, subsistence farming, mining, and high- and low-density settlements.

2.2. Reference Data

Conspicuous patches of parthenium weed infestations distributed across different land use/cover types were identified using a high spatial resolution (50 cm) color orthophotograph, captured in 2008. A survey of the identified patches was then undertaken in the study area using a differentially corrected Trimble GeoXT hand-held GPS receiver with 50 cm accuracy. The ground truth campaign was conducted during summer between 12 January and 2 February 2017. In total, 90 patches of parthenium weed greater than 10 × 10 m were randomly selected across different land use/cover types to account for variability in different ecological conditions within the study area. In addition, GPS points of surrounding land use/cover types, such as forest, grassland, built-up and water bodies, were collected. Supplementary GPS coordinates of these land use/cover types were also extracted from the color orthophotograph to increase the number of samples. In total, 447 reference points for mapping parthenium weed and major land use/cover classes were created (Table 1). As recommended by Adelabu et al. [16], these points were randomly split into training (70%) and test datasets (30%), with equal class proportions in each dataset for model development.

2.3. Acquistion of Multi-Date Sentinel-2 Images and Pre-Processing

Parthenium weed typically germinates between September and December, and senesces between March and May [15]. Therefore, four level 1C Sentinel-2A satellite images, which span the dominant phenological events (i.e., rosette growth, flowering, and senescence), acquired on 19 January, 8 February, 28 February and 27 March 2017, were downloaded from the European Space Agency (ESA) website. The multi-date image was created by layer stacking the four single-date images. Table 2 shows the characteristics of Sentinel-2 imagery.
The Semi-Automatic Classification Plugin [17] within the QGIS software version 2.14.11 [18] was used to atmospherically correct the four Sentinel-2 images using the dark object subtraction approach. Atmospheric bands (i.e., band 1—coastal aerosol, band 9—water vapor and band 10—SWIR-Cirrus) were removed and bands with 20 m were resampled to 10 m spatial resolution using the cubic spline resampling approach to allow for layer stacking.

2.4. Feature Selection and Classification Methods

2.4.1. ReliefF

ReliefF is a multi-class version of the Relief algorithm family [19]. The principle of ReliefF is to estimate the importance of features based on how well their values distinguish among instances that are close to each other [20]. Assuming that S is a sample set, R is a selected sample instance from S , K is found near the nearest neighbors of samples R , N H (‘near-hit’) is the closest instance of sample R within the same class, N M (‘near-miss’) is the closest instance of sample R among the different classes, and w t is the weight of feature t , which is updated after m times of feature evaluation.

2.4.2. Support Vector Machine—Backward

Support vector machine—backward (svm-b) ranks features according to their predictive power using the classical support vector machines (SVM) in backward selection strategy [21]. The backward elimination starts with the full set of features and then progressively eliminates the least relevant [22]. According to Kiala et al. [12], svm-b is faster and more efficient in predictive accuracy than svm-f. The svm-b code can be found in the skfeature Python package [23].

2.4.3. ExtraTrees Classifier

The ExtraTrees classifier (EXT) or extremely randomized tree is a modified version of the Random Forest (RF) that was first introduced by Geurts et al. [14]. It is similar to RF in that it constructs independent decision trees to perform classification and regression analyses. However, EXT includes stronger randomization techniques to further reduce the variance of the prediction model. Similar to RF, EXT provides a self-contained importance measure for each feature when calculating the mean decrease in the classification accuracy for the out-of-bag (OOB) data from the bootstrap sampling.

2.4.4. The Tree-Based Pipeline Optimization Tool (TPOT)

The Tree-based Pipeline Optimization Tool (TPOT) [8] is a state-of-the-art AutoML that applies genetic programming (GP), as implemented in the Python package Distributed Evolutionary Algorithms in Python (DEAP) [24], to optimize machine learning pipelines. The TPOT finds the optimized pipeline from a combination of three types of machine learning pipeline operators, namely, feature preprocessing (StandardScaler, MinMaxScaler, etc.), feature selection (Variance Threshold, SelectKBest, etc.) and classification (DecisionTree, Random Forest, etc.). Most of these machine learning pipeline operators are from the scikit-learn package [25]. More details on the TPOT can be found in Olson and Moore [5]. In this study, the TPOT was run on the datasets using its default parameters, i.e., 100 generations with 100 population size.

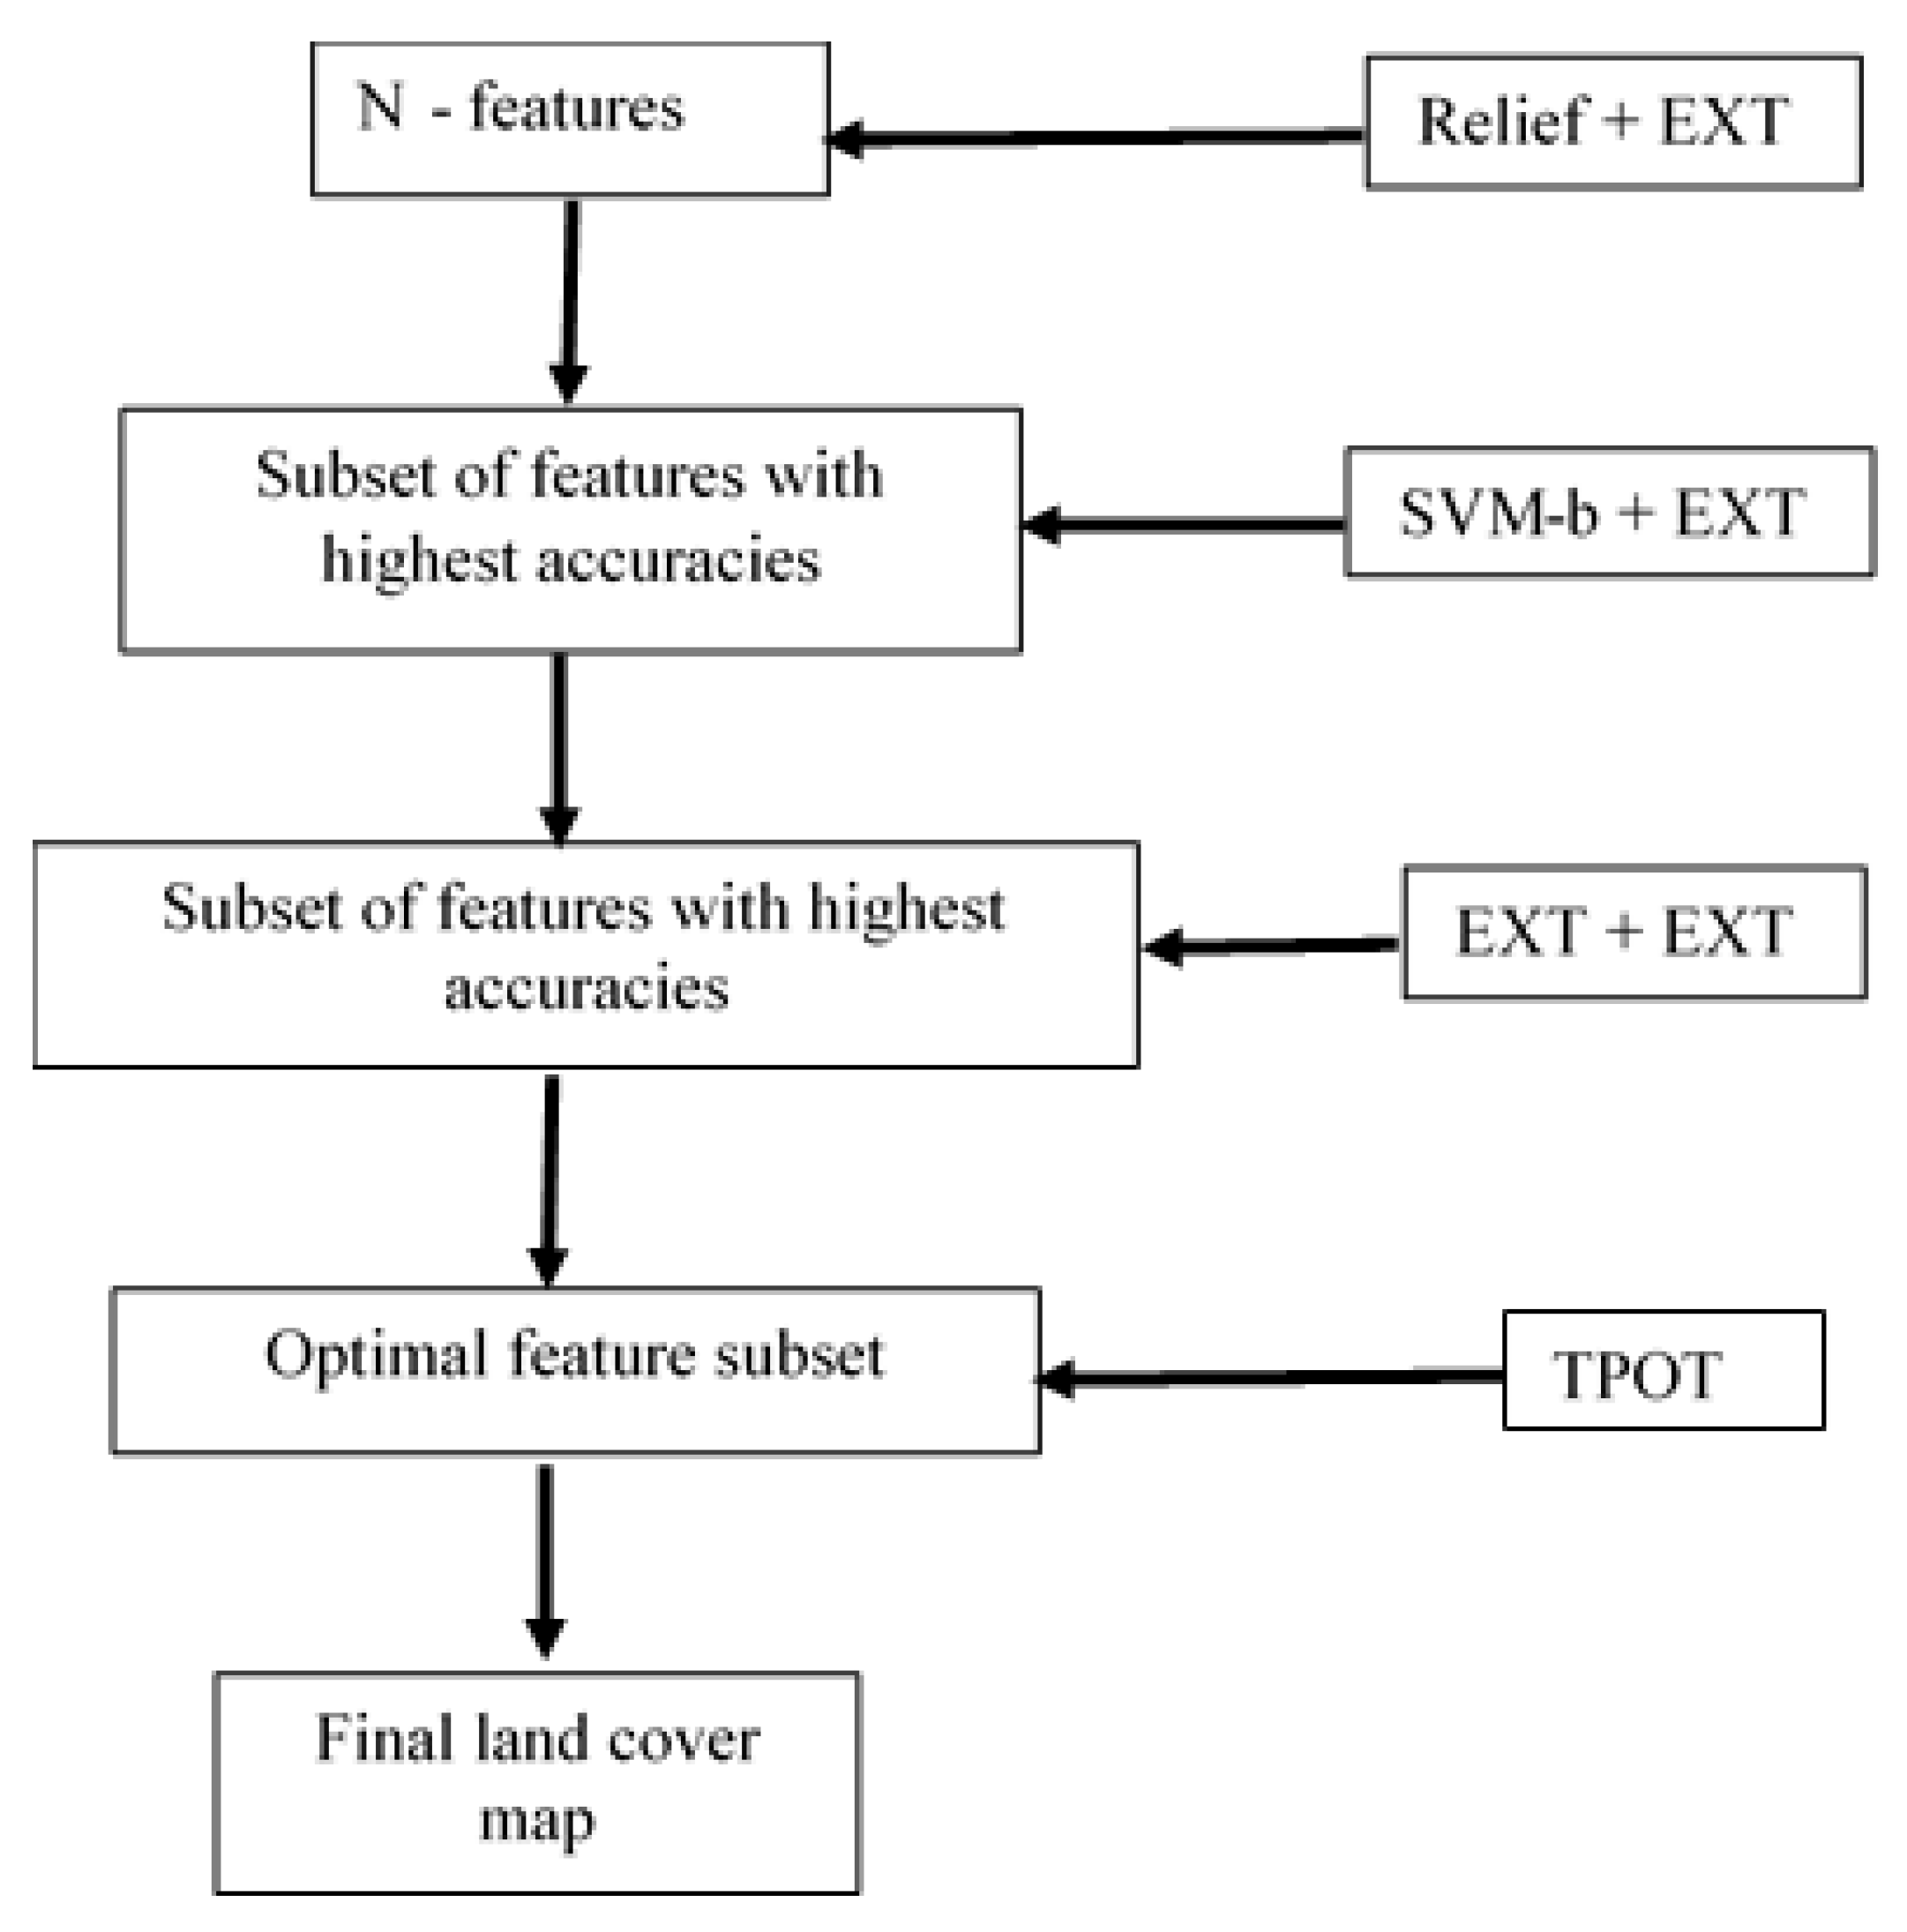
2.4.5. The ReliefF-Svmb-EXT-TPOT System

The proposed classification feature selection system (Figure 2) is a combination of the TPOT and a hybrid feature method that combines the three feature methods (ReliefF, svmb, and EXT). It consists of two parts; the first part uses a hybrid feature selection method for reducing the dimension of the datasets, and the second section consists of applying the TPOT to the features selected using the hybrid method. The following steps were followed to construct the hybrid method: First, a range of numbers that starts from 1 to N, which is the number of bands of the multi-date image, was created. Each number in the range corresponded to the size of feature subsets selected through ReliefF. The EXT model was then trained and evaluated on the test dataset using the selected feature subset through an iteration. The subset of selected features with the highest overall accuracy was considered as the output of the first stage. In the second stage, the steps of the previous stage were repeated using the optimal features selected by ReliefF as input and svm-b as feature selection. In the third stage, the resulting optimal features through svm-b were ranked by the EXT algorithm using the mean decrease in impurity (MDI). Another interaction was implemented on different subsets of the ranked features generated, using the “SelectFromModel” function of the sklearn package (25). The subset with the highest predictive accuracy was the final output of the hybrid method and served as the final input for the TPOT.

2.4.6. Model Assessment Metrics
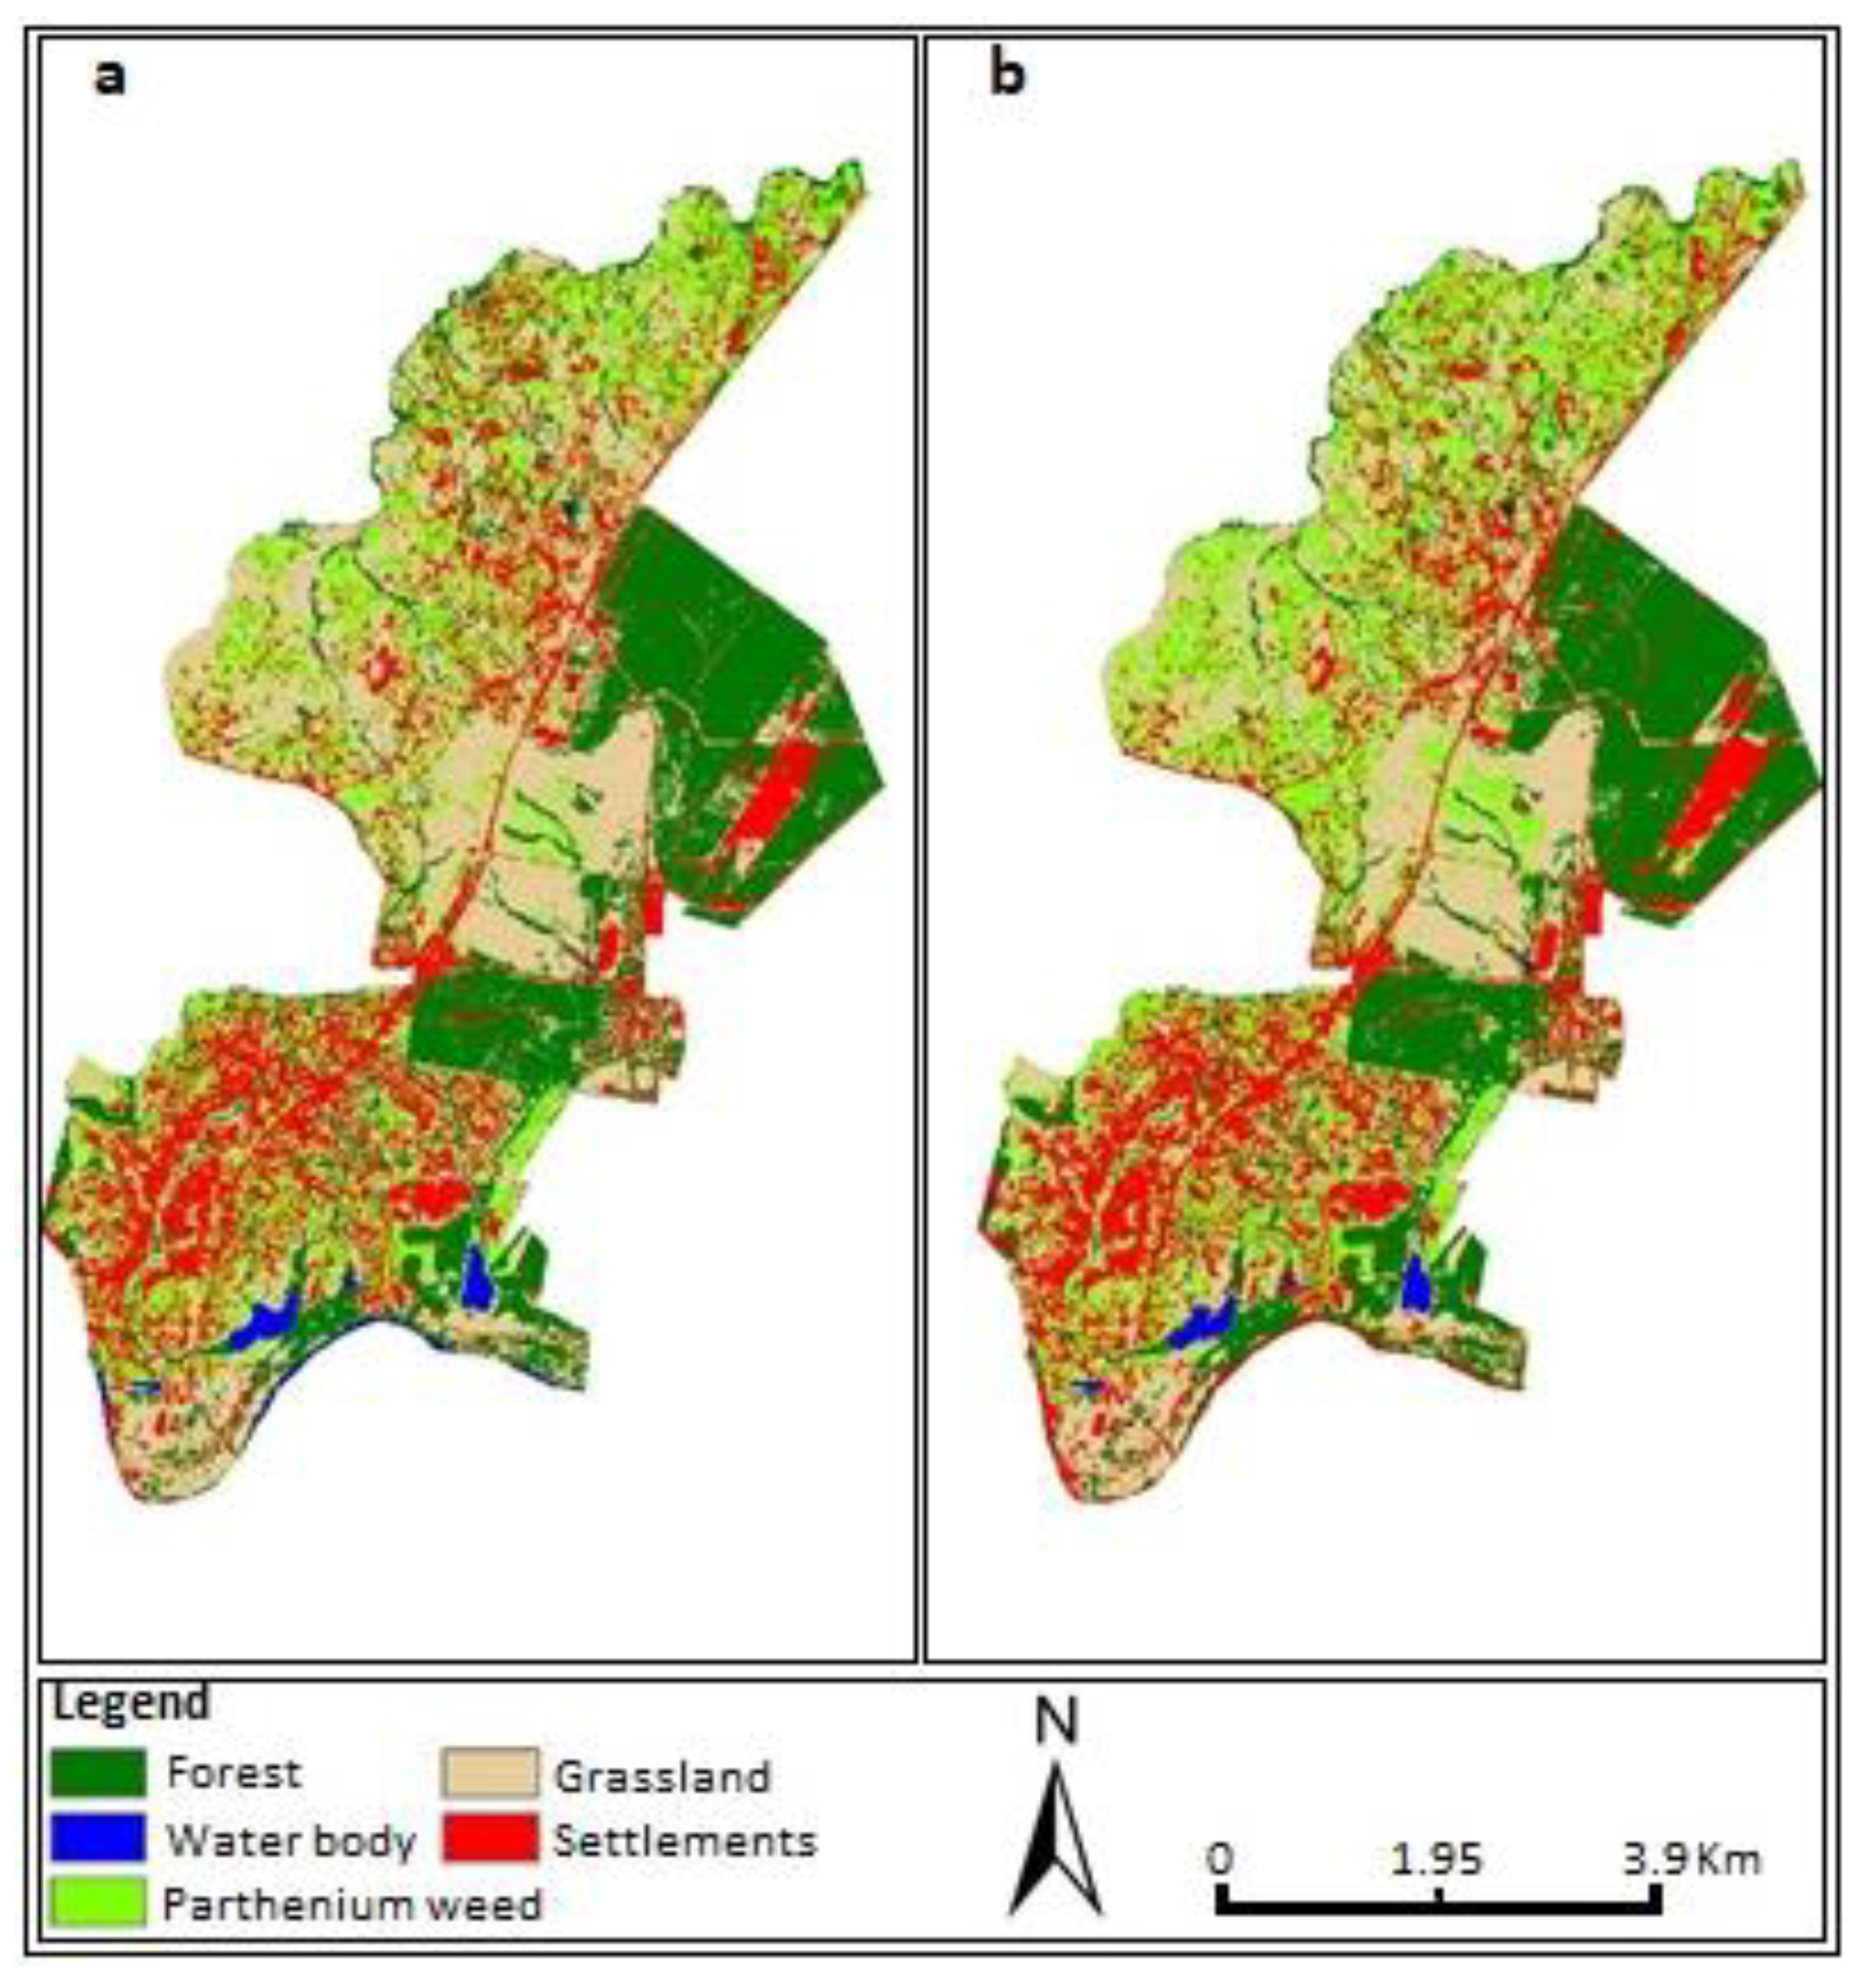
Estimated classes were cross-tabulated against the ground-sampled classes for corresponding pixels in a confusion matrix during the model assessment. From the confusion matrix, conventional performance metrics, such as the overall accuracy (OA), the user’s accuracy (UA), and the producer’s accuracy (PA), were computed [26]. The OA refers to the proportion of all the classes that was mapped correctly. The UA refers to the probability that a pixel labeled as a certain class on the map represents that class on the ground. The PA refers to the probability of real features on the ground being classified as such. In this study, the focus was on the UA and PA of the parthenium weed class, as we endeavored to map its spatial distribution. The analyses and map generation were performed using scripts written in Python (version 3). The Wilcoxon test was used to measure the statistical difference between the classification accuracies yielded by the TPOT and ReliefF-Svmb-EXT-TPOT models.

3. Results

Table 3 displays the classification accuracies of the investigated models. The results showed that the highest accuracies were achieved for the proposed algorithm system model. Overall accuracies of 91.9% and 92.6% were obtained using the TPOT and ReliefF-svmb-EXT-TPOT models, respectively. Moreover, the difference in classification accuracies between the two models was not statistically significant (p < 0.05). In terms of computational cost, the two models took 32,920 and 42,215 s, respectively. The difference in time between the two TPOT models was 9295 s (2 h, 34 min and 54 s). This represents a reduction of 22% in computational costs when hybrid feature selection is applied to the TPOT. Furthermore, the hybrid feature selection method selected 15 out of 52 spectral bands that comprise the Sentinel-2 multi-date image. A small number of variables are crucial for reducing the time of image classification.
Based on the classification accuracies of individual land cover types, the two models also yielded similar PA and UA accuracies for the parthenium weed. The average PA and UA were 83% for both models. The classification accuracies of other land cover types were also similar. Of all the classes, the water bodies followed by forest were the most accurately mapped land cover types by both models.
Table 4 displays the error matrix of the investigated models. Overall, 125 out of 135 reference points were correctly classified using the ReliefF-svmb-EXT-TPOT hybrid model, while 124 out of 135 reference points were correctly classified using the TPOT alone. With regards to parthenium weed, the results showed that 21 out of 24 reference points and 22 out of 26 parthenium weed reference points were correctly classified by the ReliefF-svmb-EXT-TPOT model (Table 4a) and the TPOT alone (Table 4b), respectively. For both models, parthenium weed and grassland were the most misclassified.
Figure 3 shows the maps of parthenium weed infestations using the TPOT and ReliefF-svmb-EXT-TPOT hybrid models. It can be noticed that parthenium weed infestations were almost non-existent in forested areas. Large parthenium stands were found in areas with less vegetation cover and in low-density residential areas (in the north).

4. Discussion

This study explored the capability of the Tree-based Pipeline Optimization Tool (TPOT) to handle multi-date Sentinel-2 imagery with a high number of spectral bands, for mapping parthenium weed infestations and its coexisting land use/covers. To achieve this, the TPOT model was compared with a hybrid feature selection approach, i.e., ReliefF-Smvb-EXT and the TPOT, to determine the impact of feature selection on classification accuracies. Classification metrics, such as producer’s accuracy (PA), user’s accuracy (UA) and overall accuracy (OA), were used to assess the different models created in this study.
The results showed that the ReliefF-Svmb-EXT-TPOT hybrid model yielded slightly higher classification accuracies than the TPOT model generated from the multi-date image. Their overall classification accuracies were 92.6% and 91.9%, respectively. Although the performance of a single-date image was not tested in this study, our TPOT model results were superior to similar studies that used a single-date image. For instance, using SPOT 6 and Random Forest (RF), Royimani et al. [27] mapped parthenium weed infestations, achieving an overall classification accuracy of 73%, with PA and UA of 60% and 61%, respectively, while Kganyago et al. [28] found that SPOT 6 yielded an overall accuracy of 86%, with PA and UA of 72.22% and 93.24%, respectively, using the support vector machine (SVM) classifier.
The above results show that the TPOT can perform well on image data with a high number of variables, such as multi-date Sentinel-2 imagery, without prior application of a feature selection method. The finding underscores the fact that multi-date images are a good alternative to single-date images for mapping vegetation, particularly when using an appropriate classifier. For example, Casady et al. [29] found similar results when comparing IKONOS multi-date and single-date images in mapping leafy spurge (Euphorbia esula L.), a deep-rooted perennial weed, using the maximum likelihood classifier. Thejas et al. [30] argued that high-dimensional data may misguide the commonly used machine learning techniques. The TPOT’s performance on the multi-date image may be explained by the fact that it intelligently selects algorithms in the recommended pipeline that can handle noisy or redundant features. For example, in this study, the optimized pipeline (Appendix A, Table A1) for classifying the multi-date image contained principal component analysis (PCA) as the pre-processor, and the ExtraTrees classifier (EXT) as the classification method. These operators are known to efficiently deal with high-dimensional data [31,32]. Samat et al. [32], for instance, found that EXT and their proposed method, Extremely Randomized Rotation Forest (ERRF), could achieve a better classification accuracy than the Random Forest classifier in handling high-dimensional data.
On the other hand, in terms of computational cost, our approach (i.e., ReliefF-Svmb-EXTTPOT) performed better than the TPOT model. The computational cost of the model created from the optimal bands selected by our system was reduced by 22%. This reduction can be attributed to the sequential and complementary use of the three feature selection methods, i.e., svm-b, ReliefF and EXT, that constituted our hybrid approach. As aforementioned, the Svm-b is one of the wrapper methods known to yield a high predictive accuracy, as it uses a robust classification algorithm [33], while the ReliefF algorithm belongs to the filter-based methods, with a fast runtime [34]. EXT is one of the embedded methods that are generally a trade-off between the filter and wrapper methods. Svm-b and EXT are also faster and yield higher predictive accuracies than their counterparts, such as support vector machine—forward (svm-f) and RF [12,14]. The literature also suggests that hybrid feature selection methods select fewer features that generate higher predictive accuracies than a full suite of features [10,35]. In this regard, it was expected that our hybrid feature selection approach would significantly increase the TPOT classification accuracies on the multi-date image. In this study, this superiority was marginal; hence, further investigation is necessary.

5. Conclusions

Based on the findings, the following can be concluded:
(a)
The TPOT can work well on a high-dimensional dataset, such as multi-date Sentinel-2 imagery, but at a higher computational cost;
(b)
Combining a hybrid feature selection method with the TPOT decreases the computational costs of the TPOT on a high-dimensional dataset, with a slight increase in the classification accuracies.
Obtaining accurate models from the TPOT can take several hours, and even days. It is, therefore, crucial to reduce their computation costs, while maintaining the accuracies. Moreover, the computation costs of TPOP models drastically increase for high-dimensional data, because of the high number of features. This study was the first to investigate the capability of the TPOT to handle image data with a high number of variables, such as multi-date Sentinel-2 imagery, by combining it with a hybrid feature selection method. In the event of big data, this study is valuable, as it provides a basis for improved landscape delineation by selecting useful features from highly dimensional datasets. The study findings demonstrate the possibility for automatic and accurate parthenium weed mapping, and, indeed, other plant species-invaded landscapes, with limited human intervention. This will contribute to the management of invasive plants and their impacts, especially in globally recognized biodiversity hotspots. For future studies, the developed algorithm should be tested on larger feature sets, which may include a combination of vegetation indices, textures and spectral bands.

Author Contributions

Conceptualization, Z.K., J.O. and O.M.; methodology, Z.K., J.O. and O.M., validation, Z.K., J.O. and O.M.; formal analysis, Z.K., J.O. and O.M.; resources, O.M. and J.O.; data curation, Z.K.; writing—original draft preparation, Z.K., J.O. and O.M.; writing—review and editing, Z.K., J.O. and O.M.; supervision, O.M. and J.O.; funding acquisition, O.M. and J.O. All authors have read and agreed to the published version of the manuscript.

Funding

The authors would like to thank the University of KwaZulu-Natal funded Big data for Science society (BDSS) programme and the DST/NRF funded SARChI chair in land use planning and management (Grant Number: 84157) for funding this study.

Data Availability Statement

The data presented in this study are available on request from the corresponding author. The data are not publicly available due to authorization restrictions from the funder that limit the distribution of data, as the article is part of an ongoing project where other manuscripts are still being prepared.

Conflicts of Interest

The authors declare no conflict of interest.

Appendix A

Table A1. Recommended pipelines of TPOT models from the proposed system, full multi-date image and single-date image.
ModelsRecommended Pipelines
TPOTExtraTreesClassifier(SelectPercentile(PCA(RobustScaler(input_matrix), iterated_power = 8, svd_solver = randomized), percentile = 51), bootstrap = False, criterion = entropy, max_features = 0.15000000000000002, min_samples_leaf = 1, min_samples_split = 4, n_estimators = 100)
ReliefF-Svmb-EXT-TPOTXGBClassifier(MLPClassifier(PCA(ZeroCount(StandardScaler(input_matrix)), iterated_power = 8, svd_solver = randomized), alpha = 0.01, learning_rate_init = 0.1), learning_rate = 0.1, max_depth = 4, min_child_weight = 2, n_estimators = 100, n_jobs = 1, subsample = 0.7500000000000001, verbosity = 0)

References

  1. Swati, G.; Halder, S.; Ganguly, A.; Chatterjee, P. Review on Parthenium hysterphorus as a potential energy source. Renew. Sustain. Energy Rev. 2013, 20, 420–429. [Google Scholar] [CrossRef]
  2. Lawrence, R.L.; Wood, S.; Sheley, R. Mapping invasive plants using hyperspectral imagery and Breiman Cutler classifications (RandomForest). Remote Sens. Environ. 2006, 100, 356–362. [Google Scholar] [CrossRef]
  3. Vuolo, F.; Neuwirth, M.; Immitzer, M.; Atzberger, C.; Ng, W. How much does multi-temporal Sentinel-2 data improve crop type classification? Int. J. Appl. Earth Obs. Geoinf. 2018, 72, 122–130. [Google Scholar] [CrossRef]
  4. Tottrup, C. Improving tropical forest mapping using multi-date Landsat TM data and pre-classification image smoothing. Int. J. Remote Sens. 2004, 25, 717–730. [Google Scholar] [CrossRef]
  5. Olson, R.S.; Moore, J.H. TPOT: A tree-based pipeline optimization tool for automating machine learning. JMLR Workshop Conf. Proc. 2016, 64, 66–74. [Google Scholar]
  6. Luo, G. A review of automatic selection methods for machine learning algorithms and hyper-parameter values. Netw. Modeling Anal. Health Inform. Bioinform. 2016, 5, 18. [Google Scholar] [CrossRef]
  7. Sohn, A.; Olson, R.; Moore, J. Toward the automated analysis of complex diseases in genome-wide association studies using genetic programming. In Proceedings of the Genetic and Evolutionary Computation Conference, Berlin, Germany, 15–19 July 2017; ACM: New York, NY, USA, 2017; pp. 489–496. [Google Scholar]
  8. Elshawi, M.; Sakr, S. Automated machine learning: State-of-the-art and open challenges. arXiv 2019, arXiv:1906.02287. [Google Scholar]
  9. Venkatesh, B.; Anuradha, J. A Hybrid Feature Selection Approach for Handling a High-Dimensional Data. Innovations in Computer Science and Engineering; Springer: Berlin/Heidelberg, Germany, 2019; pp. 365–373. [Google Scholar]
  10. Kganyago, M.; Odindi, J.; Mhangara, P. Selecting a subset of spectral bands for mapping invasive alien plants: A case of discriminating Parthenium hysterophorus using field spectroscopy data. Int. J. Remote Sens. 2017, 38, 5608–5625. [Google Scholar] [CrossRef]
  11. Rouhi, A.; Nezamabadi-pour, H. A hybrid feature selection approach based on ensemble method for high-dimensional data. In Proceedings of the 2017 2nd Conference on Swarm Intelligence and Evolutionary Computation (CSIEC), Kerman, Iran, 7–9 March 2017. [Google Scholar]
  12. Kiala, Z.; Mutanga, O.; Odindi, J.; Peerbhay, K. Feature Selection on Sentinel-2 Multispectral Imagery for Mapping a Landscape Infested by Parthenium Weed. Remote Sens. 2019, 11, 1892. [Google Scholar] [CrossRef] [Green Version]
  13. Robnik-Šikonja, M.; Kononenko, I. Theoretical and empirical analysis of ReliefF and RReliefF. Mach. Learn. 2003, 53, 23–69. [Google Scholar] [CrossRef] [Green Version]
  14. Geurts, P.; Ernst, D.; Wehenkel, L. Extremely randomized trees. Mach. Learn. 2006, 63, 3–42. [Google Scholar] [CrossRef] [Green Version]
  15. Henry, M.C. Comparison of single-and multi-date Landsat data for mapping wildfire scars in Ocala National Forest, Florida. Photogramm. Eng. Remote Sens. 2008, 74, 881–891. [Google Scholar] [CrossRef] [Green Version]
  16. Adelabu, S.; Mutanga, O.; Adam, E. Testing the reliability and stability of the internal accuracy assessment of random forest for classifying tree defoliation levels using different validation methods. Geocarto Int. 2015, 30, 810–821. [Google Scholar] [CrossRef]
  17. Congedo, L. Semi-automatic classification plugin documentation. Release 2016, 4, 29. [Google Scholar]
  18. QGIS Development Team. QGIS Geographic Information System, 2014. Open Source Geospatial Foundation Project. Available online: http://qgis.osgeo.org (accessed on 10 June 2018).
  19. Farrell, A.; Wan, G.; Rush, S.; Martin, J.; Belant, J.; Butler, A.; Godwin, D. Machine learning of large-scale spatial distributions of wild turkeys with high-dimensional environmental data. Ecol. Evol. 2019, 9, 5938–5949. [Google Scholar] [CrossRef]
  20. Zhu, Z.; Ong, Y.; Dash, M. Wrapper–filter feature selection algorithm using a memetic framework. IEEE Trans. Syst. Man Cybern. Part 2007, 37, 70–76. [Google Scholar] [CrossRef] [PubMed]
  21. Guyon, I.; Elisseeff, A. An introduction to variable and feature selection. J. Mach. Learn. Res. 2003, 3, 1157–1182. [Google Scholar]
  22. Kohavi, R.; John, G.H. Wrappers for feature subset selection. Artif. Intell. 1997, 97, 273–324. [Google Scholar] [CrossRef] [Green Version]
  23. Li, J.; Cheng, K.; Wang, S.; Morstatter, F.; Trevino, R.; Tang, J.; Liu, H. Feature selection: A data perspective. ACM Comput. Surv. 2017, 50, 94. [Google Scholar] [CrossRef] [Green Version]
  24. Fortin, F.-A.; Rainville, F.; Gardner, M.; Parizeau, M.; Gagne, C. DEAP: Evolutionary algorithms made easy. J. Mach. Learn. Res. 2012, 13, 2171–2175. [Google Scholar]
  25. Pedregosa, F.; Varoquaux, G.; Gramfort, A.; Michel, V.; Thirion, B. Scikit-learn: Machine learning in Python. J. Mach. Learn. Res. 2011, 12, 2825–2830. [Google Scholar]
  26. Lunetta, R.S.; Lyon, J.G. Remote Sensing and GIS Accuracy Assessmen; CRC Press: Boca Raton, FL, USA, 2004. [Google Scholar]
  27. Royimani, L.; Mutanga, O.; Odindi, J.; Kiala, K.; Sibanda, M.; Dube, T. Distribution of Parthenium hysterophoru L. with variation in rainfall using multi-year SPOT data and random forest classification. Remote Sens. Appl. Soc. Environ. 2018, 13, 215–223. [Google Scholar] [CrossRef]
  28. Kganyago, M.; Odindi, J.; Mhangara, P. Evaluating the capability of Landsat 8 OLI and SPOT 6 for discriminating invasive alien species in the African Savanna landscape. Int. J. Appl. Earth Obs. Geoinf. 2018, 67, 10–19. [Google Scholar] [CrossRef]
  29. Casady, G.M.; Hanley, R.; Seelan, S. Detection of leafy spurge (Euphorbia esula) using multi-date high-resolution satellite imagery. Weed Technol. 2005, 19, 462–467. [Google Scholar] [CrossRef]
  30. Thejas, G.; Joshi, S.; Iyengar, S.; Sunitha, N.; Badrinath, P. Mini-Batch Normalized Mutual Information: A Hybrid Feature Selection Method. IEEE Access 2019, 7, 116875–116885. [Google Scholar] [CrossRef]
  31. Lusa, L. Gradient boosting for high-dimensional prediction of rare events. Comput. Stat. Data Anal. 2017, 113, 19–37. [Google Scholar]
  32. Samat, A.; Persello, C.; Liu, S.; Li, E.; Miao, Z.; Abuduwaili, J. Classification of VHR multispectral images using extratrees and maximally stable extremal region-guided morphological profile. IEEE J. Sel. Top. Appl. Earth Obs. Remote Sens. 2018, 11, 3179–3195. [Google Scholar] [CrossRef]
  33. Peralta, B.; Soto, A. Embedded local feature selection within mixture of experts. Inf. Sci. 2014, 269, 176–187. [Google Scholar] [CrossRef]
  34. Hsu, C.-W.; Chung, C.; Lin, C. A practical guide to support vector classification. In Technical Report; Department of Computer Science and Information Engineering, University of National Taiwan: Taipei, Taiwan, 2003; pp. 1–12. [Google Scholar]
  35. Lin, X.; Yang, F.; Zhou, L.; Yin, P.; Kong, H.; Wing, W.; Lu, X.; Jia, L.; Wang, Q.; Xu, G. A support vector machine-recursive feature elimination feature selection method based on artificial contrast variables and mutual information. J. Chromatogr. B 2012, 910, 149–155. [Google Scholar] [CrossRef]
Figure 1. A map of South Africa (a) showing the KwaZulu-Natal province (b) and the study area (c) depicted in a Sentinel-2 true color composite.
Remotesensing 14 01687 g001
Figure 2. Flow chart of the proposed algorithm.
Remotesensing 14 01687 g002
Figure 3. Parthenium weed infestations within coexistent land use/cover types using TPOT models (a) and TPOT-Relief-svmb-EXT hybrid models (b).
Remotesensing 14 01687 g003
Table 1. Land use/cover classes and respective samples.
ClassNumber of GPS Points
Forest100
Water body70
Parthenium weed90
Grassland92
Settlement95
Table 2. Sentinel-2 band characteristics.
BandSpectral Band/RegionPixel Size (m)Wavelength Range (nm)
1Coastal aerosol60430–457
2Blue10448–546
3Green10538–583
4Red10646–684
5Vegetation red edge20694–713
6Vegetation red edge20731–749
7Vegetation red edge20769–797
8NIR10763–908
8aVegetation red edge20848–881
9Water vapour60932–958
10SWIR-Cirrus601336–1411
11SWIR201542–1685
12SWIR202081–2323
Table 3. Classification accuracies of the TPOT and the hybrid ReliefF-svmb-EXT-TPOT models.
Parthenium WeedForestWater BodyGrasslandSettlements
MethodsPAUAPAUAPAUAPAUAPAUAOA
TPOT—Hybrid88%78%100%97%100%100%84%93%93%97%92.6%
TPOT—alone85%81%97%93%100%95%89%89%91%100%91.9%
Table 4. (a) Error matrix of ReliefF-svmb-EXT-TPOT hybrid model. (b) Error matrix of TPOT alone.
(a)Reference Data
ForestWater BodyParthenium WeedGrasslandSettlementsTotal
Classified dataForest29001030
Water body02100021
Parthenium weed00214227
Grassland00226028
Settlements00102829
Total2921243130135
(b)Reference Data
ForestWater BodyParthenium WeedGrasslandSettlementsTotal
Classified dataForest28011030
Water body02000121
Parthenium weed10222227
Grassland00325028
Settlements00002929
Total2920262832135
Publisher’s Note: MDPI stays neutral with regard to jurisdictional claims in published maps and institutional affiliations.

