Article

The Staring Mode Properties and Performance of Geo-SAR Satellite with Reflector Antenna

Institute of Remote Sensing Satellite, China Association for Science and Technology, Beijing 100094, China
*
Author to whom correspondence should be addressed.
Remote Sens. 2022, 14(7), 1609; https://doi.org/10.3390/rs14071609
Submission received: 8 February 2022 / Revised: 13 March 2022 / Accepted: 23 March 2022 / Published: 28 March 2022
(This article belongs to the Section Engineering Remote Sensing)

Abstract

:
Geosynchronous synthetic aperture radar (Geo-SAR) with a short revisit time can obtain wide-area images. This paper advances a new two-dimensional pitch and roll squint controlling (2D-PRSC) method that can make satellites continuously stare at any scene in the whole orbital period. The maximum attitude steering angle is less than ±7.6 degrees, and the attitude controlling time can be greatly shortened compared with the yaw steering method. Furthermore, a Geo-SAR staring mode model is illustrated and compared with that of low earth orbital SAR (Leo-SAR). Finally, Geo-SAR’s ambiguity property is discussed. The simulation results illuminate that the cross-term ambiguity to signal ratio (CASR) also needs to be considered in addition to the azimuth and range ambiguity to signal ratio (AASR, RASR), and the whole orbital ergodic analysis should be carried out. To ensure that RASR, AASR, and CASR meet the requirement of −20 dB, it is necessary to select an appropriate PRF in the range of a few hundred Hertz.

Graphical Abstract

1. Introduction

In 1978, K. Tomiysu firstly proposed the concept of Geo-SAR satellite [1]. Since then, it has gradually become a hot research topic. It has the advantages of short revisit cycle, fast maneuver monitoring capability, large imaging width, and long staring time. Therefore, it has a wide application prospection in large-scale disaster monitoring, marine observation, geological mapping, and so on [2,3,4,5,6,7,8]. The China Academy of Space Technology(CAST) is currently developing Geo-SAR for disaster monitoring.
Geo-SAR’s orbit altitude is about 60 to 70 times higher than that of Leo-SAR, and the former’s satellite speed is about 1/60 to 1/10 of the latter’s. As a result, there are significant differences between them regarding the signal model, system design method, imaging algorithm, etc. So far, a variety of imaging modes have been advanced and developed for Leo-SAR, such as stripmap mode, ScanSAR mode, slide spotlight mode, TOPSAR mode, mosaic mode, and so on [9,10,11,12,13,14,15,16,17,18,19,20,21,22,23,24,25,26].
Spotlight mode is classical, and its beam is fixed pointing. In the Leo-SAR system, its beam points to a scene center through antenna electronical scanning or satellite attitude controlling in order to obtain higher azimuth resolution than the stripmap mode. Many SAR satellites have spotlight mode, including the Cosmo-Skymed satellite [27,28], Sentinel-1 satellite [29,30], CAST’s GaoFen-3 (GF-3) satellite [31], etc. A staring spotlight mode is proposed in 2014 by DLR. This test mode extends the TerraSAR-X phased array antenna azimuth scanning angle to ±2.2 degrees. Then, an azimuth resolution of 0.2 m is obtained in a 3 dB azimuth range [32,33]. The staring mode is suitable for Geo-SAR. Similar to Leo-SAR, its beam boresight direction invariably points to the scene center. This study discusses the staring mode of an L-band Geo-SAR with a reflector antenna. Its characteristics are presented as follows:
Staring mode imaging range mainly depends on a beam’s 3 dB coverage scale. Geo-SAR can constantly obtain a scene range of 320 km × 320 km in the whole orbit through a 25 m aperture circular antenna.
The Geo-SAR staring mode aims to obtain constantly an azimuth resolution of 25 m in different orbit positions through partial synthetic aperture.
A new two-dimensional pitch and roll squint controlling (2D-PRSC) method is proposed. The beam can quickly point to any area of 320 km × 320 km distributed in a zone of 5000 km × 5000 km. The satellite’s maneuver monitoring capability is promoted due to its attitude controlling angles being less than ±7.6 degrees. The time and energy expended for attitude controlling can be significantly saved.
Due to the distinct variation of the beam footprint direction angle (BFPA) caused by the satellite’s periodic large yaw angle, CASR also needs to be considered as well as AASR and RASR. Furthermore, it is necessary to analyze its ambiguity in the whole orbital period because of Geo-SAR’s strong time-varying velocity.
These above aspects are mainly caused by the differences of orbit parameters and attitude controlling technology between Geo-SAR and Leo-SAR. Generally, yaw steering (YS) technology is used to make Leo-SAR’s residual Doppler centroid zero for broadside imaging. This method has gone through several stages. SEASAT-A, as the first spaceborne SAR, was launched by NASA in 1978. It had a periodically changing squint angle because YS technology was not used [34]. Tomiyasu illustrated the relationship between yaw angle and squint angle in 1983, which can be regarded as the rudiment of YS theory [2]. Raney proposed a one-dimensional YS method in 1986, which can accurately calculate the yaw angle of the SAR satellite with an orbital eccentricity of zero. However, the residual Doppler centroid cannot completely achieve zero when the orbital eccentricity is not zero. This technology was firstly employed for ERS-1 launched by ESA in 1991, and its residual Doppler centroid could be kept within ±500 Hz most of the time [35]. Fiedler advanced a two-dimensional yaw steering(2D-YS) approach in 2005 [36], which is suitable for spaceborne SAR with certain orbital eccentricity. The yaw angle calculation expression is consistent with that in [35], and the pitch angle is calculated with an approximate formula. TerraSAR-X, with an eccentricity of 0.0011, launched by DLR in 2006 used this method, and its residual Doppler centroid could be kept to less than 50 Hz [36]. A more accurate 2D-YS algorithm is presented in [37]. The analytical calculation formulas of yaw angle and pitch angle are derived through vector equations. If the engineering error, such as attitude controlling error and measuring error, are not considered, the residual Doppler centroid can be controlled to zero theoretically. The GF-3 satellite launched by CAST in 2016 adopted this method.
The residual Doppler centroid of Geo-SAR can also be kept to zero theoretically by using the method in [37]. The maximum yaw angle of Leo-SAR is about ±4 degrees; however, that of Geo-SAR is much bigger, as shown in Figure 1. If this technology is still used, Geo-SAR’s attitude control system, power system, and thermal control system will be very complicated. At present, there are also relevant papers to discuss the attitude steering technology of Geo-SAR, which is based on 2D-YS technology, and they carry out the research of improved methods [38,39].
The two-dimensional pitch and roll steering (2D-PRS) technology for Geo-SAR broadside imaging is presented in [40]. A new 2D-PRSC method for squint staring mode is proposed in this paper. The maximum attitude angle to be controlled is less than 7.6 degrees, and the attitude controlling time could be greatly reduced to be shorter than 400 s.
The ambiguity to signal ratio (ASR) is one of the important parameters of spaceborne SAR. Generally, only AASR and RASR are needed to be considered for Leo-SAR. CASR is generally ignored because it is much smaller than the former two parameters [41,42,43,44]. This study discusses the ASR properties of Geo-SAR. Firstly, the earth surface curvature must be considered to accurately calculate the signal and ambiguity distribution due to having a large field of view. Secondly, due to Geo-SAR’s large yaw angle, the BFPA changes periodically with latitude argument and is much larger than that of Leo-SAR. So, it will cause great error if the antenna pattern is simplified into one-dimensional sinc functions in elevation or azimuth directions. It is necessary to calculate the 2D antenna pattern intensity distribution on the earth’s surface. Thirdly, as mentioned above, CASR cannot be ignored. Therefore, all these three kinds of ASR must meet the threshold constraint requirements in the process of satellite system designing.
The contents are arranged as follows. The new 2D-PRSC method is described in the Section 2. In the Section 3, the model of Geo-SAR staring mode is analyzed. Furthermore, the antenna size, peak transmitting power, and NESZ are also analyzed in this section. The ASR calculation approach is illuminated in the Section 4. Finally, the conclusion is presented in the Section 5.

2. Attitude Controlling Technology

2.1. Satellite Attitude Characteristic

Due to the earth rotation, the satellite’s actual flight direction will deviate from the orbital plane when it flies along the orbit, resulting in the so-called yaw angle. If there is eccentricity in the orbit, the satellite velocity direction will not coincide with the orbit tangent, resulting in the so-called pitch angle. The two angles above produce a squint angle together, which makes the Doppler centroid not zero. To solve this problem, the simplest way is to calculate these two angles and then compensate for them directly by satellite’s attitude controlling or antenna electrical scanning. This is the so-called 2D-YS technology, which is widely used for Leo-SAR satellites [36,37]. In order to minimize the satellite weight, Geo-SAR is equipped with a reflector antenna, which does not have two-dimensional beam scanning ability. As a result, it is necessary to control the satellite attitude to achieve the residual Doppler centroid of zero.
After 2D-YS, the residual Doppler centroid can be expressed as follows.
f d c = 2 r λ = 2 λ ( R s R t ) ( V s V t ) r
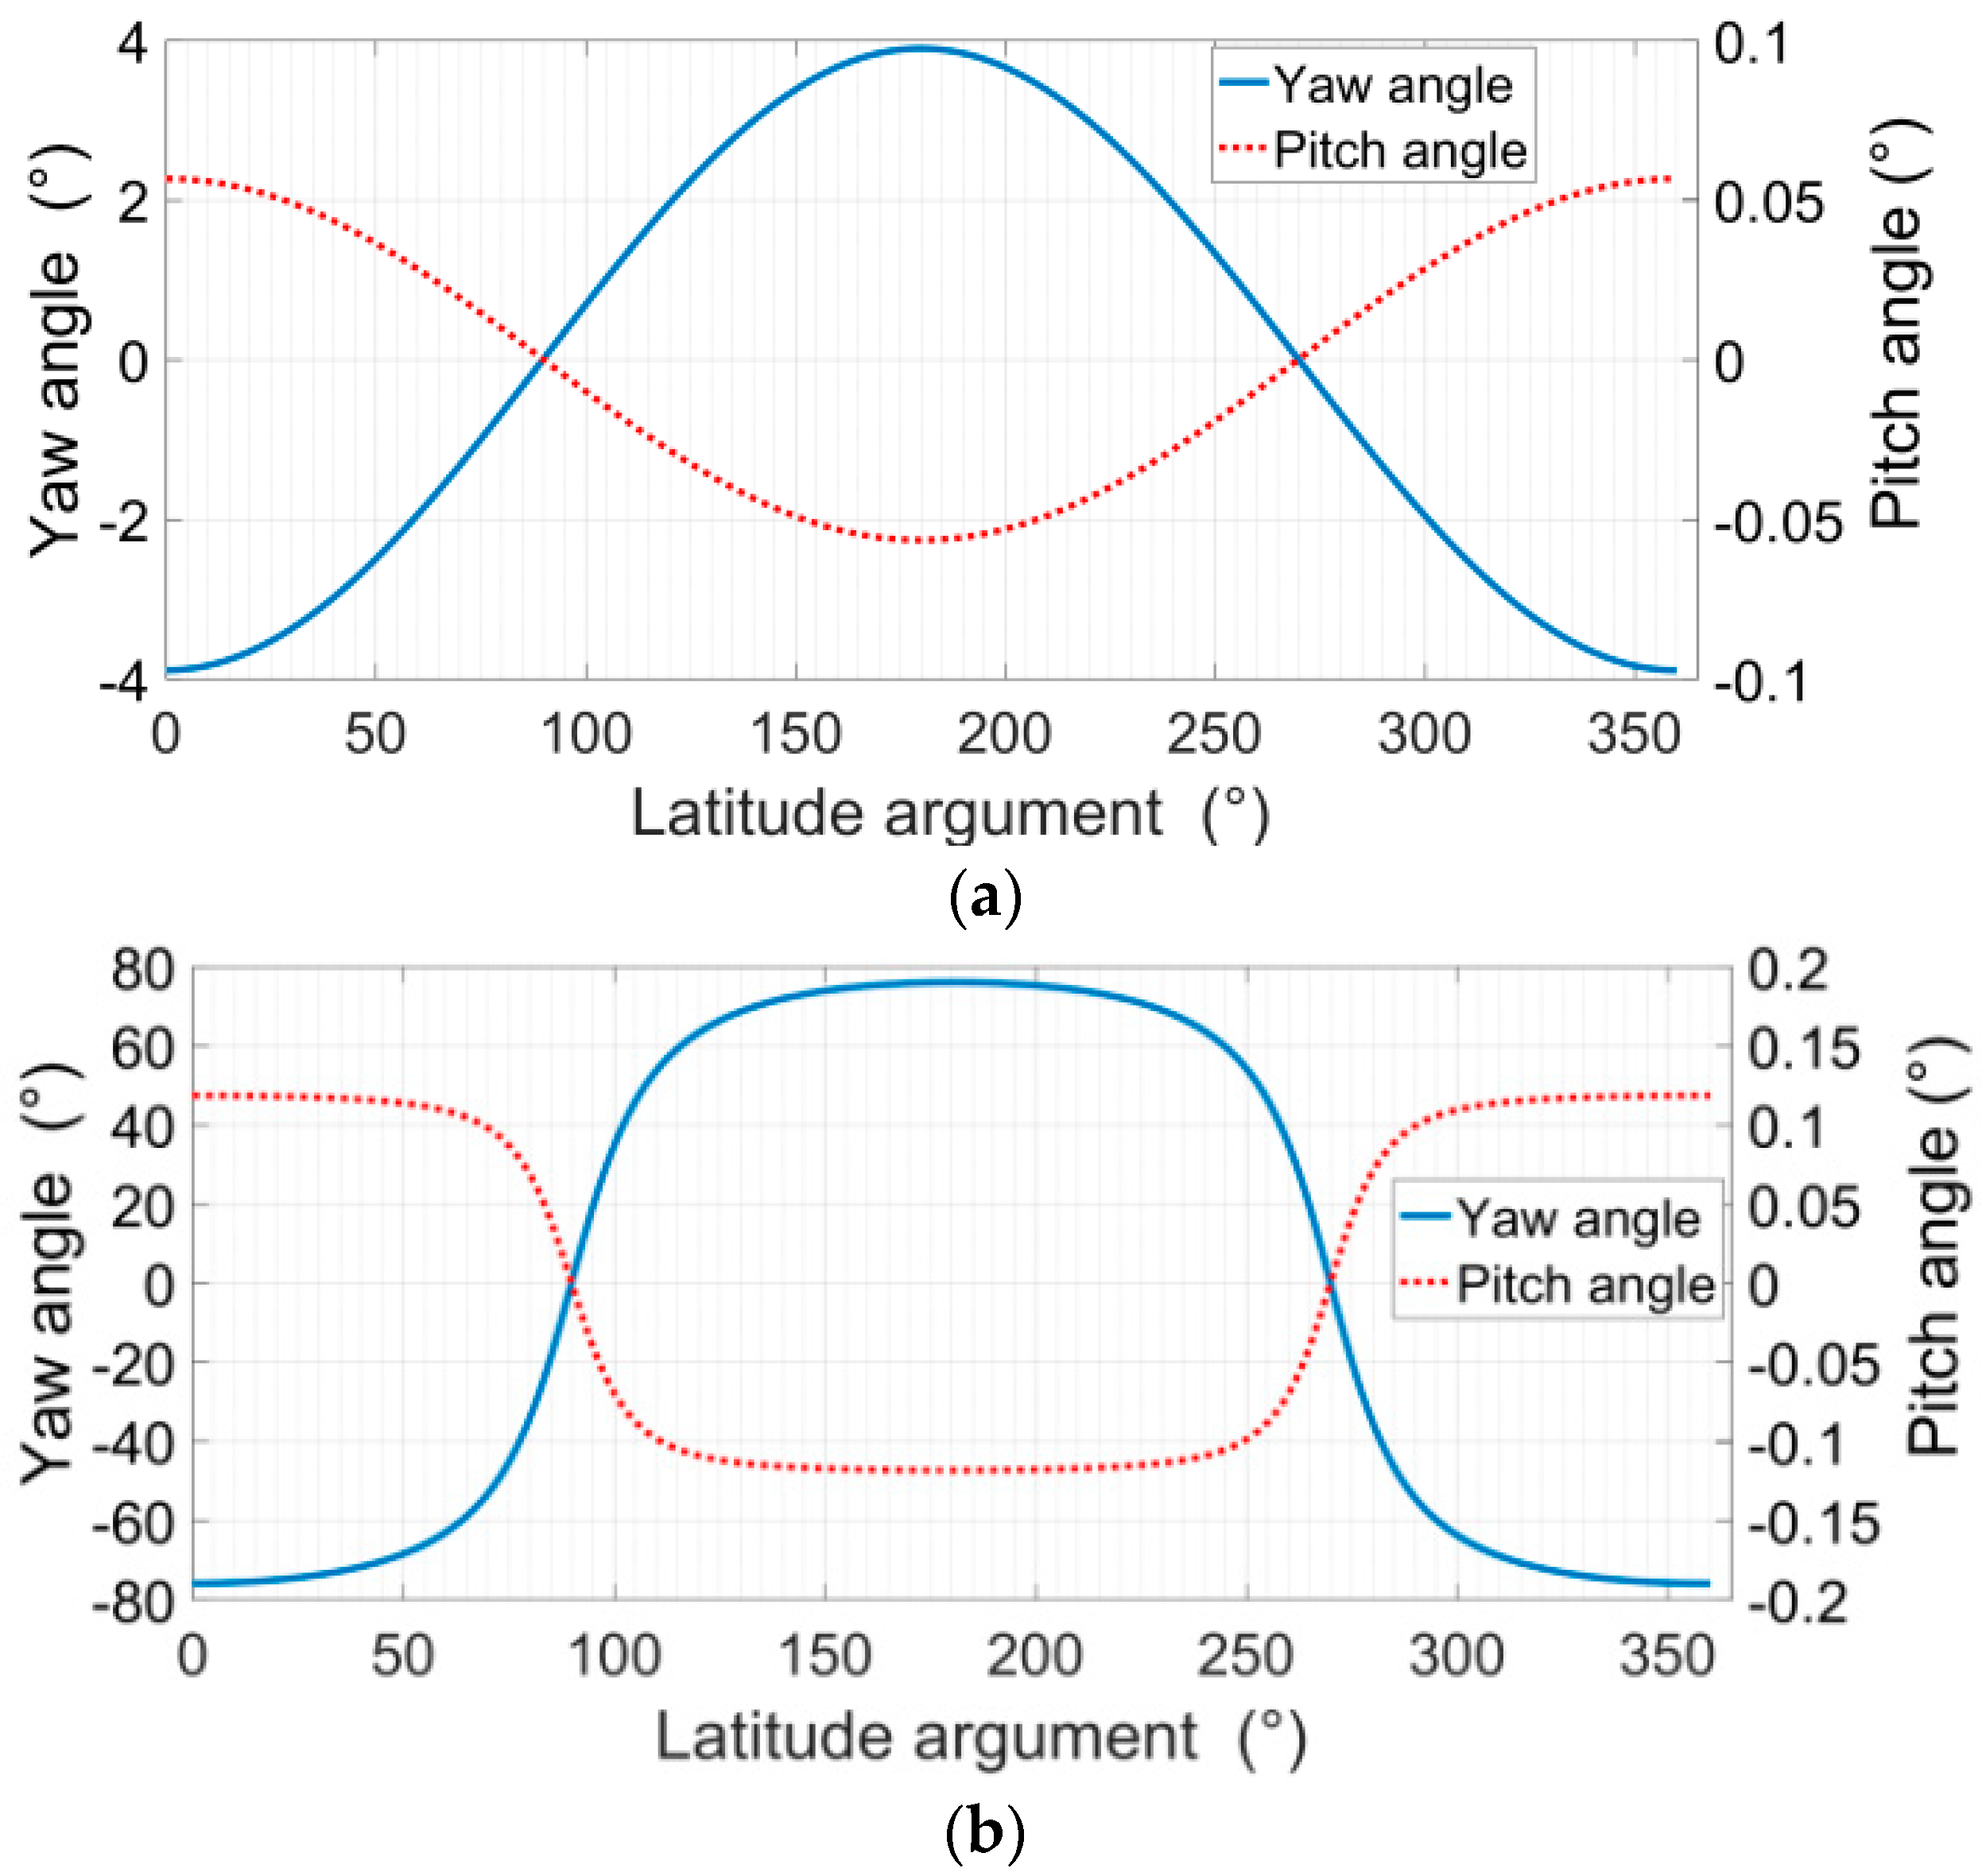
where R and V, respectively, represent the position vector and velocity vector, the subscript s means satellite and t means target, r is the range between the satellite and target, λ is the wavelength, and fdc is the Doppler centroid. The formulas in [37] are adopted to calculate the two angles above for the highest accuracy. The yaw and pitch angles of GF-3 and Geo-SAR in one orbital period are compared in Figure 2. The longitude of the ascending node is ignored here because it does not affect the analysis results. The simulation parameters are shown in Table 1.
The incidence angle of 45.5 degrees is taken as an example here for simulation. In fact, the simulation results of all different incidence angles are consistent
The solid blue line and dotted red line in Figure 2a,b, respectively, represent the yaw angle and pitch angle. There will be both small pitch angles for the two satellites due to the small eccentricity of 0.001. The pitch angle scale of GF-3 in one period is (−0.06°, 0.06°), and that of Geo-SAR is (−0.12°, 0.12°). The yaw angle scale of GF-3 in one period is (−3.9°, 3.9°), and that of Geo-SAR is (−76.1°, 76.1°).

2.2. 2D-PRSC Technology for Squint Staring Mode

2.2.1. Large Instantaneous Field of View for Geo-SAR

As described in [7,21], the angle between the beam center and zero Doppler plane is defined as the squint angle (SA), and its projection on the ground is defined as the ground squint angle (GSA). Their relationship is illustrated as follows.
θ s = arcsin ( sin γ sin θ d s )
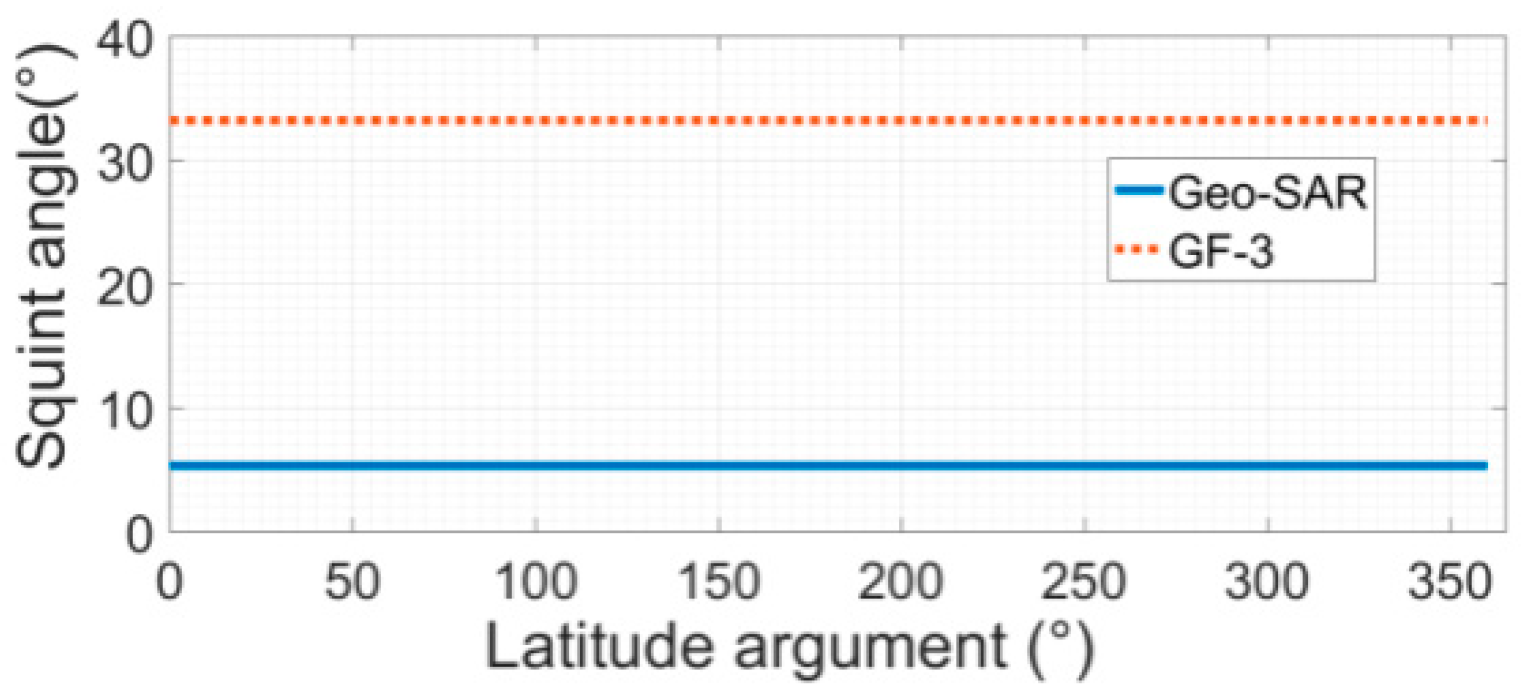
where γ is the look angle, θs is the SA, and θds is the GSA. Supposing that the GSA of GF-3 and Geo-SAR are both 60 degrees and their IAs are both 45.5 degrees, their SA in one orbit period are compared, as shown in Figure 3. It can be seen that Geo-SAR has the characteristics of large GSA and small SA due to its orbital height. This means that Geo-SAR can cover a wide range of ground areas through small attitude-controlling angles.
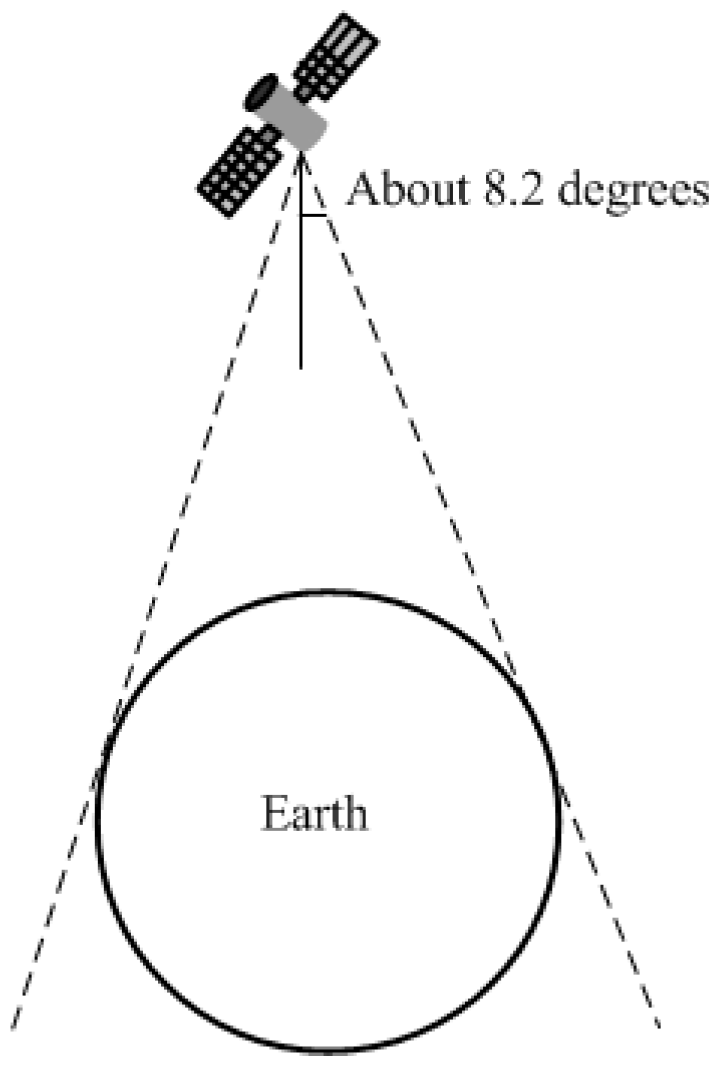
As depicted in Figure 4, Geo-SAR’s instantaneous field of view can exceed about 5000 km × 5000 km in this condition. As a result, the satellite’s revisit time can be greatly shortened, and its maneuvering imaging capability can be significantly improved if the squint mode is used.

2.2.2. 2D-PRSC Theory Illumination

We can obtain the Geo-SAR staring mode attitude-controlling angle calculating formulas for a scene of any longitude and latitude. It is named as the 2D-PRSCmethod, and its steps are presented as follows.
(a)
Calculating the original GSA.
(b)
Calculating the target direction angle. It is defined as the angle between the meridian and the line between the nadir and scene center.
(c)
Pitch and roll angle’s expressions are derived. The satellite can stare at a fixed scene by controlling these two angles.
(d)
Whether the current orbital segment meets the imaging conditions or not is confirmed according to the GSA and incidence angle (IA) threshold constraints.
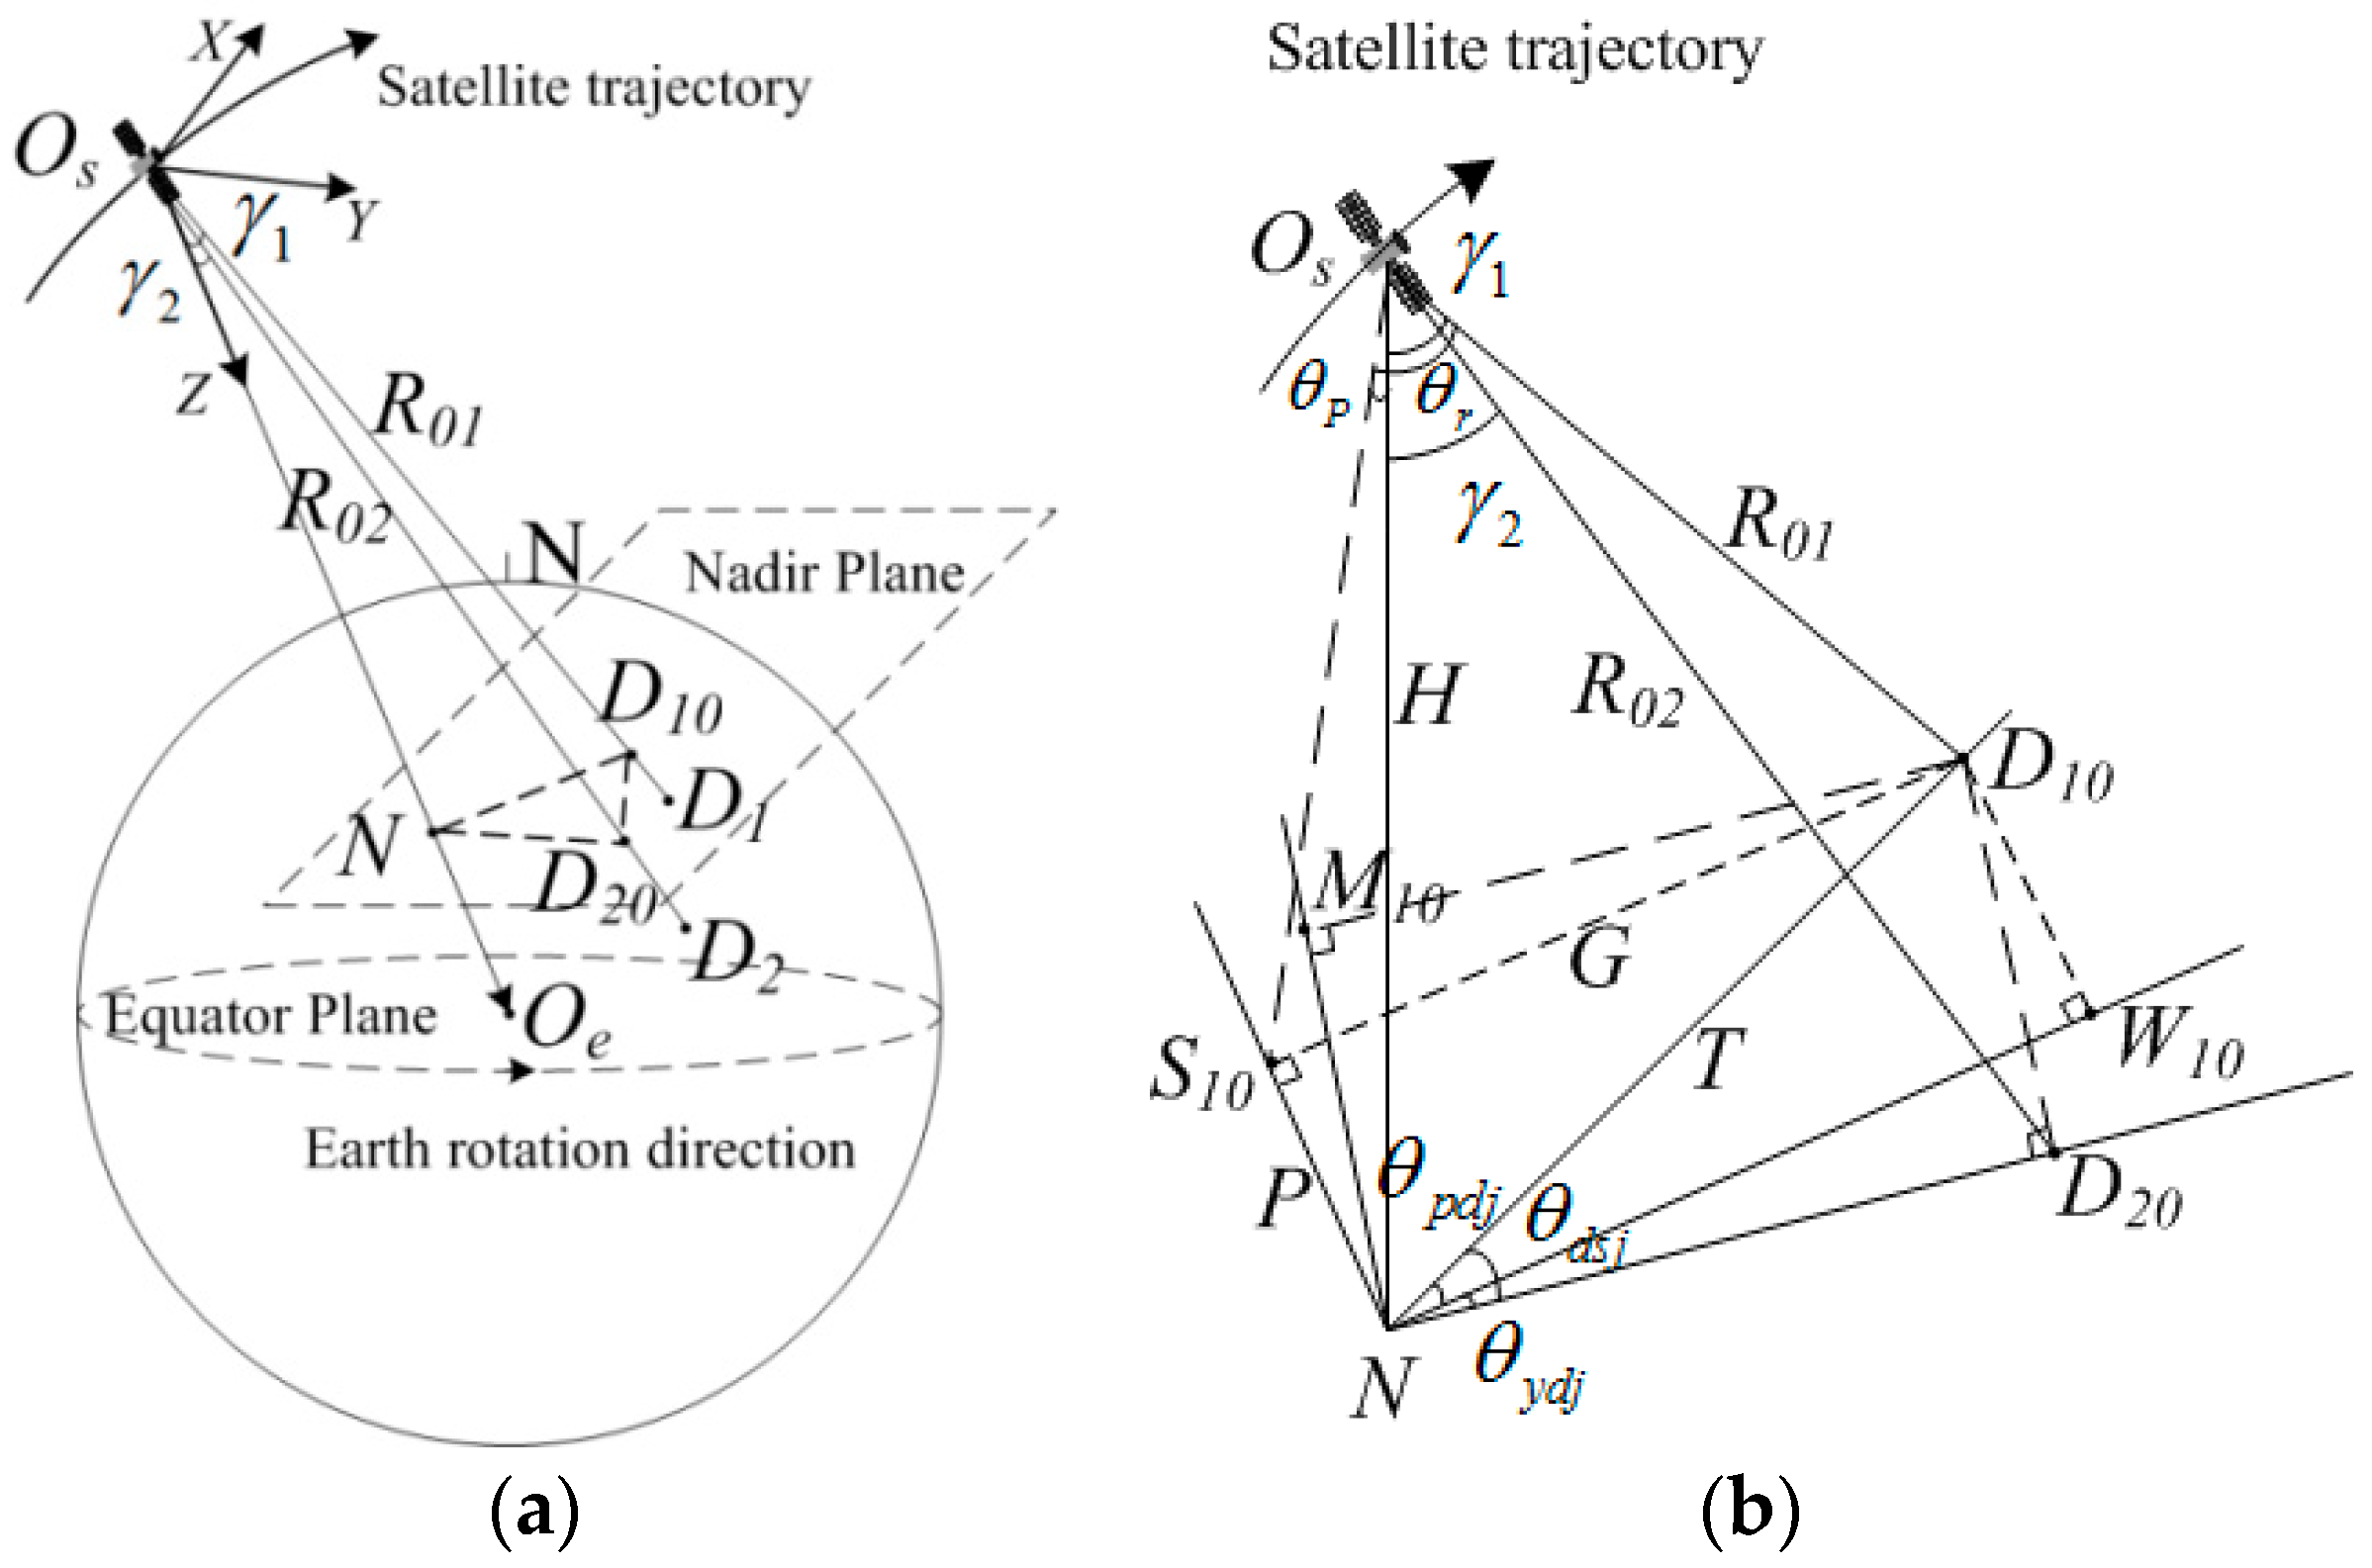
The geometric model is shown in Figure 5.
The spherical geometry model based on a satellite local coordinate system (SLCS), depicted as OsXYZ, is shown in Figure 5a. Os is the satellite centroid, the X-axis points to the flight tangent direction, the Z-axis points to the earth’s core depicted by Oe, and the Y-axis obeys the Cartesian right hand rule. N is nadir, OsD1 is the beam direction in the zero Doppler plane when the squint angle is zero, D1 is the intersection of beam center and earth surface, and γ1 is the look angle. D10 means the intersection of OsD1 and the tangent plane of the earth’s surface. OsD2 is the beam direction in no attitude steering condition, D2 is the intersection of the beam center and the earth’s surface, and γ2 is the look angle. D20 means the intersections of OsD2 and the tangent plane of the earth’s surface. R01 is the range between Os and D10, R02 is the range between Os and D20. In order to simplify the analysis process, this spherical geometry model can be transformed into plane solid geometry by projection, as shown in Figure 5b.
In Figure 5b, OsND10 is the zero Doppler plane, OsND20 is the plane with the beam center without attitude steering, <D10ND20 is the GSA, and <D10OsD20 is the squint angle. <D10ND20 and <D10OsD20 change periodically if the satellite is in the state of no-attitude steering. H is the satellite height. θyj and θpj, as simulated in Figure 1, respectively, represent the yaw and pitch angle offset zero Doppler plane in the state of no attitude steering. θdj is the original GSA, which consists of θydj from θyj and θpdj from θpj. P represents the range between N and S10, T represents the range between N and D10, and G represents the range between D10 and S10. To simplify the analysis process, this paper assumes that the beam center direction is consistent with the Z-axis of SLCS, and they both point to the earth core in the state of no attitude steering.
A satellite adjusts its beam direction on the zero Doppler plane through matrix Aypj. Furthermore, its beam can point to the predetermined target by Akj.
A ypj = [ cos θ p j sin θ p j 0 sin θ p j cos θ p j 0 0 0 1 ] [ 1 0 0 0 cos θ y j sin θ y j 0 sin θ y j cos θ y j ]
A kj = [ cos θ r j 0 sin θ r j 0 1 0 sin θ r j 0 cos θ r j ] A ypj
where θrj is the roll angle, which is equal to the look angle, and θpj and θyj are the original pitch and yaw angle. Expressions about these two angles are presented in [37]. The look angle is assumed to be consistent before and after attitude steering.
R 01 = H / cos γ 1
The original GSA θdsj can be calculated as:
θ d s j = u ( θ y d j + θ p d j )
{ θ y d j = θ y j θ p d j = sin 1 ( H tan θ p j / R 01 sin γ 1 )
where u = 1 means right look, and u = −1 means left look. Furthermore, we can get:
{ θ p 0 = tan 1 ( R 01 sin γ 1 sin θ d s j / H ) θ r 0 = tan 1 ( R 01 sin γ 1 cos θ d s j H 2 + ( R 01 sin γ 1 sin θ d s j ) 2 ) θ y 0 = 0
where θp0, θr0, and θy0, respectively, indicate the pitch, roll, and yaw angles to be compensated. It can be seen that we can realize zero Doppler centroid by steering pitch and roll angles without any controlling on the yaw angle. Its attitude steering matrix can be written as:
A k 0 = [ cos θ r 0 0 sin θ r 0 0 1 0 sin θ r 0 0 cos θ r 0 ] [ cos θ p 0 sin θ p 0 0 sin θ p 0 cos θ p 0 0 0 0 1 ]
The 2D-PRSCtheory can be further analyzed through a geometric model in an earth-centered inertial (ECI) coordinate, as shown in Figure 6.
Where Oe is the earth’s core, N is nadir, Rne is the earth radius at nadir, T is the scene center, NC represents meridians, C and T have the same latitude, and NB represents the intersection of the zero Doppler plane and the earth’s surface. NS represents the beam center projection on the ground without attitude controlling. NTr1 and NTr0, respectively, represent the nadir track with and without the earth’s rotation. The deviation angle between NTr0 and NC is α1, and that angle between NTr1 and NC is α2. They are presented as follows.
α 1 = arccos [ tan ( δ s ) cot ( θ n a ) ]
α 2 = arctan [ ( H V s sin α 1 ) / R s ω e R n e cos δ s ( H V s cos α 1 ) / R s ]
Furthermore, the deviation angle between NB and NC, expressed by αb, is written as:
α b = α 2 + u π / 2 , u = ± 1
where θna is the latitude argument, δs is the nadir’s latitude, Vs is the satellite’s velocity in ECI, and Rs is the range between the satellite and the earth core. ωe (ωe = 7.292115 × 10⁻⁵ rad/s) is the earth rotation angular velocity [21]. According to the Kepler orbit theory:
R n e = R e 2 R p 2 [ R p cos δ s ] 2 + [ R e sin δ s ] 2
R s = [ a ( 1 e 2 ) ] / ( 1 + e cos f )
V s = [ R s 2 e sin f a ( 1 e 2 ) ω s ] 2 + μ a ( 1 e 2 ) R s 2
where e is the orbital eccentricity, f is the true anomaly, a is the semi-major axis, μ (μ = 3.98696 × 10¹⁴ m3/s2) is the constant of earth’s gravitation, Re and Rp (Re = 6378.137 km, Rp = 6356.752 km), respectively, represent the equatorial semi-axis and polar semi-axis of ellipsoid earth [21].The original GSA, θdsj, has been written in (6), and the deviation angle between NS and NC, expressed by αs, is written as:
α s = α b θ d s j
Furthermore, the deviation angle between NT and NC, expressed by α3, is written as:
α 3 = Ψ Θ
where
Ψ = arccos { tan δ s cot [ arcsin ( sin δ s sin ϕ i m ) ] }
Θ = arctan χ arctan ς
Ω = arctan χ + arctan ς
where (18) can be derived from (21), and (19) and (20) can be derived from (22):
{ ϕ i m = arccos ( D i m 1 / D i m 0 ) D i m 1 = R n e cos δ s cos [ ( | ξ s ξ t | ) / 2 ] D i m 0 = ( R n e sin δ s ) 2 + D i m 1 2
{ χ = cos [ ( H t H n ) / 2 ] cos [ ( H t + H n ) / 2 ] cot Ψ 2 ς = sin [ ( H t H n ) / 2 ] sin [ ( H t + H n ) / 2 ] cot Ψ 2 H t = 2 arcsin [ cos δ s sin ( | ξ s ξ t | / 2 ) ] H n = | δ s δ t |
where ξs and ξt represent the longitude of the nadir and scene center, and δt is the scene center latitude. Ht is the arc length of the great circle between N and C and Hn is the arc length of the great circle between T and C. Hc is the arc length of the great circle between T and N, and it is equal to geocentric angle αt. Its corresponding look angle is γt.
α t = 2 arctan { cos [ ( Ω + Θ ) / 2 ] tan [ ( H t + H n ) / 2 ] cos [ ( Ω Θ ) / 2 ] }
γ t = arcsin [ ( R t e sin α t ) / R s t 0 ]
where Rte is the earth’s radius at the scene center, Rst0 is the range between the satellite and scene center. They can be presented as:
R t e = R e 2 R p 2 ( R p cos δ t ) 2 + ( R e sin δ t ) 2
R s t 0 = R s 2 + R t e 2 2 R s R t e cos α t
Based on (6), (12), (17), (24), and (26), the expressions of pitch and roll angles need to be controlled, which are derived as follows.
{ θ p t 0 = arctan [ R s t 0 sin γ t sin ( θ d s j + α 3 α b ) / H ] θ r t 0 = arctan ( R s t 0 sin γ t cos θ d s j H 2 + ( R s t 0 sin γ t sin θ d s j ) 2 ) θ y t 0 = 0
where θpt0, θrt0, and θyt0, respectively, represent the pitch, roll, and yaw angles, which need to be controlled. According to (27), the attitude controlling matrix Akt0 can be expressed as follows.
A kt 0 = [ cos θ r t 0 0 sin θ r t 0 0 1 0 sin θ r t 0 0 cos θ r t 0 ] [ cos θ p t 0 sin θ p t 0 0 sin θ p t 0 cos θ p t 0 0 0 0 1 ]
Using (28), a satellite’s beam can always point to a scene center through the pitch and roll attitude controlling from the original state. Furthermore, according to (12), (17), (23), and (24), the corresponding expressions of IA(θint0) and GSA(θdt0) are presented as follows.
θ i n t 0 = γ t + α t
θ d t 0 = α b α 3
Finally, when a satellite keeps staring at some scene of any latitude and longitude, considering the threshold constraints of GSA and IA, the imageable orbit segments in one orbital period can be calculated.

2.2.3. Simulation

This manuscript supposes that the constraint scale of GSA is (−60°, 60°), and that of IA is (18°, 60°). Taking Beijing (116.41°E, 39.90°N) and Hong Kong (114.10°E, 22.39°N) as examples, the simulation results are shown in Figure 7. Five subgraphs, in Figure 7a,b, from top to bottom separately show the variation curves of roll angle(RA), pitch angle(PA), IA, GSA, and Doppler central frequency(FR) in one orbital period. The blue solid line indicates the imageable track segment. The red dotted line indicates that the beam points to the scene center; however, these orbit segments’ parameters do not meet the constraints of IA or GSA, so the satellite cannot produce an image.
In fact, both pitch and roll attitude controlling scale will not exceed ±7.6 degrees in the whole orbit if the 2D-PRSC method is employed for Geo-SAR to stare at any ground scene. This indicates that the satellite can promptly complete the attitude controlling and achieve squint staring. The obtained result from the two cases above indicates that the Geo-SAR satellite has a great advantage of revisiting. In addition, Figure 7 shows that the absolute Doppler frequency maybe higher than the PRF, and thus, the data can be aliased. As a result, this should be considered for system parameter designing.

3. Staring Imaging Mode

3.1. Geo-SAR Staring Mode Model and Characteristics

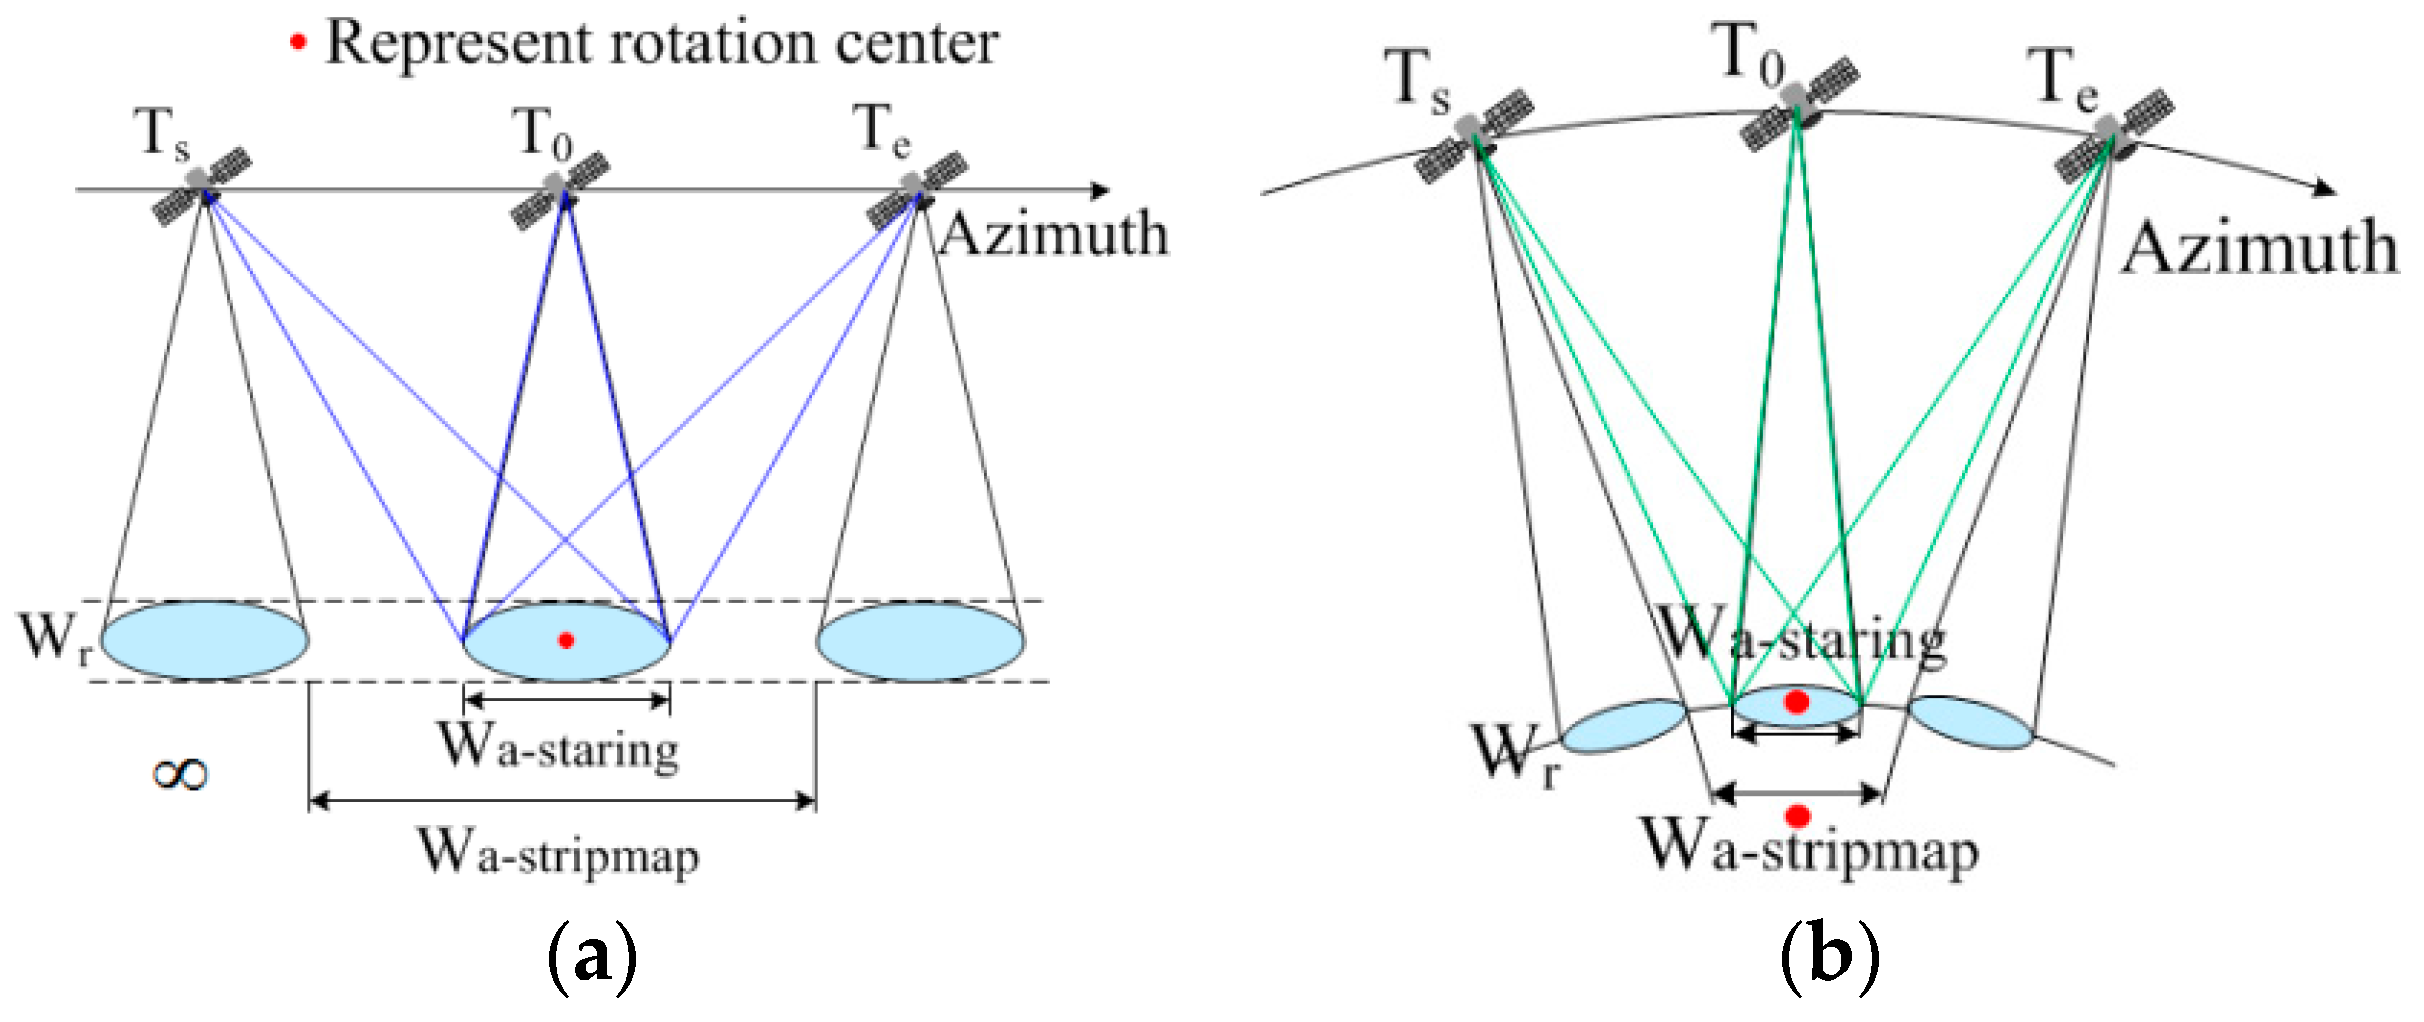
The Leo-SAR geometric model is depicted in Figure 8a. Ts, T0, and Te, respectively, represent the start time, middle time, and end time of imaging. Wr is the range swath width, and Wa is the azimuth imaging scale. The staring and stripmap modes are marked by different subscripts. The stripmap mode is marked by a black line, and the staring mode is marked by a blue line. The rotation center is marked by a red dot. In addition, the satellite trajectory can be approximated as a straight line, and the earth surface can be approximated as a plane due to its short integration time. Leo-SAR’s different modes can be realized by only changing the beam’s azimuth direction through the attitude controlling or antenna electrical scanning. Its azimuth resolution is determined by the beam scanning scale and rate [21,22,23,32,33].
Similarly, Figure 8b shows the Geo-SAR geometric model of different imaging modes. The curvature of orbital trajectory and earth surface cannot be ignored due to the orbital height, long integration time, and large beam coverage. The staring mode differences between Geo-SAR and Leo-SAR are illuminated as follows. All the simulation plots in this section correspond to the parameters presented in Table 1.
Geo-SAR’s stripmap mode is similar to Leo-SAR’s slide spotlight mode. Since Geo-SAR satellite’s speed is about seven times its beam’s moving speed, the rotation center is not at infinity, as Leo-SAR is in the stripmap mode condition. However, both of their rotation centers are in the scene center in the staring mode condition, as shown in Figure 8.
Geo-SAR’s azimuth imaging scale is mainly determined by its beam coverage. The staring mode is recommended to select, and the azimuth imaging scale is always equal to the beam coverage during its orbital period.
Leo-SAR just needs one-dimensional azimuth beam direction controlling; however, Geo-SAR needs a more complicated two-dimensional beam direction controlling algorithm to realize the staring mode. The theory in Section 2 has illustrated the 2D-PRSC method for squint staring (broadside is a special case of squint).
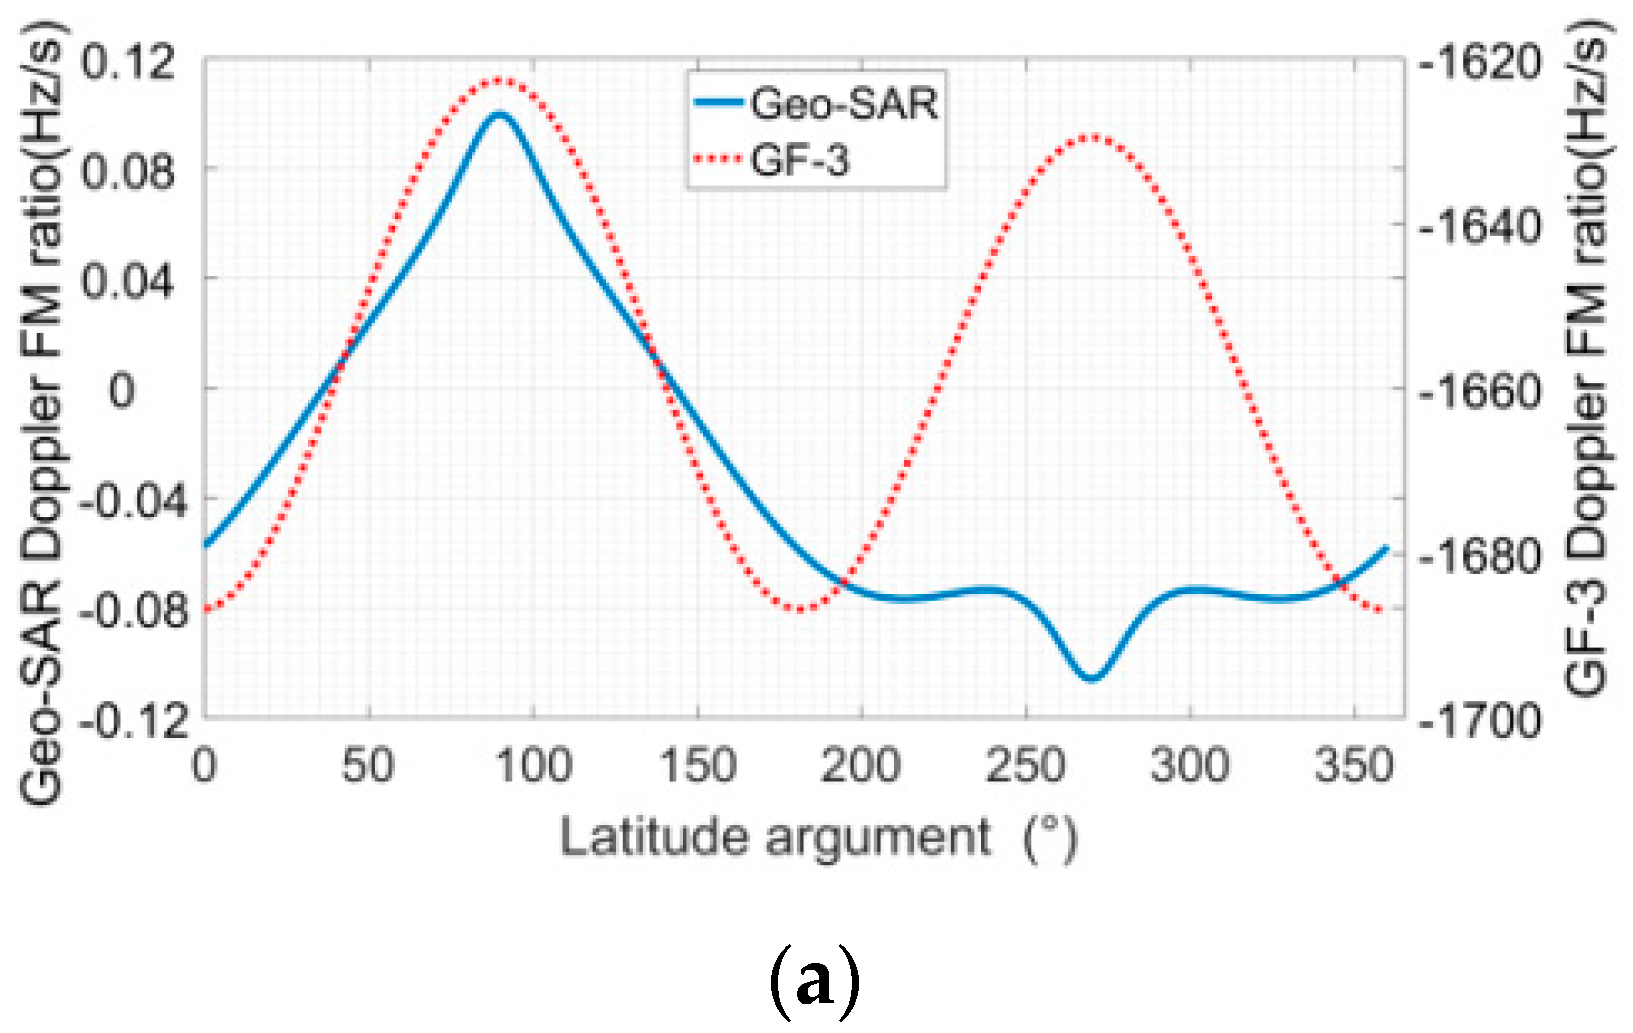
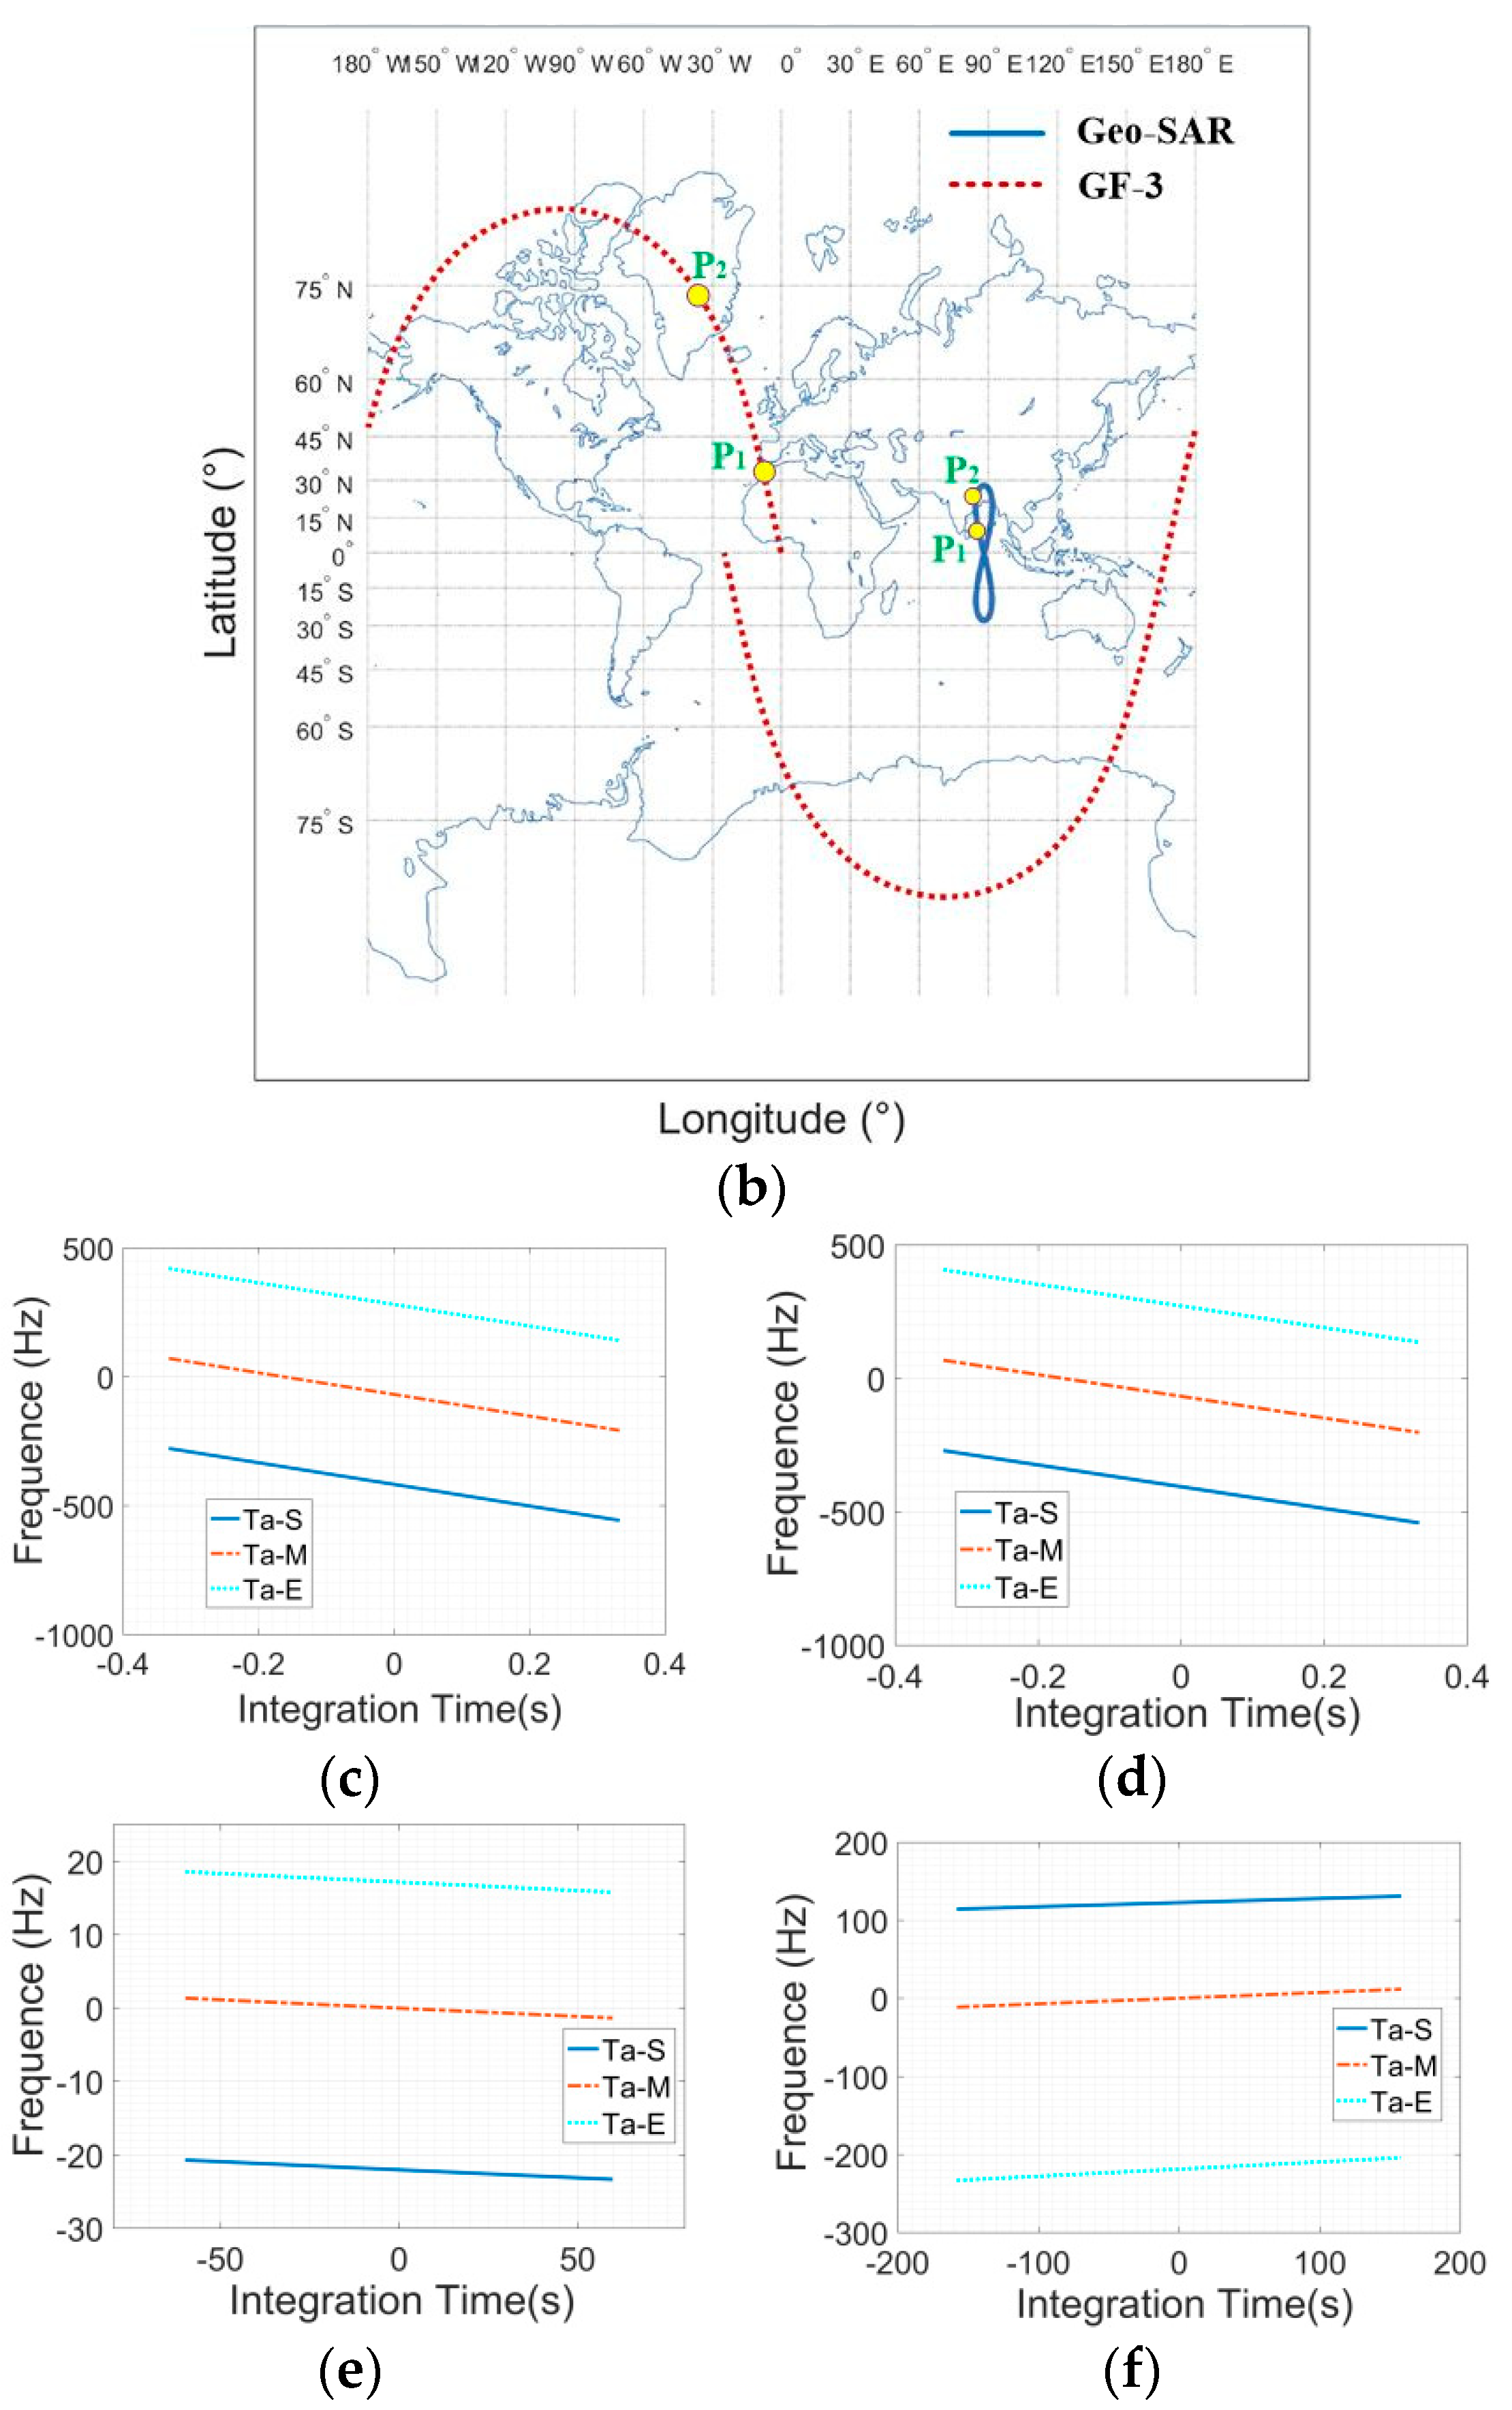
The Geo-SAR Doppler FM rate, positive or negative, always changes during the whole orbit. Its staring mode Doppler history is also strongly time-varying. The Leo-SAR Doppler FM rate, almost unchanged, is negative in the whole orbit, and its Doppler history hardly changes. Figure 9a compares the Doppler FM rate of Geo-SAR and GF-3 in the same IA of 45.5 degrees. The Doppler FM rate of Geo-SAR is (−0.11, 0.1) Hz/s, and that of GF-3 is (−1680, −1618) Hz/s. Furthermore, considering the orbital symmetry, a latitude argument of 23.4 degrees and 75.7 degrees, marked by P1 and P2, are selected to compare the two satellites’ staring mode Doppler history. Figure 9b–f show the simulation results. The Doppler history of the starting, middle, and terminal point targets of the staring area are, respectively, represented by Ta-S, Ta-M, and Ta-E, which are marked by different colors and lines. Unlike GF-3, Geo-SAR Doppler history has a strong time-varying property, as listed in Table 2. In addition, the Doppler frequency interval between Ta-S, Ta-M, and Ta-E of Geo-SAR is not uniform, and it changes obviously with the latitude argument. This is also quite different from Leo-SAR.
In summary, the Geo-SAR staring mode is selected to improve the satellite’s flexible maneuver imaging capability and to obtain a constant azimuth imaging scale.

3.2. Antenna and Power

Large antenna and large radiation power are necessary to achieve the required 25 m resolution and −18 dB NESZ for Geo-SAR.

3.2.1. Antenna Selection

The reflector antenna is smaller when gathered together and is lighter than a phased-array antenna. Considering the weight and volume constraints of the rocket and satellite, the reflector antenna is a better choice for Geo-SAR. Therefore, all the analyses in this paper are based on the reflector antenna.

3.2.2. Antenna Shape and Area

CAST’s Geo-SAR satellite adopts the L-band, and its expected range swath width is no less than 320 km in the IA scale of (18°, 60°). So, its elevation antenna size should not exceed 25 m. Its azimuth antenna size should be about 25 m to match the range swath width in the staring mode. Furthermore, affected by the periodic yaw angle, the beam foot-print direction angle (BFPA) on the ground also has a periodic direction angle if the satellite adopts a 2D-PRSC algorithm. The BFPA will be illustrated in Section 4. For the reasons above, a circular reflector antenna of 25 m diameter is chosen to ensure the same imaging range in all directions during the whole orbital period.

3.2.3. NESZ

To cover the required IA range, thirteen swaths of 320 km are designed for Geo-SAR. Considering the ambiguity and other constraints, each swath’s PRF should be selected in the range of (160, 430) Hz. The satellite has a peak radiation power of 20,000 W, pulse width of 400 us, signal width of 50 MHz, and resolution of 25 m × 25 m.
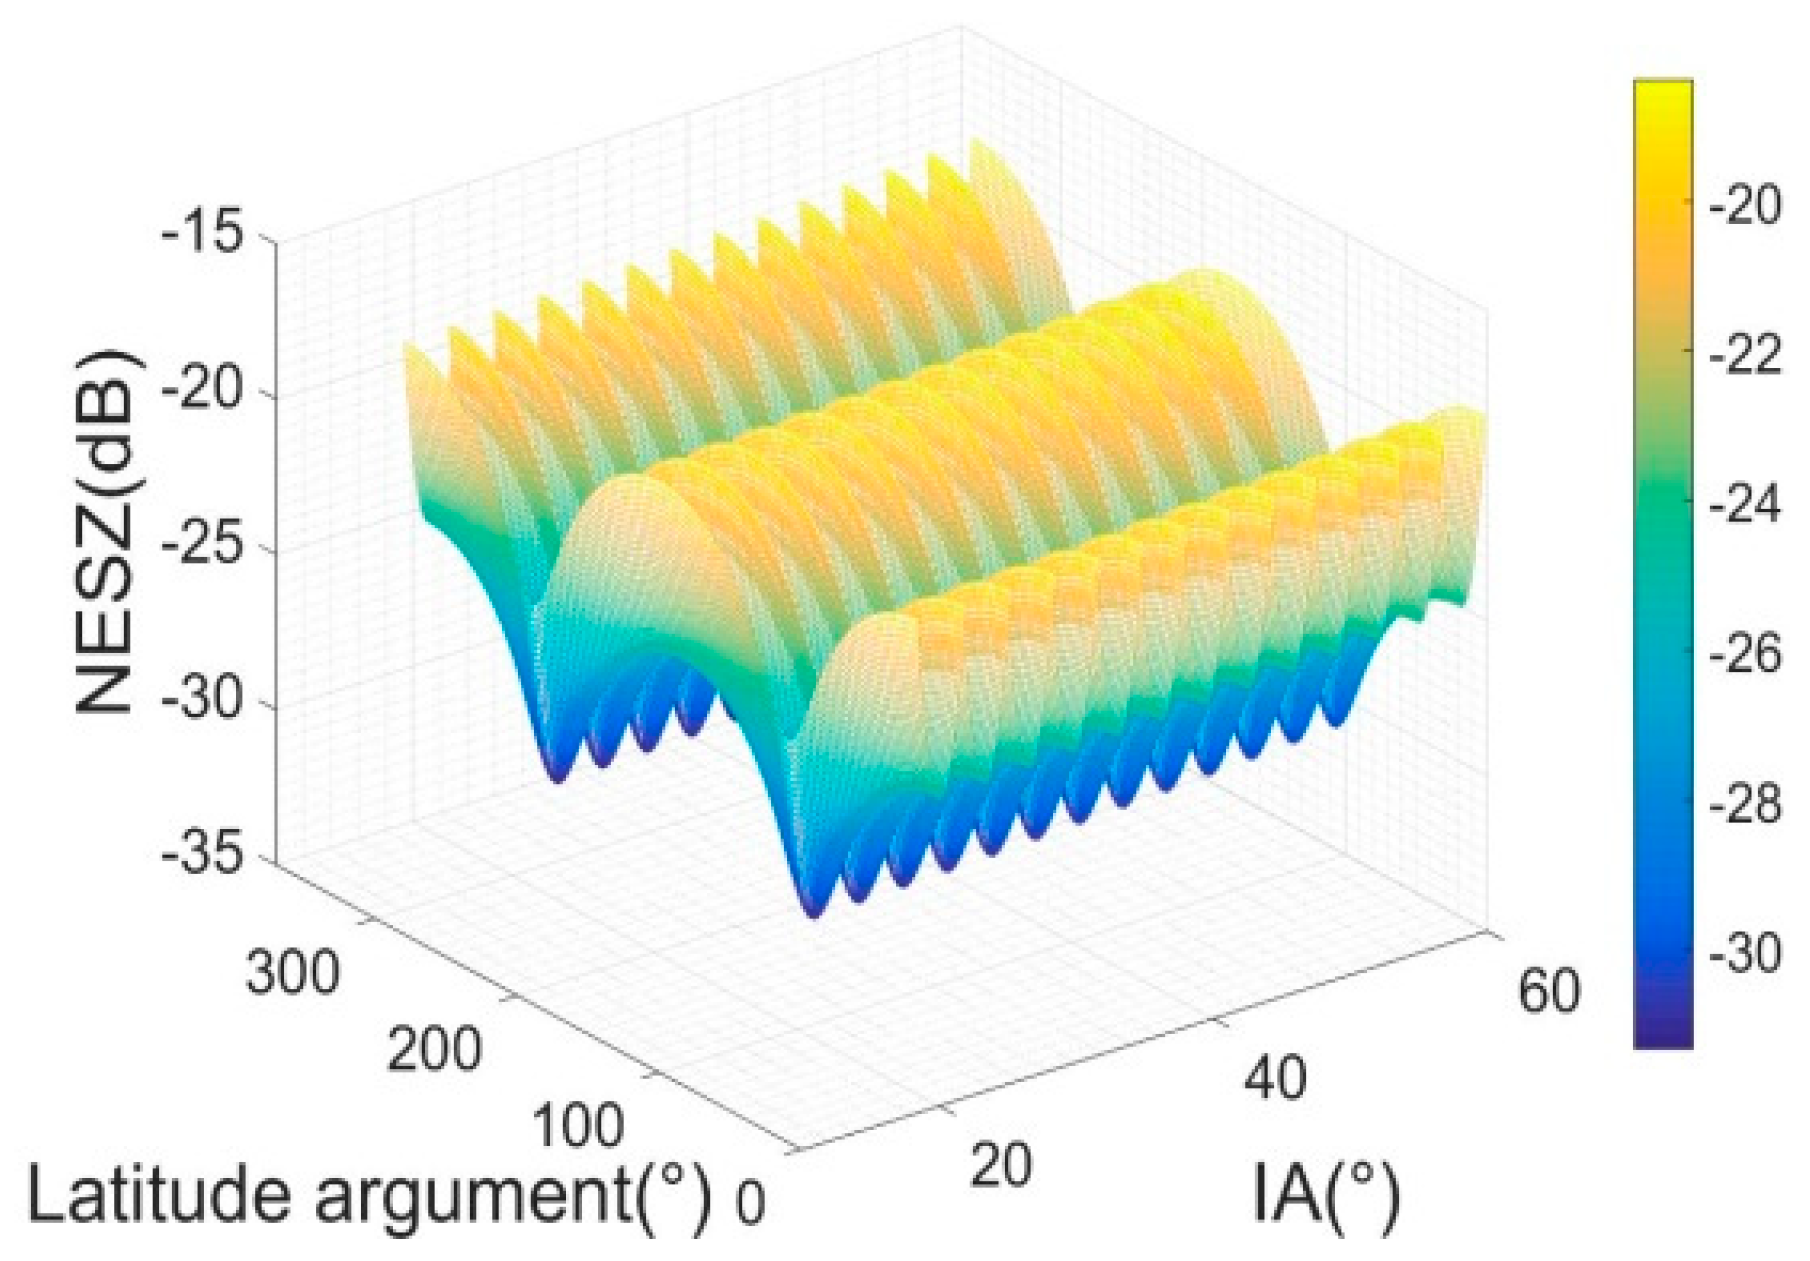
The system’s NESZ will change with the latitude argument due to the satellite time-varying velocity. The NESZ simulation results in one orbit period and the whole IA range are shown in Figure 10. The system losses are assumed as 3 dB in this part.
Therefore, an L band Geo-SAR satellite adopts a circular reflector antenna with a diameter of 25 m. Its resolution is 25 m × 25 m, and the peak radiation power is 20,000 W. The system’s worst NESZ will be better than −18.4 dB.

4. Ambiguity Analysis

4.1. Geo-SAR Staring Mode Ambiguity Model

ASR is an important parameter for spaceborne SAR. Its expression can be written as follows [41,42].
A S R ( τ , f d ) = m , n = B p / 2 B p / 2 S ( f d + m P R F , τ + n / P R F ) d f d B p / 2 B p / 2 S ( f d , τ ) d f d B p / 2 B p / 2 S ( f d , τ ) d f d
S ( f d , τ ) = ε G 2 ( f d , τ ) σ 0 ( f d , τ ) ρ a ρ g r R s t 4 ( f d , τ ) sin θ i n t
where Bp is the Doppler bandwidth, G2(fd,τ) is the dual-way far field antenna pattern, σ0(fd,τ) is the backscattering coefficient, ρa is the azimuth resolution, ρgr is the ground range resolution, Rst(fd,τ) is the range between the signal or ambiguity point and radar, fd is the Doppler frequency, τ is the echo delay time, PRF is the pulse repetition frequency, m is the ambiguity number in the Doppler frequency domain, and n is that in the time domain. The ambiguities are divided into three types [41].
RASR: those with the same Doppler frequency as signal (i.e., m = 0 and n ≠ 0 in (31));
AASR: those along the same slant range as signal (i.e., m ≠ 0 and n = 0 in (31));
CASR: the remaining terms (i.e., m ≠ 0 and n ≠ 0 in (31)).
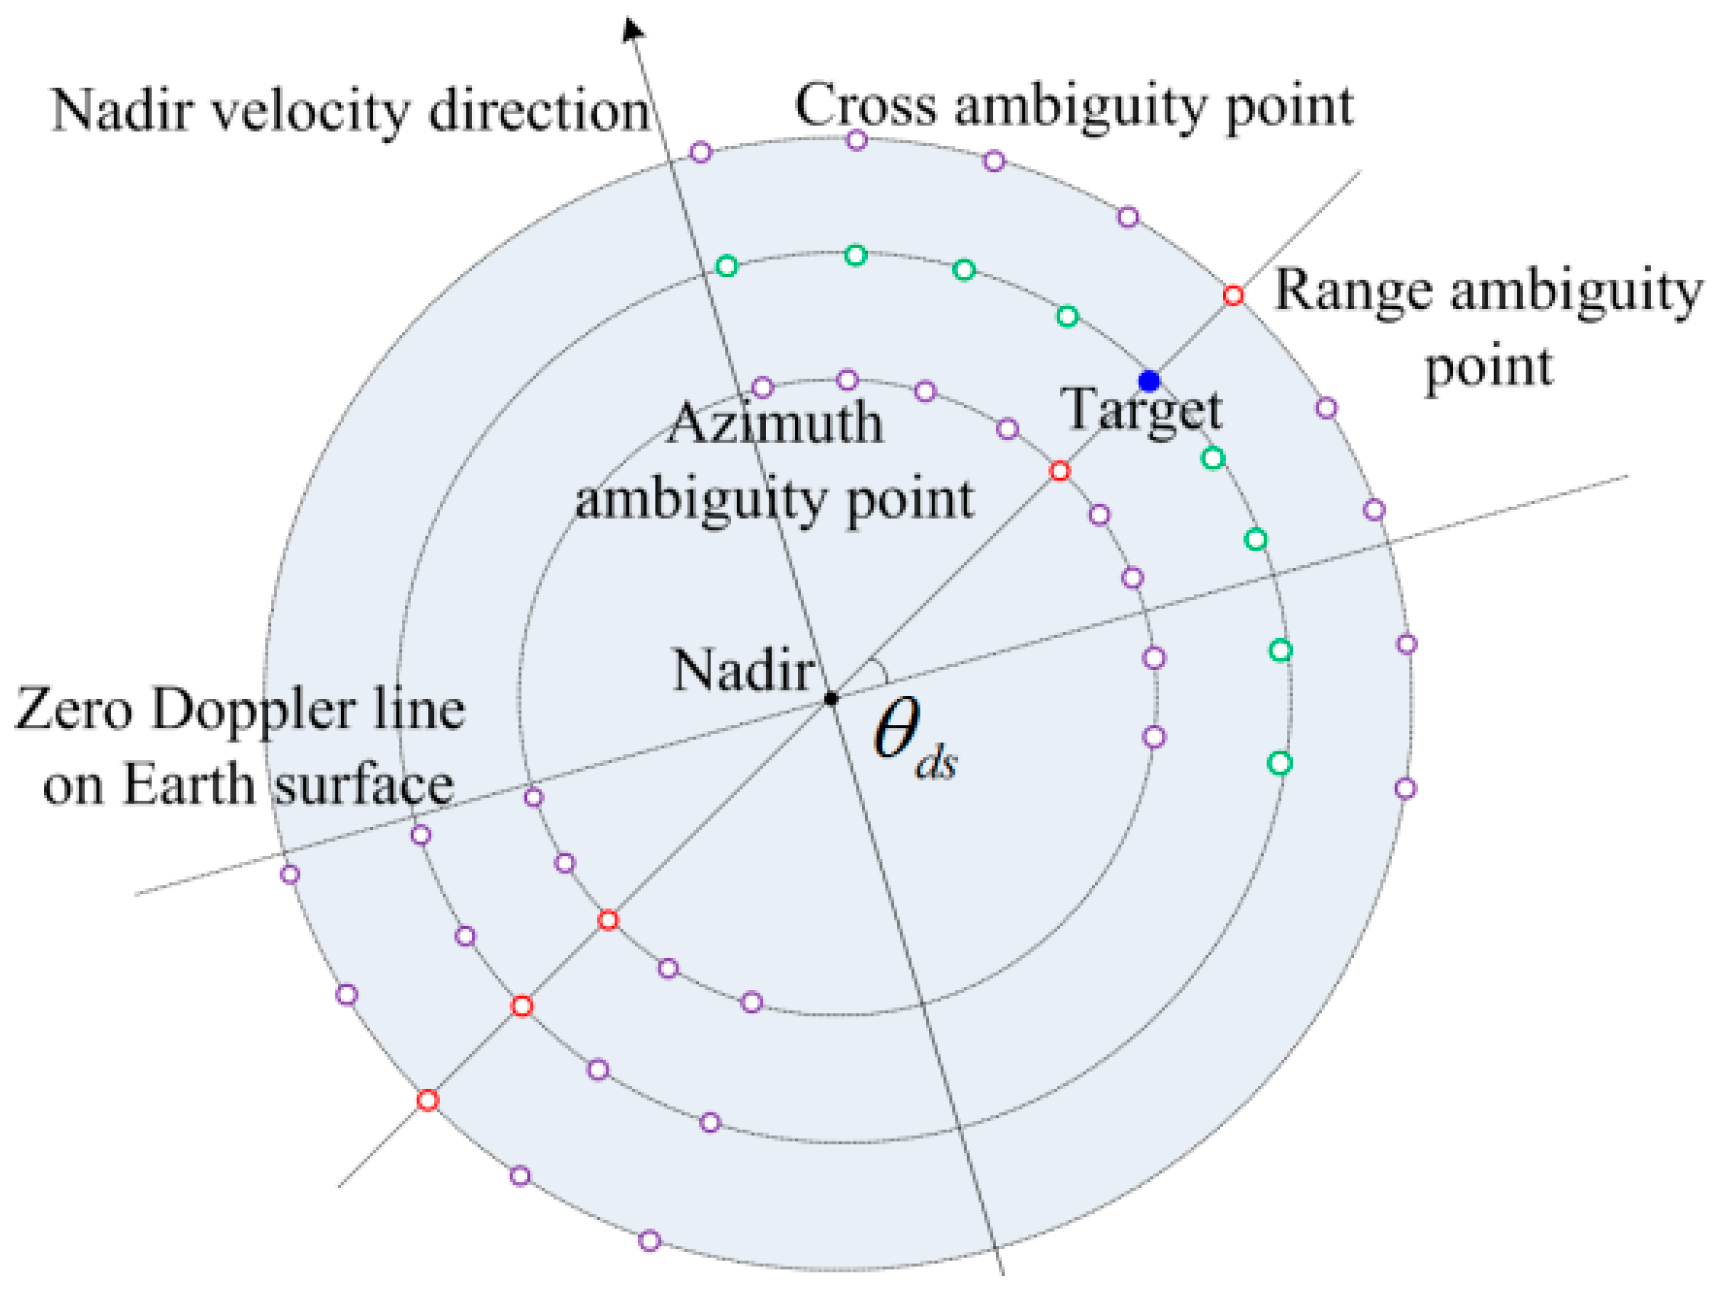
Neither the satellite trajectory nor earth surface curvature can be ignored. Figure 11 shows the signal and ambiguity point distribution on the earth’s surface. In Figure 11, the signal, azimuth ambiguity, range ambiguity, and cross-term ambiguity are, respectively, marked by a blue solid point, green hollow point, red hollow point, and purple hollow point. θds is the GSA.
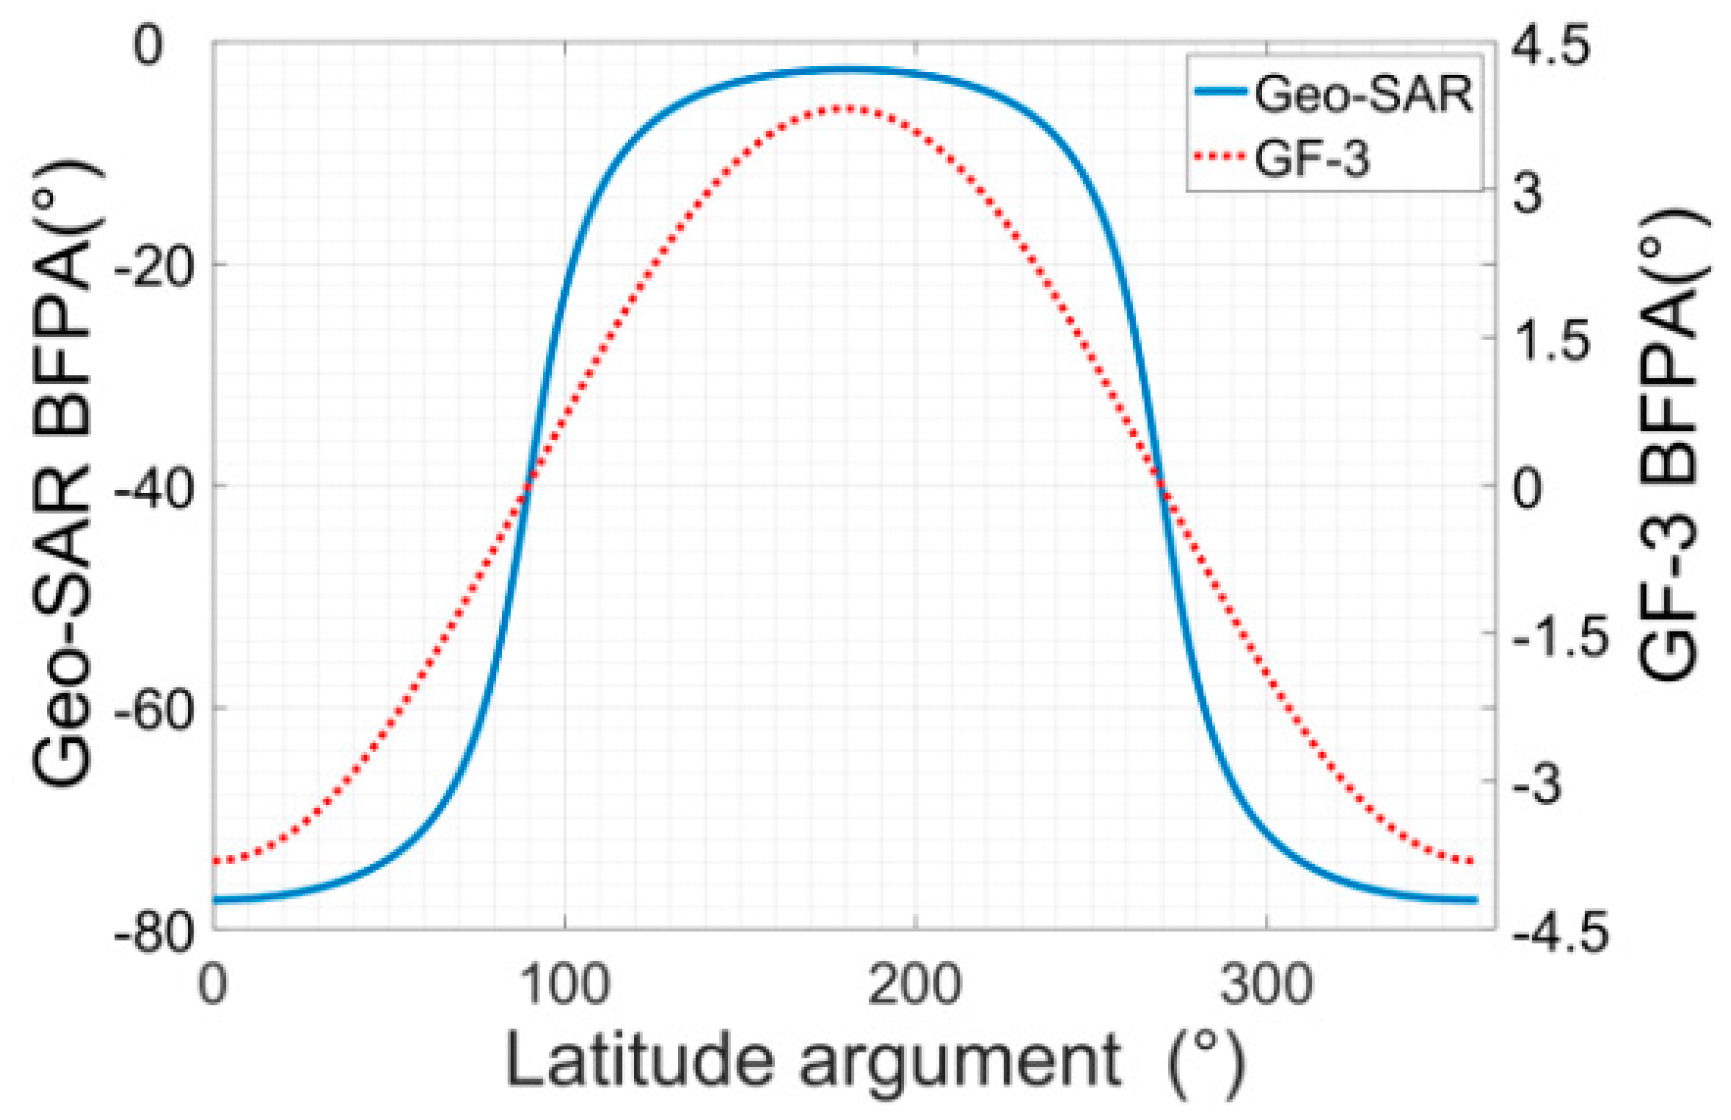
It can be seen that the ambiguity position and its corresponding calculation accuracy of the antenna pattern gain determine the ASR calculation accuracy. The angle between the profile of a one-dimensional antenna pattern in the elevation direction and the zero Doppler plane, represented by θBFPA, is defined as BFPA. Figure 12 compares its periodic variation with the latitude argument between GF-3 and Geo-SAR.
Leo-SAR, such as GF-3, uses 2D-YS technology, so θBFPA = θds jθdyj. Generally, Leo-SAR adopts near-circular orbit, that is, its orbital eccentricity is less than 3‰, so θBFPA ≈ 0. It shows that the profile of a one-dimensional antenna pattern in the elevation direction is perpendicular to the satellite’s track, and the profile of a one-dimensional antenna pattern in the azimuth direction is parallel to the satellite’s track. The range or azimuth ambiguity point will just be located on the elevation or azimuth profile of the antenna pattern. Therefore, RASR and AASR can be calculated by using the corresponding one-dimensional antenna pattern, respectively. In addition, CASR could be ignored [42].
Geo-SAR uses 2D-PRSC technology, so θBFP = θdsj. This indicates that the ambiguity properties will be quite complicated and different from Leo-SAR. It is necessary to employ the geometry model depicted in Figure 11. Furthermore, a two-dimensional antenna pattern and its distribution variety should be considered for ASR calculation.
This paper uses an ideal sinc function to characterize the antenna pattern. The dual-way two-dimensional antenna pattern is shown as follows.
G e a = sin c 2 [ D r λ sin ( ξ e ξ e 0 ) ] sin c 2 [ D a λ cos ( ξ e ξ e 0 ) sin ( ζ a ζ a 0 ) ]
where Dr and Da, respectively, indicate the elevation and azimuth antenna size. The antenna pattern elevation and azimuth angles, represented by ξe0 and ζa0, are calculated based on the reference line from the satellite to the earth center.
{ ξ e 0 = arcsin [ sin γ t cos ( θ d t 0 + θ B F P ) ] ζ a 0 = arctan [ tan γ t sin ( θ d t 0 + θ B F P ) ]
where γt is the beam center look angle shown in (24), and θdt0 is the GSA. It is zero in the broadside condition; otherwise, it is as shown in (30) in the squint staring condition. Compared with Leo-SAR, the ASR of Geo-SAR has several different characteristics:
It is necessary to use a two-dimensional antenna pattern to calculate ASR; otherwise, the error will be very large;
The ASR of Geo-SAR is obtained in 2D-PRSC conditions. This calculation result is quite different from that in 2D-YS conditions.
Due to the influence of the large BFPA, the CASR of Geo-SAR cannot be ignored for system designing;
Geo-SAR usually works in the squint condition for emergency missions. So, it is necessary to consider both GSA and BFPA to obtain the ambiguity point location. This further increases the ASR calculation complexity.
RASR, AASR, and CASR of Geo-SAR are all strongly time-varying. As a result, whole orbital ergodic analysis is necessary in system designing process.

4.2. RASR

Similar to (34), the elevation angle and azimuth angle of the target signal or range ambiguity point can be expressed as
{ ξ e = arcsin [ sin γ cos ( θ d t 0 + θ B F P ) ] ζ a = arctan [ tan γ sin ( θ d t 0 + θ B F P ) ]
where γ is the look angle of the target signal or range ambiguity point.
γ = arcsin ( R t e sin α / R s t )
where Rte is the earth radius at the scene center as expressed in (25), and Rst is the range between the satellite and target signal or range ambiguity point.
R s t = R s 2 + R t e 2 2 R s R t e cos α + n ( c / 2 P R F )
where Rs, expressed in (14), is the range between the satellite and the earth core; n ∈ (−N,N). When the parameter n equals to zero, it means target signal; otherwise, it is the range ambiguity signal. The corresponding geocentric angle is represented by α.
α = arcsin ( R s t sin γ t / R t e ) γ t + q [ W r / ( 2 R t e ) ] , q ( 1 , 1 )
where Wr is the range swath width. The variation of backscattering coefficient is ignored. RASR could be presented as follows.
R A S R = G e a _ A b m 2 / ( R s t _ A b m 4 sin θ i n _ A b m ) G e a 2 / ( R s t 4 sin θ i n )
where θin is the incidence angle.

4.3. DT-AASR

Considering Geo-SAR’s large coverage field of view, azimuth ambiguity points are distributed on a circle of equal squint range, as shown in Figure 11. Furthermore, it is necessary to calculate the azimuth Distributed Targets AASR (DT-AASR) for the staring mode due to the antenna pattern gain variety [26,32]. The total pulse number during the integration time is kp (kp = PRF × Tsar). Tsar is the integration time. Similar to (34) and (35), the elevation angle and azimuth angle of the azimuth distributed targets or corresponding azimuth ambiguity point can be expressed as follows.
{ ξ e ( k , m ) = arcsin { sin γ ( k ) cos [ θ d t 0 ( k ) + θ a m b ( m , k ) + θ B F P A ( k ) ] } ζ a ( k , m ) = arctan { tan γ ( k ) sin [ θ d t 0 ( k ) + θ a m b ( m , k ) + θ B F P A ( k ) ] }
where k is the pulse number (k ∈ (1, kp)). m ∈ (−M, M). When the parameter m equals to zero, it means target signal; otherwise, it is the azimuth ambiguity signal. γ(k)is the look angle of the distributed targets or the azimuth ambiguity points. Since they are distributed on a circle with an equal squint range, γ(k)is a fixed value (γ(k) = γt). θdt0(k) means the GSA. It is almost constant during the integration time, so it equals to θdt0 as expressed in (30). θBFPA(k) is almost constant during the integration time, so it could be written as θBFPA. θamb(m,k) represents the angle between the target or azimuth ambiguity point and beam center ground projection, and it can be presented as:
θ a m b ( m , k ) = arcsin { sin γ t sin [ arcsin ( λ ( f d c 0 + m P R F + B t a ) 2 V s ( k ) ) ] }
where Bta is the Doppler frequency offset of the azimuth distribution target and the corresponding ambiguity (Bta ∈ (−Ba/2, Ba/2)), subscript ta represents the azimuth distributed target, and Ba is the Doppler bandwidth. Vs(k) means the satellite velocity. It is almost constant during the integration time, so it equals to Vs, as expressed in (15). θamb(m,k) represents the signal angle when m equals to zero; otherwise, it is the azimuth ambiguity angle. Equation (40) could be rewritten as:
{ ξ e ( k , m ) = arcsin { sin γ t cos [ θ d t 0 + θ a m b ( m ) + θ B F P A ] } ζ a ( k , m ) = arctan { tan γ t sin [ θ d t 0 + θ a m b ( m ) + θ B F P A ] }
Finally, according to (31), (32), (33), (41), and (42), the DT-AASR for the Geo-SAR staring mode is expressed as follows.
A A S R t a = k = 1 k p m = ± 1 ± M G e a 2 [ ξ e ( k , m ) , ζ a ( k , m ) ] k = 1 m = 0 k p G e a 2 [ ξ e ( k , m ) , ζ a ( k , m ) ]

4.4. DT-CASR

Similar to (42), the elevation angle and azimuth angle of the azimuth distributed targets or corresponding cross-term ambiguity points can be expressed as follows.
{ ξ e ( k , m , n ) = arcsin { sin γ ( n ) cos [ θ d t 0 + θ a m b ( m ) + θ B F P A ] } ζ a ( k , m , n ) = arctan { tan γ ( n ) sin [ θ d t 0 + θ a m b ( m ) + θ B F P A ] }
where γ(n) is the look angle of the azimuth distributed targets or the corresponding cross-term ambiguity points on different circles, as shown in Figure 11. Finally, according to (31), (32), (33), (36), (37), (41), and (44), the DT-CASR for the Geo-SAR staring mode could be advanced as follows.
C A S R t a = k = 1 k p m = ± 1 ± M n = ± 1 ± N G e a 2 [ ξ e ( k , m , n ) , ζ a ( k , m , n ) ] / ( R s t _ A b m 4 sin θ i n _ A b m ) k = 1 m = 0 , n = 0 k p G e a 2 [ ξ e ( k , m , n ) , ζ a ( k , m , n ) ] / ( R s t 4 sin θ i n )

4.5. Simulation Results

The Geo-SAR staring mode ambiguity characteristics are analyzed in this section through simulation. The whole orbital ergodic has to be analyzed considering the time-varying property. One typical orbital position, a latitude of 23.4 degrees, is selected for analysis due to the limited length of the article. Furthermore, the effects of different attitude steering methods on ASR are compared. The simulation parameters are listed in Table 3.

4.5.1. RASR

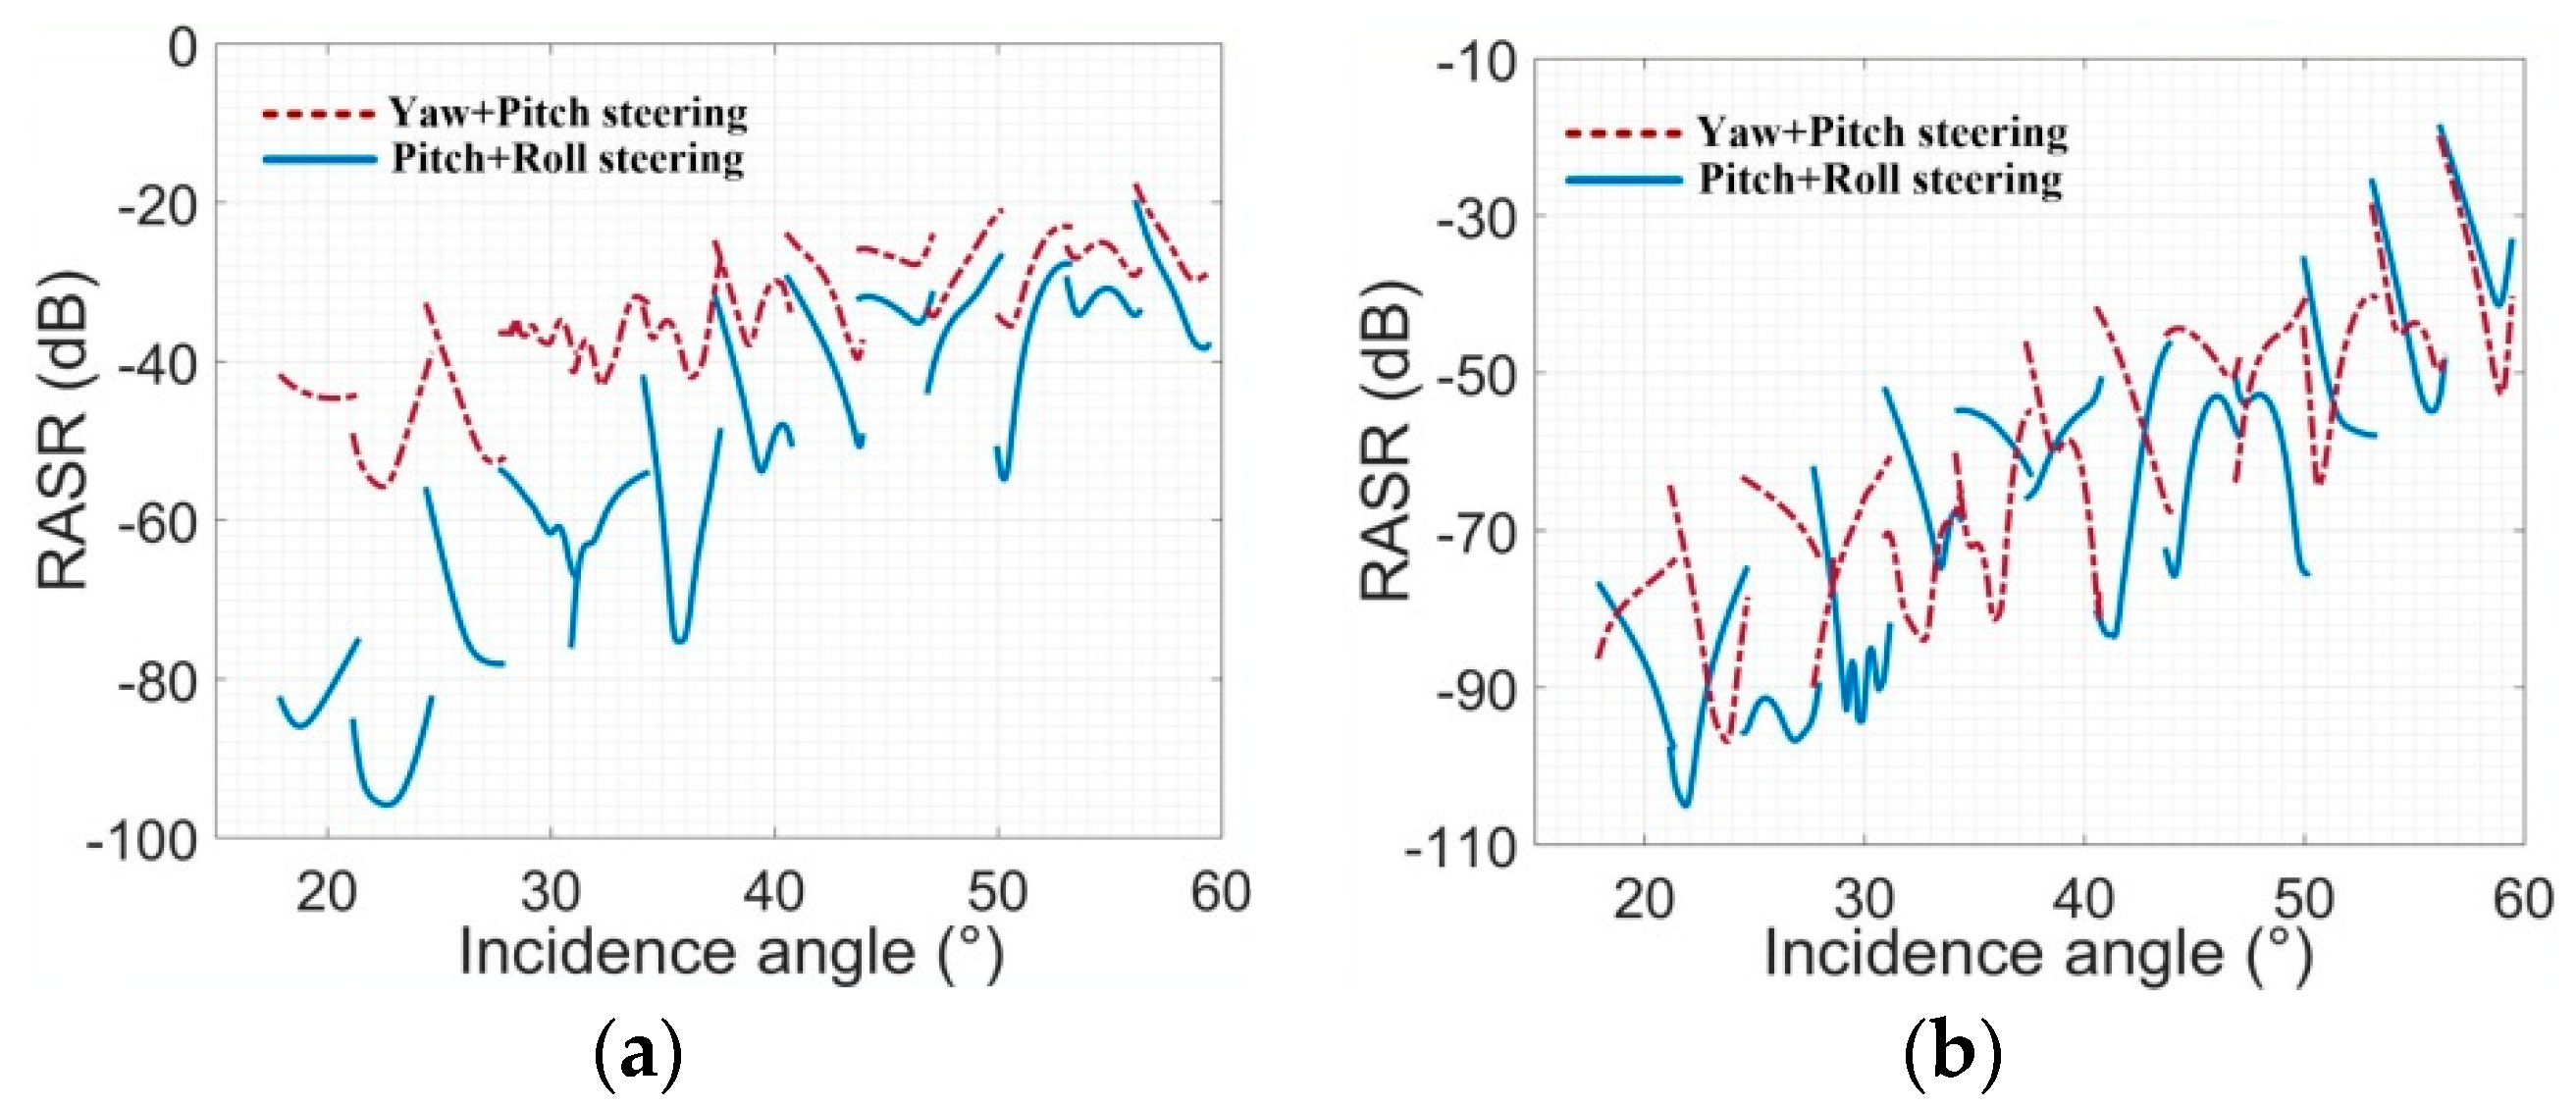
The RASR and latitude argument are not strongly related. Figure 13 simulates the RASR of thirteen beam positions in the incidence angle scale of (18°,60°). The broadside and squint condition are, respectively, depicted in Figure 13a,b. The simulation results based on 2D-PRSC are represented by a blue solid line, and those based on 2D-YS are represented by a red dotted line.
The simulation results in Figure 13 show the following:
In broadside condition, RASR in the 2D-PRSC condition is about 2–45 dB better than that in the 2D-YS condition. The smaller the incidence angle is, the greater the improvement. Due to BFPA, not all the antenna elevation pattern gain is in the range of the ambiguity region. So, the range ambiguity signal is weakened.
In the squint condition, the differences of RASR between the different attitude steering methods are not obvious. This is because that BFPA, which is about −72 degrees at a latitude argument of 23.4 degrees, counteracts most of the antenna elevation pattern gain variety caused by GSA.

4.5.2. DT-AASR

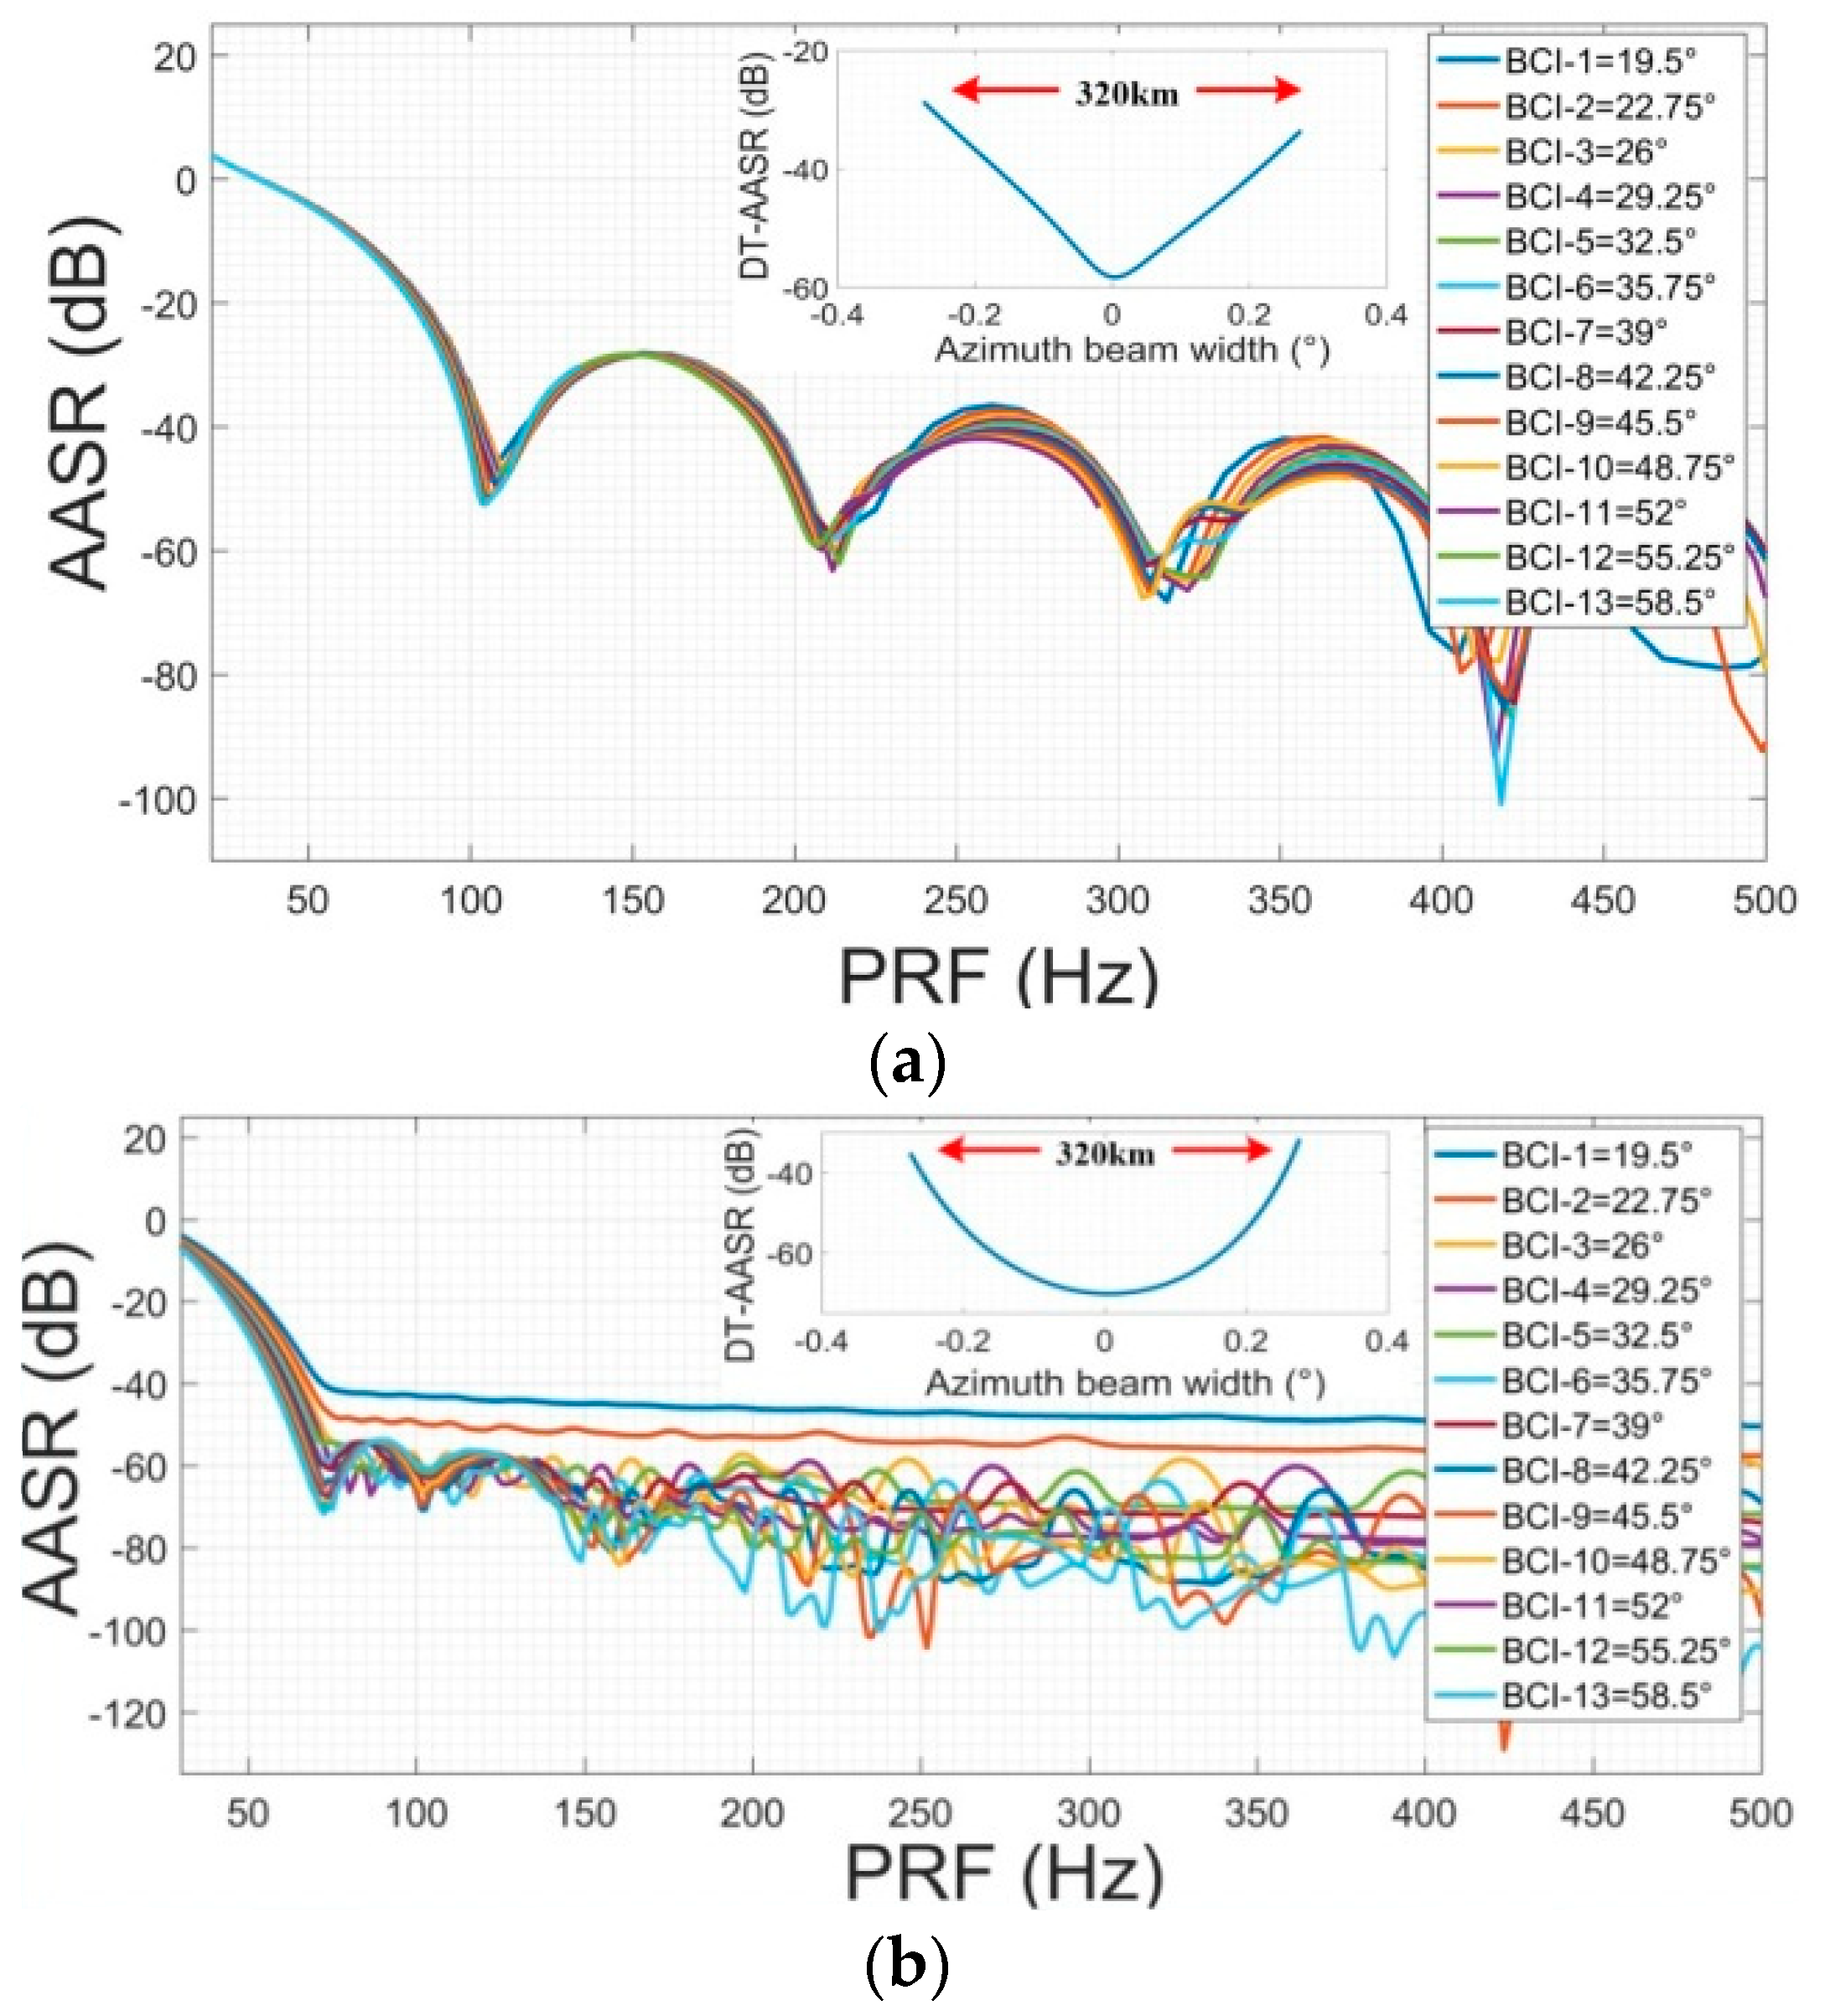
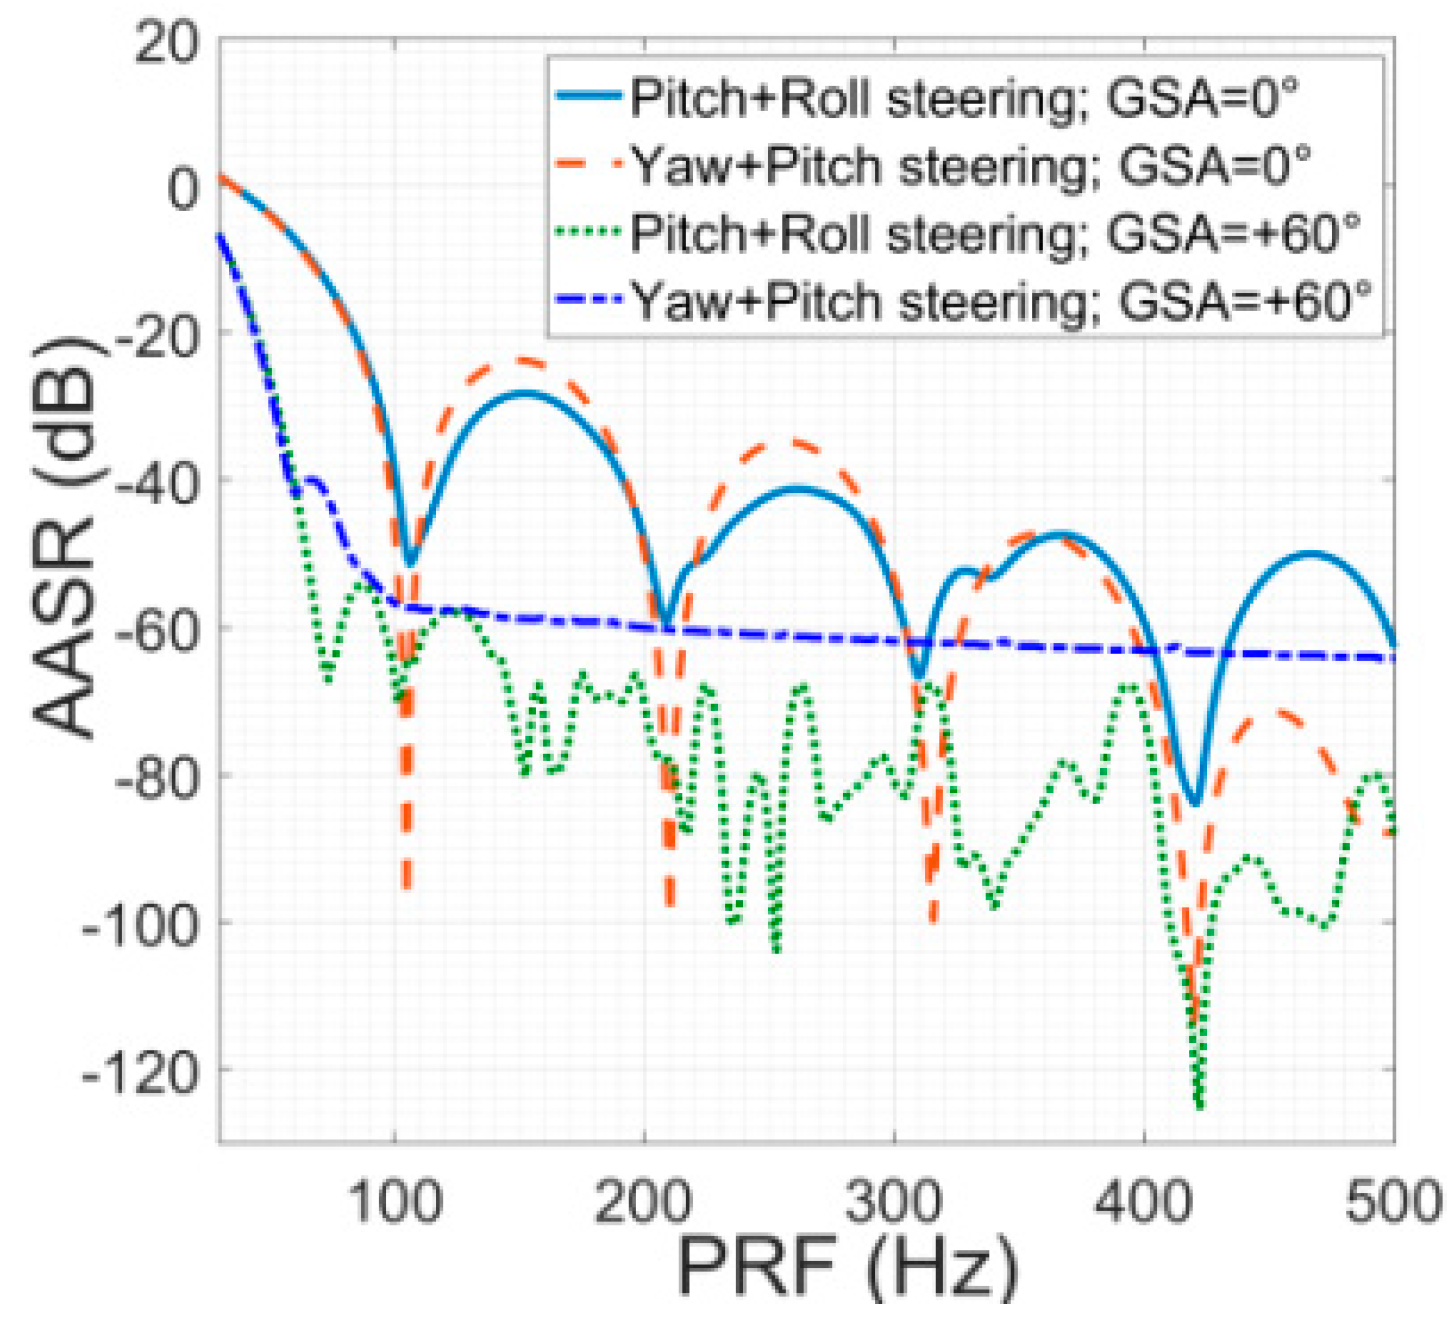
There isa strong correlation between the AASR and latitude argument. Figure 14 simulates that the scene center’s AASR varies with PRF for thirteen beam positions in the 2D-PRSC condition. Different linear colors indicate different beam center incidence (BCI) angles. The small image embedded in each figure shows the DT-AASR in the azimuth range of 320 km when the incidence angle equals 45.5 degrees.
Furthermore, the influences of different attitude steering methods on AASR are compared. We choose an incidence angle of 45.5 degrees for simulation. The results are depicted in Figure 15.
To facilitate comparison, the analysis conclusions of Figure 14 and Figure 15 will be illustrated in the next section.

4.5.3. DT-CASR

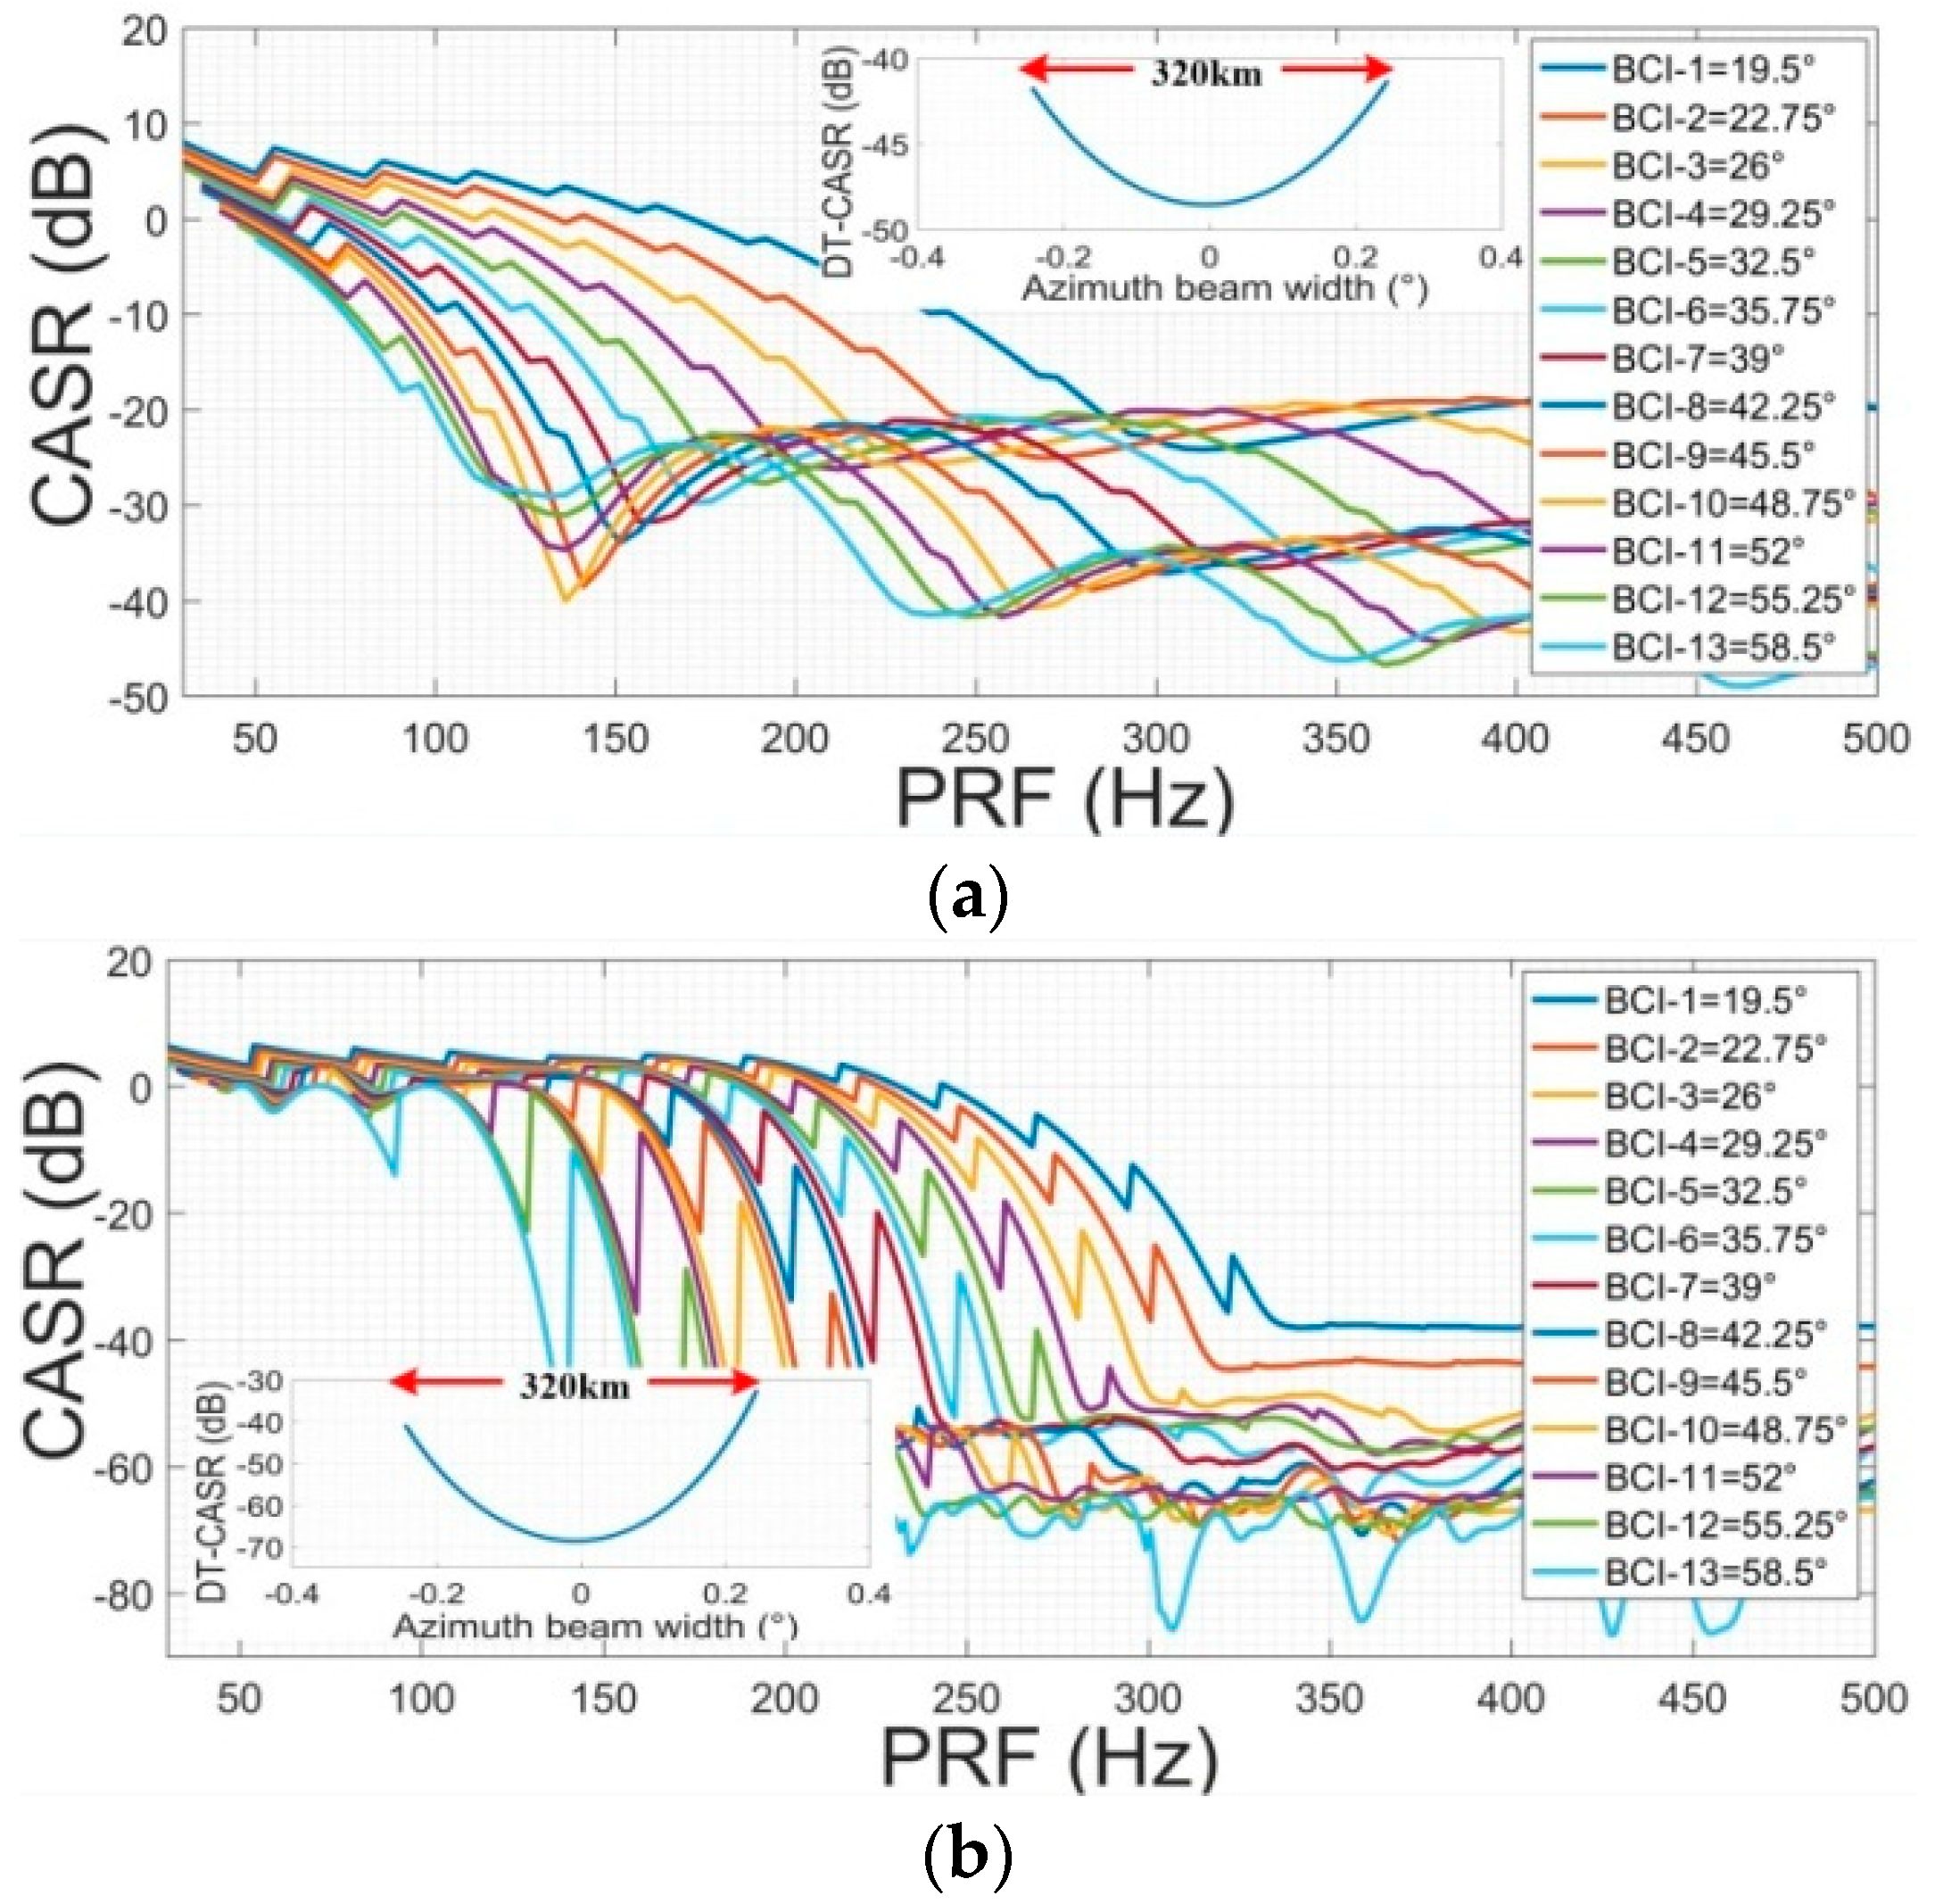
Similar to AASR, CASR is analyzed here. Figure 16 simulates that the scene center’s CASR varies with PRF for thirteen beam positions in the 2D-PRSC condition. Different linear colors indicate different BCI angles. The small image embedded in each figure shows the DT-CASR in the azimuth range of 320 km when the incidence angle equals 45.5 degrees.
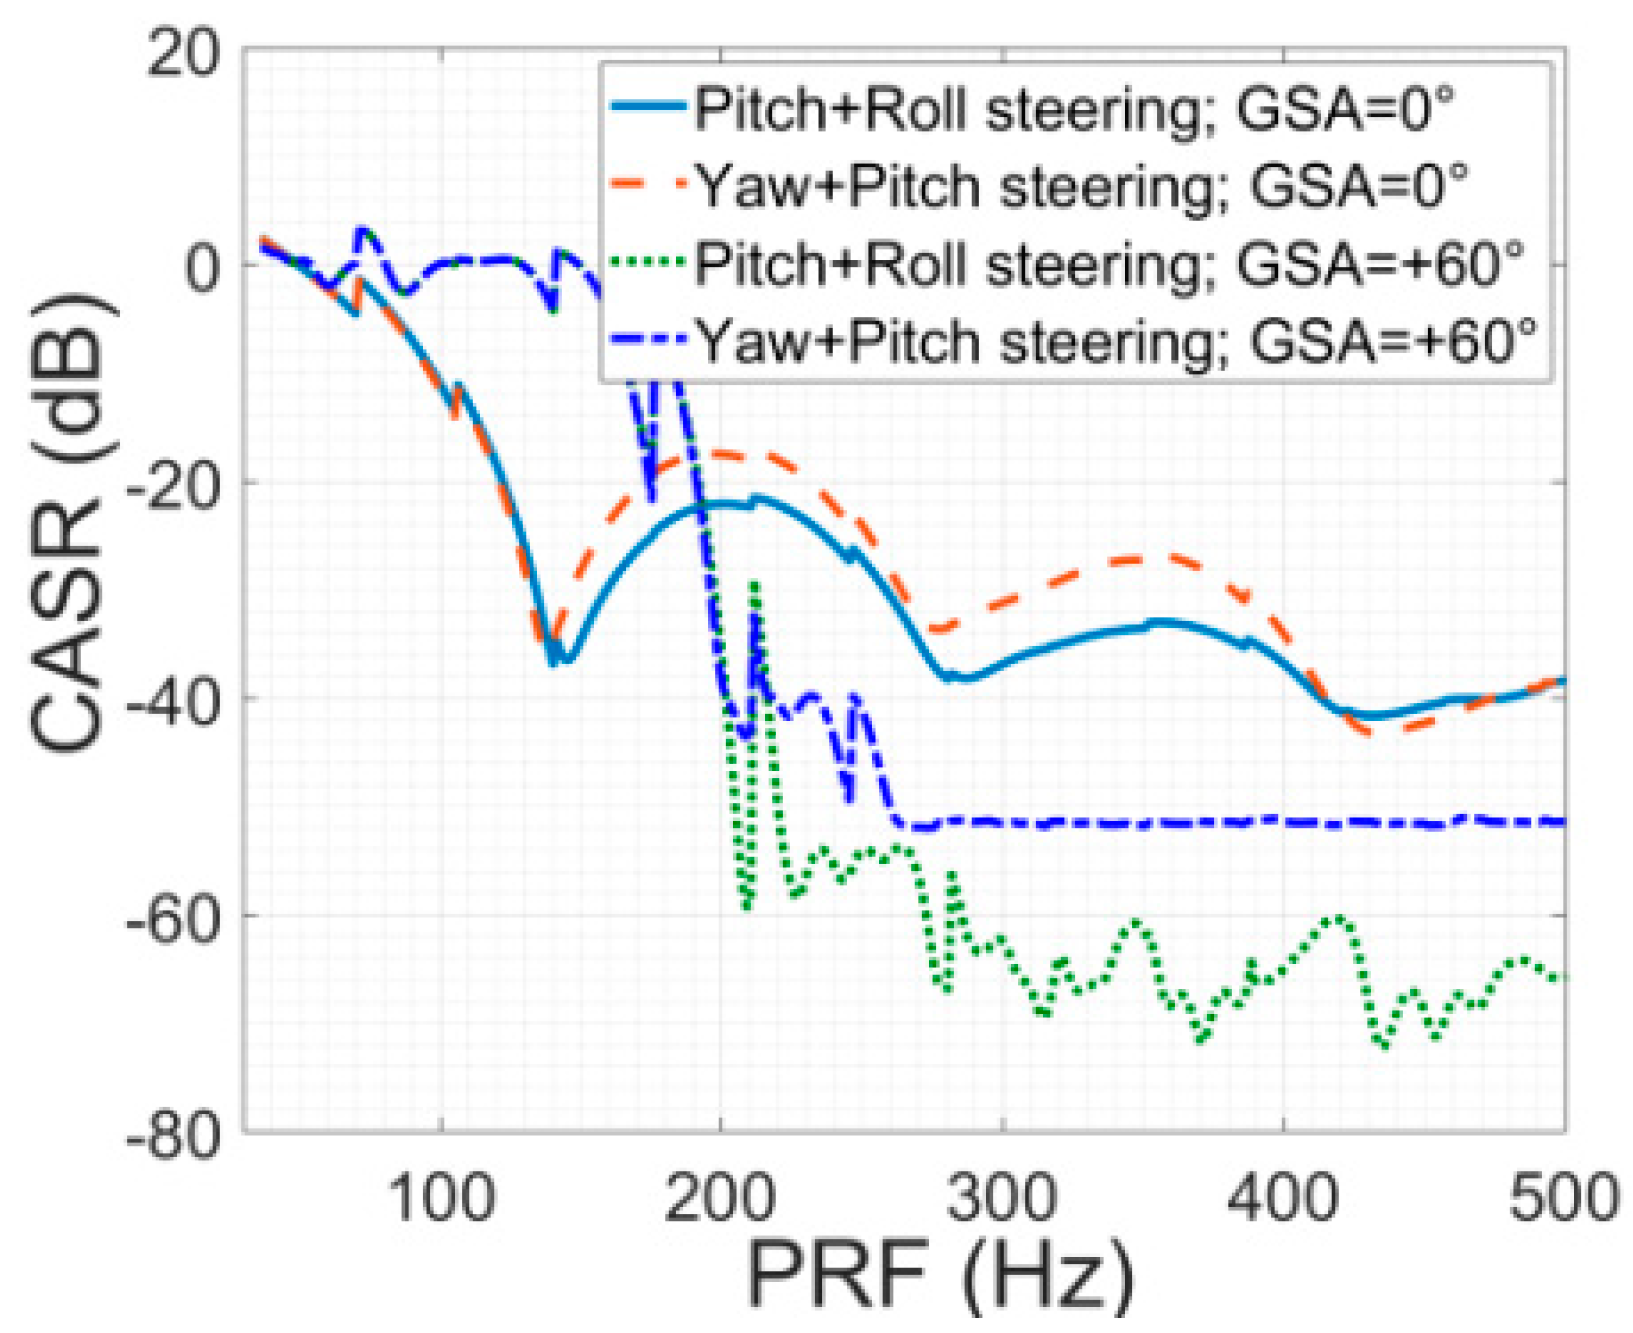
Furthermore, the influences of different attitude steering methods on CASR are compared. We choose an incidence angle of 45.5 degrees for simulation again. The results are depicted in Figure 17.
The simulation results in Figure 14, Figure 15, Figure 16 and Figure 17 show the following:
CASR has a comparable magnitude as AASR in the Geo-SAR condition, so it cannot be ignored. The constraints of RASR, AASR, and CASR should be considered simultaneously in the process of system designing.
Due to the strong time-varying property, different GSA and latitude argument both have obvious effects on AASR and CASR. Therefore, the GSA should be calculated according to the longitude and latitude of the expected imaging zone and satellite’s position. Furthermore, it is recommended to recalculate and update the system parameters for every five-degree change in latitude argument.
The DT-AASR and DT-CASR of the distributed targets in the azimuth range change significantly for the staring mode. In order to ensure that the DT-AASR and DT-CASR of all targets in the azimuth range of 320 km meet the requirement of −20 dB, it is necessary to select an appropriate PRF in the scale of (160, 430) Hz.
Different from RASR, the influence of different attitude steering methods on AASR and CASR is not obvious.

5. Conclusions

The staring mode properties and system parameters’ performance of Geo-SAR with reflector antenna are presented in this study. A new 2D-PRSC method for the fixed-pointing staring mode is firstly proposed. The satellite can continuously stare at any scene in the whole orbital period, and its maximum steering angle is about ±7.6 degrees. According to the simulation results of Beijing and Hong Kong, it can be inferred that about 10 h for any region of China could meet the Geo-SAR imaging requirement of 24 h. Furthermore, the staring mode model and Doppler history of Geo-SAR are analyzed and compared with those of Leo-SAR. For an L-band Geo-SAR satellite with 25 m × 25 m resolution, a circular antenna with a diameter of 25 m and peak radiation power no less than 20,000 W are required, and its worst NESZ will exceed −18.4 dB in the whole orbital period. Finally, the Geo-SAR’s ASR calculation formulas are proposed, and the differences between Geo-SAR and Leo-SAR are compared. Since CASR, AASR, and RASR of Geo-SAR are almost in comparable magnitude, all of them should be considered in the system designing process, and the whole orbit ergodicity analysis should be carried out. Furthermore, it is necessary to select an appropriate PRF in the scale of (160, 430) Hz for the staring mode to ensure that the DT-AASR and DT-CASR of all the targets in the azimuth range of 320 km meet the requirement of −20 dB.

Author Contributions

Conceptualization, B.Z. and Q.Z.; methodology, B.Z.; software, B.Z.; validation, Q.Z.; formal analysis, B.Z.; investigation, B.Z.; resources, B.Z.; data curation, B.Z.; writing—original draft preparation, B.Z.; writing—review and editing, B.Z. and Q.Z.; visualization, B.Z.; supervision, Q.Z.; project administration, Q.Z. All authors have read and agreed to the published version of the manuscript.

Funding

This research received no external funding.

Conflicts of Interest

The authors declare no conflict of interest.

References

  1. Tomiyasu, K. Synthetic aperture radar in geosynchronous orbit. In Proceedings of the Digest International IEEE Antennas Propagation Symposium, College Park, MD, USA, 15–19 May 1978; pp. 42–45. [Google Scholar]
  2. Tomiyasu, K.; Pacelli, J.L. Synthetic aperture radar imaging from an inclined geosynchronous orbit. IEEE Trans. Geosci. Remote Sens. 1983, GE-21, 324–329. [Google Scholar] [CrossRef]
  3. Long, T.; Hu, C.; Ding, Z.; Dong, X.; Tian, W.; Zeng, T. Geosynchronous SAR: System and Signal Processing; Springer: Singapore, 2018. [Google Scholar] [CrossRef]
  4. Matar, J.; Rodriguez-Cassola, M.; Krieger, G.; López-Dekker, P.; Moreira, A. MEO SAR: System concepts and analysis. IEEE Trans. Geosci. Remote Sens. 2019, 58, 1313–1324. [Google Scholar] [CrossRef] [Green Version]
  5. Hobbs, S.; Sanchez, J.P. Laplace plane and low inclination geosynchronous radar mission design. Sci. China Inf. Sci. 2017, 60, 060305. [Google Scholar] [CrossRef]
  6. Zhang, Y.; Xiong, W.; Dong, X.; Hu, C.; Sun, Y. GRFT-based moving ship target detection and imaging in geosynchronous SAR. Remote Sens. 2018, 10, 2002. [Google Scholar] [CrossRef] [Green Version]
  7. Global Earthquake Satellite System: A 20-Year Plan to Enable Earthquake Prediction; JPL Document: Pasadena, CA, USA, 2003.
  8. Zhou, B.; Qi, X.; Zhang, J.; Zhang, H. Effect of 6-DOF Oscillation of Ship Target on SAR Imaging. Remote Sens. 2021, 13, 1821. [Google Scholar] [CrossRef]
  9. Bingji, Z.; Qingun, Z.; Chao, D.; Weiping, S.; MingMing, X. Baseline designing and implementation approach for a Geo-SAR tomography system. J. Eng. 2019, 2019, 6235–6238. [Google Scholar] [CrossRef]
  10. Zhao, B.; Zhang, Q.; Dai, C.; Liu, L. Baseline Accuracy Analysis for Sub-Geosynchronous Orbital Tomo-SAR System. In Proceedings of the 2019 6th Asia-Pacific Conference on Synthetic Aperture Radar (APSAR), Xiamen, China, 26–29 November 2019; pp. 1–4. [Google Scholar]
  11. Prati, C.; Rocca, F.; Giancola, D.; Guarnieri, A.M. Passive geosynchronous SAR system reusing backscattered digital audio broadcasting signals. IEEE Trans. Geosci. Remote Sens. 1998, 36, 1973–1976. [Google Scholar] [CrossRef] [Green Version]
  12. Guarnieri, A.M.; Leanza, A.; Recchia, A.; Tebaldini, S.; Venuti, G. Atmospheric Phase Screen in GEO-SAR: Estimation and Compensation. IEEE Trans. Geosci. Remote Sens. 2017, 56, 1668–1679. [Google Scholar] [CrossRef]
  13. Chen, J.; Sun, G.-C.; Xing, M.; Yang, J.; Ni, C.; Zhu, Y.; Shu, W.; Liu, W. A Parameter Optimization Model for Geosynchronous SAR Sensor in Aspects of Signal Bandwidth and Integration Time. IEEE Geosci. Remote Sens. Lett. 2016, 13, 1374–1378. [Google Scholar] [CrossRef]
  14. Hobbs, S.; Mitchell, C.; Forte, B.; Holley, R.; Snapir, B.; Whittaker, P. System Design for Geosynchronous Synthetic Aperture Radar Missions. IEEE Trans. Geosci. Remote Sens. 2014, 52, 7750–7763. [Google Scholar] [CrossRef] [Green Version]
  15. Hu, C.; Long, T.; Liu, Z.; Zeng, T.; Tian, Y. An Improved Frequency Domain Focusing Method in Geosynchronous SAR. IEEE Trans. Geosci. Remote Sens. 2013, 52, 5514–5528. [Google Scholar] [CrossRef]
  16. Wang, R.; Hu, C.; Li, Y.; Hobbs, S.E.; Tian, W.; Dong, X.; Chen, L. Joint Amplitude-Phase Compensation for Ionospheric Scintillation in GEO SAR Imaging. IEEE Trans. Geosci. Remote Sens. 2017, 55, 3454–3465. [Google Scholar] [CrossRef]
  17. Zhang, T.; Ding, Z.; Tian, W.; Zeng, T.; Yin, W. A 2-D Nonlinear Chirp Scaling Algorithm for High Squint GEO SAR Imaging Based on Optimal Azimuth Polynomial Compensation. IEEE J. Sel. Top. Appl. Earth Obs. Remote Sens. 2017, 10, 5724–5735. [Google Scholar] [CrossRef]
  18. Rodon, J.R.; Broquetas, A.; Monti-Guarnieri, A.V.; Rocca, F. Geosynchronous SAR Focusing With Atmospheric Phase Screen Retrieval and Compensation. IEEE Trans. Geosci. Remote Sens. 2013, 51, 4397–4404. [Google Scholar] [CrossRef]
  19. Zheng, W.; Hu, J.; Zhang, W.; Yang, C.; Li, Z.; Zhu, J. Potential of geosynchronous SAR interferometric measurements in estimating three-dimensional surface displacements. Sci. China Inf. Sci. 2017, 60, 060304. [Google Scholar] [CrossRef]
  20. Recchia, A.; Monti-Guarnieri, A.V.; Broquetas, A.; Leanza, A. Impact of Scene Decorrelation on Geosynchronous SAR Data Focusing. IEEE Trans. Geosci. Remote Sens. 2015, 54, 1635–1646. [Google Scholar] [CrossRef] [Green Version]
  21. Cumming, I.G.; Wong, F.H. Digital Processing of Synthetic Aperture Radar Data: Algorithms and Implementation; Artech House: Boston, MA, USA, 2005; pp. 90–152. [Google Scholar]
  22. Davidson, G.W.; Cumming, I. Signal properties of spaceborne squint-mode SAR. IEEE Trans. Geosci. Remote Sens. 1997, 35, 611–617. [Google Scholar] [CrossRef] [Green Version]
  23. Li, G.; Fang, S.; Han, B.; Zhang, Z.; Hong, W.; Wu, Y. Compensation of Phase Errors for Spotlight SAR With Discrete Azimuth Beam Steering Based on Entropy Minimization. IEEE Geosci. Remote Sens. Lett. 2020, 18, 841–845. [Google Scholar] [CrossRef]
  24. Prats-Iraola, P.; Scheiber, R.; Mittermayer, J.; Meta, A.; Moreira, A. Processing of Sliding Spotlight and TOPS SAR Data Using Baseband Azimuth Scaling. IEEE Trans. Geosci. Remote Sens. 2009, 48, 770–780. [Google Scholar] [CrossRef] [Green Version]
  25. Meta, A.; Mittermayer, J.; Prats, P.; Scheiber, R.; Steinbrecher, U. TOPS imaging with TerraSAR-X: Mode design and performance analysis. IEEE Trans. Geosci. Remote Sens. 2009, 48, 759–769. [Google Scholar] [CrossRef] [Green Version]
  26. De Zan, F.; Guarnieri, A.M. TOPSAR: Terrain observation by progressive scans. IEEE Trans. Geosci. Remote Sens. 2006, 44, 2352–2360. [Google Scholar] [CrossRef]
  27. Sacco, P.; Battagliere, M.L.; Coletta, A. COSMO-SKYMED mission status: Results, lessons learnt and evolutions. In Proceedings of the 2015 IEEE International Geoscience and Remote Sensing Symposium (IGARSS), Milan, Italy, 26–31 July 2015; pp. 207–210. [Google Scholar]
  28. Pastina, D.; Turin, F. Exploitation of the COSMO-SkyMed SAR system for GMTI applications. IEEE J. Sel. Top. Appl. Earth Obs. Remote Sens. 2014, 8, 966–979. [Google Scholar] [CrossRef]
  29. Potin, P.; Rosich, B.; Miranda, N.; Grimont, P.; Shurmer, I.; O’Connell, A.; Krassenburg, M.; Gratadour, J.-B. Copernicus Sentinel-1 Constellation Mission Operations Status. In Proceedings of the IEEE International Geosciences and Remote Sensing Symposium, Yokohama, Japan, 28 July–2 August 2019; pp. 5385–5388. [Google Scholar] [CrossRef]
  30. Benedetti, A.; Picchiani, M.; Del Frate, F. Sentinel-1 and Sentinel-2 Data Fusion for Urban Change Detection. In Proceedings of the IGARSS 2018-2018 IEEE International Geoscience and Remote Sensing Symposium, Valencia, Spain, 22–27 July 2018; pp. 1962–1965. [Google Scholar] [CrossRef]
  31. Liang, D.; Zhang, H.; Fang, T.; Deng, Y.; Yu, W.; Zhang, L.; Fan, H. Processing of Very High Resolution GF-3 SAR Spotlight Data With Non-Start–Stop Model and Correction of Curved Orbit. IEEE J. Sel. Top. Appl. Earth Obs. Remote Sens. 2020, 13, 2112–2122. [Google Scholar] [CrossRef]
  32. Mittermayer, J.; Wollstadt, S.; Prats-Iraola, P.; Scheiber, R. The TerraSAR-X staring spotlight mode concept. IEEE Trans. Geosci. Remote Sens. 2013, 52, 3695–3706. [Google Scholar] [CrossRef]
  33. Kraus, T.; Bräutigam, B.; Grigorov, C.; Mittermayer, J.; Wollstadt, S. TerraSAR-X staring spotlight mode optimization. In Proceedings of the 2013 Asia-Pacific Conference on Synthetic Aperture Radar (APSAR), Tsukuba, Japan, 23–27 September 2013; pp. 16–19. [Google Scholar]
  34. Jordan, R.L. The Seasat-A synthetic aperture radar system. IEEE J. Ocean. Eng. 1980, 5, 154–164. [Google Scholar] [CrossRef]
  35. Raney, R.K. Doppler properties of radars in circular orbits. Int. J. Remote Sens. 1986, 7, 1153–1162. [Google Scholar] [CrossRef]
  36. Fiedler, H.; Boerner, E.; Mittermayer, J.; Krieger, G. Total zero Doppler steering-a new method for minimizing the Doppler centroid. IEEE Geosci. Remote Sens. Lett. 2005, 2, 141–145. [Google Scholar] [CrossRef]
  37. Ze, Y.; Yinqing, Z.; Jie, C.; Chunsheng, L. A new satellite attitude steering approach for zero Doppler centroid. In Proceedings of the IET International Radar Conference, Guilin, China, 20–22 April 2009; pp. 1–4. [Google Scholar]
  38. Zhang, J.; Yu, Z.E.; Xiao, P. A novel antenna beam steering strategy for GEO SAR staring observation. In Proceedings of the 2016 IEEE International Geoscience and Remote Sensing Symposium (IGARSS), Beijing, China, 10–15 July 2016; pp. 1106–1109. [Google Scholar]
  39. Long, T.; Dong, X.; Hu, C.; Zeng, T. A new method of zero-Doppler centroid control in GEO SAR. IEEE Geosci. Remote Sens. Lett. 2010, 8, 512–516. [Google Scholar] [CrossRef]
  40. Jiang, Y.; Hu, B.; Zhang, Y.; Lian, M.; Wang, Z. Study on Zero-Doppler Centroid Control for GEO SAR Ground Observation. Int. J. Antennas Propag. 2014, 2014, 549269. [Google Scholar] [CrossRef]
  41. Guarnieri, A.M. Adaptive removal of azimuth ambiguities in SAR images. IEEE Trans. Geosci. Remote Sens. 2005, 43, 625–633. [Google Scholar] [CrossRef]
  42. Li, F.K.; Johnson, W.T.K. Ambiguities in spacebornene synthetic aperture radar systems. IEEE Trans. Aerosp. Electron. Syst. 1983, 3, 389–397. [Google Scholar] [CrossRef]
  43. Villano, M.; Krieger, G.; Moreira, A. New insights into ambiguities in quad-pol SAR. IEEE Trans. Geosci. Remote Sens. 2017, 55, 3287–3308. [Google Scholar] [CrossRef]
  44. Huber, S.; de Almeida, F.Q.; Villano, M.; Younis, M.; Krieger, G.; Moreira, A. Tandem-L: A technical perspective on future spaceborne SAR sensors for Earth observation. IEEE Trans. Geosci. Remote Sens. 2018, 56, 4792–4807. [Google Scholar] [CrossRef] [Green Version]
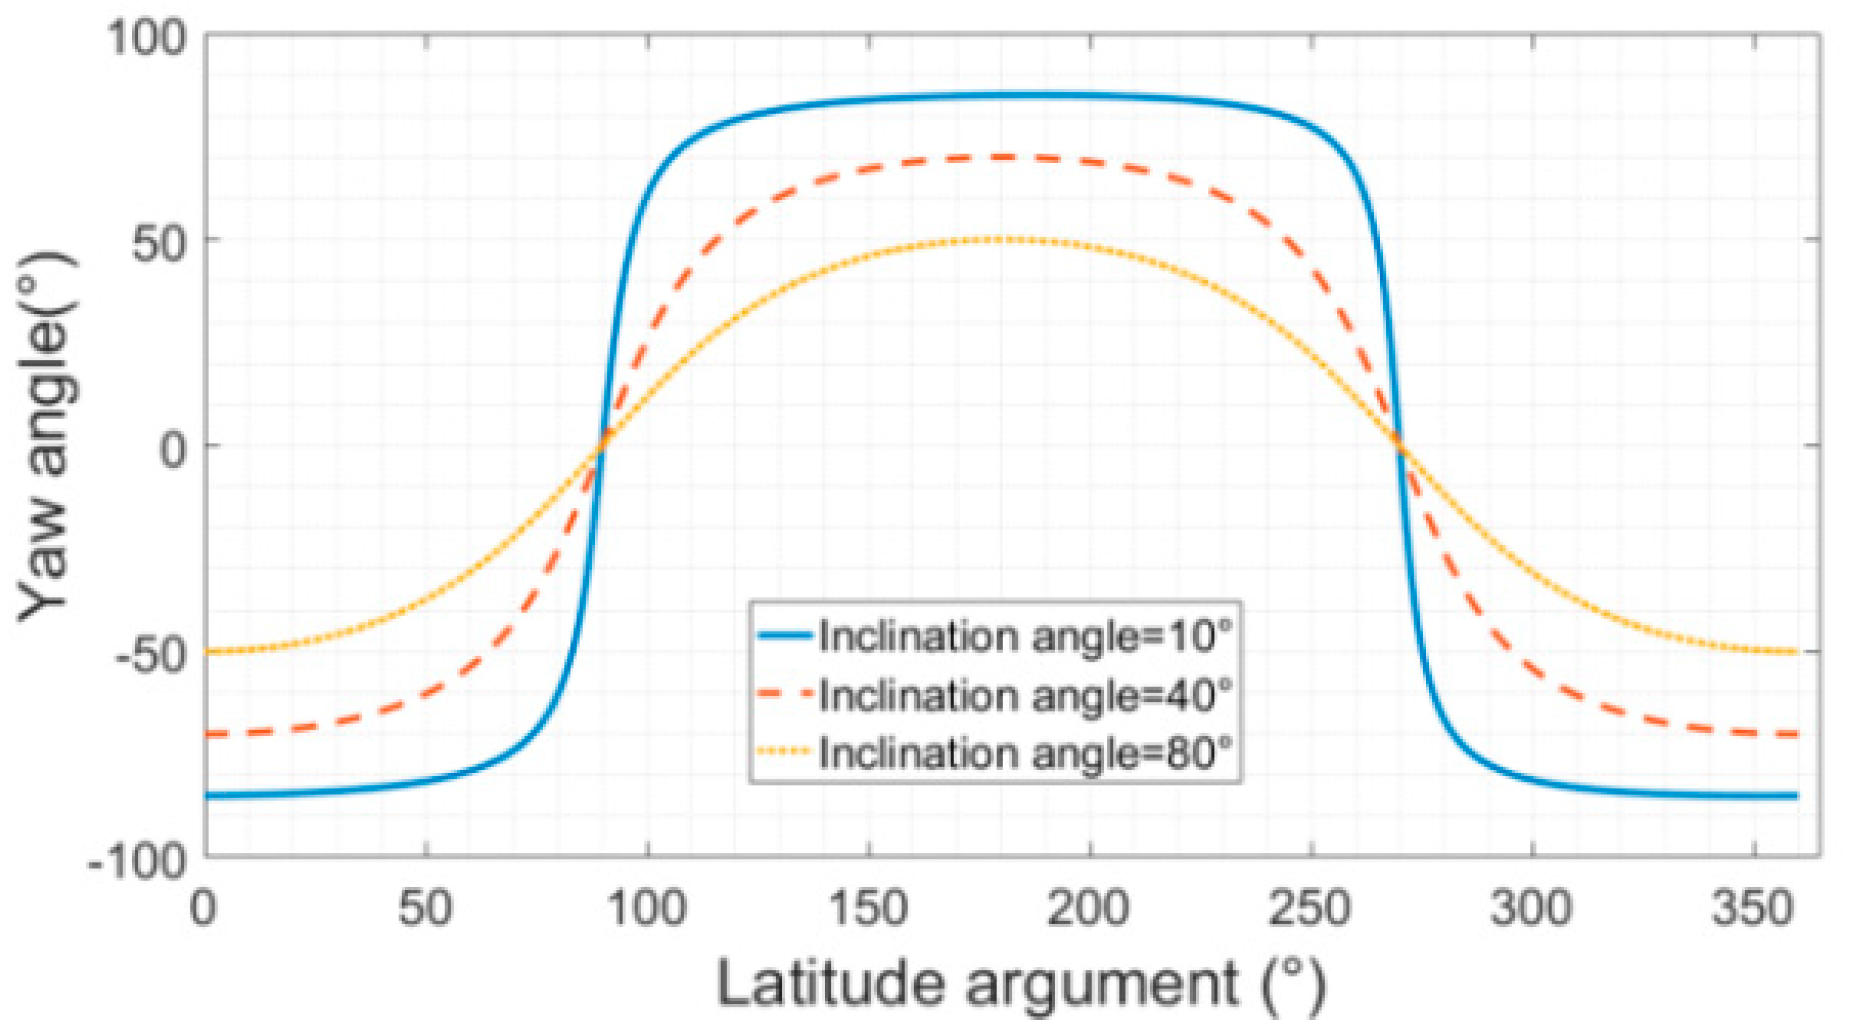
Figure 1. Geo-SAR yaw angles for three different orbital inclination angles.
Remotesensing 14 01609 g001
Figure 2. Yaw angle, and pitch angle of GF-3 and Geo-SAR in one orbital period. (a) GF-3 satellite. Its yaw angle, marked by a blue line, is less than ±3.9 degrees, and its pitch angle, marked by a dotted red line, is less than ±0.06 degrees. (b) Geo-SAR satellite. Its yaw angle, marked by a blue line, is less than ±76.1 degrees, and its pitch angle, marked by a dotted red line, is less than ±0.12 degrees.
Remotesensing 14 01609 g002
Figure 3. Squint angles (SA) comparison (IA = 45.5° and GSA = 60°). The solid blue line and dotted red line, respectively, represent Geo-SAR and GF-3. GF−3 SA in one orbit period is about 33.2 degrees, while that of Geo−SAR is about 5.3 degrees.
Remotesensing 14 01609 g003
Figure 4. Geo-SAR instantaneous field of view.
Remotesensing 14 01609 g004
Figure 5. Geometric model. (a) Spherical geometry model. (b) Plane solid geometry model.
Remotesensing 14 01609 g005
Figure 6. Geo-SAR staring mode spherical geometry model.
Remotesensing 14 01609 g006
Figure 7. The imageable track segment when Geo-SAR, respectively, stares at Beijing, and Hong Kong in the whole orbital period by using 2D-PRSC technology. (a) Beijing. (b) Hong Kong. The total imageable time in a whole orbital period of 24 h for staring at Beijing is about 9.3 h, and that for Hong Kong is about 10.4 h.
Remotesensing 14 01609 g007
Figure 8. Imaging mode geometrical model comparison. (a) Leo-SAR. (b) Geo-SAR.
Remotesensing 14 01609 g008
Figure 9. Staring mode Doppler history characteristics comparison between Geo-SAR and GF-3. (a) Doppler FM rate comparison between GF-3 and Geo-SAR. (b) P1(23.4°) and P2(75.7°) in nadir trace, and their positions comparison between GF-3 and Geo-SAR. (c) Doppler history, P1, GF-3. (d) Doppler history, P2, GF-3. (e) Doppler history, P1, Geo-SAR. (f) Doppler history, P2, Geo-SAR.
Remotesensing 14 01609 g009aRemotesensing 14 01609 g009b
Figure 10. NESZ in whole orbit period and all incidence angle range.
Remotesensing 14 01609 g010
Figure 11. Signal and ambiguity point distribution.
Remotesensing 14 01609 g011
Figure 12. BFPA comparison between GF-3 and Geo-SAR. The largest BPFA of GF-3 is about 3.9 degrees, and that of Geo-SAR is about −75 degrees.
Remotesensing 14 01609 g012
Figure 13. RASR of Geo-SAR at a latitude argument of 23.4°. (a) Broadside. (b) 60°squint.
Remotesensing 14 01609 g013
Figure 14. AASR and DT-AASR of Geo-SAR at a latitude argument of 23.4°. (a) Broadside, latitude argument of 23.4°. (b) 60° squint, latitude argument of 23.4°.
Remotesensing 14 01609 g014
Figure 15. AASR of Geo-SAR in different attitude steering method conditions at a latitude argument of 23.4°.
Remotesensing 14 01609 g015
Figure 16. CASR and DT-CASR of Geo-SAR at a latitude argument of 23.4°. (a) Broadside, latitude argument of 23.4°. (b) 60° squint, latitude argument of 23.4°.
Remotesensing 14 01609 g016
Figure 17. CASR of Geo-SAR in different attitude steering method conditions at a latitude argument of 23.4°.
Remotesensing 14 01609 g017
Table 1. Simulation parameters of GF-3 and Geo-SAR.
NameGF-3Geo-SAR
Semi-major axis (km)7126.442,163.5
Inclination angle (°)98.428
Eccentricity0.0010.001
Incidence angle (°)45.545.5
Argument of perigee (°)9090
Wave length (m)0.060.24
Earth modelWSG84WSG84
Table 2. Doppler history comparison between GF-3 and Geo-SAR.
NameGF-3Geo-SAR
Latitude argument (°)23.475.723.475.7
Azimuth resolution (m)112525
Integration time (s)0.570.58115.8311.2
Doppler bandwidth (Hz)1075.21043.546.1400.7
Table 3. Simulation parameters.
Parameter NameValueParameter NameValue
Semi-major axis (km)42,163.5Wave length (m)0.24
Argument of perigee (°)90Inclination (°)28
Range swath width (km)≥320Bandwidth (MHz)50
Incidence angle (°)(18, 60)Eccentricity0.001
Ground squint angle (°)0/60Earth modelWSG84
Azimuth resolution (m)25Antenna size (m)25
Ground range resolution (m)25Latitude argument (°)23.4
Publisher’s Note: MDPI stays neutral with regard to jurisdictional claims in published maps and institutional affiliations.