Abstract
The planetary boundary layer (PBL) is the part of the troposphere in which the soil’s influence is noticeable. It plays an important role in the fields of air pollution, meteorology, weather forecasting, and climate. Continuous observation of lidar makes obtaining the day–night PBL height (PBLH) with a high temporal resolution possible. A high-precision PBLH retrieval method is the key to achieving this goal. In this study, we propose a new method based on a bagged tree model to retrieve the PBLH from micro-lidar backscatter profiles. With the radiosonde measurements taken as the true reference, lidar features (the ten maximum slopes identified by the maximum gradient method) and four meteorological parameters (atmospheric pressure, temperature, relative humidity, and wind speed) serve as characteristic variables. The PBLH retrieval model is evaluated using a 10-fold cross-validation (CV) method and then compared with the four traditional methods (i.e., maximum gradient, maximum standard deviation, wavelet covariance, and the ideal profile method). The correlation coefficient (R) between the retrieved PBLHs and the radiosonde measurements is 0.89, which is much bigger than the R (0.2–0.48) from the four traditional methods. Moreover, the root mean square error and mean absolute error for the retrieved PBLH are 0.3 km and 0.2 km, respectively, which are lower than those of the four traditional methods (0.5~0.6 km for RMSE and 0.4–0.5 for MAE). Cases with different conditions show that this new method is almost undisturbed by cloud and suspended/thick aerosol layers. It can also be used to retrieve shallow PBL in cases in which using traditional methods would be difficult. Long-term analysis of averaged PBLHs retrieved by the proposed model from 2013 to 2016 shows that the hourly PBLH rises at sunrise and sets at sunset, and that the monthly PBLH in summer is higher than that in winter. The results suggest that the proposed method is better than the four traditional methods and available for use in conditions such as existing cloud layers and multiple-layers.
1. Introduction
The planetary boundary layer (PBL) is defined as the nearest atmospheric layer to the earth’s surface [1]. The height of PBL (PBLH) is the thickness of PBL, a key factor in determining the regional scale of environmental pollution, weather, climate, and air pollution models [2,3]. A diurnal variation in time and space for the PBLH is typically from several kilometers to hundreds of meters [4]. Day–night PBLH observations can monitor the pollutant change in real time and provide the PBLH for weather and climate forecasting. Previous studies show that the PBLH derived from a radiosonde has a high accuracy and is considered as the validation data for PBLHs derived from other instruments and models [5,6]. However, a radiosonde has a low temporal resolution approximately twice a day [7]. As an active sensor, light detection and ranging (LiDAR) can be applied to retrieve aerosol layers [8], wind fields [9], and leaf biochemical properties [10], amongst others. Continuous observation of aerosol lidar makes obtaining the day–night PBLH with a high temporal resolution possible [5,11].
PBL has a higher aerosol burden than that of the free atmosphere above it [12,13]. The backscatter signal has strong attenuation, and its height is the PBLH [14]. Many algorithms are used to retrieve the PBLH, such as the maximum gradient (MG) [15], maximum standard deviation (MSD) [16], wavelet covariance transformation (WCT) [17,18], and ideal profile fit (IPF) methods [14]. These algorithms are prone to error under complex conditions, such as the presence of clouds or noise. Several algorithms perform well in the daytime and are prone to error at night owing to the residual layer [19]. Machine learning is widely used in various fields with classification and regression functions. Some machine learning models are introduced to simulate the PBLH. Kumar, et al. [20] developed a tool to automatically identify different structures of PBL based on machine learning technology. Rieutord, et al. [21] used two machine learning algorithms (k-means and AdaBoost for PBL) to derive the PBLH based on the training sets made by human experts. These two algorithms perform well in general, but they still have limitations, such as misjudgments. Ye, et al. [22] used training data, which are radiance data from an emitted radiance interferometer, and the true values of PBLHs measured by radiosondes, which are then used by a support vector machine to derive the PBLH. This method reduces the influence of clouds on PBLH retrieval and proves the feasibility of machine learning. de Arruda Moreira, et al. [23] proposed gradient boosting regression trees to improve the estimation of the PBLH derived from a ceilometer. A non-supervision Mahalanobis transform K-near-means algorithm was proposed to estimate the PBLH, which can identify available PBL under the cloud and residual layer conditions [24]. However, multiple aerosol layers influence the estimation for the PBLH. Therefore, it is promising to explore a new method for PBLH estimation based on machine learning.
The accuracy of PBLH modeling in machine learning can be improved by exploring different parameters and models. The bagged tree (BT) algorithm of supervised machine learning is used to train a model for the retrieval of the PBLH. The input data are the first 10 maximum variances of the backscatter signal from the micro-pulse lidar (MPL) [25] and meteorological parameters from the surface meteorology systems (MET) [26] of the Atmospheric Radiation Measurement (ARM) facility, and the output data for the training set are PBLHs derived from the radiosonde [27] and are also used as the reference. The structure of this paper is as follows: The second section describes site and data. The third section details the methods of BT model, MG, WCT, MSD, WCT, and IPF. The fourth section analyzes the experimental results, and the fifth section summarizes the study.
2. Site and Data
2.1. Site
This study applied three kinds of data from the ARM: the backscatter signal profiles from the MPL, the meteorological parameters from the MET, and the PBLH derived from the radiosonde. Figure 1 shows the locations of the instruments. The red triangle indicates the sites of the MPL, the radiosonde, and the MET at Lamont, Oklahoma (Lat: 36.607322, Lon: −97.487643), the Southern Great Plains (SGP).
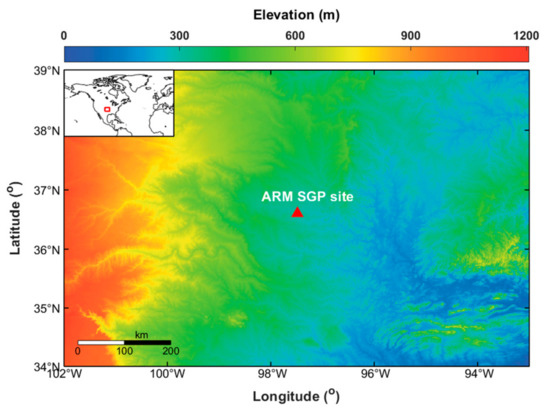
Figure 1.
Location of the SGP sites of the ARM facility.
2.2. Radiosonde
The ARM facility provided the PBLH value-added product from radiosonde profiles [28]. The variables from the radiosonde profiles contained the pressure, dry bulb temperature, relative humidity, wind speed, and wind direction, which were used as input data to retrieve PBLHs. In this study, PBLHs for the output training data were derived using the bulk Richardson number method [2] using a critical threshold of 0.25, specifically reported by Sivaraman, et al. [27].
2.3. MPL
MPL is an eye-safe lidar operating at 532 nm and an active ground-based automatic observation instrument. It works by sending short pulses of laser light and detecting and collecting light backscattered by atmospheric particles. The distance to the scatterer can be inferred from the time delay between transmitting and receiving the signal. The produced MPL contains the return signal in the co-pol and cross-pol channels [25]. The range resolution is 15 m, and the averaging temporal resolution is approximately 10 s.
2.4. Meteorology Measurements
The meteorological parameters from the MET of the ARM facility at the SGP site were used as input data for the training set. The variables atmospheric pressure, temperature, relative humidity, and wind speed were used in the study as the input data for the training set. The accuracy of pressure, temperature, RH, and wind speed measurements were 0.01 kPa, 0.01 °C, 0.1% RH, and 0.01 m/s, respectively. The measurement interval of atmospheric pressure was one minute, and those of the other variables were one-minute averages. The measurement levels of atmospheric pressure, temperature, relative humidity, and wind speed were are 1, 2, 2, and 10 m, respectively, and the resolutions were 0.01 kPa, 0.001 dec C, 0.1%, and 0.001 m/s, respectively [29].
3. Methods
3.1. Bagged Tree (BT)
BT is an ensemble of decision trees for either classification or regression. Many training sets were taken from the total training set, and each training set was used to create a separate prediction model. The prediction result is the average predictor for every decision tree, which reduces the variance. Studies show that integrating decision trees provides a higher accuracy than that of a single tree [30,31]. The BT model is defined as
By generating B different self-help training datasets, the prediction results (b = 1, 2, …, B) were obtained from the self-service training dataset. A clustering prediction was obtained by averaging B training results. The k-fold cross-validation (CV) randomly divided a dataset into k disjoint folds with roughly the same number of instances. Each fold, in turn, served as the test level, and other folds served as the model generated by the training dataset. The average of the correct rate of the k times results was used as an estimate of the accuracy of the algorithm. In this study, the number of decision trees (B) was 200, and the minimum leaf size was 5, k = 10.
Figure 2 displays the workflow for PBLH estimation. The key step is choosing the feature of the lidar profile. Specifically, the variance profile is calculated from the lidar signal, and the 10 maximum values of the variance profile work as a part of characteristic variables. The meteorological parameters, namely, atmospheric pressure, temperature, relative humidity, and wind speed, are the other part. The characteristic variables are also called test sets. The test set and the PBLH derived from the radiosonde form the training set, the size of which is 22,860. This step is flexible in order to select feature variables helpful in constructing the PBLH retrieval model for other lidar signals. The BT model used to retrieve the PBLH can be built and trained by the training dataset. Then, the output of the PBLH can be estimated by the trained BT model.
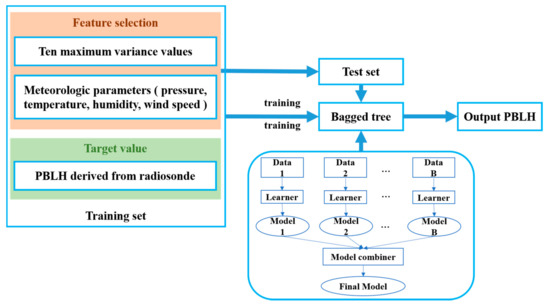
Figure 2.
Flowchart of BT to determine the PBLH by integrating the MPL lidar profiles and meteorological parameters.
3.2. Traditional Methods
3.2.1. Maximum Gradient (MG)
The gradient of the signal can be calculated by moving the window center according to the specified window size, which is defined as follows:
where is the backscatter signal of MPL, z is the height above the ground, and indicates the gradient of . The height of the greatest attenuation can be regarded as the PBLH.
3.2.2. Maximum Standard Deviation (MSD)
The signal standard deviation is defined as follows [32]:
where is the signal profile, z is the height above the ground, and refers to the standard deviation of . The height corresponds to the maximum can be regarded as PBLH.
3.2.3. Wavelet Covariance Transformation (WCT)
The WCT method is applied to estimate PBLH by detecting step changes in signals. The Haar wavelet function h is defined as follows [33]:
where z is the height above the ground, b is the center position of the h function, and a is the extension of the function. The covariance transform of the Haar function is defined as
where is the signal profile, and and are the lower and upper limits of , respectively. A local maximum in with a coherent scale of a, b is usually considered as the PBLH.
3.2.4. Ideal Profile Fit (IPF)
Steyn, et al. [14] presented the IPF method to estimate PBLH. The method has been widely used in PBLH detection. The function of an idealized backscatter profile is defined as
where B(z) is the idealized backscatter profile, Bm is the backscattering of the average of mixed layer backscatter, Bu is the average backscattering in the air directly above the mixed layer, is the mixed layer depth as well as the PBLH in this study, and s is related to the thickness of the entrainment layer. Four ideal backscattering profile parameters are determined by minimizing the root mean square deviation between B(z) and the original backscatter profile. The thickness of the entrainment zone is equal to 2.77 s, where s is the thickness of the layer in which the layered air and overlying air are mixed.
3.3. Evaluation Approaches
The sample-based 10-fold CV was utilized in this study to verify the PBLHs located by the proposed BT models. The sample-based CV, a widely used validation approach, involves randomly selecting 90% of the samples for modeling and using the remaining 10% for verification. All samples are guaranteed to be tested by repeating the process 10 times. The performance of the BT models was quantitatively evaluated using the following statistical metrics: linear regression equation (slope and intercept), correlation coefficient (R), root-mean-square error (RMSE), and mean absolute error (MAE).
4. Results and Discussion
In this section, the performance of the BT model was evaluated by the 10-fold CV. The PBLHs derived by the four traditional methods are given as a comparison to demonstrate the excellent ability of the BT model. The long-term PBLHs in the study station from 2013 to 2016 were statistically analyzed at the end.
4.1. Model Validation
Figure 3 shows the PBLHs derived from the BT model and measurements from the radiosonde. The x- and y-axes represent PBLHs from the radiosonde and the BT model, respectively. The color represents the sample distribution density of each PBLH. Blue represents the smaller density, and red represents the larger density. Figure 3a shows that after model training with the training set, the PBLHs of the training set were predicted and compared with the PBLHs of the corresponding radiosonde. The correlation coefficient (R), root mean square error (RMSE), and mean absolute error (MAE) are 0.97, 0.2 km, and 0.1 km, respectively, and they are highly consistent with the PBLHs of the radiosonde with low error. Figure 3b shows the results of the sample-based 10-fold CV. Compared with the radiosonde measurements, the high R of 0.89, low RMSE of 0.3 km, and MAE of 0.2 km indicate that the model has a strong generalization ability. The results based on the 10-fold CV method demonstrate the strong generalization ability of the proposed model.
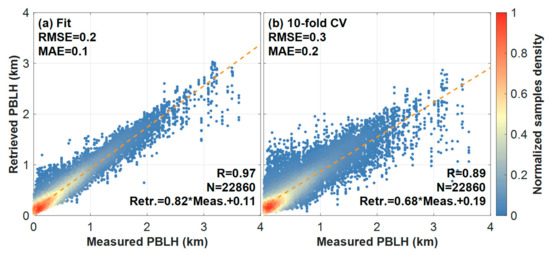
Figure 3.
(a) PBLHs derived from BT model directly and (b) processing 10-fold CV method compared with PBLHs derived from the radiosonde.
4.2. Comparison with Other Methods
MPL measurements from 2013 to 2016 were applied to retrieve the PBLH from the four traditional methods (MG, MSD, WCT, and IPF). Due to the weak anti-interference capability of these traditional methods, only the values with deviation for PBLHs between traditional methods and radiosonde less than 500 m are shown. Figure 4 shows the PBLHs derived from the MG, MSD, and WCT, and IPF methods compared with radiosonde measurements. The x-axis of Figure 4 expresses the PBLHs derived from the radiosonde, and the y-axis of Figure 4a–d express the PBLHs derived from the MG, MSD, WCT, and IPF. The chromaticity bar represents the sample size, and the redder the color, the greater the density. The R between the retrieval PBLHs and the radiosonde measurements shows that the BT model is superior to the other traditional methods (R: 0.48, 0.41, 0.48, and 0.20). Compared with the PBLH calculated by the four traditional methods, the PBLH retrieved from the BT model is more consistent with the radiosonde. The lower RMSE and MAE show that the BT model has a lower error rate than that of the traditional methods.
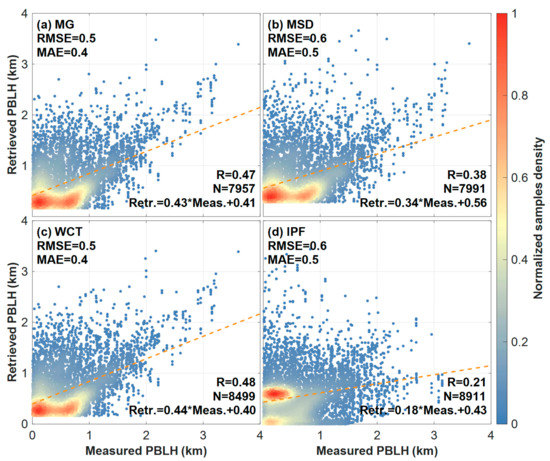
Figure 4.
PBLHs derived by (a) MG, (b) MSD, (c) WCT, and (d) IPF compared with radiosonde measurements.
Recently, PBLH algorithms have been greatly developed and improved by considering them in one and two dimensions. In one dimension, generally improving traditional methods with some constraints [19,34,35] allowed excellent results to be obtained in certain conditions. Liu, et al. [34] improved the threshold for signal to noise to estimate the PBLH from the radar wind profiler. This method was highly consistent with radiosonde measurements based on data from the summer of 2018 in Beijing, when the R was approximately 0.69. However, this method is unavailable in cloudy or dusty conditions and needs to change the threshold based on areas and seasons. Su, et al. [19] presented an algorithm to determine the PBLH by combining the traditional method and PBLH temporal variation, which can exclude the interference of the residual or multiple aerosol layers. Moreover, algorithms developed from two dimensions are similar with image processing [36,37]. Vivone, et al. [36] proposed an algorithm based on image processing techniques to continuously retrieve the PBLH and achieve better accuracy (about 30%) than that of the WCT method. However, this type of method depends on the correlation of adjacent lidar distance bins and requires continuous data not available for real-time estimates. In summary, the method proposed in this study had a better performance than that of other methods proposed in recent studies.
4.3. Case Analysis
In this section, four cases of PBLH estimation are analyzed to demonstrate the advantages of the BT model. Figure 5 and Figure 6 display the performances of the BT model under four conditions, namely, suspended aerosol layers (marked ‘A’), optical thick layers (marked ‘B’), shallow boundary layers (marked ‘C’), and impenetrable layers (marked ‘D’).
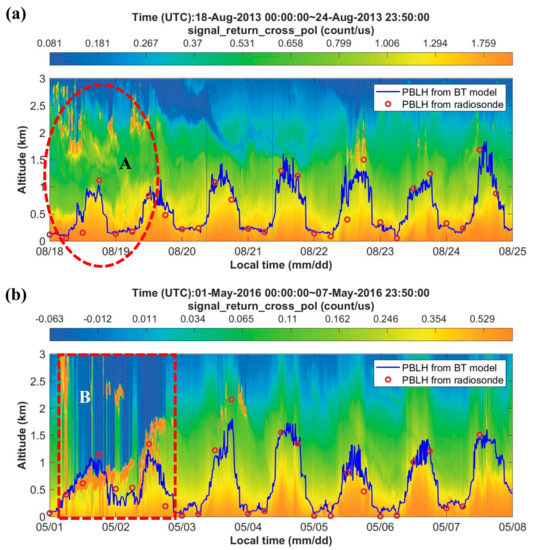
Figure 5.
MPL signal measured from (a) 18 August 2013 to 24 August 2013 and (b) 1 May 2016 to 7 May 2016; PBLHs were determined with the BT model (blue line) and radiosonde (red circles).
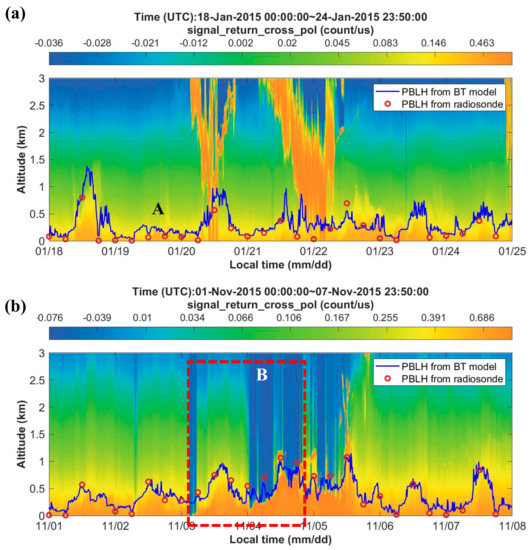
Figure 6.
MPL signal measured from (a) 18 January 2015 to 24 January 2015 and (b) 1 November 2015 to 7 November 2015; PBLHs were determined with the BT model (blue line) and radiosonde (red circles).
Figure 5 shows the data with suspended aerosol and optical thick layers from (a) 18 August to 24 August 2013 and (b) 1 May to 7 May 2016, respectively. The color bar represents the strength of the MPL signal, with orange indicating larger values. The blue line and red points indicate the PBLH derived from the BT model and the radiosonde, respectively. Overall, it is easy to notice the remarkable consistency between the PBLHs retrieved from the BT model and the radiosonde observations. Figure 5a,b display the suspended aerosol and optical thick layers in zones A and B, respectively. In general, many traditional methods, such as the MG, MSD, WCT, and IPF methods, are unavailable under the conditions in zones A and B [11]. Fortunately, the BT model is available for PBLH estimation for these two conditions.
Figure 6 shows the MPL measurements with shallow PBLs and impenetrable layers from (a) 18 January to 24 January 2015 and (b) 1 November to 7 November 2015, respectively. The color bar represents the strength of the MPL signal, with orange indicating larger values. The blue line and red points indicate the PBLH derived from the BT model and the radiosonde measurements, respectively. Similarly, the PBLH derived from the BT model is consistent with the radiosonde measurements. Estimating PBLHs is difficult using these traditional methods under the following two conditions: shallow PBLs in zone A of Figure 6a and impenetrable layers in zone B of Figure 6b. The BT model has an obvious ability to overcome interference from non-boundary layer signals.
4.4. Long-Term Analysis
Figure 7 shows the mean of PBLHs of different time periods from 2013 to 2016. The black and gray line indicates the mean of PBLHs and the standard deviation of PBLHs, and the color bar indicates that the MPL signals from blue to red correspond to the MPL signal strength from small to large. Figure 7a shows the variation in hourly PBLHs in a daily cycle. The PBLH begins to rise to about one kilometer from 7:00 a.m. to 12:00 a.m., and then it maintains a height of approximately 1 km from 12:00 a.m. to 6:00 p.m. From 7:00 p.m. to 9:00 p.m., the PBLH begins to drop to roughly 300 m, and then the PBLH stays at approximately 300 m from 10:00 p.m. to 7:00 a.m. The PBLH is generally lower at night and higher during the day, and an ascending phase at sunrise and a descending phase at sunset are shown. The standard deviation of the PBLH is higher in the daytime from 11:00 a.m. to 8:00 p.m. than in other periods. Figure 7b shows the variation in the monthly mean of PBLHs from 2013 to 2016. The PBLHs start to rise from January to June and go down from June to December. From the end of spring to the beginning of autumn (April to September), the PBLH is approximately 600 to 800 m, and in other months, it is approximately 400 to 500 m. That is, the PBLH in summer is higher than in winter, the PBLH in spring gradually increases, and the PBLH in autumn gradually decreases.
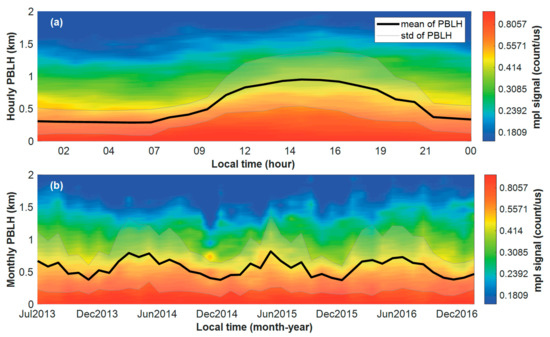
Figure 7.
(a) Hourly mean of PBLHs and (b) monthly mean of PBLHs from 2013 to 2016; the black line refers to the PBLHs; the black shaded areas indicate the standard deviation.
4.5. Uncertainty Analysis
The excellent performance of the BT model in retrieving the PBLH is obtained using the CV method in case analysis in different conditions. However, some deviations still exist in PBLH calculations conducted by the BT model. The causes of deviations are very complex, involving external inadequacy of environment (feature) variables and internal inconsistency of lidar-captured aerosol layers with the PBL. For the first reason, better feature variables are sought from the lidar signal by considering the corresponding relationship between the aerosol layers and PBLs. The heights of 10 maximum standard deviations of the MPL signal could include both the boundary layer and other layers, such as a cloud layer, elevated aerosol layer, and noise that could reduce the performance of the model in retrieving the PBLH. Figure 7a displays the case with the top of the aerosol layer being inconsistent with the radiosonde PBLH in zone A. The radiosonde PBLHs are lower than those from the BT model. The results should be higher if the top of the aerosol layer is the position of the PBLH. It is very difficult to judge which results are correct.
Moreover, the changes in the aerosol layer (the black dotted line) may be delayed with the change in the true boundary layer, as shown in zones B1, B2, and B3 of Figure 8b. That is, consistency between the PBLH and the top of the aerosol layer does not always exist. The boundary layer can change rapidly, but the aerosol layer changes slowly. To some extent, we suspect that this synchronicity also affects the performance of the traditional methods and raises the inconsistency between the PBLHs derived from the traditional methods and the radiosonde measurements. This delay mechanism is uncertain and needs further analysis. Unlike these traditional methods, the BT model is not only based on a MPL signal but also incorporates meteorological parameters, which are not easily affected by aerosol delay effects. Therefore, PBLHs derived from the BT model are more consistent with the radiosonde measurements.
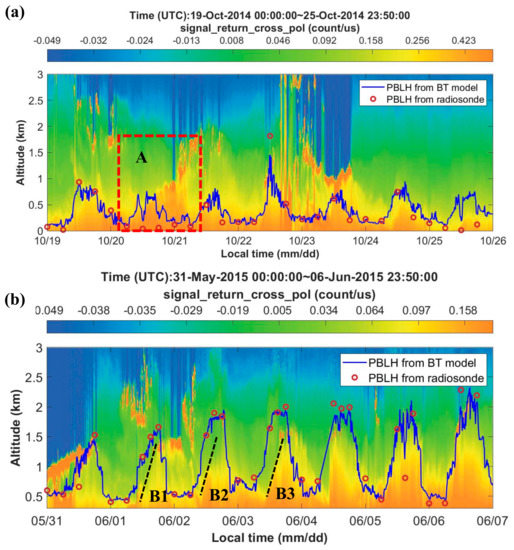
Figure 8.
MPL signal measured from (a) 19 October 2014 to 25 October 2014 and (b) 31 May 2015 to 6 June 2015; PBLHs were determined with the BT model (blue line) and radiosonde (red circles).
5. Conclusions
In this study, a new method was proposed to estimate the long-term PBLHs by choosing the ten maximum values based on the MSD from the lidar profile and four meteorological parameters. The PBLH retrieval method was created by using the BT model and then validated by using a sample-based 10-fold CV. The high correlation of 0.89, low RMSE of 0.3 km, and MAE of 0.2 km from the three CV methods demonstrated the outstanding generalization ability of the proposed model. The PBLHs derived using the BT model were then compared with the PBLH from the four traditional methods and other studies. The proposed method was better than the four traditional methods, and, being almost undisturbed by both suspended aerosol layers and optical thick layers, it can also be used in conditions for shallow boundary layers and impenetrable layers. Finally, the long-term analysis of PBLHs displayed the diurnal and seasonal changes in PBLHs. The PBLH rises at sunrise and sets at sunset, and the monthly PBLH in summer is higher than that in winter.
This paper proposed a new method for retrieving PBLH based on machine learning with high accuracy, and it is superior to the four traditional methods and is helpful in providing real-time and high-quality PBLH observations. However, there are still deviations caused by inadequacy of environment (feature) variables and inconsistency of lidar-captured aerosol layers with boundary layers. Future work will concentrate on reducing the uncertainty caused by the two aforementioned issues to improve the performance of the method.
Author Contributions
Conceptualization, W.W. and H.F.; methodology, W.W. and Y.P.; software, Y.P.; validation, W.W. and Y.P.; formal analysis, Y.P.; investigation, Y.P.; writing—original draft preparation, W.W. and Y.P.; writing—review and editing, W.W., Y.P. and H.F.; visualization, W.W. and Y.P.; supervision, H.F. and B.C.; project administration, H.F. and B.C.; funding acquisition, W.W. and B.C. All authors have read and agreed to the published version of the manuscript.
Funding
This study was supported by the National Natural Science Foundation of China (41901295 and 41904032), the theory and application of resource and environment management in the digital economy era (72088101), the Natural Science Foundation of Hunan Province, China (2020JJ5708), and the Key Program of the National Natural Science Foundation of China (41930108).
Institutional Review Board Statement
Not applicable.
Informed Consent Statement
Not applicable.
Data Availability Statement
Data used in this study can be found in the data discovery of ARM (https://adc.arm.gov/discovery/, data set accessed on 19 January 2022).
Acknowledgments
We are grateful to those who contributed to this work.
Conflicts of Interest
The authors declare no conflict of interest.
References
- Stull, R.B. An Introduction to Boundary Layer Meteorology; Springer: Dordrecht, The Netherland, 1988; Volume 13. [Google Scholar]
- Seibert, P.; Beyrich, F.; Gryning, S.-E.; Joffre, S.; Rasmussen, A.; Tercier, P. Review and intercomparison of operational methods for the determination of the mixing height. Atmos. Environ. 2000, 34, 1001–1027. [Google Scholar] [CrossRef]
- Wang, W.; He, J.; Miao, Z.; Du, L. Space–Time Linear Mixed-Effects (STLME) model for mapping hourly fine particulate loadings in the Beijing–Tianjin–Hebei region, China. J. Clean. Prod. 2021, 292, 125993. [Google Scholar] [CrossRef]
- Wang, W.; Mao, F.; Gong, W.; Pan, Z.; Du, L. Evaluating the Governing Factors of Variability in Nocturnal Boundary Layer Height Based on Elastic Lidar in Wuhan. Int. J. Environ. Res. Public Health 2016, 13, 1071. [Google Scholar] [CrossRef] [Green Version]
- Wang, F.; Yang, T.; Wang, Z.; Chen, X.; Wang, H.; Guo, J. A comprehensive evaluation of planetary boundary layer height retrieval techniques using lidar data under different pollution scenarios. Atmos. Res. 2021, 253, 105483. [Google Scholar] [CrossRef]
- Liu, S.; Liang, X.-Z. Observed Diurnal Cycle Climatology of Planetary Boundary Layer Height. J. Clim. 2010, 23, 5790–5809. [Google Scholar] [CrossRef]
- Seidel, D.J.; Ao, C.O.; Li, K. Estimating climatological planetary boundary layer heights from radiosonde observations: Comparison of methods and uncertainty analysis. J. Geophys. Res. Earth Surf. 2010, 115, D16113. [Google Scholar] [CrossRef] [Green Version]
- Shi, T.; Han, G.; Ma, X.; Gong, W.; Chen, W.; Liu, J.; Zhang, X.; Pei, Z.; Gou, H.; Bu, L. Quantifying CO2 uptakes over oceans using LIDAR: A tentative experiment in Bohai bay. Geophys. Res. Lett. 2021, 48, e2020GL091160. [Google Scholar] [CrossRef]
- Guo, J.; Liu, B.; Gong, W.; Shi, L.; Zhang, Y.; Ma, Y.; Zhang, J.; Chen, T.; Bai, K.; Stoffelen, A. First comparison of wind observations from ESA’s satellite mission Aeolus and ground-based radar wind profiler network of China. Atmos. Chem. Phys. 2021, 21, 2945–2958. [Google Scholar] [CrossRef]
- Yang, J.; Yang, S.; Zhang, Y.; Shi, S.; Du, L. Improving characteristic band selection in leaf biochemical property estimation considering interrelations among biochemical parameters based on the PROSPECT-D model. Opt. Express 2021, 29, 400–414. [Google Scholar] [CrossRef]
- Du, L.; Pan, Y.; Wang, W. Random Sample Fitting Method to Determine the Planetary Boundary Layer Height Using Satellite-Based Lidar Backscatter Profiles. Remote Sens. 2020, 12, 4006. [Google Scholar] [CrossRef]
- Liu, B.; Ma, X.; Ma, Y.; Li, H.; Jin, S.; Fan, R.; Gong, W. The relationship between atmospheric boundary layer and temperature inversion layer and their aerosol capture capabilities. Atmos. Res. 2022, 271, 106121. [Google Scholar] [CrossRef]
- Xu, W.; Wang, W.; Wang, N.; Chen, B. A New Algorithm for Himawari-8 Aerosol Optical Depth Retrieval by Integrating Regional PM2.5 Concentrations. IEEE Trans. Geosci. Remote Sens. 2022, 1. [Google Scholar] [CrossRef]
- Steyn, D.G.; Baldi, M.; Hoff, R.M. The Detection of Mixed Layer Depth and Entrainment Zone Thickness from Lidar Backscatter Profiles. J. Atmos. Ocean. Technol. 1999, 16, 953–959. [Google Scholar] [CrossRef]
- Menut, L.; Flamant, C.; Pelon, J.; Flamant, P.H. Urban boundary-layer height determination from lidar measurements over the paris area. Appl. Opt. 1999, 38, 945–954. [Google Scholar] [CrossRef] [PubMed]
- Yin, J.; Gao, C.Y.; Hong, J.; Gao, Z.; Li, Y.; Li, X.; Fan, S.; Zhu, B. Surface Meteorological Conditions and Boundary Layer Height Variations During an Air Pollution Episode in Nanjing, China. J. Geophys. Res. Atmos. 2019, 124, 3350–3364. [Google Scholar] [CrossRef]
- Brooks, I.M. Finding Boundary Layer Top: Application of a Wavelet Covariance Transform to Lidar Backscatter Profiles. J. Atmos. Ocean. Technol. 2003, 20, 1092–1105. [Google Scholar] [CrossRef] [Green Version]
- Baars, H.; Ansmann, A.; Engelmann, R.; Althausen, D. Continuous monitoring of the boundary-layer top with lidar. Atmos. Chem. Phys. 2008, 8, 7281–7296. [Google Scholar] [CrossRef] [Green Version]
- Su, T.; Li, Z.; Kahn, R. A new method to retrieve the diurnal variability of planetary boundary layer height from lidar under different thermodynamic stability conditions. Remote Sens. Environ. 2020, 237, 111519. [Google Scholar] [CrossRef]
- Kumar, N.; Soni, K.; Agarwal, R. A comprehensive study of different feature selection methods and machine-learning techniques for SODAR structure classification. Modeling Earth Syst. Environ. 2021, 7, 209–220. [Google Scholar] [CrossRef]
- Rieutord, T.; Aubert, S.; Machado, T. Deriving boundary layer height from aerosol lidar using machine learning: KABL and ADABL algorithms. Atmos. Meas. Tech. 2021, 14, 4335–4353. [Google Scholar] [CrossRef]
- Ye, J.; Liu, L.; Wang, Q.; Hu, S.; Li, S. A Novel Machine Learning Algorithm for Planetary Boundary Layer Height Estimation Using AERI Measurement Data. IEEE Geosci. Remote Sens. Lett. 2021, 19, 1–5. [Google Scholar] [CrossRef]
- de Arruda Moreira, G.; Sánchez-Hernández, G.; Guerrero-Rascado, J.L.; Cazorla, A.; Alados-Arboledas, L. Estimating the urban atmospheric boundary layer height from remote sensing applying machine learning techniques. Atmos. Res. 2022, 266, 105962. [Google Scholar] [CrossRef]
- Liu, Z.; Chang, J.; Li, H.; Chen, S.; Dai, T. Estimating Boundary Layer Height from LiDAR Data under Complex Atmospheric Conditions Using Machine Learning. Remote Sens. 2022, 14, 418. [Google Scholar] [CrossRef]
- Muradyan, P.; Coulter, R. Micropulse Lidar (MPL) Handbook; PNNL: Richland, WA, USA, 2020. [Google Scholar]
- Ritsche, M. ARM Surface Meteorology Systems Instrument Handbook; PNNL: Richland, WA, USA, 2011. [Google Scholar]
- Sivaraman, C.; McFarlane1, S.; Chapman, E.; Sivaraman, C.; McFarlane1, S.; Chapman, E.; Liu, S.; Fischer, M. Planetary Boundary Layer (PBL) Height Value Added Product (VAP): Radiosonde Retrievals; US Department of Energy: Washington, DC, USA, 2013. [Google Scholar]
- Holdridge, D.; Ritsche, M.; Prell, J.; Coulter, R. Balloon-Borne Sounding System (SONDE) Handbook; US Department of Energy: Washington, DC, USA, 2011. [Google Scholar]
- Holdridge, D. Balloon-Borne Sounding System (SONDE) Instrument Handbook; Atmospheric Radiation Measurement User Facility, Pacific Northwest National Laboratory: Richland, WA, USA, 2020. [Google Scholar]
- Pan, W. Shrinking classification trees for bootstrap aggregation. Pattern Recognit. Lett. 1999, 20, 961–965. [Google Scholar] [CrossRef]
- Ma, L.; Sun, B.; Li, Z. Bagging Likelihood-Based Belief Decision Trees. In Proceedings of the 2017 20th International Conference on Information Fusion (FUSION), Xi’an, China, 10–13 July 2017. [Google Scholar]
- Su, T.; Li, J.; Li, C.; Xiang, P.; Lau, A.K.-H.; Guo, J.; Yang, D.; Miao, Y. An intercomparison of long-term planetary boundary layer heights retrieved from CALIPSO, ground-based lidar, and radiosonde measurements over Hong Kong. J. Geophys. Res. Atmos. 2017, 122, 3929–3943. [Google Scholar] [CrossRef]
- Compton, J.C.; Delgado, R.; Berkoff, T.A.; Hoff, R.M. Determination of Planetary Boundary Layer Height on Short Spatial and Temporal Scales: A Demonstration of the Covariance Wavelet Transform in Ground-Based Wind Profiler and Lidar Measurements. J. Atmos. Ocean. Technol. 2013, 30, 1566–1575. [Google Scholar] [CrossRef]
- Liu, B.; Ma, Y.; Guo, J.; Gong, W.; Zhang, Y.; Mao, F.; Li, J.; Guo, X.; Shi, Y. Boundary Layer Heights as Derived From Ground-Based Radar Wind Profiler in Beijing. IEEE Trans. Geosci. Remote Sens. 2019, 57, 8095–8104. [Google Scholar] [CrossRef]
- Li, J.; Han, Y.; Liu, W.; Wang, S.; Cao, L.; Lu, Z. A new theoretical model deriving planetary boundary layer height in desert regions and its application on dust devil emissions. Sci. Total Environ. 2021, 152378. [Google Scholar] [CrossRef]
- Vivone, G.; D’Amico, G.; Summa, D.; Lolli, S.; Amodeo, A.; Bortoli, D.; Pappalardo, G. Atmospheric boundary layer height estimation from aerosol lidar: A new approach based on morphological image processing techniques. Atmos. Chem. Phys. 2021, 21, 4249–4265. [Google Scholar] [CrossRef]
- Pan, Y.n.; Jin, Z.; Tong, P.; Xu, W.; Wang, W. Edge Detection Method for Determining Boundary Layer Height Based on Doppler Lidar. Atmosphere 2021, 12, 1103. [Google Scholar] [CrossRef]
Publisher’s Note: MDPI stays neutral with regard to jurisdictional claims in published maps and institutional affiliations. |
© 2022 by the authors. Licensee MDPI, Basel, Switzerland. This article is an open access article distributed under the terms and conditions of the Creative Commons Attribution (CC BY) license (https://creativecommons.org/licenses/by/4.0/).