1. Introduction
Remote sensing (RS) image change detection refers to using multi-temporal RS images and other auxiliary data covering the same surface area to determine and analyze surface changes. The use of high-resolution RS images for regional change detection can intuitively, quickly, and truly obtain relevant change information and grasp its development trend. This technology is widely used, such as dynamic monitoring of forest and vegetation [
1,
2], land use and cover change analysis [
3,
4], natural disaster assessment [
5,
6], and other fields.
According to the basic unit, traditional RS change detection algorithms can be divided into two categories, pixel-based and object-based methods [
7]. In pixel-based methods, the first step is to generate difference image by image difference [
8], principal component analysis (PCA) [
9], change vector analysis (CVA) [
10], and other methods. Then, threshold-based and cluster-based methods [
9,
11,
12] are adopted to generate the change detection results. The object-based method first extracts the features of the bi-temporal images, divides them into different semantic information, and then analyses the differences between the bi-temporal images [
13,
14,
15,
16,
17]. However, with the development of Earth observation technology, more advanced sensors are designed for Earth observation with higher spatial resolutions and larger sensor detection ranges. It is difficult for traditional algorithms to excavate the potential connections of these huge amounts of high-resolution images. In addition, RS change detection tasks include not only changing objects but also other pseudo-change interference objects, such as light and seasons [
18], which brings great challenges to the task. These factors make traditional methods unable to meet application needs. Many traditional change detection methods [
9,
10,
11,
12,
13,
14,
15,
16,
17,
19,
20,
21,
22] usually employ handcrafted features to extract change maps. The manual feature extraction process is very cumbersome, and these methods have poor robustness in complex scenarios.
In recent years, deep learning has achieved admirable results in computer vision tasks, such as object detection [
23,
24,
25], semantic segmentation [
26,
27,
28], image classification [
29,
30,
31], and other tasks. Many researchers have adopted the deep semantic segmentation model into the pixel-level RS change detection tasks and obtained remarkable performance. At present, this strategy has gradually become the mainstream method of RS change detection. The pixel-level RS change detection model based on deep learning is mainly divided into two main structures [
32]. The first is the single-branch structure that concatenates the bi-temporal images directly as the input of the model. Based on U-Net [
33], Daudt et al. [
34] proposed the Fully Convolutional Early Fusion (FC-EF) that first concatenates the bi-temporal images as the input, then uses skip connection to prevent the loss of details caused by the convolution layers and pooling layers in the deep network, and finally obtains the change map through a softmax layer. Unet++_MSOF [
35] is improved from Unet++ [
36], which concatenates the bi-temporal images as the input and combines the deep supervision strategy. Another one is the double-branch structure with shared weights, also known as the Siamese structure [
37]. The Siamese structure uses the same feature extractor to generate the bi-temporal feature maps that are used to calculate the distance between the corresponding features to measure the similarity and obtain a change intensity map. Based on the change intensity map, the change detection results can be calculated. Chen et al. [
38] used VGG [
29] and ResNet [
30] as feature extractors and introduced a dual attention mechanism (DAM) [
39] to solve the pseudo-change problem. Fang et al. [
18] improved Unet++ to a Siamese structure, and introduced an Ensemble Channel Attention Module (ECAM) to aggregate and refine features of multiple semantic levels of deep supervision and achieved excellent results.
The above deep-learning-based methods have achieved good results, but there are still some common problems to be solved. The single-branch structure has the entanglement and non-correspondence of spatial features in bi-temporal images [
18], which affects the performance of the model during feature fusion. However, the Siamese structure extracts features from the bi-temporal images separately and then fuses them to generate change detection results. Therefore, we adopt the Siamese structure to avoid this shortcoming of the single-branch structure. Due to RS images having the characteristics of complex scenes and abundant objects, bi-temporal images are usually affected by factors such as positional deviation, lighting conditions, and seasonal changes [
32]. These complex factors result in it being difficult to detect the changed areas with weak intensity. However, most Siamese models lack attention to the vulnerable change information, and successive down-samplings and convolutions cause the loss of these changed areas, which often leads to missing small objects, incomplete objects, and the rough edges of objects in the results. In addition, the feature difference is not fully utilized in the existing RS change detection models.
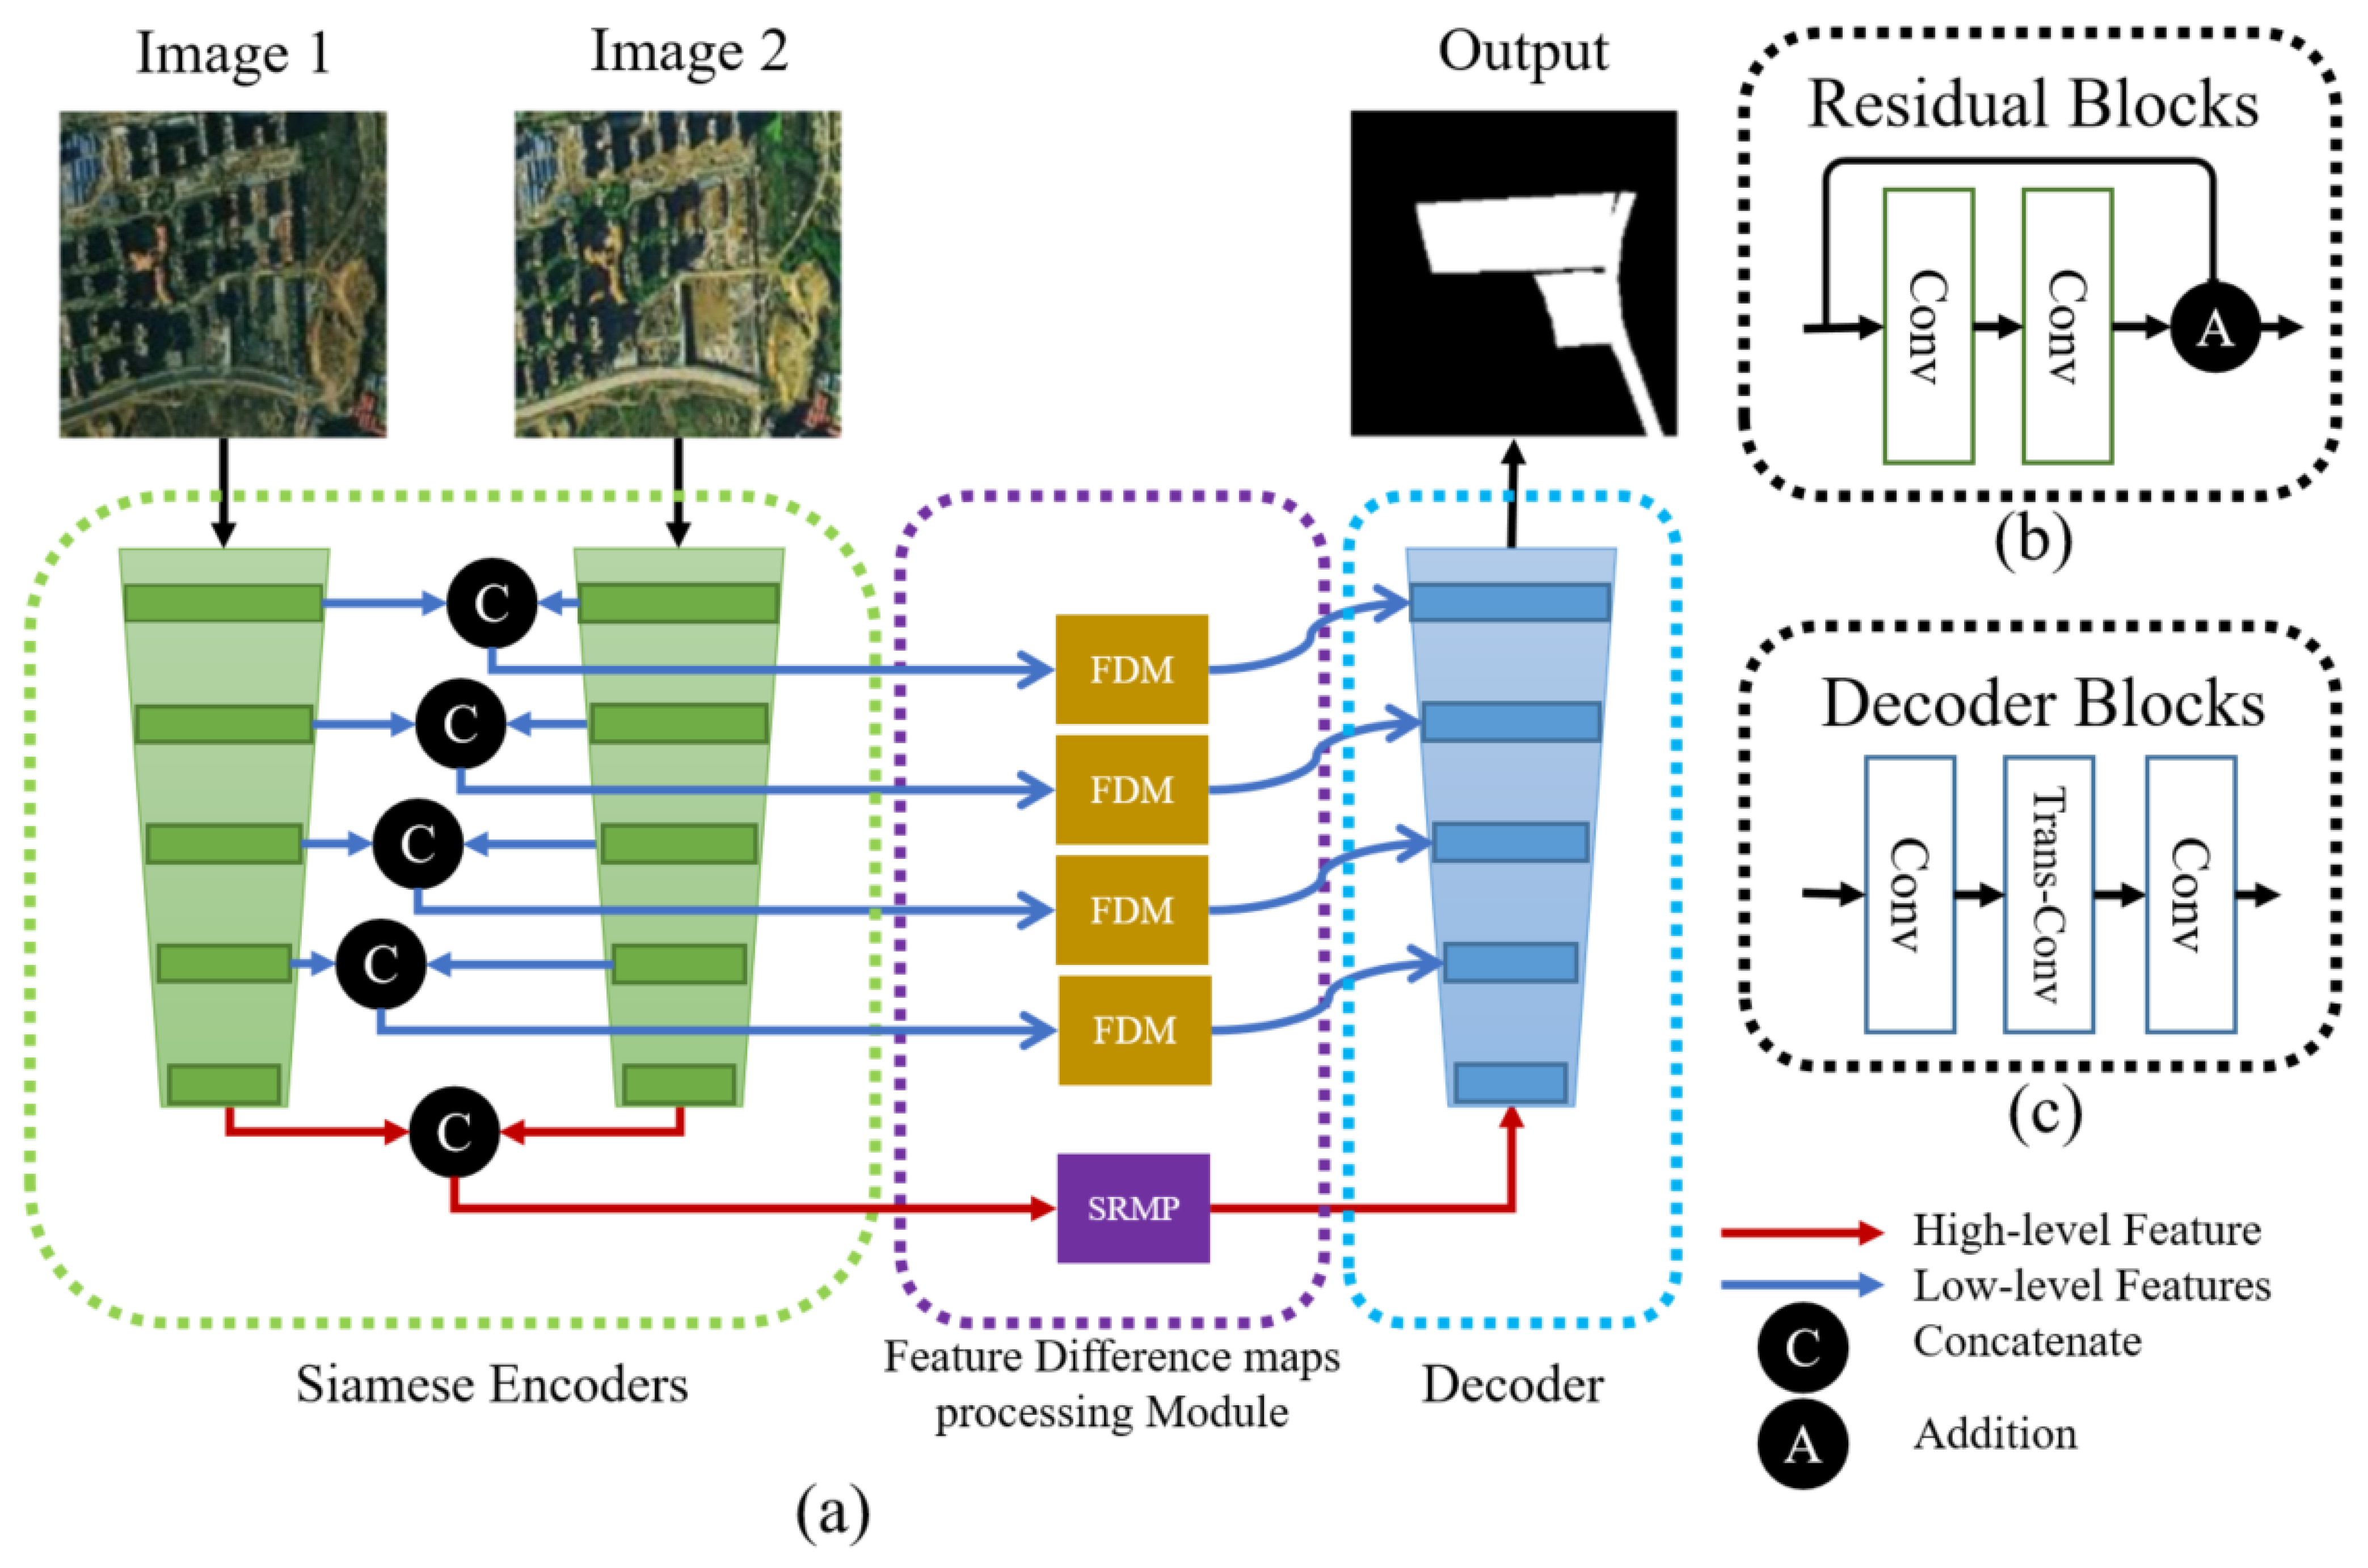
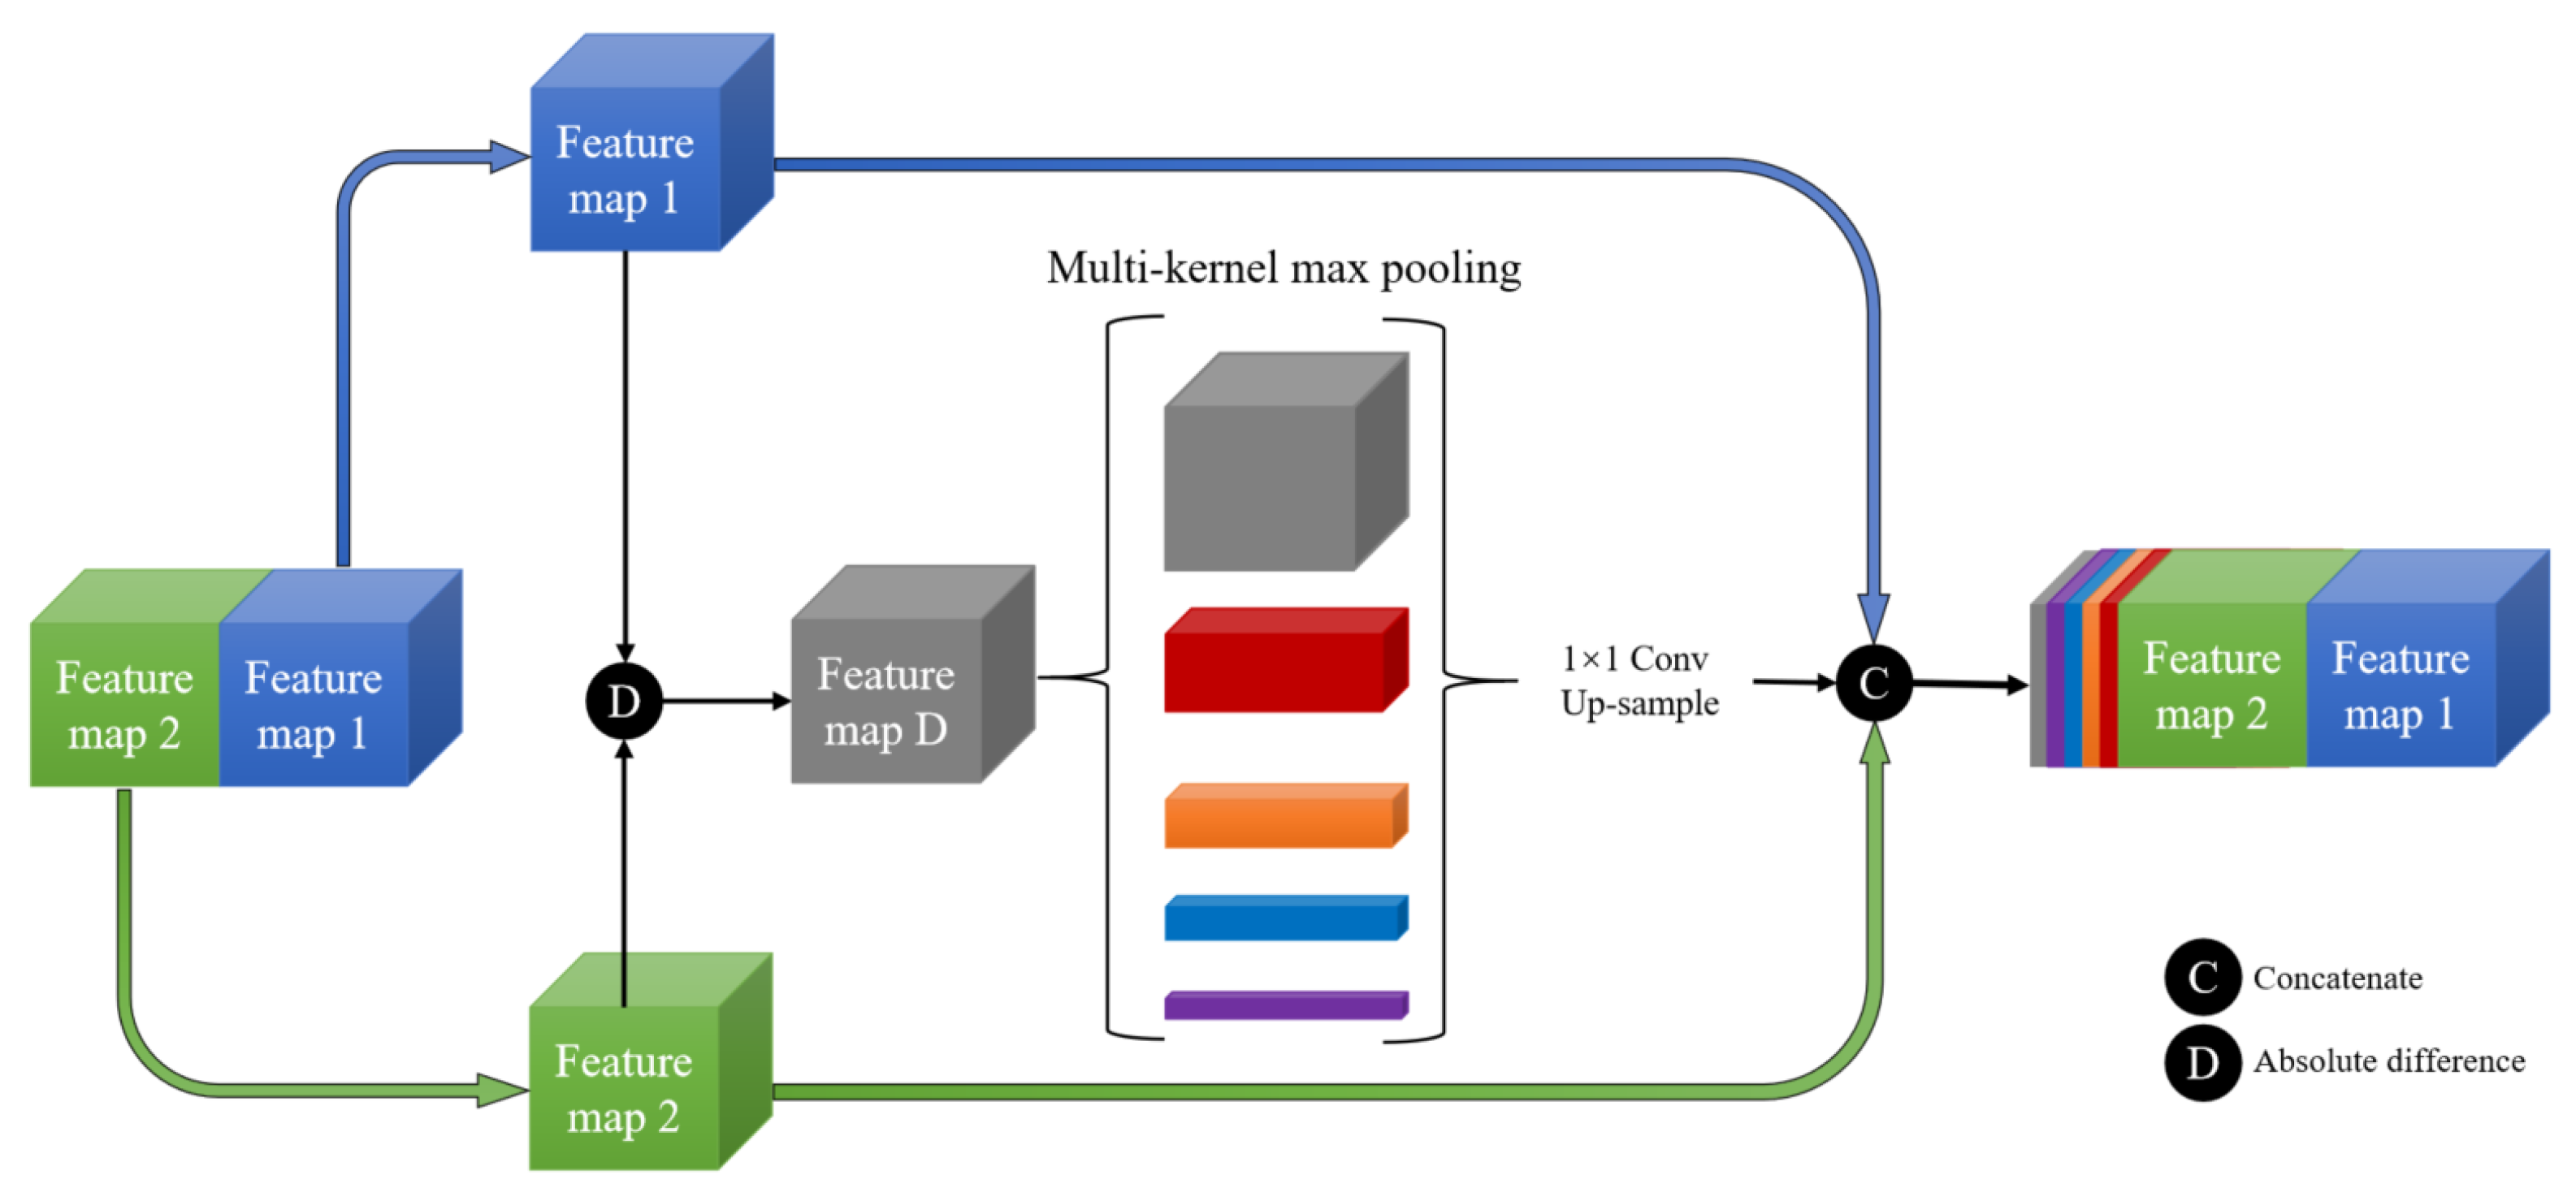
To deal with the above problems, we propose a novel approach called Siamese Multi-Scale Difference-Enhancement Network (SMD-Net) that uses multi-scale feature difference maps to enhance the information of the changed areas, so that the model could have a good performance. Previous studies [
26,
33,
36] have shown that the low-level features of the neural network (NN) contain fine-grained positioning information such as the location and texture of the RS objects, while high-level features contain coarse-grained semantic information such as the range of RS objects, land properties, semantics, and other information. Based on this view, we propose a Siamese residual multi-kernel pooling module (SRMP) for high-level features, which can provide high-level change information to enhance the ability of semantic discrimination to the changed areas. SRMP can help the model to improve the completeness of objects and the ability to detect small objects based on high-level information. For the low-level features of multiple skip connections, we propose a feature difference module (FDM) that can provide multi-scale detailed change information to enhance the local details of the changed areas. FDM can improve the performance of the model at the edges of the objects. During the feature fusion of the decoder, the model combines the different scales and depths of feature change maps provided by SRMP and FDM to enhance the changed information step by step. SRMP and FDM can increase the discriminative ability of the model in the changed areas so that it has a better performance in changed areas.
In the next two subsections, we discuss related work on remote sensing change detection, our motivation, and the main contributions of this paper.
1.1. Related Work and Motivation
In this part, we briefly review the existing RS change detection methods.
Due to the excellent ability of the U-shaped network to fuse low-level and high-level features, as well as its lightweight architecture, U-shaped networks are improved for RS change detection tasks. Papadomanolaki et al. [
40] proposed a novel method for urban change detection, which combines the U-shaped network for feature representation and powerful recurrent networks for temporal modeling. To deal with the limitation that a large number of labeled datasets are required for supervised change detection tasks, Peng et al. [
41] introduced a semi-supervised network (SemiCDNet) in combination with a generative adversarial network (GAN).
However, when the single-branch structure extracts feature maps in RS change detection tasks, the bi-temporal features will interfere with each other, which affects the performance of the model during feature fusion. The Siamese network is a method to distinguish between inputs and learns a measure of similarity from the data, which can avoid this problem well. The Siamese network consists of two identical NNs with shared weights. Each of the NNs generates a feature vector to calculate the similarity between the two inputs. Because of its excellent ability to measure similarity, the Siamese network has been widely used in RS change detection tasks. Dual attentive fully convolutional Siamese networks (DASNet) [
38] use a dual attention mechanism (DAM) to improve feature discrimination and combine with weighted double-margin contrastive (WDMC) loss to solve the problem of sample imbalance. Chen et al. [
42] combined CNN and RNN and proposed SiamCRNN that stacked the long short-term memory (LSTM) units to fully excavate the change information and can be used for both homogeneous and heterogeneous images for change detection. Yang et al. [
43] proposed Asymmetric Siamese Networks (ASN) for change detection to locate and identify semantic changes through feature pairs obtained from modules of widely different structures. Meanwhile, in order to alleviate the influences of label imbalance in model training and evaluation, an adaptive threshold learning (ATL) module and a separated kappa (SeK) coefficient were proposed.
Due to the outstanding performance of the Siamese structure and U-shaped network, they were combined and applied to RS change detection tasks. By combining nested connections, Fang et al. [
18] proposed a Siamese Network for Change Detection (SNUNet-CD) to alleviate the loss of localization information in the deep layers of NN through compact information transmission. Zhang et al. [
44] proposed an End-to-end Superpixel-enhanced Change Detection Network (ESCNet) that combined differentiable superpixel segmentation to solve the problem of the precise location of the changing areas.
In the Siamese U-shaped network, the difference map cannot be directly used to represent the change due to the existence of spectral and position errors, but the difference map is still the most intuitive means to reveal the changes in the bi-temporal images [
32]. Therefore, many scholars use the difference map to excavate the change information contained in it. Zhang et al. [
45] proposed a deeply supervised image fusion network (IFN), and fused the image difference features with multi-level deep features of the original images for change map reconstruction, which improves the boundary completeness and internal compactness of objects in the output change maps. Zhang et al. [
46] used the multi-scale and multi-depth feature difference maps, as well as RS images obtained by various sensors with different spatial resolutions to solve the multi-scale problem in RS change detection. Peng et al. [
32] proposed a difference-enhancement dense-attention convolutional NN (DDCNN) that improved the accuracy of change feature extraction by introducing difference-enhancement (DE) unit and combined the up-sampling attention (UA) unit to capture the change characteristics of the ground features with the spatial context information. Wang et al. [
47] proposed an attention mechanism-based deep supervision network (ADS-Net) for the detection of changes in bi-temporal remote sensing images, and they propose an adaptive attention mechanism combining spatial and channel features to capture the relationship of different scale changes and achieve more accurate change detection. In addition, the Siamese U-shaped network also plays an important role in the detection of changes in multi-source remote sensing images. A deep-translation-based change detection network (DTCDN) [
48] was proposed for optical and Synthetic Aperture Radar (SAR) images from different times. The deep translation firstly maps images from one domain (e.g., optical) to another domain (e.g., SAR) through a cyclic structure into the same feature space. The translation results are imported to a supervised CD network that utilizes deep context features to realize the change detection of different sensors. Ebel et al. [
49] proposed a dual stream network architecture for the fusion of bi-temporal SAR and bi-temporal optical data. Specifically, a dual-stream network based on U-Net was introduced to process SAR and optical data separately and combine the extracted features at a later decision stage. Hafner et al. [
50] proposed a novel four-branch Siamese architecture for the fusion of SAR and optical observations for multi-modal change detection. Specifically, a pair of branches (weights sharing) is used to extract the features of the bi-temporal optical image, the other pair of branches (weights sharing) is used to extract the features of the bi-temporal SAR image, and, finally, a decoder is adopted to fuse the four features to generate the multi-source change detection results.
The above work has shown that, in RS change detection tasks, the difference map can better help the model to improve the effectiveness of the extracted change features, as well as the completeness of the boundary of the changed areas. However, the previous work either made insufficient use of the difference map or only used the difference map without retaining the original feature maps. This will make the change information not fully excavated, leading to missing small objects and incomplete change detection results.
In our proposed method, we not only retain the original feature maps but also adopt the feature difference maps to model multi-scale and multi-depth change information, which will enhance the change intensity. In addition, our research found that using such an encoder similar to Fully Convolutional Siamese-Concatenation (FC-Siam-Conc) and Fully Convolutional Siamese-Difference (FC-Siam-Diff) [
34] can not only make the model have a small number of parameters but also can easily achieve a good result on the Change Detection Dataset (CDD) [
51]. However, its performance on other datasets is often not very good (see
Section 4.1 for details). We consider that ResNet has a more stable performance in all aspects, and the weights pre-trained on ImageNet can be loaded to accelerate the model’s convergence, so we employ ResNet as our encoder. In addition, we concatenate the bi-temporal feature map to preserve the original features and reduce the loss of information as the decoder.
1.2. Contribution
The main contributions of this paper are mainly as follows:
- 1.
We propose an SMD-Net for RS change detection, which combines multi-scale and multi-depth difference feature maps to enhance the change information and achieve more robust performance;
- 2.
The SRMP is proposed to provide high-level change information, which will enhance the overall changed areas, which is helpful for solving the problem of object incompleteness and missing small objects;
- 3.
The FDM is proposed to fully excavate the change information through the feature difference, which can enhance the details of changed areas to improve the edge accuracy.
The paper is organized as follows.
Section 2 describes the method proposed in this paper.
Section 3 introduces the experiments and results.
Section 4 discusses the effect of dataset overlap and label error on the change detection model. Finally, the conclusion of this paper is drawn in
Section 5.
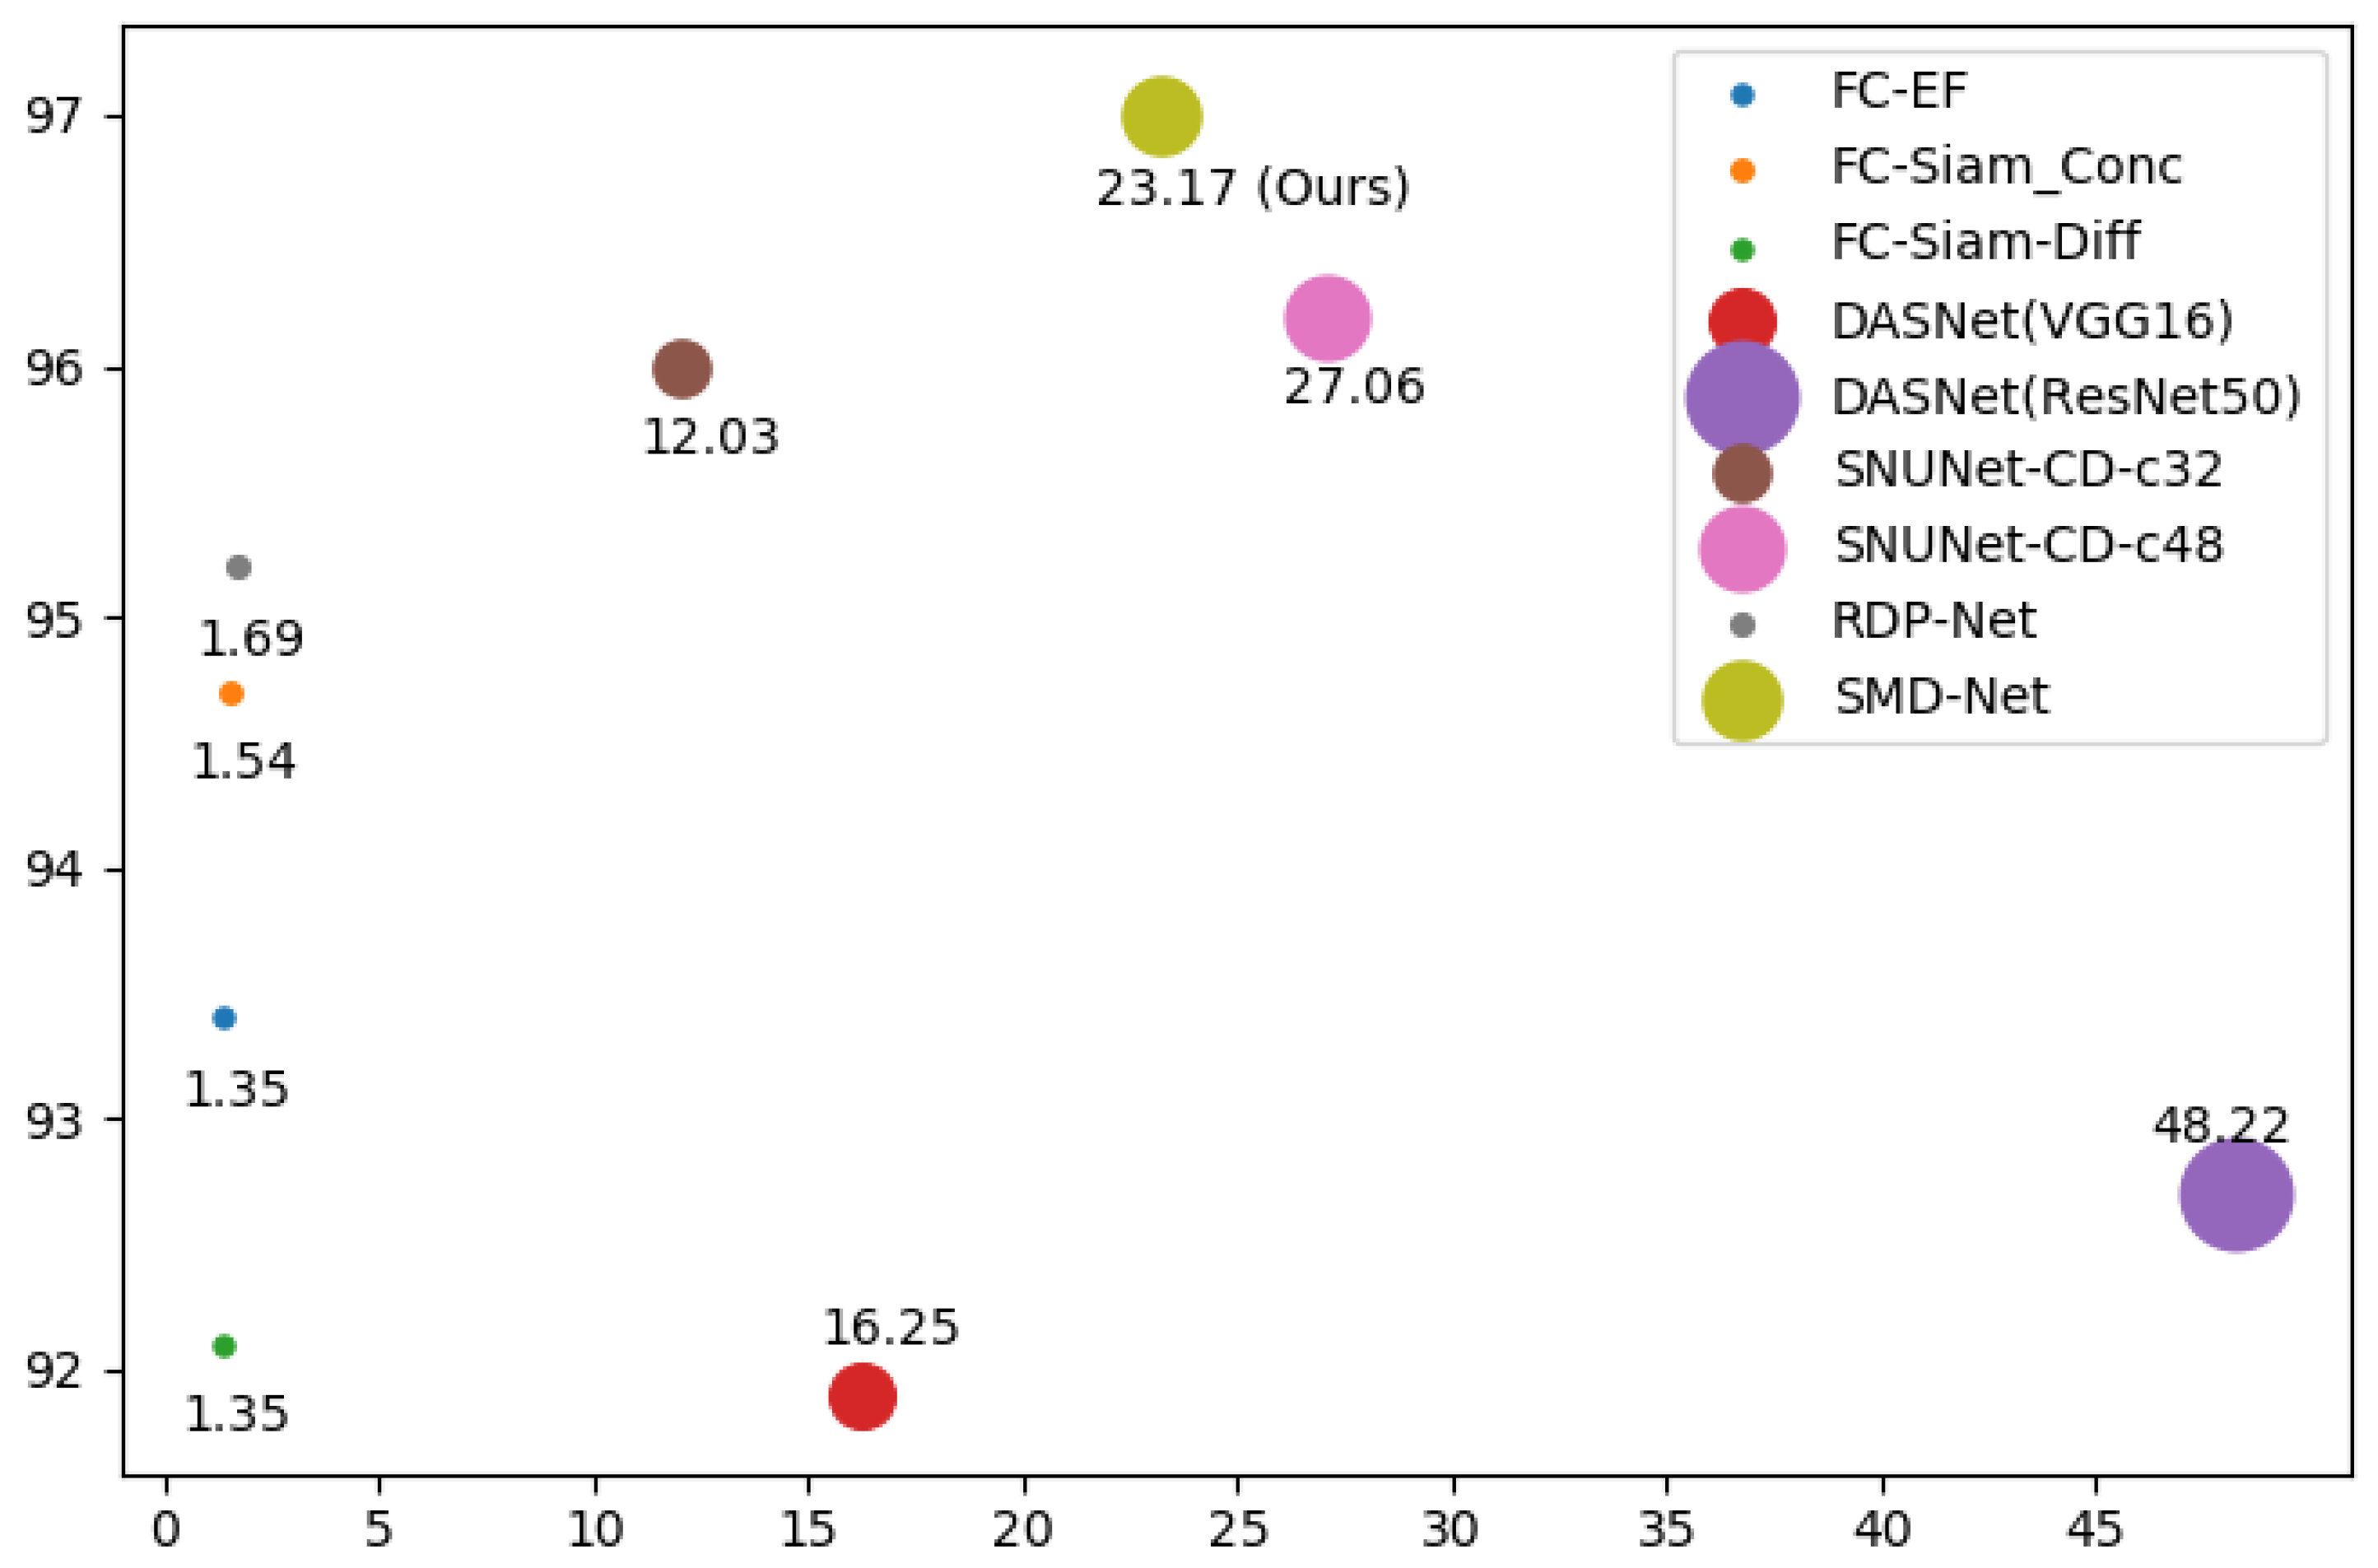
5. Conclusions
In this paper, we have proposed an SMD-Net for high-resolution RS image change detection. Adopting the Siamese structure, SRMP block and FDM block are proposed to provide the decoder with multi-scale and multi-depth change information to enhance the change intensity while retaining the original features. Through this strategy, our network has an excellent performance in object completeness, small object detection, and object edge detection. Compared with some other methods, our proposed network has excellent performance on three public datasets and has a good trade-off between accuracy and calculation cost. In addition, our model has good generalization ability and can detect more label errors. However, our method still has some points for improvement. For example, the practicality of our method in real-world scenarios needs to be improved, and its inference time needs to be shortened. In addition to this, our experiments have some limitations. For example, in
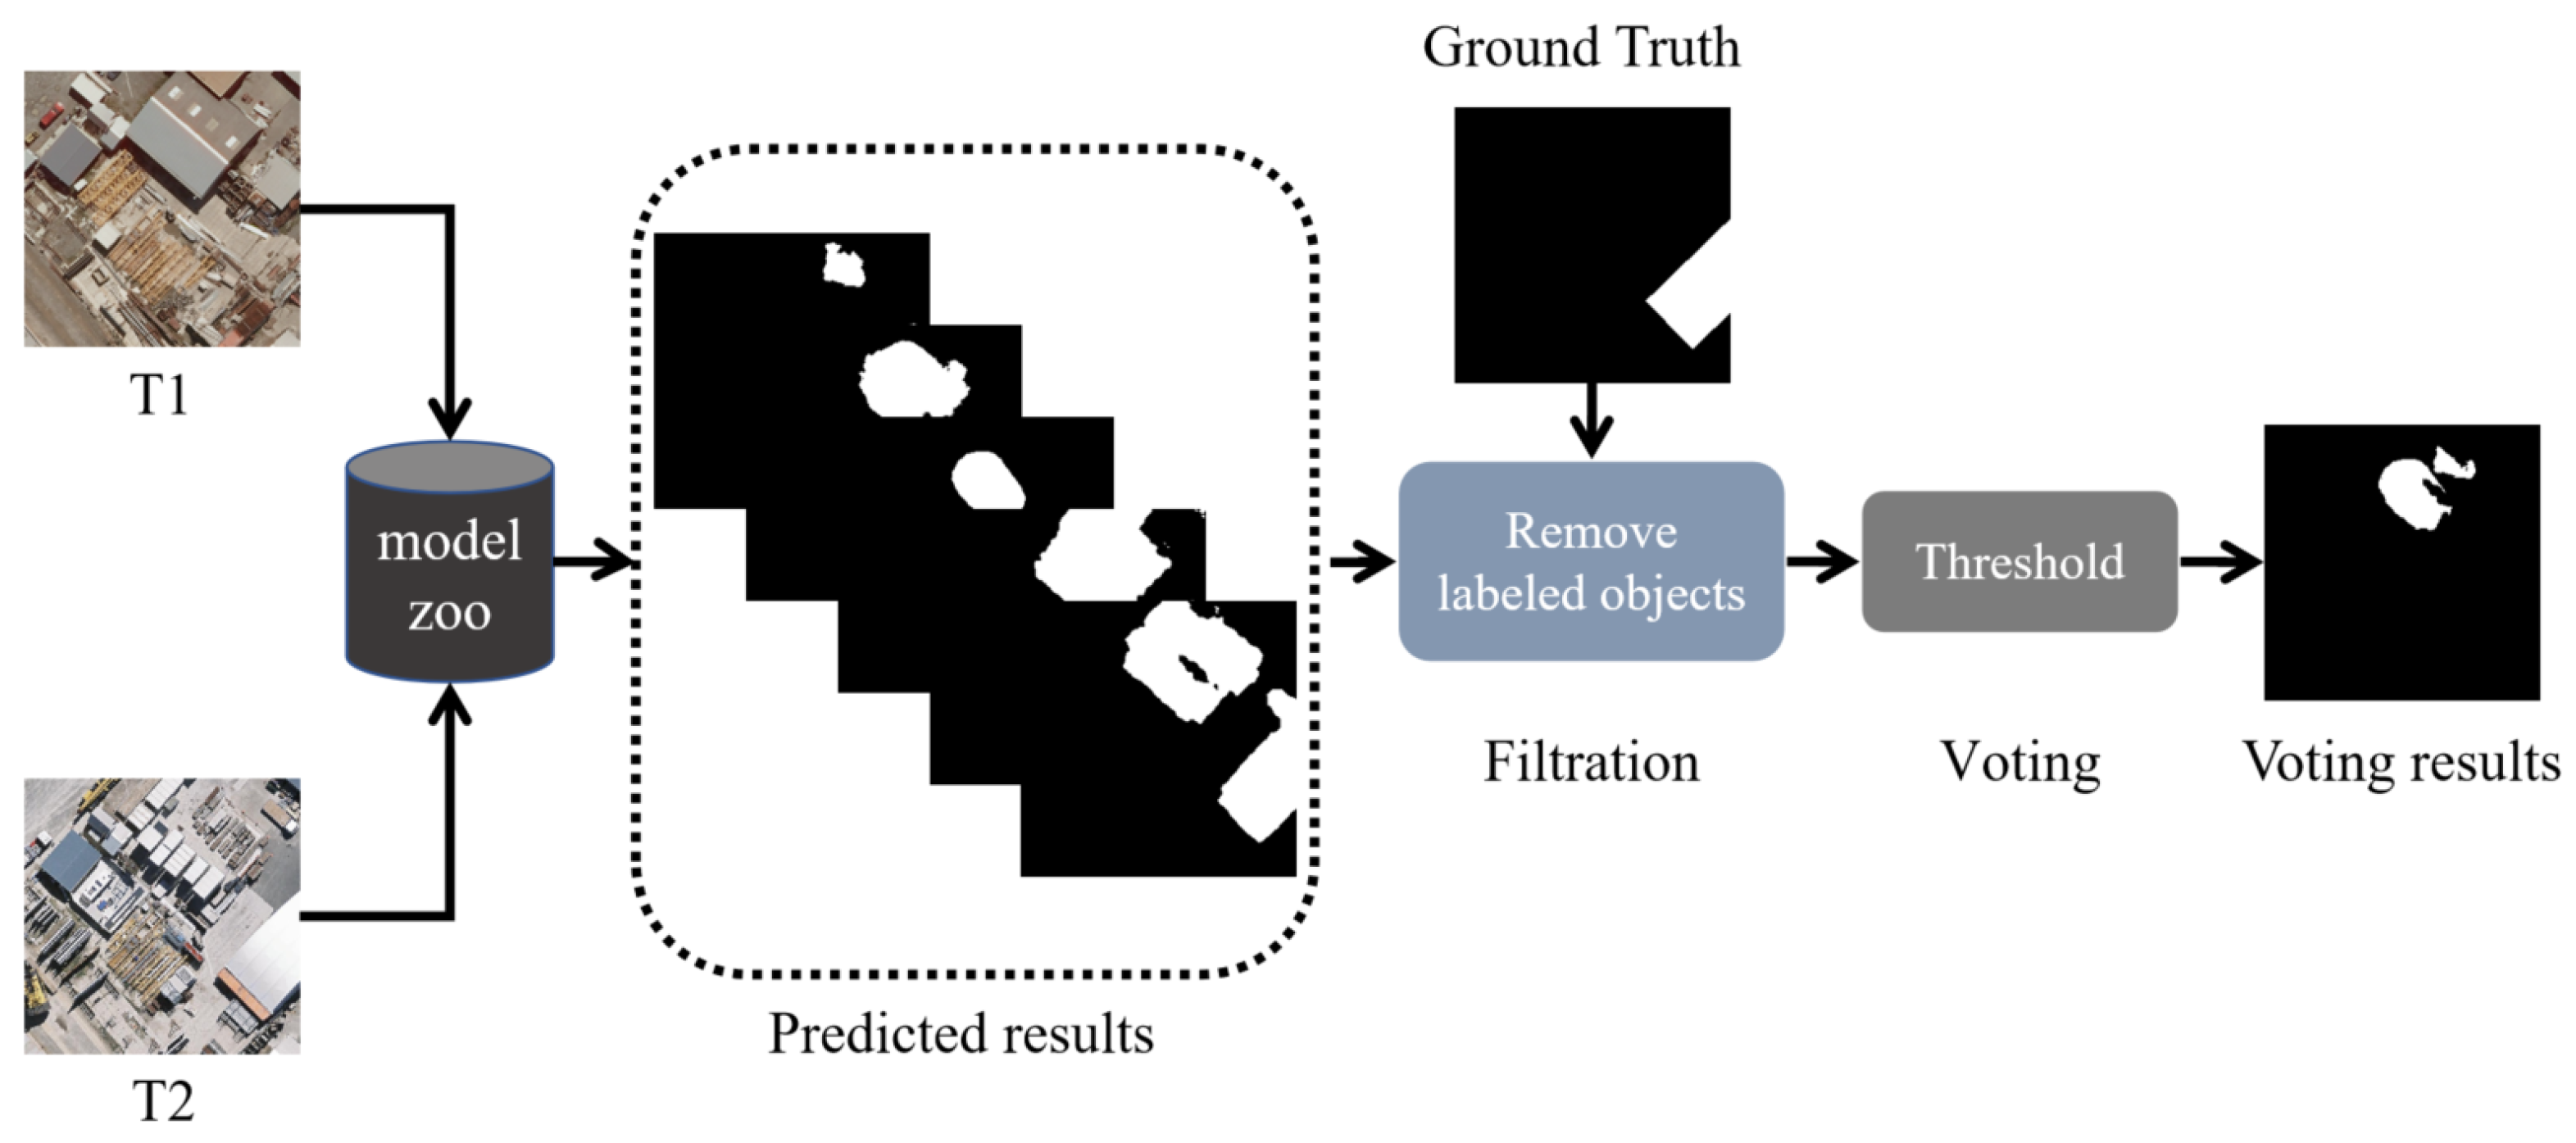
Section 4.2, since some objects in the BCDD dataset are mislabeled, we can only indirectly evaluate the performance of each model by means of pseudo-labels. In addition, our experiments do not fully determine how many mislabeled objects each model can realistically detect.
In the future, we will conduct further research on few-shot learning, inaccurate supervision, and multiple types of changed areas to improve the performance of change detection, as well as improving the ability of the model in real-world scenarios.


