Article

Arbitrarily Oriented Dense Object Detection Based on Center Point Network in Remote Sensing Images

1
School of Instrumentation and Optoelectronic Engineering, Beihang University, Beijing 100191, China
2
Department of Computer Science, Tangshan Normal University, Tangshan 063000, China
*
Author to whom correspondence should be addressed.
Remote Sens. 2022, 14(7), 1536; https://doi.org/10.3390/rs14071536
Submission received: 5 February 2022 / Revised: 5 March 2022 / Accepted: 19 March 2022 / Published: 22 March 2022

Abstract

:
Arbitrarily oriented object detection has recently attracted increasing attention for its wide applications in remote sensing. However, it is still a challenge for detection algorithms because of complex scenes, small size, rotation, densely parked. And angle discontinuity at the boundary is an important factor restricting model performance. In this paper, we propose an anchor-free approach for the high-precision detection of rotated objects. Firstly, our model achieves the classification and localization of an object by detecting its center point. Secondly, we convert the regression task of angle into a classification task and utilize the periodicity and symmetry of the transformation function to eliminate the disturbance of angle discontinuity. Thirdly, the dynamic gradient adjustment method is applied to suppress the negative effects of sample imbalance on the classification task. In addition, we proposed a union loss function to achieve accurate and stable regression of the rotated bounding box. We perform a series of ablation experiments to validate the effectiveness of the improvements. The experimental results obtained on several publicly available remote sensing datasets show that the proposed method has a higher detection accuracy, and it can be applied to efficiently identify rotated objects in remote sensing images.

1. Introduction

Object detection is widely employed in remote sensing imaging technology applications such as urban planning, resource and environmental surveys, traffic control, mapping, communication and navigation [1,2,3,4], and it has received constant attention from many scholars. Machine learning technology is constantly updating and evolving, and it has been used in various image processing applications, such as pose estimation [5,6], image reconstruction [7,8], target tracking [9,10], and so on. Recognition methods utilizing deep learning have achieved ideal detection results. Motivated by the great successes of convolutional neural networks (CNNs), many researchers have introduced deep networks for measuring large-scale natural image datasets such as ImageNet [11] and MSCOCO [12] in the remote sensing identification field. The direct transfer of models from natural scene images to optical aerial images does not achieve the ideal detection effect. Object identification in aerial images also faces multiple difficulties, such as illumination, weather, multiscale settings, partially obscured, and so on. In addition, aerial images are obtained from vertical views, and the feature information of the target is obviously different from that contained in natural scene images, which usually capture information from an approximately horizontal perspective. Remote sensing images have lower spatial resolutions since they are acquired from substantial distances. Objects in aerial images such as ships and vehicles usually occupy fewer pixels and are densely packed, resulting in intercategory feature crosstalk and intracategory feature boundary blurring. Therefore, it is necessary to improve such networks according to the characteristics of remote sensing images.
Due to the image acquisition mode of vertical views, objects in optical aerial images usually appear arbitrarily oriented, which requires the utilized bounding box to be rotatable to match the characteristics of the target. Many excellent arbitrarily oriented detectors have been proposed and applied in remote sensing and scene text detection [13,14,15]. The differences between horizontal bounding box (HBB) detection and oriented bounding box (OBB) detection are shown in Figure 1. An HBB can be denoted by four parameters ( c x , c y , w ,   h ) , where ( c x , c y ) represent the coordinates of the center point and ( w ,   h ) indicate the width and height of the bounding box. OBB introduces an additional parameter θ to describe the rotation angle of the objects. Compared with OBB, HBB detection has three disadvantages: (1) an HBB does not reflect the size and shape information of the target, especially for a target with a high aspect ratio; (2) an HBB is less enveloping than an OBB, and it contains many background pixels; (3) objects that are densely packed are hard to distinguish from each other. Therefore, the OBB method is more suitable for object detection in aerial images. However, experiments have shown that the discontinuity during the angle regression affects the model performance, so it is necessary to investigate effective solutions to eliminate the boundary discontinuity caused by angular periodicity.
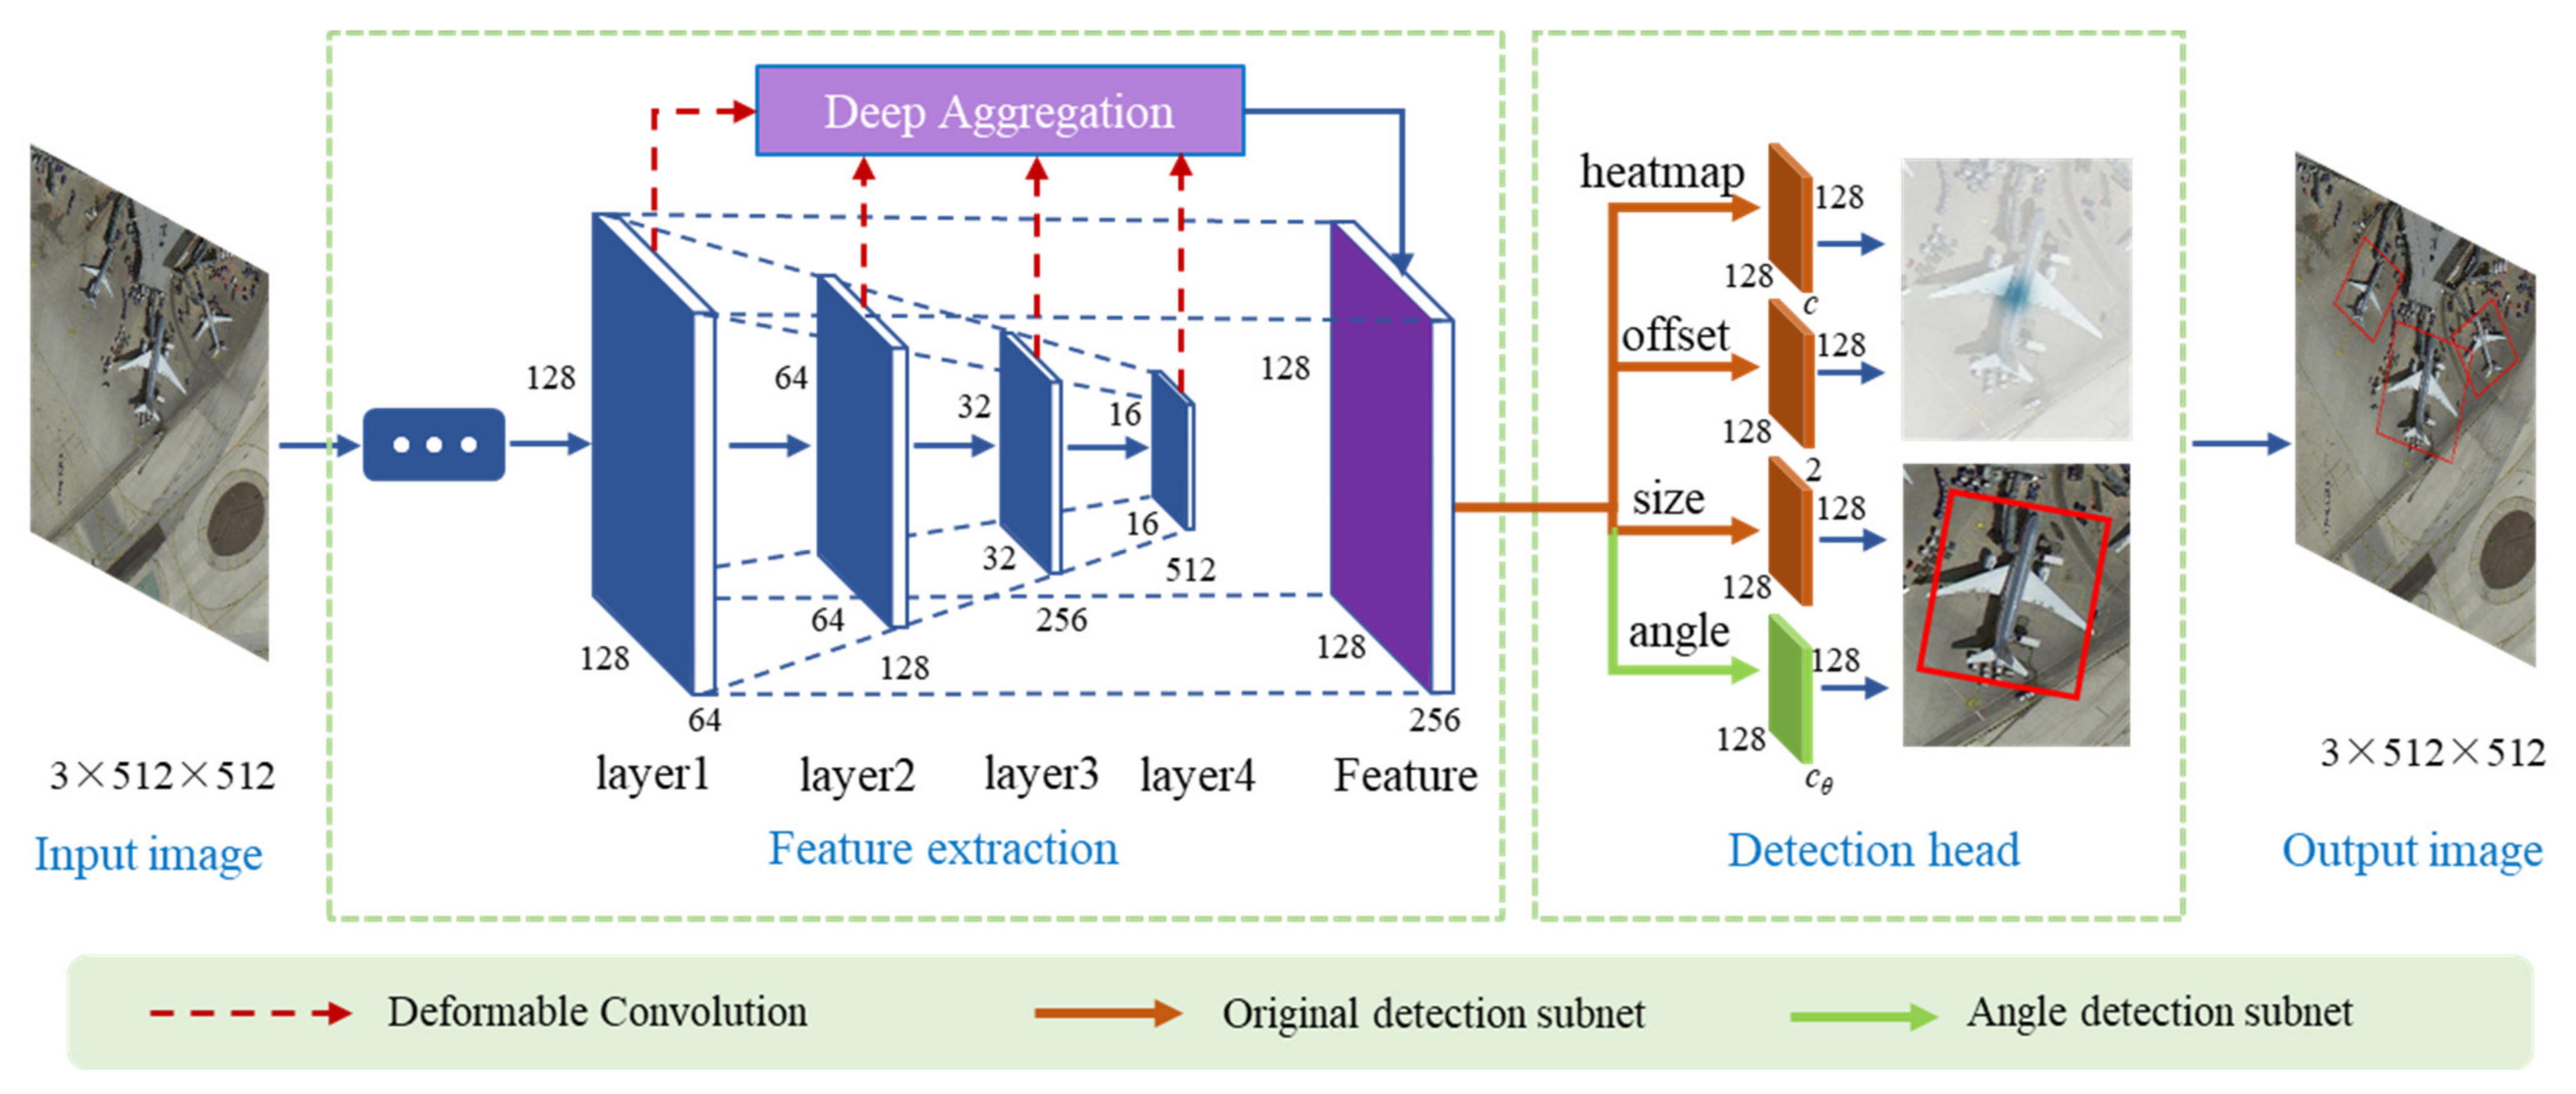
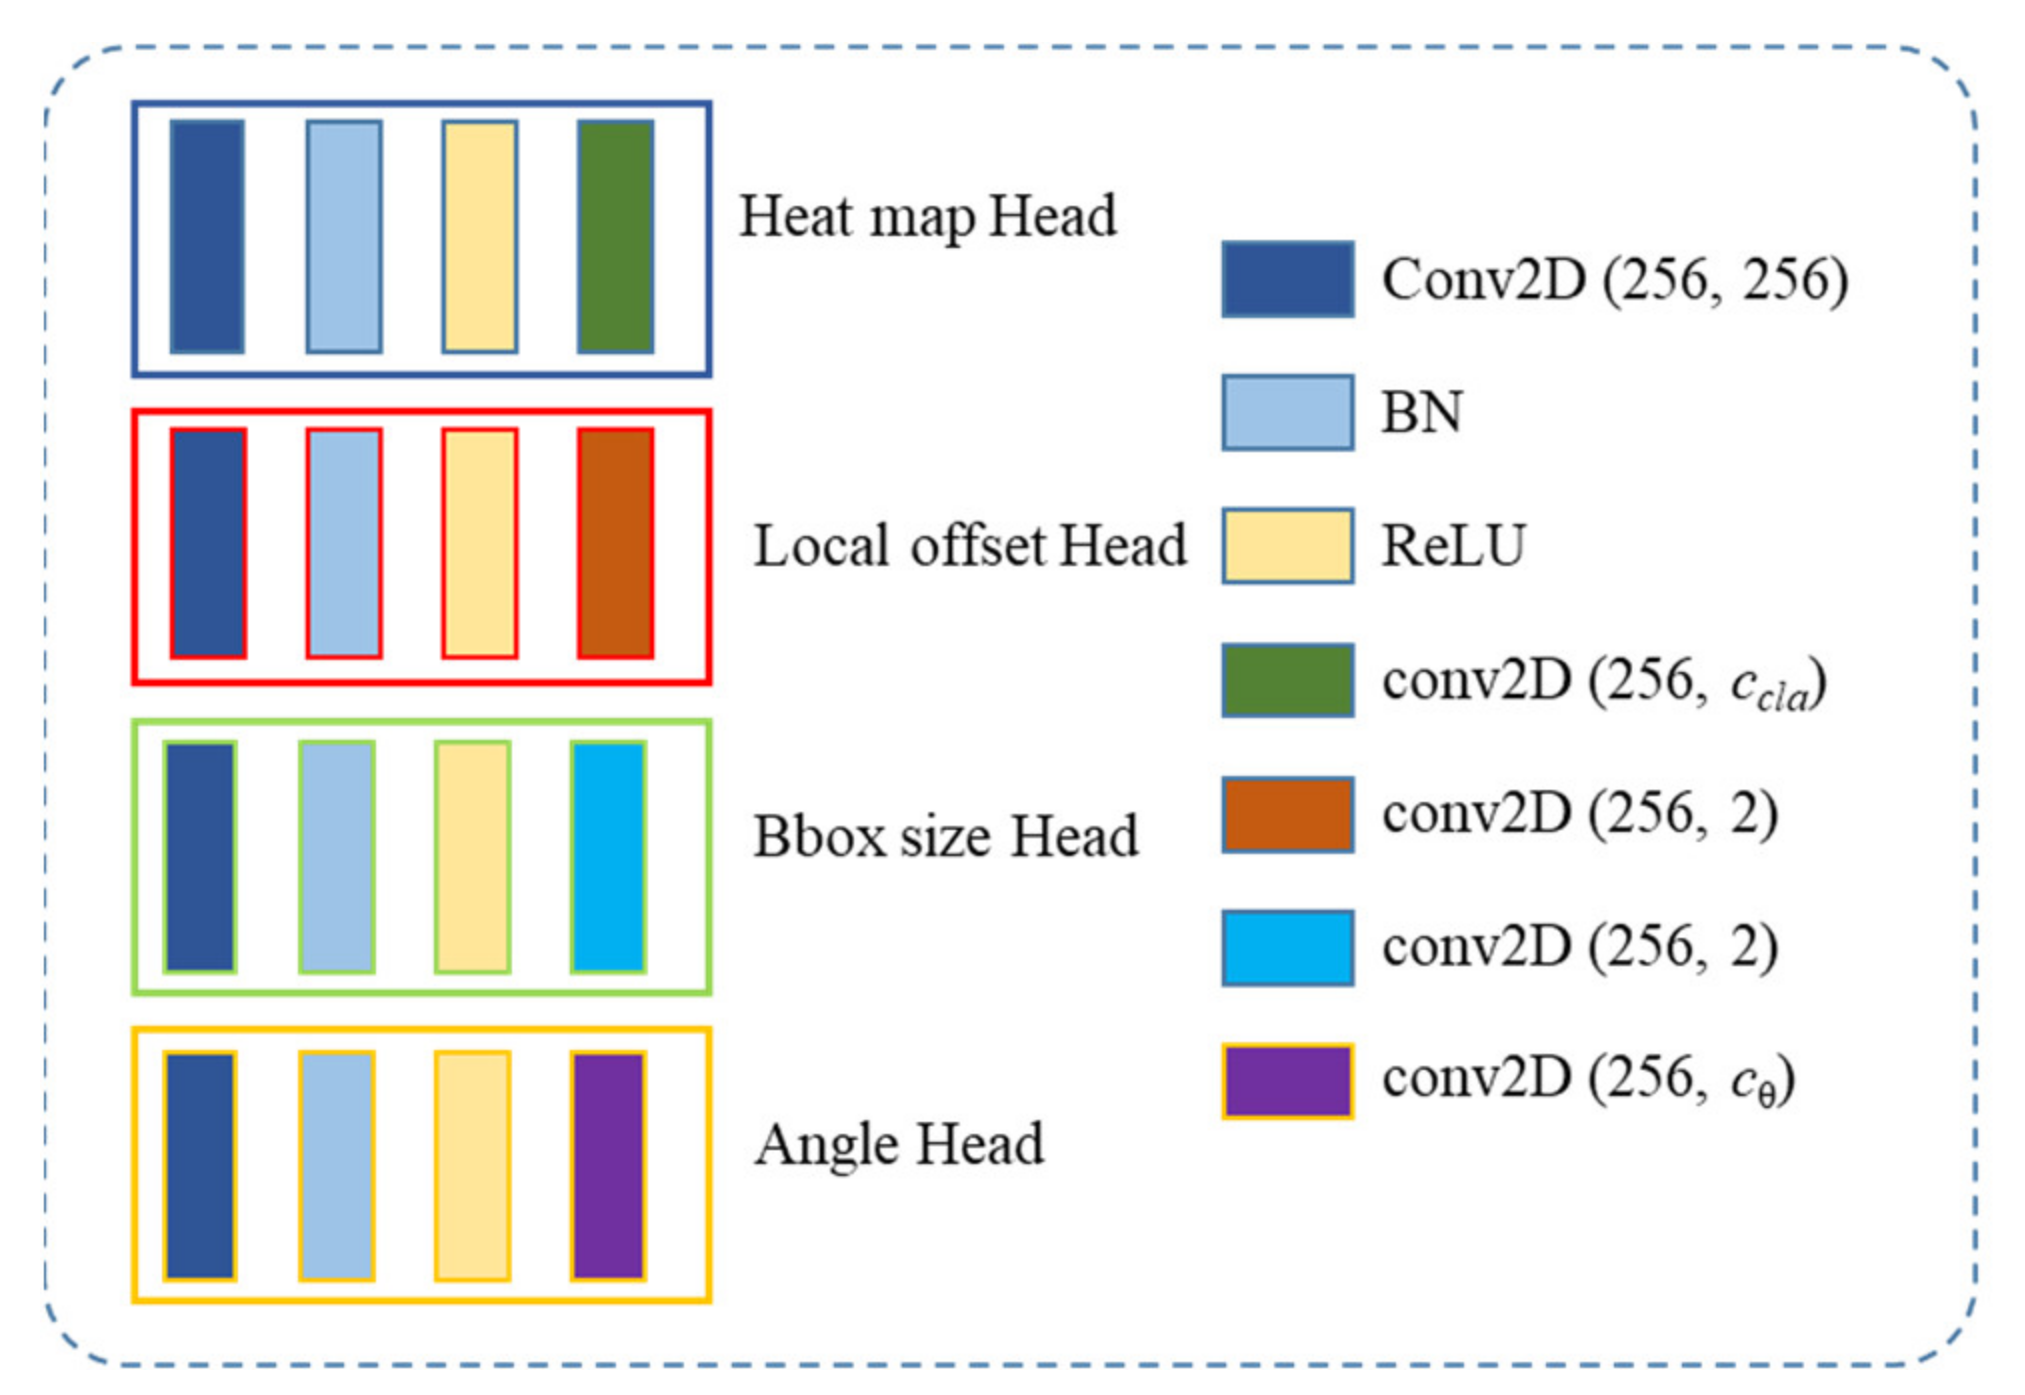
We adopt an anchor-free approach to realize the detection of arbitrarily oriented objects. The detector is based on CenterNet [16], which regards the given object as a point and then directly predicts its width and height values. This method designs an additional angle prediction branch to extract the angle information of the object. To handle the problem of angle periodicity, we introduce a smooth labeling method to convert the issue into a classification task. This method transforms a single truth value into a sequence, which effectively improves the angle prediction accuracy.
In addition, the sample quantity imbalance problem restricts the performance of the classifier. In aerial images, positive examples occupy only a fraction of an image, and most of them are easily identifiable examples. The quantity variance between positive and negative examples and hard and easy examples harms the accuracy of the classification task. Focusing on the problem, online hard example mining (OHEM) [17] is proposed to increase the contribution of hard examples to the loss function, but the screening process for hard samples causes more training time. Focal loss [18] modifies the cross-entropy loss to pay more attention to hard examples. However, hard examples contain some discrete targets that are difficult to be recognize by eyes, and it will harm model convergence by increasing the weight of those discrete targets.
To improve the learning efficiency of the network for obtaining effective features, a gradient harmonizing mechanism (GHM) [19] is introduced to suppress the disequilibrium between examples. This method focuses on weakening the influence of the very hard examples. Aiming at improving the detection accuracy of the model, we propose a more effective example dynamic equalization method on the basis of the GHM. First, a weight coefficient is incorporated into the harmonization module to address the quantity imbalance between positive and negative examples. Second, gradient adjustment mechanism is embedded into the classification function [18,20] to dynamically adjust the weighing factor of easy examples and hard examples.
Besides, independent regression of object distribution parameters raises several problems. First, this will introduce more hyper-parameters in the optimization function. Second, its inconsistency to the evaluation metric, i.e., Intersection over Union (IoU). Generalized IoU (GIoU) loss [21] and complete IoU (CIoU) loss [22] can overcome such issues in HBB task. But they cannot be applied directly in OBB task. Pixes IoU (PIoU) loss [23] realizes it by counting the number of pixels in the intersection area, but its accuracy is not satisfactory. We propose a rotated CIoU (RCIoU) loss which incorporates angle information in CIoU, and adopts it to achieve the union regression of rotation objects.
In this article, we propose a novel framework for the high-precision detection of rotating objects in remote sensing images. Our approach aims to eliminate the limitations of angle discontinuity, sample quantity imbalance, and parameter separation regression on model performance. The experimental results show that our method achieves state-of-the-art performance in remote sensing datasets. The major contributions of this article include the following.
  • We propose a unified paradigm for arbitrarily oriented object detection in remote sensing imaging. The detector is built based on the anchor-free CenterNet, and an angle-sensitive subnet is added to the network to realize rotated object detection. The periodic smooth label is introduced to transform the one-hot value of the rotated angle into a category label sequence. This transformation method can eliminate the discontinuity of the rotated boundary, which is caused by the periodicity of the angle.
  • A dynamic gradient adjustment method is embedded into the angle classification loss function to harmonize the quantity imbalance between easy and hard examples. This method is transplanted into the angle loss function to further improve the angle identification accuracy.
  • We proposed an RCIoU loss for oriented bounding box regression, which achieves a faster convergence rate and higher detection accuracy than independent regression of distribution parameters.
The structure of this paper is designed as follows. Section 2 outlines relevant deep convolutional networks in remote sensing object detection and describes arbitrarily oriented object detection methods. We elaborate on the detection principle of our proposed method in Section 3. The superiority of the proposed approach is verified, and a quantitative comparison with the existing methods is conducted in Section 4. Finally, Section 5 gives the conclusion of this article.

2. Related Work

2.1. Horizontal Object Detection Network

With the continuous progress of computer performance and machine learning techniques, many excellent networks have been proposed to realize high-precision object recognition in natural images. Detectors based on CNNs can be divided into two categories: two-stage frameworks and one-stage frameworks. The R-CNN [24] is a pioneering two-stage detection paradigm that generates the proposal region via selective search [25] before classifying the object of interest. He et al. [26] proposed spatial pyramid pooling (SPP)-net to reduce the number of redundant computations by computing the feature map from a whole image once and then deriving fixed-length vectors from the feature map by SPP. Compared with SPP-net, Fast R-CNN [27] extracts region features with a region of interest (ROI) pooling layer, and then a classification layer is used to classify objects instead of a support vector machine (SVM). Ren et al. proposed utilizing a region proposal network (RPN) in Faster R-CNN [28] to generate candidate regions and achieve more accurate prediction results. To improve the identification accuracy of tiny objects, the feature pyramid network (FPN) [29] was introduced to fuse multilayer features via a top-down approach. Furthermore, the R-FCN [30] was proposed to generate a position-sensitive feature map that includes both position information and category information. This method shares the computational cost over the entire image and achieves a competitive result compared with that of Faster R-CNN.
Different from two-stage detection networks, one-stage frameworks do not need to extract candidate regions to complete object detection, and they directly classify each region of the input image as foreground or background. Thus, this kind of strategy has a faster detection speed in theory. Sermanet [31] utilizes an integrated one-stage framework, namely OverFeat, which realized localization by learning from predicted boundaries. SSD [32], YOLO [33], YOLOv2 [34], RetinaNet [18] and YOLOv3 [35] attempt to divide the input image into a number of grid cells and regard them as candidate regions. The object regression task in those approaches is carried out by using manually designed anchors. Then, a series of anchor-free detection methods were developed. CornerNet [36], FCOS [37], and ExtremeNet [38] were proposed to predict the bounding box of an object according to four key points, such as corners or extreme points. Zhou et al. proposed CenterNet [16], which predicts an object by its center point and achieves competitive results on the COCO dataset [12].
The previous methods were designed for general object detection. Many approaches have been introduced in the optical aerial field, and substantial progress has been made to improve the precision of such networks for tiny or cluttered objects. A hybrid CNN was proposed to detect vehicles from aerial images [39]. Dong et al. [40] designed Sig-NMS in an RPN to improve the detection accuracy for tiny objects, and the new network achieved a 17.8% increase on the LEVIR dataset [41] over the original network. Ding [42] proposed a fully convolutional neural network, which combined with dilated convolution and OHEM [17] to realize a high precision detection for small and dense objects in remote sensing images. For the purpose of detection under a complex background, authors designed a spatial and channel attention mechanism to weaken the distraction caused by a cluttered background [38]. However, high-precision object detection for optical remote sensing images is still a challenge for HBB detection.

2.2. Arbitrarily Oriented Object Detection Network

Rotated bounding box detection is necessary since a large number of objects with arbitrary rotation angles are contained in aerial images. Ma [13] proposed a rotated RPN to generate inclined candidate regions and designed a rotated region of interest (RROI) pooling layer to map candidate regions to a feature map. The method was first designed for scene text detection and then introduced into the aerial field by Zhang for ship detection [14]. Yang [43] proposed a dense FPN to extract features of the object, and adopted the rotated RPN to realize rotated detection of objects. However, the rotated RPN introduced an additional angle-dependent hyperparameter, which would increase the computational parameters and training time of the model. To increase the inference speed of the detector, a supervised RoI learner [44] was proposed to transform horizontal RoIs into rotated RoIs. This method alleviates the misalignment between RoIs and true objects. However, previous studies needed preset anchors and complex RoI operations. Extensive studies have attempted to find a more concise and effective method for conducting arbitrarily oriented object detection.
Gliding Vertex [14] demonstrated a novel paradigm on the basis of Faster R-CNN. This method glides the vertices of the HBBs on each corresponding boundary to capture the relative sliding offset and then obtains accurately OBBs based on offset and obliquity factors. Zhang et al. [45] introduced an OBB regression branch to align the rotation angles of objects, and the method exploited an attention mechanism to enhance the observed features by learning global and local contexts together in the object rotation detection. R3Det [46] utilizes a feature refinement module (FRM) during the process of box refinement to correct the misalignment between the predicted border and the corresponding true border through feature interpolation. SCRDet [47] uses the IOU-smooth L1 loss instead of smooth L1 loss to solve the boundary problem of rotated object detection. However, most of these detectors have boundary problems since their angles are periodic, and rotated detection misalignment has become a research hotspot in remote sensing.

3. Proposed Method

In this work, we introduce the overall architecture of our method and expound on the several improvement modules of our detector. Firstly, we introduce the framework of the CenterNet, and the rotated angle detection subnet is added to realize the detection of arbitrarily oriented objects. Secondly, the boundary discontinuity problem of angle is ex-pounded. Aiming at this problem, we introduce an angle classification method based on a smooth label to improve the recognition accuracy of angles. Thirdly, an example equalization method based on gradient distribution is proposed to overcome the negative effect of sample quantity imbalance on the classification task. Finally, we propose an RCIoU loss to achieve the precise regression of the rotated bounding box. This framework can be used for high precision detection of rotated objects in remote sensing images, and the structure diagram of our approach is exhibited in Figure 2.

3.1. Network Architecture

We choose CenterNet [16] as our baseline due to its high accuracy and detection speed. This network regards an object as a single point and then regresses the size and location offset of the object, and the detector mainly consists of 2 modules: a feature extraction module and a detection head module.
Deep layer aggregation (DLA) [48] is used to extract effective features from images. CenterNet modifies the DLA, includes adding a skip connection between adjacent layers and replacing general convolution layers with 3 × 3 deformable convolution layers [49] in upsampling stages. Our feature extraction module follows these improvements and finally generates a feature map with 256 channels.
In the heatmap subnet, the input image I is defined as I R W × H × 3 with a width W and a height H , and we downsample the image to generate a feature map with a sampling factor of 4. The detector extracts objects as points and then maps all ground-truth key points onto a heatmap p 0 , 1 W S × H S × C . C indicates the number of classes, while S is the output stride of the network. The heatmap p is expected to be equal to 1 at target centers, and it decreases at adjacent positions in order. The ground truth of the center point is modeled as a 2D Gaussian kernel
p x y c = exp x p ˜ x 2 + y p ˜ y 2 2 σ p 2
where the p ˜ x and p ˜ y are the downsampled object center points and σ p is an object size-adaptive standard deviation [20]. If two Gaussian kernels belong to the same class with an overlap region, the maximum value at each pixel is selected as the standard result.
In the bounding box regression subnet, the object size is expressed as s = ( w , h ) , where w and h are the long side and short side of the box. L1 loss is used to optimize the size prediction. An offset operation is designed to recover the discretization error caused by the downsampling. The offset is also optimized with an L1 loss. Focusing on implementing rotated bounding boxes detection, we add a network branch to regress the rotation angles of the bounding boxes, as illustrated in Figure 2. Compared with an HBB, an OBB is composed of five parameters, and the additional θ indicates the angle between the long side of the box and the horizontal axis.
The illustration of the head network is shown in Figure 3. We use color to distinguish different operations with features. On the basis of the original network, we add an angle extraction branch to obtain the rotated angle information. Thus, the proposed detector can describe the classification, location, scale, aspect ratio, and angle of the object in aerial images.

3.2. Angle Classification Method

Five-parameter regression is a current technology hotspot for rotation target detection, and it has been widely used in different vision tasks [13,43,44,45,46,47]; these detectors have achieved competitive performance. However, the boundary discontinuity problem caused by the period of the angle is a main limiting factor for rotation detection. This problem leads to an increase in the loss value of the angle at the boundary critical point, which impairs the performance and convergence speeds of networks. The boundary problem is illustrated in Figure 4.
The rotated angles of objects are arbitrary in aerial images, and some objects may be displayed at near-vertical angles, as shown by the red box (80°) in Figure 4. When the blue box (−80°) rotates clockwise to match the ground truth box, the angle loss value (L1 loss) actually increases. It is the periodicity of angle that leads to the abnormal increase in loss value during the regression. Therefore, the OBB has to regress in other complex forms, as shown in Figure 4b. To overcome the problem of rotated angle discontinuity, we introduce an angle classification method based on circular smooth labels [50] to eliminate the angle boundary problem and convert the angle regression issue into a classification task. When the target is placed vertically and the prediction values are assumed to be −89° and 89°, the angle losses should theoretically be the same in both cases. The periodic smooth label (PSL) is proposed to implement this solution.
The angle classification method regards each 1 degree interval as a category, so an angle is converted to a sequence with length 180. The window function f ( x ) is proposed to implement the angle conversion and make the distribution of the sequence periodic, monotonic, and symmetric. That is, the label value at the angle index is 1, and the label value decreases gradually on both sides of the center point. In addition, the window function has a periodicity of 180, which coincides with the period of the angle. The mathematical expression of PSL is as follows:
P S L ( θ ) = f ( θ θ 0 )           μ < θ θ 0 < μ 0 otherwise
where P S L ( θ ) [ 0 , 1 ] , θ 0 is the rotated angle of the bounding box, and μ is the radius of the window function. We design three kinds of window functions: a cosine function ( cos ( 2 θ ) + 1 2 ), a Gaussian function ( exp ( θ 2 2 μ 2 ) ), and a triangle function ( θ μ μ ). Take the rotated angle of 90° as an example, the angle classification sequences converted by three window functions are shown in Figure 5. The maximum value of the sequence is equal to 1, which appears at 90°, and centered on it, the label values on the left and right sides are decreasing in order. The values of the sequence are symmetric about the center point; that is, the label values at the 80° and −80° are equal. As can be seen from the figure, the boundary discontinuity of angle is eliminated due to the periodicity and symmetry of the window function.

3.3. Dynamic Gradient Adjustment

In the center point detection module, only the center points are positive samples, and all the other points are negative samples. To handle the sample imbalance issue, the training objective of the CenterNet [16] is a penalty-reduced piecewise logistic regression with a variant focal loss [20].
L c ( p ) = 1 N ( 1 p ) α log ( p )       if   p = 1 ( 1 p ) β p α log ( 1 p ) otherwise  
where P 0 , 1 denotes the ground-truth label for a certain class and p [ 0 , 1 ] is the probability predicted by the detector, while α and β are hyperparameters of the variant focal loss. N is the number of center points in an image, which is used for normalization.
A large number of hard examples are distributed in aerial images due to changes in complex scenes, such as illumination, shadow, sheltering, and haze. A certain number of indistinguishable examples exist stably even after the network converges. These extremely hard examples can affect the stability of the model, since their gradients may have large discrepancies. However, the variant focal loss defines a static ratio coefficient to pay attention to hard examples during training, and it does not adopt a changing data distribution. This region is focused on classification in anchor-free object detection, where the classes (foreground and background) of examples, as well as easy and hard examples, are quite imbalanced. Concerning this issue, we design a dynamic gradient adjustment (DGA) method to inhibit these two disharmonies based on focal loss and the gradient harmony mechanism (GHM) [19]. We introduce the gradient norm g to represent the attribute of an example, and it is defined as follows:
g = p p = 1 p if   p = 1 p     if   p 1
g is the bias between the ground truth and predicted value, and it indicates the example’s impact on the global gradient. The larger the value of g is, the more difficult the sample is to identify. A converged network still cannot solve some extremely hard examples that can be regarded as singularities. We need to reduce the weights of these singularities in the loss function, so we design a gradient density function as follows:
G D ( g ) = 1 l ε ( g ) k = 1 N δ ε ( g k , g )
g k is the gradient norm of the k-th example, and δ ε ( g k , g ) is used to indicate whether g k belongs to a certain interval ( g ε 2 , g + ε 2 ) . l ε ( g ) indicates the number of global examples. Gradient density stands for the ratio of the number of examples within a certain range to the number of global examples. The value of G D ( g ) changes with the training epoch. Finally, we propose a DGA function to effectively harmonize the problem of sample imbalance.
L D G A = γ ( 1 p ) α log ( p ) G D ( g )   if   p = 1 ( 1 γ ) ( 1 p ) β p α log ( 1 p ) G D ( g )     if   p 1  
where γ is used to harmonize the sample size. The recognition accuracy is best when the value of this parameter is 0.25. In addition, we empirically design α = 2 and β = 4 in all our experiments, as in the baseline network.
In addition, a periodic smooth label is used to settle the boundary discontinuous problem of angles. This method transforms angle regression into a classification task, so we need to design an effective loss function for angle classification. There is also an imbalance in the number of positive and negative angle samples in the training stage, and some rotation angles are hard to distinguish. In order to improve the accuracy of angle recognition, we propose the dynamic gradient adjustment of angles (DGAA) instead of LE function. The loss function is defined in Equation (7).
L D G A A = γ ( 1 y ) α log ( y ) G D ( g a n g ) i f   y = 1 ( 1 γ ) y α log ( 1 y ) G D ( g a n g )   i f   y 1  
where y is the ground-truth of the labeled angle, and y is the predicted value. g a n g is the gradient norm of an angle.

3.4. United Regression Function for Rotated Bounding Box

In order to better respond to evaluation metrics and improve the convergence rate of the model, we propose a united regression function for the rated bounding box based on CIoU [22]. The RCIoU is defined as follows:
L RCIoU = 1 RIoU + ρ 2 ( b p r e d , b g t ) c 2 + κ ν κ = ν ( 1 RIoU ) + ν ν = 4 π 2 ( arctan w g t h g t arctan w h ) 2
where RIoU denotes the IoU of the rotated bounding box, ρ ( ) is the distance between the center points of two OBBs, and c is the diagonal distance of the smallest enclosing rectangle. ν relates to the aspect ratios of OBBs. This method is more intuitive and effective than independent regression of distribution parameters. Therefore, the overall training objective of our detector is expressed as follows:
L = λ 1 N n = 1 N L D G A + λ 2 N n = 1 N L D G A A + λ 3 N n = 1 N L R C I o U
where N denotes the number of candidate boxes, λ 1 , λ 2 , and λ 3 are hyper-parameters to adjust the weights of different modules.

4. Experiment and Discussion

We perform a series of ablation experiments to verify the validity of the designed network in aerial images. First, we introduce the datasets for experimentation and the metrics for evaluating the performance of the detector. Second, multiple sets of comparative experiments are performed to verify the impacts of the proposed modules on performance, and we carry out a detailed comparative analysis. Finally, we compare the proposed method with published advanced approaches on public datasets. The numeral results indicate that our detector is a competitive paradigm in terms of object identification.

4.1. Datasets

UCAS-AOD: We conduct ablation experiments on the UCAS-AOD dataset [51], which contains two categories: cars and planes. All remote images are taken from aerial and satellite platforms. The dataset contains 1510 images with 14,596 items annotated by HBBs and OBBs. Among them, the car dataset is composed of 510 images, and the plane dataset is composed of 1000 images. The dataset is randomly divided into a training set and a test set, and the proportion of the former is 80%. The input images are cropped into 512 × 512 during the training process.
DOTA: The DOTA dataset [52] consists of 15 kinds of categories: plane (PL), baseball diamond (BD), ship (SH), tennis court (TC), storage tank (ST), bridge (BR), basketball court (BC), ground field track (GTF), harbor (HA), small vehicle (SV), large vehicle (LV), roundabout (RA), helicopter (HC), swimming pool (SP), and soccer ball field (SBF). It contains 2806 images obtained from different scenes and includes 188,282 instances in total. The size of the image ranges from about 800 × 800 to 4000 × 4000 pixels and contains a large number of objects with diverse orientations and sizes. We divide these images into 500 × 500 with an overlap of 200 pixels. We obtain about 20,000 subimages for training and 7000 subimages for validation after the cropping operation.
HRSC2016: Ship detection in aerial images is widely applied in many scenarios. The HRSC2016 dataset [53] contains 1070 remote sensing images with ships in various backgrounds, and the images are all collected from the internet (Google Earth). The ships in the dataset have large aspect ratios, and their angles are randomly distributed. The training dataset is composed of 626 images, while the test set contains 444 images with 1228 ship samples. The resolutions of the images range from 2 to 0.4 m. The test set is used to measure the detector.

4.2. Evaluation Metrics

We select two common metrics to measure the accuracy of the tested networks: mean average precision (mAP) and mean recall (mRecall). In addition, we use the error of angle (EoA) to describe the accuracy of the angle recognition results. The evaluation methods [12] are described as follows.
  • IoU: This parametric measure is applied to describe the matching degree between the predicted box and ground-truth box, and they are considered to be matched if their IoU is greater than the threshold. A true positive (TP) indicates that there is a ground-truth box to match this prediction; otherwise, the predicted sample is marked as a false positive (FP). A false negative (FN) indicates that a ground-truth box is not matched by any predicted box. The precision can be calculated by TP TP + FP , while the recall is defined as TP TP + FN .
  • mAP: Average precision (AP) is used to characterize the accuracy of a single category, and it is calculated by the mean value of precision under a series of recall values. The mAP denotes the average value across all categories. Furthermore, the mRecall is the mean recall value for all classes. mAP50 means that the results are computed when the IoU threshold is 0.5, and mAP75 indicates that the threshold is set to 0.75. We compute the mRecall at the IoU threshold of 0.5 to evaluate the recall performance of the detector.
  • EoA: To evaluate the angle prediction performance of the model for rotated objects, we define the EoA to quantitatively describe the deviation between the predicted angle and the ground truth. We adopt the mean absolute error to measure the deviation, and EoA is defined as EoA = 1 N min ( θ p θ g ,   180 θ p θ g ) , N is the number of predicted boxes that meet the IoU requirement (larger than 0.5), θ p indicates the predicted angle, and θ g indicates the ground truth angle.

4.3. Ablation Experiments

In this subsection, we present comparative results to demonstrate the validity of our method. All networks are implemented on our laptop with an Intel single-core i7-9750H CPU and an NVIDIA RTX 2070 GPU (8 GB of memory). The software version of our platform is Python 3.6, PyTorch 1.2.0, CUDA10.0, and CUDNN 7.6.1. The model crops the input image randomly to 512 × 512; then, it downsamples to generate a 128 × 128 × 3 feature map. The initial learning rate of the model is set to 1.25 × 10⁻⁴, and it will be reduced to 1.25 × 10⁻⁵ after 50 epochs. During the training process, our detector will randomly flip the input image. In the test session, the image maintains its original size without cropping.

4.3.1. Angle Branch Evaluation

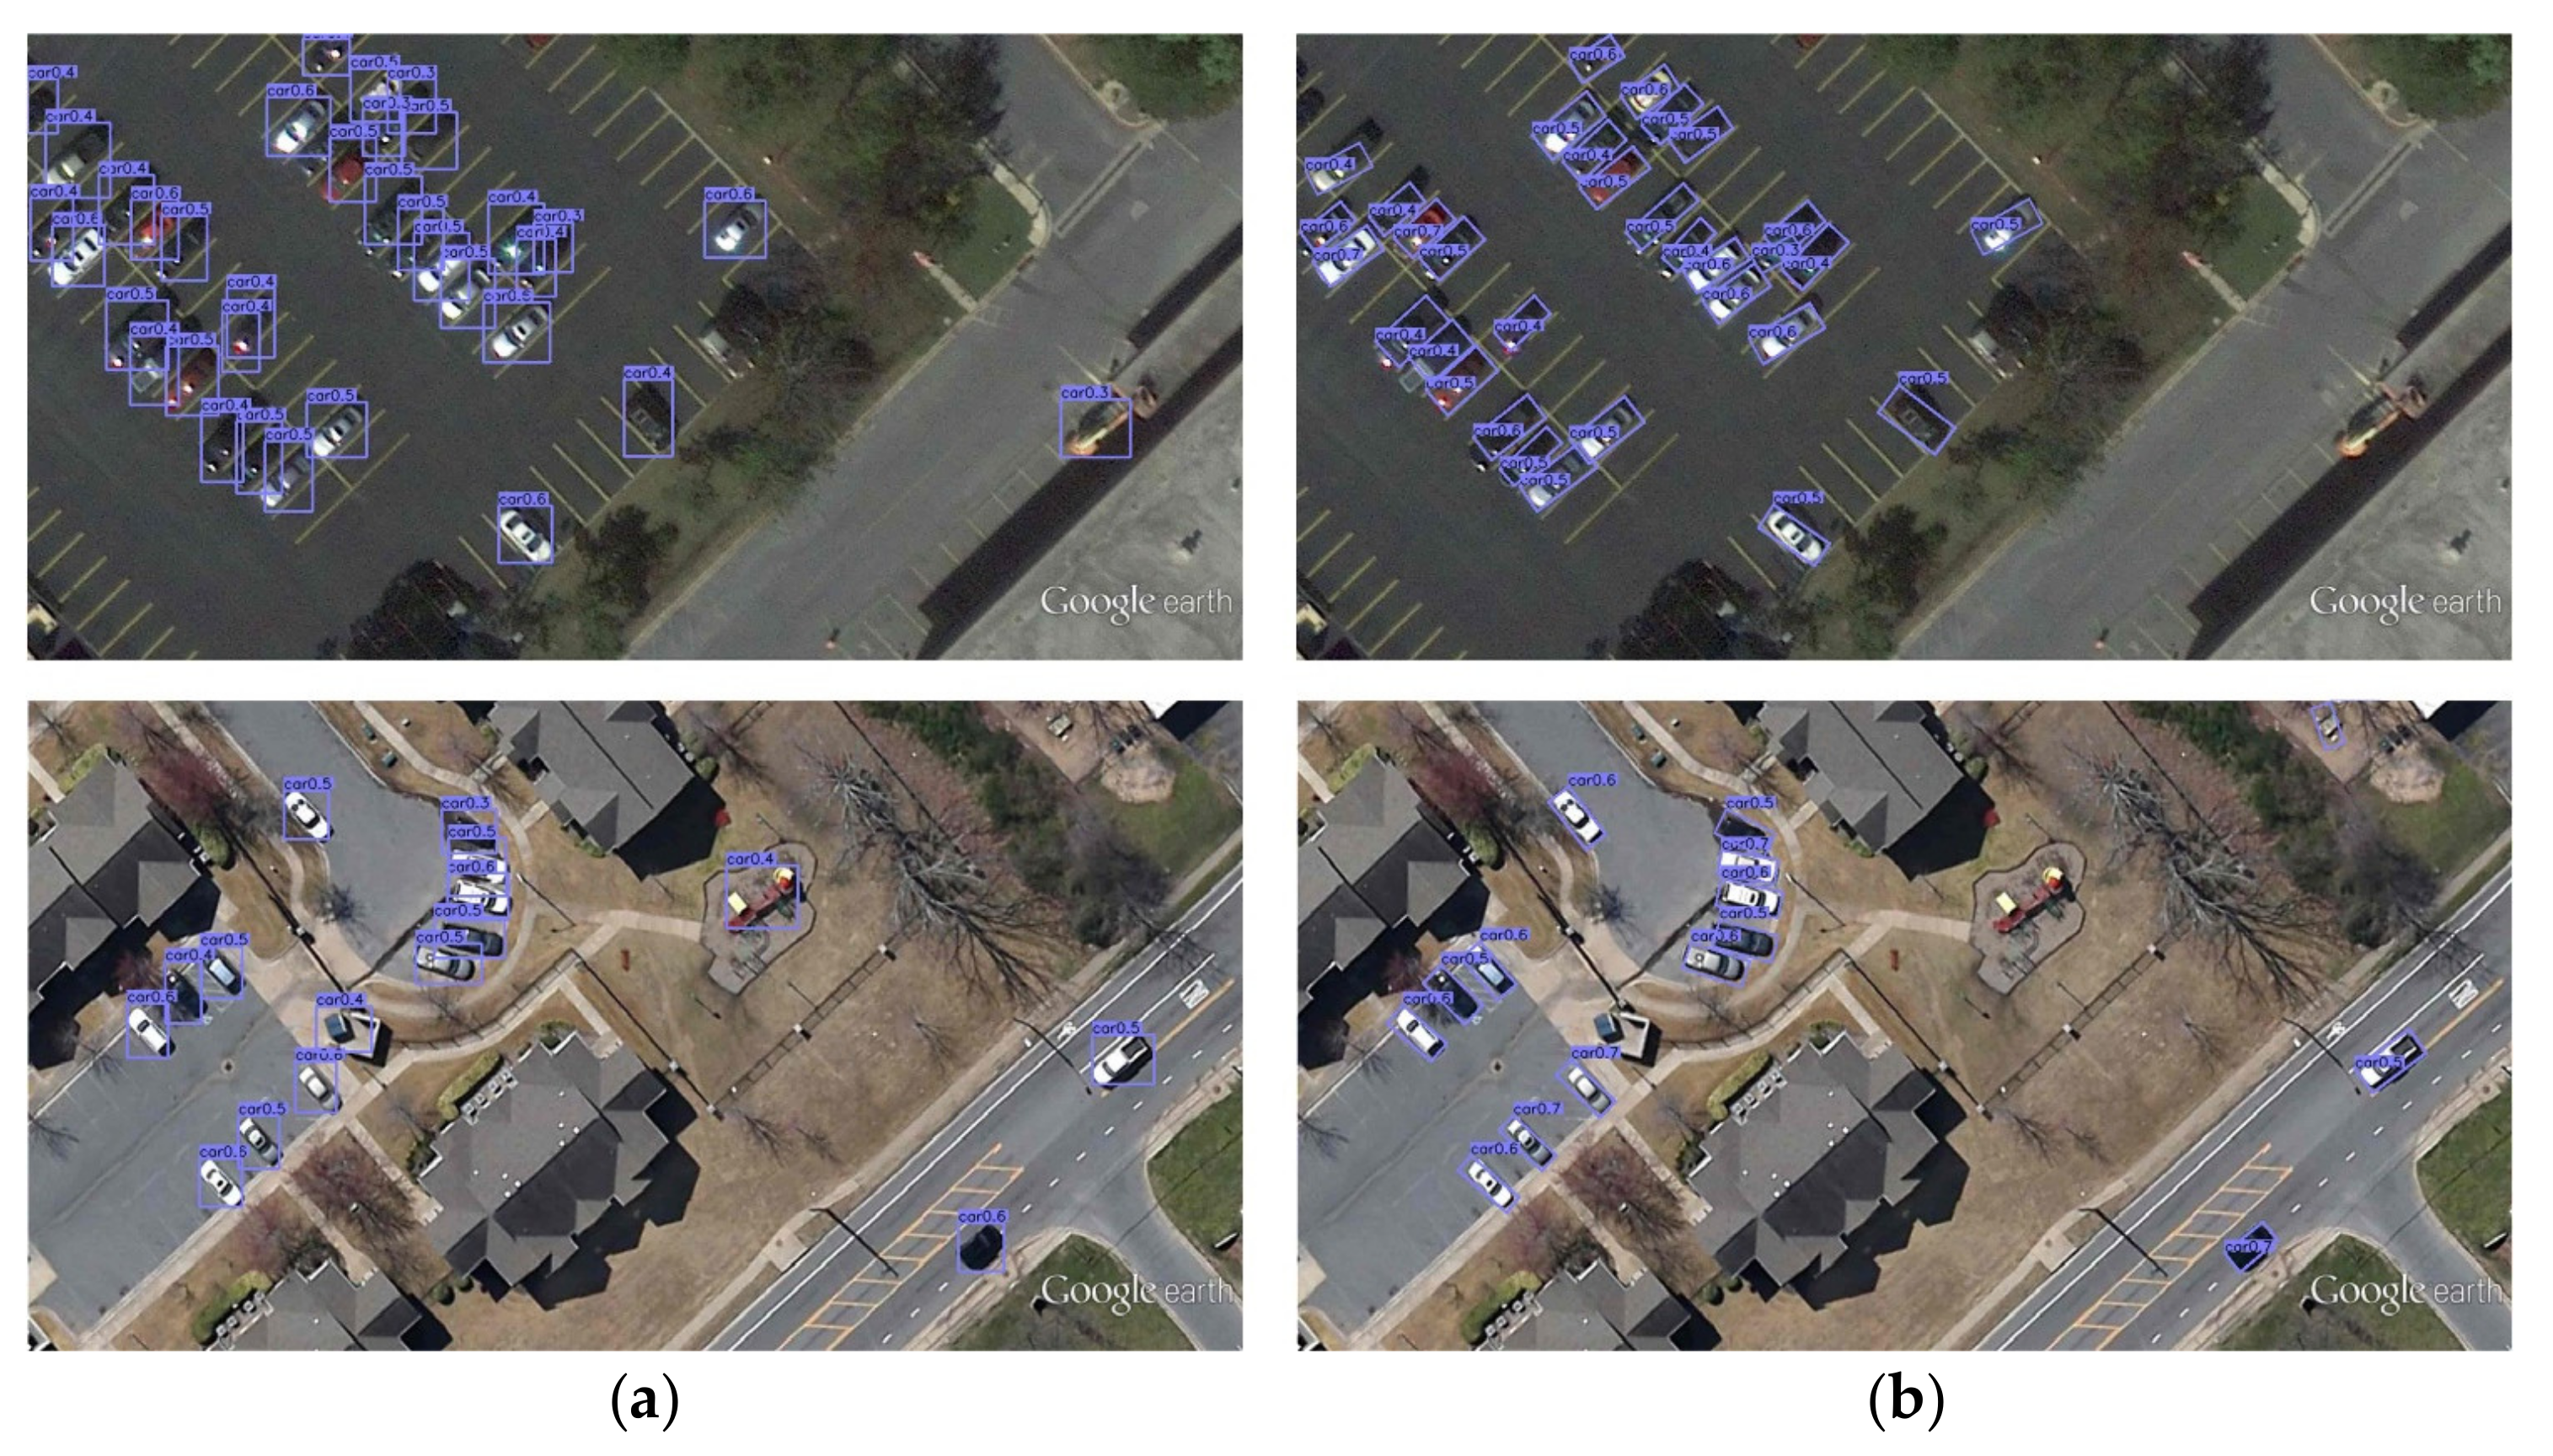
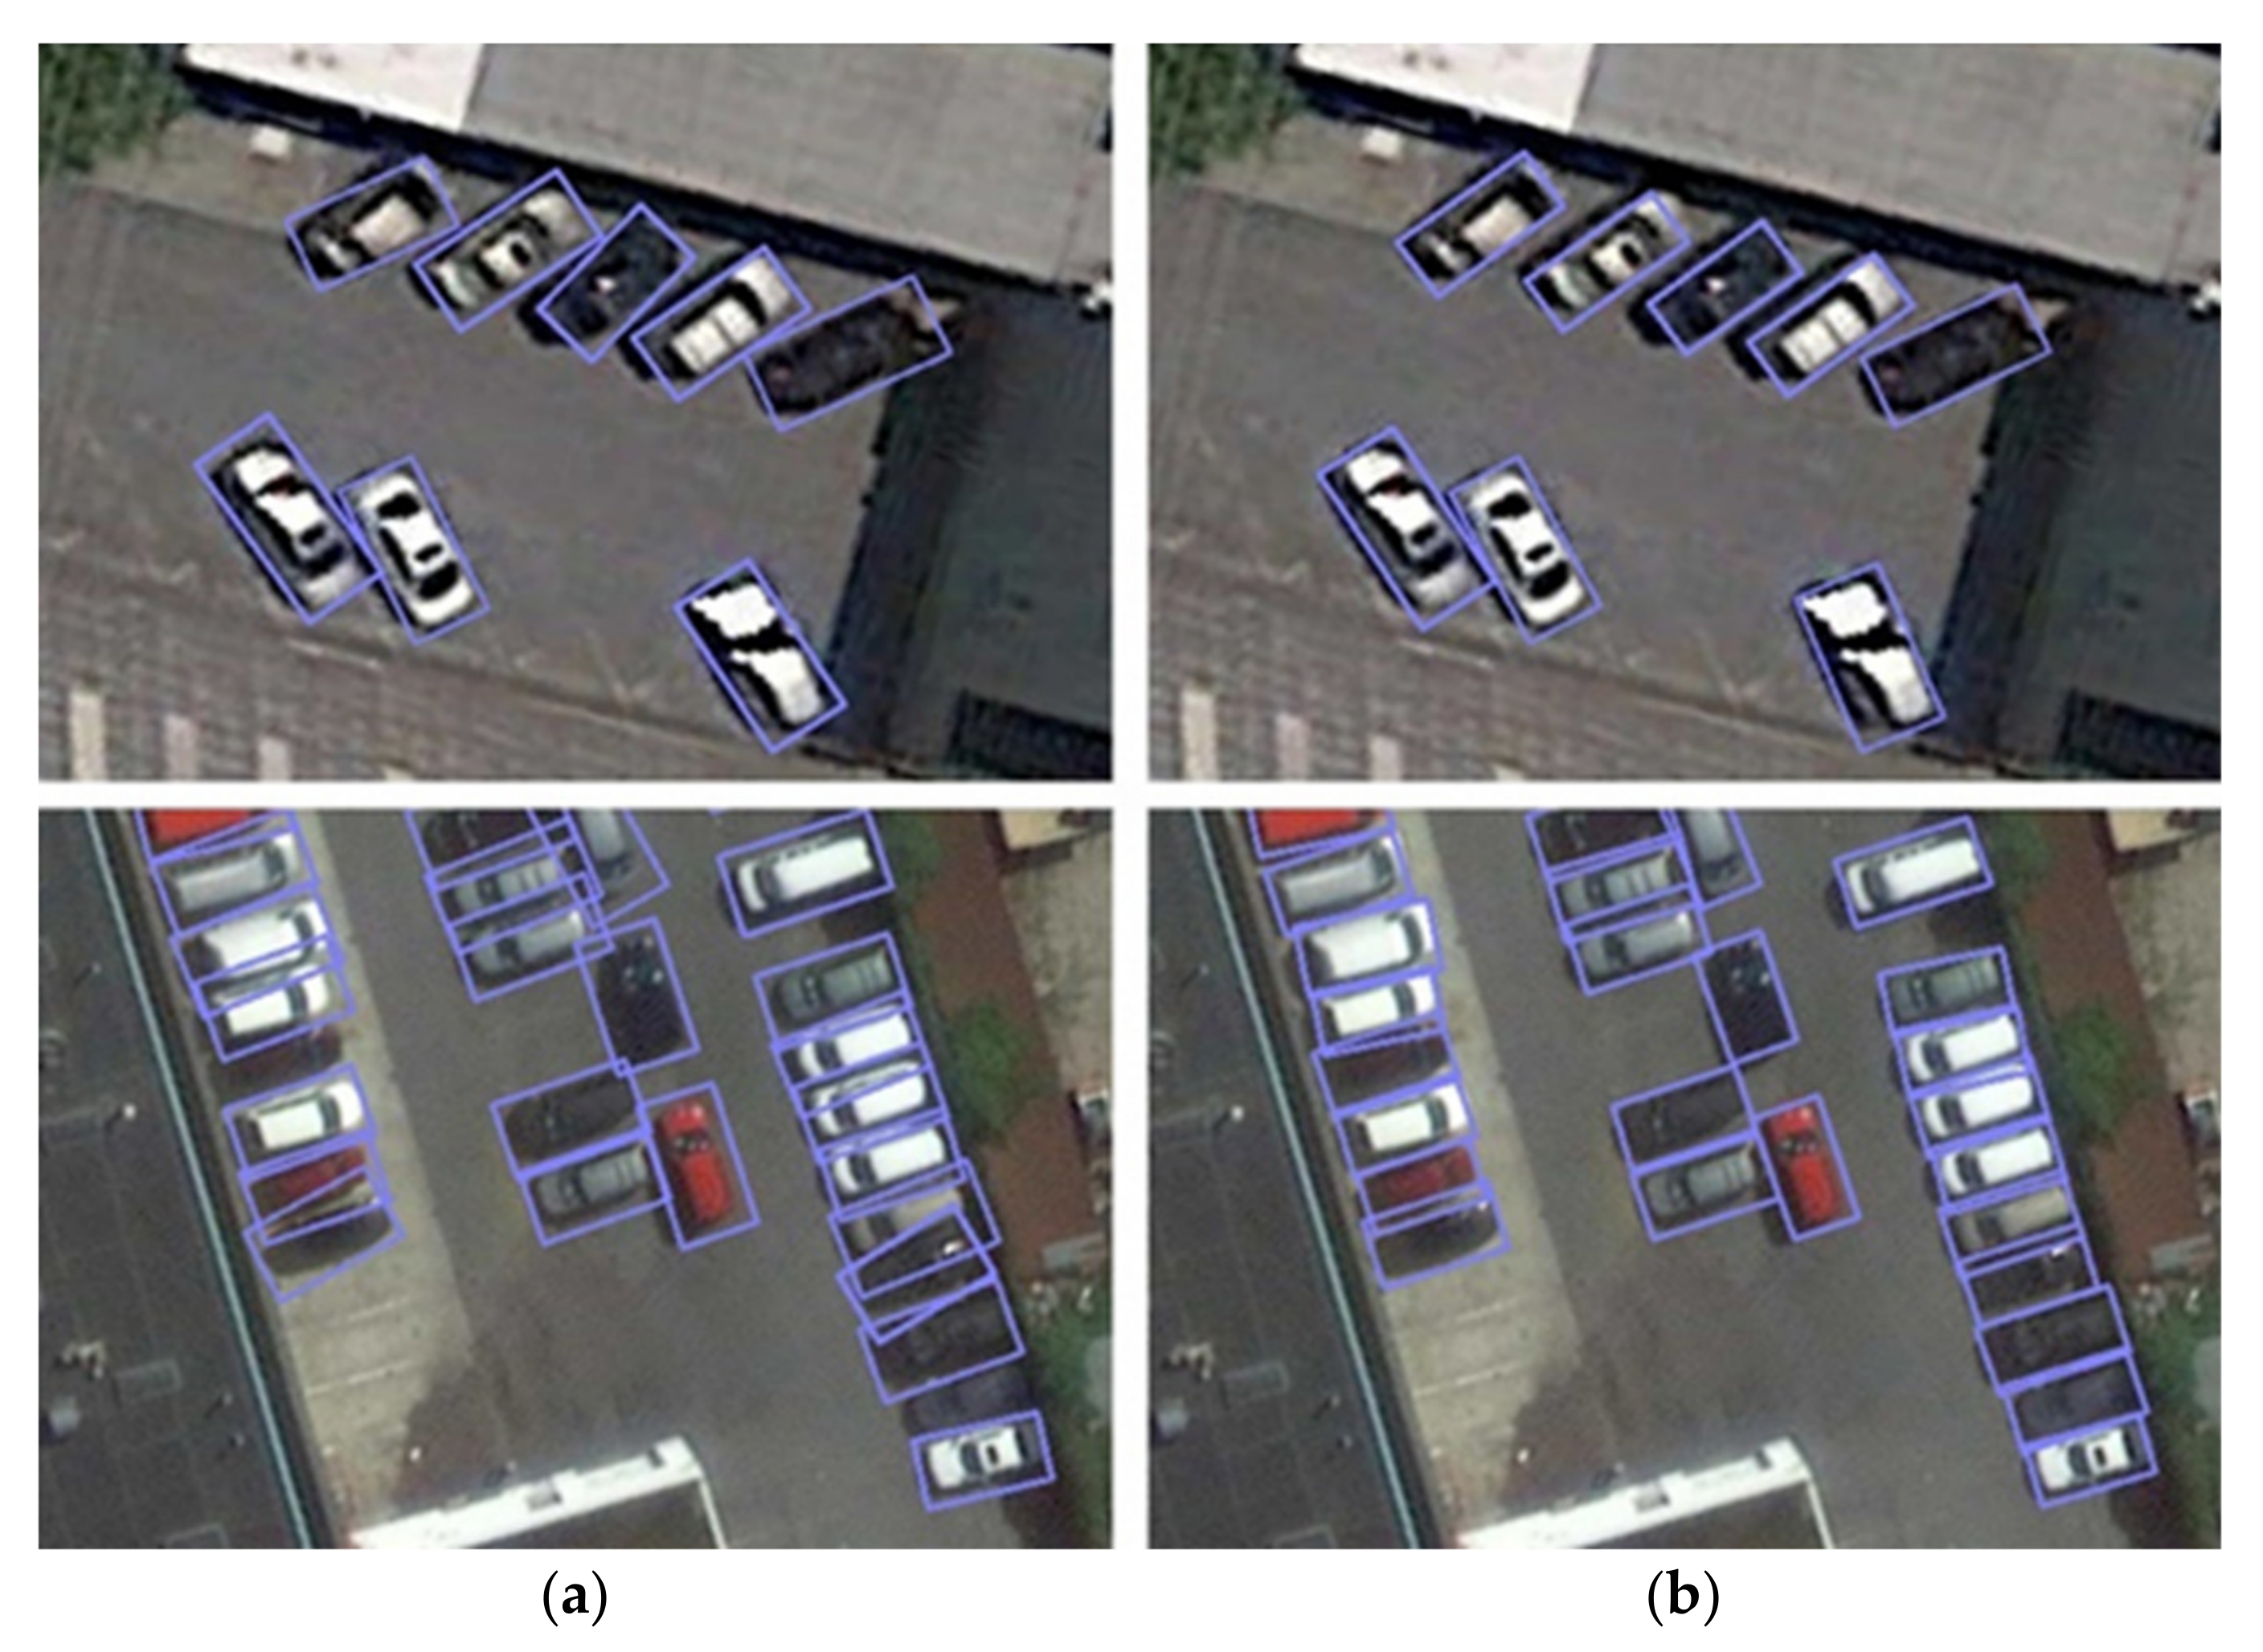
We conduct a series of comparison experiments on the UCAS-AOD dataset to verify the effectiveness of our method. On the basis of the original network, we add an angle prediction branch to realize the detection of rotating targets in aerial images. A comparison of the results between horizontal detection and rotation detection for vehicles is shown in Figure 6, and the quantitative comparison results are listed in the first and fourth rows of Table 1.
By comparing the detection results between HBB detection and OBB detection, we can see that rotated detection allows for the effective distinction of dense objects and the number of background pixels in the bounding box is significantly reduced than HBB. However, the accuracy of the model slightly decreases, and some of the predicted boxes have significant offsets. The results show that the accuracy of angle prediction is unsatisfactory, with a mean deviation of 14.7°. The model performance needs to be further improved.

4.3.2. Evaluation of DGA

Focal loss acts as the center point loss function in the baseline framework, but the sample imbalance problem cannot be effectively harmonized. DGA is proposed to improve the detection performance of our network. We conduct many experiments to determine the optimal loss function for target identification, and the HBB and OBB detection results are listed in Table 1. In accordance with the comparison results, the experiments demonstrate that the DGA method can suppress the angle deviation and improve the model detection accuracy. The mAP of horizontal detection increases by 2.4%, while that of rotary detection increases by 1.0%. In addition, the EoA decreases from 14.72° to 13.01°. These results confirm the validity of the GHM method in complex backgrounds.

4.3.3. Evaluation of PSL

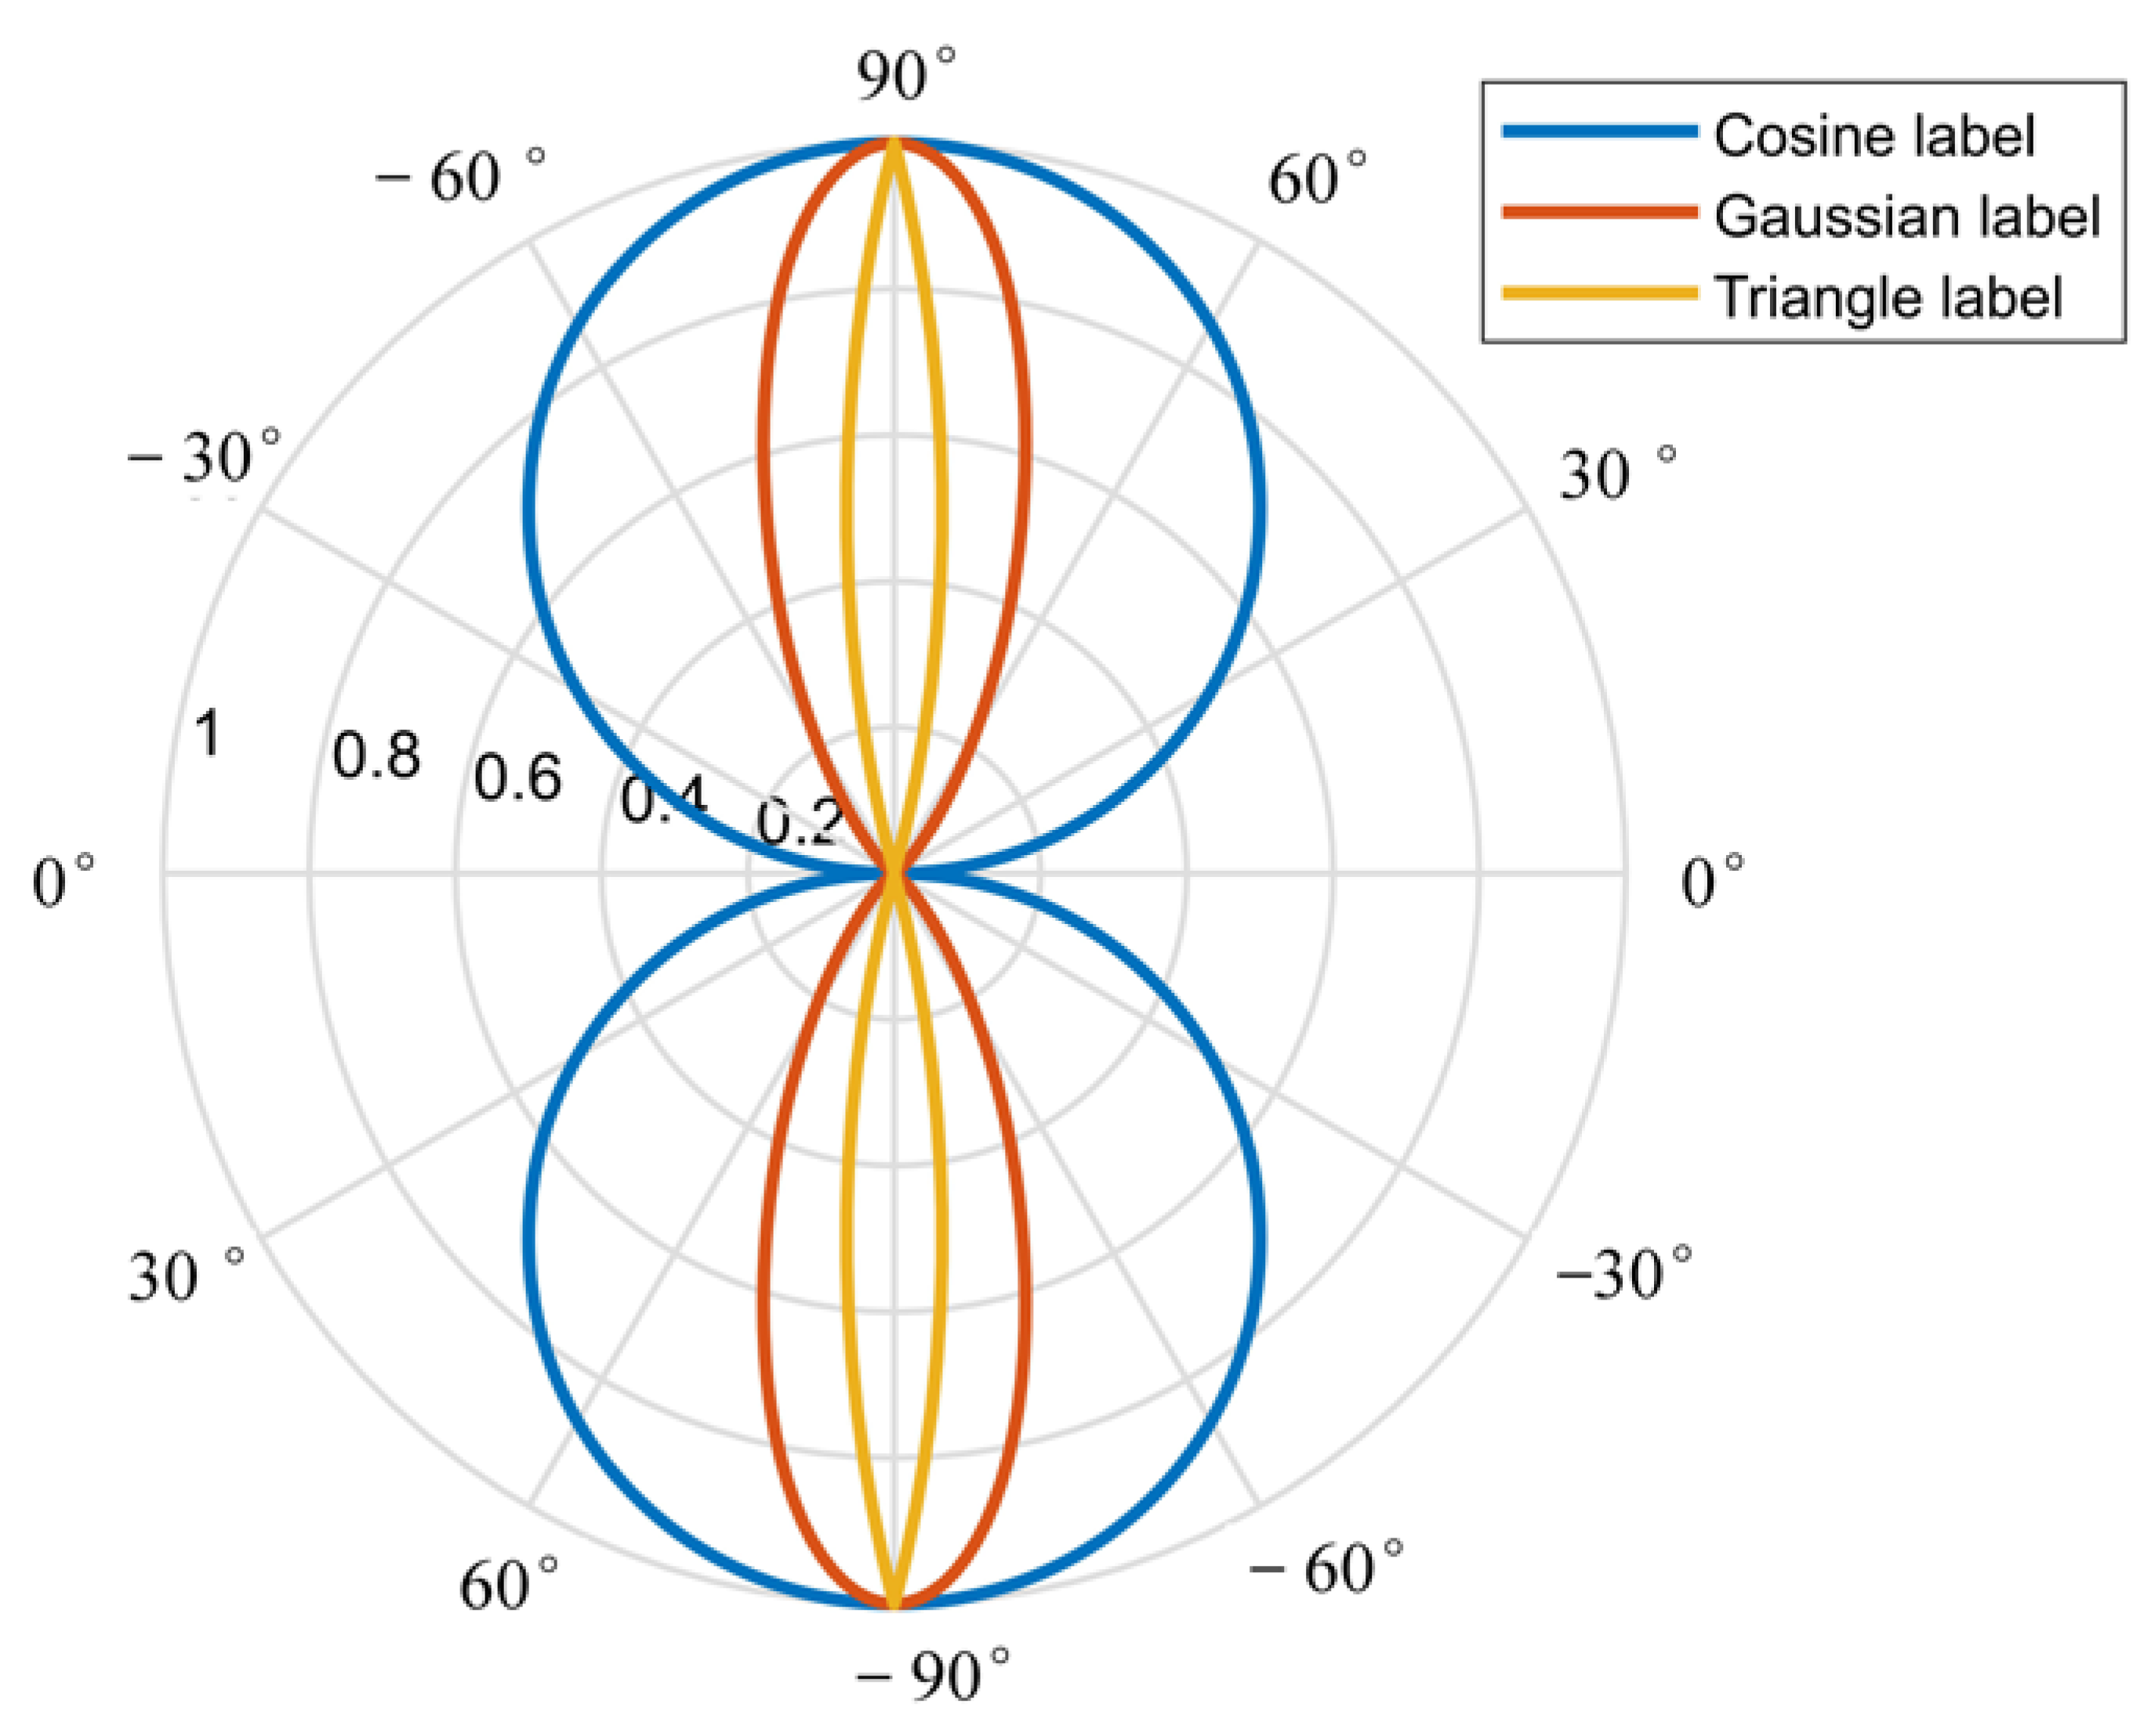
We also evaluate the proposed periodic smooth label module on the UCAS-AOD dataset. The differences among the three window functions are revealed in Table 2. An inspection of the data indicates that the proposed PSL module can effectively improve the ability of the network to identify objects’ rotation angles.
A closer observation indicates that the Gaussian window function performs best, while the triangle function is the worst. Compared with the baseline network, the detector with the DGA and PSL modules improves the mAP by approximately 3% to 0.956, and the angle recognition error is effectively suppressed and reduced by 56%. Figure 7 shows the partial prediction results of the three window functions. The prediction result of the Gaussian window function is closer to the ground truth than the results of the other two functions.
Aiming at further improving the accuracy of angle recognition, we optimize the loss function of the angle recognition network. The results of an experimental comparison are presented in Table 3. We apply the DGA strategy to the angle regression branch to improve the learning efficiency of the network. The DGAA method achieves the highest mAP (96.4%), which is a 0.8% improvement over that of the L1 method. In addition, the angle recognition accuracy of the detector is significantly improved, the EoA is reduced from 5.71° to 3.17°, and the performance is improved by 44.5%.

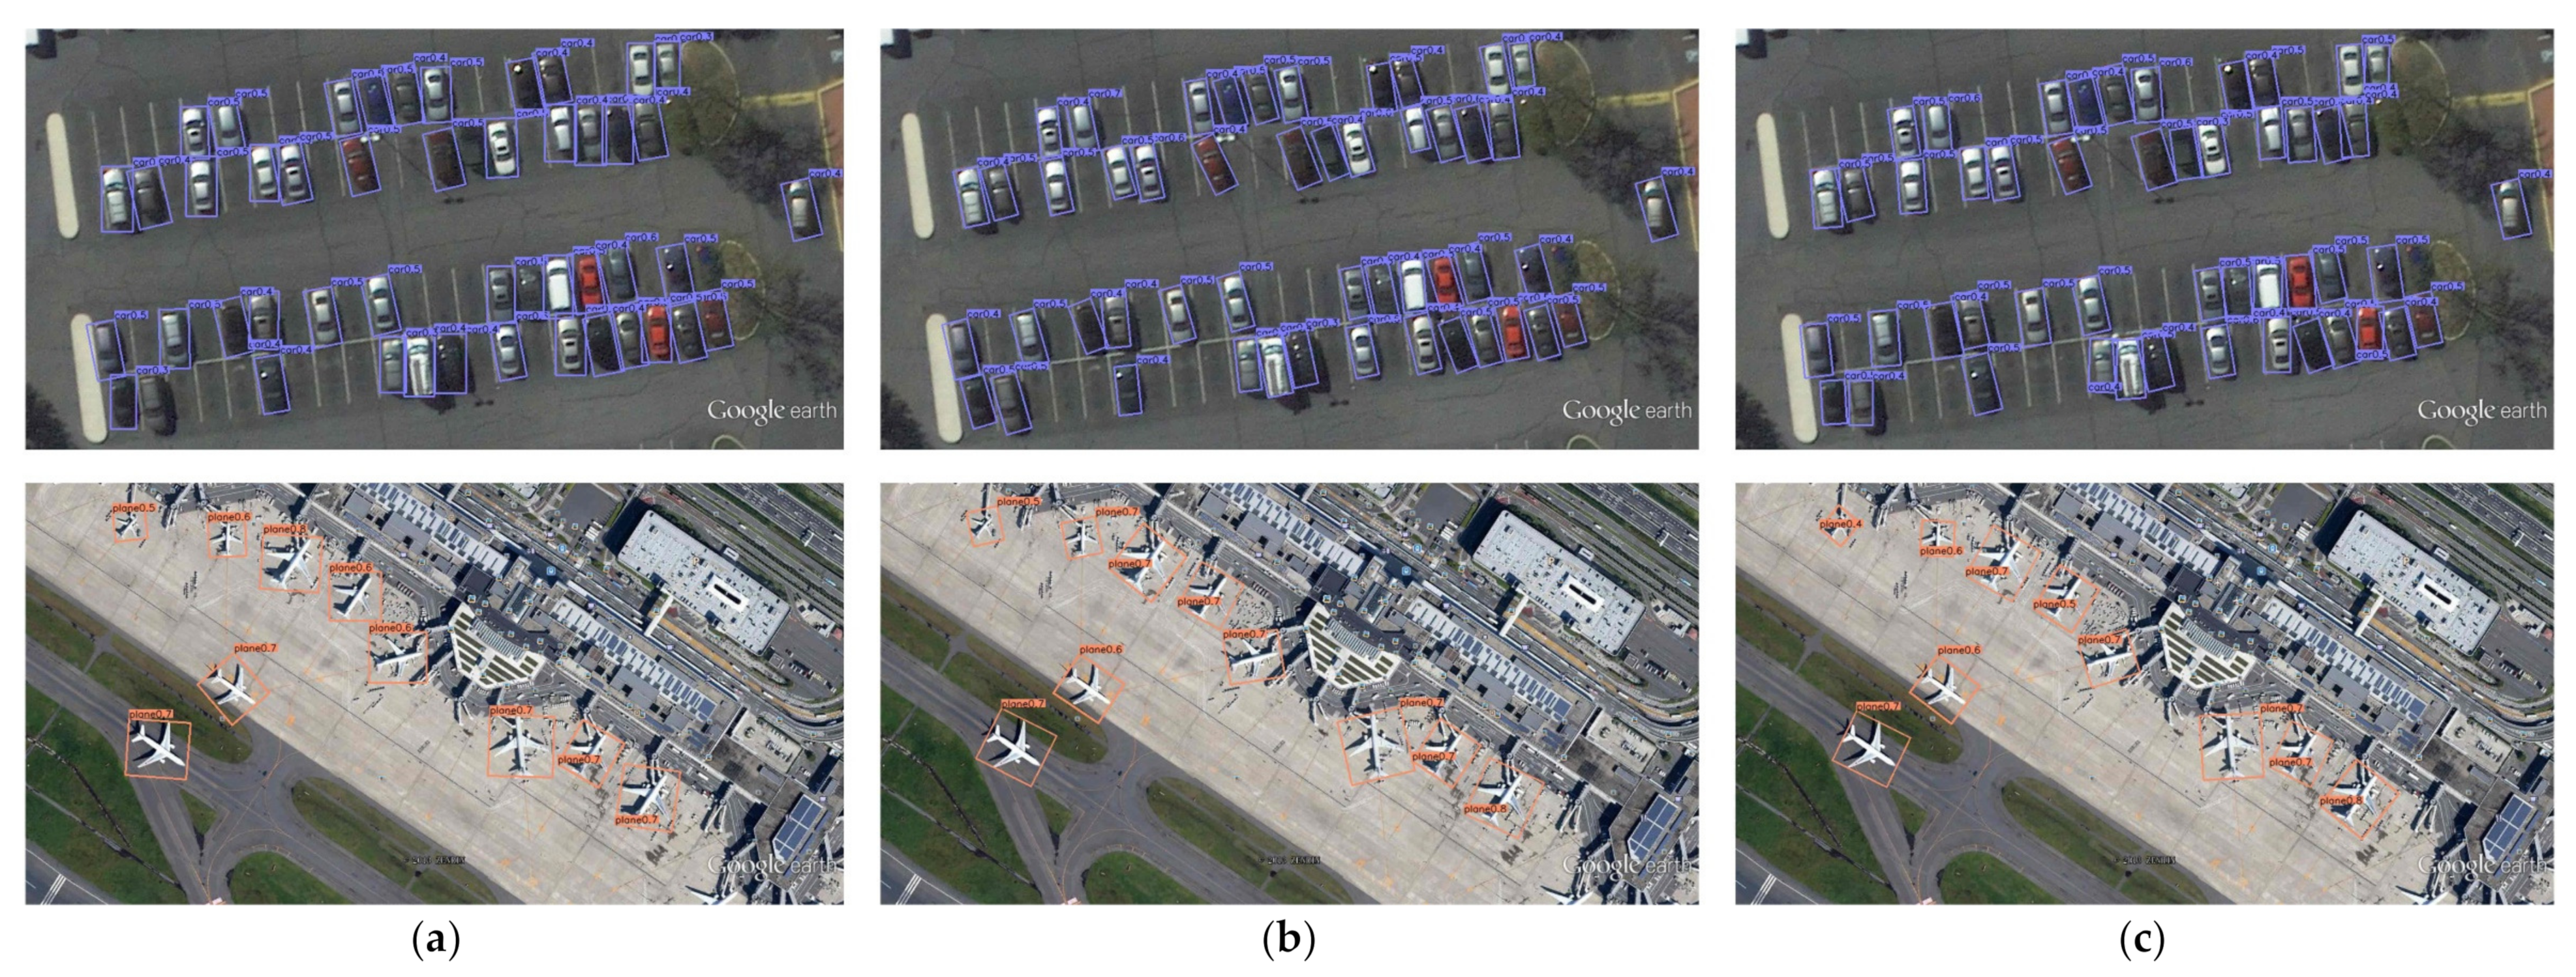
4.3.4. Evaluation of United Regression

The RCIoU function realizes the united regression of distribution parameters, making it easier and faster for the detector to converge to the optimal value. The new loss improves the accuracy to 0.969, and the EoA is further suppressed to 2.96° with a 6.6% improvement. This method increases the mAP75 from 0.513 to 0.530, which shows that the coincidence degree of predicted OBB and true OBB is obviously improved. Figure 8 exhibits the detection results before and after adding the RCIoU loss function.
As can be seen from the figure, the bounding box envelops the object more compactly after adding the RCIoU loss. RCIoU loss further improves the prediction accuracy of the angle. The predicted bounding boxes of this method are closer to the ground truth, which also confirms the significant improvement in mAP75.
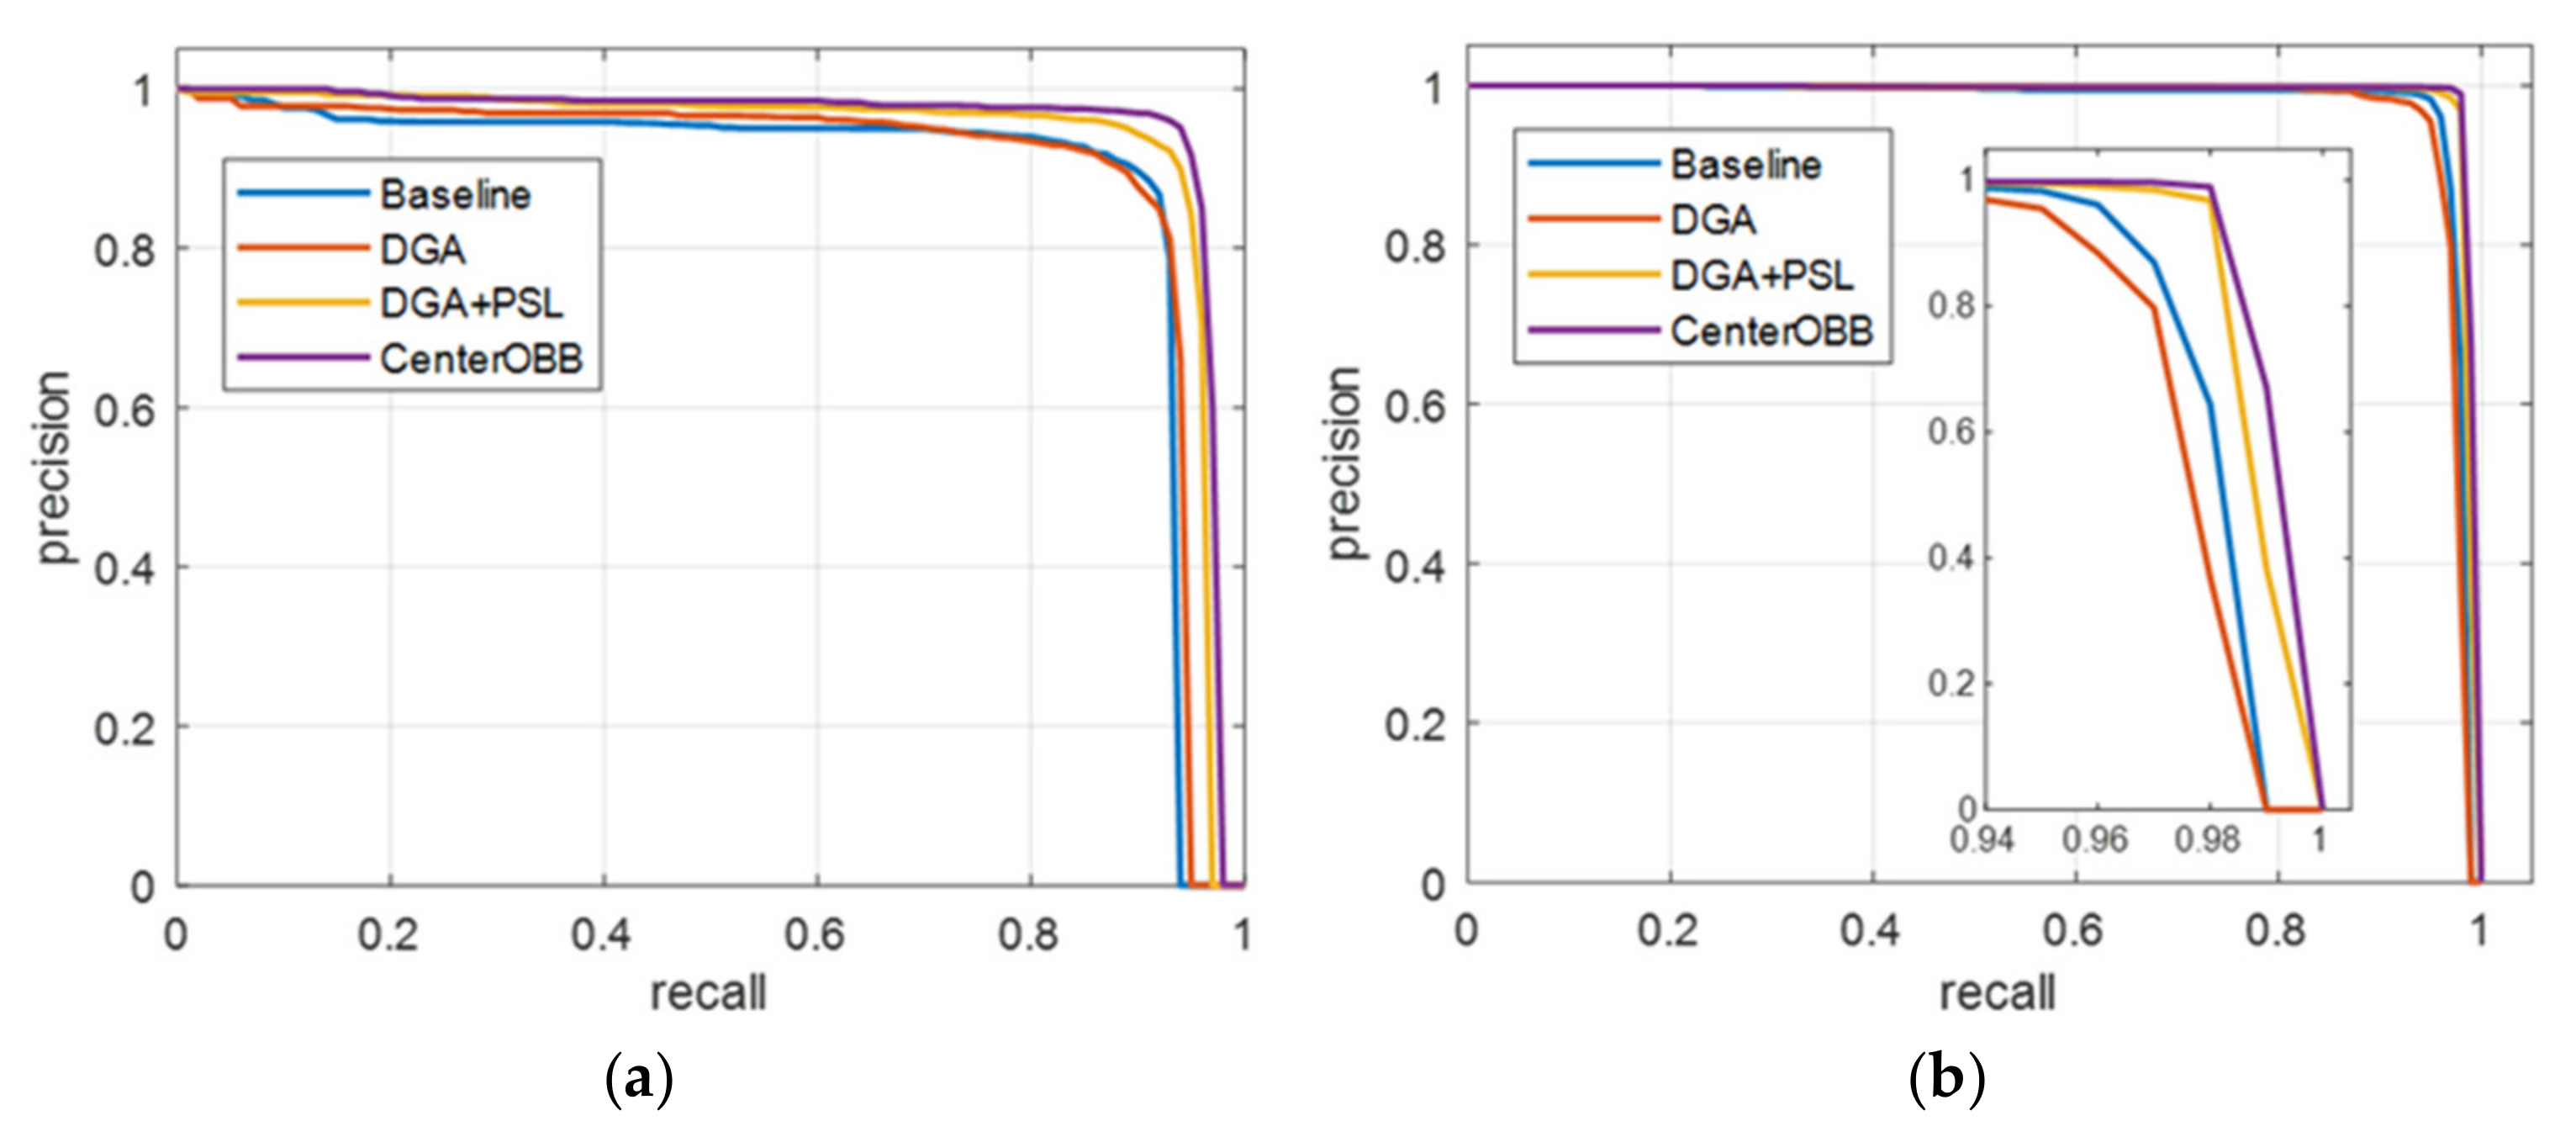
In addition, we plot the PR curves of models with different improvements, and the results are illustrated in Figure 9.
CenterOBB in Figure 9 represents the combination of improvements DGA, PSL, and RCIoU loss. The results of the PR curve also prove the effectiveness of our improvement modules. In the UCAS-AOD dataset, car samples are more difficult to identify than aircraft samples due to their small size and complex background. It can be seen that our approach improves the recognition of cars more significantly.

4.4. Comparison with Other Popular Frameworks

The baseline model achieves great success in object detection when using a horizontal box, and we design the DGA mechanism to further enhance the performance of the model. When the PSL, DGAA, and RCIoU are applied to rotation angle detection, a substantial improvement is still achieved, which confirms the effectiveness of our method. In the following, contrast tests with other representative frameworks are conducted on different datasets.
Results for UCAS-AOD. We enumerate the detection results obtained by our detector and other published methods on the UCAS-AOD dataset in Table 4. In terms of HBB detection, we achieve an mAP of 0.966, outperforming the baseline model by 2.4%. In addition, we embed an angle classification branch into our approach, and OBB detection also achieves SOTA performance. The AP for the car and plane categories reaches 0.952 and 0.987, respectively. The mAP reaches 0.969, which is the best result among those of the published models.
Figure 10 shows some visualization of detection results among several typical rotated detection methods. The comparison detectors we have chosen include RoI-Trans, FPN-CSL, R3Det-GWD, and our approach, and the first column is the ground truth. The first picture contains a car instance partially obscured by trees and two samples of the car close to the background color. All the other methods have missed alarms, while our approach accurately identifies all instances. The second picture reflects the scene where objects are dense and cluttered parked. There are two missed instances and a false prediction for RoI-Trans. The angle recognition performances of RoI-Trans and FPN-CSL are reduced. R3Det-GWD performs well in angle detection, but it misses a car instance in the shadow. The prediction of our model is closest to the ground truth. The third image of Figure 10 is for plane detection in an airport environment. FPN-CSL misses a plane, while RoI-Trans and R3Det-GWD have inaccurate predictions. R3Det-GWD is insensitive to the angles of near-square targets, resulting in a large deviation in the angle prediction of plane instances.
The performance of the four models is listed in Table 5. We also give the performance of these four detectors with an IoU threshold of 0.75 (mAP75). RoI-trans transforms a horizontal region of interest (RoI) into a rotated one, but it suffers from the problem of angle discontinuity. R3Det-GWD adopts the rotated Gaussian function to describe the object distribution, which overcomes the problem of angular discontinuity, but when the target is a square. However, when the object is a square, its Gaussian distribution will correspond to multiple rotated bounding boxes. This leads to an unsatisfactory accuracy on mAP75. FPN-CSL adopts the angle classification method, which performs well with an EoA of 3.42°. Our method suppresses both the angular boundary problem and the sample quantity imbalance problem; its mAP75 reaches 0.53 and the EoA is limited to 2.96°. Experimental results verify the validity of our approach.
Results for DOTA. We compare our approach with other state-of-the-art detectors for the OBB detection on the DOTA dataset. The comparison result is listed in Table 6; our anchor-free detector with DLA-34 obtains a precision of 0.7785. Our method achieves the best performance overall compared to the other methods. 
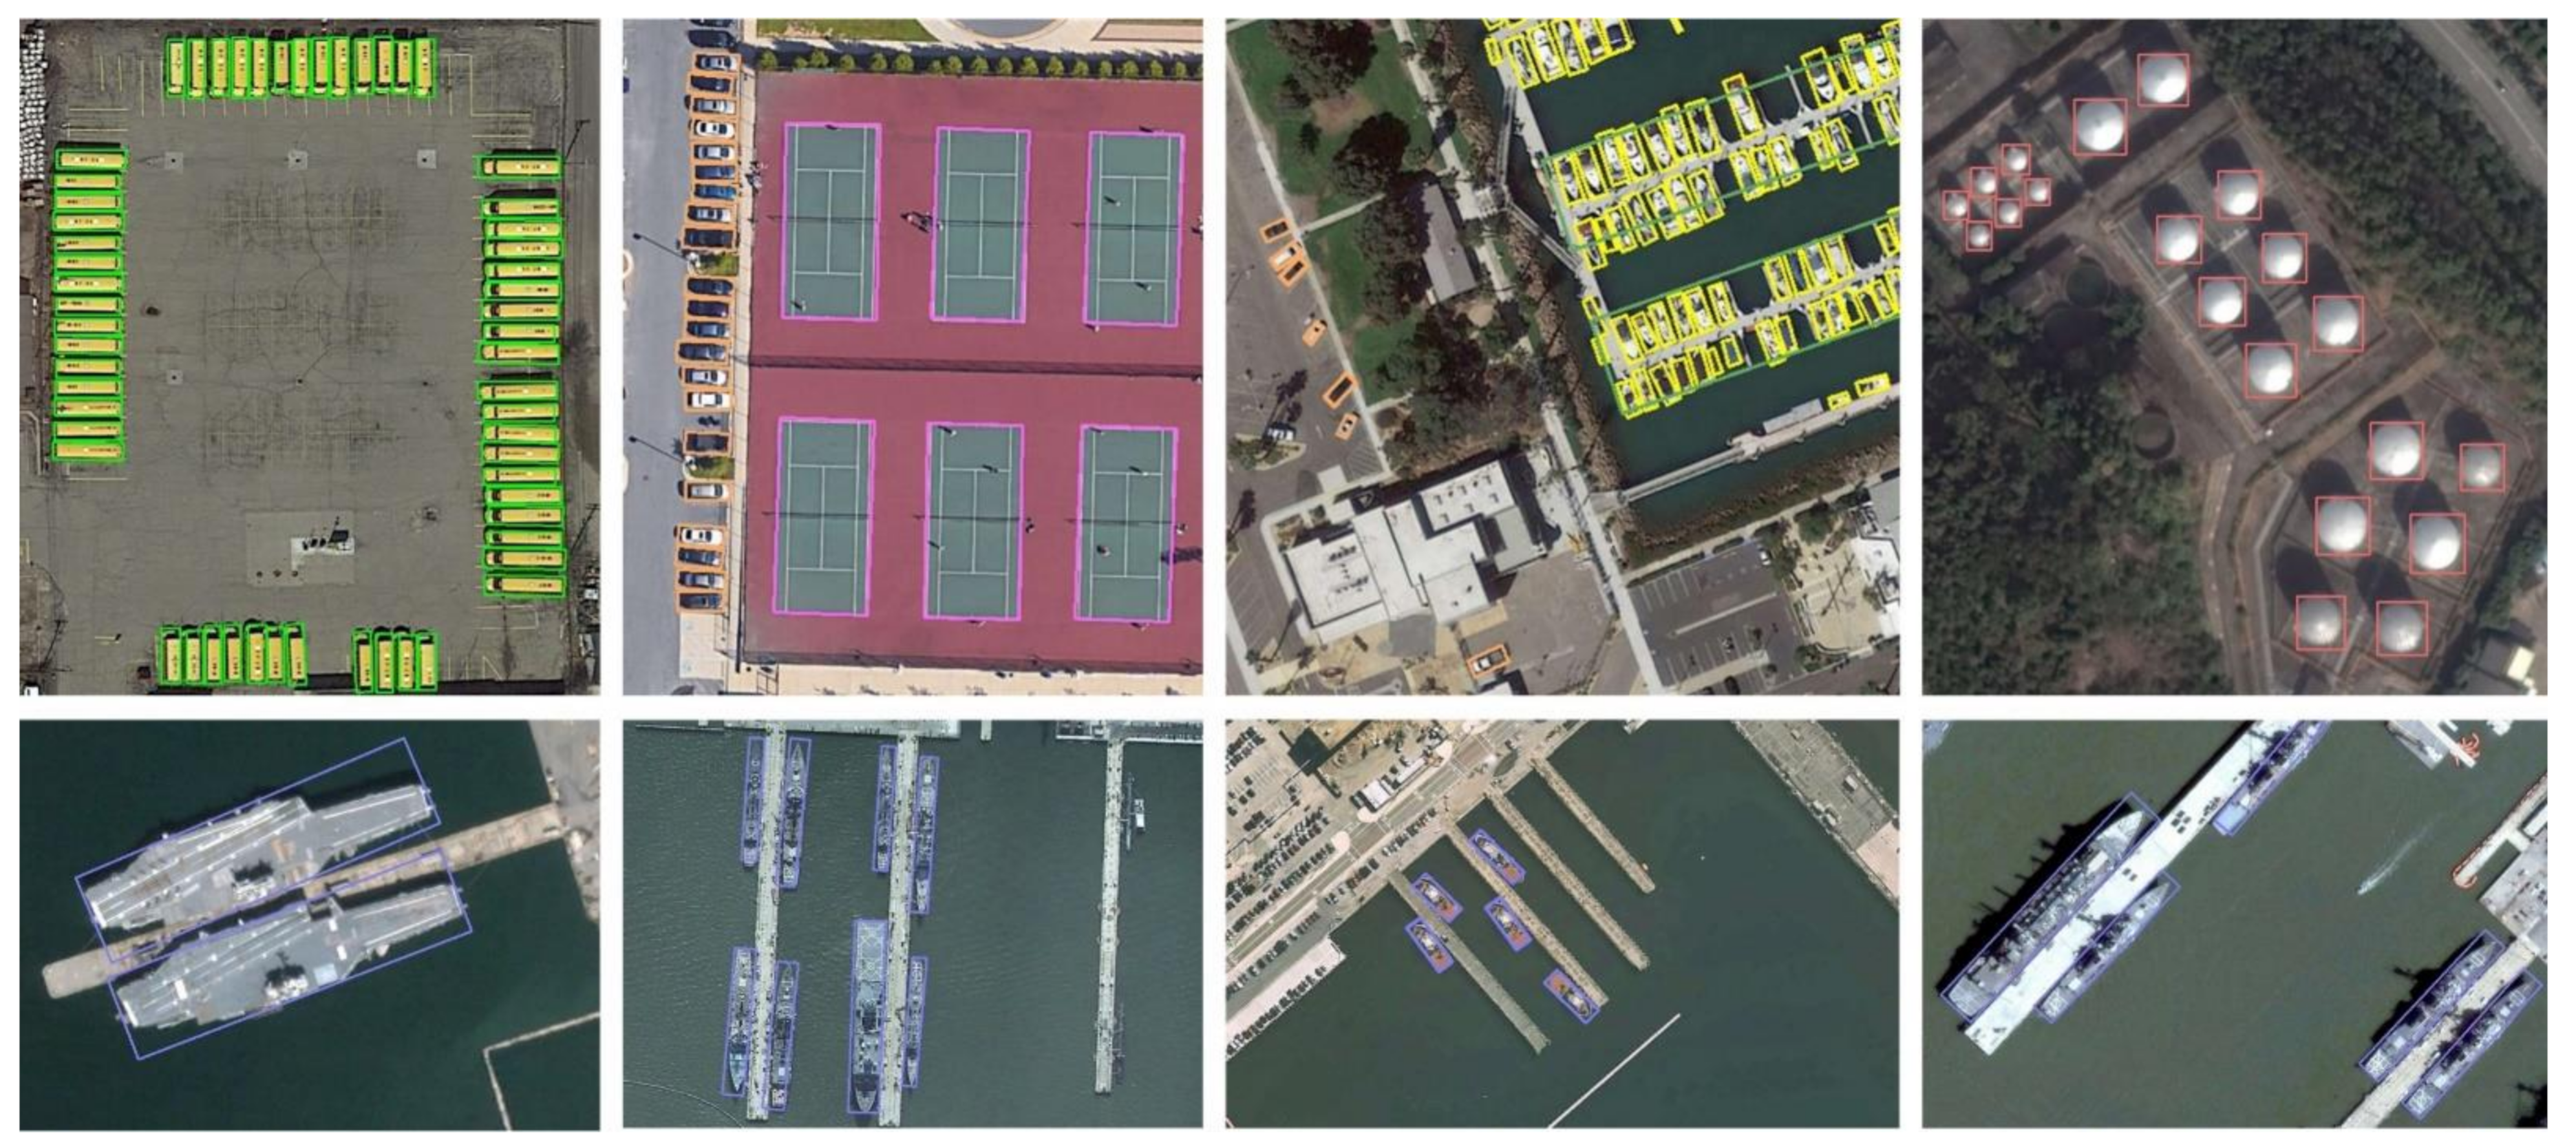
Figure 11 shows several prediction results obtained on the dataset, and there are a large number of small and densely parked objects in images. The accurate prediction results show that our approach performs well under complex backgrounds.
Results for HRSC2016. Aiming to verify the universality of the proposed approach for different objectives, we perform tests on the HRSC2016 ship dataset. During the test process, all methods predict on the original images without cropping operation. Table 7 summarizes the experimental results obtained by the SOTA networks, and the size in the table stands for the pixels of the input image in the training phase. Our method reaches the highest AP of 0.901, which is comparable to that of many current advanced methods. Some detection results are exhibited in the second row of Figure 11.

5. Conclusions

We present a one-stage center point network to realize high-precision detection of arbitrarily oriented objects in aerial images. The developed method detects targets by identifying their center points in a feature map, and an angle branch network is inserted to predict the rotation angle of the object. The DGA strategy is proposed to handle the sample imbalance problem and eliminate the influence of discrete examples. The PSL is adopted to resolve the effects of angular boundary discontinuities by transforming it into a classification task, and DGAA is selected as the loss function for angle recognition to further enhance the performance of the proposed method. The RCIoU loss is proposed to achieve accurate and stable regression for rotated objects. Finally, we perform ablation experiments on the UCAS-AOD dataset to prove the validity of our improvements, and comparative experiments on UCAS-AOD, DOTA, and HRSC2016 confirm the superior performance of our detector. In the future, we will focus on achieving improved tiny target detection.

Author Contributions

Conceptualization, P.W.; methodology, P.W.; software, P.W.; validation, C.Z. and Y.N.; formal analysis, P.W. and J.W.; writing—original draft preparation, P.W. and F.M.; writing—review and editing, P.W. and J.W.; visualization, F.M.; supervision, C.Z. and Y.N. All authors have read and agreed to the published version of the manuscript.

Funding

This research received no external funding.

Institutional Review Board Statement

Not applicable.

Informed Consent Statement

Not applicable.

Data Availability Statement

The data used to support the findings of this study are available from the corresponding author upon request.

Conflicts of Interest

The authors declare no conflict of interest.

References

  1. Feng, H.; Zou, B.; Tang, Y. Scale- and Region-Dependence in Landscape-PM2.5 Correlation: Implications for Urban Planning. Remote Sens. 2017, 9, 918. [Google Scholar] [CrossRef] [Green Version]
  2. Leichtle, T.; Geiß, C.; Wurm, M.; Lakes, T.; Taubenböck, H. Unsupervised change detection in VHR remote sensing imagery-an object-based clustering approach in a dynamic urban environment. Int. J. Appl. Earth Obs. Geoinf. 2017, 54, 15–27. [Google Scholar] [CrossRef]
  3. Kalantar, B.; Bin Mansor, S.; Halin, A.A.; Shafri, H.Z.M.; Zand, M. Multiple Moving Object Detection from UAV Videos Using Trajectories of Matched Regional Adjacency Graphs. IEEE Trans. Geosci. Remote Sens. 2017, 55, 5198–5213. [Google Scholar] [CrossRef]
  4. Li, K.; Wan, G.; Cheng, G.; Meng, L.; Han, J. Object detection in optical remote sensing images: A survey and a new benchmark. ISPRS J. Photogramm. Remote Sens. 2020, 159, 296–307. [Google Scholar] [CrossRef]
  5. Cao, Z.; Hidalgo, G.; Simon, T.; Wei, S.E.; Sheikh, Y. OpenPose: Realtime Multi-Person 2D Pose Estimation Using Part Affinity Fields. IEEE Trans. Pattern Anal. Mach. Intell. 2019, 43, 172–186. [Google Scholar] [CrossRef] [Green Version]
  6. Kamel, A.; Sheng, B.; Li, P.; Kim, J.; Feng, D.D. Hybrid Refinement-Correction Heatmaps for Human Pose Estimation. IEEE Trans. Multimed. 2020, 23, 1330–1342. [Google Scholar] [CrossRef]
  7. Qin, C.; Schlemper, J.; Caballero, J.; Price, A.N.; Hajnal, J.V.; Rueckert, D. Convolutional Recurrent Neural Networks for Dynamic MR Image Reconstruction. IEEE Trans. Med. Imaging 2018, 38, 280–290. [Google Scholar] [CrossRef] [PubMed] [Green Version]
  8. Zhang, L.; Chen, D.; Ma, J.; Zhang, J. Remote-Sensing Image Superresolution Based on Visual Saliency Analysis and Unequal Reconstruction Networks. IEEE Trans. Geosci. Remote Sens. 2020, 58, 4099–4115. [Google Scholar] [CrossRef]
  9. Cui, Y.; Hou, B.; Wu, Q.; Ren, B.; Wang, S.; Jiao, L. Remote Sensing Object Tracking With Deep Reinforcement Learning Under Occlusion. IEEE Trans. Geosci. Remote Sens. 2021, 60, 1–13. [Google Scholar] [CrossRef]
  10. Sun, S.; Akhtar, N.; Song, H.; Mian, A.S.; Shah, M. Deep Affinity Network for Multiple Object Tracking. IEEE Trans. Pattern Anal. Mach. Intell. 2019, 43, 104–119. [Google Scholar] [CrossRef] [Green Version]
  11. Russakovsky, O.; Deng, J.; Su, H.; Krause, J.; Satheesh, S.; Ma, S.; Huang, Z.; Karpathy, A.; Khosla, A.; Bernstein, M.; et al. ImageNet large scale visual recognition challenge. Int. J. Comput. Vis. 2015, 115, 211–252. [Google Scholar] [CrossRef] [Green Version]
  12. Lin, T.Y.; Maire, M.; Belongie, S.; Hays, J.; Perona, P.; Ramanan, D.; Dollár, P.; Zitnick, C.L. Microsoft coco: Common objects in context. In Proceedings of the 13th European Conference on Computer Vision (ECCV), Zurich, Switzerland, 6–12 September 2014; pp. 740–755. [Google Scholar]
  13. Ma, J.; Shao, W.; Ye, H.; Wang, L.; Wang, H.; Zheng, Y.; Xue, X. Arbitrary-Oriented Scene Text Detection via Rotation Proposals. IEEE Trans. Multimed. 2018, 20, 3111–3122. [Google Scholar] [CrossRef] [Green Version]
  14. Xu, Y.; Fu, M.; Wang, Q.; Wang, Y.; Chen, K.; Xia, G.-S.; Bai, X. Gliding Vertex on the Horizontal Bounding Box for Multi-Oriented Object Detection. IEEE Trans. Pattern Anal. Mach. Intell. 2020, 43, 1452–1459. [Google Scholar] [CrossRef] [PubMed] [Green Version]
  15. Zhang, Z.; Guo, W.; Zhu, S.; Yu, W. Toward Arbitrary-Oriented Ship Detection with Rotated Region Proposal and Discrimination Networks. IEEE Geosci. Remote Sens. Lett. 2018, 15, 1745–1749. [Google Scholar] [CrossRef]
  16. Zhou, X.; Wang, D.; Krahenbuhl, P. Objects as points. arXiv 2019, arXiv:1904.07850. [Google Scholar]
  17. Shrivastava, A.; Gupta, A.; Girshick, R.B. Training region-based object detectors with online hard example mining. In Proceedings of the IEEE Conference on Computer Vision and Pattern Recognition (CVPR), Las Vegas, NV, USA, 27–30 June 2016; pp. 761–769. [Google Scholar]
  18. Lin, T.Y.; Goyal, P.; Girshick, R.; He, K.; Dollar, P. Focal loss for dense object detection. IEEE Trans. Pattern Anal. Mach. Intell. 2020, 42, 318–327. [Google Scholar] [CrossRef] [Green Version]
  19. Li, B.; Liu, Y.; Wang, X. Gradient harmonized single-stage detector. In Proceedings of the AAAI Conference on Artificial Intelligence, Honolulu, HI, USA, 27 January–1 February 2019; Volume 33, pp. 8577–8584. [Google Scholar]
  20. Law, H.; Deng, J. CornerNet: Detecting objects as paired keypoints. In Proceedings of the Advances in Information Retrieval, Grenoble, France, 26–29 March 2018; Springer: Berlin/Heidelberg, Germany, 2018; pp. 765–781. [Google Scholar]
  21. Rezatofighi, H.; Tsoi, N.; Gwak, J.; Sadeghian, A.; Reid, I.; Savarese, S. Generalized intersection over Union: A metric and a loss for bounding box regression. In Proceedings of the IEEE Conference on Computer Vision and Pattern Recognition (CVPR), Long Beach, CA, USA, 15–20 June 2019; pp. 658–666. [Google Scholar]
  22. Zheng, Z.; Wang, P.; Liu, W.; Li, J.; Ye, R.; Ren, D. Distance-IoU loss: Faster and better learning for bounding box regression. In Proceedings of the AAAI Conference on Artificial Intelligence, Grenoble, France, 26–29 March 2018; Association for the Advancement of Artificial Intelligence (AAAI): Menlo Park, CA, USA, 2020; Volume 34, pp. 12993–13000. [Google Scholar]
  23. Chen, Z.; Chen, K.; Lin, W.; See, J.; Yu, H.; Ke, Y.; Yang, C. Piou loss: Towards accurate oriented object detection in complex environments. In Proceedings of the European Conference on Computer Vision, (ECCV), Glasgow, UK, 23–28 August 2020. [Google Scholar]
  24. Girshick, R.; Donahue, J.; Darrell, T.; Malik, J. Region-Based Convolutional Networks for Accurate Object Detection and Segmentation. IEEE Trans. Pattern Anal. Mach. Intell. 2015, 38, 142–158. [Google Scholar] [CrossRef]
  25. Uijlings, R.J.; Sande, V.D.; Gevers, T.; Smeulders, W. Selective search for object recognition. Int. J. Comput. Vis. 2013, 104, 154–171. [Google Scholar] [CrossRef] [Green Version]
  26. He, K.; Zhang, X.; Ren, S.; Sun, J. Spatial pyramid pooling in deep convolutional networks for visual recognition. IEEE Trans. Pattern Anal. 2015, 37, 1904–1916. [Google Scholar] [CrossRef] [Green Version]
  27. Girshick, R. Fast R-CNN. In Proceedings of the 2015 IEEE International Conference on Computer Vision (ICCV), Santiago, Chile, 7–13 December 2015; pp. 1440–1448. [Google Scholar]
  28. Ren, S.; He, K.; Girshick, R.; Sun, J. Faster R-CNN: Towards real time object detection with region proposal networks. IEEE Trans. Pattern Anal. Mach. Intell. 2017, 39, 1137–1149. [Google Scholar] [CrossRef] [Green Version]
  29. Lin, T.; Dollar, P.; Girshick, R.; He, K.; Hariharan, B.; Belongie, S. Feature pyramid networks for object detection. In Proceedings of the IEEE Conference on Computer Vision and Pattern Recognition (CVPR), Honolulu, HI, USA, 21–26 July 2017; pp. 936–944. [Google Scholar]
  30. Dai, J.; Li, Y.; He, K.; Sun, J. R-fcn: Object detection via region-based fully convolutional networks. arXiv 2016, arXiv:1605.06409. [Google Scholar]
  31. Sermanet, P.; Eigen, D.; Zhang, X.; Mathieu, M.; Fergus, R.; LeCun, Y. Overfeat: Integrated recognition, localization and detection using convolutional networks. arXiv 2014, arXiv:1312.6229v3. [Google Scholar]
  32. Liu, W.; Anguelov, D.; Erhan, D.; Szegedy, C.; Reed, S.; Fu, C.; Berg, A. SSD: Single shot multibox detector. In Proceedings of the European Conference on Computer Vision (ECCV), Amsterdam, The Netherlands, 8–16 October 2016; pp. 21–37. [Google Scholar]
  33. Redmon, J.; Divvala, S.; Girshick, R.; Farhadi, A. You only look once: Unified, real-time object detection. In Proceedings of the IEEE Conference on Computer Vision and Pattern Recognition (CVPR), Las Vegas, NV, USA, 27–30 June 2016; pp. 779–788. [Google Scholar]
  34. Redmon, J.; Farhad, A. YOLO9000: Better, faster, stronger. In Proceedings of the 2017 IEEE Conference on Computer Vision and Pattern Recognition (CVPR), Honolulu, HI, USA, 21–26 July 2017; pp. 6517–6525. [Google Scholar]
  35. Redmon, J.; Farhadi, A. YOLOv3: An incremental improvement. In Proceedings of the 2017 IEEE Conference on Computer Vision and Pattern Recognition (CVPR), Salt Lake City, UT, USA, 18–22 June 2018. [Google Scholar]
  36. Law, H.; Teng, Y.; Russakovsky, Y.; Deng, J. Cornernet-lite: Efficient keypoint based object detection. arXiv 2019, arXiv:1904.08900. [Google Scholar]
  37. Tian, Z.; Shen, C.; Chen, H.; He, T. Fcos: Fully convolutional one-stage object detection. In Proceedings of the IEEE International Conference on Computer Vision (ICCV), Seoul, Korea, 27–28 October 2019; pp. 9627–9636. [Google Scholar]
  38. Zhou, X.; Zhuo, J.; Krahenbuhl, P. Bottom-up object detection by grouping extreme and center points. In Proceedings of the IEEE Conference on Computer Vision and Pattern Recognition (CVPR), Long Beach, CA, USA, 15–20 June 2019; pp. 850–859. [Google Scholar]
  39. Chen, X.; Xiang, S.; Liu, C.-L.; Pan, C.-H. Vehicle Detection in Satellite Images by Hybrid Deep Convolutional Neural Networks. IEEE Geosci. Remote Sens. Lett. 2014, 11, 1797–1801. [Google Scholar] [CrossRef]
  40. Dong, R.; Xu, D.; Zhao, J.; Jiao, L.; An, J. Sig-NMS-Based Faster R-CNN Combining Transfer Learning for Small Target Detection in VHR Optical Remote Sensing Imagery. IEEE Trans. Geosci. Remote Sens. 2019, 57, 8534–8545. [Google Scholar] [CrossRef]
  41. Zou, Z.; Shi, Z. Random Access Memories: A New Paradigm for Target Detection in High Resolution Aerial Remote Sensing Images. IEEE Trans. Image Process. 2017, 27, 1100–1111. [Google Scholar] [CrossRef] [PubMed]
  42. Ding, P.; Zhang, Y.; Deng, W.-J.; Jia, P.; Kuijper, A. A light and faster regional convolutional neural network for object detection in optical remote sensing images. ISPRS J. Photogramm. Remote Sens. 2018, 141, 208–218. [Google Scholar] [CrossRef]
  43. Yang, X.; Sun, H.; Fu, K.; Yang, J.; Sun, X.; Yan, M.; Guo, Z. Automatic Ship Detection in Remote Sensing Images from Google Earth of Complex Scenes Based on Multiscale Rotation Dense Feature Pyramid Networks. Remote Sens. 2018, 10, 132. [Google Scholar] [CrossRef] [Green Version]
  44. Ding, J.; Xue, N.; Long, Y.; Xia, G.S.; Lu, Q. Learning roi transformer for oriented object detection in aerial images. In Proceedings of the IEEE Conference on Computer Vision and Pattern Recognition, Long Beach, CA, USA, 15–20 June 2019; pp. 2849–2858. [Google Scholar]
  45. Zhang, G.; Lu, S.; Zhang, W. CAD-Net: A context-aware detection network for objects in remote sensing imagery. arXiv 2019, arXiv:1903.00857. [Google Scholar] [CrossRef] [Green Version]
  46. Yang, X.; Liu, Q.; Yan, J.; Li, A.; Zhang, Z.; Yu, G. R3det: Refined single-stage detector with feature refinement for rotating object. arXiv 2019, arXiv:1908.05612. [Google Scholar]
  47. Yang, X.; Yang, J.; Yan, J.; Zhang, Y.; Zhang, T.; Guo, Z.; Sun, X.; Fu, K. SCRDet: Towards more robust detection for small, cluttered and rotated objects. In Proceedings of the IEEE International Conference on Computer Vision (ICCV), Seoul, Korea, 27–28 October 2019. [Google Scholar]
  48. Yu, F.; Wang, D.; Shelhamer, E.; Darrell, T. Deep layer aggregation. In Proceedings of the 2018 IEEE/CVF Conference on Computer Vision and Pattern Recognition, Salt Lake City, UT, USA, 18–23 June 2018; pp. 2403–2412. [Google Scholar]
  49. Zhu, X.; Hu, H.; Lin, S.; Dai, J. Deformable ConvNets v2: More deformable, better results. In Proceedings of the IEEE Conference on Computer Vision and Pattern Recognition (CVPR), Long Beach, CA, USA, 15–20 June 2019; pp. 9300–9308. [Google Scholar]
  50. Yang, X.; Yan, J.C. Arbitrary-oriented object detection with circular smooth label. In Proceedings of the 16th European Conference on Computer Vision (ECCV), Glasgow, UK, 23–28 August 2020; pp. 677–694. [Google Scholar]
  51. Zhu, H.; Chen, X.; Dai, W.; Fu, K.; Ye, Q.; Jiao, J. Orientation robust object detection in aerial images using deep convolutional neural network. In Proceedings of the IEEE International Conference Image Processing, Quebec City, QC, Canada, 27–30 September 2015; pp. 3735–3739. [Google Scholar] [CrossRef]
  52. Xia, G.S.; Bai, X.; Ding, J.; Zhu, Z.; Belongie, S.; Luo, J.; Datcu, M.; Pelillo, M.; Zhang, L. DOTA: A large-scale dataset for object detection in aerial images. In Proceedings of the 2017 IEEE Conference on Computer Vision and Pattern Recognition (CVPR), Salt Lake City, UT, USA, 18–22 June 2018; pp. 3974–3983. [Google Scholar]
  53. Liu, Z.; Yuan, L.; Weng, L.; Yang, Y. A high resolution optical satellite image dataset for ship recognition and some new baselines. In Proceedings of the International Conference on Pattern Recognition Applications and Methods (ICPRAM), Porto, Portugal, 24–26 February 2017; pp. 324–331. [Google Scholar]
  54. Bochkovskiy, A.; Wang, C.; Liao, H. YOLOv4: Optimal Speed and Accuracy of Object Detection. arXiv 2020, arXiv:2004.10934. [Google Scholar]
  55. Wang, Y.; Li, H.; Jia, P.; Zhang, G.; Wang, T.; Hao, X. Multi-scale densenets-based aircraft detection from remote sensing images. Sensors 2019, 19, 5270. [Google Scholar] [CrossRef] [PubMed] [Green Version]
  56. Li, C.; Xu, C.; Cui, Z.; Wang, D.; Zhang, T.; Yang, J. Feature-attentioned object detection in remote sensing imagery. In Proceedings of the IEEE International Conference on Image Processing (ICIP), Taipei, Taiwan, China, 22–25 September 2019; pp. 3886–3890. [Google Scholar]
  57. Jiang, Y.; Zhu, X.; Wang, X.; Yang, S.; Li, W.; Wang, H.; Fu, P.; Luo, Z. R2CNN: Rotational region CNN for orientation robust scene text detection. arXiv 2017, arXiv:1706.09579. [Google Scholar]
  58. Bao, S.; Zhong, X.; Zhu, R.; Zhang, X.; Li, Z.; Li, M. Single Shot Anchor Refinement Network for Oriented Object Detection in Optical Remote Sensing Imagery. IEEE Access 2019, 7, 87150–87161. [Google Scholar] [CrossRef]
  59. Wang, J.; Yang, W.; Li, H.-C.; Zhang, H.; Xia, G.-S. Learning Center Probability Map for Detecting Objects in Aerial Images. IEEE Trans. Geosci. Remote Sens. 2020, 59, 4307–4323. [Google Scholar] [CrossRef]
  60. Yang, X.; Yan, J.; Ming, Q.; Wang, W.; Zhang, X.; Tian, Q. Rethinking Rotated Object Detection with Gaussian Wasserstein Distance Loss. arXiv 2021, arXiv:2101.11952v2. [Google Scholar]
  61. Liao, M.; Zhu, Z.; Shi, B.; Xia, G.; Bai, X. Rotation-sensitive regression for oriented scene text detection. In Proceedings of the 2017 IEEE Conference on Computer Vision and Pattern Recognition, Salt Lake City, UT, USA, 18–22 June 2018; pp. 5909–5918. [Google Scholar]
  62. Ming, Q.; Zhou, Z.; Miao, L.; Zhang, H.; Li, L. Dynamic anchor learning for arbitrary-oriented object detection. arXiv 2020, arXiv:2012.04150. [Google Scholar]
Figure 1. Horizontal bounding box detection and oriented bounding box detection are compared. A ship detection scenario is provided to visually illustrate their differences. (a) Horizontal bounding boxes; (b) Oriented bounding boxes.
Remotesensing 14 01536 g001
Figure 2. The pipeline of our rotated object detector (using DLA-34 as the backbone). The detector mainly consists of two modules: feature extraction module (FEM) and detection head module (DHM). FEM extracts the most useful features by a deep aggregation network. The DHM is used to predict the classification and location of objects. We add an angle detection subnet that is indicated by the green arrow.
Remotesensing 14 01536 g002
Figure 3. The head network of the proposed rotated object detector.
Remotesensing 14 01536 g003
Figure 4. The boundary problem of angle regression. The red box indicates the ground-truth bounding box, the blue box indicates an initial precision box, and the yellow box indicates an intermediate state in the regression process. (a) Ideal regression mode. (b) Actual regression mode.
Remotesensing 14 01536 g004
Figure 5. Three kinds of periodic smooth label functions for angular transformation. Assume the ground truth of the angle is 90°, and the period of the window function is 180°.
Remotesensing 14 01536 g005
Figure 6. Comparison results regarding the HBB detection and OBB detection. (a) HBB detection; (b) OBB detection.
Remotesensing 14 01536 g006
Figure 7. Comparison of the detection results obtained on the UCAS-AOD dataset with different window functions, where the combination of DGA and PSL is chosen as the base method. (a) Triangle; (b) Cosine; (c) Gaussian.
Remotesensing 14 01536 g007
Figure 8. Visualization of detection results before and after adopting RCIoU loss. (a) Before; (b) After.
Remotesensing 14 01536 g008
Figure 9. Recall–precision curves of different improvements for the UCAS-AOD dataset. (a) Car; (b) Plane.
Remotesensing 14 01536 g009
Figure 10. Comparison of the detection results on the UCAS-AOD dataset with different methods. (a) Ground Truth; (b) RoI-Trans; (c) FPN-CSL; (d) R3Det-GWD; (e) Ours.
Remotesensing 14 01536 g010
Figure 11. Some detection results on commonly remote sensing datasets. The first row shows predicted results on DOTA, and the second row exhibits predicted results on HRSC2016.
Remotesensing 14 01536 g011
Table 1. Evaluation results of the HBB and OBB tasks on the UCAS-AOD dataset. FL indicates the focal loss used in the baseline network. GHM indicates the gradient harmony mechanism proposed in reference [19]. DGA indicates the dynamic gradient adjustment method proposed in this paper.
HBBmAP50CarPlanemRecallEoA
FL0.9420.9220.9620.968-
GHM0.9270.8840.9750.980-
DGA0.9660.9540.9780.987-
OBBmAP50CarPlanemRecallEoA
FL0.9230.8710.9740.96314.72
GHM0.9210.8840.9580.96013.93
DGA0.9330.8980.9680.96413.01
Table 2. The results achieved on UCAS-AOD with different window functions. PSL denotes the periodic smooth label that is used to convert a single angle value to a specific sequence.
MethodFunctionmAP50APmAP75mRecallRecallEoA
CarPlaneCarPlane
FL + PSLTriangle0.9420.9090.9750.2000.9650.9460.98413.55
Cosine0.9500.9260.9740.3910.9720.9600.9847.19
Gaussian0.9520.9210.9840.3990.9760.9590.9936.12
DGA + PSLTriangle0.9460.9260.9660.2350.9650.9520.97812.60
Cosine0.9530.9300.9770.4230.9760.9620.9906.17
Gaussian0.9560.9340.9780.4410.9760.9650.9875.71
Table 3. The results achieved on UCAS-AOD with different angle loss functions. L1 means the Euclidean distance, and DGAA means dynamic gradient angle adjustment method proposed in this paper.
MethodAngle Loss FunctionmAP50APmAP75mRecallRecallEoA
CarPlaneCarPlane
DGA + PSLL10.9560.9340.9780.4410.9760.9650.9875.71
LE0.9570.9350.9790.4620.9780.9660.9903.81
FL0.9590.9390.9790.4650.9770.9690.9853.68
DGAA0.9640.9450.9830.5130.9820.9730.9913.17
Table 4. Comparison with the state-of-the-art networks on the UCAS_AOD dataset.
NetworkBackboneAPcarAPplanemAP
HBBYOLOv2 [34]VGG160.6690.8550.762
SSD [32]VGG160.8130.8910.852
RFCN [30]ResNet1010.8060.8990.853
Faster RCNN [28]VGG160.8790.9070.893
YOLOv3 [35]DarkNet530.8500.9720.911
YOLOv4 [54]DarkNet530.9260.9580.942
MSDensNet [55]DenseNet65--0.957
FADet [56]ResNet1010.9360.9780.957
CenterHBB (ours)DLA340.9540.9780.966
OBBRRPN [13]VGG160.7440.8800.812
R2CNN [57]VGG160.8980.7890.844
YOLOv2-A [34]GoogLeNet0.8820.9070.894
R-DFPN [43]ResNet500.8250.9590.892
RoI-Trans [44]ResNet1010.8710.9530.912
S2ARN [58]ResNet500.9220.9760.949
RetinaNet-H [18]ResNet500.9360.9730.955
FADet [20]ResNet1010.9270.9870.957
R3Det [46]ResNet1520.9410.9820.962
CenterMap [59]ResNet500.9470.9790.963
FPN-CSL [50]ResNet1010.9500.9760.963
R3Det-GWD [60]ResNet1520.9470.9830.965
CenterOBB (ours)DLA340.9520.9870.969
Table 5. Accuracy comparison of four methods on the UCAS_AOD dataset.
MethodRoI-Trans [44]FPN-CSL [50]R3Det-GWD [60]Ours
mAP500.9120.9630.9650.969
mAP750.3620.4930.4210.530
EoA6.173.424.822.96
Table 6. Comparison with the state-of-the-art networks on the DOTA dataset.
MethodPLBDSHTCSTBRBCGTFHASVLVRAHCSPSBFmAP
PIoU [23]0.8090.6970.6480.9090.7040.2410.7720.6020.5710.3830.6440.3710.6400.6190.4650.6050
R2CNN [57]0.80940.65670.55810.90670.72390.35340.66920.67440.55140.59920.50910.52230.48220.53350.55060.6067
RRPN [13]0.88520.71200.57250.90810.67380.31660.72840.59300.53080.51850.56190.52840.53580.51940.56690.6101
RetinaNet [18]0.88920.67670.75240.90870.75070.33550.73950.56830.51050.66110.73280.56720.21460.55860.43770.6202
RoI-Trans [44]0.88640.78520.83590.90740.81460.43440.77270.75920.62830.68810.73680.53540.47670.58930.58390.6956
R3Det [46]0.88760.83090.86720.90780.83240.50910.84680.67270.66910.76230.80390.61350.53940.70630.61980.7379
CenterMap [59]0.89830.84410.87190.90660.85270.54600.84890.70250.74130.77660.78320.69230.66060.71560.56460.7603
FPN-CSL [50]0.90250.85530.77620.90840.86690.54640.86150.75310.73830.70440.73510.68040.68930.71100.69600.7617
R3Det-GWD [60]0.88820.82940.87460.90210.85440.55630.86360.72750.73460.78520.83100.61410.57380.76940.64700.7634
ours0.90870.83910.87250.91820.85730.54390.85630.74160.72820.78450.84390.68270.67140.74630.68320.7785
Table 7. Comparison with the SOTA networks on the HRSC2016 dataset. AP(07) means using the VOC2007 evaluation metric.
TermBackboneSizeAP(07)
R2CNN [57]ResNet101800 × 8000.731
RRPN [13]ResNet101800 × 8000.791
RRD [61]VGG16384 × 3840.843
R-DFPN [43]ResNet101600 × 10000.850
ROI-tans [44]ResNet101512 × 8000.862
S2ARN [58]ResNet50600 × 6000.881
Xu2020 [14]ResNet101512 × 8000.882
R3DeT [46]ResNet101800 × 8000.893
FPN-CSL [50]ResNet101800 × 8000.896
DAL [62]ResNet101800 × 8000.898
R3DeT-GWD [61]ResNet101512 × 5120.899
CenterOBB (ours)DLA34512 × 5120.901
Publisher’s Note: MDPI stays neutral with regard to jurisdictional claims in published maps and institutional affiliations.

