Article

Evaluation of Eight High-Resolution Gridded Precipitation Products in the Heihe River Basin, Northwest China

1
State Key Laboratory of Resources and Environmental Information System, Institute of Geographic Sciences and Natural Resources Research, Chinese Academy of Sciences, Beijing 100101, China
2
College of Resources and Environment, University of Chinese Academy of Sciences, Beijing 100101, China
3
Jiangsu Center for Collaborative Innovation in Geographic Information Resource Development and Application, Nanjing 210023, China
*
Author to whom correspondence should be addressed.
Remote Sens. 2022, 14(6), 1458; https://doi.org/10.3390/rs14061458
Submission received: 28 January 2022 / Revised: 26 February 2022 / Accepted: 15 March 2022 / Published: 18 March 2022
(This article belongs to the Topic Advanced Research in Precipitation Measurements)

Abstract

:
The acquisition of the precise spatial distribution of precipitation is of great importance and necessity in many fields, such as hydrology, meteorology and ecological environments. However, in the arid and semiarid regions of Northwest China, especially over mountainous areas such as the Heihe River basin (HRB), the scarcity and uneven distribution of rainfall stations have created certain challenges in gathering information that accurately describes the spatial distribution of precipitation for use in applications. In this study, the accuracy of precipitation estimates from eight high-resolution gridded precipitation products (CMORPHv1-CRT, CRU TSv.4.05, ERA5, GSMaP_NRT, IMERG V06B-Final, MSWEPv2.0, PERSIANN-CDR and TRMM 3B42v7) are comprehensively evaluated by referring to the precipitation observations from 23 stations over the HRB using six indices (root mean square error, standard deviation, Pearson correlation coefficient, relative deviation, mean error and Kling–Gupta efficiency) from different spatial and temporal scales. The results show that at an annual scale, MSWEP has the highest accuracy over the entire basin, while PERSIANN, CRU and ERA5 show the most accurate results in the upper, middle and lower reaches of the HRB, respectively. At a seasonal scale, the performance of IMERG, CRU and ERA5 is superior to that of the other products in all seasons in the upper, middle and lower reaches, respectively. Over the entire HRB, PERSIANN displays the smallest deviation in all seasons except for spring. TRMM shows the highest accuracy in spring and autumn, while MSWEP and CRU show the highest accuracy in summer and winter, respectively. At a monthly scale, TRMM is superior to the other products, with a relatively stronger correlation almost every month, while GSMaP is inferior to the other products. Moreover, MSWEP and PERSIANN perform relatively best, with favorable statistical results around almost every station, while GSMaP shows the worse performance. In addition, ERA5 tends to overestimate higher values, while GSMaP tends to overestimate lower values over the entire basin. Moreover, the overestimation of ERA5 tends to appear in the upper reach area, while that of GSMaP tends to appear in the lower reach area. Only CRU and PERSIANN yield underestimations of precipitation, with the strongest tendency appearing in the upper reach area. The results of this study display some findings on the uncertainties of several frequently used precipitation datasets in the high mountains and poorly gauged regions in the HRB and will be helpful to researchers in various fields who need high-resolution gridded precipitation datasets over the HRB, as well as to data producers who want to improve their products.

1. Introduction

The acquisition of a precise spatial distribution of precipitation plays a vital role in a wide range of fields, such as agriculture, ecosystems and water resource management [1,2,3,4]. As an important atmospheric input parameter in terrestrial ecosystem models and hydrological models, the accuracy of precipitation is of great importance for model simulation results [5]. However, it is very challenging to obtain high-quality precipitation estimates at fine spatial–temporal resolutions [6], especially in poorly gauged and highly mountainous areas. Rain gauges are traditional and reliable tools used to measure point-scale precipitation, with high accuracy at specific locations [7], which typically serve as the benchmark for the evaluation of various precipitation products. Precipitation is accompanied by complex physical processes with large temporal and spatial variability, making it difficult to conduct large-scale regional monitoring [8]. Although China has established a multilevel distribution and denser meteorological and hydrological observation network, there are still many problems in areas that are remote or have complex terrain, such as the sparse distribution of observation sites, non-continuous measurements, and high-cost maintenance [9,10].
With the rapid development of satellite remote sensing technology and data retrieval algorithms as well as computer science, the applications of satellite- and reanalysis-based precipitation estimates have gained much attention for obtaining the spatial distribution of precipitation, particularly in sparsely gauged regions and highly mountainous areas [11,12,13]. These products are increasingly available to the public, which significantly improves our understanding of precipitation characteristics [14,15,16] and promotes a variety of hydrometeorological applications [17,18,19,20], especially over poorly gauged regions, such as the HRB in China. Until now, several satellite, reanalysis-based and merged precipitation products have been developed and have become operational, including the Asian Precipitation—Highly Resolved Observational Data Integration Towards Evaluation (APHRODITE), the Climate Prediction Center Morphing technique product (CMORPH) [21,22], the Climate Research Unit dataset (CRU), the latest climate reanalysis product (ERA5) of the European Centre for Medium-Range Weather Forecasts (ECMWF), integrated Multi-satellite Retrievals for Global Precipitation Measurement Mission (GPM) (IMERG) and Global Satellite Mapping of Precipitation (GSMaP) of NASA’s GPM, Multi-Source Weighted-Ensemble Precipitation (MSWEP), Precipitation Estimation from Remotely Sensed Information using Artificial Neural Networks Climate Data Record (PERSIANN-CDR) [23] and the Tropical Rainfall Measuring Mission (TRMM) Multisatellite Precipitation Analysis (TMPA) [24], among others. Products with high accuracy can improve the capability to predict natural hazards, such as floods, droughts and landslides, especially in ungauged regions [25,26]. Nevertheless, these products are inherently subjected to large uncertainties and biases arising from the retrieval algorithms, indirect measurements and parameters of numerical models [27,28,29].
There have been several studies on the evaluation of the accuracy of these data products around the world [30,31,32]. Dinku et al. [33] examined the accuracy of seven products over Colombia, finding a low accuracy in PERSIANN and TRMM 3B42RT and relatively high accuracy in CMORPHv0. In addition, they also indicated that the products were good at detecting the occurrence of rainfall but poor at estimating the amount of daily precipitation. Salio et al. [34] evaluated six different products over South America (TRMM 3B42v6, TRMM 3B42v7, TRMM 3B42RT, CMORPHv0, HYDRO and the CoSch) and found that the accuracy of satellite rainfall estimates that included microwave measurements was higher than those with only infrared (IR) information. Wang et al. [35] found that ERA5 showed higher precipitation in the Arctic than ERA-Interim. Sharifi et al. [36] concluded that the monthly precipitation products of IMERG and ERA both had a problem with overestimation in Austria, and when the daily precipitation was greater than 10 mm, they both had a lower detection degree. Tarek et al. [37] deduced that the hydrological model constructed using ERA5 could better reflect the observation results in most parts of North America, and the deviation was lower compared with the previous generation of products. However, there has been little research on a comprehensive accuracy evaluation and comparison for up to eight or more kinds of high-resolution gridded precipitation products at the same time, especially in sparsely gauged and ungauged highly mountainous regions around the world, such as the HRB in China.
Precipitation with strong heterogeneity has been well documented in the HRB since the complex topography [38,39] and precipitation over this region play a significant and critical role in influencing the formation and change of water resources and their impact on the sustainable development of oasis socioeconomic development, agricultural production and environmental changes [40,41]. However, the scarcity and uneven distribution of meteorological stations in the HRB together with the complex mountainous terrain create certain difficulties in the study of these processes [42]. Based on the precipitation-observed data from 17 available national meteorological stations and six automatic weather stations in the HRB from January 2016 to December 2019, this study comprehensively evaluates and compares the accuracy of the CMORPHv1.0-CRT, CRU TS v.4.05, ERA5, GSMaP_NRT, IMERG V06B-Final, MSWEPv2.0, PERSIANN-CDR and TRMM 3B42v7 products from different scales of year, season and month and at the same time from both the stations and the entire HRB, as well as its upper, middle and lower reaches. These products are often used in climate analysis and the assessment of climate models and have been adopted for various applications in the HRB [43,44,45,46,47,48,49]. However, the quality of these eight products has not been well validated in the HRB. Our results provide the characteristics and differences among these products and thus offer data users some context for choosing a suitable dataset for a particular application, as well as helping to inspire innovations and improvements in the datasets of these products in the future.

2. Study Area and Data
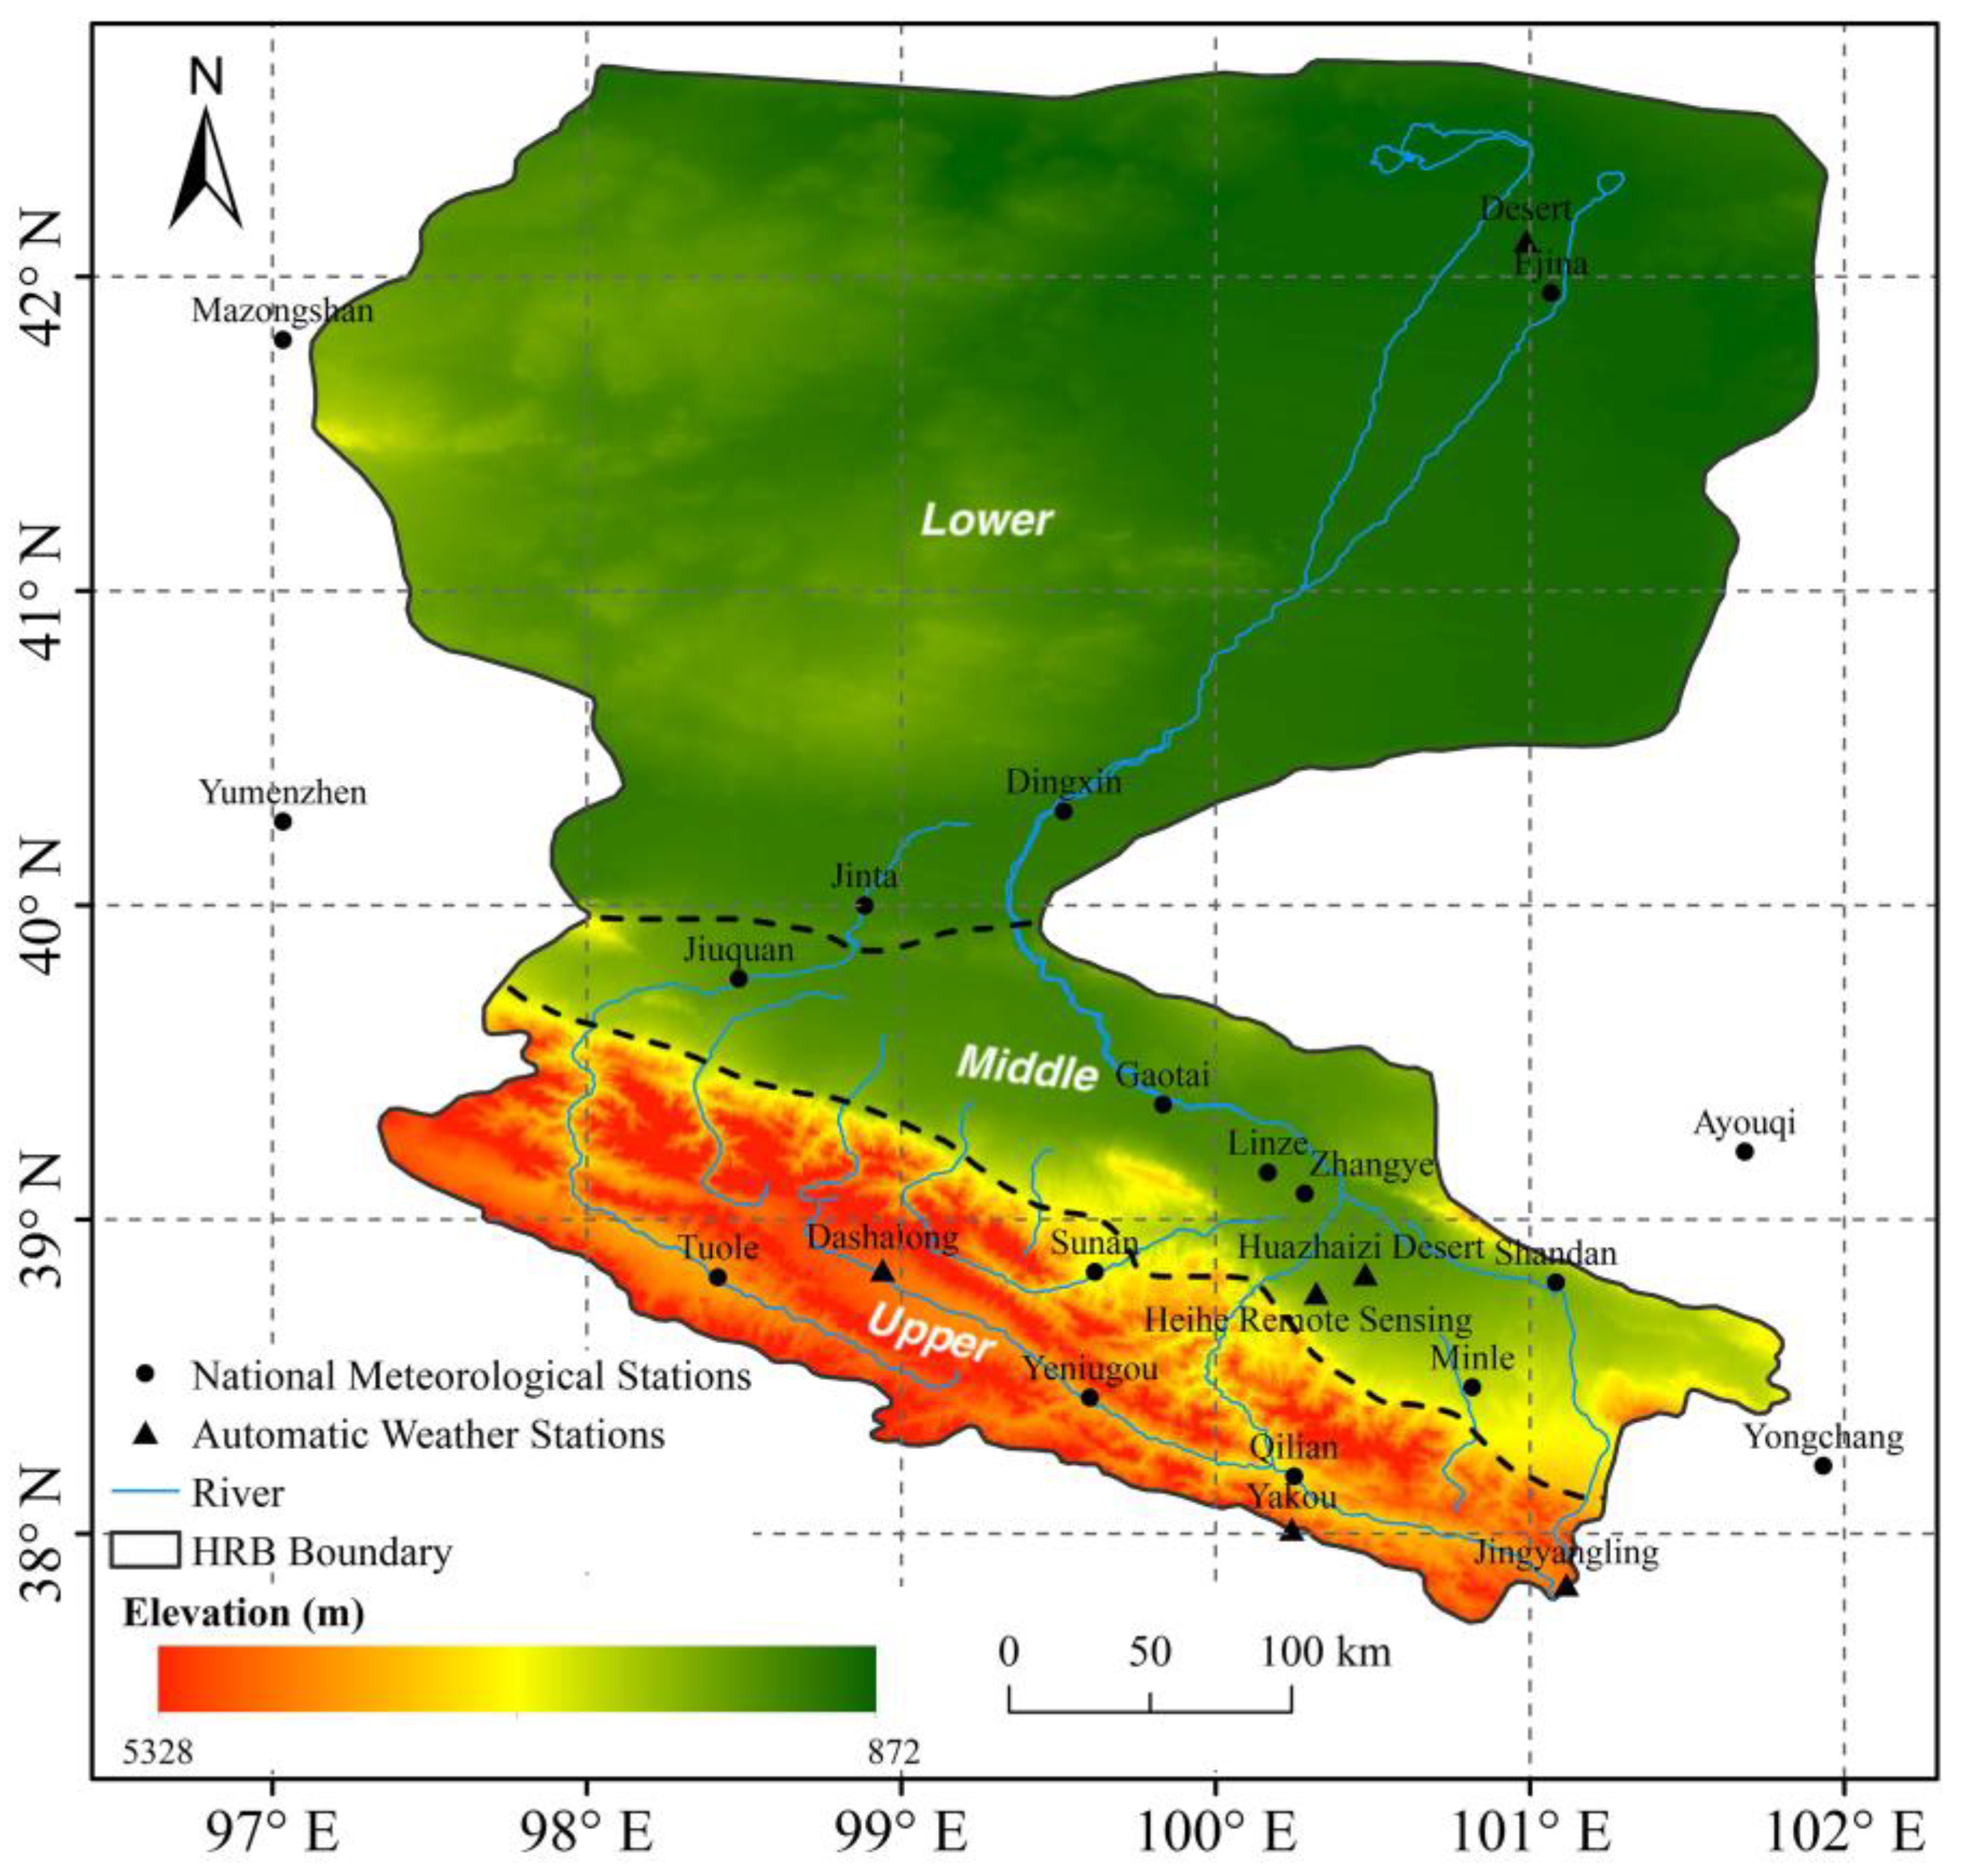
2.1. Study Area

The Heihe River originates in the Qilian Mountains, flows through an irrigated agricultural area and finally joins two lakes in the desert in the north, forming the second-largest inland river basin, the HRB, in China. The HRB is located in the arid inland area of Northwest China (Figure 1). It is a large inland water system in Northwest China that flows through Qinghai, Gansu and Inner Mongolia. The geographic location is between 37°50′ and ∼42°40′N, 98°00′ and ∼101°30′E, and the drainage area is 142,900 km2. The climate is mainly affected by the circulation of the westerly zone in the middle and high latitudes and the influence of the polar cold air mass. The dry climate and uneven distribution of precipitation during the year have caused large differences in precipitation between the northern and southern areas in the basin. There are significant regional differences in landform characteristics within the basin, with the Qilian Mountains in the south, Corridor Plain in the middle and low mountains and the Alxa Plateau in the north bordering the Badain Jaran Desert [40]. The Qilian Mountains are the formation area of surface water resources in the upper, middle and lower reaches of the basin, and the amount of precipitation directly affects the conditions of glaciers, snow and runoff in the upper reaches of the Heihe River [50,51].

2.2. Datasets

2.2.1. High-Resolution Gridded Precipitation Products

Eight high-resolution gridded precipitation products were evaluated in this study (Table 1). They are the Climate Prediction Center Morphing technique product Version 1 (CMORPHv1.0-CRT, hereafter CMORPH) and Precipitation Estimation from Remotely Sensed Information using Artificial Neural Networks Climate Data Record (PERSIANN-CDR, hereafter PERSIANN) at a daily scale, as well as the current version of the Climate Research Unit TS dataset (CRU TS v.4.05, hereafter CRU), the Fifth generation of ECMWF atmospheric reanalysis of the global climate (ERA5) of the ECMWF as the latest climate reanalysis product, integrated Multi-satellite Retrievals for GPM Final Precipitation Version 06B (IMERG V06B-Final, hereafter IMERG) and the Near Real Time Global Satellite Mapping of Precipitation Version 6 (GSMaP_NRT v6, hereafter GSMaP) of NASA’s GPM, Multi-Source Weighted-Ensemble Precipitation Version 2 (MSWEP V2.0, hereafter MSWEP) and the Tropical Rainfall Measuring Mission 3B42v7 (TRMM 3B42v7, hereafter TRMM) of TMPA at a monthly scale. These eight products are classified into five main categories: (1) gauge-based products (CRU), (2) satellite-based products (GSMaP), (3) reanalysis products (ERA5), (4) gauge-corrected and satellite-based products (PERSIANN, TRMM, CMORPH and IMERG) and (5) merged products (MSWEP). Gauge-based products, satellite-based products and reanalysis products are only based on gauged precipitation, satellite data and reanalysis, respectively, while merged products combine gauge, satellite and reanalysis datasets. Gauge-corrected and satellite-based products are firstly based on satellite data and then corrected by gauged data. Among the five categories, one product was selected to represent each category except, four most commonly used products were chosen to represent gauge-corrected and satellite-based products. In this study, the data for four years from 2016 to 2019 from these eight products were used. The specific information regarding these products is summarized in Table 1.
The CMORPH product is a satellite precipitation product with a spatial resolution of 0.25° × 0.25° provided by the National Oceanic and Atmospheric Administration (NOAA). Since 1998, CMORPH V1.0 has provided two near-real-time and bias-corrected products named CMORPH-RAW and CMORPH-CRT. The product used in this study was CMORPH-CRT, which uses motion vectors derived from 3-hourly IR satellite imagery to propagate the relatively high-quality precipitation estimates derived from passive microwave (PMW) data [21]. It is bias corrected through matching a probability density function (PDF) of daily CMORPH-RAW against the CPC daily gauge analysis and the Global Precipitation Climatology Project (GPCP) over land and ocean from 1998 to the present.
The CRU TS dataset is one of the most widely used observed climate datasets and is produced by the UK’s National Center for Atmospheric Science (NCAS) at the University of East Anglia’s CRU. It provides monthly data on a 0.5° × 0.5° grid covering land surfaces (except Antarctica) from 1901 to 2020 with ten variables, all based on near-surface measurements. Version 4 of this dataset used an improved interpolation process, which delivers full traceability back to station measurements. In addition, cross-validation was performed at the station level, and the results can be examined to guide the accuracy of the interpolation.
The ERA5 dataset is a reanalysis product that provides monthly data with a spatial resolution of 0.1° × 0.1° covering the global areas (90°N–90°S) from 1979 to the present. It is the latest product of global reanalysis from the European Center for Medium-Term Weather Forecast with much higher spatiotemporal resolutions compared with ERA-Interim. This product combines vast amounts of historical observations into global estimates using advanced modeling and data assimilation systems. Currently, it has replaced the ERA-Interim reanalysis, which stopped being produced on 31 August 2019.
The GSMaP product was produced using the Japan Aerospace Exploration Agency (JAXA) Global Rainfall Watch System based on the combined MW-IR algorithm using extensive satellite data from both PMW and IR sensors. It has a quasi-global coverage (60°N–60°S) with high spatial and temporal resolutions (0.1° × 0.1°). The GSMaP_NRT dataset used here is a near-real-time version of the GSMaP algorithm.
The IMERG product was generated through the intercalibration, interpolation and integration of “all” microwave satellite-based precipitation estimates, precipitation gauge analyses, microwave-calibrated IR satellite estimates and other precipitation estimators [52]. It currently covers the quasi-global areas ranging from 60°N–60°S with a 0.1° × 0.1° spatial resolution. Version 6 of this product used in this study includes many major improvements over previous versions.
The MSWEP is a global merged dataset that provides data with a 0.1° × 0.1° spatial resolution available from 1979 to the present. This product is unique in that it merges gauge, satellite and reanalysis data to obtain the highest quality precipitation estimates at every location. It incorporates daily gauge observations and accounts for gauge-reporting times to reduce temporal mismatches between satellite reanalysis estimates and gauge observations. Version 2 of this dataset features new data sources, improved weight maps, less peaky precipitation estimates, a longer record, near real-time estimates and compatibility with multisource weather (MSWX).
The PERSIANN product was produced using network function classification or approximation procedures based on geostationary IR brightness temperature images and daytime visible imagery [53,54]. Since conversion from IR to precipitation rate requires a complex algorithm, it relies heavily on IR data. It covers an area from 60°N to 60°S globally with a 0.25° × 0.25° spatial resolution from 1982 to the present and was developed by the Center for Hydrometeorology and Remote Sensing (CHRS) at the University of California, Irvine (UCI).
The TRMM is a joint mission between NASA and JAXA developed to provide a detailed dataset of rainfall distribution over tropical and subtropical regions [55]. This mission is intended to provide estimates of quasi-global rainfall at a relatively high spatial resolution (0.25° × 0.25°) in both real time and post real time, which is calibrated with monthly rain gauge data from the Global Precipitation Climatology Center (GPCC) [24]. The dataset combines IR data from geosynchronous Earth orbit (GEO) and PMW data from LEO satellites. The TRMM product used here is TMPA’s data product (3B43 monthly precipitation data of Version 7), which adjusts its bias based on monthly rain gauge observations. It covers an area from 50°N to 50°S with a 0.25° × 0.25°spatial resolution from 1982 to 1 January 2020.
In preliminary data exploration, the monthly precipitation data in December 2018 from the MSWEP were found to be abnormal with extremely high values. By referring to the observations from national meteorological stations and gathering local weather information, we defined the data as outliers of precipitation in December 2018 from the MSWEP. Consequently, these data were excluded when we directly compared the values and calculated indices to evaluate accuracy. However, it remains to be explored in the future why these abnormal data appear in the MSWEP, which is also an important factor that would affect the evaluation of accuracy.

2.2.2. Gauged Precipitation

To evaluate the accuracy of the eight precipitation products mentioned above, these datasets were compared with precipitation observations at gauges from national meteorological stations and automatic weather stations, which provide relatively accurate local information. Therefore, daily precipitation observations from 17 available national meteorological stations and 10 min precipitation observations from 6 available automatic weather stations over the HRB from January 2016 to December 2019 were downloaded from the China Meteorological Data Service Center (http://data.cma.cn/en, accessed on 25 February 2021) and the Third Pole Environment Data Center (http://data.tpdc.ac.cn/en/, accessed on 23 March 2021). Several automatic weather stations were not selected since they lack records of data in a year or more from 2016 to 2019. To cover as many rain gauges as possible, five stations outside the HRB but fairly close to its boundary were included. All the stations chosen had no missing data during the study period. A summary of the information regarding these stations is listed in Table A1. All records from these two station groups were strictly quality controlled before being made public and they have been used in extensive studies.

3. Methodology

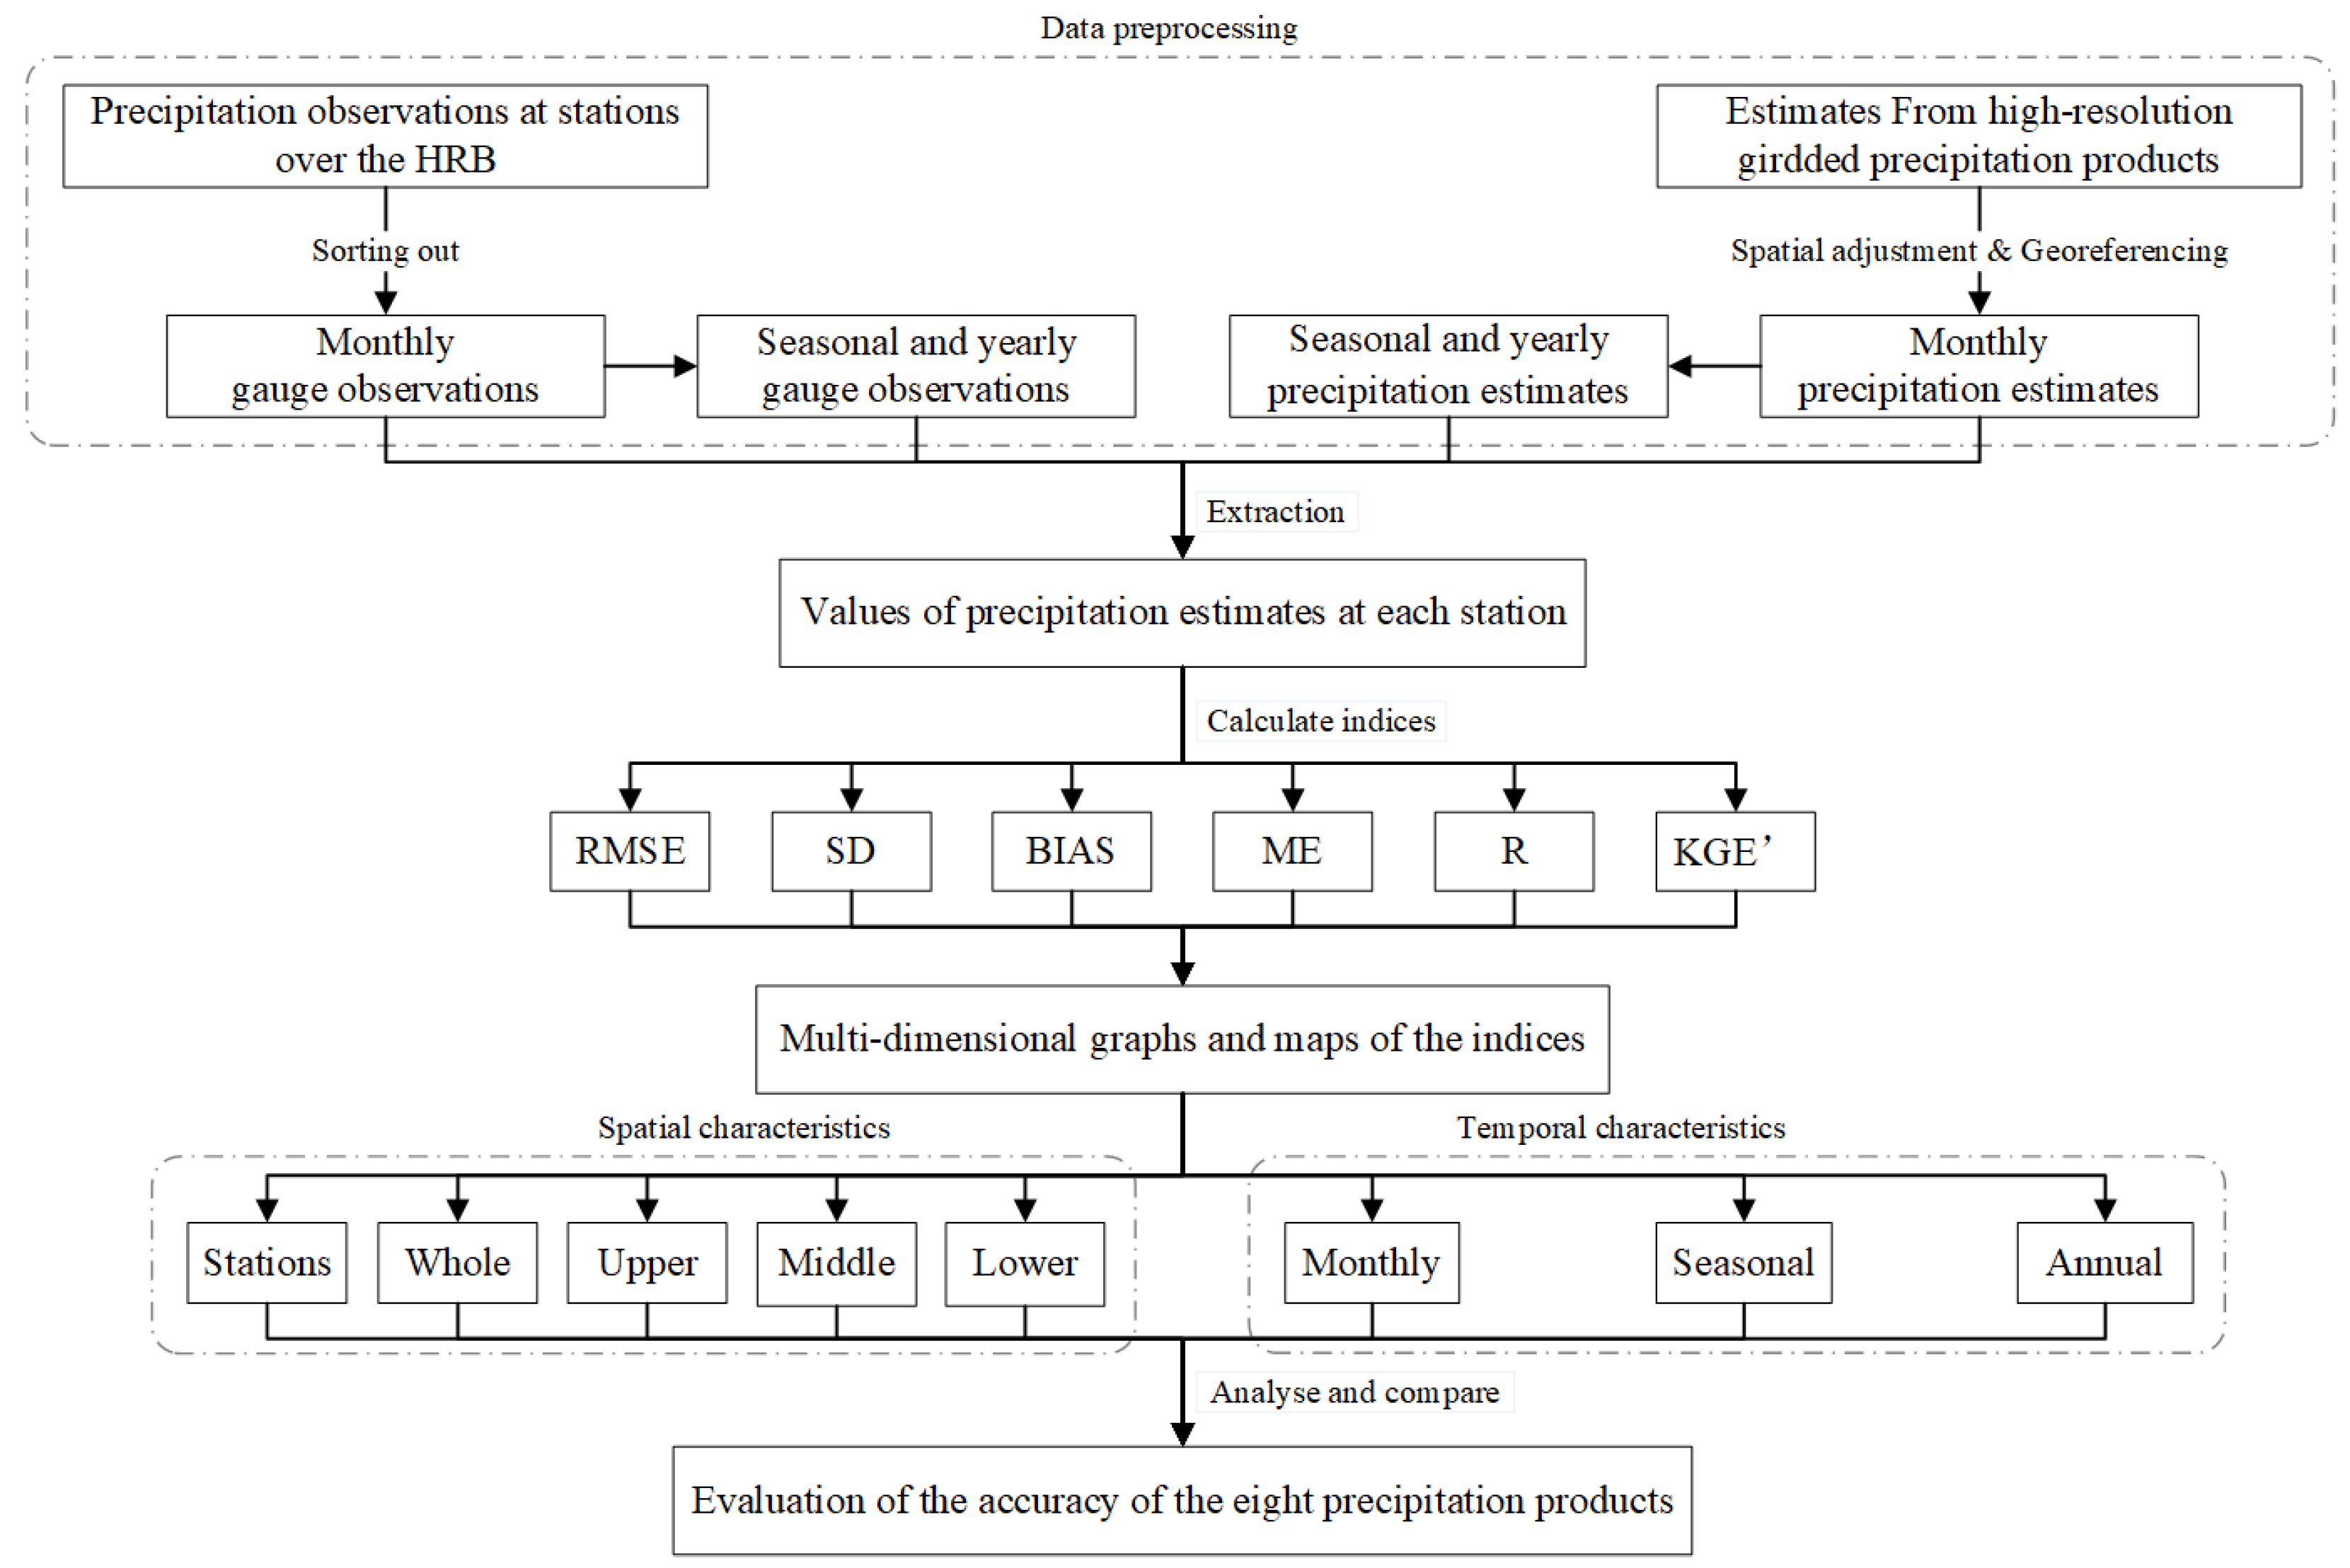
3.1. Data Preprocessing

In regard to the time scale, all three-consecutive-monthly data for each season were accumulated as seasonal data: December to February (winter), March to May (spring), June to August (summer) and September to November (autumn). The data of all 12 months were accumulated as the annual precipitation. Among all products downloaded, part of the data was at a daily scale, and the accumulated data of each day in a month were the corresponding monthly data. In regard to the spatial scale, all data had to be unified under the same projection and geographic coordinate system (GCS_WGS_1984) through spatial adjustment and georeferencing, and the unit (mm) of all products was unified through raster calculation.

3.2. Evaluation Method

In this study, the value of each precipitation product at its spatially corresponding station was extracted to provide a direct comparison with the contemporaneous ground observations. The results using the center of each nearest cell without applying interpolation and the results calculated from the adjacent cells with valid values using bilinear interpolation are almost the same. To evaluate the accuracy of these precipitation products, this study adopted five statistical indices, including the root mean square error (RMSE), the standard deviation (SD), the Pearson correlation coefficient (R), the relative deviation (BIAS) and the mean error (ME). The RMSE is used to evaluate the overall level of error with its value inversely related to the accuracy; SD can reflect the standard error of the precipitation products and the degree of dispersion of the dataset; R is used to measure the closeness of the linear correlation between the observed value and the estimated value; and BIAS is used to evaluate the average trend of the precipitation estimates with respect to the error of the precipitation gauges. ME is the average error between the estimation value and the observation value. They can be calculated as:
RMSE = 1 n i = 1 n ( x i y i ) 2
SD = 1 n i = 1 n ( x i x ¯ ) 2
R = i = 1 n ( x i x ¯ ) ( y i y ¯ ) i = 1 n ( x i x ¯ ) 2 i = 1 n ( y i y ¯ ) 2
BIAS = 1 n i = 1 n ( x i y i ) i = 1 n y i × 100 %
ME = 1 n i = 1 n ( x i y i )
where n is the total number of data records; i is the i-th data point in the entire dataset; xi is the value of satellite, merged or reanalysis-based precipitation product; and yi is the value of gauged precipitation at the stations.
The Kling–Gupta efficiency (KGE′) statistic proposed by Gupta et al. [56] and modified by Kling et al. [57] was also used in this study, which balances the contributions of the correlation, bias and variability terms. The KGE’ can be calculated as:
KGE = 1 ( r 1 ) 2 + ( β 1 ) 2 + ( γ 1 ) 2
β = μ t a r μ r e f
γ = C V t a r C V r e f = σ t a r / μ t a r σ r e f / μ r e f
where r is the R between the reference (ref) dataset and target (tar) datasets, ref refers to the observed precipitation at stations, tar refers to the estimated precipitation from the different precipitation products, β is the bias ratio, γ is the variability ratio, μ is the mean value, CV is the coefficient of variation and σ is the SD. The KGE’ ranges in (−∞, 1]. The larger the value is, the better the dataset performs.
The technical route of this study is shown in Figure 2.

4. Results

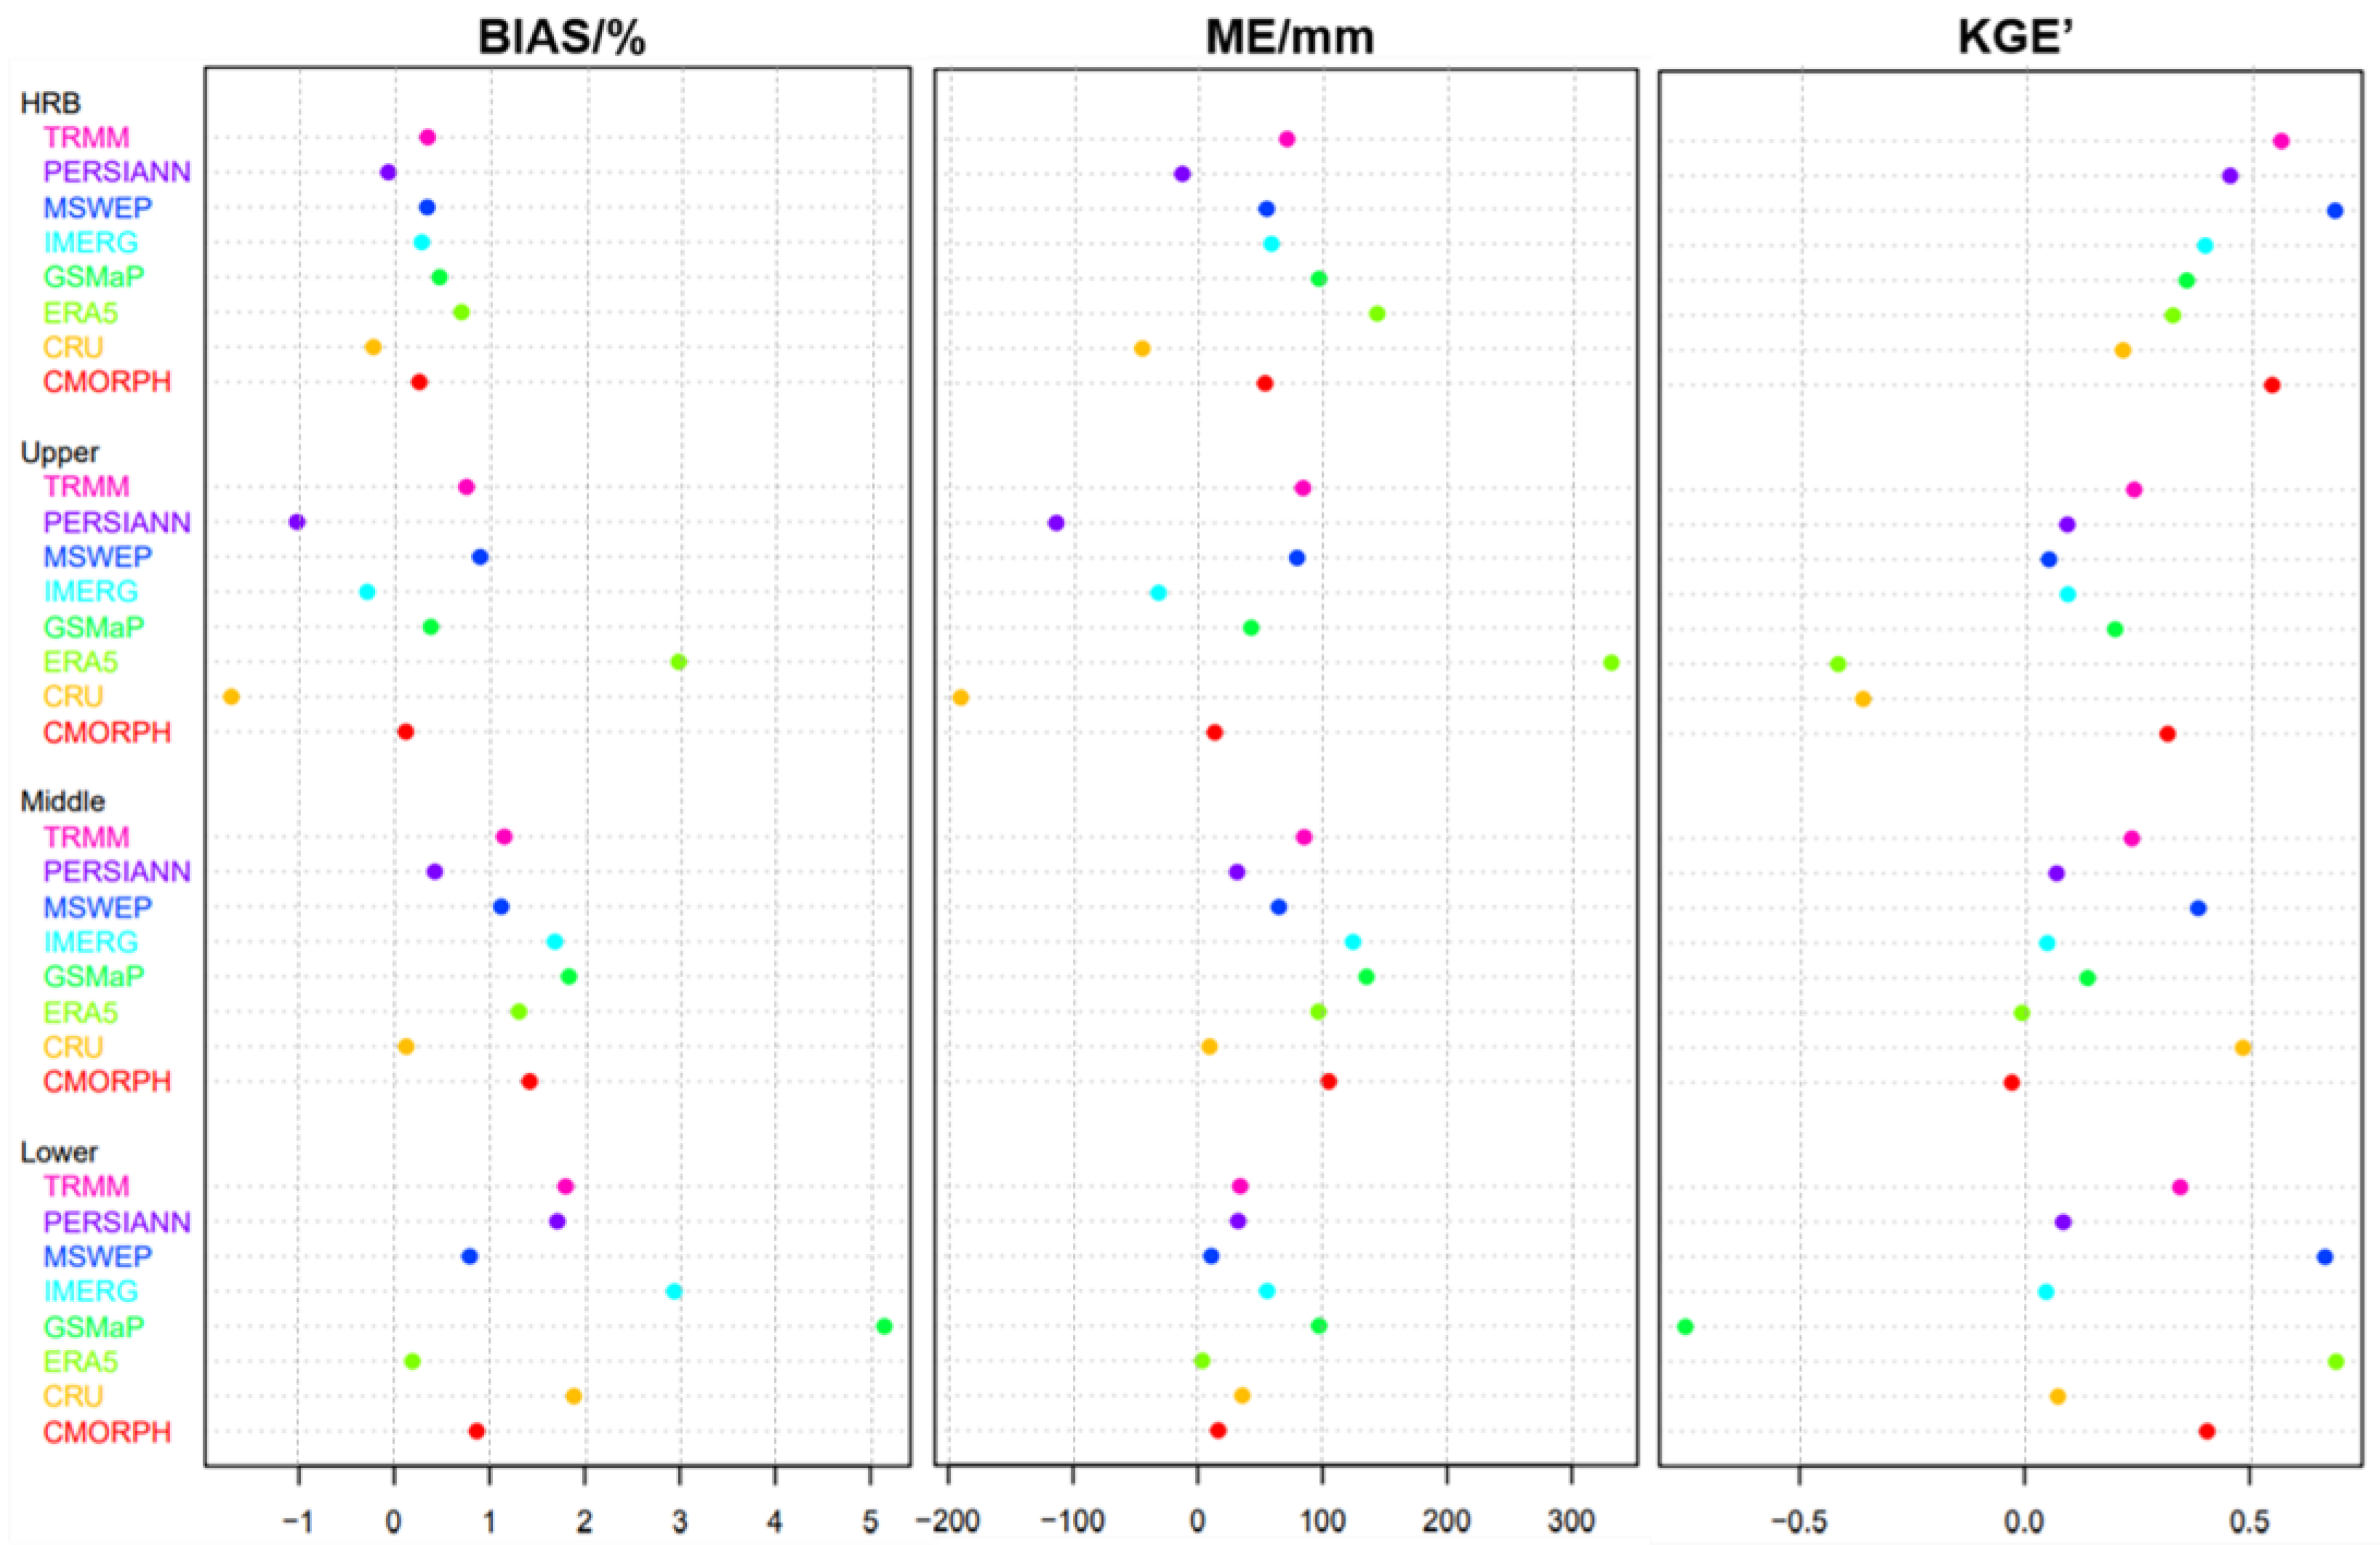
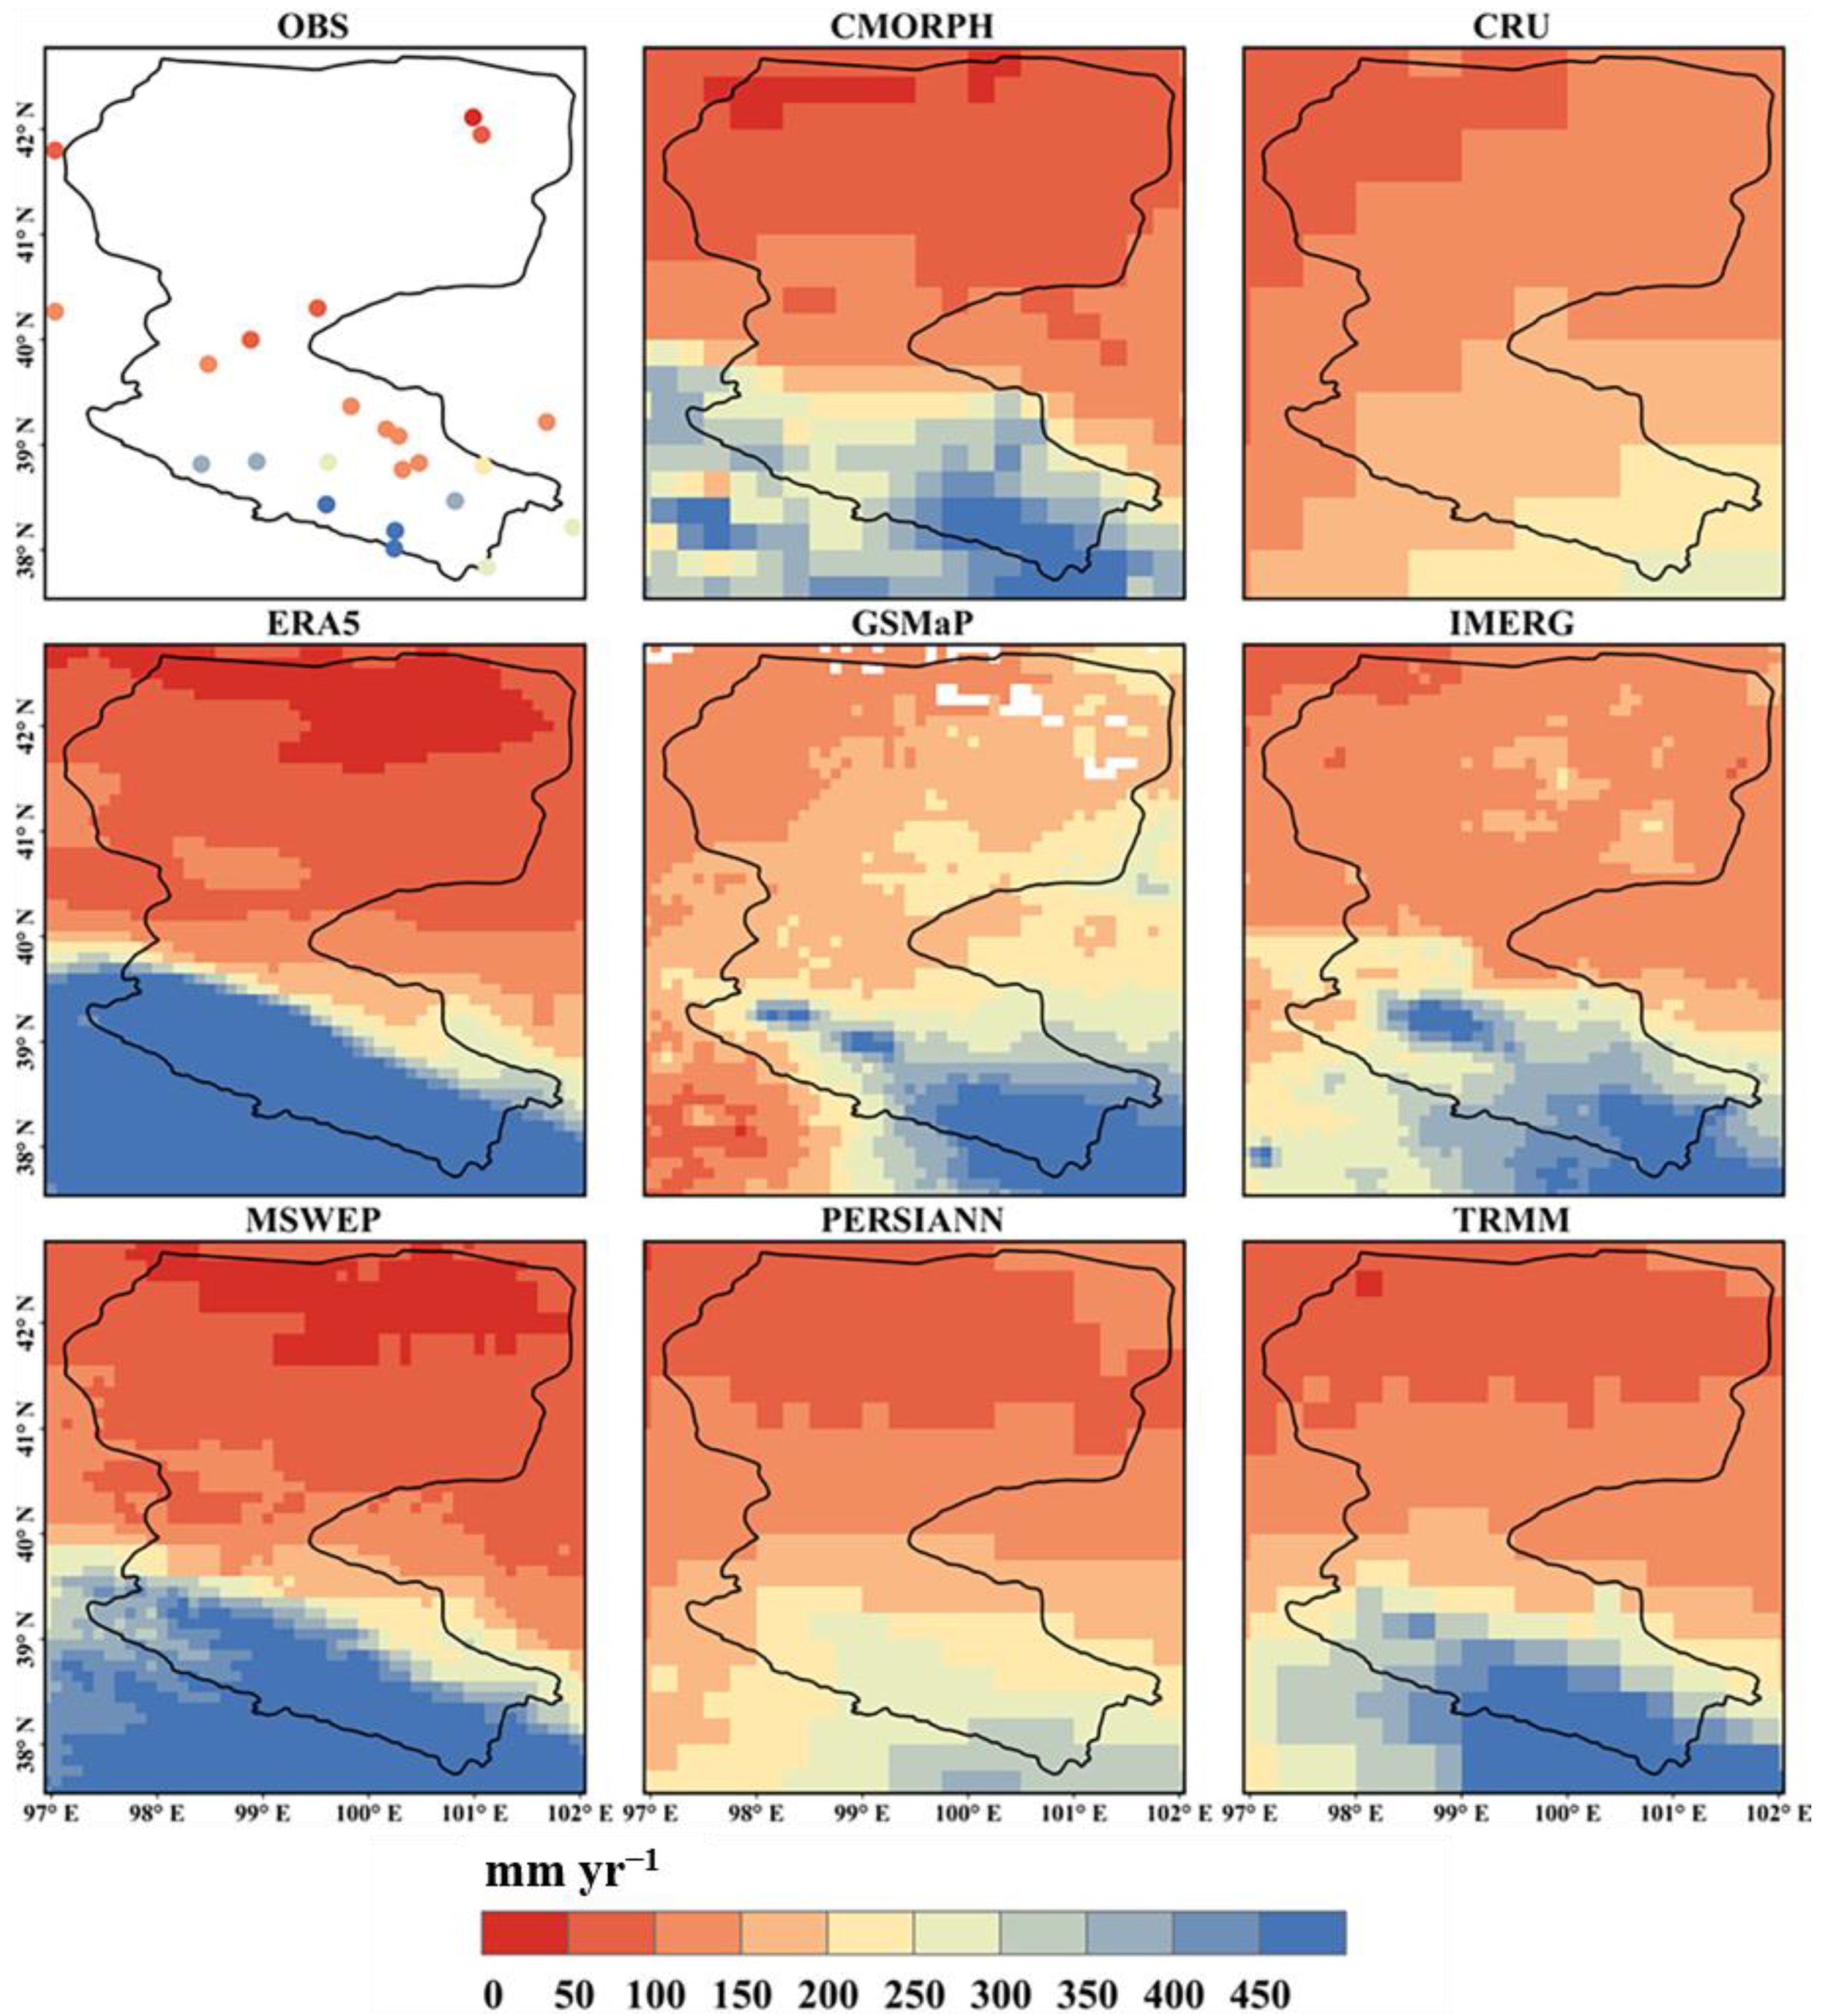
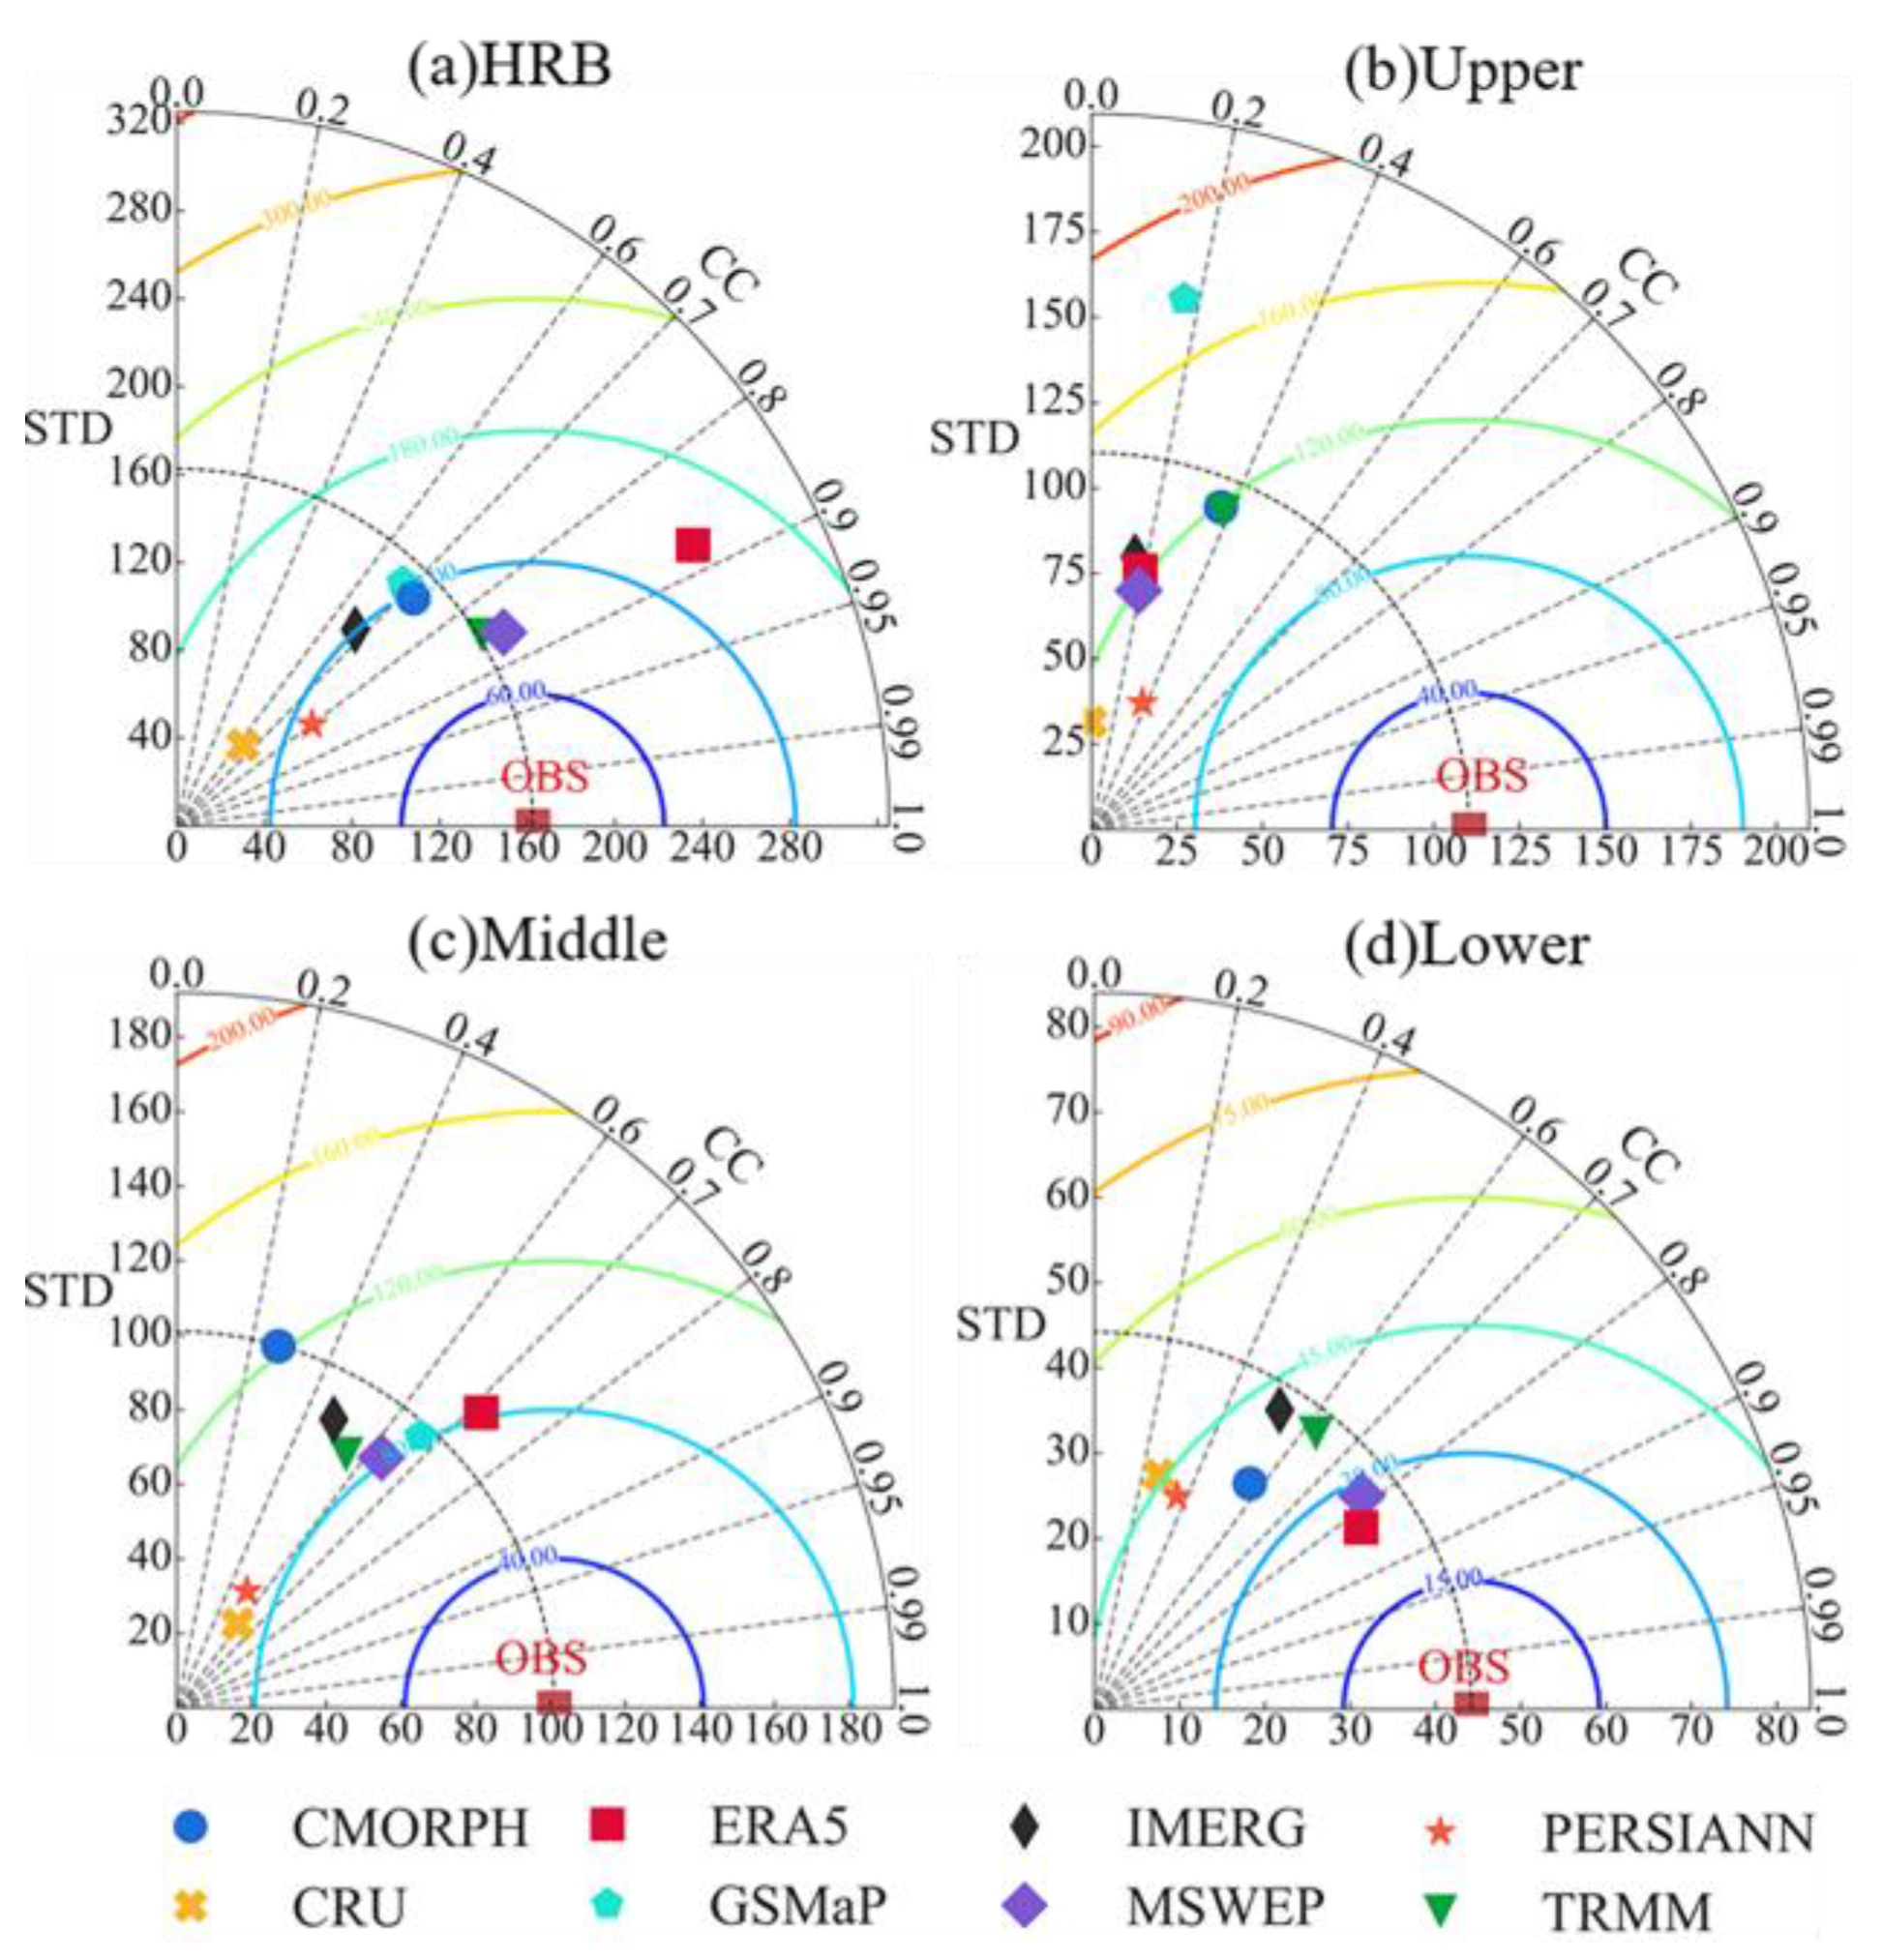
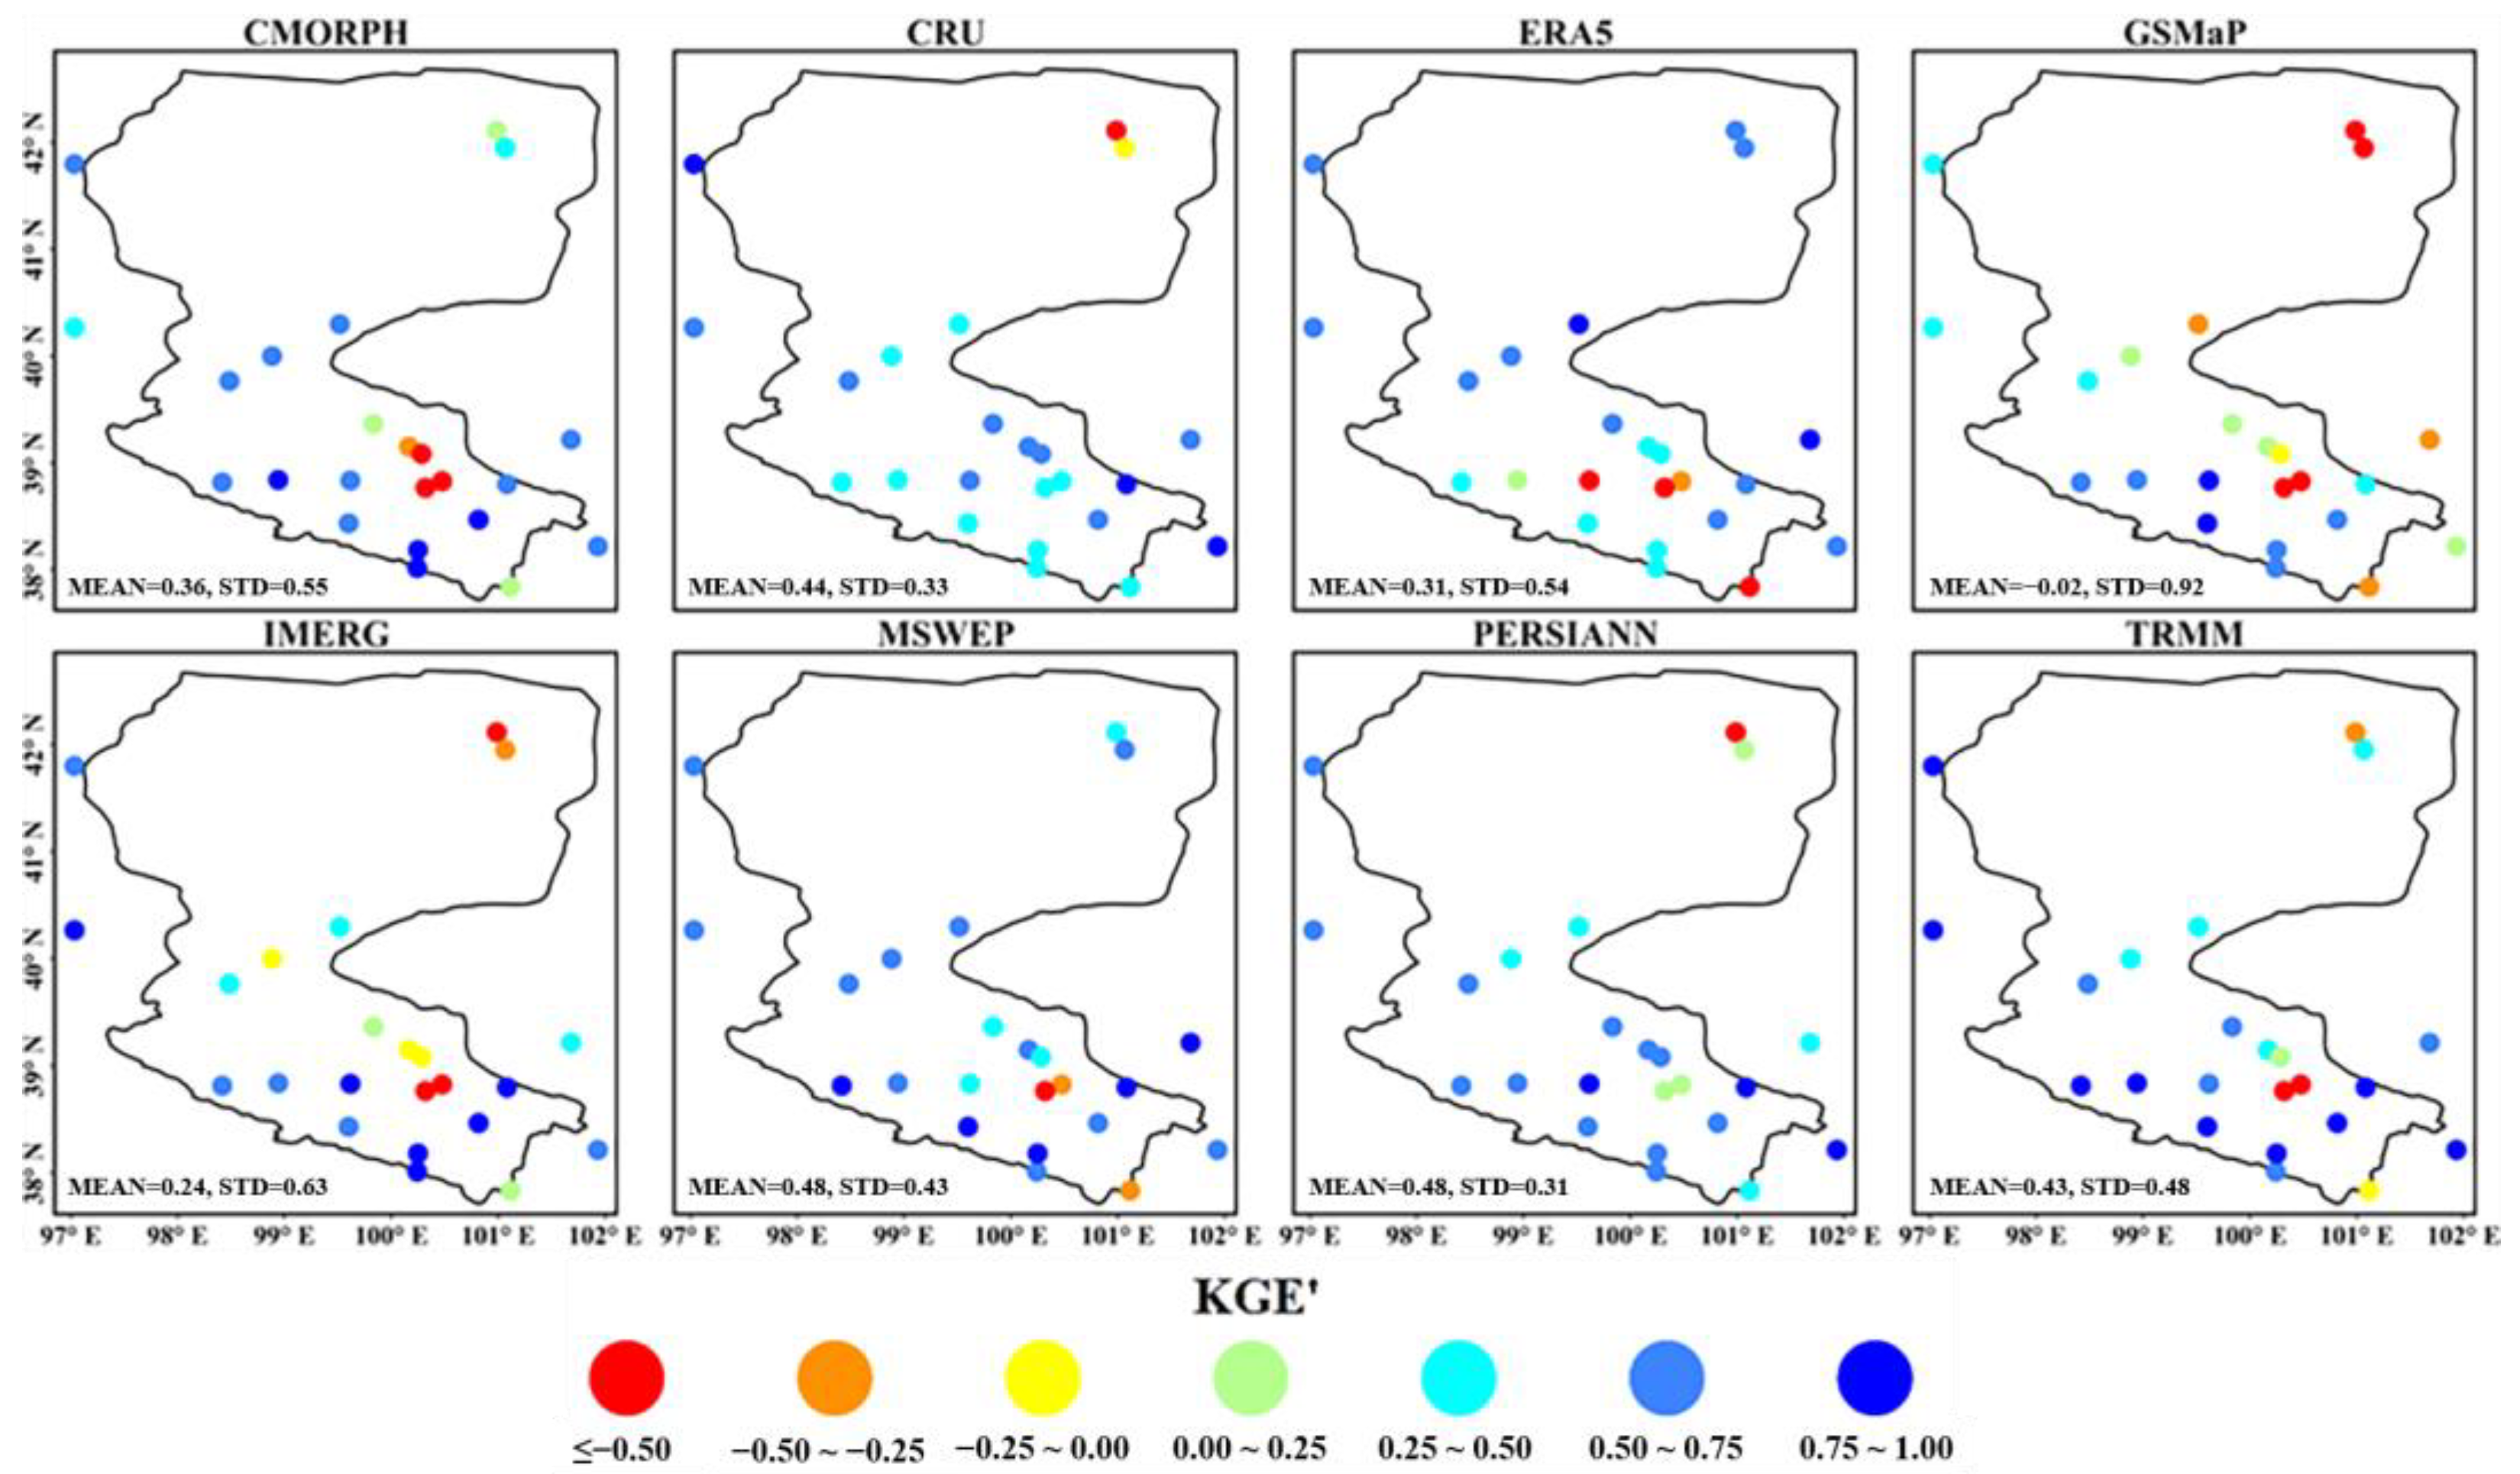
4.1. Accuracy Evaluation at an Annual Scale

The spatial distributions of annual mean precipitation over the HRB during 2016–2019 are displayed in Figure 3. The mean annual precipitation according to the observations at stations shows obvious regional differences. It indicates an increasing trend from less than 50 mm in the lower reaches of the basin to more than 450 mm in the upper reaches of the basin. This indicates that the mountain area with higher elevation in the southern part of the HRB gains more precipitation than the plains and desert area with lower elevation in the northern part of the HRB. The annual mean precipitation of the eight products shares certain characteristics consistent with those of the observations at stations: precipitation increases from the lower to the upper reaches of the HRB, with the least precipitation appearing in the northern region and the most precipitation appearing in the southern region. However, there are still differences in how each product performs. Among them, CRU and PERSIANN both tend to underestimate the annual precipitation in the upper reaches of the HRB, with CRU more obviously doing so (less than 300 mm), while ERA5 and MSWEP both tend to overestimate the annual precipitation in the same area, with ERA5 more obviously doing so (almost all over 450 mm in the upstream region). Nevertheless, CRU and PERSIANN overestimate precipitation in the downstream region (no less than 50 mm). In addition, GSMaP also appears to overestimate the annual precipitation in the lower reaches of the HRB, which is even greater than CRU and PERSIANN (no less than 100 mm).
For further exploration of the performance of these eight products at an annual scale, values of the nearest grid cells of annual precipitation for each product at its spatially corresponding station were extracted. Then, three indices, including the BIAS, ME and KGE’, of the annual precipitation from each product over the entire HRB and its upper, middle and lower reaches were calculated (Figure 4).
In the entire HRB, regarding the deviation, it is shown that among all products, only CRU and PERSIANN tend to underestimate precipitation, but PERSIANN has better statistical results than CRU. Among the other products that tend to overestimate precipitation at an annual scale, CMORPH performs the best (BIAS = 0.265%, ME = 54.05 mm), and ERA5 appears to be the worst product which tends to considerably overestimate the amount of precipitation in the entire HRB (BIAS = 0.71%, ME = 143.93 mm). However, comprehensively considering the correlation, bias ratio and variability ratio of each product at an annual scale in the HRB, MSWEP outperforms the other products (KGE’ = 0.69) with the best performance in terms of deviation, and CRU displays the most undesirable performance.
Furthermore, in the sub-regions of the HRB, the accuracy of these products exhibits pronounced spatial heterogeneity. In the upper reach area, CRU and PERSIANN still underestimate precipitation, with PERSIANN (BIAS = −1.02%, ME = −113.42 mm) still showing higher consistency with the observations than CRU (BIAS = −1.71%, mm = −190.05 mm). ERA5 (BIAS = 2.98%, ME = 331.75 mm) still performs the worst, while CMORPH (BIAS = 0.12%, ME = 13.65 MM) still provides the most favorable result among the products that tend to overestimate precipitation. However, CMORPH displays more satisfactory precision than PERSIANN, thus being the best product among all products in the upper reach area. In the middle reach area, all products tend to overestimate precipitation, among which, however, CRU (BIAS = 0.13%, ME = 9.43 mm) outperforms the others, while GSMaP (BIAS = 1.83%, ME = 135.26 mm) has the largest bias. In the lower reach area, no product tends to underestimate precipitation, and ERA5 tends to overestimate the least (BIAS = 0.19%, ME = 3.61 mm), while GSMaP (BIAS = 5.14%, ME = 97.27 mm) still shows the most striking overestimation. These results are consistent with those indicated in Figure 3. For the KGE’ in the sub-regions, the overall value is much lower than that in the entire HRB, especially ERA5 (KGE’ = −0.41) and CRU (KGE’ = −0.36) in the upper reach area and GSMaP (KGE’ = −0.75) in the lower reach area. In addition, ERA5 (KGE’ = 0.69) and MSWEP (KGE’ = 0.67) are slightly superior to the other six products in the lower reaches of the HRB.
To gain better insights into the accuracy of these eight products at an annual scale, RMSE, R and SD were calculated and presented in Taylor diagrams (Figure 5). Taylor diagrams can concisely and appropriately summarize the degree of correspondence between the estimates from the precipitation products and observations at stations by considering the three statistical indices mentioned above: the spatial correlation (CC), RMSE and the standard deviations (STDs) in a quarter circle, with the points closer to the “OBS” point on the X-axis showing better accuracy. According to Figure 5, the overall accuracy of these products in the entire HRB is higher than that in the sub-regions; in the sub-regions, the overall performance in the lower reach area is better than that in the other two regions, while the overall performance in the upper reach area is the least favorable. However, it remains to be tested whether this worse performance in the upper reaches is caused by the lower accuracy of the products or the larger amount of precipitation in this area.
In the entire HRB, all products display a strong correlation with the observations (R ≥ 0.6), among which, ERA5 and MSWEP show the strongest correlation (R close to 0.9). In addition, MSWEP has the best statistical results overall, and TRMM also shows a relatively good performance; in contrast, CRU and ERA5 are the least accurate. In the upper reach area, all products perform relatively poorly, and PERSIANN is slightly superior to the others. In the middle reach area, MSWEP, GSMaP and ERA5 show more satisfactory precision, while CMORPH appears to be the least accurate. However, in the lower reach area, CMORPH appears to be a more reliable source for precipitation than in the upper and middle reaches, and ERA5 performs the best, while CRU again has the relatively worst performance.

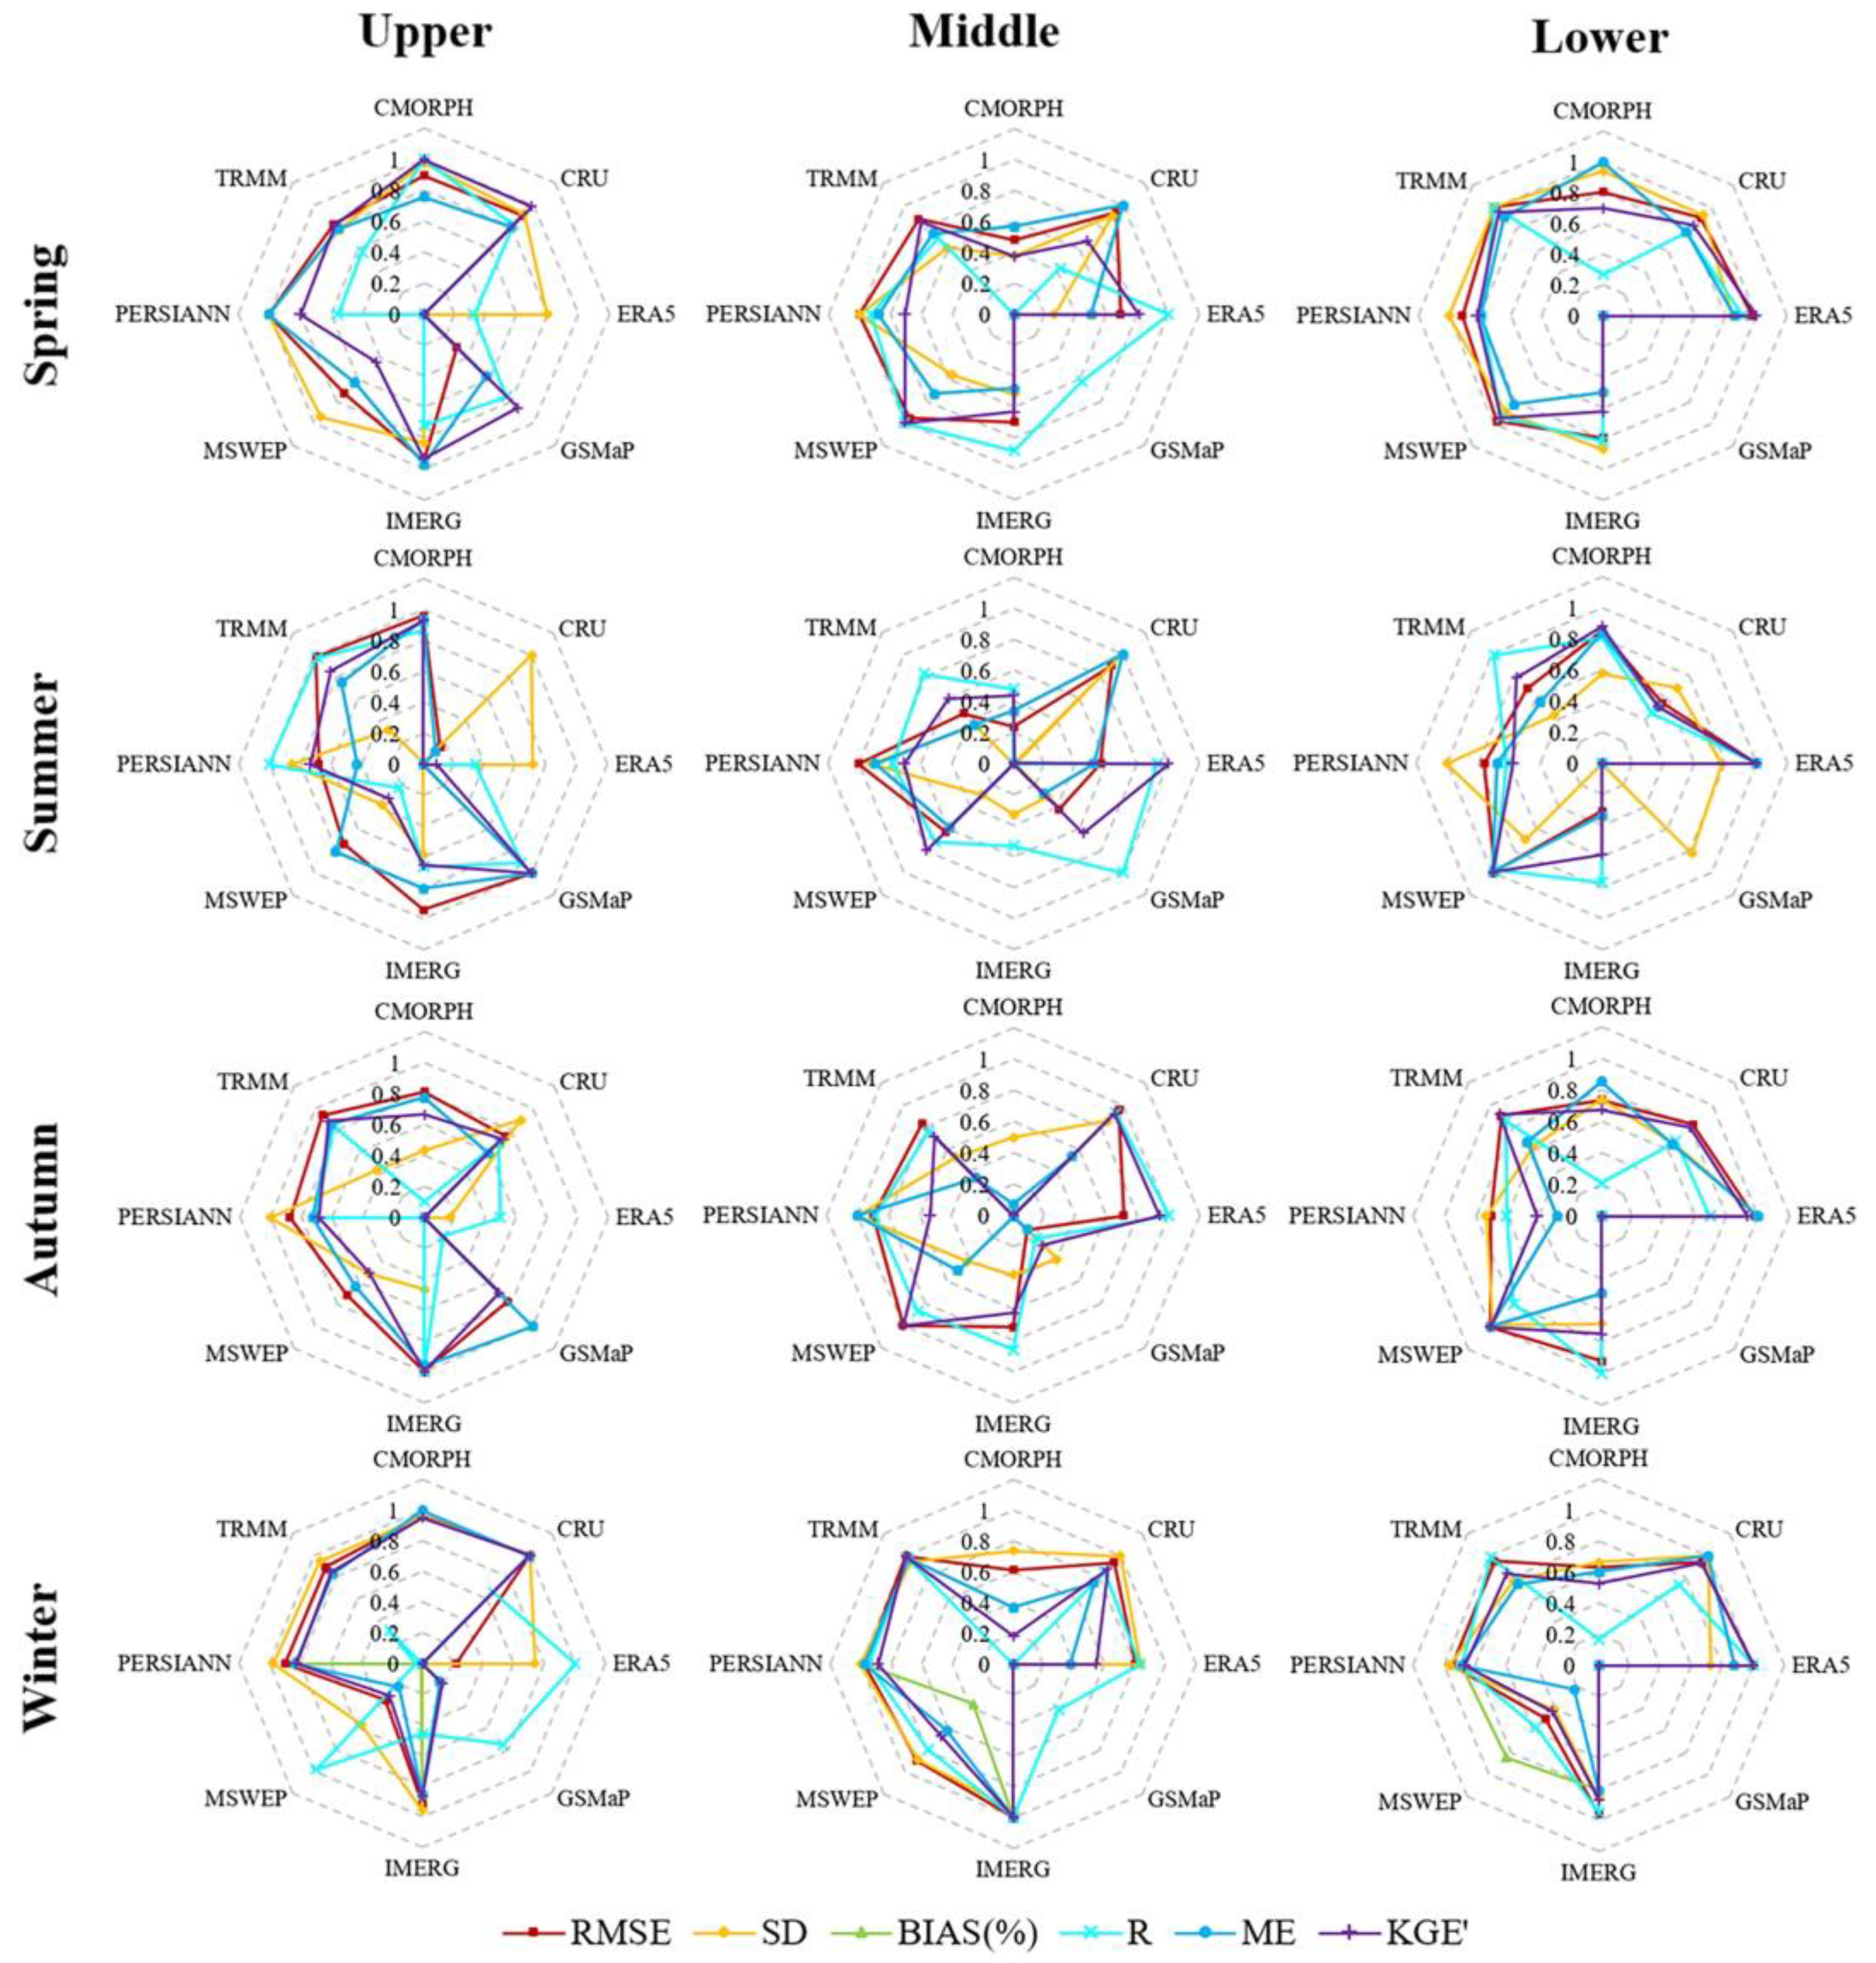
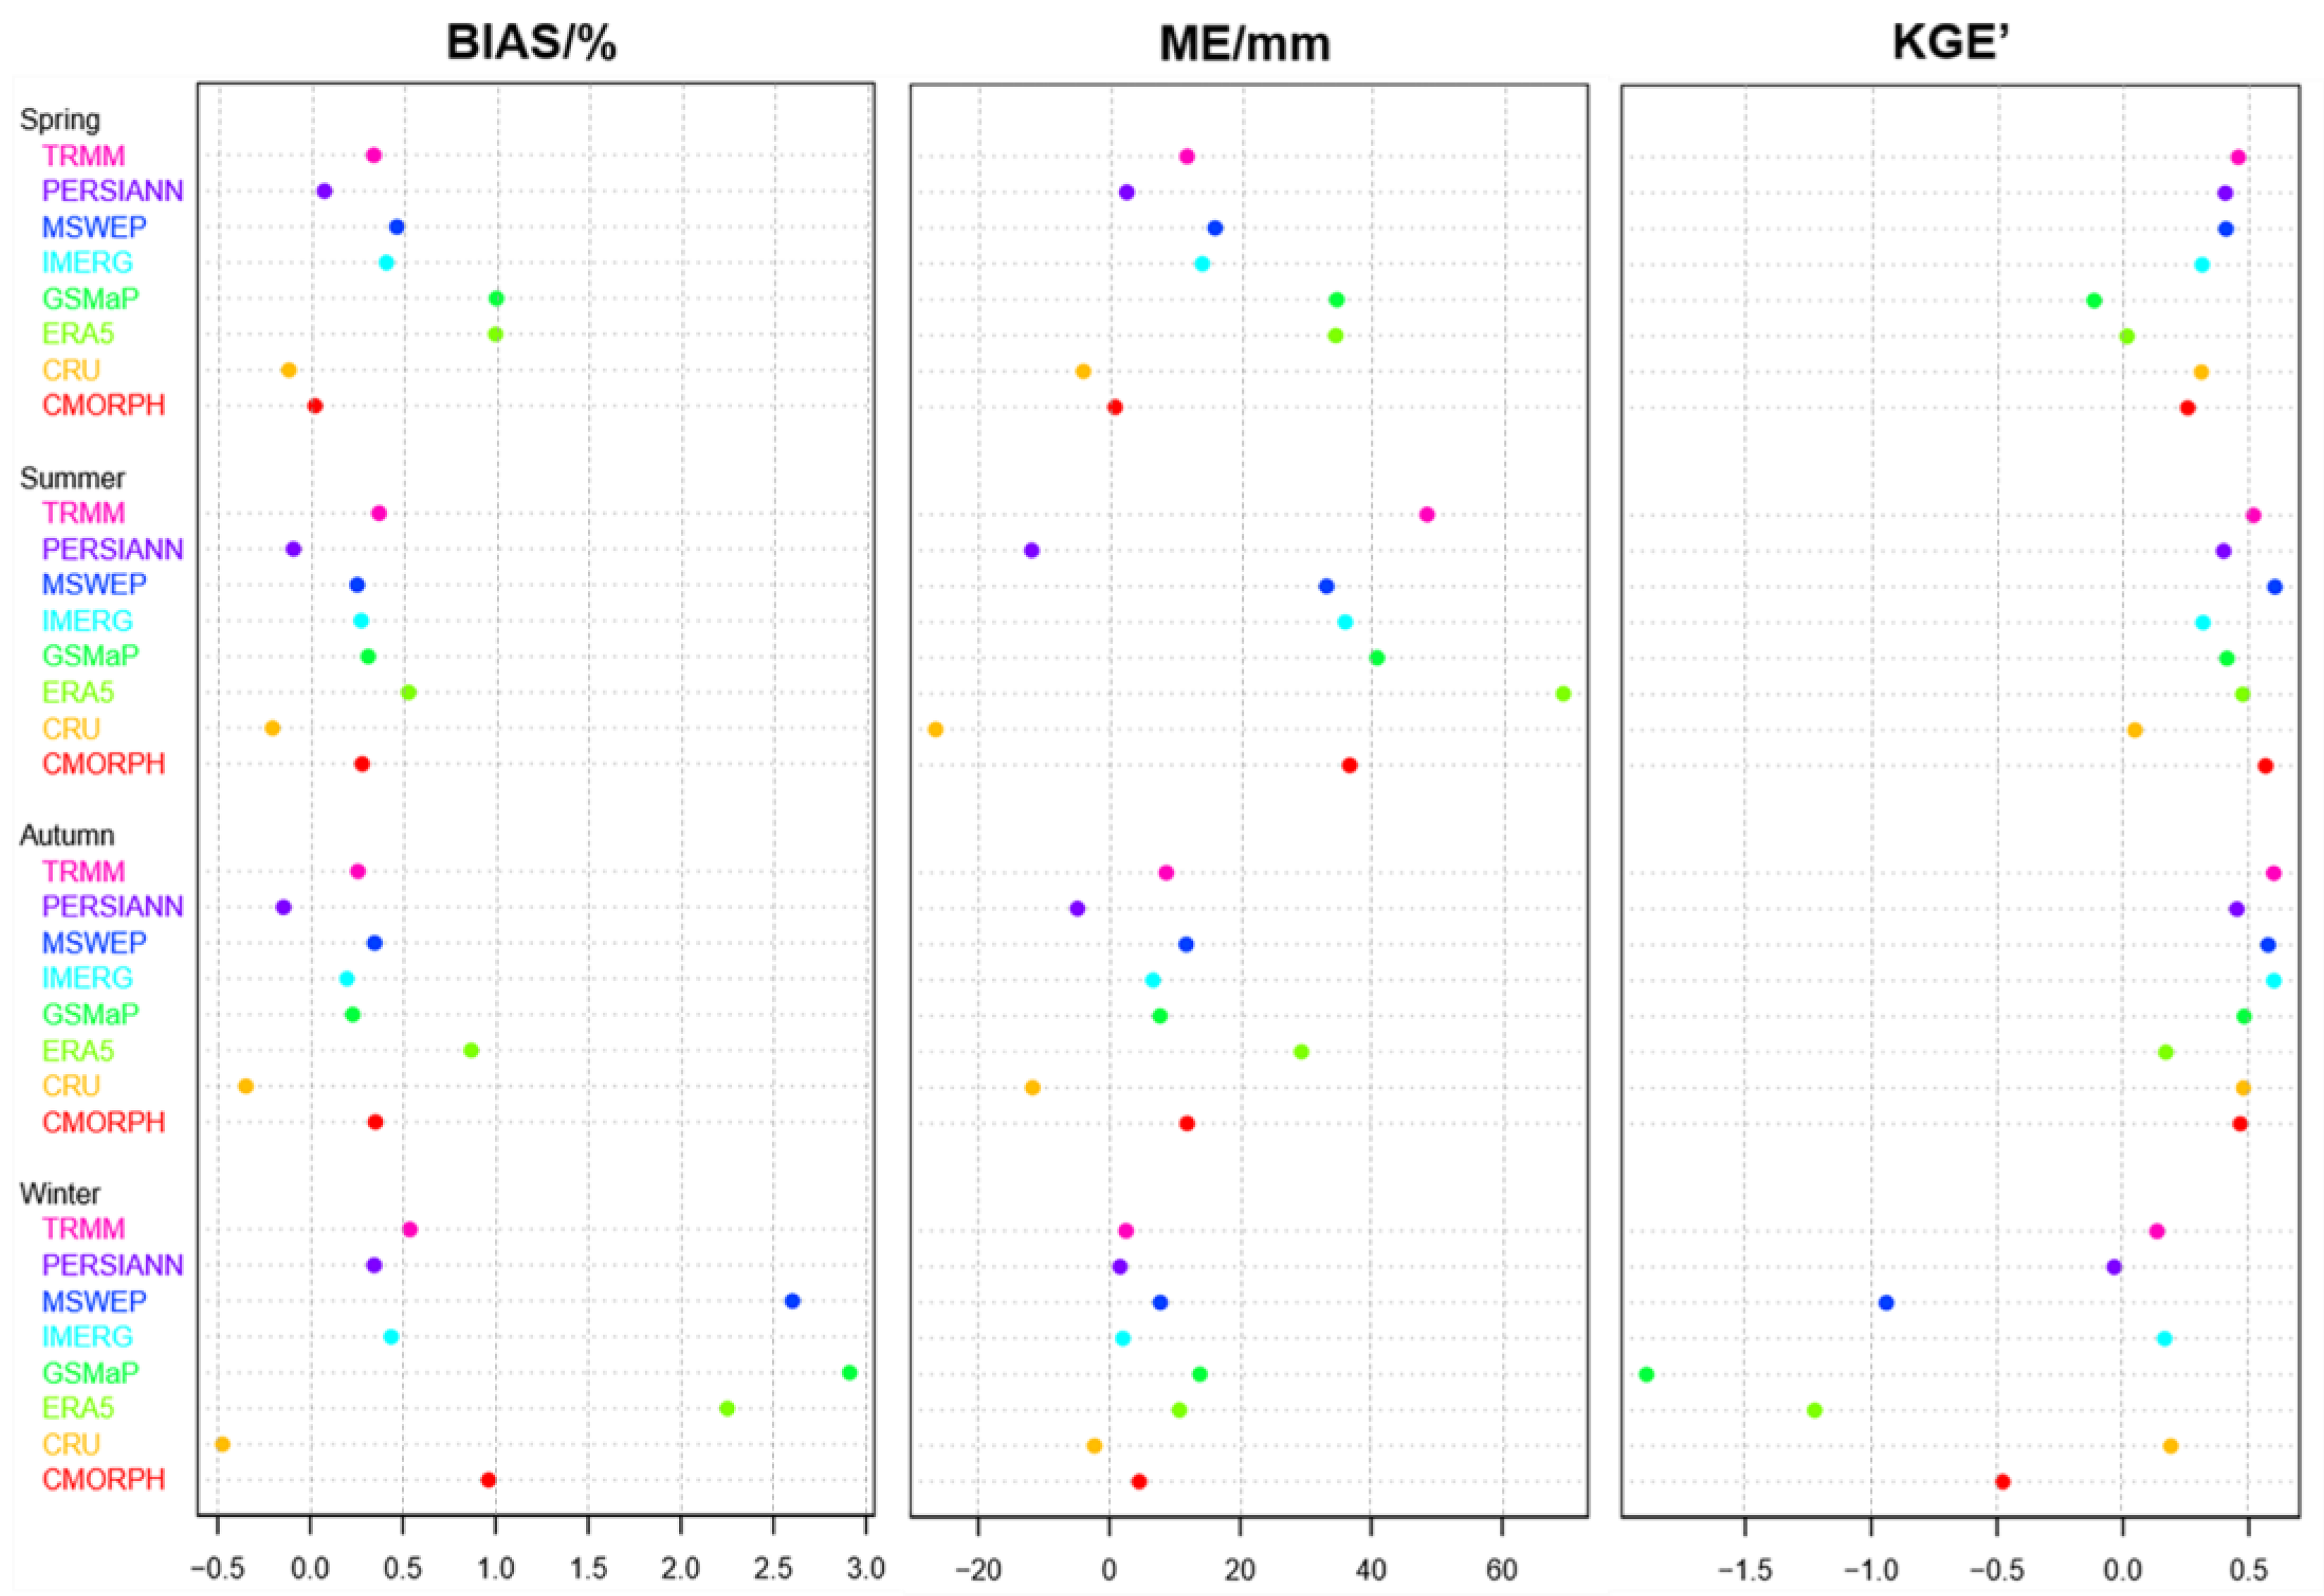
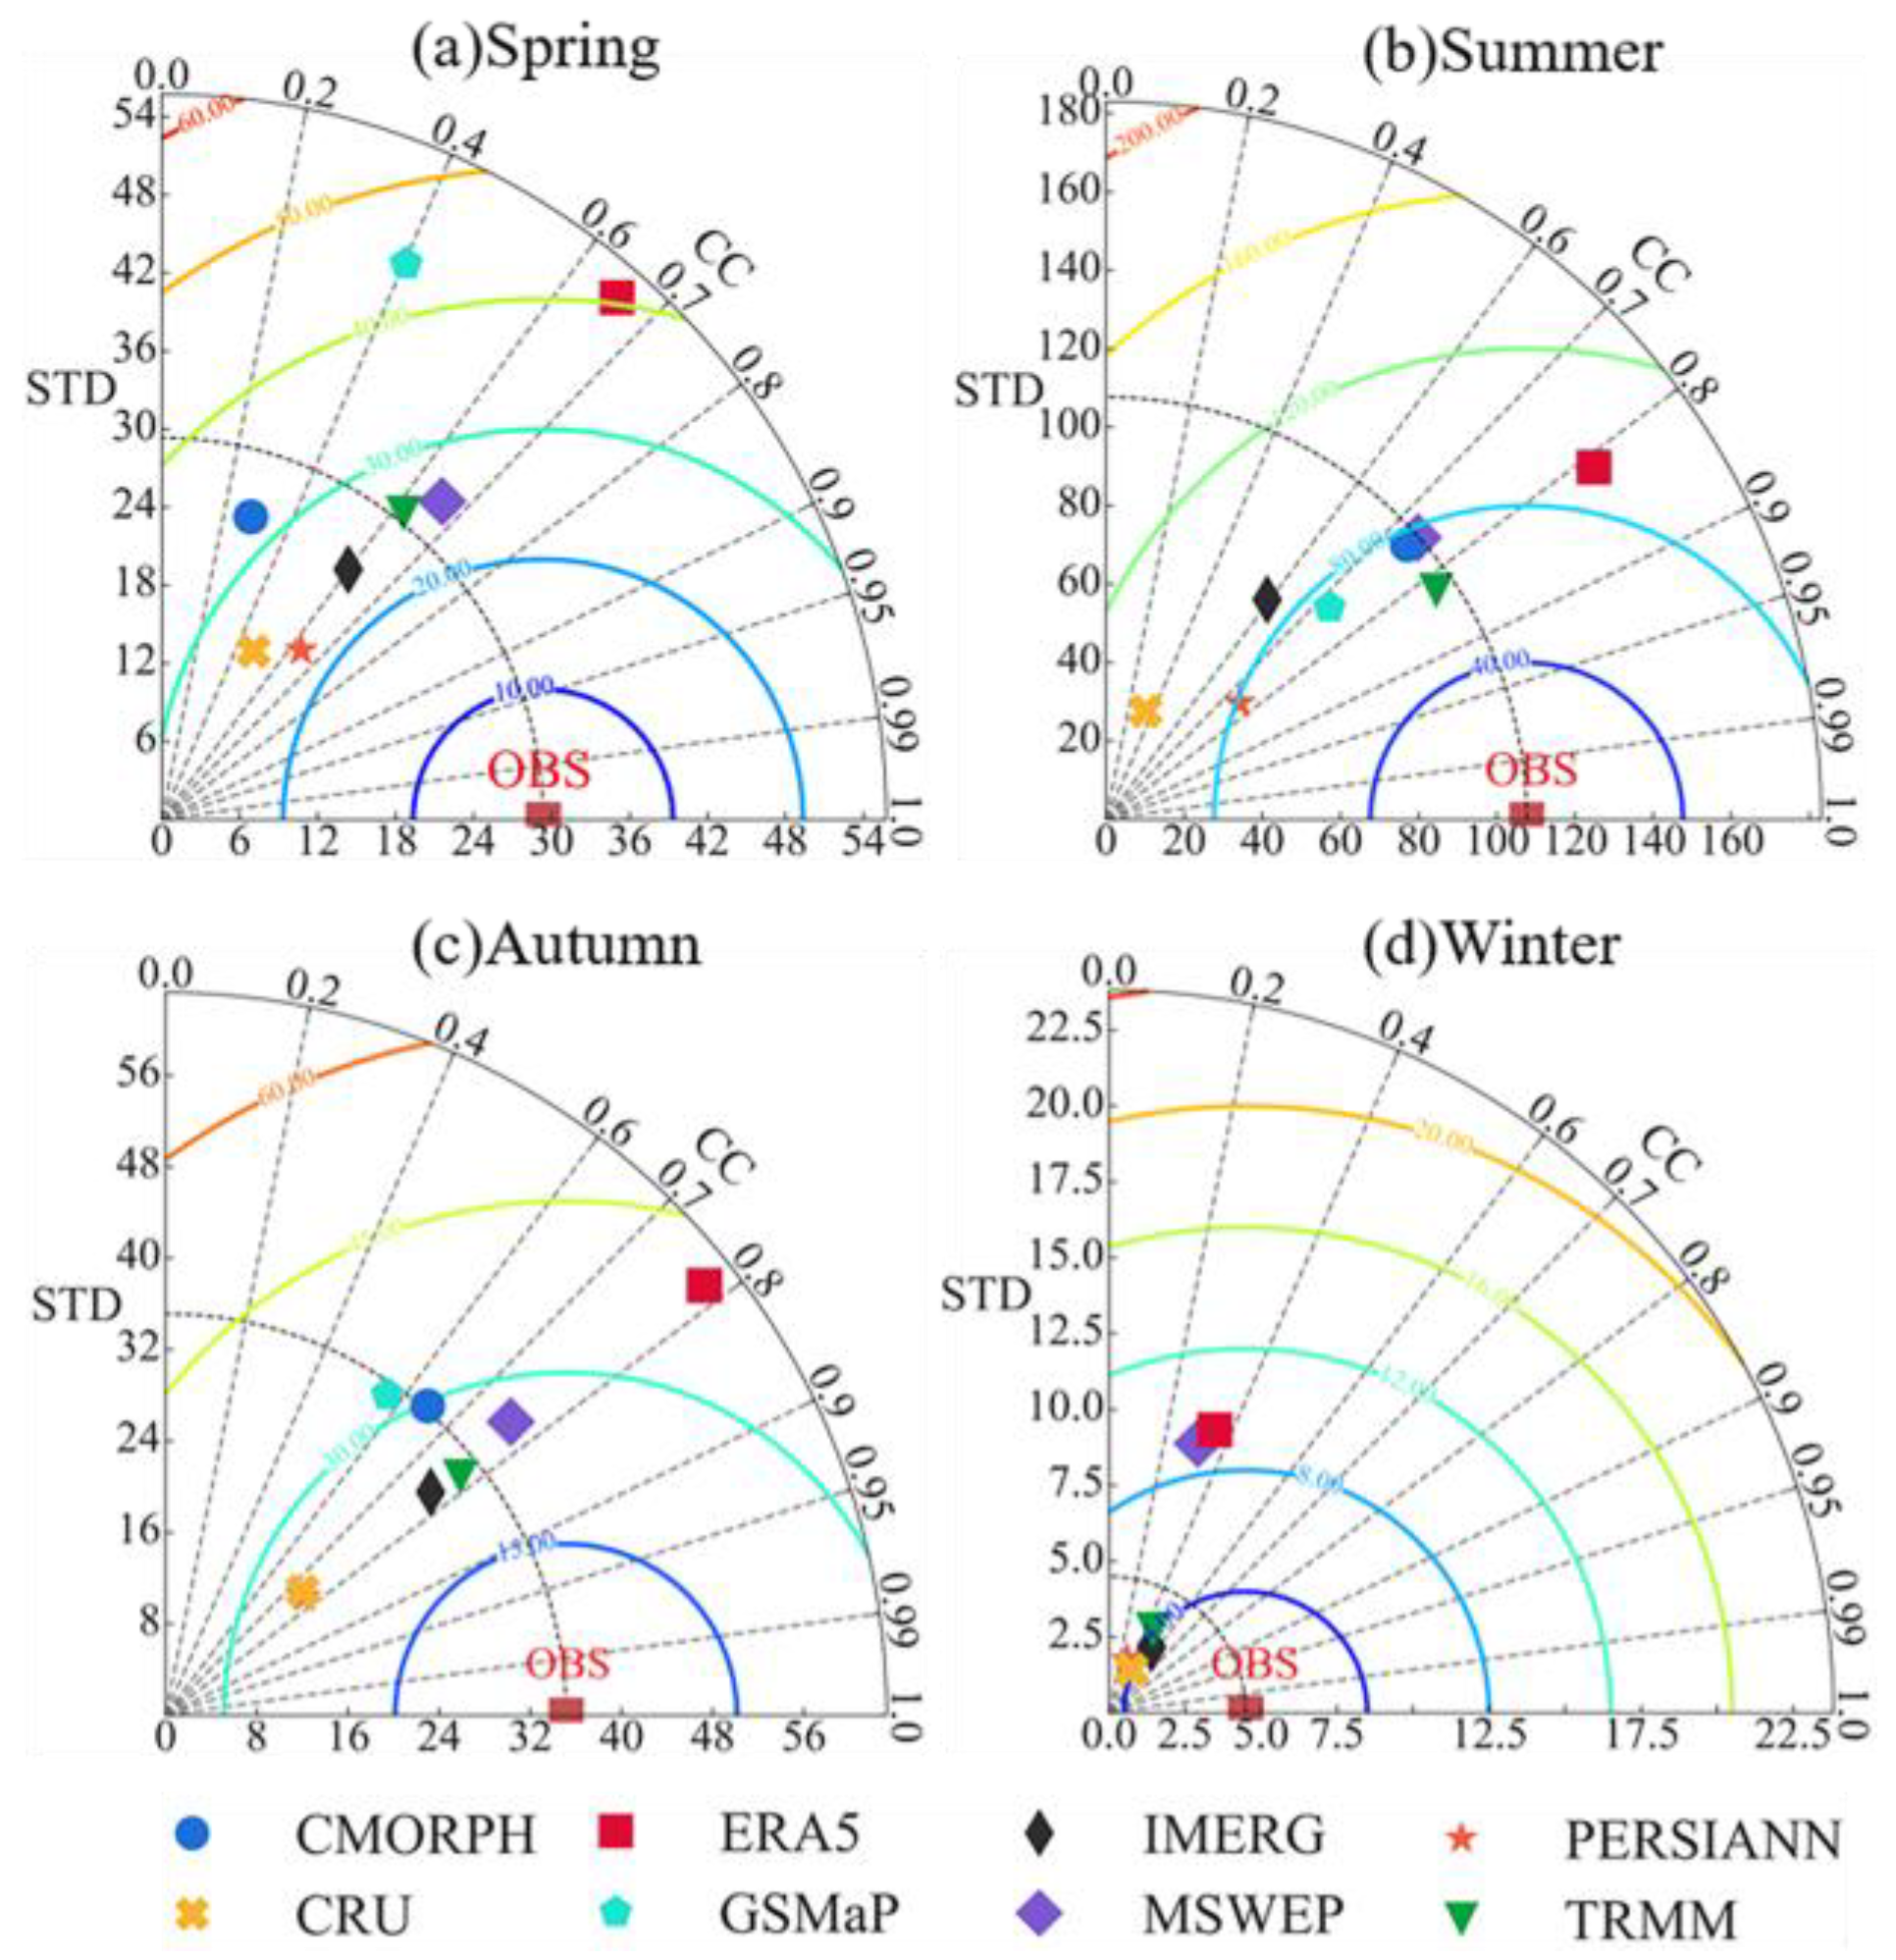
4.2. Accuracy Evaluation at a Seasonal Scale

4.2.1. Performance in the HRB

To further evaluate the accuracy of these products over the entire HRB at a seasonal scale, indices including the BIAS, ME and KGE’ of the seasonal precipitation for each product over the entire HRB were calculated and are presented in Figure 6. The results show that in spring, only CRU tends to slightly underestimate precipitation (BIAS = −0.11%, ME = −3.95 mm), while the other seven products all tend to display overestimations, especially ERA5 and GSMaP. However, CMORPH provides the most favorable results with BIAS and ME values closest to 0, and PERSIANN also has a relatively good consistency with the observations. The results in summer have obvious differences from those in spring. For example, PERSIANN, which tends to overestimate in spring, shows a slight underestimation but still has the least bias from the observations (BIAS = −0.09%, ME = −11.84 mm). In addition, CMORPH, which outperforms all other products in spring, shows a suboptimal accuracy in summer and performs worse than MSWEP and IMERG. Nevertheless, ERA5 still shows the greatest degree of overestimation, while GSMaP performs much better in summer. The overall tendency to underestimate or overestimate precipitation over the HRB by these products in summer is less obvious than that in spring (BIAS closer to 0) and is also the weakest among all seasons. However, the overall value of ME is higher than that in spring since the amount of precipitation in summer is far greater than that in spring. Consequently, this cannot indicate worse overall performance of these products in summer than in spring and better overall performance in winter than in summer for the same reason. The results in autumn share certain common characteristics with those in summer, except for IMERG (BIAS = 0.20%, ME = 6.68 mm), which exhibits the most satisfactory precision among the products showing overestimations instead of MSWEP and IMERG. The overall statistical result in winter is the most undesirable among all seasons, and the performance of each product is similar to that in spring, except for MSWEP and CMORPH, which do not provide rather good results in winter, especially MSWEP (BIAS = 2.60%, ME = 11.74 mm). Among all products at the seasonal scale, TRMM and IMERG show a relatively stable performance, with no best or worst results but relatively good statistical results in all seasons. The overall performance of PERSIANN is not stable since it tends to underestimate in summer and autumn and overestimate in spring and winter. Nevertheless, except in spring, when CMORPH performs slightly better than PERSIANN, PERSIANN outperforms all other products in any other season. As the values of KGE’ indicate, the overall accuracy of the products balancing R, bias ratio and variability ratio over the HRB is better in summer and autumn than in spring and winter. Almost all products show deteriorated performance in winter, with the highest value of KGE’ only up to 0.19 mm (CRU). TRMM is superior to all other products in spring and autumn, while GSMaP displays the lowest consistency with the observations in spring and winter. In addition, MSWEP appears to be the most reliable source of precipitation in summer, and CRU shows the best performance in winter and the worst in summer, which may be due to the characteristics of the overall underestimation of this product.
As shown in Figure 7, indices including RMSE, R and SD of seasonal precipitation from each product are reflected in Taylor diagrams. This indicates that the overall accuracy of the eight products is highest in summer and lowest in winter. The occurrence of ice and snow cover may possibly be the reason for this poor performance of the products in winter. In spring, five out of eight products show a strong correlation with the observations (R ≥ 0.6). CMORPH exhibits the weakest correlation even though it performs the best in the degree of overestimation, which is consistent with what the lower value of KGE’ indicates. However, it is still not the least ideal product in spring. Instead, GSMaP has the lowest accuracy due to its highest degree of overestimation and dispersion, as well as a weak correlation. Among all of the products, PERSIANN provides the most ideal results, which are consistent with what is indicated from its BIAS and ME, while IMERG and MSWEP perform evenly well. The characteristics of each product’s performance in summer vary greatly from those in spring, with GSMaP displaying a rather high accuracy and CRU showing the least ideal results. Except for CRU, all other products exhibit a strong correlation with the observations and a relatively good overall performance, among which, TRMM provides the highest accuracy. In autumn, all products show a strong correlation with the observations except for GSMaP, which is similar to spring but very different from summer. Even though ERA5 outperforms the other products in terms of correlation, it still shows limited consistency with the observations due to its highest SD and RMSE. TRMM and IMERG provide the highest accuracy. The statistical results of all products in winter are much worse than those in other seasons, and CRU provides the most favorable results, which correspond to the indication from the KGE’.

4.2.2. Performance in the Sub-Regions

Further evaluations of the upper, middle and lower reaches during each season are shown in the radar plots in Figure 8. The six indices of seasonal precipitation estimates from each product between observations at stations for different seasons and regions were calculated and normalized to [0, 1]. The indices used in this study are divided into three types: positive indices, negative indices and other indices. R and KGE’ are positive indices since the higher the value is, the better the performance, while RMSE and SD are negative indices, with lower values indicating better performance. Indices such as BIAS and ME are different since the closer their value is to 0, the higher the accuracy. Hence, there is no monotonic relationship between the original value and accuracy, but there is between the absolute value and accuracy. Different types of indices are normalized using different calculation methods. Finally, all indices are normalized to [0, 1], and the closer the value is to 1, the better the performance. Moreover, six normalized indices in each season and region of each product are shown together in one plot, thus making it more convenient to compare and evaluate the performance.
As shown in the radar plots (Figure 8), great differences in the performance of each product in different sub-regions and seasons appear. Among the six indices, R and SD reasonably show the weakest consistency with other indices. In the upper reach area, IMERG has the most satisfactory overall precision, and only in summer does it perform well between the products, followed by TRMM. CMORPH shows relatively good performance in summer and winter but a less ideal result in spring and autumn. In contrast, PERSIANN performs well in spring and autumn but slightly worse in summer and winter, thus making these two products complementary in usage. The precision of CRU is not so constant, as it shows truly deteriorated performance between the products in summer but actually has favorable results in the other three seasons. It is worth noting that the correlations with the observations of ERA5 and MSWEP are stronger than those of any other product, but these two products still do not perform as ideal overall. ERA5 definitely provides the worst statistical results, indicating the lowest accuracy. In the middle reach area, however, CRU displays the highest accuracy, and its performance is also stable during all seasons. In addition, PERSIANN exhibits favorable results as well. ERA5 displays a much more ideal precision than that in the upper reach area. MSWEP has relatively satisfactory precision except in summer and winter. Nevertheless, GSMaP and CMORPH display the lowest accuracy among all products in almost every season. Finally, in the lower reach area, GSMaP still shows the most undesirable performance, while ERA5 is superior to all others. Similar to what is indicated from the plots in the upper reach area, PERSIANN has higher accuracy in spring and winter and a less good performance in summer and autumn. MSWEP has better results overall except in winter, while IMERG outperforms all other products in winter. In addition, TRMM and CRU appear to be reliable sources for precipitation except in summer, with TRMM showing higher accuracy than CRU.

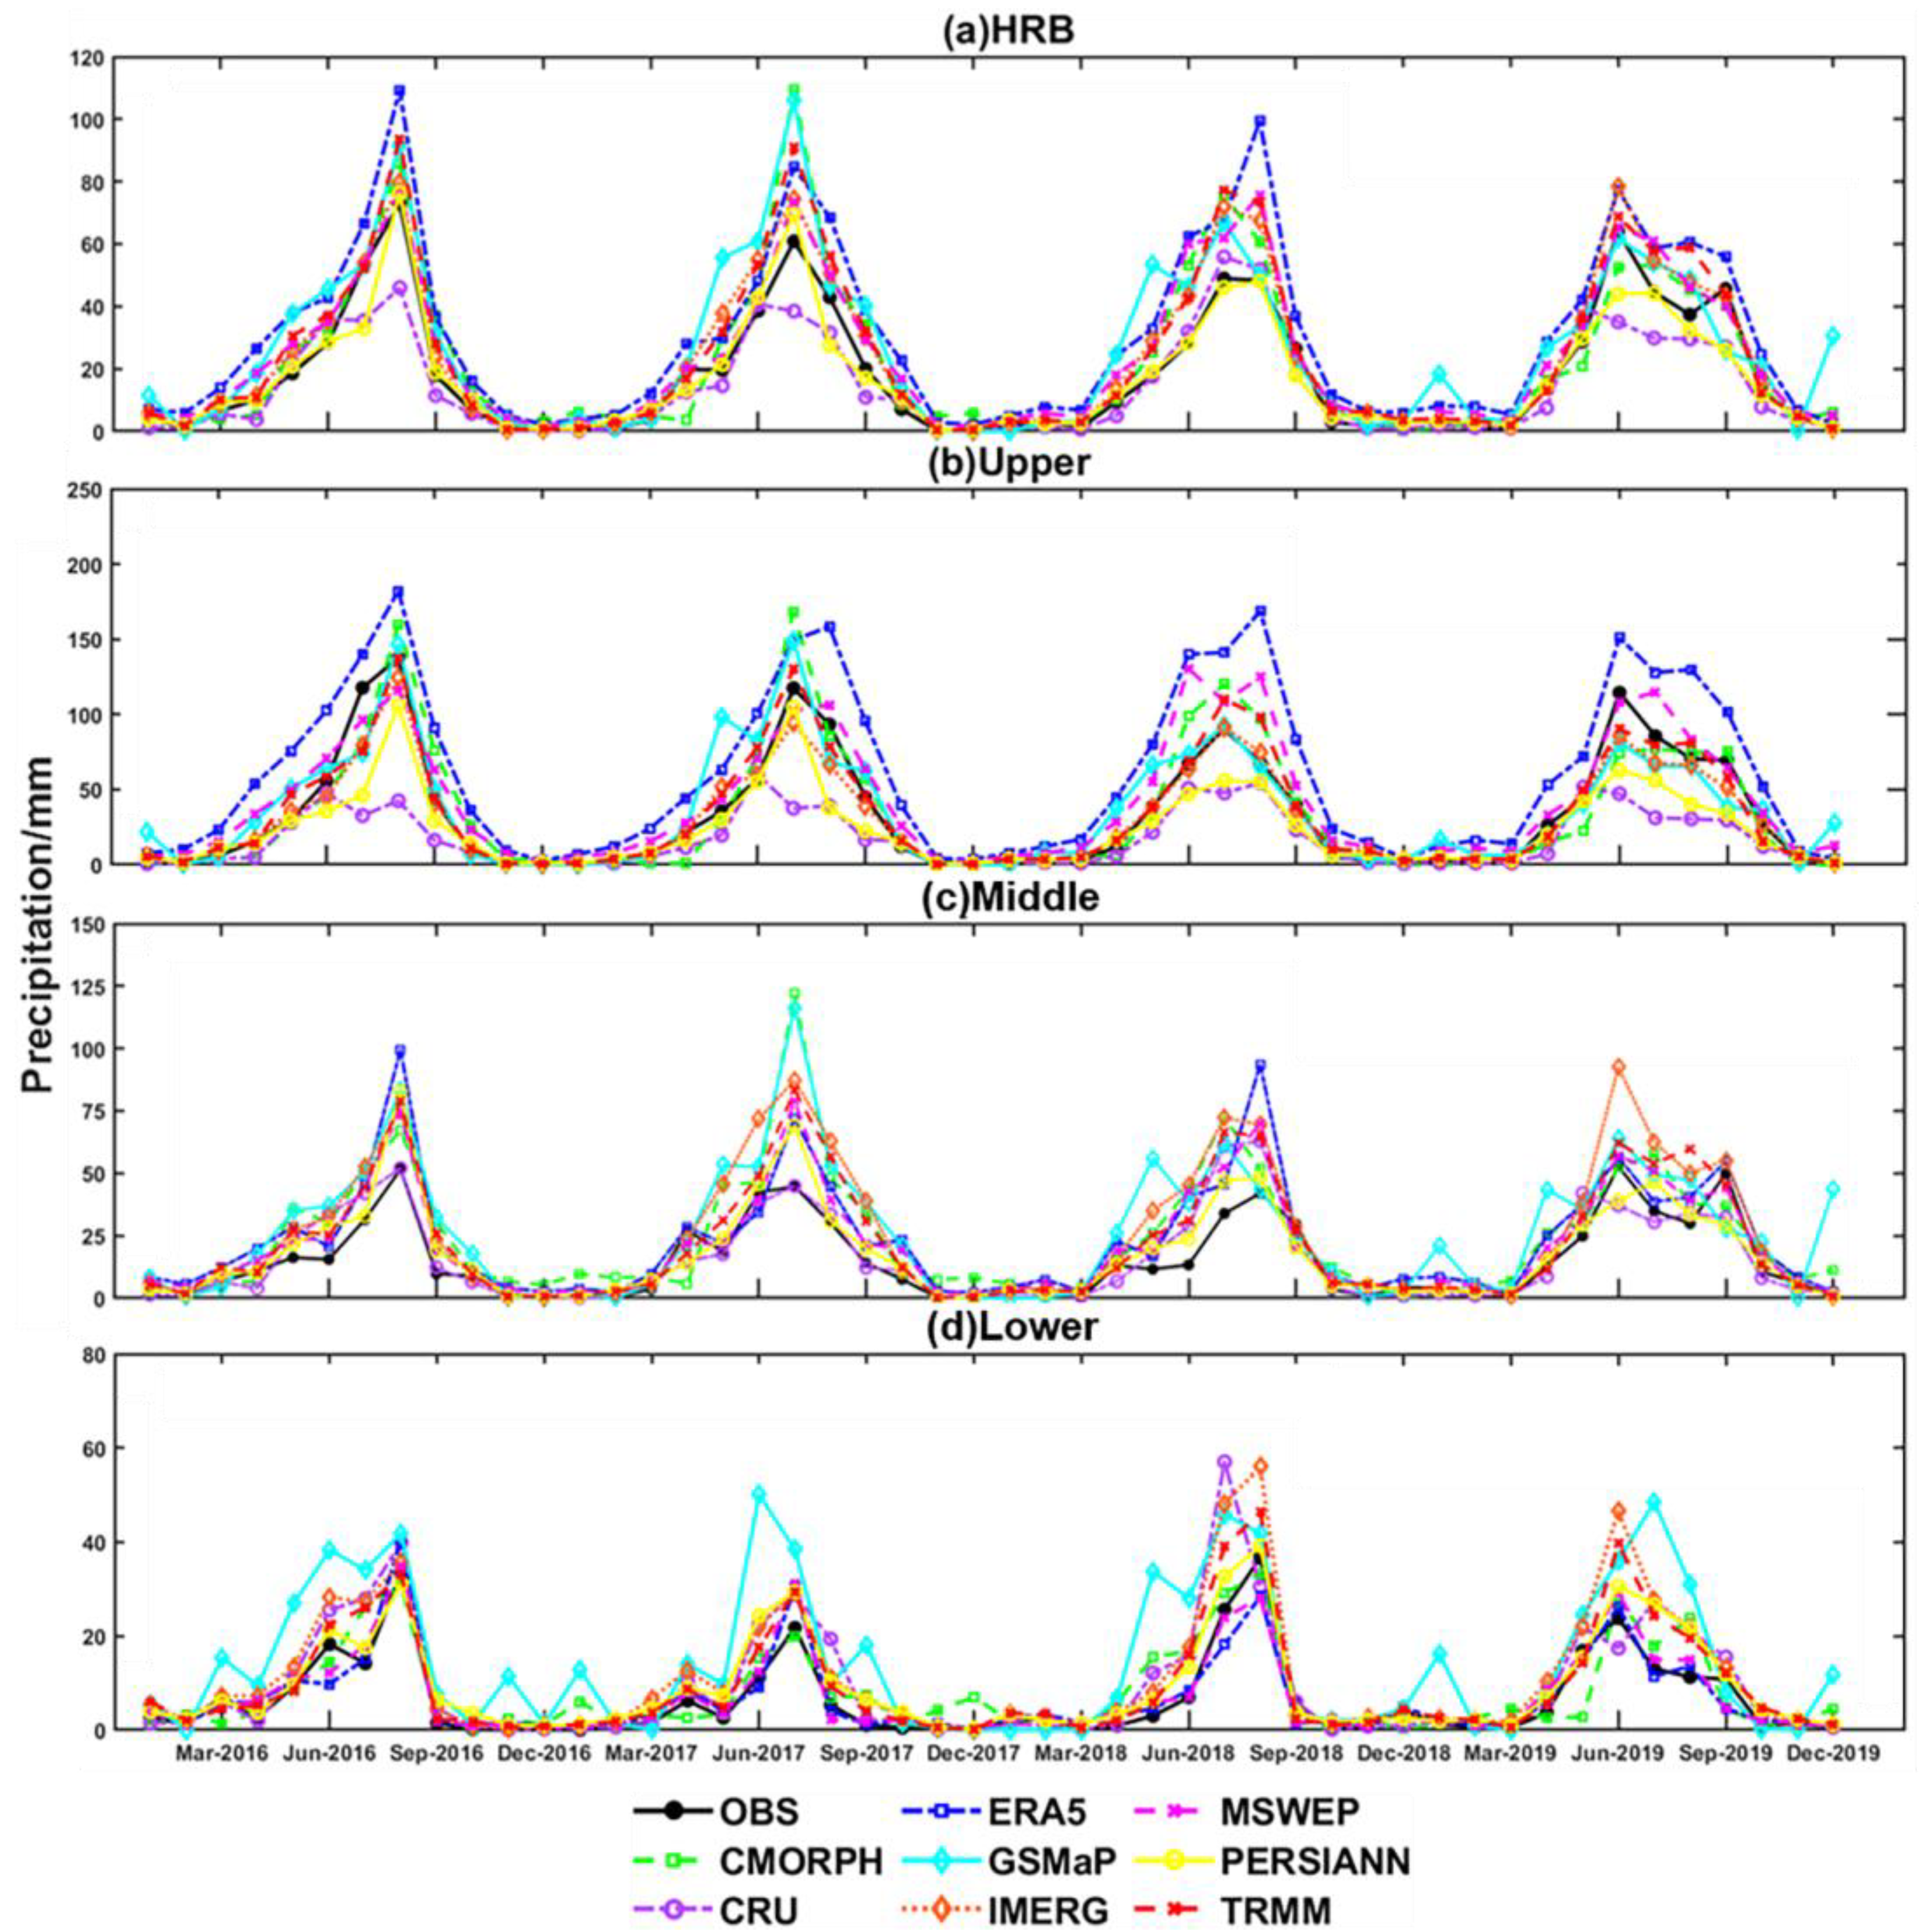
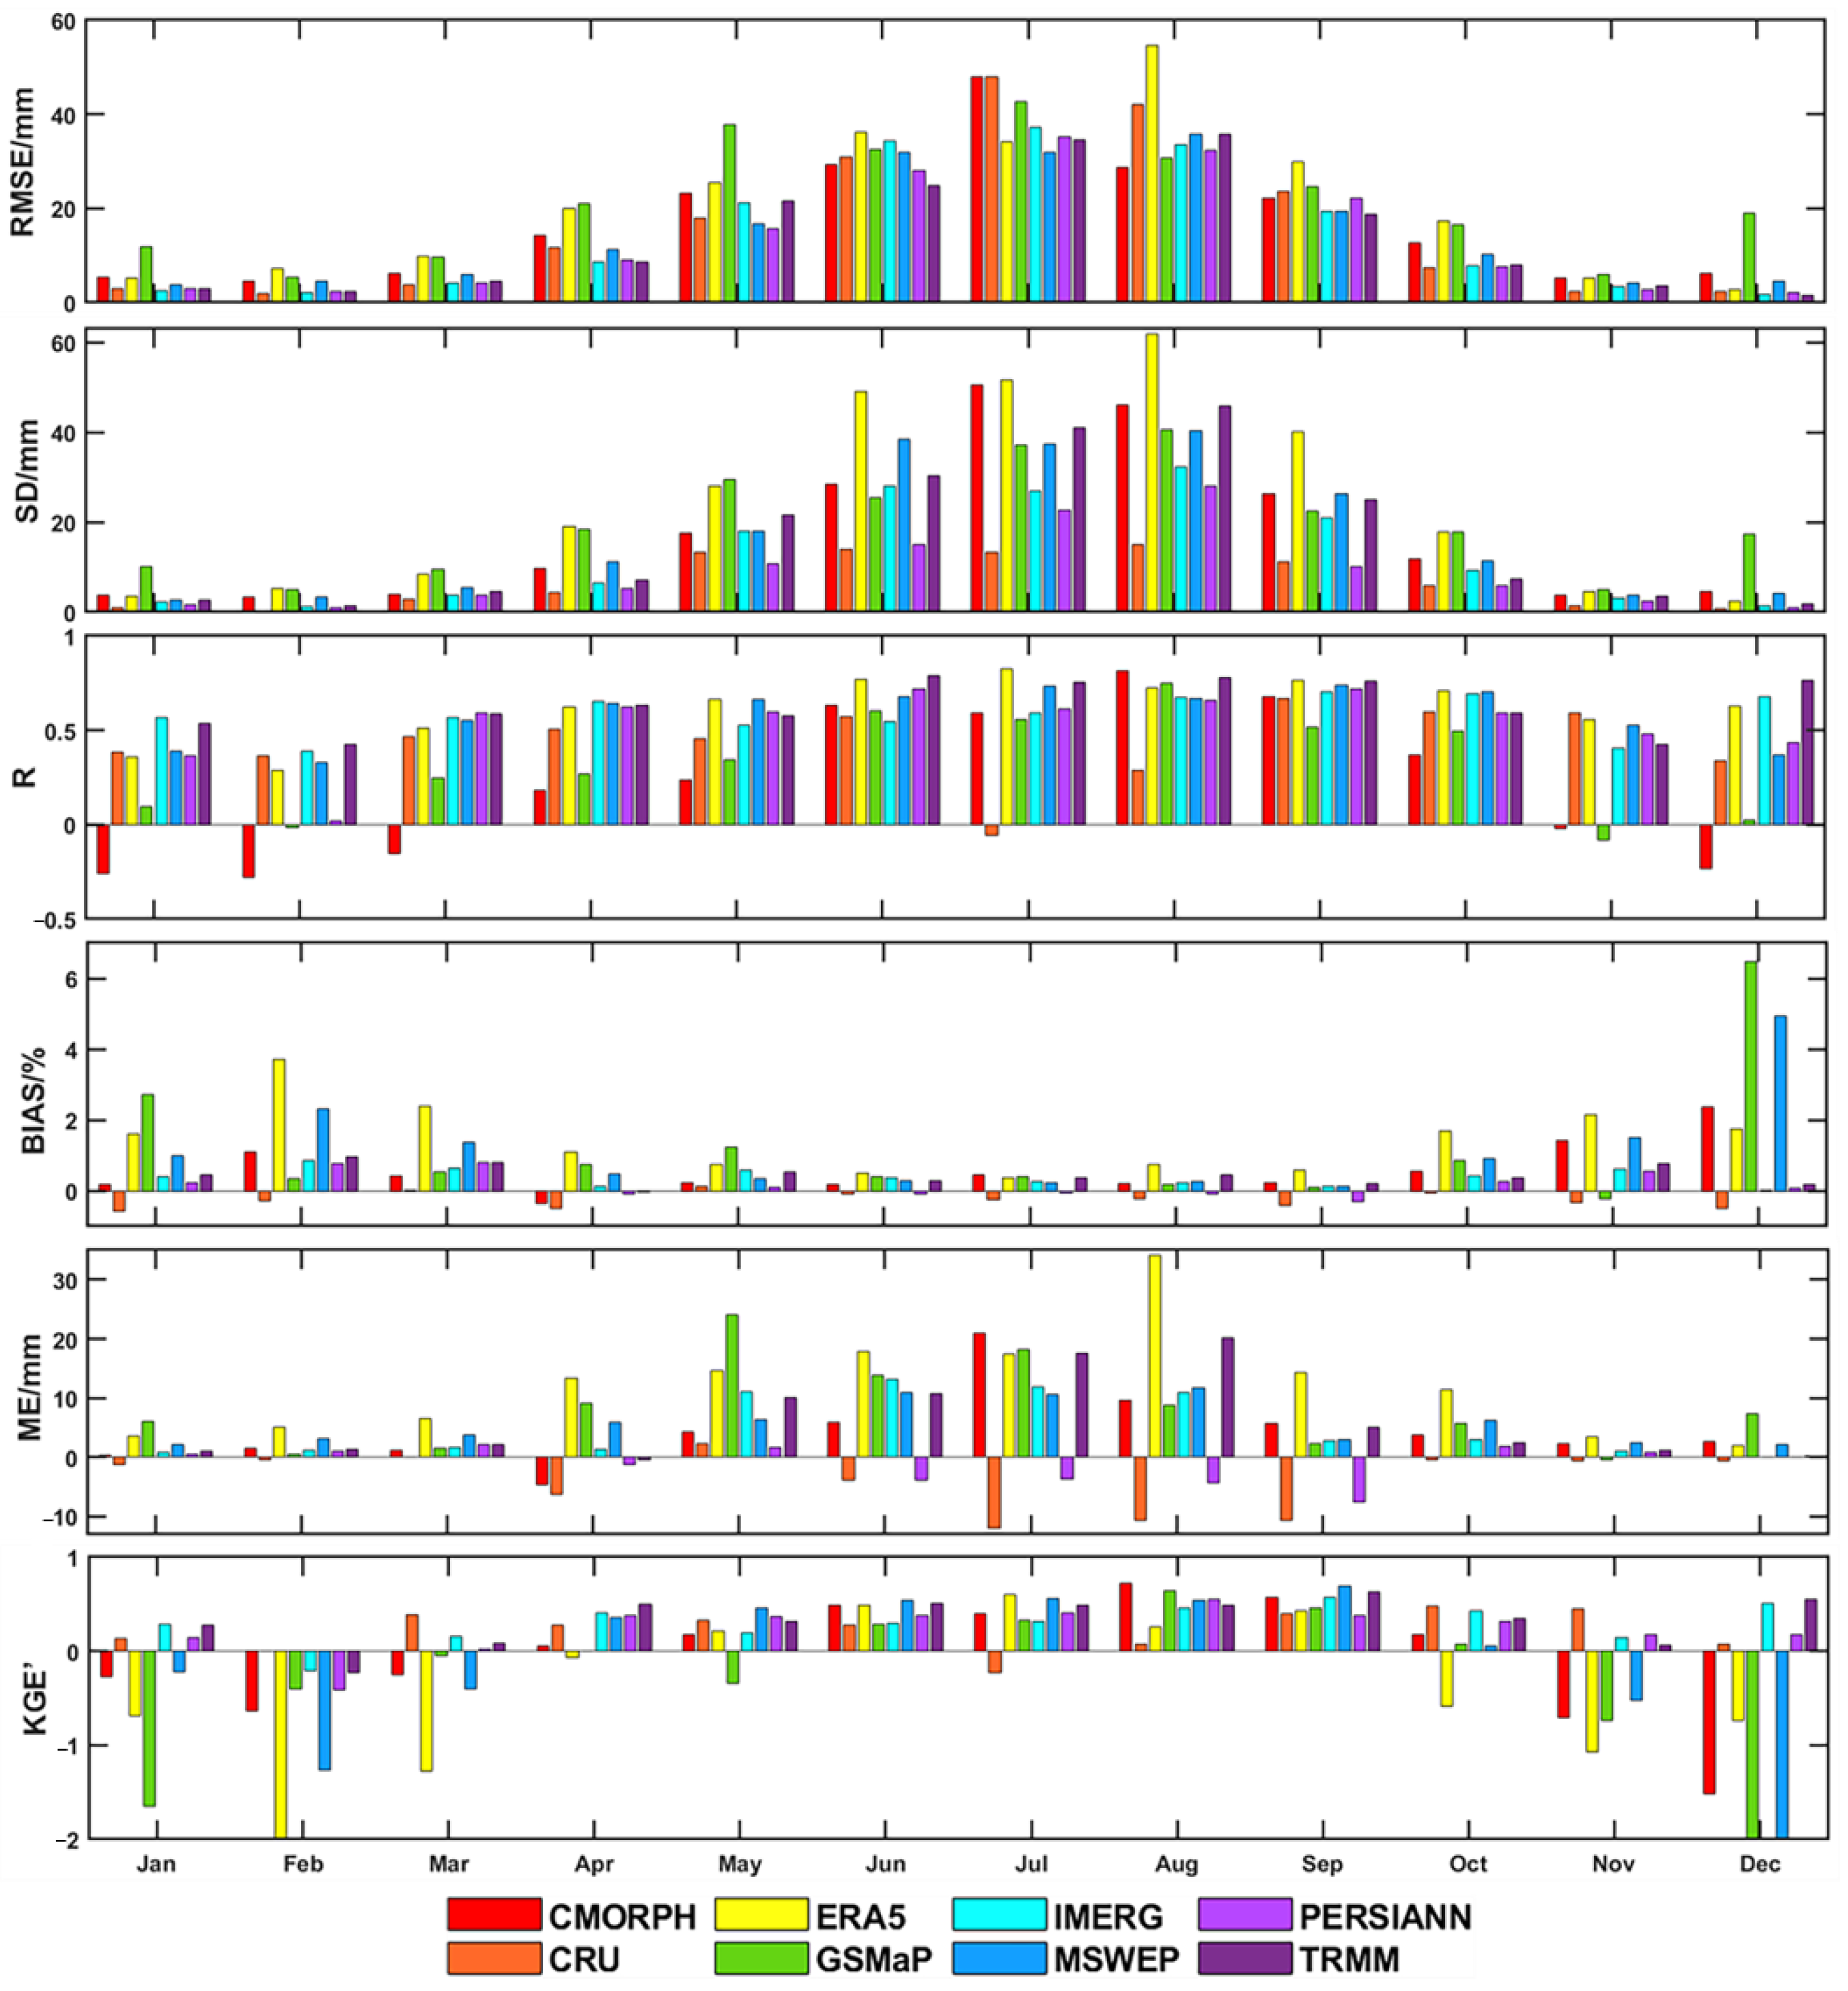
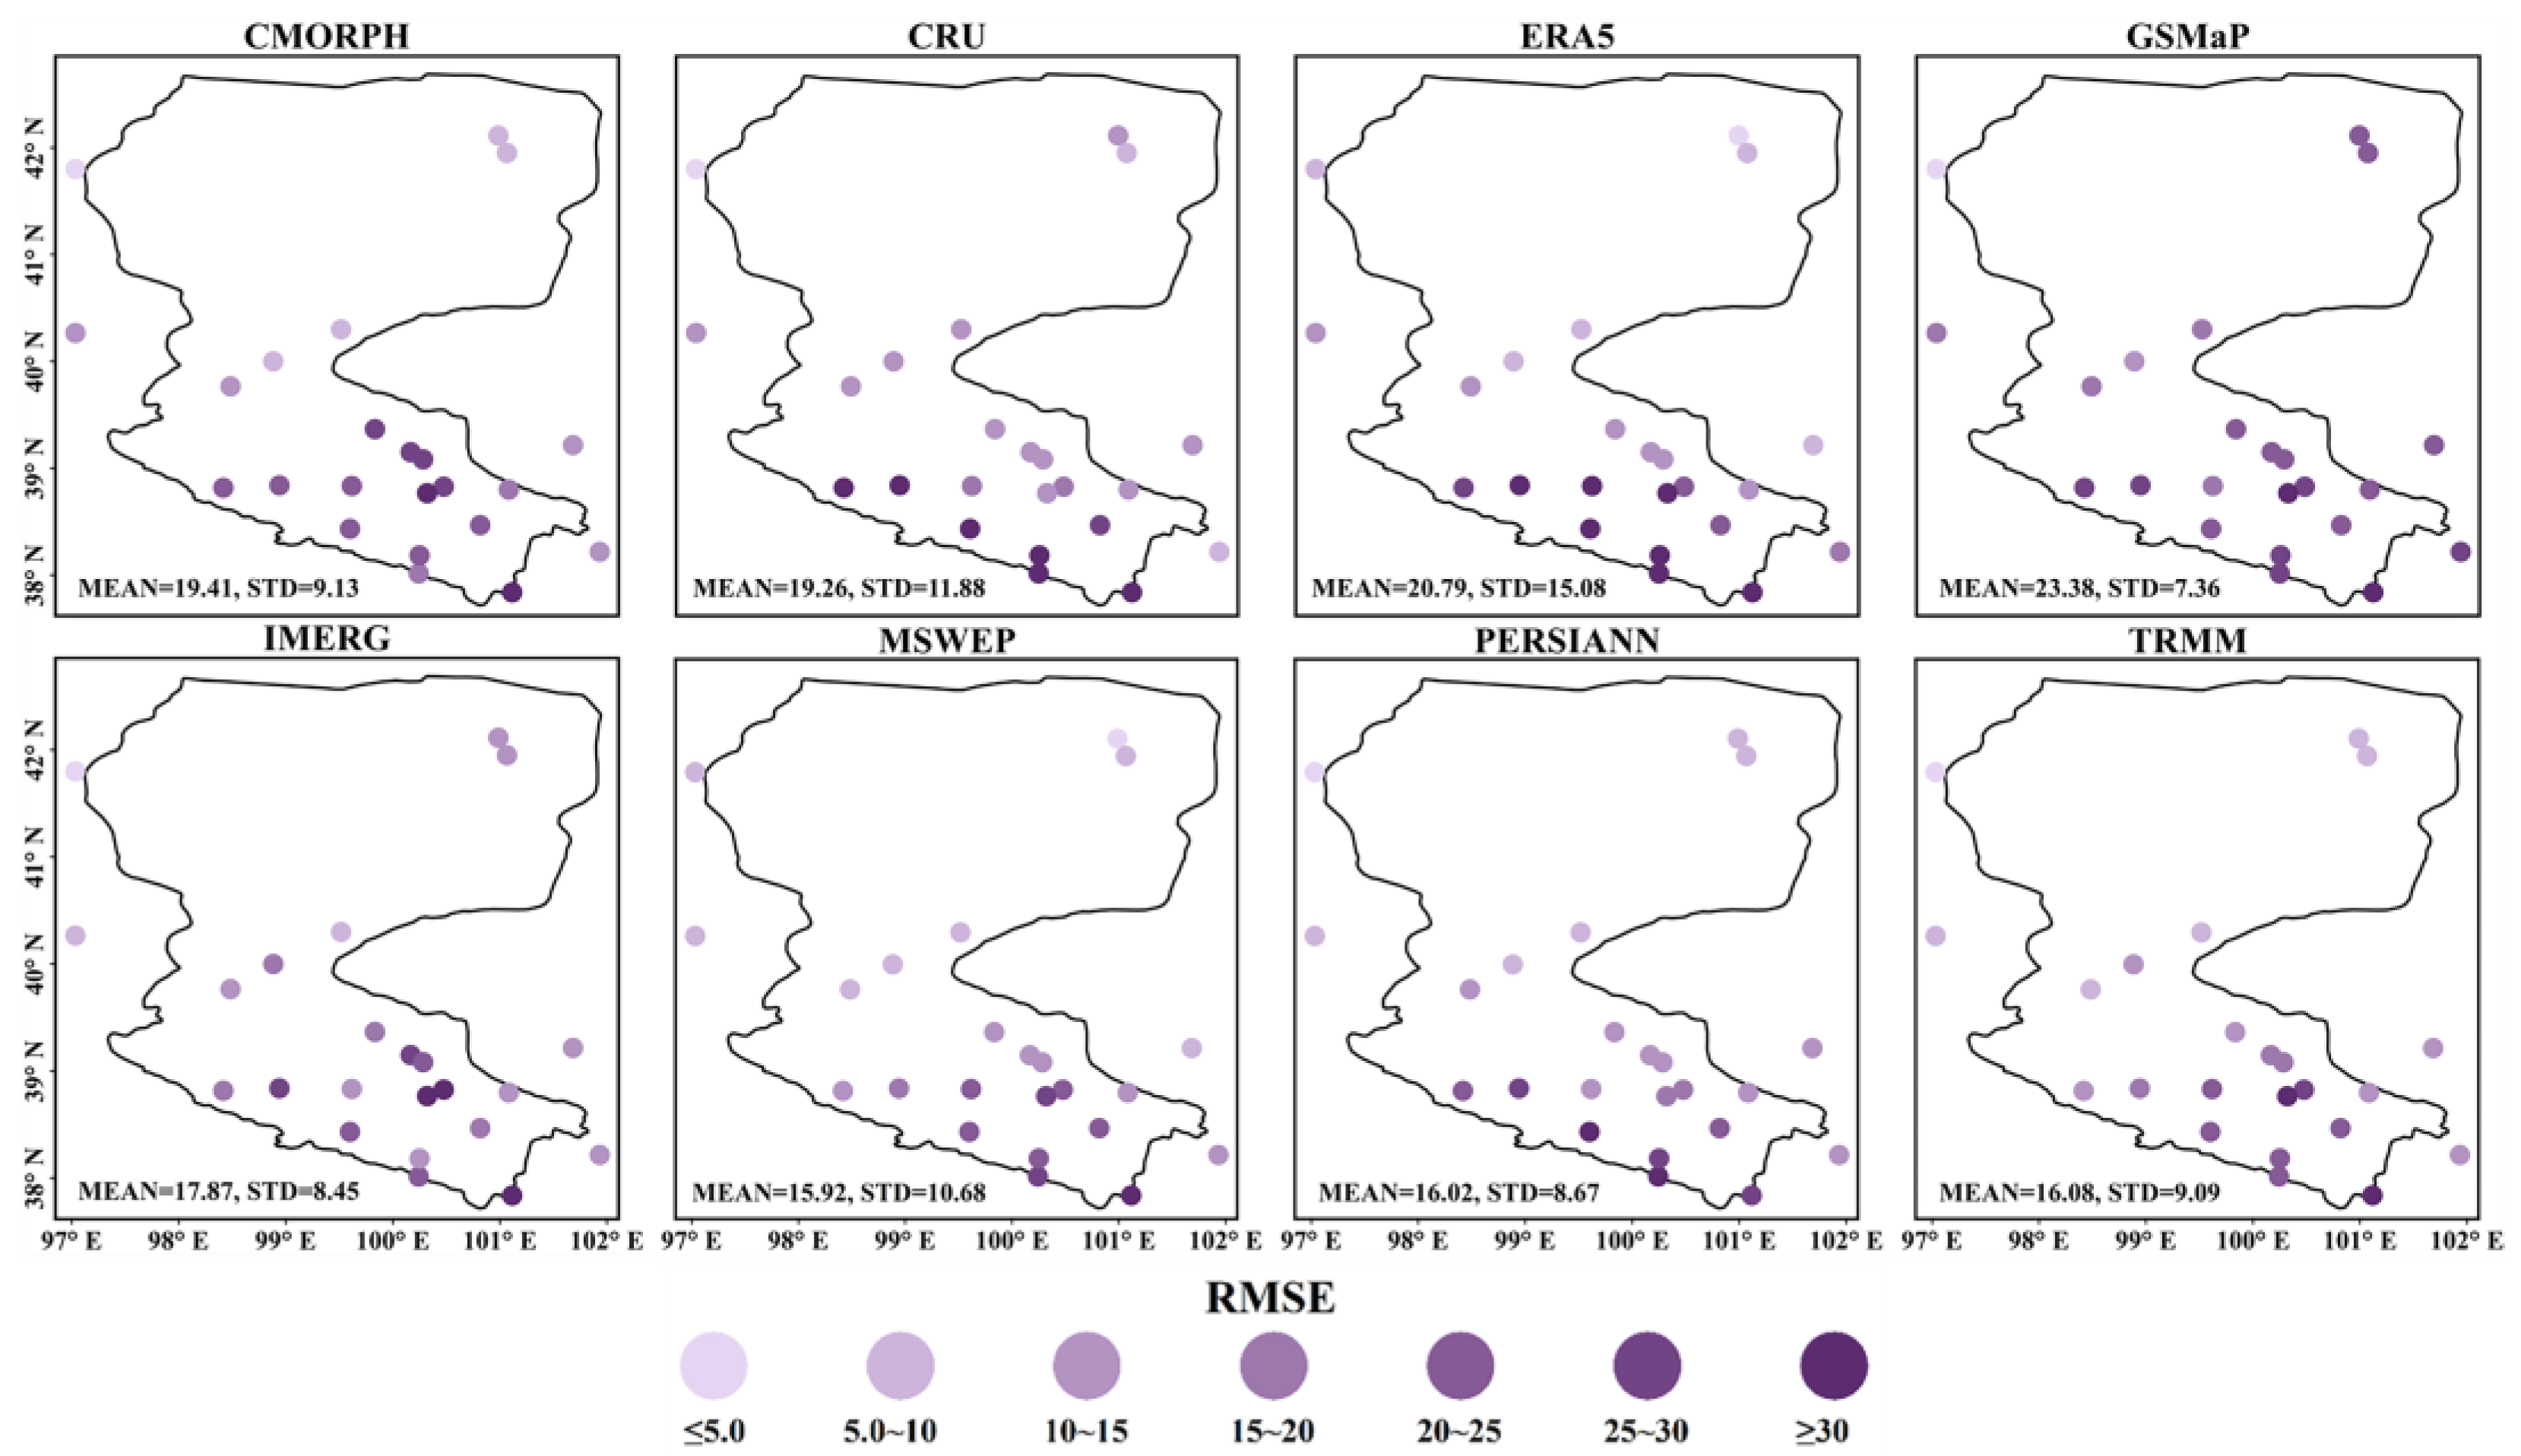
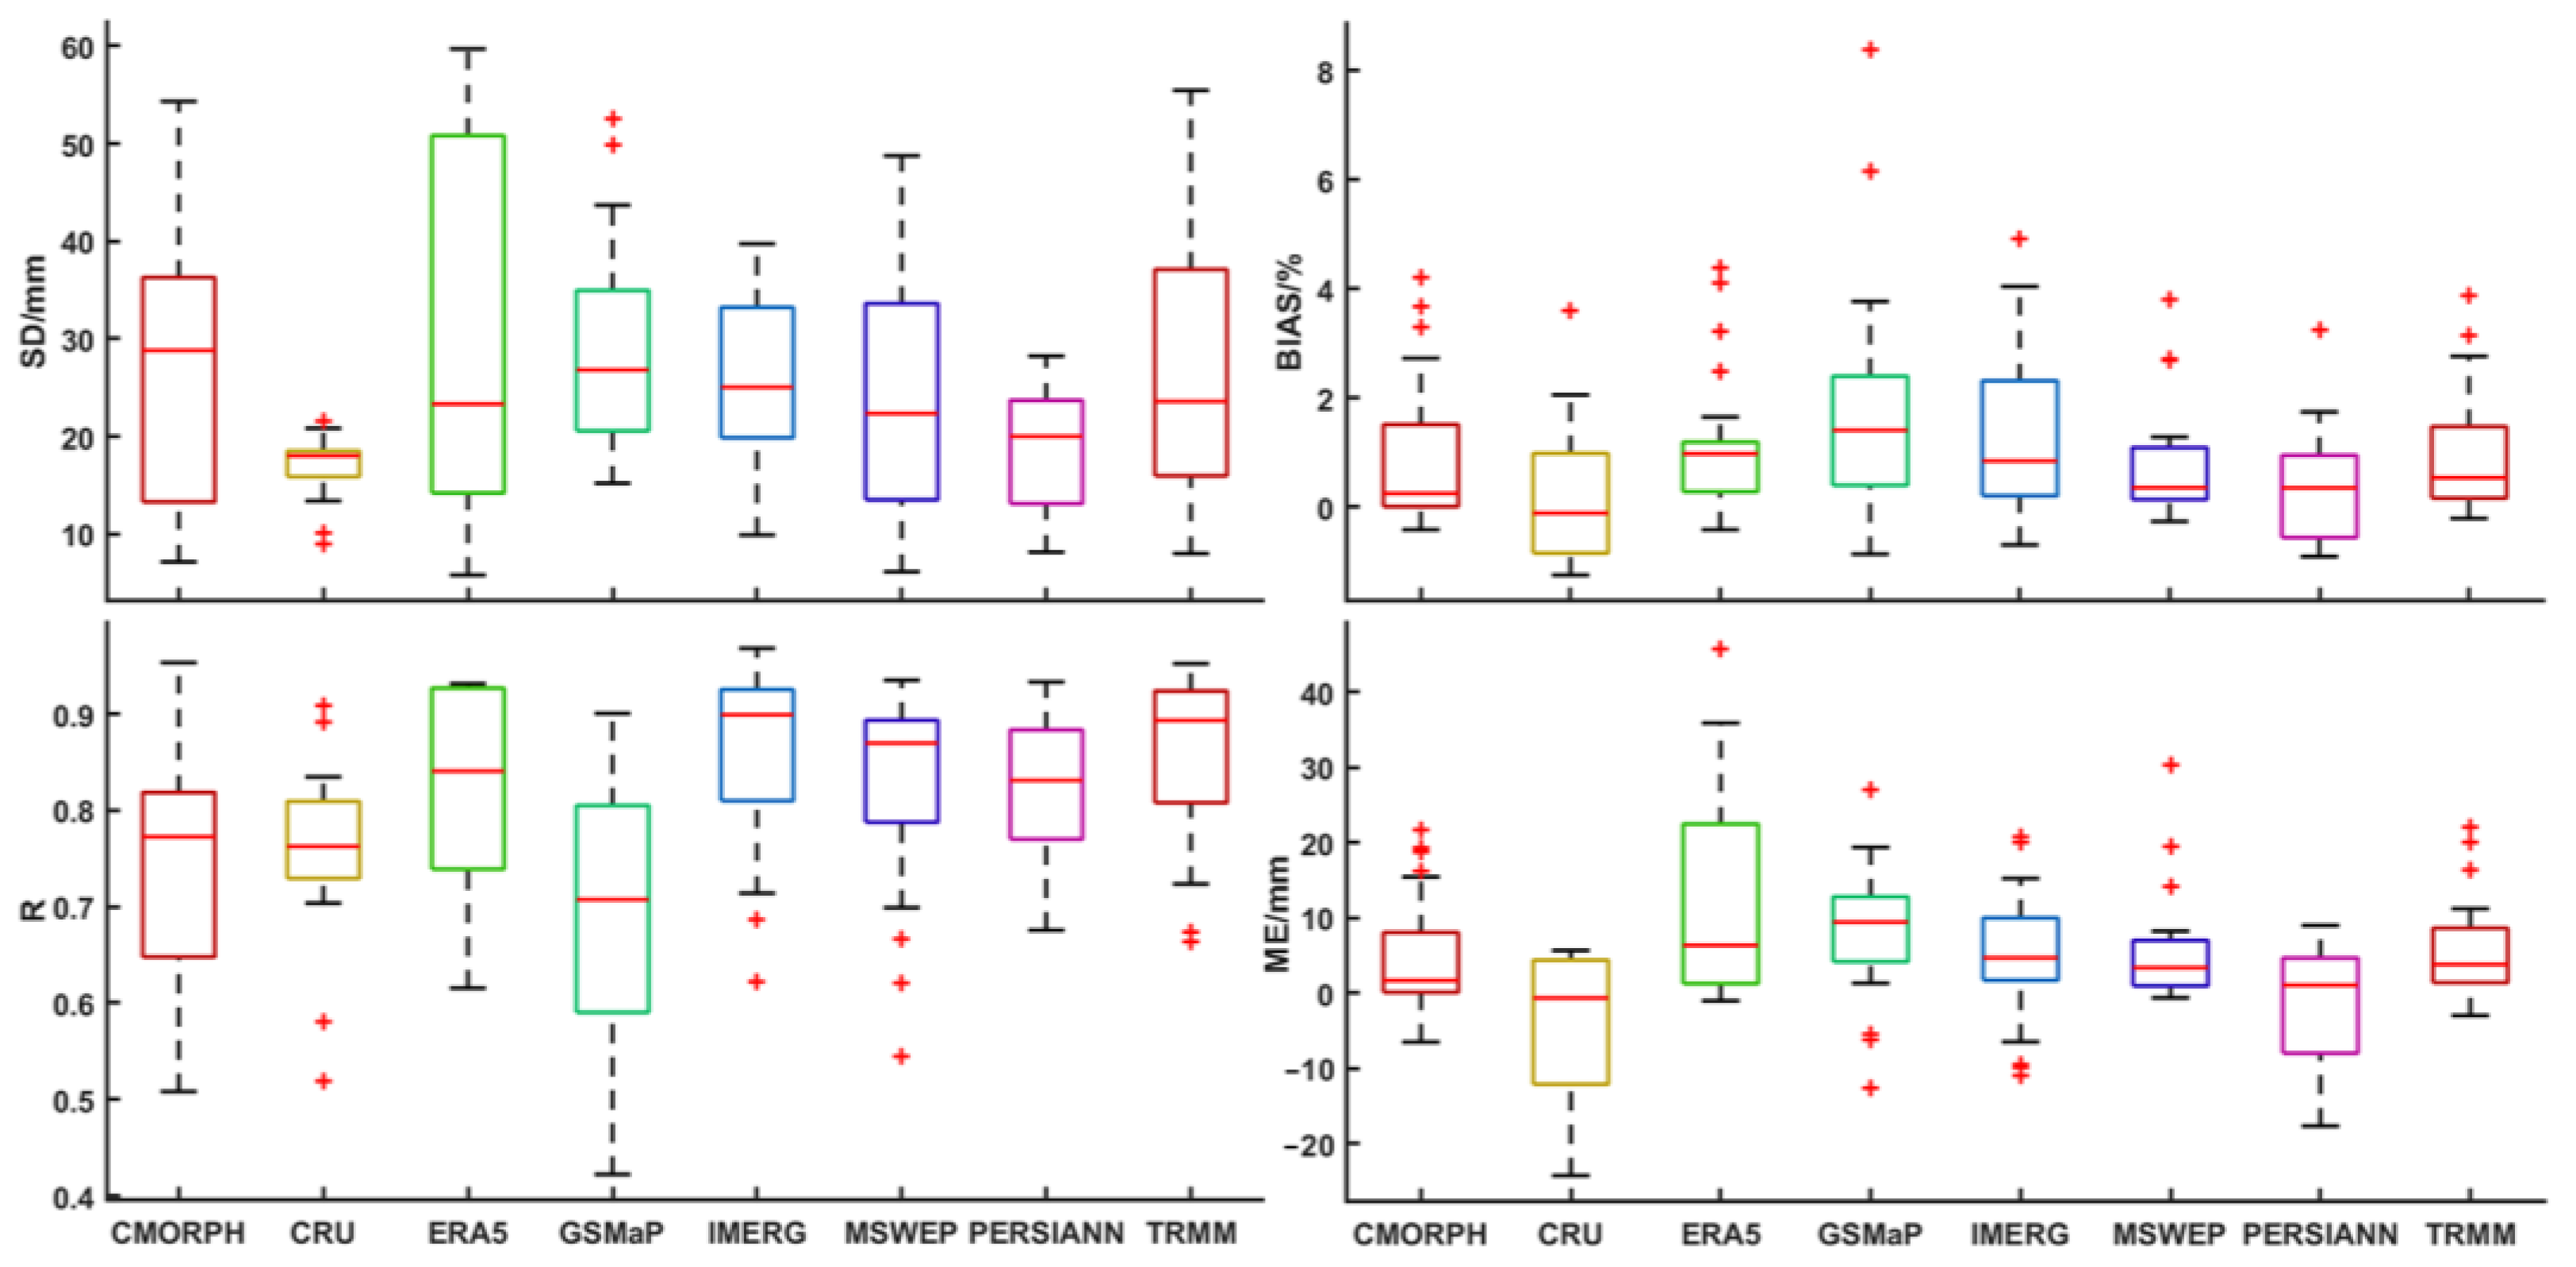
4.3. Accuracy Evaluation at a Monthly Scale

The time series diagrams of the monthly mean precipitation estimates for each product and observations at stations over the HRB (Figure 9a) and the upper (Figure 9b), middle (Figure 9c) and lower (Figure 9d) reaches from January 2016 to December 2019 are shown in Figure 9. The curves of the time series for these eight products all share certain common characteristics with those of the observations at stations, which indicates overall relatively satisfactory precision of these high-resolution gridded precipitation products. This indicates that precipitation over the HRB and its sub-regions is regular, with the year as the recurrence interval. For example, the amount of precipitation reaches a peak in approximately June, July or August every year, which is summertime of every year and remains small from October to March of the next year. From the perspective of the region, the upper reach area gains the largest amount of monthly mean precipitation, while the middle reach area gains the smallest, corresponding to what has been shown in Figure 3. In the entire HRB, it is obvious that ERA5 and GSMaP considerably overestimate precipitation. However, they still perform differently from one another, as ERA5 tends to overestimate higher values, while GSMaP tends to overestimate lower values. This can be supplemented by the difference in their performance in the upper reach area, where the amount of precipitation is larger, and the lower reach area, where the amount of precipitation is smaller. Nevertheless, almost every product except for PERSIANN and CRU tends to overestimate precipitation over the HRB more or less. Between the two products tending to underestimate precipitation, PERSIANN performs better than CRU.
To better examine the accuracy of these eight products at a monthly scale over the entire HRB, the six indices of every product in every month were calculated and combined in bar plots (Figure 10) to make it more convenient to evaluate and compare accuracy. As shown in Figure 10, from April to October in every year, when the amount of precipitation is larger, all products display higher RMSE, SD and absolute ME values than those in other months of a year when the amount of precipitation seems to be smaller. Nevertheless, this cannot indicate undesirable results of all these products since their higher values are due to the higher amount of precipitation as the cardinal number. In contrast, as the bar plots of BIAS and KGE’ in Figure 10 suggest, they all yield a rather weaker tendency to overestimate or underestimate precipitation and higher accuracy. However, with the same amount of precipitation as the cardinal number when products are compared with each other in one month, the lower the RMSE is, the better the performance. For example, products such as PERSIANN, MSWEP and IMERG with lower RMSE and SD, especially from June to August, have higher accuracy, while products such as ERA5 show less satisfactory precision. Moreover, the high RMSE and ME as well as the low KGE’ of GSMaP in December and January indicate the rather deteriorated performance of this product. In addition, as the bar plot of R indicates, the products display a stronger correlation with the observations from June to September when the amount of precipitation is larger as well, while they display a weaker correlation in other months, especially from December to February of the next year. Among all products, TRMM is superior to the others, as it always displays a relatively stronger correlation even in months with smaller amounts of precipitation. In contrast, GSMaP always displays a relatively weaker correlation only in August. TRMM and IMERG display relatively stable performances in terms of correlation with the observations. Hence, in months with small amounts of precipitation, such as December and January, TRMM and IMERG can still display relatively favorable statistical results. It is obvious in the bar plots of BIAS and ME that CRU and PERSIANN underestimate precipitation with CRU, while ERA5 and GSMaP overestimate precipitation with ERA5, tending to overestimate the higher value, and GSMaP tends to overestimate the lower value, which can also be observed in Figure 9.
For further evaluation of monthly precipitation on a spatial scale following that on a time scale, the indices of each product at each station over the HRB from January 2016 to December 2019 were calculated. The spatial distributions of the RMSE and KGE’ of monthly precipitation estimates from each product for stations are shown in Figure 11 and Figure 12.
An increasing trend from less than 5 mm in the lower reach area to more than 30 mm in the upper reach area is shown in the spatial distribution of the RMSE, and each product has a similar pattern. Since the upper reach area gains a larger amount of precipitation, the RMSE at these stations is higher as the cardinal number is higher. This is consistent with what was analyzed in Figure 10. However, there are still differences between these products. For example, GSMaP shows the least ideal performance since the mean value of the points over the entire HRB is the highest among all. As shown in the GSMaP map, all stations, even the two stations in the northeastern HRB, with relatively less precipitation, display a high RMSE. ERA5 and CRU also have less satisfactory precision, as the means are high due to their outstanding problems of noticeable overestimation and underestimation, respectively. However, MSWEP, PERSIANN and TRMM provide favorable results with lower means and reasonable spatial distributions.
For the KGE’, unlike the performance in the RMSE, the spatial distribution pattern of each product is very distinctive from one another, but it can still be seen that in the northeastern and southeastern HRB, almost all products display low accuracy. More specifically, almost every product shows much limited consistency with the observations around the Heihe Remote Sensing station and the desert station. Among all products, GSMaP still performs the worst with a mean KGE’ lower than 0, while PERSIANN outperforms all others with the highest mean KGE’ and the lowest SD of KGE’. In addition, MSWEP also displays satisfactory precision in most areas over the HRB, with the same mean KGE’ as PERSIANN.
Since the KGE’ balances the contributions of the correlation, bias and variability terms, the remaining four indices were not presented on maps to show the spatial distribution pattern, which would actually make no sense, but were displayed in box plots (Figure 13) to show the statistical characteristics on the spatial scale. As demonstrated in Figure 13, CRU shows the minimum fluctuation and median, indicating that SDs at different stations are more similar and do not differ greatly from one another than that of other products. In addition, the value of precipitation estimates from CRU at the same location changes with time in the smallest range among all products. ERA5 shows the greatest degree of dispersion in SD at stations. For R, IMERG displays the highest average level, indicating the strongest correlation with observations on average over the area of the entire HRB. In addition, CRU shows the weakest spatial heterogeneity of R at stations over the entire HRB, but the median is much lower than that of IMERG and TRMM. Therefore, IMERG performs the best, and TRMM also performs well. In contrast, GSMaP displays the worst performance with both the lowest average level and greatest degree of dispersion at the same time. According to the box plots of BIAS and ME, among all products, only CMORPH, CRU and PERSIANN display underestimation and tend to underestimate occasionally at some of the stations, but CMORPH performs the best. PERSIANN performs better than CRU since CRU shows a greater degree of dispersion than PERSIANN. Among the other products that overestimate precipitation, MSWEP shows the best performance, and TRMM also performs well. GSMaP displays the highest average level again, indicating its strongest tendency to overestimate, while ERA5 displays the strongest spatial heterogeneity of ME at stations over the entire HRB.

5. Discussion

Due to the different data production mechanisms and complex topography over the HRB, great discrepancies appear in the performance of the eight precipitation products at different spatial and temporal scales. As expected, the generally poorest performances are observed in the satellite-based product (GSMaP) compared with other gauge-based products, reanalysis products, gauge-corrected and satellite-based products and merged products, especially at the monthly scale since it is without any gauge adjustment, and GSMaP shows limited accuracy and negative spatial correlations with the observational data. The right bias-correction procedures of this product can actually bring significant improvement. However, at a seasonal and annual scale, this deficiency of GSMaP is less obvious. The performances of the gauge-based product (CRU) at a monthly scale are not as favorable as expected, and it often tends to underestimate the precipitation. CRU was constructed solely from station data based on a mathematical interpolation, and the performance of CRU in this study may be probably due to the very limited number of stations used in the development or the interpolation algorithm to be improved. Nevertheless, it is still noteworthy to mention that CRU shows a high accuracy both at a seasonal and annual scale in the middle reaches where the stations are of higher density and in winter when the amount of precipitation is smaller. Besides, as expected, generated from numerical models that combine satellite and gauge observations, the performance of the reanalysis product (ERA5) is not so good compared to the merged product (MSWEP) which combined gauge, satellite and reanalysis datasets at the same time, as ERA5 always tends to overestimate the precipitation, especially the higher values. However, in the lower reaches of the HRB where the amount of precipitation is larger compared to other sub-regions, ERA5 can display the best performance both in estimating seasonal and annual precipitation. MSWEP merges gauge, satellite and reanalysis data to obtain the highest quality precipitation estimates at every location, and it incorporates daily gauge observations and accounts for gauge-reporting times to reduce temporal mismatches between satellite reanalysis estimates and gauge observations. Therefore, MSWEP outperforms all other products over the entire HRB at the annual scale and in summer at the seasonal scale.
The four gauge-corrected and satellite-based products (CMORPH, IMERG, PERSIANN and TRMM) have a similar pattern to other products and all display a relatively remarkable performance. Among them, there is no optimal product among all spatial and temporal scales. The use of motion vectors derived from 3-hourly IR satellite imagery to propagate the relatively high-quality precipitation estimates derived from PMW data do improve the accuracy of CMORPH greatly, and thereby, it exhibits the overall smallest deviation in estimating the seasonal precipitation in the entire HRB. In addition, IMERG performs the best in all seasons in the entire HRB owing to the comprehensive inter-calibration, interpolation and integration of “all” microwave satellite-based precipitation estimates, precipitation gauge analyses, microwave-calibrated IR satellite estimates and other precipitation estimators. PERSIANN tends to underestimate the annual precipitation and displays overall relatively good performance at a seasonal scale, which is less ideal than the other three products. Possibly, the algorithm of the conversion from IR data to precipitation rate is in need to be improved. TRMM relatively outperforms all the products in the evaluation at a monthly scale, which may be due to the calibration with monthly rain gauge data from the GPCC as well as the combination of IR data and PMW data.
The RMSE is one of the most frequently used metrics of the absolute differences between estimated and observed values. In this study, it gives more weight to high rainfall events, and the results are not comparable between areas with different precipitation regimes. However, the evaluation of this study is not solely based on this one index but based on the six indexes comprehensively. As shown in Section 4.1, the Taylor diagram in Figure 5 displays relatively worse performance of all products in the upper reaches of the HRB than other sub-regions. Besides, as the results reported in Section 4.3 show, other indexes suggest that the overall accuracy in the upper reaches is lower than that in other sub-regions, which indicates that the higher RMSE correctly evaluates the performance in the upper reaches. This is opposite to the situation at a monthly scale, in which a higher RMSE was observed in the months with a larger amount of precipitation and a higher overall accuracy of each product. When using RMSE for analysis, it should be noted that it is not possible to simply evaluate the data accuracy performance based on its value.
Sample size may affect the results of the evaluation, and the larger the number of the stations, the more reliable the conclusions. Previous studies have demonstrated the evaluation of precipitation products strongly depend on gauge density [58], and the evaluation results based on relatively lower gauge density tend to underestimate the quality of the products. However, the difference of the performance between each product is relatively obvious in the upper, middle and lower reaches of the HRB, as was verified from the results of this study. In order to make the evaluation more comprehensive and reliable, in view of the complex geographical features of the HRB, this study compared different products in the upper, middle and lower regions, respectively. The stations in the upper reaches and the middle reaches are relatively evenly distributed and representative, while the stations in the lower reaches with larger area are somewhat unevenly distributed, which may lead to several uncertainties in comparison results that should be taken with caution. Nevertheless, since the terrain of the lower reaches is relatively flat and the spatial distribution of precipitation is relatively stable, the stations in this area can also be representative. Moreover, those stations are the most accurate and reliable data source to be referred for the assessment at present. Based on the current availability of long time series observations from the stations in the HRB, this study provided a relatively optimal evaluation in the study area, which can be used as a reference for related applications. However, this still indicates that a higher gauge density network is more desirable to obtain a robust evaluation result. A more comprehensive comparison of the different precipitation products will be conducted based on more available observational datasets in the future study.
Since the verifications were carried out based on observations from the stations, for the products using gauge data in the development, the data are biased towards the station observations. However, since some of the stations are not available internationally, the number of the national meteorological stations used in this study was larger than the number of stations used in the development of these products. That is, the gauge data used for accuracy evaluation were not all involved in the development of these products, and the automatic weather stations used in this study were not involved at all. These overlapping data only represent a small portion of the gauge data, and even if there is a potential impact on the evaluation results, the impact on the overall results is acceptable [59].
In this study, the accuracy of eight precipitation datasets was evaluated and compared at monthly, seasonal and annual scales, since some of the products do not provide daily or hourly precipitation data. In future studies, the accuracy of different high-resolution gridded precipitation products will be evaluated comprehensively at daily and hourly scales as an important supplement to make the applications of the conclusions broader and of greater practical significance.

6. Conclusions

In recent years, the acquisition of a precise spatial distribution of precipitation has played an increasingly vital role in a wide range of fields. This study evaluated the accuracy of eight high-resolution gridded precipitation products based on precipitation observations at 23 stations over the HRB from January 2016 to December 2019. The main findings are:
  • The eight products have different results when evaluated at different spatial and temporal scales but show similar spatial distribution patterns and overall satisfactory precision, indicating the feasibility of using these precipitation products over the HRB in future studies.
  • At an annual scale, among all products, only CRU and PERSIANN tend to underestimate precipitation, with the strongest tendency appearing in the upper reaches. MSWEP outperforms all other products over the entire HRB, while PERSIANN, CRU and ERA5 show the highest accuracy in the upper, middle and lower reaches, respectively.
  • At a seasonal scale:
    (i)
    In the upper reaches, IMERG provides favorable results in all seasons, while PERSIANN shows relatively good performance in autumn and winter. CRU displays relatively high accuracy except in summer, while TRMM has relatively ideal results except in spring.
    (ii)
    In the middle reaches, CRU performs well in all seasons; IMERG and TRMM have relatively high accuracy except in summer.
    (iii)
    In the lower reaches, ERA5 performs well in all seasons; MSWEP shows relatively high accuracy except in winter, and PERSIANN displays satisfactory precision except in summer and autumn.
    (iv)
    In the entire HRB, CMORPH has the overall smallest deviation from the observations in spring but actually performs poorly in the middle reaches, while PERSIANN has the smallest deviation in all seasons except for spring. TRMM has the highest accuracy in spring and autumn, while the accuracies of MSWEP and CRU are the highest in summer and winter, respectively.
  • At a monthly scale:
    (i)
    From the perspective of time, in the entire HRB, TRMM is superior to the other products with a relatively stronger correlation almost every month, while GSMaP is inferior to the other products with a relatively weaker correlation, except in August.
    (ii)
    From the perspective of space, MSWEP and PERSIANN perform relatively best with favorable statistical results around almost every station over the HRB, while GSMaP shows the least ideal performance.
    (iii)
    ERA5 and GSMaP both always yield overestimations of precipitation, but ERA5 tends to overestimate higher values, while GSMaP tends to overestimate lower values. Moreover, the overestimation of ERA5 tends to appear in the upper reach area, while the overestimation of GSMaP tends to appear in the lower reaches.
In summary, none of these products obviously outperforms the others at every different scale, but there will always be a best alternative resource for precipitation information in each case of different spatial and temporal scales over the HRB. The results of this study will assist researchers in making wiser choices when selecting the right precipitation data for their study or applications and offer data-provider guidance to improve their products. In addition, this study also indicates the uncertainties in currently available precipitation products, especially in mountainous areas that are sparsely gauged or even ungauged, such as the HRB in China. Hence, there is still much room for improvement in the quality of different precipitation products in such regions.

Author Contributions

Conceptualization, Y.W. and N.Z.; methodology, Y.W. and N.Z.; software, Y.W.; validation, Y.W. and N.Z.; formal analysis, Y.W.; investigation, Y.W.; resources, Y.W.; data curation, Y.W.; writing—original draft preparation, Y.W.; writing—review and editing, N.Z.; visualization, Y.W.; supervision, N.Z.; project administration, N.Z.; funding acquisition, N.Z. All authors have read and agreed to the published version of the manuscript.

Funding

This research was funded by the National Natural Science Foundation of China (grant number 42071374 and 41930647) and the Strategic Priority Research Program (A) of the Chinese Academy of Sciences (XDA20030203).

Institutional Review Board Statement

The study did not involve humans or animals.

Informed Consent Statement

The study did not involve humans or animals.

Data Availability Statement

Publicly available datasets were analyzed in this study. The high-resolution gridded precipitation datasets can be downloaded in the following websites, respectively: the daily precipitation of CMORPH: https://rda.ucar.edu/, accessed on 23 March 2021, the monthly precipitation of CRU: http://www.cru.uea.ac.uk/, accessed on 25 March 2021, the monthly precipitation of ERA5: https://cds.climate.copernicus.eu/, accessed on 26 March 2021, the monthly precipitation of GSMaP: https://hokusai.eorc.jaxa.jp/, accessed on 26 March 2021, the monthly precipitation of IMERG: https://disc.gsfc.nasa.gov/, accessed on 28 March 2021, the monthly precipitation of MSWEP: http://www.gloh2o.org/mswep/, accessed on 10 April 2021, the daily precipitation of PERSIANN: https://www.ncei.noaa.gov/, accessed on 28 March 2021, and the monthly precipitation of TRMM: https://disc.gsfc.nasa.gov/, accessed on 3 April 2021. The data used to support the findings of this study are included within the article.

Conflicts of Interest

The authors declare no conflict of interest.

Appendix A

Table A1. Summary of the information regarding the stations over the HRB used in this study. In the description of type, N represents the national meteorological station and A represents the automatic weather station.
NameLongitude (°E)Latitude (°N)TypeReachesElevation (m)
Dashalong98.9438.84AUpper3786
Heihe Remote Sensing100.4838.83AMiddle1520
Huazhaizi Desert100.3238.77AMiddle1710
Desert100.9942.11ALower924
Jingyangling101.1237.84AUpper3747
Yakou100.2438.01AUpper4070
Ejina100.4538.98NLower937
Mazongshan101.0741.95NLower1776
Yumenzhen97.0341.80NLower1515
Dingxin97.0340.27NLower1161
Jinta99.5240.30NLower1254
Jiuquan98.8840.00NMiddle1464
Gaotai98.4839.77NMiddle1352
Linze99.8339.37NMiddle1437
Ayouqi100.1739.15NMiddle1509
Tuole101.6839.22NUpper3362
Sunan98.4238.82NUpper2302
Yeniugou99.6238.83NUpper3437
Zhangye99.6038.43NMiddle1464
Minle100.2839.08NMiddle2202
Qilian100.8238.47NUpper2779
Shandan100.2538.18NMiddle1765
Yongchang101.0838.80NMiddle2055
Table A2. Summary of the abbreviations in this study.
AbbreviationFull Name
APHRODITEAsian Precipitation-Highly Resolved Observational Data Integration Towards Evaluation
CHRSCenter for Hydrometeorology and Remote Sensing
CMORPHClimate Prediction Center Morphing technique product
CRUClimate Research Unit
ECMWFEuropean Centre for Medium-Range Weather Forecasts
ERA5The Fifth generation of ECMWF atmospheric reanalysis of the global climate
GPCCGlobal Precipitation Climatology Center
GPCPGlobal Precipitation Climatology Project
GPMGlobal Precipitation Measurement Mission
GSMaPGlobal Satellite Mapping of Precipitation
HRBHeihe River Basin
IMERGIntegrated Multi-satellite Retrievals for GPM
IRInfrared
JAXAJapan Aerospace Exploration Agency
MSWEPMulti-Source Weighted-Ensemble Precipitation
NCASNational Center for Atmospheric Science
NOAANational Oceanic and Atmospheric Administration
PERSIANNPrecipitation Estimation from Remotely Sensed Information using Artificial Neural Networks Climate Data Record
PDFProbability density function
PMWPassive microwave
TMPAMulti-satellite Precipitation Analysis
TRMMTropical Rainfall Measuring Mission

References

  1. Zhang, Q.; Sun, P.; Singh, V.P.; Chen, X.H. Spatial-Temporal Precipitation Changes (1956–2000) and their Implications for Agriculture in China. Glob. Planet. Chang. 2012, 82, 86–95. [Google Scholar] [CrossRef]
  2. Wu, Z.T.; Dijkstra, P.; Koch, G.W.; Penuelas, J.; Hungate, B.A. Responses of Terrestrial Ecosystems to Temperature and Precipitation Change: A Meta-Analysis of Experimental Manipulation. Glob. Chang. Biol. 2011, 17, 927–942. [Google Scholar] [CrossRef] [Green Version]
  3. Li, C.; Zhang, H.B.; Gong, X.H.; Wei, X.W.; Yang, J.T. Precipitation Trends and Alteration in Wei River Basin: Implication for Water Resources Management in the Transitional Zone between Plain and Loess Plateau. China Water 2019, 11, 2407. [Google Scholar] [CrossRef] [Green Version]
  4. Brodeur, Z.P.; Steinschneider, S. Spatial Bias in Medium-Range Forecasts of Heavy Precipitation in the Sacramento River Basin: Implications for Water Management. J. Hydrometeorol. 2020, 21, 1405–1423. [Google Scholar] [CrossRef]
  5. Su, F.G.; Hong, Y.; Lettenmaier, D.P. Evaluation of TRMM Multisatellite Precipitation Analysis (TMPA) and its Utility in Hydrologic Prediction in the La Plata Basin. J. Hydrometeorol. 2008, 9, 622–640. [Google Scholar] [CrossRef] [Green Version]
  6. Xie, P.P.; Xiong, A.Y. A Conceptual Model for Constructing High-Resolution Gauge-Satellite Merged Precipitation Analyses. J. Geophys. Res. Atmos. 2011, 116, D21106. [Google Scholar] [CrossRef]
  7. Villarini, G.; Mandapaka, P.V.; Krajewski, W.F.; Moore, R.J. Rainfall and Sampling Uncertainties: A Rain Gauge Perspective. J. Geophys. Res. Atmos. 2008, 113, D11102. [Google Scholar] [CrossRef]
  8. Tang, Q.H.; Zhang, X.J.; Qi, Y.C.; Chen, S.H.; Jia, G.Q.; Mu, M.F.; Yang, J.T.; Yang, Q.Q.; Huang, X.; Yun, X.B.; et al. Remote Sensing of the Terrestrial Water Cycle:Progress and Perspectives. Geomat. Inf. Sci. Wuhan Univ. 2018, 43, 1872–1884. [Google Scholar]
  9. Beck, H.E.; Wood, E.F.; McVicar, T.R.; Zambrano-Bigiarini, M.; Alvarez-Garreton, C.; Baez-Villanueva, O.M.; Sheffield, J.; Karger, D.N. Bias Correction of Global High-Resolution Precipitation Climatologies Using Streamflow Observations from 9372 Catchments. J. Clim. 2020, 33, 1299–1315. [Google Scholar] [CrossRef] [Green Version]
  10. Sharifi, E.; Eitzinger, J.; Dorigo, W. Performance of the State-Of-The-Art Gridded Precipitation Products over Mountainous Terrain: A Regional Study over Austria. Remote Sens. 2019, 11, 2018. [Google Scholar] [CrossRef] [Green Version]
  11. Zhao, P.W.; Li, F.; Wang, J.N.; Yang, H.Q.; Guo, P.; Gong, L.J. Accuracy Evaluation and Comparison of GPM IMERG and ERA5 Precipitation Products over Complex Terrain in Yunnan. Meteorol. Sci. Technol. 2021, 49, 114–123. [Google Scholar] [CrossRef]
  12. Satge, F.; Ruelland, D.; Bonnet, M.P.; Molina, J.; Pillco, R. Consistency of Satellite-Based Precipitation Products in Space and over Time Compared with Gauge Observations and Snow-Hydrological Modelling in the Lake Titicaca Region. Hydrol. Earth Syst. Sci. 2019, 23, 595–619. [Google Scholar] [CrossRef] [Green Version]
  13. Scheel, M.L.M.; Rohrer, M.; Huggel, C.; Villar, D.S.; Silvestre, E.; Huffman, G.J. Evaluation of TRMM Multi-Satellite Precipitation Analysis (TMPA) Performance in the Central Andes Region and its Dependency on Spatial and Temporal Resolution. Hydrol. Earth Syst. Sci. 2011, 15, 2649–2663. [Google Scholar] [CrossRef] [Green Version]
  14. Chen, F.R.; Gao, Y.Q. Evaluation of Precipitation Trends from High-Resolution Satellite Precipitation Products over Mainland China. Clim. Dynam. 2018, 51, 3311–3331. [Google Scholar] [CrossRef]
  15. Gupta, V.; Jain, M.K.; Singh, P.K.; Singh, V.P. An Assessment of Global Satellite-Based Precipitation Datasets in Capturing Precipitation Extremes: A Comparison With Observed Precipitation Dataset in India. Int. J. Climatol. 2020, 40, 3667–3688. [Google Scholar] [CrossRef]
  16. Markonis, Y.; Papalexiou, S.M.; Martinkova, M.; Hanel, M. Assessment of Water Cycle Intensification over Land Using a Multisource Global Gridded Precipitation DataSet. J. Geophys. Res. Atmos. 2019, 124, 11175–11187. [Google Scholar] [CrossRef]
  17. Belabid, N.; Zhao, F.; Brocca, L.; Huang, Y.B.; Tan, Y.M. Near-Real-Time Flood Forecasting Based on Satellite Precipitation Products. Remote Sens. 2019, 11, 252. [Google Scholar] [CrossRef] [Green Version]
  18. Munier, S.; Aires, F.; Schlaffer, S.; Prigent, C.; Papa, F.; Maisongrande, P.; Pan, M. Combining Data Sets of Satellite-Retrieved Products for Basin-Scale Water Balance Study: 2. Evaluation on the Mississippi Basin and Closure Correction Model. J. Geophys. Res. Atmos. 2014, 119, 12100–12116. [Google Scholar] [CrossRef] [Green Version]
  19. Pellet, V.; Aires, F.; Munier, S.; Prieto, D.F.; Jorda, G.; Dorigo, W.A.; Polcher, J.; Brocca, L. Integrating Multiple Satellite Observations into a Coherent Dataset to Monitor the Full Water Cycle—Application to the Mediterranean Region. Hydrol. Earth Syst. Sci. 2019, 23, 465–491. [Google Scholar] [CrossRef] [Green Version]
  20. Baez-Villanueva, O.M.; Zambrano-Bigiarini, M.; Mendoza, P.A.; McNamara, I.; Beck, H.E.; Thurner, J.; Nauditt, A.; Ribbe, L.; Thinh, N.X. On the Selection of Precipitation Products for the Regionalisation of Hydrological Model Parameters. Hydrol. Earth Syst. Sci. 2021, 25, 5805–5837. [Google Scholar] [CrossRef]
  21. Joyce, R.J.; Janowiak, J.E.; Arkin, P.A.; Xie, P.P. CMORPH: A Method that Produces Global Precipitation Estimates from Passive Microwave and Infrared Data at High Spatial and Temporal Resolution. J. Hydrometeorol. 2004, 5, 487–503. [Google Scholar] [CrossRef]
  22. Xie, P.P.; Joyce, R.J.; Wu, S.R.; Yoo, S.H.; Yarosh, Y.; Sun, F.Y.; Lin, R. Reprocessed, Bias-Corrected CMORPH Global High-Resolution Precipitation Estimates from 1998. J. Hydrometeorol. 2017, 18, 1617–1641. [Google Scholar] [CrossRef]
  23. Ashouri, H.; Hsu, K.L.; Sorooshian, S.; Braithwaite, D.K.; Knapp, K.R.; Cecil, L.D.; Nelson, B.R.; Prat, O.P. PERSIANN-CDR Daily Precipitation Climate Data Record from Multisatellite Observations for Hydrological and Climate Studies. Bull. Am. Meteorol. Soc. 2015, 96, 69–83. [Google Scholar] [CrossRef] [Green Version]
  24. Huffman, G.J.; Adler, R.F.; Bolvin, D.T.; Gu, G.; Nelkin, E.J.; Bowman, K.P.; Hong, Y.; Stocker, E.F.; Wolff, D.B. The TRMM Multisatellite Precipitation Analysis (TMPA): Quasi-Global, Multiyear, Combined-Sensor Precipitation Estimates at Fine Scales. J. Hydrometeorol. 2007, 8, 38–55. [Google Scholar] [CrossRef]
  25. Ashouri, H.; Phu, N.; Thorstensen, A.; Hsu, K.L.; Sorooshian, S.; Braithwaite, D.K. Assessing the Efficacy of High-Resolution Satellite-Based PERSIANN-CDR Precipitation Product in Simulating Streamflow. J. Hydrometeorol. 2016, 17, 2061–2076. [Google Scholar] [CrossRef]
  26. Zambrano-Bigiarini, M.; Nauditt, A.; Birkel, C.; Verbist, K.; Ribbe, L. Temporal and Spatial Evaluation of Satellite-Based Rainfall Estimates across the Complex Topographical and Climatic Gradients of Chile. Hydrol. Earth Syst. Sci. 2017, 21, 1295–1320. [Google Scholar] [CrossRef] [Green Version]
  27. Bharti, V.; Singh, C. Evaluation of Error in TRMM 3B42V7 Precipitation Estimates over the Himalayan Region. J. Geophys. Res. Atmos. 2015, 120, 12458–12473. [Google Scholar] [CrossRef]
  28. Ebrahimi, S.; Chen, C.; Chen, Q.W.; Zhang, Y.S.; Ma, N.; Zaman, Q. Effects of Temporal Scales and Space Mismatches on the TRMM 3B42 v7 Precipitation Product in a Remote Mountainous Area. Hydrol. Process. 2017, 31, 4315–4327. [Google Scholar] [CrossRef]
  29. Eyring, V.; Cox, P.M.; Flato, G.M.; Gleckler, P.J.; Abramowitz, G.; Caldwell, P.; Collins, W.D.; Gier, B.K.; Hall, A.D.; Hoffman, F.M. Taking Climate Model Evaluation to the Next Level. Nat. Clim. Chang. 2019, 9, 102–110. [Google Scholar] [CrossRef] [Green Version]
  30. Benkirane, M.; Laftouhi, N.E.; Khabba, S.; El Mansouri, B. Multiscale Assessment of TRMM (3B42 V7) and GPM (IMERG V5) Satellite Precipitation Products over a Mediterranean Mountainous Watershed with Sparse Rain Gauges in the Moroccan High Atlas (case study of Zat basin). Hydrol. Earth Syst. Sci. Discuss. 2021, 2021, 1–18. [Google Scholar] [CrossRef]
  31. Qi, W.; Zhang, C.; Fu, G.; Sweetapple, C.; Zhou, H. Evaluation of Global Fine-Resolution Precipitation Products and their Uncertainty Quantification in Ensemble Discharge Simulations. Hydrol. Earth Syst. Sci. 2016, 20, 903–920. [Google Scholar] [CrossRef] [Green Version]
  32. Tang, G.; Clark, M.P.; Papalexiou, S.M.; Ma, Z.; Hong, Y. Have satellite precipitation products improved over last two decades? A comprehensive comparison of GPM IMERG with nine satellite and reanalysis datasets. Remote Sens. Environ. 2020, 240, 111697. [Google Scholar] [CrossRef]
  33. Dinku, T.; Ruiz, F.; Connor, S.J.; Ceccato, P. Validation and Intercomparison of Satellite Rainfall Estimates over Colombia. J. Appl. Meteorol. Clim. 2010, 49, 1004–1014. [Google Scholar] [CrossRef]
  34. Salio, P.; Paula Hobouchian, M.; Garcia Skabar, Y.; Vila, D. Evaluation of High-Resolution Satellite Precipitation Estimates over Southern South America Using a Dense Rain Gauge Network. Atmos. Res. 2015, 163, 146–161. [Google Scholar] [CrossRef]
  35. Wang, C.X.; Graham, R.M.; Wang, K.G.; Gerland, S.; Granskog, M.A. Comparison of ERA5 and ERA-Interim Near-Surface Air Temperature, Snowfall and Precipitation over Arctic Sea Ice: Effects on Sea Ice Thermodynamics and Evolution. Cryosphere 2019, 13, 1661–1679. [Google Scholar] [CrossRef] [Green Version]
  36. Sharifi, E.; Saghafian, B.; Steinacker, R. Downscaling Satellite Precipitation Estimates With Multiple Linear Regression, Artificial Neural Networks, and Spline Interpolation Techniques. J. Geophys. Res. Atmos. 2019, 124, 789–805. [Google Scholar] [CrossRef] [Green Version]
  37. Tarek, M.; Brissette, F.P.; Arsenault, R. Evaluation of the ERAS Reanalysis as a Potential Reference Dataset for Hydrological Modelling over North America. Hydrol. Earth Syst. Sci. 2020, 24, 2527–2544. [Google Scholar] [CrossRef]
  38. Gao, Y.; Yuan, Z.; Yuan, Y.; Fang, H.Y. Analysis of Precipitation Variation in the Heihe River in Recent 50 Years. South-To-North Water Transf. Water Sci. Technol. 2013, 11, 16–21. [Google Scholar]
  39. Li, H.Y.; Wang, K.L.; Jiang, H.; Yu, T. Study of the Precipitation in the Heihe River Basin: Progress and Prospect. J. Glaciol. Geocryol. 2009, 31, 334–341. [Google Scholar]
  40. Wang, N.L.; He, J.Q.; Jiang, X.; Song, G.J.; Pu, J.C.; Wu, X.B.; Chen, L. Study on the Zone of Maximum Precipitation in the North Slopes of the Central Qilian Mountains. J. Glaciol. Geocryol. 2009, 31, 395–403. [Google Scholar]
  41. Xu, J.J.; Wang, K.L.; Jiang, H.; Li, Z.G.; Sun, J.; Luo, X.P.; Zhu, Q.L. A Numerical Simulation of the Effects of Westerly and Monsoon on Precipitation in the Heihe River Basin. J. Glaciol. Geocryol. 2010, 32, 489–496. [Google Scholar]
  42. Yang, Y.F.; Luo, Y. Evaluation on Detective Ability of TRMM Remote Sensing Precipitation in Arid Region of Northwest China. Arid Land Geography 2013, 36, 371–381. [Google Scholar]
  43. Pan, X.D.; Li, X.; Cheng, G.D.; Li, H.Y.; He, X.B. Development and Evaluation of a River-Basin-Scale High Spatio-Temporal Precipitation Data Set Using the WRF Model: A Case Study of the Heihe River Basin. Remote Sens. 2015, 7, 9230–9252. [Google Scholar] [CrossRef] [Green Version]
  44. Qu, W.; Lu, J.X.; Pang, Z.G. Assessment of TRMM Satellite Precipitation Data and Its Impacts on the Water Balance of the Heihe River Basin. In Proceedings of the 3rd International Conference on Photonics and Image in Agriculture Engineering (PIAGENG), Sanya, China, 27–28 January 2013. WOS:000323247100027. [Google Scholar] [CrossRef]
  45. Wang, Y.; Xu, Z.L.; Zhang, B.; Li, Q. Monitoring the Meteorological Drought in the Middle Reaches of Heihe River Basin Based on TRMM Precipitation Data. In Proceedings of the 36th IEEE International Geoscience and Remote Sensing Symposium (IGARSS), Beijing, China, 10–15 July 2016; pp. 4313–4316, WOS:000388114604079. [Google Scholar] [CrossRef]
  46. Zhang, D.; Song, X.F.; Zhang, Y.H.; Yang, L.H.; Yang, S.T. Variation Characteristics of Precipitation over Weihe River Basin Based on CRU Grid Dataset During Last 100 Years. J. Arid Land Res. Environ. 2018, 32, 142–148. [Google Scholar]
  47. Yuan, F.; Zhang, L.M.; Soe, K.M.W.; Ren, L.L.; Zhao, C.X.; Zhu, Y.H.; Jiang, S.H.; Liu, Y. Applications of TRMM- and GPM-Era Multiple-Satellite Precipitation Products for Flood Simulations at Sub-Daily Scales in a Sparsely Gauged Watershed in Myanmar. Remote Sens. 2019, 11, 140. [Google Scholar] [CrossRef] [Green Version]
  48. Jiang, Y.Z.; Yang, K.; Shao, C.K.; Zhou, X.; Zhao, L.; Chen, Y.Y.; Wu, H. A Downscaling Approach for Constructing High-Resolution Precipitation Dataset over the Tibetan Plateau from ERA5 Reanalysis. Atmos. Res. 2021, 256, 105574. [Google Scholar] [CrossRef]
  49. Uysal, G.; Sorman, A.U. Evaluation of PERSIANN Family Remote Sensing Precipitation Products for Snowmelt Runoff Estimation in a Mountainous Basin. Hydrolog. Sci. J. 2021, 66, 1790–1807. [Google Scholar] [CrossRef]
  50. Xiao, S.C.; Xiao, H.L.; Lan, Y.C.; Yang, Y.G. Water Issues and Integrated Water Resource Management in Heihe River Basin in Recent 50 Years. J. Desert Res. 2011, 31, 529–535. [Google Scholar]
  51. Zhang, H.W.; Lu, A.X.; Wang, L.H.; Guo, Z.M.; Zhang, C.W. Glacier Change in the Shulenan Mountain Monitored by Remote Sensing. J. Glaciol. Geocryol. 2011, 33, 8–13. [Google Scholar]
  52. Huffman, G.; Bolvin, D.; Braithwaite, D.; Hsu, K.; Joyce, R.; Xie, P. Integrated Multi-satellitE Retrievals for GPM (IMERG), Version 4.4. NASA’s Precipitation Processing Center. Available online: ftp://arthurhou.pps.eosdis.nasa.gov/gpmdata/ (accessed on 31 March 2015).
  53. Phu, N.; Shearer, E.J.; Hoang, T.; Ombadi, M.; Hayatbini, N.; Palacios, T.; Phat, H.; Braithwaite, D.; Updegraff, G.; Hsu, K.L.; et al. The CHRS Data Portal, an Easily Accessible Public Repository for PERSIANN Global Satellite Precipitation Data. Sci. Data 2019, 6, 180296. [Google Scholar] [CrossRef] [Green Version]
  54. Sorooshian, S.; Hsu, K.L.; Gao, X.; Gupta, H.V.; Imam, B.; Braithwaite, D. Evaluation of PERSIANN System Satellite-Based Estimates of Tropical Rainfall. Bull. Am. Meteorol. Soc. 2000, 81, 2035–2046. [Google Scholar] [CrossRef] [Green Version]
  55. Schuster, G.; Ebert, E.E.; Stevenson, M.A.; Corner, R.J.; Johansen, C.A. Application of Satellite Precipitation Data to Analyse and Model Arbovirus Activity in the Tropics. Int. J. Health Geogr. 2011, 10, 8. [Google Scholar] [CrossRef] [PubMed] [Green Version]
  56. Gupta, H.V.; Kling, H.; Yilmaz, K.K.; Martinez, G.F. Decomposition of the Mean Squared Error and NSE Performance Criteria: Implications for Improving Hydrological Modelling. J. Hydrol. 2009, 377, 80–91. [Google Scholar] [CrossRef] [Green Version]
  57. Kling, H.; Fuchs, M.; Paulin, M. Runoff Conditions in the Upper Danube Basin Under an Ensemble of Climate Change Scenarios. J. Hydrol. 2012, 424, 264–277. [Google Scholar] [CrossRef]
  58. Tian, F.; Hou, S.; Yang, L.; Hu, H.; Hou, A. How does the evaluation of the GPM IMERG rainfall product depend on gauge density and rainfall intensity? J. Hydrometeorol. 2018, 19, 339–349. [Google Scholar] [CrossRef]
  59. Lei, H.; Li, H.; Zhao, H.; Ao, T.; Li, X. Comprehensive evaluation of satellite and reanalysis precipitation products over the eastern Tibetan plateau characterized by a high diversity of topographies. Atmos. Res. 2021, 259, 105661. [Google Scholar] [CrossRef]
Figure 1. Topography and station distribution map over the HRB.
Remotesensing 14 01458 g001
Figure 2. Processing workflow for the precipitation observations at stations and estimates from high-resolution gridded precipitation products of this study.
Remotesensing 14 01458 g002
Figure 3. Spatial distribution of annual mean precipitation observations at stations and estimates from each product over the HRB during 2016–2019.
Remotesensing 14 01458 g003
Figure 4. Dot plots of three indices of annual precipitation from each product over the HRB and its upper, middle and lower reaches during 2016–2019.
Remotesensing 14 01458 g004
Figure 5. Taylor diagrams of annual precipitation estimates from each product in comparison with observations at stations over the (a) entire HRB and (b) upper, (c) middle and (d) lower reaches of the basin during 2016–2019.
Remotesensing 14 01458 g005
Figure 6. Dot plots of three indices of seasonal precipitation estimates from each product over the HRB during 2016–2019.
Remotesensing 14 01458 g006
Figure 7. Taylor diagrams of seasonal precipitation estimates from each product in comparison with observations at stations over the HRB during 2016–2019.
Remotesensing 14 01458 g007
Figure 8. Radar plots of six indices of seasonal precipitation estimates from each product between observations at stations for different seasons and regions during 2016–2019.
Remotesensing 14 01458 g008
Figure 9. Time series diagram of monthly mean precipitation of estimates from each product and observations at stations over the (a) entire HRB and (b) upper, (c) middle and (d) lower reach area during 2016–2019.
Remotesensing 14 01458 g009
Figure 10. Bar plots of 6 indices of monthly precipitation estimates from each product between observations at stations over the HRB in different months during 2016–2019.
Remotesensing 14 01458 g010
Figure 11. Spatial distributions of RMSE of monthly precipitation estimates from each product for stations over the HRB during 2016–2019.
Remotesensing 14 01458 g011
Figure 12. Spatial distributions of KGE’ of monthly precipitation estimates from each product for stations over the HRB during 2016–2019.
Remotesensing 14 01458 g012
Figure 13. Box plots of four indices of monthly precipitation estimates from each product over the HRB during 2016–2019.
Remotesensing 14 01458 g013
Table 1. Summary of high-resolution gridded precipitation products used in this study.
DatasetResolutionPeriodCoverageData Source
CMORPH0.25°, daily1998-present60°N–60°Shttps://rda.ucar.edu/, accessed on 23 March 2021
CRU0.5°, monthly1901–202090°N–90°Shttp://www.cru.uea.ac.uk/, accessed on 23 March 2021
ERA50.1°, monthly1979-present90°N–90°Shttps://cds.climate.copernicus.eu/, accessed on 25 March 2021
GSMaP0.1°, monthly2014-present60°N–60°Shttps://hokusai.eorc.jaxa.jp/, accessed on 26 March 2021
IMERG0.1°, monthly2000–202160°N–60°Shttps://disc.gsfc.nasa.gov/, accessed on 28 March 2021
MSWEP0.1°, monthly1979-present90°N–90°Shttp://www.gloh2o.org/mswep/, accessed on 10 April 2021
PERSIANN0.25°, daily1982-present60°N–60°Shttps://www.ncei.noaa.gov/, accessed on 28 March 2021
TRMM0.25°, monthly1998–202050°N–50°Shttps://disc.gsfc.nasa.gov/, accessed on 3 April 2021
Publisher’s Note: MDPI stays neutral with regard to jurisdictional claims in published maps and institutional affiliations.

