Article

CALIOP-Based Quantification of Central Asian Dust Transport

1
Key Laboratory for Semi-Arid Climate Change of the Ministry of Education, College of Atmospheric Sciences, Lanzhou University, Lanzhou 730000, China
2
Collaborative Innovation Center for Western Ecological Safety, Lanzhou University, Lanzhou 730000, China
*
Author to whom correspondence should be addressed.
Remote Sens. 2022, 14(6), 1416; https://doi.org/10.3390/rs14061416
Submission received: 8 February 2022 / Revised: 7 March 2022 / Accepted: 12 March 2022 / Published: 15 March 2022

Abstract

:
Central Asia is one of the most important sources of mineral saline dust worldwide. A comprehensive understanding of Central Asian dust transport is essential for evaluating its impacts on human health, ecological safety, weather and climate. This study first puts forward an observation-based climatology of Central Asian dust transport flux by using the 3-D dust detection of Cloud-Aerosol LiDAR with Orthogonal Polarization (CALIOP). The seasonal difference of transport flux and downstream contribution are evaluated and compared with those of the Modern-Era Retrospective Analysis for Research and Applications, version 2 (MERRA-2). Central Asian dust can be transported not only southward in summer under the effect of the South Asian summer monsoon, but also eastward in other seasons under the control of the westerly jet. Additionally, the transport of Central Asian dust across the Pamir Plateau to the Tibetan Plateau is also non-negligible, especially during spring (with a transport flux rate of 150 kg m−1 day−1). The annual CALIOP-based downstream contribution of Central Asian dust to South Asian (164.01 Tg) is 2.1 times that to East Asia (78.36 Tg). This can be attributed to the blocking effect of the higher terrain between Central and East Asia. Additionally, the downstream contributions to South and East Asia from MERRA-2 are only 0.36 and 0.84 times that of CALIOP, respectively. This difference implies the overestimation of the wet and dry depositions of the model, especially in the low latitude zone. The quantification of the Central Asian dust transport allows a better understanding of the Central Asian dust cycle, and supports the calibration/validation of aerosol-related modules of regional and global climate models.

1. Introduction

Central Asia, a key node in the Belt and Road Initiative, is located in inland arid and semi-arid regions, with some important deserts, e.g., Karakum Desert (KkD) and Kyzylkum Desert (KlD). Increased desertification has exposed the region to severe dust storm hazards driven by global warming, and increased its contribution to the global dust cycle [1,2]. Especially over the past 50 years, the surface areas of the Caspian Sea and the Aral Sea have been shrinking [3,4]. A large amount of high-density saline-alkali dust along with heavy metal elements has been discharged into the atmosphere by wind erosion on dry lakes. This saline dust is carried downstream by the westerly jet to the Pamir and Tibetan Plateau [5,6,7], and even to Northern China [8,9], where it can cause a serious threat to the surrounding environment, ecosystem and human health [3,10,11,12].
Dust aerosol can affect the regional weather and climate by modulating the radiation budget of the earth-atmosphere system [13,14,15,16,17]. When dust aerosol is deposited into snow, it can darken the snow and reduce the surface albedo, and then warm the surface by absorbing radiation. Meanwhile, salt has a strong ability to remove snow; thus, saline dust may accelerate the melting process of snowpack and affect the cryosphere when deposited into snow [18,19,20,21,22]. Additionally, saline-alkali dust always carries a large amount of minerals and heavy metal elements, which can affect the downstream ecological environment and biochemical cycle [10,23,24,25]. Since saline dust is highly hygroscopic, with a stronger ability of ice nucleus (IN) and cloud condensation nucleus (CCN) activation, it plays an important role in cloud microphysical processes and precipitation in local and downstream areas [23,26,27]. Therefore, a comprehensive analysis of the Central Asian dust distribution and transport process can provide scientific and effective support to understanding its potential role in and response to climate change and the land-atmosphere ecological cycle.
Advances in remote sensing and model simulation provide a good foundation for the study of Central Asian dust. Researchers have established long-term observations of the optical properties of Central Asian dust based on the observation of AErosol RObotic NETwork (AERONET) [28,29,30,31,32] and some meteorological stations [33,34,35]. However, ground observation cannot obtain appropriate 3-D distribution information in a vast space due to limited ground-based stations. By contrast, satellite measurements can supplement the information of dust distribution in Central Asia with the advantages of large-scale, high-resolution observations [3,13]. Based on MODerate-resolution Imaging Spectroradiometer (MODIS) data, Wang et al. [3] analyzed the spatiotemporal variability of aerosol optical depth in Central Asia. Moreover, the Cloud-Aerosol LiDAR with Orthogonal Polarization (CALIOP), onboard the Cloud-Aerosol LiDAR and Infrared Pathfinder Satellite Observations (CALIPSO), was used to characterize the vertical distribution of aerosols [36,37]. Such efforts set the stage for model developments which can provide an opportunity to analyze the Central Asian dust cycle [38,39]. Nevertheless, there are still large uncertainties in model simulations due to the settings of different parameterization schemes, especially in the regional models [1,40,41]. Therefore, an independent and effective observation-based dataset on the transport characteristics of Central Asian dust is essential for constraining and improving model simulation and prediction [42].
In recent decades, researchers have been constructing and refining methods for quantifying dust transport using satellite observations. For example, Kaufman et al. [43] proposed a retrieval method of dust mass concentration (DMC) from MODIS observations by setting the layer height, dust mass extinction efficiency (MEE) and effective particle radius. That study estimated the trans-Atlantic dust transport and sedimentation flux by combining the wind field data. However, it is worth noting that the distribution of dust optical depth (DOD) or DMC is not able to better illustrate dust transport characteristics, because dust transport is largely determined by wind regime and geomorphology. Yu et al. [44] further quantified 3-D trans-Atlantic dust transport using the profiles of dust extinction coefficient observed by CALIPSO with an assumed dust MEE. Nonetheless, that assumption of MEE could result in an uncertainty of about 30% in the dust mass flux estimation [44]. Yu et al. [45] also attempted to improve the estimation of dust transport by assuming the linear increment of dust MEE with dust transport distance. To further reduce the uncertainty induced by dust MEE, the seasonal dust MEE of the new Dust Constraints from joint Observational-Modelling-experiMental analysis (DustCOMM) dataset is employed in this study. The DustCOMM uses the constrained size distributions to achieve size integration, and it has been proven that the column-integrated MEE has a mean difference of less than 1% compared with observed MEE [46,47], as was also introduced by Han et al. [48]. Their purpose was to construct East Asian dust transport fluxes and the downstream contributions of East and South Asian desert-sources by using CALIPSO observations. These newly updated retrieval methods are better able to quantify dust transport characteristics and even understand the dust cycle.
In this study, the new retrieval method developed by Han et al. [48] is employed to further quantify the Central Asian dust transport flux and evaluate its downstream contribution based on CALIPSO observations. Additionally, the CALIOP-based results are analyzed by comparing them with those of MERRA-2. The paper is organized as follows. All datasets and methods are introduced in Section 2. Section 3.1 and Section 3.2 provide analyses of the climatology of DOD and the dust transport characteristics over the Central Asia. The quantitative evaluation of the downstream contributions of Central Asian dust are discussed in Section 3.3. Discussions and conclusions are presented in Section 4 and Section 5, respectively.

2. Data and Method

2.1. CALIOP and MODIS Data

To obtain a 3-D distribution of the optical properties of the Central Asian dust, the latest CALIOP version 4 level 2 Aerosol Profile (APRO) products during 2007–2018 are used. Following Wang et al. [20] and Han et al. [48], a data filtering scheme with cloud-aerosol discrimination (CAD) score between −70 and −100 and extinction quality control flag (Ext_QC) flag values of 0, 1, 2, 16 and 18 are used to further ensure the high quality retrieval data. The CALIOP can identify three dust-related subtypes, being “dust”, “polluted dust”, and “dusty marine”. Using “dust” alone would result in an underestimation of the actual atmospheric dust loading, while introducing the full value of polluted dust would overestimate the dust loading. Therefore, we set an a priori threshold value of particulate depolarization ratio (PDR) for dust (0.31) and non-dust (0.05) to extract dust components from “polluted dust” and “dusty marine” (see detailed description of the method in Wang et al. [20]), considering irregular dust particles with a significantly larger PDR than pollutants [49]. The total dust backscatter coefficient at 532 nm is calculated as the sum of “dust” and dust component of “polluted dust” and “dusty marine”. Dust extinction coefficient at 532 nm is then calculated as the dust backscatter coefficient (multiplying by the dust LiDAR ratio of 44 sr), consistent with the number used in the CALIOP V4 product [37,50]. Finally, the total DOD is calculated by integrating the vertical dust extinction profile. Considering the complex topography of Central Asia, the monthly mean dust extinction coefficient and DOD of CALIPSO are re-gridded at a resolution of 0.5° (latitude) × 1.5° (longitude).
The MODIS on board Aqua and Terra satellites provides observations in 36 spectral bands around 0.41–14 µm, with a coverage of 2330 km and almost daily global coverage. Based on two complementary aerosol inversion algorithms, the “Dark Target” algorithm (DT) and the “Deep Blue” algorithm (DB), the information of the global aerosol optical properties can be obtained. Following the method of Song et al. [51] and Yu et al. [52], the MODIS DOD over ocean can be extracted by using the AOD and fine mode fraction retrieved from DT algorithm, while the DOD over land is calculated by using the AOD, Ångström exponent and single-scattering albedo at 470 nm retrieved from DB algorithm. Next, the MODIS DOD is used to evaluate and compare with the results of CALIOP.

2.2. MERRA-2 Data

The MERRA-2 dataset was generated by coupling the Goddard Earth Observation System of Systems v5 (GEOS-5) with the Goddard Chemical Aerosol Radiation and Transport (GOCART) model [53]. This can provide the fundamental meteorological field data as an atmospheric model using the three-dimensional variational data analysis (3DVAR) Gridpoint Statistical Interpolation (GSI) meteorological analysis scheme [54,55]. The DOD at 550 nm is also given by MERRA-2 by assimilating multisource aerosol observations, such as MODIS, Multiangle Imaging Spectroradiometer (MISR) and AERONET [56,57,58]. Additionally, the MERRA-2 can directly offer aerosol diagnostics not easily observed, such as dust emission, transport and deposition fluxes, which are simulated using a radiatively coupled version of GOCART. All these variations are driven with a resolution of 0.5° × 0.625° and 72 hybrid-eta levels from the surface and to 0.01 hPa. In this study, the U and V components of the monthly mean wind speed are resampled to the same resolution of CALIOP so as to calculate the dust transport flux. In addition, the one-hourly dust column transport flux rate and DOD data are also used for comparison with the CALIOP-based estimation. To facilitate calculations and comparative analysis, all variables are re-gridded to 0.5° × 1.5° resolution at monthly scale.

2.3. Estimates of Dust Transport Flux and Downstream Contribution

The dust transport flux and downstream contribution are estimated by following the method described in our previous studies [48]. Here, we simply describe the retrieval diagrams. First, the CALIOP-based extinction observations are used to obtain the monthly averaged 3-D distribution of total dust extinction coefficient profiles (as described in Section 2.1). Second, the DMC is calculated by dividing the DOD by the seasonal dust MEE from DustCOMM dataset. In addition, the uncertainties of DMC and dust transport flux caused by dust MEE are also evaluated by employing one standard deviation of dust MEE. Third, to characterize the dust transport flux and downstream contribution, the monthly mean dust transport flux rates (DFR) in the longitudinal and latitudinal directions are calculated by combining dust mass concentration and monthly mean wind field provided by MERRA-2.
According to the previous study, Central Asian dust can be transported eastward across the Pamirs Plateau and Tianshan Mountains and then sweep through the Tibetan Plateau and Northern China [5,7], and also move southeast into Pakistan and the Indian peninsula [59,60,61]. Therefore, the study region of Central Asia is defined as the region connecting Europe and Asia at latitude range of 25–55°N and a longitude range of 45–88°E, which covers the Uzbekistan, Kyrgyzstan, Turkmenistan, Tajikistan, Kazakhstan and Iranian plateau (see Figure 1). To conveniently quantify the transport contribution of Central Asian dust to South and East Asia based on the calculated DFR, two cross-sections, C1 (69°E) and C2 (along the Tianshan Mountains, Junggar Xibu Shandi Mountains, western Altai Mountains), are also defined (refer to Figure 1). The integrated dust transport fluxes at zonal and meridional directions along the two cross sections are used to understand the contributions of Central Asian dust to South and East Asia, respectively.

3. Results

3.1. Climatology of Central Asian Dust

Figure 2 shows the seasonal climatology of DOD over Central Asia and surroundings captured by CALIOP, MODIS observation and MERRA-2 Reanalysis dataset. Apparently, the Central Asian dust loading exhibits significant seasonal variation, which peaks (more than 0.3) in spring and summer, and bottoms out (below 0.15) in autumn and winter. Over an annual cycle, the DOD in the north of Central Asia is much lower than that in the north throughout the year because of its higher vegetation coverage [26]. Additionally, the DOD of Central Asia decreases gradually from west to east, with the peak center in the Caspian Sea, Aral Sea, and the surrounding deserts, i.e., KkD and KlD. This is consistent with the findings of previous studies [62,63,64]. The annual mean DODs for these four regions are about 0.18, 0.12, 0.15 and 0.11, respectively. The high DOD usually extends from the Caspian Sea and Aral Sea to the Indo-Gangetic Plain throughout the whole year. Additionally, a weak DOD belt (DOD > 0.05) comes from Central Asia and extends to the Junggar Basin and TD, especially in spring. However, comparing the DOD in TD of East Asia and the Indo-Gangetic Plain (IGP)of South Asia, the DOD of Central Asia is relatively small due to the high dust emission from ThD and TD themselves [65,66].
Although the CALIOP, MODIS and MERRA-2 DOD have consistent seasonal characteristics, there are still significant differences between them in terms of the magnitude of DOD. The CALIOP DOD is significantly smaller than the MODIS DOD in the north of Central Asia and the TP, while it is higher than that in Pakistan and the Indo-Gangetic Plain. This phenomenon can be attributed to differences in sensors and retrieval methods. On one hand, the CALIOP has some missing detections caused by the detection threshold and periods. On the other hand, the retrieval algorithms of MODIS AOD contain some uncertainties due to instrument calibration errors, cloud-masking errors, inappropriate assumptions regarding surface reflectance, and aerosol model selection [67,68]. Additionally, the extraction of MODIS DOD over land depends on the dust size and absorption characteristics, which also introduces some uncertainties, especially in areas with large snow, ice or cloud coverage [51]. Compared with the CALIOP DOD, the distribution of MERRA-2 DOD is more consistent with MODIS DOD. This is because the MODIS AOD is one of the most important aerosol observation sources when the MERRA-2 produced the DOD by using the atmospheric assimilation system [53].

3.2. Climatology of Central Asian Dust Transport

3.2.1. Horizontal Distribution

To clearly characterize the transport of Central Asian dust, the column-integrated DFR at zonal and meridional direction is compounded. Figure 3 displays the composite column-integrated DFR over Central Asia, which clearly describes the magnitude (color scale) and directions (arrows) of Central dust transport in each season. Obviously, a heavy dust transport belt is distributed in the south of Central Asia at a latitude range of 25–40°N, extending from the southern Caspian Sea to the Iranian Plateau. This belt possesses the highest DFR (>100 kg m−1 day−1) and significant seasonal-varying transport direction. The peak DFR occurs in spring and summer (beyond 250 kg m−1 day−1) and the trough occurs in winter (less than 150 kg m−1 day−1). Notably, a distinct center of convergence can be found in Central Asia during summer, and thus the Central Asian dust can be transported from KkD to Iranian Plateau under the prevailing north winds and then turn southeast under the effect of South Asian summer monsoon with a DFR of no less than 150 kg m−1 day−1. This leads to a significant accumulation of dust in the Sulaiman Range, with a high DOD (>0.4) in Pakistan (Figure 2c–f).
Furthermore, the transcontinental transport of Central Asian dust to East Asia is also non-negligible. As shown in Figure 3, on one hand, the Central Asian dust from KlD can be lifted and transported to the Tibetan Plateau across the Pamirs Plateau, especially during spring (~150 kg m−1 day−1) and summer (~90 kg m−1 day−1), under the co-configuration of upper and lower air circulation. On the other hand, Central Asian dust can also be transported along the Tianshan and Altai Mountains under the prevailing westerlies, and then arrive in the mainland of China and Mongolia. This is related to the westerly circulation [69,70], which occurs almost all year round, with a peak in spring (~120 kg m−1 day−1) and a trough in winter (~55 kg m−1 day−1). Similarly, the above transcontinental transport of Central Asian dust can also be clearly described by the MERRA-2 DFR. However, the MERRA-2 has a much smaller magnitude of DFR than that of CALIOP, which means the MERRA-2 reanalysis dataset would underestimate the cross-continental transport of Central Asian dust to East and South Asia.

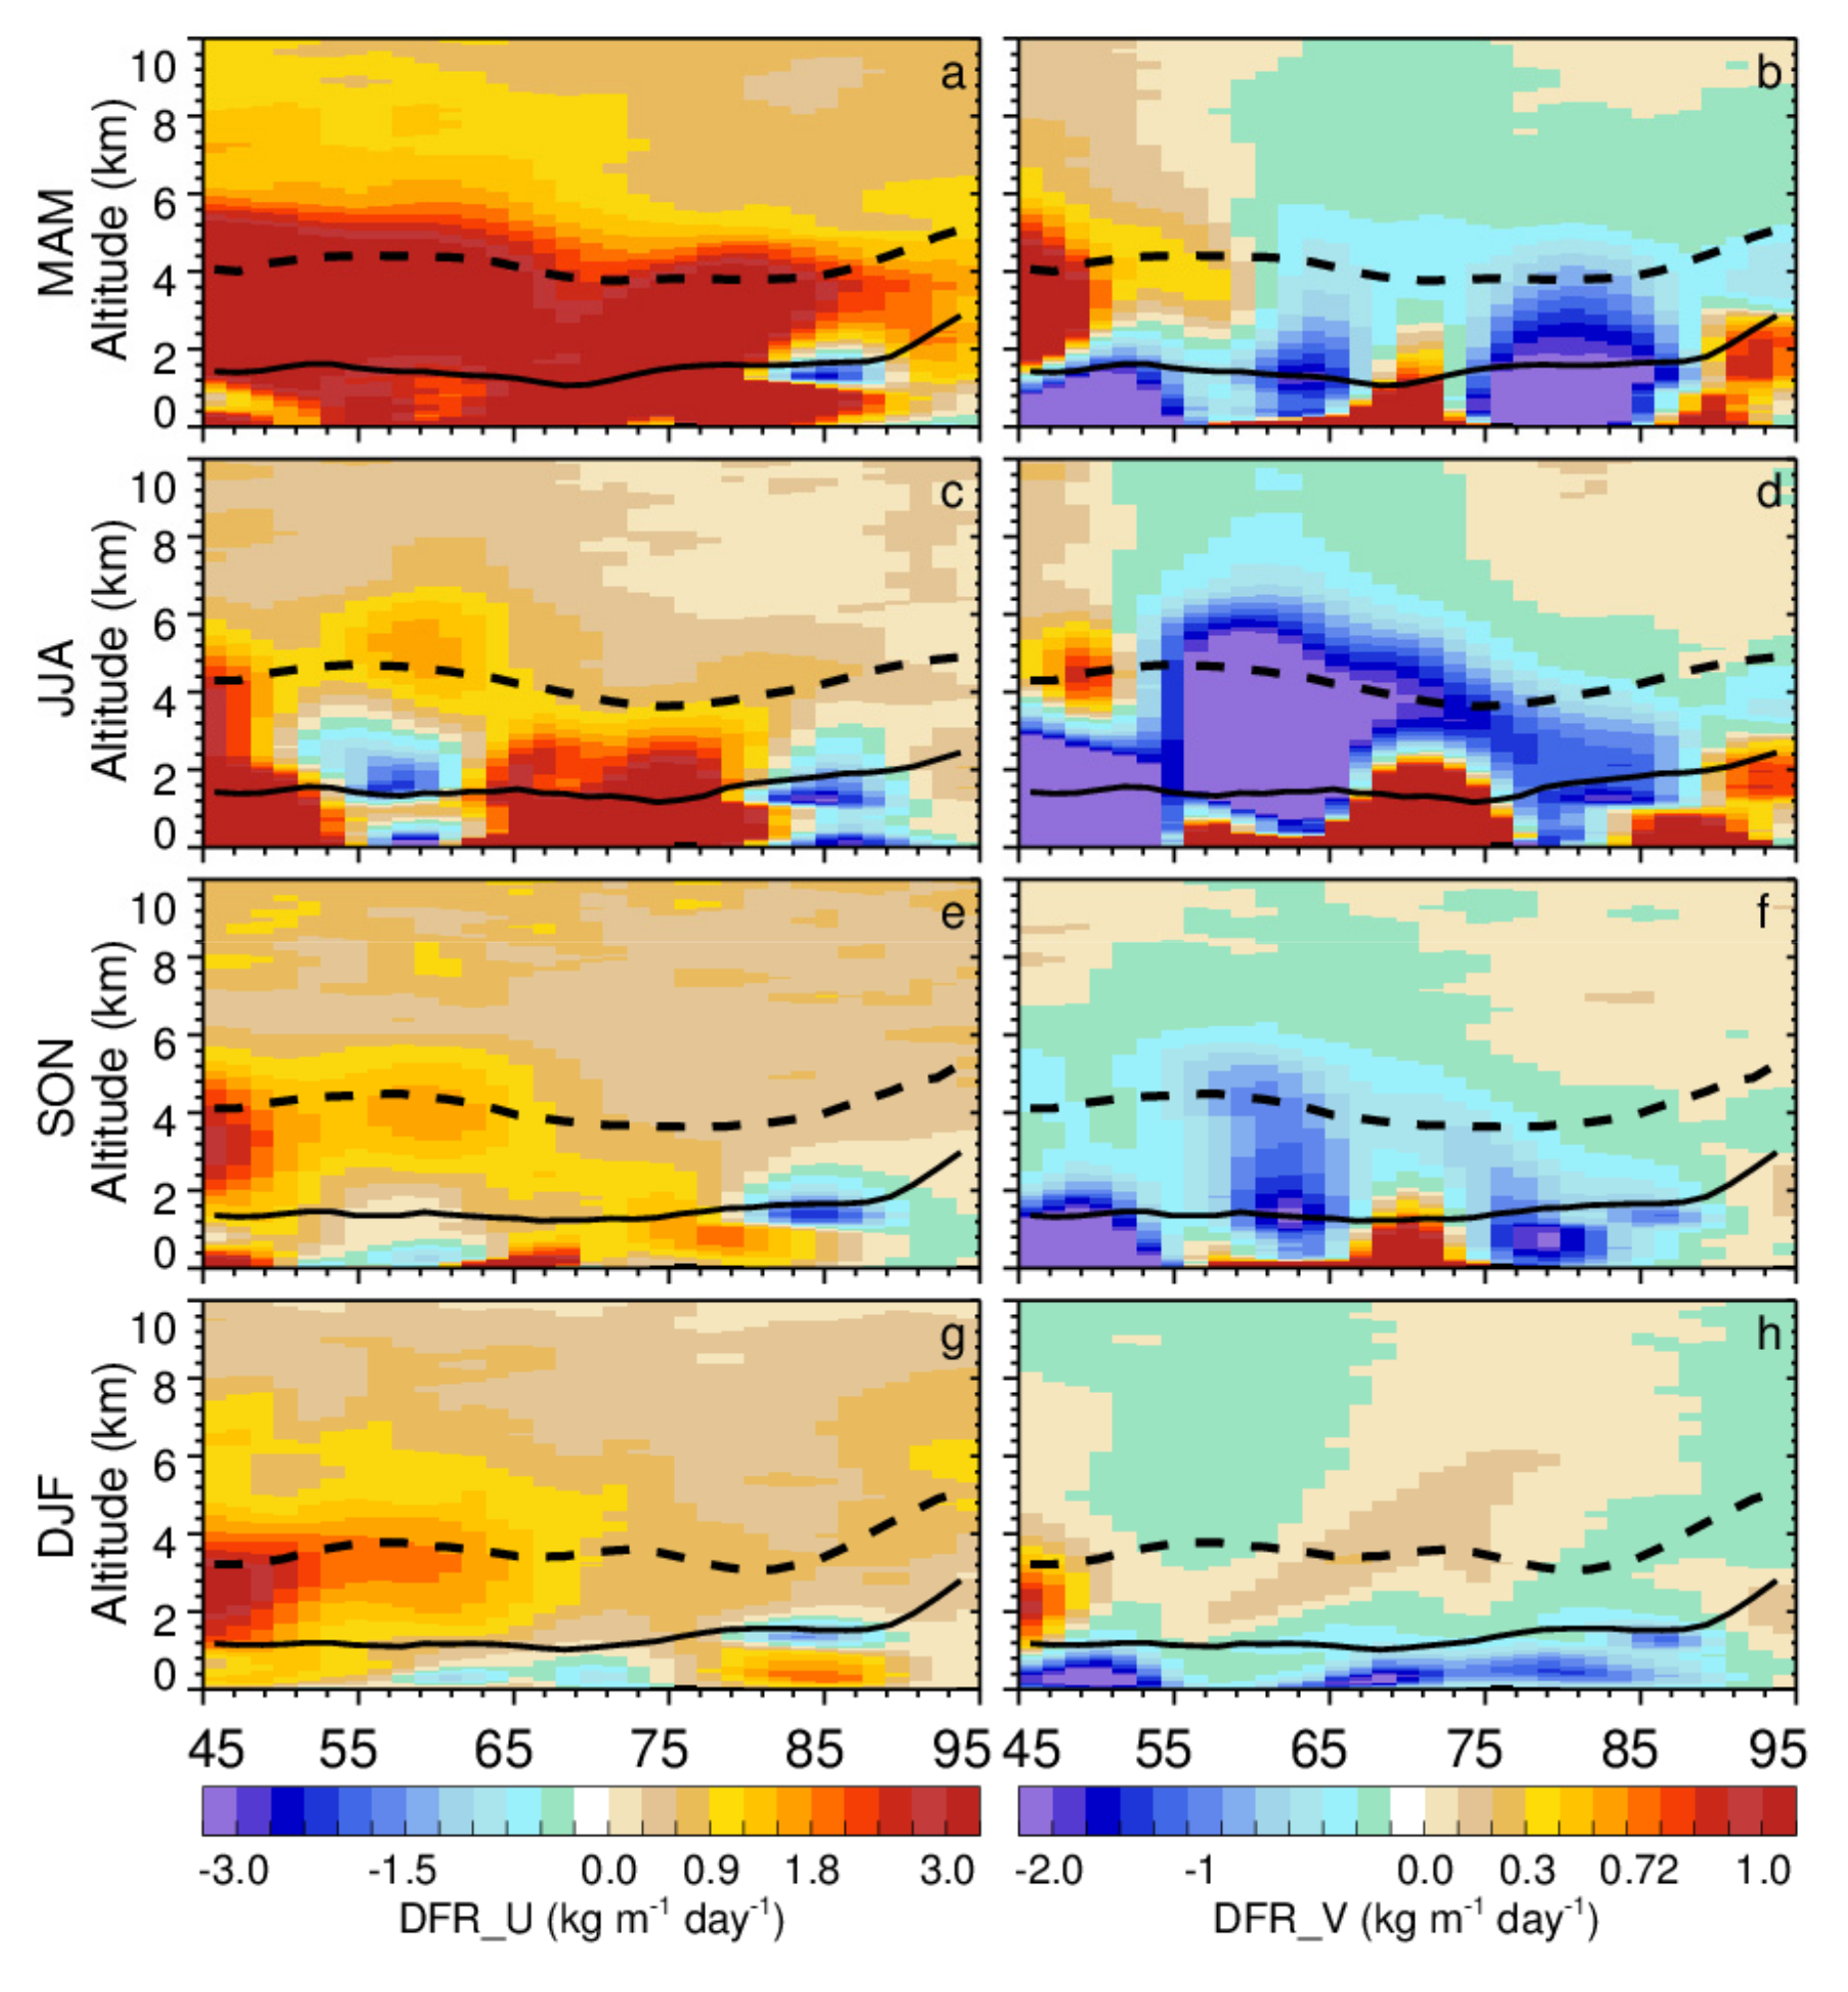
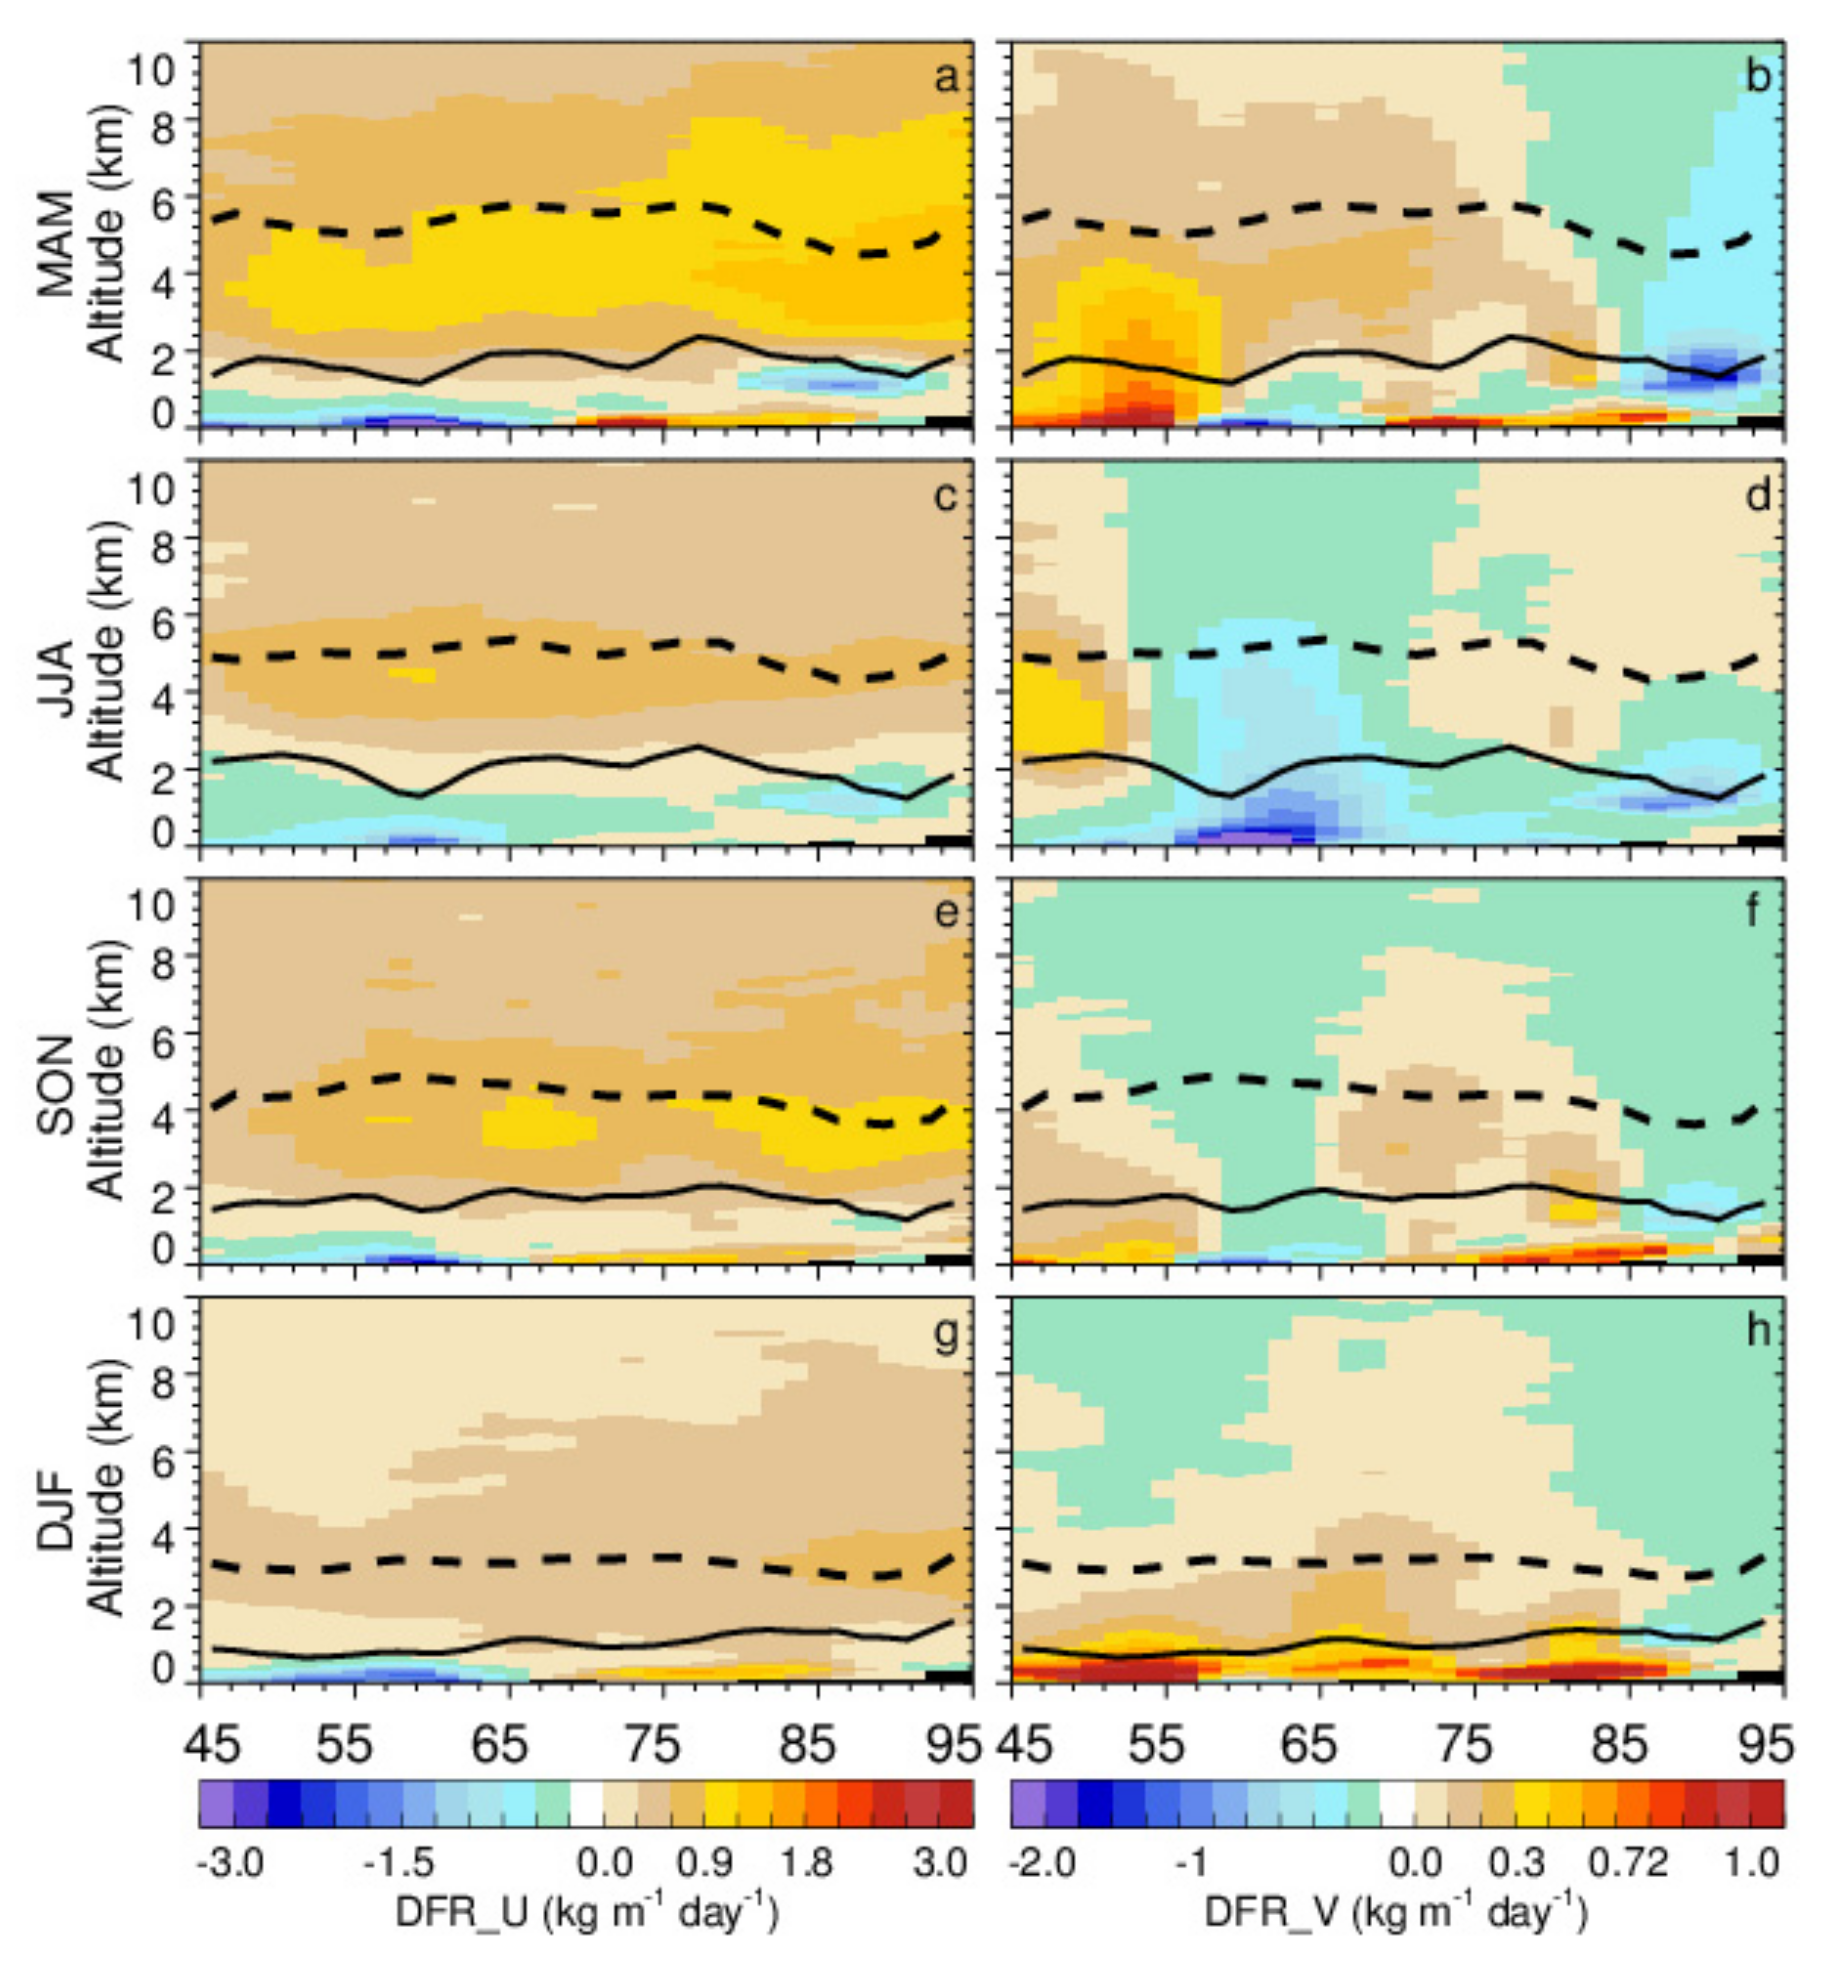
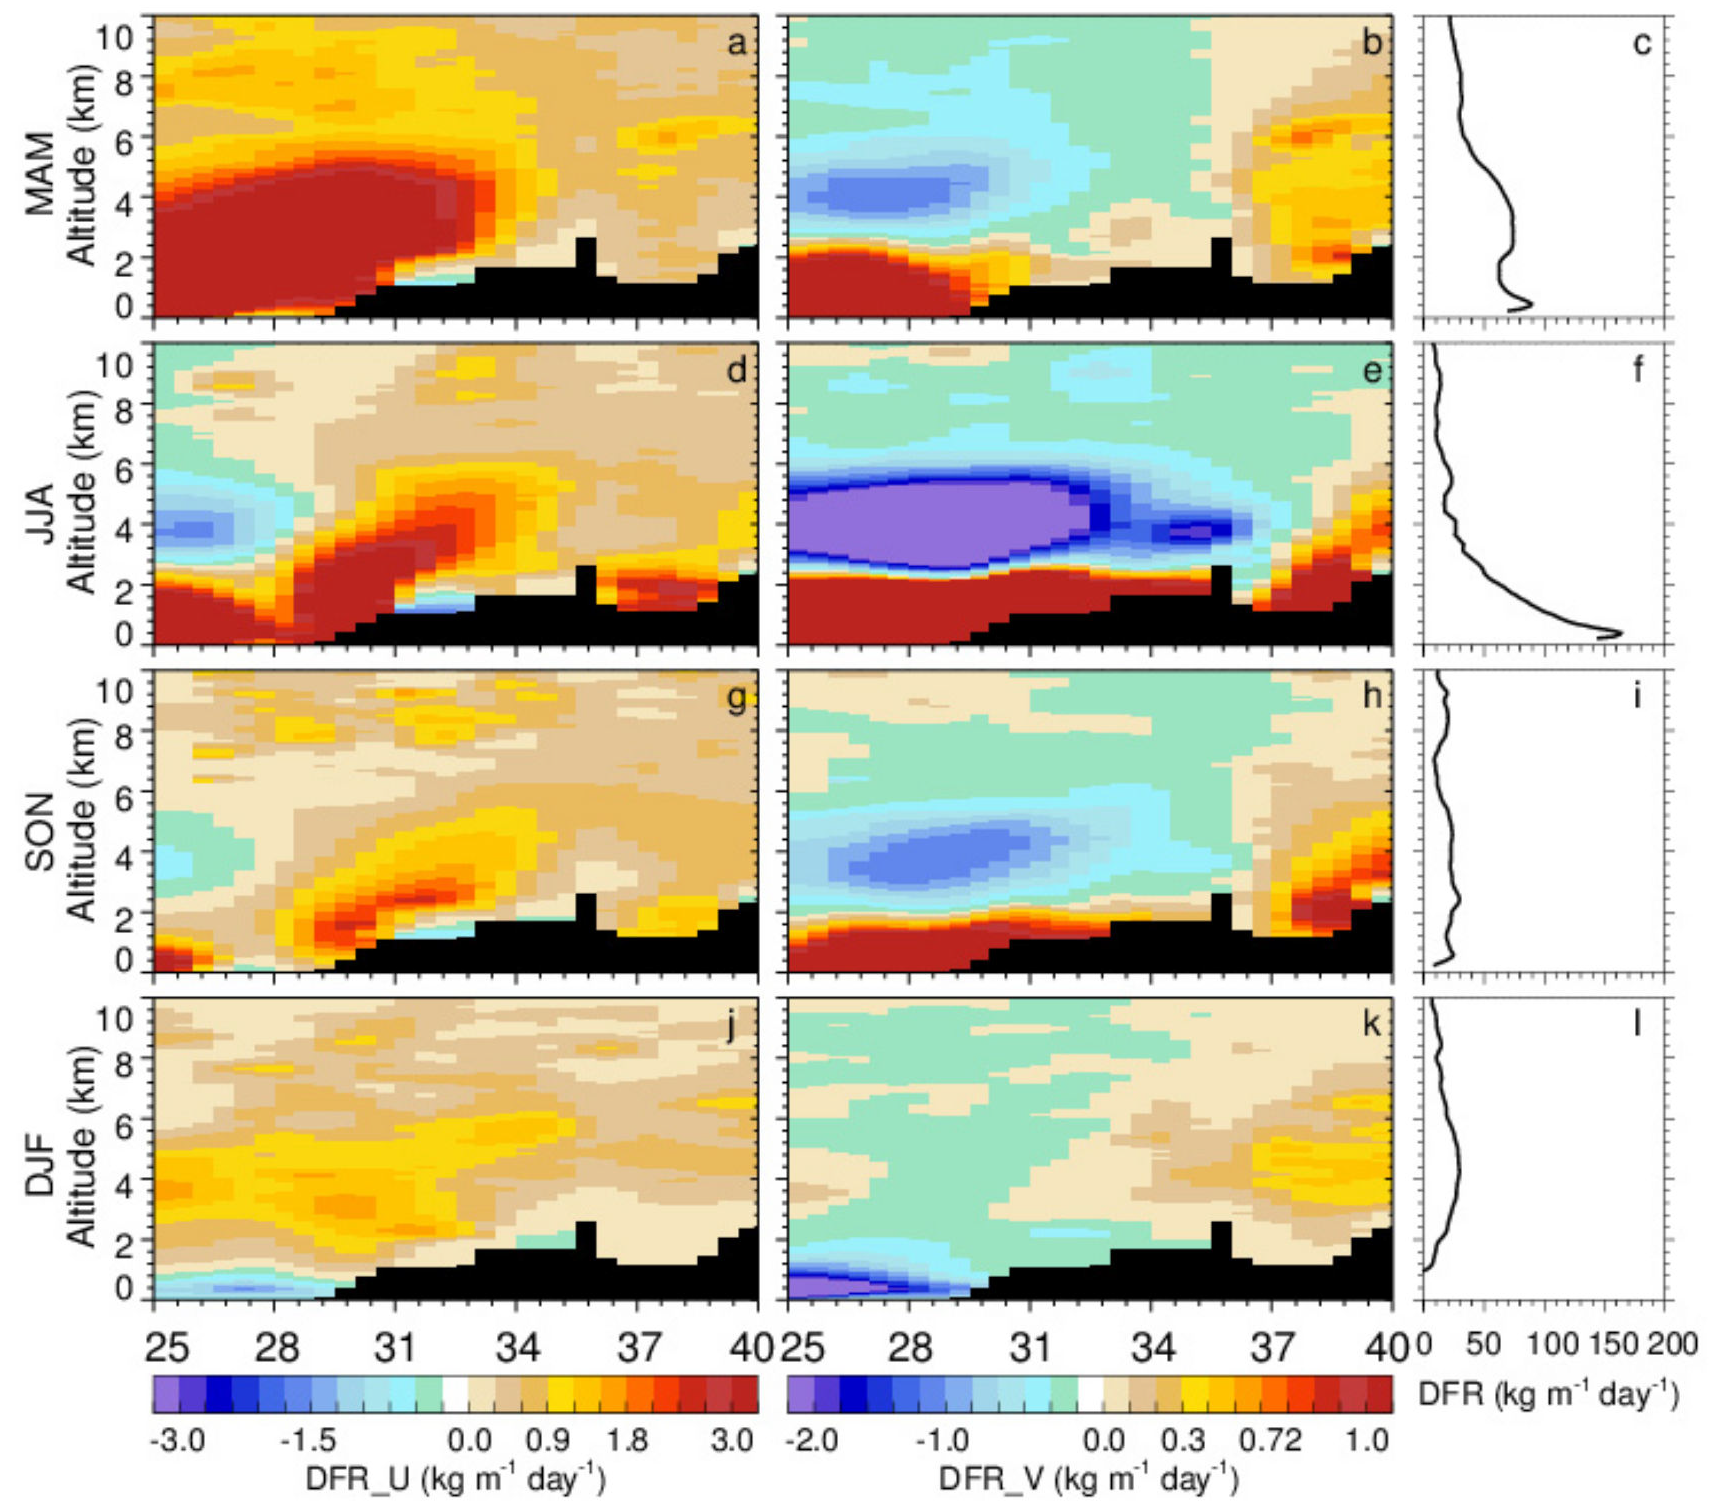
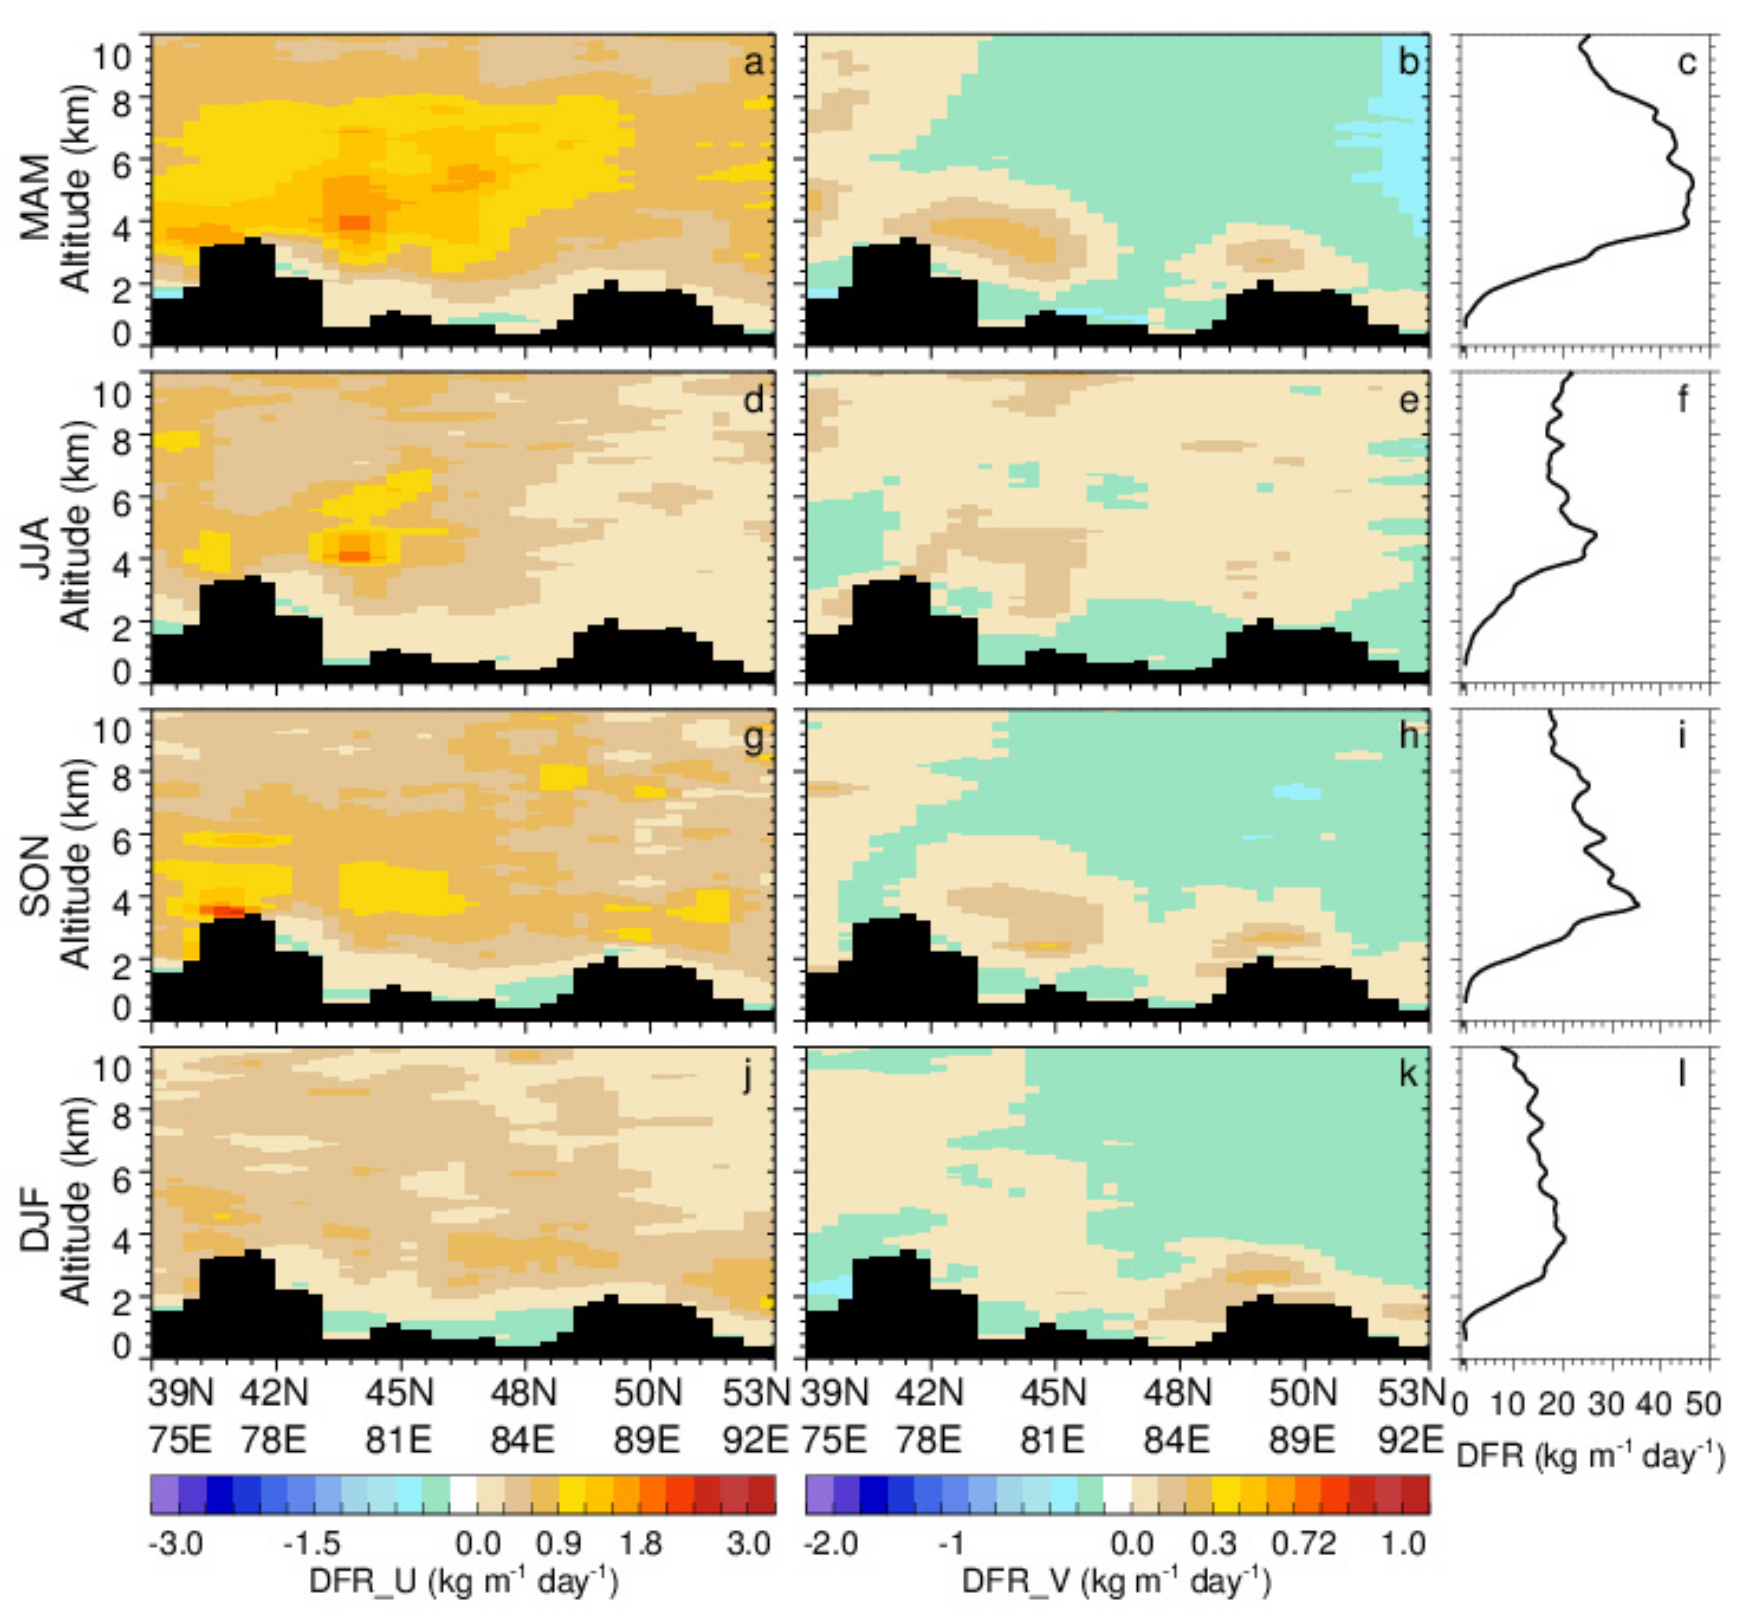
3.2.2. Vertical Distribution

To further understand the transcontinental transport of Central Asian dust, we divide them into two parts by taking the latitude of 40°N as the boundary, which represents dust transport to South Asia and East Asia, respectively. The CALIOP-based longitude-height cross-section of DFR at zonal (DFR_U) and meridional (DFR_V) direction, averaged over the southern (25–40°N) and northern portions (40–55°N), is employed to depict the transport characteristics of dust from Central Asia to South Asia and East Asia, respectively (as shown in Figure 4 and Figure 5). Here, the positive DFRs represent the eastward or northward transport of dust aerosol, while negative DFRs stand for westward or southward transport. The mass center (solid line) and canopy (dashed line) of the dust layer are also plotted to characterize the vertical evolution process, which are calculated as the 50th percentile and 90th percentile of DMC, respectively.
For the transport to South Asia (Figure 4), the seasonal variation of DFRs both at the zonal and meridional directions are clearly visible, while the altitude of the dust mass center and canopy is almost unchanged in all seasons except for winter. Overall, the mass canopy of the dust layer is trapped below 4.0 km in winter and 5.0 km in other seasons. This is directly related to the smallest DOD in this region (see Figure 2g), and related to a lower frequency of dust events in winter [71]. Correspondingly, the altitude of dust mass center is trapped below 1.1 km in winter, while it is below 1.5 km in other seasons. Notably, the altitude of dust mass center and canopy is significantly increased when the dust is transported to the east of 80°E. This stems from the fact that dust can be lifted to the atmosphere over the Tibetan Plateau by the convective updrafts caused by the topography of the plateau. Although the largest dust mass is focused near the surface, this is not always consistent with the transport flux. In addition, the dust transport direction exhibits significant changes between seasons. In spring and autumn, dust is always carried eastward (positive DFR_U) and southward (negative DFR_V) over Central Asia and transported northward (positive DFR_V) at the Indus plain (65–75°E) below 3 km. After that, it is transported southward and northward at the longitude of 85°E once again. This is consistent with the two transport pathways of dust from South Asia to the highlands proposed by Wang et al. [72], and implies the contribution of Central Asian dust as well as South Asian dust to the Tibetan Plateau. Additionally, the dust transport process during summer is similar to that during spring. However, there is negative DFR_U occurring at Iranian plateau (48–62°E), which is consistent with the column-integrated DFR (see Figure 3c). This phenomenon demonstrates that the Central Asian dust can be transported to South Asia, which makes a small contribution to the Persian Gulf and Arabian Peninsula during summer.
For transport to East Asia (Figure 5), the altitude of dust mass center (canopy) decreases with the change of season. The highest mass canopy (center) of dust layer appears in spring with an altitude as high as 6.0 (2.0) km, while the lowest mass canopy occurs in winter, with an altitude below 3.2 (1.0) km. Since the north portion (40–−55°N) of Central Asia is located in the Northern Hemisphere westerly zone, the dust shows an obvious eastward transport trend (positive DFR_U) above 1.0 km throughout the year, apart from a slight westward transport (negative DFR_U) near the surface. However, seasonal variation of DFR_V causes a significant difference in the transport process from Central Asia to East Asia in different seasons. In spring and winter, the dust over Central Asia (45–80°E) is transported eastward and northward in its entirety. When dust aerosols are travel eastward across the Tianshan Mountains and the Ili River valley (75–85°E), the DFR_V changes from positive to negative, i.e., they travel southeast to the northwest China under the combined effect of atmospheric circulation and terrain. While the situation is the opposite in summer; a little dust can be transported across the Tianshan Mountains to downstream East Asia via the westerly jet, as there are smaller positive DFR_V appearing above 3 km at the longitude of 75–95°E. In addition, the widespread larger negative DFR_V, especially near the surface in summer, indicating that most dust from KkD and KlD prefers to move southward.

3.3. Downstream Contribution of Central Asian Dust

To quantify the downstream contribution of Central Asian dust, the dust transport flux along two the cross-sections C1 and C2 (as shown in Figure 1) are integrated to represent the transport contribution to South Asia and East Asia, respectively. Although the Central Asia is also a long-range transport region, we ignore the upstream transport from Central Asia, as it is difficult to distinguish. Hence, the downstream contributions of Central Asian dust are overestimated to some extent. As shown in Table 1, the CALIOP-based transport contribution of Central Asian dust to South Asia is much greater than that to East Asia. The annual dust transport flux to South Asia is 164.01 Tg, which is about 2.1 times that to East Asia (78.36 Tg). The highest transport flux to South Asia appears in summer (69.03 Tg), while that to East Asia appears in spring (30.84 Tg), and the lowest appears in winter. However, it is worth noting that, compared to the CALIOP-based estimation, dust transport contribution to South Asia and East Asia based on MERRA-2 are much smaller, which is only about 0.36 and 0.84 times than that of CALIOP, respectively. This is mainly attributed to the overestimation of dry and wet depositions during dust transport process in the model simulation [73], especially the large wet deposition associated with model simulations of rainfall rate in the low latitude [45,74]. It even leads to the conclusion, contrary to the CALIOP-based estimation, that the annual transport contribution of Central Asian dust to South Asia (~58.52 Tg) is smaller than that to East Asia (~66.17 Tg). This phenomenon also indicates that long-range dust transport described by model simulation needs to be carefully considered in quantifying and evaluating dust cycle.
To better understand the vertical distribution of downstream contribution of Central Asian dust, the profiles of CALIOP DFR_U and DFR_V along the two cross-sections are shown in Figure 6 and Figure 7. For C1 (shown in Figure 6), the overall positive DFR_U reveals a significant eastward transport through the Indus Valley and Sulaiman Range (25–35°N) before reaching the Indo-Gangetic Plain in all seasons. At the same time, the large DFR_V here is positive near the surface and negative above 2 km except for in winter. This suggests that dust from Central Asia at lower levels can manifest itself mainly as northward transport affects the Ganges plain and causes dust accumulation on the southern slope of the plateau, while at higher levels it can spread southward across the Indian peninsula. However, the positive DFR_U and DFR_V at the latitude of 35–40°N, which is the west slope of the Hindu Kush, encourages the dust to climb along the Hindu Kush and spread northward to the whole TP. Generally, the integrated composited DFR (shown in the right column of Figure 6) along C1 decreases with increasing altitude, especially during summer. The maximum DFR reaches 80 kg m−1 day−1 in spring (Figure 6c) and 162 kg m−1 day−1 in summer (Figure 6f) at the surface, and 35 kg m−1 day−1 in autumn at 4.0 km (Figure 6i).
Compared to the DFR of C1, it is obvious that the vertical distribution of downstream transport of C2 in both zonal and meridional directions is quite different, with a much smaller value, as shown in Figure 7. Overall, the dust eastwards across the Tianshan Mountains and the Ili River valley is transported northward to northwest China near the surface with a positive DFR_V of less than 0.5 kg m−1 day−1, and southward weakly at high altitude with a negative DFR_V of no more than 0.3 kg m−1 day−1 except in summer. While a small positive DFR level (<0.3 kg m−1 day−1) occurs throughout the range from the surface to 10 km in summer, demonstrating the tendency of Central Asian dust to move to the Mongolia instead of northwest China. With increasing altitude, the integrated composited DFR (Figure 7, right column) initially increases, and then decreases, with its peak values being 48 kg m−1 day−1 at 4–6 km in spring, 28 kg m−1 day−1 at 5 km in summer, 36 kg m−1 day−1 at 3.6 km in autumn, and 20 kg m−1 day−1 at 4 km in winter, respectively.

4. Discussion

4.1. Uncertainties of Central Asian Dust Transport

In this study, we constructed the dust transport flux data to quantify the evolution of Central Asian dust transport with a similar method to that of Han et al. [48]. However, there are still certain uncertainties in the calculation process that need to be considered.
The first important source of uncertainties is the dust extinction coefficient, which can be attributed to the capacity of CALIPSO aerosol detection, the preset threshold value of PDR for dust and non-dust in the separating process and the dust LiDAR ratio. Actually, the various sources of uncertainties related to the dust extinction coefficient has been summarized and discussed in detail by Han et al. [49]. The dust extinction coefficient has an overall known uncertainty of ±(45–76%), which is related to the capacity of CALIPSO aerosol detection (~10–20%) [75,76], the preset threshold value of PDR for dust and non-dust in the separating process (~15–34%), and the dust LiDAR ratio (~20%) [77]. More details can be found in Han et al. [48].
Another source of uncertainty is related to the assumption of dust MEE. Considering that the 2-D DustCOMM seasonal MEE ignores vertical variation, we use the dust MEE with one standard deviation to access the sensitive of dust transport flux caused by MEE. The results (see Table 2) show that the uncertainties for annual contribution of Central Asian dust to South Asia and East Asia caused by MEE with one deviation are about 42.14 (25.7%) and 17.75 (22.7%), respectively. In addition, the seasonal variation of relative uncertainties caused by MEE is negligible.

4.2. Potential Applications of Dust Transport Flux

The CALIOP-based dust transport flux datasets generated in this study can quantify the impacts of Central Asian dust on ecological security, human health, and land–ocean–atmosphere water cycle. In general, Central Asia is an important source of saline dust, globally [4,10]. Compared to pure dust, saline dust is more dangerous to human health and ecology, because it carries a large amount of heavy metals [10,61]. Previous studies have indicated that Central Asian dust contains a high percentage (about 8–10%) of various salts (chlorides, sulfates, carbonate) [78,79] and a high concentration (126 mg kg−1) of phosalone [80]. Based on this, the satellite-based dust transport flux datasets in our study can be used to capture the quality of Central Asian dust along with the minerals and heavy metals transported downstream, and thus assess their impacts on the ecological environment and human health. Additionally, the Pan-Third Pole region has the second largest snow cover and ice sheet all over the world [81], which is located downstream to Central Asia. It is widely known that saline dust can accelerate snowmelt, as it can interfere with the ice structure and absorb more heat. Therefore, the inflow of Central Asian saline dust to the Pan-Third Pole is a serious threat to ice and glaciers in the region, which can affect the global water cycle. The CALIOP-based transport flux data can provide direct and accurate estimates of the influx of Central Asian dust to the Pan-Third Pole region. This can fill the information gap of Central Asian dust transport to the Pan-Third Pole region over interdecadal time spans, and provide a solid foundation to access the corresponding response on the climate system, especially under global warming.
The satellite-based dust transport flux can be used to evaluate and constrain the model simulations. Under the same wind field, we compared the CALIOP-based dust transport flux with that of MERRA-2. Despite their consistent distribution pattern, large numerical variations exist between the CALIOP observation and the MERRA-2 simulation. For example, the downstream contribution of Central Asian dust to South Asia based on CALIOP is 2.8 times that of MERRA-2, while it is 1.2 times the contribution to East Asia. Differences between satellites and models could be due to uncertainties in model representations associated with the parameterizations of dry and wet dust depositions, model simulations of rainfall rate and vertical distributions of dust [46,73]. While it is difficult to directly estimate the dust emission and deposition based on the satellite (constrained by the detection method and sampling frequency), the satellite-based 3-D dust transport flux can serve as a powerful tool to enhance the simulations of dust dynamics.

5. Conclusions

Quantifying the transport characteristics of Central Asian dust is important for comprehending its impacts on regional/global weather and climate, global ecological cycle and water cycle. Based on CALIPSO observation covering a period of 2007–2018, we constructed the 3-D Central Asian dust transport flux and used it to reveal the seasonal characteristics. We also investigated the downstream contribution to South and East Asia. Meanwhile, the results were evaluated and compared with those of MERRA-2 reanalysis. The key findings of this study are summarized below:
-
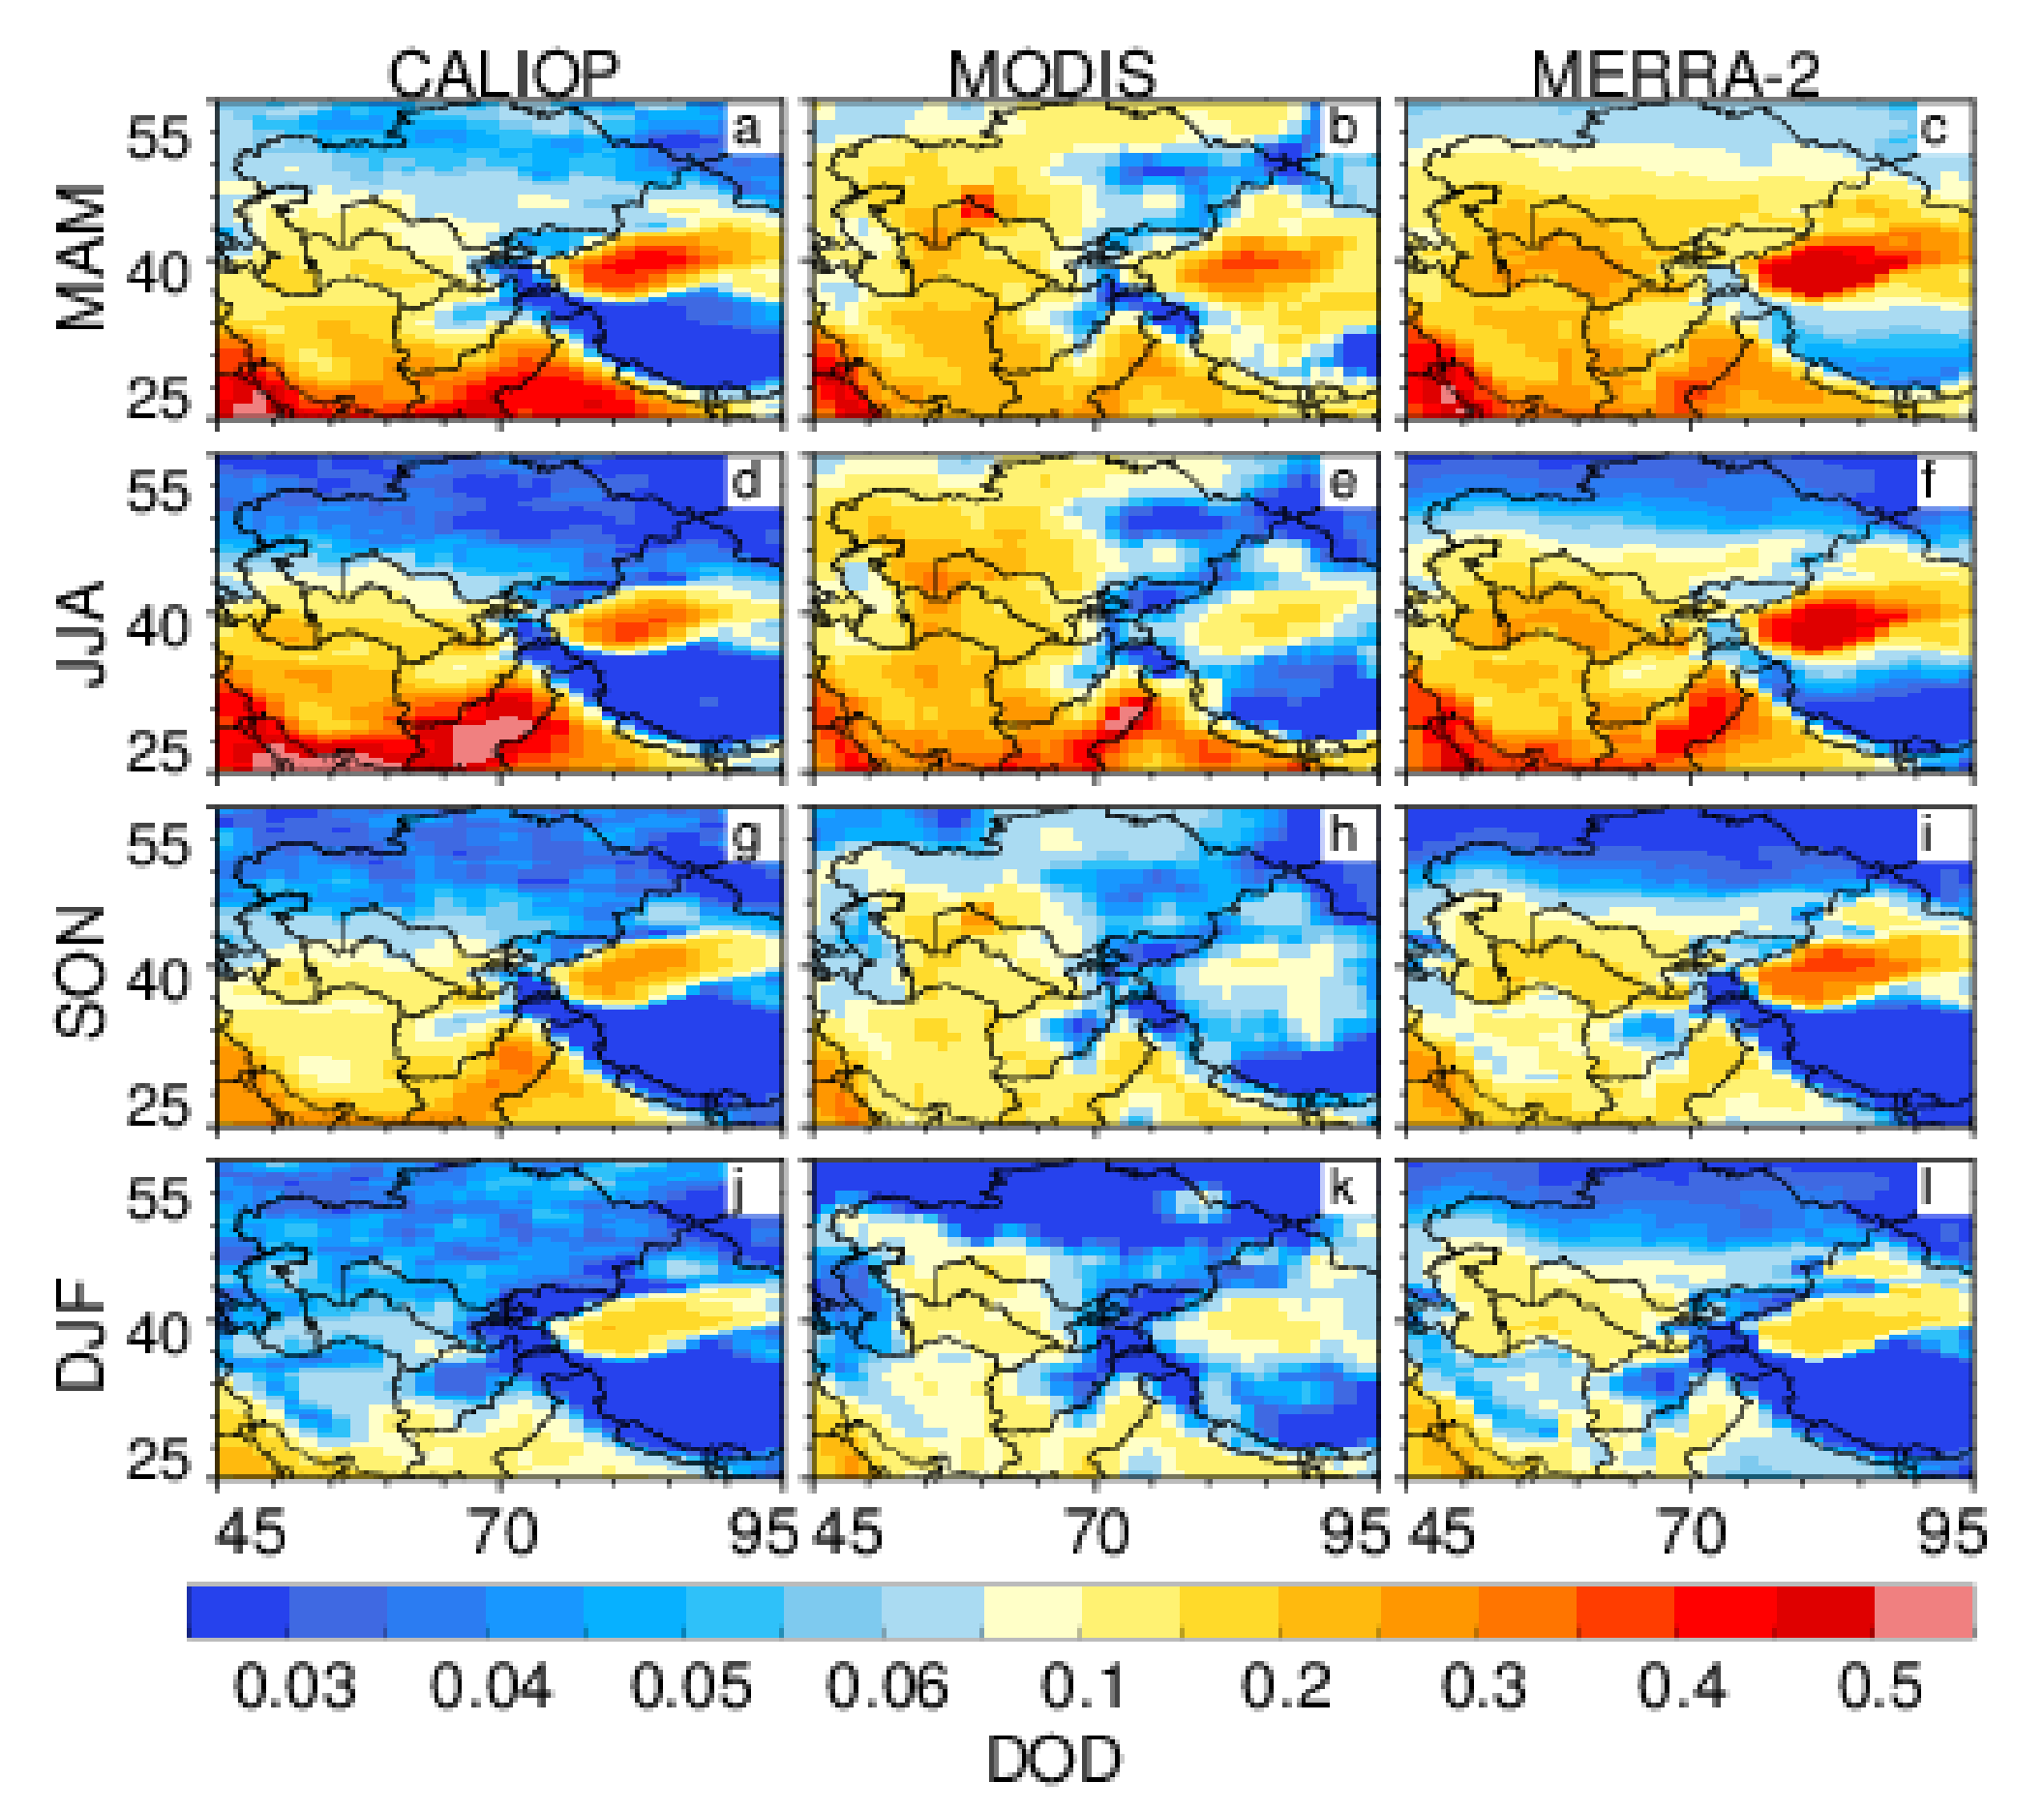
The distribution of Central Asian dust DOD exhibits obvious spatial and temporal variability. The DOD of southern Central Asia is larger than that of the northern region throughout the year. Additionally, peak DOD appears in spring and summer, while a trough occurs in winter.
-
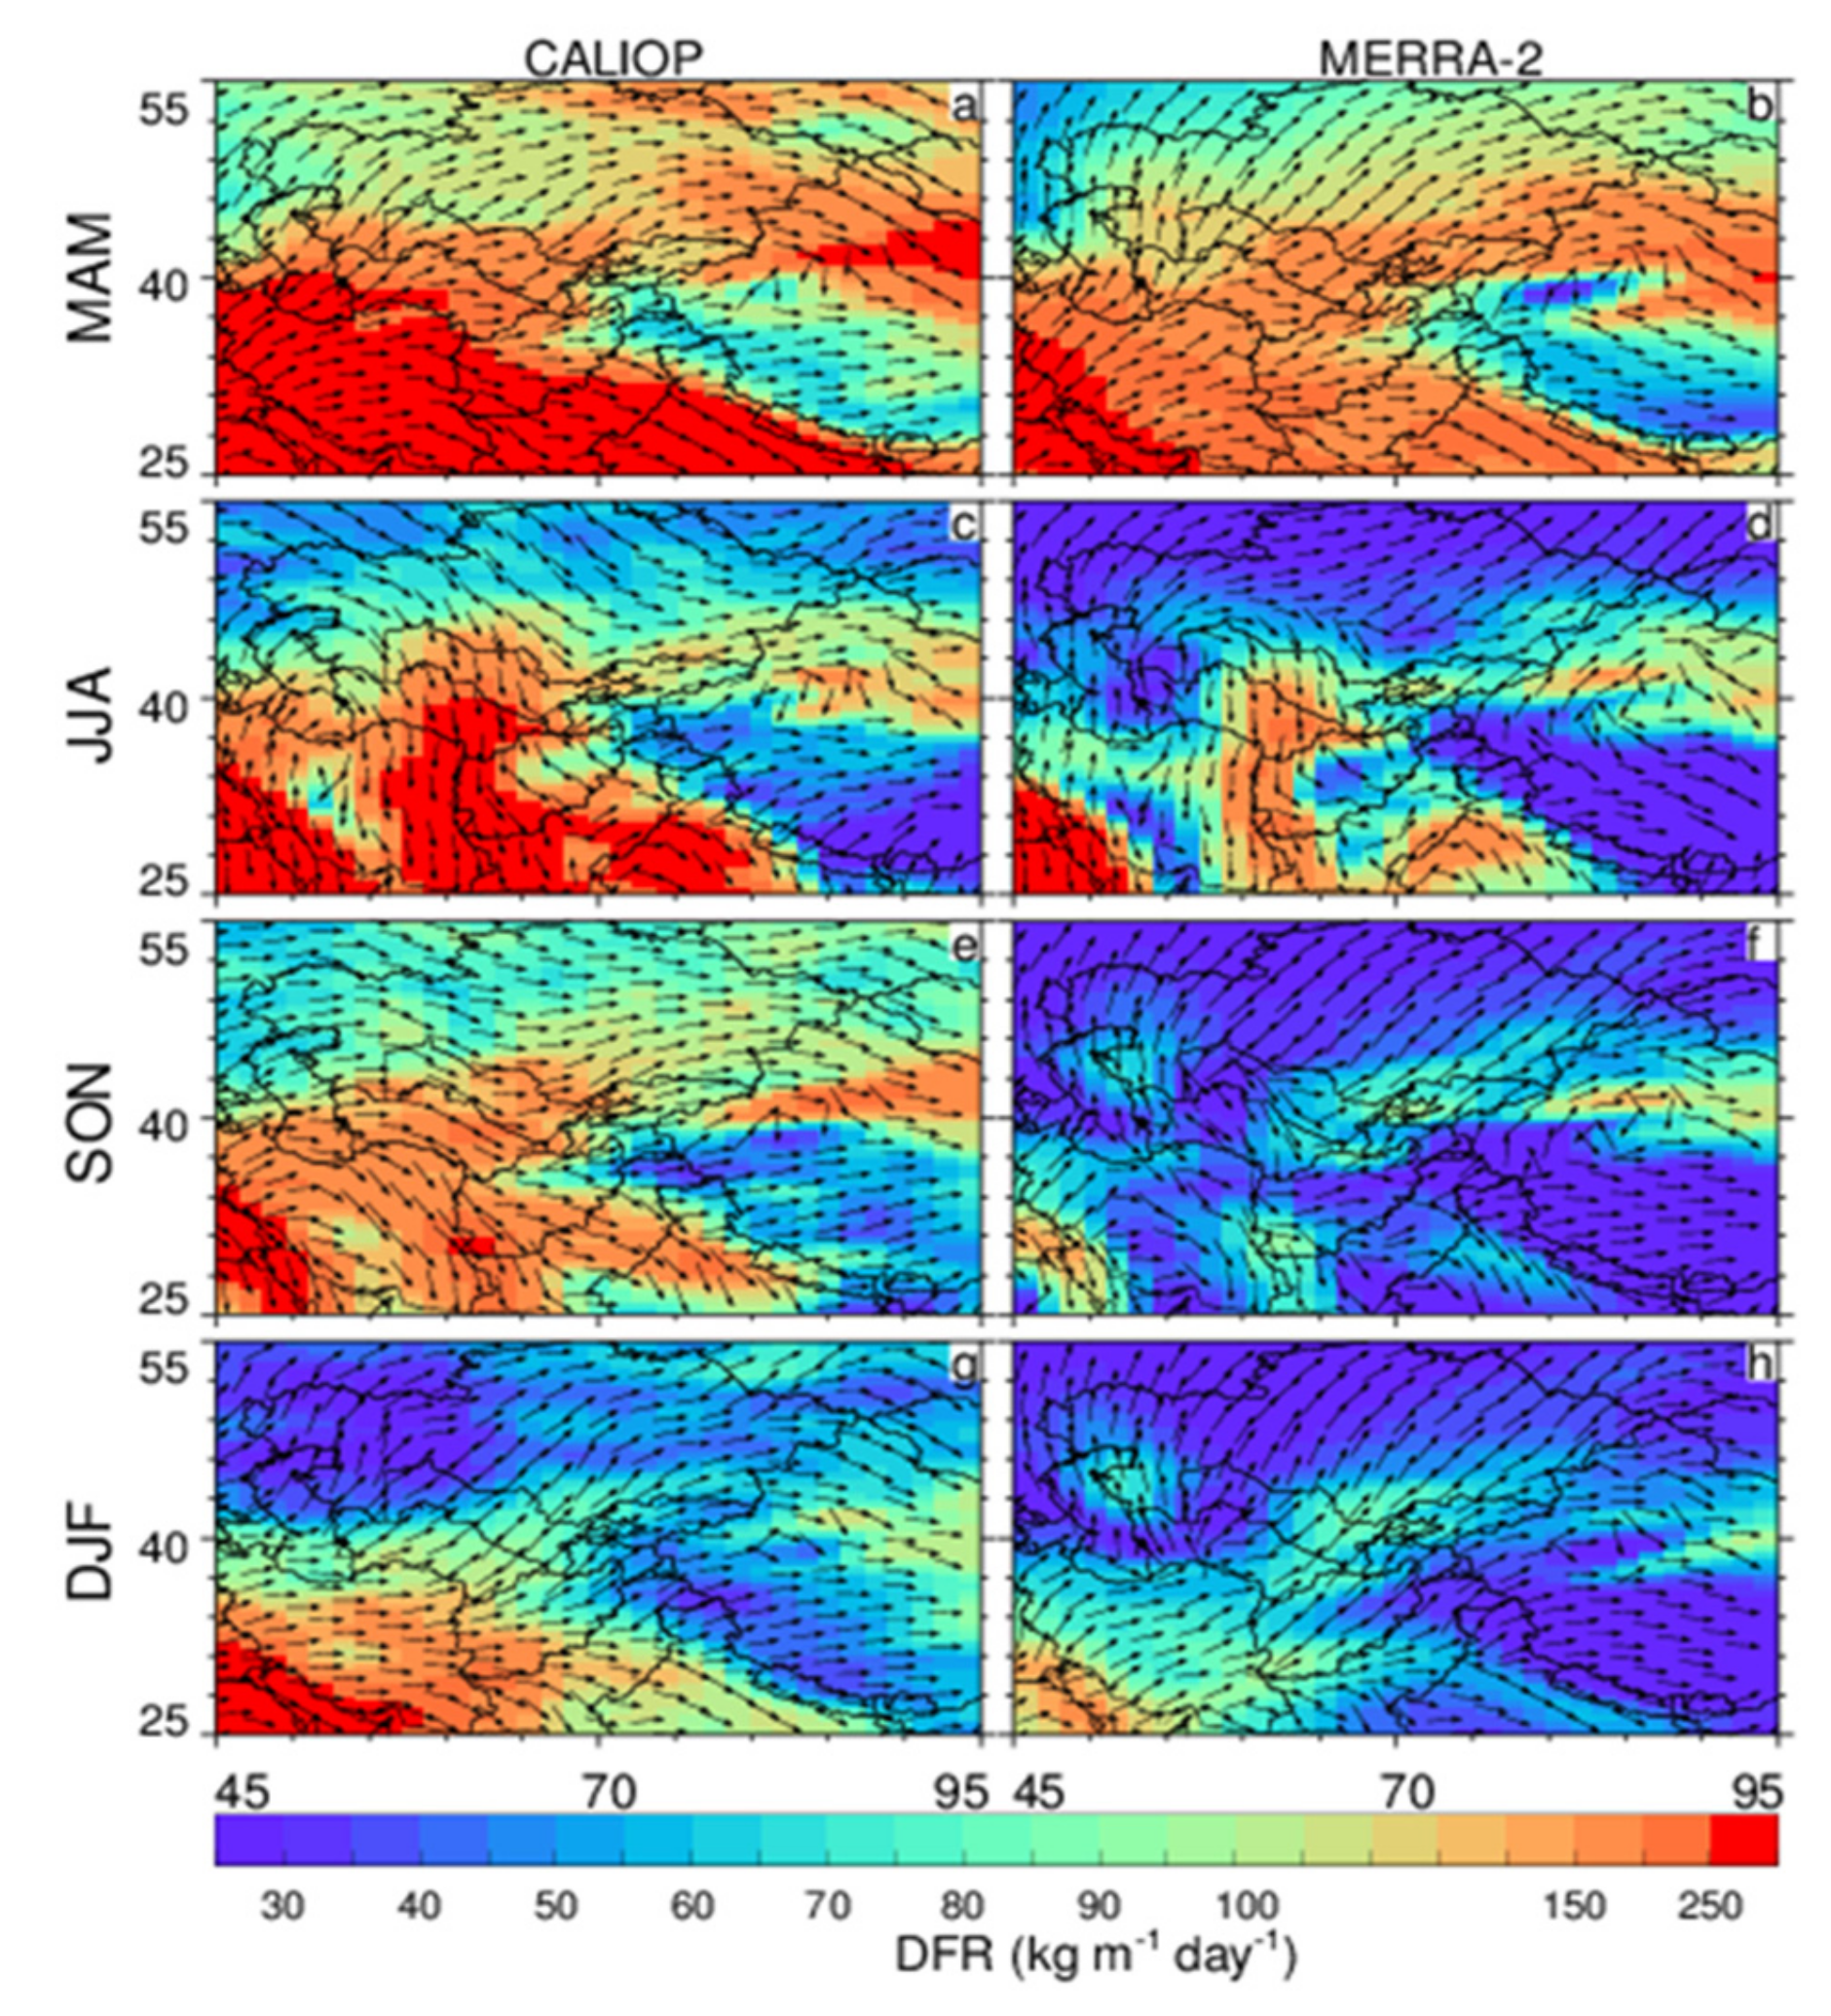
Central Asian dust can be transported to East and South Asia, with a significant seasonal fluctuation. The dust transport activity is the strongest in spring and the weakest in winter. The Central Asian dust mainly shifts southward in summer due to the South Asian summer monsoon, while it has an obvious tendency of moving eastward in other seasons under the control of the westerly jet.
-
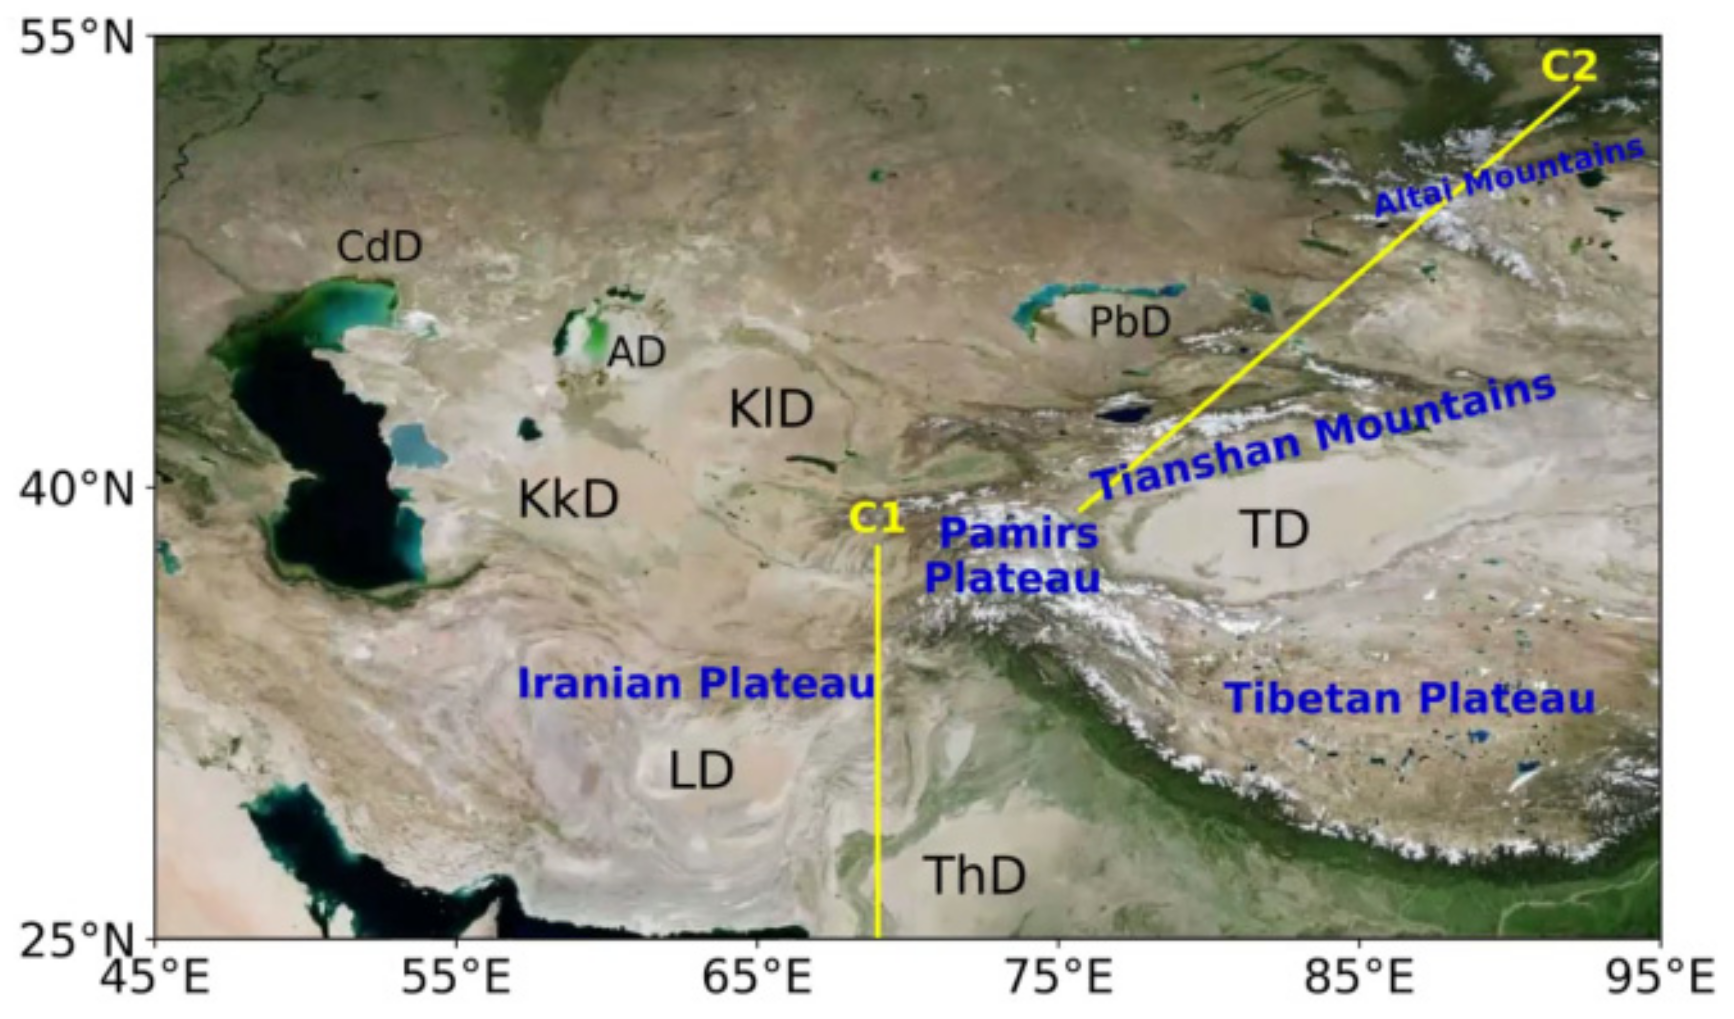
The transport of Central Asian dust across the Pamir Plateau to the Tibetan Plateau is also non-negligible, especially in spring, with a DFR of 150 kg m−1 day−1, and in summer, with a DFR of 90 kg m−1 day−1.
-
Despite the consistent distribution pattern between the CALIOP observation and MERRA-2 reanalysis for both DOD and DFR, their magnitudes are different. Compared to CALIOP DOD, MERRA-2 DOD is larger over the Central Asian dust source regions and their surrounding areas, especially in Kazakhstan, while it is smaller in remote regions (i.e., Pakistan and the Indian peninsula). However, the MERRA-2 can underestimate the DFR in all regions throughout the year. This could be due to the set scheme of dependence on dust size, dust emission, and deposition in the MERRA-2 models.
-
Based on CALIOP observations, the annual downstream contribution of Central Asian to South Asia is the largest, with a value of 164.01 Tg (accounting about 68% of the total contribution from Central Asia), while the contribution to East Asia is only 78.36 Tg. However, these contributions estimated from MERRA-2 are 58.52 Tg and 78.36 Tg, which are only 0.36 and 0.84 times that of CALIOP, respectively.
Despite the limitations and uncertainties associated with the dust extinction coefficient detection of CALIPSO, dust MEE and wind field, the dust transport flux datasets from CALIPSO observations in our study revealed some important features of seasonal variability of dust transport in Central Asia over interdecadal time spans. In the future, we will perform a comparison between the multi-source satellite observations and ensemble of regional/global model simulations. Such an effort would greatly benefit from thorough and systematic evaluation of many variables, including DOD, dust extinction coefficient profile, and transport flux, even the dust particle size and MEE. Insights gained from such strategic efforts would provide help for improving model simulations of the Central Asian dust cycle and its roles in the climate system.

Author Contributions

Conceptualization, Y.H. and T.W.; methodology, Y.H., S.H. and T.W.; software, Y.H. and J.T.; validation, Y.H., T.W. and R.T.; formal analysis, Y.H.; investigation, R.T., S.H., Y.D. and C.W.; resources, Y.H. and T.W.; data curation, C.W., J.B. and Z.H.; writing—original draft preparation, Y.H.; writing—review and editing, T.W. and Y.H.; visualization, Y.H. and J.T.; supervision, T.W., Z.H. and J.B.; project administration, T.W.; funding acquisition, T.W. All authors have read and agreed to the published version of the manuscript.

Funding

This research was funded by the Second Tibetan Plateau Scientific Expedition and Research Program (STEP, 2019QZKK0602), the Strategic Priority Research Program of Chinese Academy of Sciences (XDA2006010301), the National Natural Science Foundation of China (42075174), and the Project of Field Scientific Observation and Research Station of Gansu Province (18JR2RA013).

Institutional Review Board Statement

Not applicable.

Informed Consent Statement

Not applicable.

Data Availability Statement

CALIPSO data are processed from the NASA Langley Research Center Atmospheric Science Data Center (http://eosweb.larc.nasa.gov/, accessed on 12 August 2021). MERRA-2 data are acquired from the NASA Giovanni online data system (https://giovanni.gsfc.nasa.gov/giovanni/, accessed on 12 August 2021), developed and maintained by the NASA GES DISC. The DustCOMM is derived from Dust Constraints from joint Observational-Modelling-experiMental analysis (http://dustcomm.atmos.ucla.edu/, accessed on 12 August 2021), developed by the Earth, Wind & Particles research group at UCLA.

Acknowledgments

We appreciate the NASA group for making satellite datasets accessible in public. The authors would like to express their gratitude to EditSprings (https://www.editsprings.cn/, accessed on 1 February 2022) for the expert linguistic services provided. We would also like to thank all anonymous reviews for their constructive and insightful comments.

Conflicts of Interest

The authors declare no conflict of interest.

References

  1. Xi, X.; Sokolik, I.N. Dust interannual variability and trend in Central Asia from 2000 to 2014 and their climatic linkages. J. Geophys. Res. Atmos. 2015, 120, 12175–12197. [Google Scholar] [CrossRef] [Green Version]
  2. Shi, L.; Zhang, J.; Yao, F.; Zhang, D.; Guo, H. Temporal variation of dust emissions in dust sources over Central Asia in recent decades and the climate linkages. Atmos. Environ. 2019, 222, 117176. [Google Scholar] [CrossRef]
  3. Wang, D.; Zhang, F.; Yang, S.; Xia, N.; Ariken, M. Exploring the spatial-temporal characteristics of the aerosol optical depth (AOD) in Central Asia based on the moderate resolution imaging spectroradiometer (MODIS). Environ. Monit. Assess. 2020, 192, 383. [Google Scholar] [CrossRef] [PubMed]
  4. Wurtsbaugh, W.A.; Miller, C.; Null, S.E.; Derose, R.J.; Wilcock, P.; Hahnenberger, M.; Howe, F.; Moore, J. Decline of the world’s saline lakes. Nat. Geosci. 2017, 10, 816–821. [Google Scholar] [CrossRef]
  5. Wu, G.; Yao, T.; Xu, B.; Tian, L.; Li, Z.; Duan, K. Seasonal variations of dust record in the Muztagata ice cores. Sci. Bull. 2008, 53, 2506–2512. [Google Scholar] [CrossRef] [Green Version]
  6. Dong, Z.; Li, Z.; Edwards, R.; Wu, L.; Zhou, P. Temporal characteristics of mineral dust particles in precipitation of Urumqi River Valley in Tian Shan, China: A comparison of alpine site and rural site. Atmos. Res. 2011, 101, 294–306. [Google Scholar] [CrossRef]
  7. Wu, G.; Zhang, X.; Zhang, C.; Gao, S.; Li, Z.; Wang, F.; Wang, W. Concentration and composition of dust particles in surface snow at Urumqi Glacier No. 1, Eastern Tien Shan. Glob. Planet. Chang. 2010, 74, 34–42. [Google Scholar] [CrossRef]
  8. Nobakht, M.; Shahgedanova, M.; White, K. New Inventory of Dust Emission Sources in Central Asia and Northwestern China Derived from MODIS Imagery Using Dust Enhancement Technique. J. Geophys. Res. Atmos. 2021, 126, e2020JD033382. [Google Scholar] [CrossRef]
  9. Mo, J.; Gong, S.; Zhang, L.; He, J.; Lu, S.; Zhou, Y.; Ke, H.; Zhang, H. Impacts of long-range transports from Central and South Asia on winter surface PM2.5 concentrations in China. Sci. Total Environ. 2021, 777, 146243. [Google Scholar] [CrossRef]
  10. Abuduwaili, J.; Liu, D.; Wu, G. Saline dust storms and their ecological impacts in arid regions. J. Arid Land 2010, 2, 144–150. [Google Scholar] [CrossRef] [Green Version]
  11. Sternberg, T.; Edwards, M. Desert Dust and Health: A Central Asian Review and Steppe Case Study. Int. J. Environ. Res. Public Health 2017, 14, 1342. [Google Scholar] [CrossRef] [Green Version]
  12. Shen, H.; Abuduwaili, J.; Samat, A.; Ma, L. A review on the research of modern aeolian dust in Central Asia. Arab. J. Geosci. 2016, 9, 625. [Google Scholar] [CrossRef]
  13. Kaufman, Y.J.; Tanré, D.; Boucher, O. A Satellite View of Aerosols in the Climate System. Nature 2002, 419, 215–223. [Google Scholar] [CrossRef]
  14. Kudo, R.; Nishizawa, T.; Aoyagi, T. Vertical profiles of aerosol optical properties and the solar heating rate estimated by combining sky radiometer and lidar measurements. Atmos. Meas. Tech. 2016, 9, 3223–3243. [Google Scholar] [CrossRef] [Green Version]
  15. Huang, J.; Wang, T.; Wang, W.; Li, Z.; Yan, H. Climate effects of dust aerosols over East Asian arid and semiarid regions. J. Geophys. Res. Atmos. 2014, 119, 11398–11416. [Google Scholar] [CrossRef]
  16. Vinoj, V.; Rasch, P.J.; Wang, H.; Yoon, J.-H.; Ma, P.-L.; Landu, K.; Singh, B. Short-term modulation of Indian summer monsoon rainfall by West Asian dust. Nat. Geosci. 2014, 7, 308–313. [Google Scholar] [CrossRef]
  17. Tao, M.; Chen, L.; Wang, J.; Wang, L.; Wang, W.; Lin, C.; Gui, L.; Wang, L.; Yu, C.; Wang, Y. Characterization of dust activation and their prevailing transport over East Asia based on multi-satellite observations. Atmos. Res. 2021, 265, 105886. [Google Scholar] [CrossRef]
  18. Yasunari, T.J.; Koster, R.D.; Lau, W.K.M.; Kim, K. Impact of snow darkening via dust, black carbon, and organic carbon on boreal spring climate in the Earth system. J. Geophys. Res. Atmos. 2015, 120, 5485–5503. [Google Scholar] [CrossRef]
  19. Shi, Z.; Xie, X.; Li, X.; Yang, L.; Xie, X.; Lei, J.; Sha, Y.; Liu, X. Snow-darkening versus direct radiative effects of mineral dust aerosol on the Indian summer monsoon onset: Role of temperature change over dust sources. Atmos. Chem. Phys. 2019, 19, 1605–1622. [Google Scholar] [CrossRef] [Green Version]
  20. Wang, T.; Han, Y.; Huang, J.; Sun, M.; Jian, B.; Huang, Z.; Yan, H. Climatology of Dust-Forced Radiative Heating Over the Tibetan Plateau and Its Surroundings. J. Geophys. Res. Atmos. 2020, 125, e2020JD032942. [Google Scholar] [CrossRef]
  21. Zhang, Y.; Gao, T.; Kang, S.; Sprenger, M.; Tao, S.; Du, W.; Yang, J.; Wang, F.; Meng, W. Effects of black carbon and mineral dust on glacial melting on the Muz Taw glacier, Central Asia. Sci. Total Environ. 2020, 740, 140056. [Google Scholar] [CrossRef]
  22. Yue, X.; Wang, H.; Wang, Z.; Fan, K. Simulation of dust aerosol radiative feedback using the Global Transport Model of Dust: 1. Dust cycle and validation. J. Geophys. Res. Atmos. 2009, 114, D10202. [Google Scholar] [CrossRef]
  23. Issanova, G.; Abuduwaili, J.; Galayeva, O.; Semenov, O.; Bazarbayeva, T. Aeolian transportation of sand and dust in the Aral Sea region. Int. J. Environ. Sci. Technol. 2015, 12, 3213–3224. [Google Scholar] [CrossRef] [Green Version]
  24. Opp, C.; Groll, M.; Aslanov, I.; Lotz, T.; Vereshagina, N. Aeolian dust deposition in the southern Aral Sea region (Uzbekistan): Ground-based monitoring results from the LUCA project. Quat. Int. 2017, 429, 86–99. [Google Scholar] [CrossRef]
  25. Tang, M.; Zhang, H.; Gu, W.; Gao, J.; Jian, X.; Shi, G.; Zhu, B.; Xie, L.; Guo, L.; Gao, X.; et al. Hygroscopic Properties of Saline Mineral Dust From Different Regions in China: Geographical Variations, Compositional Dependence, and Atmospheric Implications. J. Geophys. Res. Atmos. 2019, 124, 10844–10857. [Google Scholar] [CrossRef]
  26. Zhang, X.-X.; Claiborn, C.; Lei, J.-Q.; Vaughan, J.; Wu, S.-X.; Li, S.-Y.; Liu, L.-Y.; Wang, Z.-F.; Wang, Y.-D.; Huang, S.-Y.; et al. Aeolian dust in Central Asia: Spatial distribution and temporal variability. Atmos. Environ. 2020, 238, 117734. [Google Scholar] [CrossRef]
  27. Machalett, B.; Oches, E.A.; Frechen, M.; Zöller, L.; Hambach, U.; Mavlyanova, N.G.; Marković, S.B.; Endlicher, W. Aeolian dust dynamics in central Asia during the Pleistocene: Driven by the long-term migration, seasonality, and permanency of the Asiatic polar front. Geochem. Geophys. Geosyst. 2008, 9, Q08Q09. [Google Scholar] [CrossRef]
  28. Chin, M.; Chu, A.; Levy, R.; Remer, L.; Kaufman, Y.; Holben, B.; Eck, T.; Ginoux, P.; Gao, Q.X. Aerosol distribution in the Northern Hemisphere during ACE-Asia: Results from global model, satellite observations, and Sun photometer meas-urements. J. Geophys. Res. Atmos. 2004, 109, 1–15. [Google Scholar] [CrossRef]
  29. Zhang, W.H.; Gu, X.F.; Xu, H.; Yu, T.; Zheng, F.J. Assessment of OMI near-UV aerosol optical depth over Central and East Asia. J. Geophys. Res. Atmos. 2016, 121, 382–398. [Google Scholar] [CrossRef] [Green Version]
  30. Rupakheti, D.; Rupakheti, M.; Yin, X.F.; Hofer, J.; Rai, M.; Hu, Y.L.; Abdullaev, S.F.; Kang, S.C. Modifications in aerosol physical, optical and radiative properties during heavy aerosol events over Dushanbe, Central Asia. Geosci. Front. 2021, 12, 101251. [Google Scholar] [CrossRef]
  31. Hofer, J.; Althausen, D.; Abdullaev, S.F.; Makhmudov, A.N.; Nazarov, B.I.; Schettler, G.; Engelmann, R.; Baars, H.; Fomba, K.W.; Mueller, K.; et al. Long-term profiling of mineral dust and pollution aerosol with multiwavelength polarization Raman lidar at the Central Asian site of Dushanbe, Tajikistan: Case studies. Atmos. Chem. Phys. 2017, 17, 14559–14577. [Google Scholar] [CrossRef] [Green Version]
  32. Wang, L.; Zhang, X.; Ming, J. Aerosol Optical Properties Measured Using a PAX in Central Asia from 2016 to 2019 and the Climatic and Environmental Outlooks. ACS Earth Space Chem. 2021, 5, 95–105. [Google Scholar] [CrossRef]
  33. Rashki, A.; Kaskaoutis, D.G.; Sepehr, A. Statistical evaluation of the dust events at selected stations in Southwest Asia: From the Caspian Sea to the Arabian Sea. Catena 2018, 165, 590–603. [Google Scholar] [CrossRef]
  34. Issanova, G.; Abuduwaili, J.; Kaldybayev, A.; Semenov, O.; Dedova, T. Dust Storms in Kazakhstan: Frequency and Division. J. Geol. Soc. India 2015, 85, 348–358. [Google Scholar] [CrossRef]
  35. Indoitu, R.; Orlovsky, L. Dust storms in Central Asia: Spatial and temporal variations. J. Arid Environ. 2012, 85, 62–70. [Google Scholar] [CrossRef]
  36. Omar, A.H.; Winker, D.M.; Vaughan, M.A.; Hu, Y.; Trepte, C.R.; Ferrare, R.A.; Lee, K.-P.; Hostetler, C.A.; Kittaka, C.; Rogers, R.R.; et al. The CALIPSO Automated Aerosol Classification and Lidar Ratio Selection Algorithm. J. Atmos. Ocean. Technol. 2009, 26, 1994–2014. [Google Scholar] [CrossRef]
  37. Liu, Z.; Kar, J.; Zeng, S.; Tackett, J.; Vaughan, M.; Avery, M.; Pelon, J.; Getzewich, B.; Lee, K.-P.; Magill, B.; et al. Discriminating between clouds and aerosols in the CALIOP version 4.1 data products. Atmos. Meas. Tech. 2019, 12, 703–734. [Google Scholar] [CrossRef] [Green Version]
  38. Tanaka, T.Y.; Chiba, M. A numerical study of the contributions of dust source regions to the global dust budget. Glob. Planet. Chang. 2006, 52, 88–104. [Google Scholar] [CrossRef]
  39. Davitashvili, T.; Samkharadze, I. Study of Aeolian transfer of mineral dust from deserts to the territory of Georgia. Arab. J. Geosci. 2021, 14, 67. [Google Scholar] [CrossRef]
  40. Shao, Y.; Dong, C.H. A review on East Asian dust storm climate, modelling and monitoring. Glob. Planet. Chang. 2006, 52, 1–22. [Google Scholar] [CrossRef]
  41. Yuan, T.; Chen, S.; Huang, J.; Zhang, X.; Luo, Y.; Ma, X.; Zhang, G. Sensitivity of simulating a dust storm over Central Asia to different dust schemes using the WRF-Chem model. Atmos. Environ. 2019, 207, 16–29. [Google Scholar] [CrossRef]
  42. Klose, M.; Shao, Y.; Li, X.; Zhang, H.; Ishizuka, M.; Mikami, M.; Leys, J.F. Further development of a parameterization for convective turbulent dust emission and evaluation based on field observations. J. Geophys. Res. Atmos. 2014, 119, 10441–10457. [Google Scholar] [CrossRef]
  43. Kaufman, Y.J.; Koren, I.; Remer, L.A.; Tanre, D.; Ginoux, P.; Fan, S. Dust transport and deposition observed from the Terra-Moderate Resolution Imaging Spectroradiometer (MODIS) spacecraft over the Atlantic ocean. J. Geophys. Res. Atmos. 2005, 110, S12. [Google Scholar] [CrossRef] [Green Version]
  44. Yu, H.; Chin, M.; Bian, H.; Yuan, T.; Prospero, J.; Omar, A.H.; Remer, L.A.; Winker, D.M.; Yang, Y.; Zhang, Y.; et al. Quantification of trans-Atlantic dust transport from seven-year (2007–2013) record of CALIPSO lidar measurements. Remote Sens. Environ. 2015, 159, 232–249. [Google Scholar] [CrossRef]
  45. Yu, H.; Tan, Q.; Chin, M.; Remer, L.A.; Kahn, R.A.; Bian, H.; Kim, D.; Zhang, Z.; Yuan, T.; Omar, A.H.; et al. Estimates of African Dust Deposition Along the Trans-Atlantic Transit Using the Decadelong Record of Aerosol Measurements from CALIOP, MODIS, MISR, and IASI. J. Geophys. Res. Atmos. 2019, 124, 7975–7996. [Google Scholar] [CrossRef] [PubMed]
  46. Adebiyi, A.A.; Kok, J.F.; Wang, Y.; Ito, A.; Ridley, D.A.; Nabat, P.; Zhao, C. Dust Constraints from joint Observational-Modelling-experiMental analysis (DustCOMM): Comparison with measurements and model simulations. Atmos. Chem. Phys. 2020, 20, 829–863. [Google Scholar] [CrossRef] [Green Version]
  47. Kok, J.F.; Adebiyi, A.A.; Albani, S.; Balkanski, Y.; Checa-Garcia, R.; Chin, M.; Colarco, P.R.; Hamilton, D.S.; Huang, Y.; Ito, A.; et al. Contribution of the world’s main dust source regions to the global cycle of desert dust. Atmos. Chem. Phys. 2021, 21, 8169–8193. [Google Scholar] [CrossRef]
  48. Han, Y.; Wang, T.; Tang, J.; Wang, C.; Jian, B.; Huang, Z.; Huang, J. New insights into the Asian dust cycle derived from CALIPSO lidar measurements. Remote Sens. Environ. 2022, 272, 112906. [Google Scholar] [CrossRef]
  49. Huang, Z.; Qi, S.; Zhou, T.; Dong, Q.; Ma, X.; Zhang, S.; Bi, J.; Shi, J. Investigation of aerosol absorption with dual-polarization lidar observations. Opt. Express 2020, 28, 7028–7035. [Google Scholar] [CrossRef]
  50. Kim, M.-H.; Omar, A.H.; Tackett, J.L.; Vaughan, M.A.; Winker, D.M.; Trepte, C.R.; Hu, Y.; Liu, Z.; Poole, L.R.; Pitts, M.C.; et al. The CALIPSO version 4 automated aerosol classification and lidar ratio selection algorithm. Atmos. Meas. Tech. 2018, 11, 6107–6135. [Google Scholar] [CrossRef] [Green Version]
  51. Song, Q.; Zhang, Z.; Yu, H.; Ginoux, P.; Shen, J. Global dust optical depth climatology derived from CALIOP and MODIS aerosol retrievals on decadal timescales: Regional and interannual variability. Atmos. Chem. Phys. 2021, 21, 13369–13395. [Google Scholar] [CrossRef]
  52. Yu, H.; Yang, Y.; Wang, H.; Tan, Q.; Chin, M.; Levy, R.C.; Remer, L.A.; Smith, S.J.; Yuan, T.; Shi, Y. Interannual variability and trends of combustion aerosol and dust in major continental outflows revealed by MODIS retrievals and CAM5 simulations during 2003-2017. Atmos. Chem. Phys. 2020, 20, 139–161. [Google Scholar] [CrossRef] [Green Version]
  53. Gelaro, R.; McCarty, W.; Suárez, M.J.; Todling, R.; Molod, A.; Takacs, L.; Randles, C.A.; Darmenov, A.; Bosilovich, M.G.; Reichle, R.; et al. The Modern-Era Retrospective Analysis for Research and Applications, Version 2 (MERRA-2). J. Clim. 2017, 30, 5419–5454. [Google Scholar] [CrossRef]
  54. Xi, X.; Ignatov, A.; Zhou, X. Exploring MERRA-2 global meteorological and aerosol reanalyses for improved SST retrieval. Remote Sens. Environ. 2019, 223, 1–7. [Google Scholar] [CrossRef]
  55. Pan, B.; Liu, D.; Kumar, K.R.; Wang, M.; Devi, N.L. Global distribution of maritime low clouds with an emphasis on different aerosol types and meteorological parameters inferred from multi-satellite and reanalysis data during 2007–2016. Atmos. Environ. 2020, 246, 118082. [Google Scholar] [CrossRef]
  56. Yao, W.; Che, H.; Gui, K.; Wang, Y.; Zhang, X. Can MERRA-2 Reanalysis Data Reproduce the Three-Dimensional Evolution Characteristics of a Typical Dust Process in East Asia? A Case Study of the Dust Event in May 2017. Remote Sens. 2020, 12, 902. [Google Scholar] [CrossRef] [Green Version]
  57. Yousefi, R.; Wang, F.; Ge, Q.; Shaheen, A. Long-term aerosol optical depth trend over Iran and identification of dominant aerosol types. Sci. Total Environ. 2020, 722, 137906. [Google Scholar] [CrossRef]
  58. Buchard, V.; Randles, C.A.; da Silva, A.M.; Darmenov, A.; Colarco, P.R.; Govindaraju, R.; Ferrare, R.; Hair, J.; Beyersdorf, A.J.; Ziemba, L.D.; et al. The MERRA-2 Aerosol Reanalysis, 1980 Onward. Part II: Evaluation and Case Studies. J. Clim. 2017, 30, 6851–6872. [Google Scholar] [CrossRef]
  59. Huang, Y.; Liu, X.; Yin, Z.; An, Z. Global Impact of ENSO on Dust Activities with Emphasis on the Key Region from the Arabian Peninsula to Central Asia. J. Geophys. Res. Atmos. 2021, 126, e2020JD034068. [Google Scholar] [CrossRef]
  60. Li, Y.; Song, Y.; Kaskaoutis, D.G.; Chen, X.; Mamadjanov, Y.; Tan, L. Atmospheric dust dynamics in southern Central Asia: Implications for buildup of Tajikistan loess sediments. Atmos. Res. 2019, 229, 74–85. [Google Scholar] [CrossRef]
  61. Ge, Y.; Abuduwaili, J.; Ma, L.; Liu, D. Temporal Variability and Potential Diffusion Characteristics of Dust Aerosol Originating from the Aral Sea Basin, Central Asia. Water Air Soil Pollut. 2016, 227, 63. [Google Scholar] [CrossRef]
  62. Groll, M.; Opp, C.; Aslanov, I. Spatial and temporal distribution of the dust deposition in Central Asia-results from a long term monitoring program. Aeolian Res. 2012, 9, 49–62. [Google Scholar] [CrossRef]
  63. Alfaro-Contreras, R.; Zhang, J.; Reid, J.S.; Christopher, S. A study of 15-year aerosol optical thickness and direct shortwave aerosol radiative effect trends using MODIS, MISR, CALIOP and CERES. Atmos. Chem. Phys. 2017, 17, 13849–13868. [Google Scholar] [CrossRef] [Green Version]
  64. Alizadeh-Choobari, O.; Sturman, A.; Zawar-Reza, P.; Alizadeh-Choobari, O.; Sturman, A.; Zawar-Reza, P. A global satellite view of the seasonal distribution of mineral dust and its correlation with atmospheric circulation. Dyn. Atmos. Ocean. 2014, 68, 20–34. [Google Scholar] [CrossRef]
  65. Liu, D.; Wang, Z.; Liu, Z.; Winker, D.; Trepte, C. A height resolved global view of dust aerosols from the first year CALIPSO lidar measurements. J. Geophys. Res. Atoms. 2008, 113, D16214. [Google Scholar] [CrossRef]
  66. Proestakis, E.; Amiridis, V.; Marinou, E.; Georgoulias, A.K.; Solomos, S.; Kazadzis, S.; Chimot, J.; Che, H.; Alexandri, G.; Binietoglou, I.; et al. Nine-year spatial and temporal evolution of desert dust aerosols over South and East Asia as revealed by CALIOP. Atmos. Chem. Phys. 2018, 18, 1337–1362. [Google Scholar] [CrossRef] [Green Version]
  67. Levy, R.C.; Mattoo, S.; Sawyer, V.; Shi, Y.; Colarco, P.R.; Lyapustin, A.I.; Wang, Y.; Remer, L.A. Exploring systematic offsets between aerosol products from the two MODIS sensors. Atmos. Meas. Tech. 2018, 11, 4073–4092. [Google Scholar] [CrossRef] [Green Version]
  68. Levy, R.C.; Mattoo, S.; Munchak, L.A.; Remer, L.A.; Sayer, A.M.; Patadia, F.; Hsu, N.C. The Collection 6 MODIS aerosol products over land and ocean. Atmos. Meas. Tech. 2013, 6, 2989–3034. [Google Scholar] [CrossRef] [Green Version]
  69. Uno, I.; Eguchi, K.; Yumimoto, K.; Takemura, T.; Shimizu, A.; Uematsu, M.; Liu, Z.; Wang, Z.; Hara, Y.; Sugimoto, N. Asian dust transported one full circuit around the globe. Nat. Geosci. 2009, 2, 557–560. [Google Scholar] [CrossRef]
  70. Uno, I.; Eguchi, K.; Yumimoto, K.; Liu, Z.; Hara, Y.; Sugimoto, N.; Shimizu, A.; Takemura, T. Large Asian dust layers continuously reached North America in April 2010. Atmos. Chem. Phys. 2011, 11, 7333–7341. [Google Scholar] [CrossRef] [Green Version]
  71. Sun, H.; Liu, X.; Wang, A. Seasonal and interannual variations of atmospheric dust aerosols in mid and low latitudes of Asia-A comparative study. Atmos. Res. 2020, 244, 105036. [Google Scholar] [CrossRef]
  72. Wang, T.; Tang, J.; Sun, M.; Liu, X.; Huang, Y.; Huang, J.; Han, Y.; Cheng, Y.; Huang, Z.; Li, J. Identifying a transport mechanism of dust aerosols over South Asia to the Tibetan Plateau: A case study. Sci. Total Environ. 2020, 758, 143714. [Google Scholar] [CrossRef] [PubMed]
  73. Wu, M.; Liu, X.; Yu, H.; Wang, H.; Shi, Y.; Yang, K.; Darmenov, A.; Wu, C.; Wang, Z.; Luo, T.; et al. Understanding processes that control dust spatial distributions with global climate models and satellite observations. Atmos. Chem. Phys. 2020, 20, 13835–13855. [Google Scholar] [CrossRef]
  74. Kim, D.; Chin, M.; Yu, H.; Diehl, T.; Tan, Q.; Kahn, R.A.; Tsigaridis, K.; Bauer, S.E.; Takemura, T.; Pozzoli, L.; et al. Sources, sinks, and transatlantic transport of North African dust aerosol: A multimodel analysis and comparison with remote sensing data. J. Geophys. Res. Atmos. 2014, 119, 6259–6277. [Google Scholar] [CrossRef] [Green Version]
  75. Omar, A.H.; Winker, D.M.; Tackett, J.L.; Giles, D.; Kar, J.; Liu, Z.; Vaughan, M.A.; Powell, K.A.; Trepte, C.R. CALIOP and AERONET aerosol optical depth comparisons: One size fits none. J. Geophys. Res. Atmos. 2013, 118, 4748–4766. [Google Scholar] [CrossRef]
  76. Denjean, C.; Bourrianne, T.; Burnet, F.; Mallet, M.; Maury, N.; Colomb, A.; Dominutti, P.; Brito, J.; Dupuy, R.; Sellegri, K.; et al. Overview of aerosol optical properties over southern West Africa from DACCIWA aircraft measurements. Atmos. Chem. Phys. 2020, 20, 4735–4756. [Google Scholar] [CrossRef] [Green Version]
  77. Wang, T.; Han, Y.; Hua, W.; Tang, J.; Huang, J.; Zhou, T.; Huang, Z.; Bi, J.; Xie, H. Profiling Dust Mass Concentration in Northwest China Using a Joint Lidar and Sun-Photometer Setting. Remote Sens. 2021, 13, 1099. [Google Scholar] [CrossRef]
  78. Al-Dousari, A.M.; Al-Awadhi, J. Dust fallout in northern Kuwait, major sources and characteristics. Kuwait J. Sci. 2012, 39, 171–187. [Google Scholar]
  79. O’Hara, S.L.; Clarke, M.L.; Elatrash, M.S. Field measurements of desert dust deposition in Libya. Atmos. Environ. 2006, 40, 3881–3897. [Google Scholar] [CrossRef]
  80. Smith, J.P.; Brabander, D.J.; Panek, L.A.; Besancon, J.R. Enrichment of potentially toxic elements in the fine fraction of soils from Iraq and Kuwait. J. Soils Sediments 2019, 19, 3545–3563. [Google Scholar] [CrossRef]
  81. Yao, T.; Xue, Y.; Chen, D.; Chen, F.; Thompson, L.; Cui, P.; Koike, T.; Lau, W.K.-M.; Lettenmaier, D.; Mosbrugger, V.; et al. Recent Third Pole’s Rapid Warming Accompanies Cryospheric Melt and Water Cycle Intensification and Interactions between Monsoon and Environment: Multidisciplinary Approach with Observations, Modeling, and Analysis. Bull. Am. Meteorol. Soc. 2019, 100, 423–444. [Google Scholar] [CrossRef]
Figure 1. The geographical distribution of dust sources and major mountains in Central Asia. The dust sources include: the Lut desert, the Karakum Desert (KkD), the Kyzylkum Desert (KlD), the Aralkum Desert (AD), the Pre-Balkhash Desert (PbD), the Caspian Depression deserts (CdD), the Taklimakan Desert (TD) and, the Thar Desert (ThD). The downstream contribution of Central Asian dust will be estimated at two cross-sections (yellow lines) of C1 (~69°E) and C2 (along the Tianshan Mountains, the Junggar Xibu Shandi Mountains, the western of Altai Mountains), respectively.
Remotesensing 14 01416 g001
Figure 2. The seasonal climatology of DOD from CALIOP (left), MODIS (middle) and MERRA-2 (right) over Central Asia in (ac) spring (MAM: March–April–May), (df) summer (JJA: June–July–August), (gi) autumn (SON: September–October–November), and (jl) winter (DJF: December–January–February).
Remotesensing 14 01416 g002
Figure 3. A composite of column–integrated zonal and meridional DFRs (kg m−1 day−1) derived from CALIOP (left) and MERRA–2 (right) in (a,b) spring (MAM: March–April–May), (c,d) summer (JJA: June–July–August), (e,f) autumn (SON: September–October–November), and (g,h) winter (DJF: December–January–February), showing the magnitude (color scale) and direction (arrow of vector) of dust transport in the atmosphere and its seasonal variations.
Remotesensing 14 01416 g003
Figure 4. Seasonal longitude–height cross-section of DFRs derived from CALIOP at (left panel) zonal and (right panel) meridional directions in (a,b) spring (MAM: March–April–May), (c,d) summer (JJA: June–July–August), (e,f) autumn (SON: September–October–November), and (g,h) winter (DJF: December–January–February), averaged over the southern portion of the regions (25–−40°N). The black lines indicate that 50% (solid line) and 90% (dashed line) of DMC lies below that height. Here the positive DFRs represent the dust transport eastward and northward.
Remotesensing 14 01416 g004
Figure 5. Same as the Figure 4, but for the northern portion of the regions (40–55°N) in (a,b) spring (MAM: March–April–May), (c,d) summer (JJA: June–July–August), (e,f) autumn (SON: September–October–November), and (g,h) winter (DJF: December–January–February).
Remotesensing 14 01416 g005
Figure 6. Vertical distribution of seasonal climatology of zonal (left) and meridional (middle) of DFR derived from CALIOP along the meridional cross-section of C1 (69°E) in (ac) spring (MAM: March–April–May), (df) summer (JJA: June–July–August), (gi) autumn (SON: September–October–November), and (jl) winter (DJF: December–January–February). Here, the positive of zonal and meridional DFRs represent the dust transport eastward and northward, respectively. The profiles of integrated composited DFR (right) along the border at different seasons are also shown. Additionally, the positive of composited DFR means the Central Asian dust transport to the downstream areas.
Remotesensing 14 01416 g006
Figure 7. Same as the Figure 5, but for the cross-section of C2 in (ac) spring (MAM: March–April–May), (df) summer (JJA: June–July–August), (gi) autumn (SON: September–October–November), and (jl) winter (DJF: December–January–February).
Remotesensing 14 01416 g007
Table 1. Dust transport contribution (unit: Tg) from Central Asia to South Asia (C1) and East Asia (C2) based on CALIOP observation and MERRA-2 reanalysis data.
MAMJJASONDJFAnnual
C1CALIOP55.5969.0326.0813.31164.01
MERRA-224.1020.775.947.7158.52
C2CALIOP30.8416.7019.4811.3478.36
MERRA-229.3116.0511.639.1866.17
Table 2. The absolute (relative) uncertainties of dust contribution from Central Asia to South (C1) and East Asia (C2) caused by MEE with one deviation based on CALIOP.
MAMJJASONDJFAnnual
C114.26
(25.7%)
17.93
(26.0%)
6.57
(25.7%)
3.38
(25.2%)
42.14
(25.7%)
C26.89
(22.3%)
3.92
(23.5%)
4.33
(22.2%)
2.61
(23.0%)
17.75
(22.7%)
Publisher’s Note: MDPI stays neutral with regard to jurisdictional claims in published maps and institutional affiliations.

