Article

Assessing the Potential of Downscaled Far Red Solar-Induced Chlorophyll Fluorescence from the Canopy to Leaf Level for Drought Monitoring in Winter Wheat

1
State Key Laboratory of Remote Sensing Science, Beijing Normal University, Institute of Remote Sensing and Digital Earth of Chinese Academy of Sciences, Beijing 100875, China
2
Beijing Key Laboratory for Remote Sensing of Environment and Digital Cities, Beijing 100875, China
3
Faculty of Geographical Science, Beijing Normal University, Beijing 100875, China
4
Center for Drought and Risk Research, Beijing Normal University, Beijing 100875, China
5
College of Grassland Science and Technology, China Agricultural University, Beijing 100083, China
*
Author to whom correspondence should be addressed.
Remote Sens. 2022, 14(6), 1357; https://doi.org/10.3390/rs14061357
Submission received: 13 January 2022 / Revised: 2 March 2022 / Accepted: 8 March 2022 / Published: 10 March 2022

Abstract

:
Solar-induced chlorophyll fluorescence (SIF) from ground, airborne, and satellite-based observations has been increasingly used in drought monitoring recently due to its close relationship with photosynthesis. SIF emissions respond rapidly to droughts, relative to the widely used vegetation indices (VIs), thus indicating their potential for early drought monitoring. The response of SIF to droughts can be attributed to the confounding effects of both the physiology and canopy structure. In order to reduce the reabsorption and scattering effects, the total emitted SIF (SIFtot) was proposed and served as a better tool to estimate GPP compared with the top-of-canopy SIF (SIFtoc). However, the response time and response magnitude of SIFtot to droughts and its relationships with the environmental parameters and soil moisture (SM) (i.e., the knowledge of drought monitoring using SIFtot) remains unclear. Here, the continuous ground data of F760toc (SIFtoc at 760 nm) from a nadir view that was downscaled to F760tot (SIFtot at 760 nm), NIRv, and the NDVI, SM, meteorological, and crop growth parameters were measured from four winter wheat plots with different intensities of drought (well-watered, moderate drought, severe drought, and extreme drought) over 2 months. The results indicated that F760tot was more closely correlated with the SM than the VIs at short time lags but weaker at longer time lags. The daily mean values of F760tot and NIRv were able to distinguish the differences between different drought levels, and F760tot responded quickly to the onset of drought, especially for the moderate drought intensity. These findings demonstrated that F760tot has potential for early drought monitoring and may contribute to mitigating the risk of agricultural drought.

Graphical Abstract

1. Introduction

Droughts are one of the most extreme and least understood climatic events in many regions of the world that has been responsible for significant socioeconomic and ecological consequences [1]. Climate change increases the global frequency and severity of droughts, thus exacerbating yield uncertainty and posing several risks to agriculture [2]. Consequently, there is an urgent need for obtaining a better understanding of drought detection. Historically, drought monitoring approaches have evolved from in situ station-based measurements (e.g., the Palmer Drought Severity Index (PDSI)) toward the continuous observations and monitoring of key drought-related variables at regional and global scales using remote sensing [3]. Among them, vegetation indices (VIs) have been widely used for estimating drought severity across space and serve as good indicators to monitor drought [4]. However, it is noted that greenness-based VIs are incapable of capturing dynamic changes of drought responses in shorter timescales, since these indices relate to canopy greenness directly and potentially decouple from photosynthetic functioning [5].
Solar-induced fluorescence (SIF) is an optical signal (650–850 nm) emitted from plant chlorophyll and has been used as an indicator of the actual functional state of plant photosynthesis. Recent research has demonstrated that SIF is promising for estimating gross primary production (GPP) [6], monitoring water stress [7], tracking phenological changes [8], predicting crop yield [9], and estimating leaf nitrogen content [10], among other uses. With respect to stress detection, various studies have explored the impacts of droughts on the red (e.g., F685) or far red (e.g., F760) SIF observed by the ground, airborne, and satellite platforms. For example, Pérez-Priego et al. [11] conducted the field experiments to acquire ratios between the 757 nm (out) and 760 nm (in) bands and revealed the good relationship between fluorescence and droughts at the canopy scale. The far-red SIF was more sensitive to VPD [7] and the short-term standard precipitation index (SPI) than the Normalized Difference Vegetation Index (NDVI) [12]. More importantly, the site-observed F760 was significantly correlated with the root zone soil moisture (SM) [13], and it outperformed the VIs for early drought detection in a short time lag, especially over a closed canopy [14].
However, the top-of-canopy SIF (SIFtoc) is only a fraction of the emitted SIF photons due to the absorption and scattering effects of SIF emission in the canopy scale, thus influencing its relationship with GPP and showing the confounding effects of the leaf optical properties and canopy structures on SIF [15]. Therefore, many efforts have been made to reduce the influence of normalizing the solar zenith angle (SZA) of SIF observations or downscaling SIF from the canopy to leaf level. Some studies [16,17,18] have used the bidirectional reflectance distribution function model to correct the angular effect of SIF and demonstrated a stronger relationship between SIF and GPP. Alternatively, the importance of downscaling SIF from the canopy to leaf level has attracted increasing attention recently. Generally, at the canopy scale, the amount of SIFtoc is frequently defined as
SIF toc = PAR · fPAR · Φ F · f esc
where PAR represents the photosynthetically active radiation received, fPAR is the fraction of PAR absorbed by vegetation, Φ F is the fluorescence efficiency, and f esc is the fluorescence escape ratio (i.e., the probability of a photon escaping from the canopy in the direction of the sensor). Based on SIFtoc and f esc , the term of SIFtot (total canopy SIF emission) can be defined as
SIF toc = SIF tot · f esc
The core of downscaling SIF from the canopy to leaf level is to estimate f esc . For example, a model for retrieving the spectral shape of the leaf fluorescence spectrum was proposed by Romero et al. [19]. Liu et al. [20] utilized the Random Forest (RF) model to estimate SIF at the photosystem level in both the red and far-red bands and improved the correlations between SIF and absorbed photosynthetically active radiation (APAR). A simple approach to estimate the f esc of SIF at the far-red band was introduced based on the near-infrared reflectance of vegetation (NIRv) and the fraction of absorbed photosynthetically active radiation (fPAR) [21]. Generally, the O2–A band (~760 nm) is most commonly used for retrieving SIF results, or in other words, F760 (SIF at 760 nm). However, the fact is that only a fraction of the emitted SIF photons is observed from the top of the canopy, which is therefore called F760toc. Using the above method, F760toc can be used to calculate the total emitted SIF (SIFtot) at 760 nm (i.e., F760tot), thus reflecting the total emitted SIF from the entire canopy. In this regard, some studies [22] suggested that SIFtot exhibited better performance in predicting GPP compared with SIFtoc. In contrast to these findings, Dechant et al. [23] actually found a decreased performance of F760tot compared with F760toc for GPP estimation.
With respect to stress detection, SM is used to indicate drought-induced water stress, and the relationship between SIF and SM is complex. Generally, the physiological response of plants to a drought includes the stomatal and non-stomatal limitations, thus leading to the variation of photosynthetic electron transport, non-photochemical quenching (NPQ), and SIF. As the SM continuously declines until a certain threshold, the stomatal and non-stomatal limitations lead to a decrease both in photosynthesis and fluorescence. Based on many canopy-scale studies [5,13,14], a decrease in F760 can be observed under water stress, and F760 has a higher correlation relationship with SM than VI. Specifically, the behavior of the canopy-scale SIF under a drought is the ensemble of the changes in the physiological reaction and canopy structure [23], and among them, Xu et al. [5] suggested that structural factors dominated the spatial response of SIF to water stress over the physiological reaction, while F760tot represents the total emitted SIF at the leaf level and should be less affected by canopy structures. Therefore, it is unreasonable to speculate on the performance of F760tot for drought monitoring based on the performance of F760toc. That aside, only a few studies, such as Liu et al. [24] demonstrated that the value of SIFtot apparently declined compared with the multi-year average under a drought, and there appeared to be similar monitoring effects for both SIFtoc and SIFtot regarding droughts. This study used satellite SIF data to obtain these findings without ground experiments. Moreover, the response time and magnitude of SIFtot (F760tot) for droughts and its relationships with the environmental parameters and SM (i.e., the potential of F760tot in drought detection) remain unclear. If this is figured out, the results might provide a deep insight into the utility of F760tot in drought monitoring, thus contributing to mitigating the risk of agricultural droughts.
To explore the monitoring effects of F760tot on droughts, here, the continuous ground measurements to four plots under different levels of drought for a wheat crop were carried out. An automated field spectroscopy system was used to collect the time series of canopy F760toc, and then F760toc was downscaled to F760tot for analyzing its relationship with the environmental and crop growth parameters and addressing the following three objectives:
(1)
explore the detailed responses between F760tot with F760toc and VIs in responding to different intensities of drought;
(2)
reveal the relationships between PAR and the growth parameters with seasonal F760tot;
(3)
determine the relationships of F760tot, F760toc, and VIs with SM across the growth season of wheat.

2. Materials and Methods

2.1. Ground Measurements

A dataset comprising the ground spectral, canopy structure, and vegetation physiological measurements of winter wheat, as well as meteorological and SM measurements, was acquired at the Fangshan Comprehensive Experimental Station (39°35′N, 115°42.5′E) of Beijing Normal University, following the experimental settings of different drought levels for four plots. It was used to evaluate the performance of F760tot for drought monitoring.
Winter wheat was sown in October 2016 in rows in four plots (4 m × 4 m) and harvested in June 2017. To protect the wheat from freezing, the same irrigation was conducted on four plots before the green-up stage. After the green-up, the four different irrigation treatments in Table 1 were applied in order to generate four drought levels: well-watered treatment, moderate drought, severe drought, and extreme drought, corresponding to the order of P1, P2, P3, and P4. Among the four plots, only the irrigations of P1 met the needs of the winter wheat during growth. The winter wheat in other plots suffered different levels of water stress. During the study period, there was no rainfall, and therefore the experiment was not affected by precipitation. Eventually, the prolonged drought levels of four plots were generated, and the period between 28 March 2017 and 19 May 2017 was selected as the time window for field measurements.
Details on the measurements including the parameters, methods or devices, and intervals are summarized in Table 2 as follows. The spectral measurements were conducted using an automated field spectroscopy system [14], which was improved based on the FluoSpec system [25]. As displayed in Figure 1, the core components of this system were an Ocean Optics HR2000+ spectrometer (wavelength: 680–775 nm; FWHM: ~0.13 nm) and a fiber switch (OceanOptics, Inc., Dunedin, FL, USA) to measure the up- and downwelling radiation fluxes in sequence (nadir view, ~4.5 m height, hemispherical-conical configurations, footprint: 0.45 m). One of the fibers which pointed toward the wheat canopy to collect upwelling radiance was a bare fiber (FOV: 25°), and the other fiber attached to a cosine corrector (CC-3, OceanOptics, Inc., Dunedin, FL, USA) was pointed toward the sky to collect incident light (FOV: 180°). In order to reduce the influence of dark current, the HR2000+ spectrometer was placed in an incubator with a fixed temperature of 23 °C. Another key component was the stepping motor with a round trip that could be rotated over the 4 plots in 6-min intervals. Moreover, the surface soil moisture at the 20-cm soil layer, incident photosynthetically active radiation (PAR, 400–700 nm), and meteorological parameters were collected automatically using different devices. Additionally, some critical growth parameters of wheat such as the leaf area index (LAI), chlorophyll content (Chl), and relative water content of leaf (RWC) were manually measured in a coarser temporal resolution. Specifically, the growth parameters were measured six times during the field campaign.

2.2. F760toc Retrieval

Before SIF retrieval, pre-processing, including dark current correction, a Savitzky–Golay (SG) filter, radiometric and wavelength calibration, and quality control were conducted for solar irradiance and canopy radiance, which were then converted to irradiance (mW/m2/nm) and radiance (mW/m2/sr/nm). Because of the limited height between the sensor and canopy surface (<2 m), the effect of atmospheric radiation was negligible and therefore not corrected in this study.
Various methods have been developed to decouple SIF from the total at-sensor radiance from spectral measurements. Among them, major SIF retrieval methods were derived from the Fraunhofer line discrimination (FLD) principle [26]. For example, several different FLD-based algorithms including the three-band FLD (3FLD), the improved FLD (iFLD), and the pFLD method have been developed, focusing on the telluric O2 absorption bands or solar Fraunhofer lines. These methods have proven to be robust and simple to apply but may overestimate the values of SIF emissions [27]. Hence, by assuming that the SIF and reflectance were polynomials or other appropriate mathematical functions of wavelengths, the Spectral Fitting Methods (SFM), proposed by Meroni et al. [28], utilized a set of contiguous channels to estimate SIF. Apart from these FLD-based algorithms, statistical methods based on singular vector decomposition (SVD) or principal component analysis (PCA) were proposed to enhance FLD SIF retrieval from satellites [29,30] but were applied to extract ground-based SIF [31].
Here, only F760toc was retrieved due to the limitation of our spectrometer. According to the analysis by Chang et al. [32], the FLD-based retrievals of SIF were noisier and more sensitive when assuming the SIF spectral shape than the O2A-based method, and the authors recommended that the SVD or SFM method using a reduced fitting window (759.5–761.5 nm) was robust for far-red SIF retrievals across different sky conditions. Therefore, based on this reduced fitting window, the SFM algorithm was selected to estimate F760toc at the canopy level. The basic equation was
L λ = r MOD λ · E λ π + F MOD λ
where L λ is the radiance upwelling from the vegetation canopy at ground level, E λ is the total solar irradiance incident on the target, r MOD λ and F MOD λ are the mathematical functions used to describe and model (MOD) the two key variables, and they are all distributed at each wavelength.

2.3. Estimation of fPARchl

According to Equations (1) and (2) in Section 1, fPAR was essential for the escape probability to calculate SIFtot, which was not measured directly in the field experiment. Therefore, the statistical model based on regression analysis between the fPAR and VIs was selected as the method to estimate fPAR. Pioneering works [33,34] have shown that fPAR (i.e., fPARcanopy or fPARchl) could be approximated with the NDVI, enhanced vegetation index (EVI), wide dynamic range vegetation index (WDRVI), and so on. Here, the SCOPE 2.0 model [35] was utilized to illustrate the relationships between different fPAR values and VIs.
Details about the SCOPE input parameters are listed in Table 3 (i.e., different leaf chlorophyll contents (Cab) and LAI levels to cover the most common vegetation conditions of winter wheat, as well as different soil moisture contents (SMCs) and SZA to represent different drought levels and solar-view geometries, respectively). Consequently, 10,530 different samples of spectral reflectance (1-nm intervals), aPAR, and aPARbyCab were generated. Different VIs containing the Normalized Difference Vegetation Index (NDVI), Red Edge NDVI (NDVI705), WDRVI, and Optimized Soil-Adjusted Vegetation Index (OSAVI) are calculated in Table 4, where the average values of 684–686 nm, 704–706 nm, and 749–751 nm were used for the Red, Rededge, and NIR bands, respectively.
As depicted in Figure 2, the fPARchl estimation of NDVI705 outperformed the original counterparts with the highest R2 (0.921). The linear fPARchl–NDVI705 function was expressed as:
fPAR chl = 0 . 872 · NDVI 705 + 0 . 119
The PAR above the canopy (PARabove) was directly measured using three quantum sensors (S-LIA-M003, Onset Computer Corporation, Bourne, MA, USA). Consequently, the APARchl could be calculated as follows:
APAR chl = PAR · fPAR chl
Figure 2. Linear regressions of the fPARchl on the different VIs computed from SCOPE 2.0 simulations.
Remotesensing 14 01357 g002

2.4. F760tot Calculation

SIFtoc may be downscaled to SIFtot of all leaves or all photosystems by considering the absorption and scattering effects of SIF emissions within the canopy or the leaf [15], respectively. Based on the concept of recollision probability (or ‘p-theory’) [40], several studies aimed at describing the radiative transfer of SIF emissions within the canopy and the SIF escape probability ( f esc ) from the leaf to canopy level. For example, Yang and van der Tol [41] and Liu et al. [20] showed that f esc could be modeled as follows:
δ FC λ = BRF λ , Ω i 0 · w
where δ FC λ is the canopy scattering of SIF, BRF λ , Ω is the directional canopy reflectance for the direction Ω, i 0 is the proportion of incident photons intercepted by the canopy, and w is the leaf-scattering coefficient or leaf single-scattering albedo.
However, these parameters cannot, in general, be accurately estimated, so different available variables were chosen to represent the components of δ FC λ ,   i 0 , and w . For BRF λ ,   Ω , it was usually assumed to be consistent with NIR v = NDVI NIR [21], R Veg = R Obs R Soil [22], or Red V = Red tot × NDVI 2 [42]. For i 0 , it appeared to play a similar role to fPAR [42] or be calculated as 1 EXP ( 0 . 5 × L e / cos θ S ) [22]. For w , it was expected to be relatively stable (e.g., 0.853~0.888) at the far red band and 0.287~0.444 at the red band, as suggested by Liu et al. [20]. In this study, NIR v for BRF, fPAR for i 0 , and 0.87 for w were combined to calculate F760tot:
f esc = NIR v 0 . 87 · fPAR
Based on f esc , F 760 tot can be calculated as:
F 760 tot   = F 760 toc f esc

2.5. Data Analysis

The pre-processing of different measurements was introduced in the previous sections, and data analyses were then performed to address the scientific questions raised previously. For all different measurement data, the SIF data were dominant, and only the time steps of the meteorological data and PAR, SM, and vegetation parameters that corresponded to the SIF data were selected in order to ensure direct comparability. The ratio of F760/PAR (referred to as AF760toc and AF760tot hereafter) was also calculated to remove the influence of solar irradiance.
The temporal resolutions of the measurements are displayed in Table 2. The hourly and daily mean values (from 8:00 a.m. to 5:00 p.m.) of the different parameters were calculated. For the hourly scale, the hourly mean F760 and F760/PAR as well as the meteorological data were calculated along with the PAR. The fPAR derived from the linear regression and APAR was also averaged hourly to calculate F760tot. For the daily scale, the paired daily data mentioned above were also calculated depending on the average hourly mean values.
First, the utility of F760tot for drought monitoring in comparison with F760toc, F760/PAR, and VIs (NDVI, NIRv) was evaluated during most of the growing stages. Secondly, to reveal the effect of different parameters on F760tot under a long-running drought, correlation analyses of F760tot with PAR and other vegetation parameters such as LAI and Chl were conducted for the four plots. Third, the goal of this part is to discuss the detailed differences in the relationship of the root zone soil moisture (20 cm SM) with F760tot, AF760, and the VIs. Furthermore, the lag responses of 20 cm SM to F760tot were also explored with the development of wheat. All correlation analyses were performed based on the Pearson correlation coefficient, and the statistical significance of the Pearson correlation coefficient was evaluated with a two-sided t-test at a confidence level of 95%.

3. Results

3.1. Differences of F760tot, F760toc, and VIs in Responding to Different Drought Levels

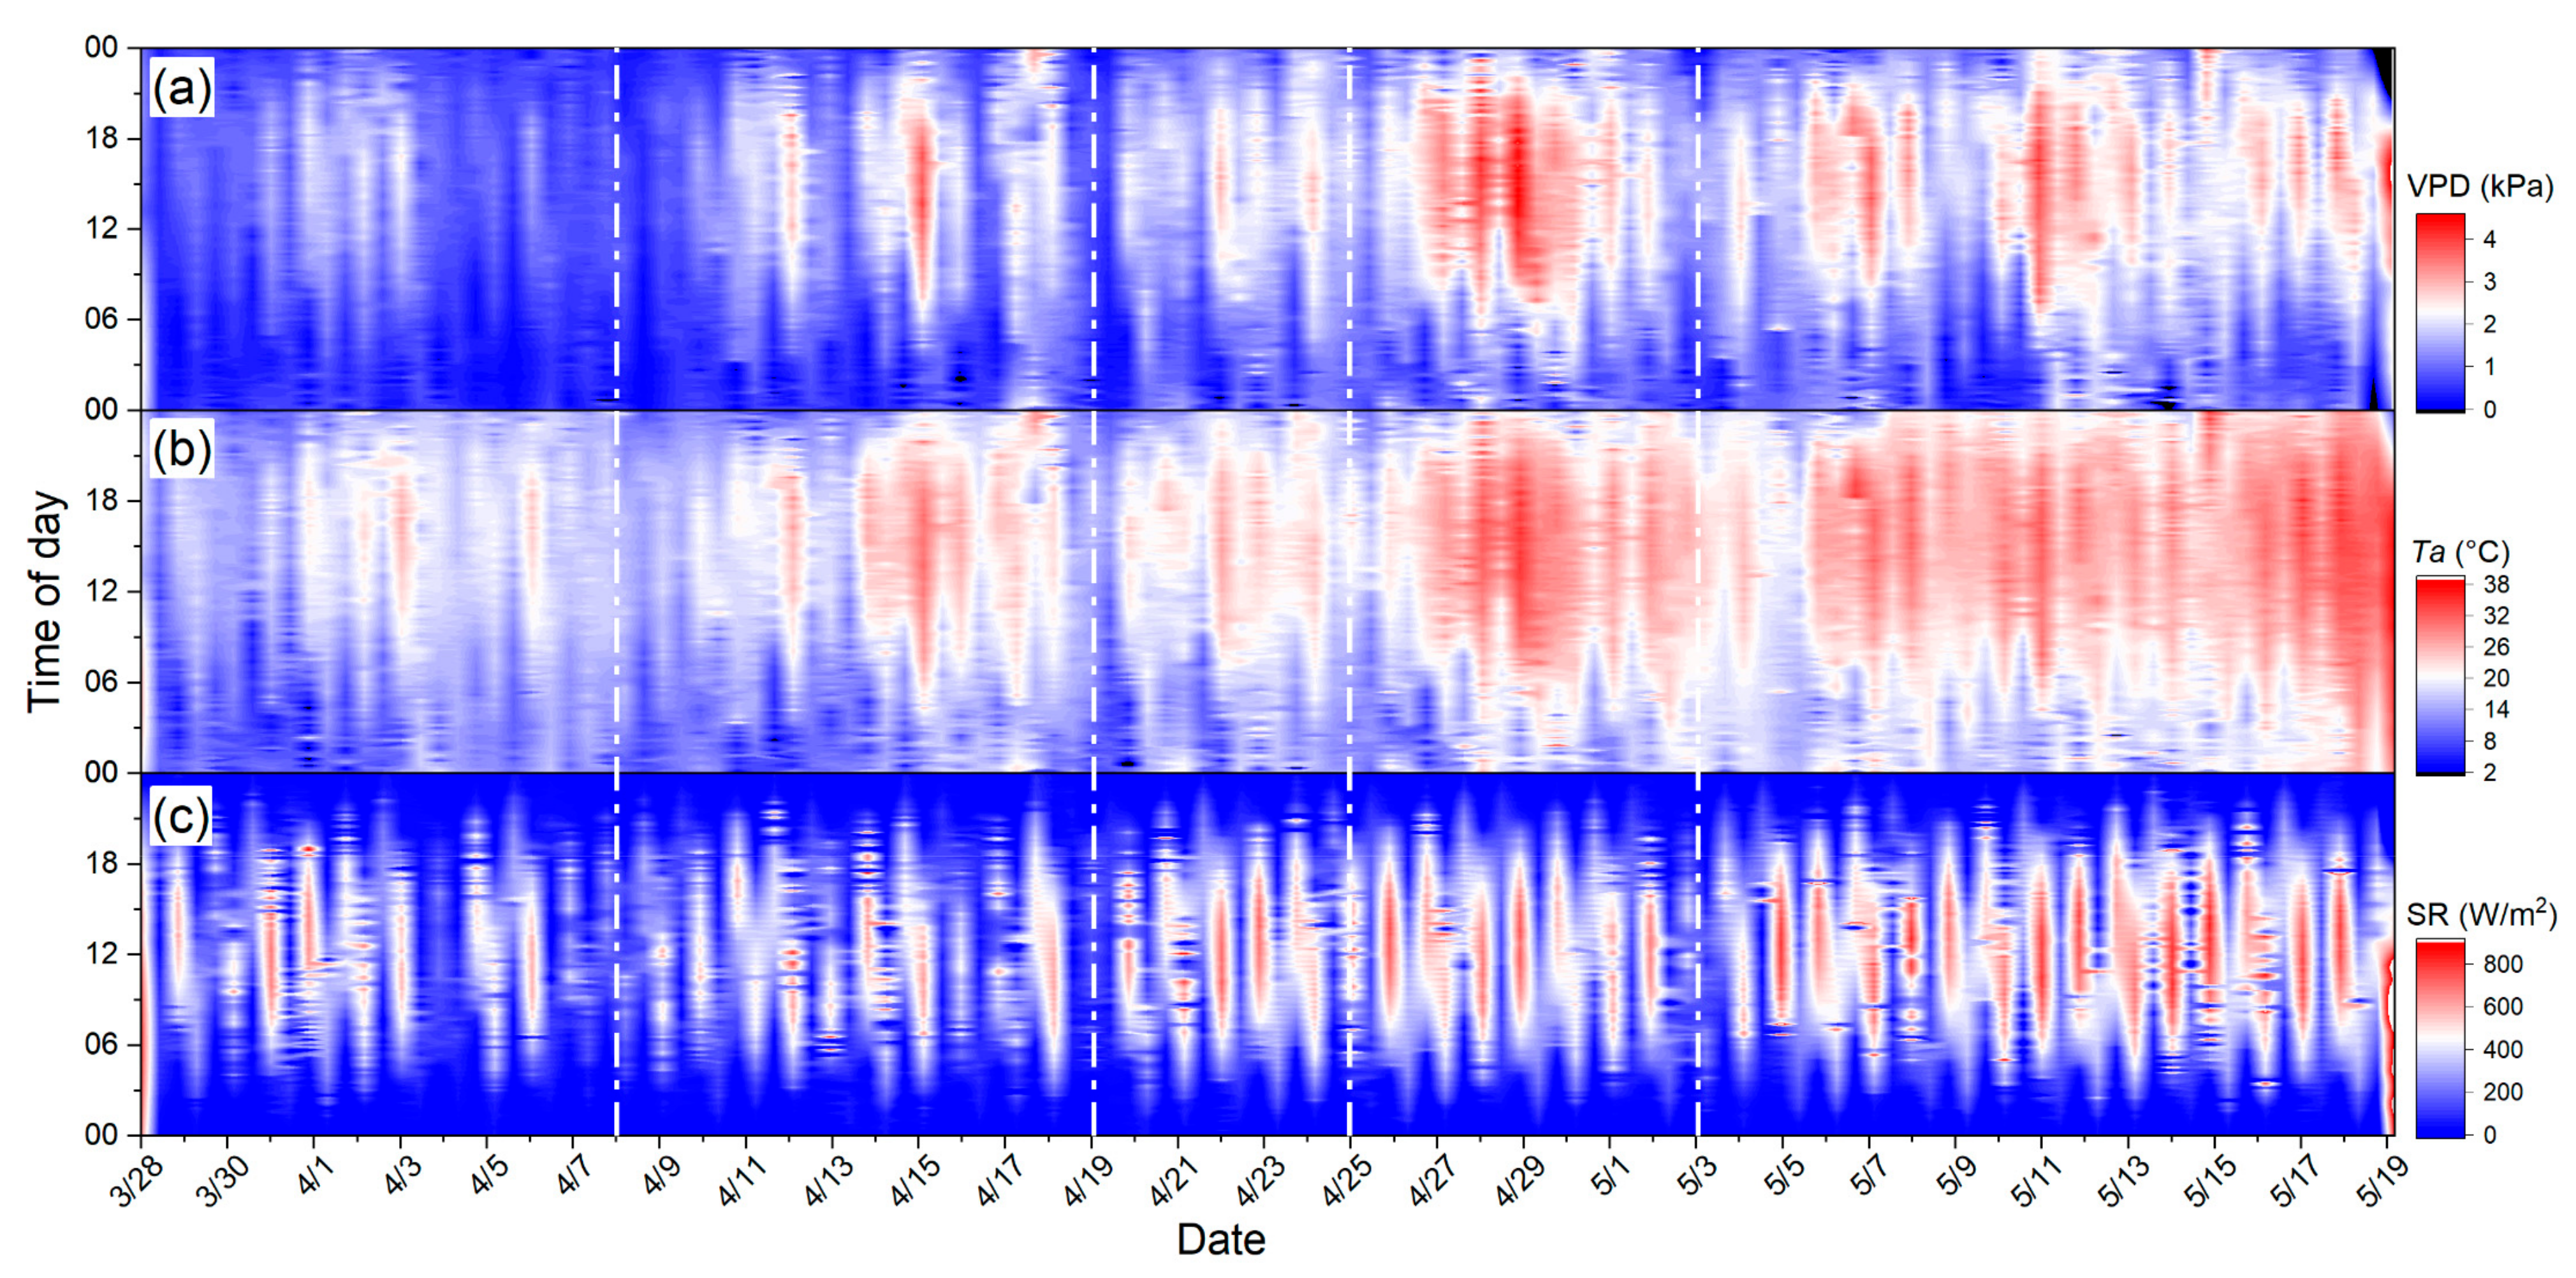
In Section 2.1, a dataset containing different types of measurements was obtained for subsequent analysis. As illustrated in Figure 3, there was a steady increase in these three parameters, including the VPD, Ta, and SR, during the growing season, among which Ta appeared to have the greatest increment (Figure 3b). Specifically, these three parameters showed the daily variability, and the peaks of Ta were well correlated with those of the VPD (13–17 April, 27 April to 1 May, and 5–9 May in 2017, etc.). Most importantly, the four white dash-dotted lines marked in panels (a–c) (8 April, 19 April, 25 April, and 3 May) indicate several valleys of SR during the growing season, which had implications for deciphering the minimum values of F760tot (Figure 4b,c).
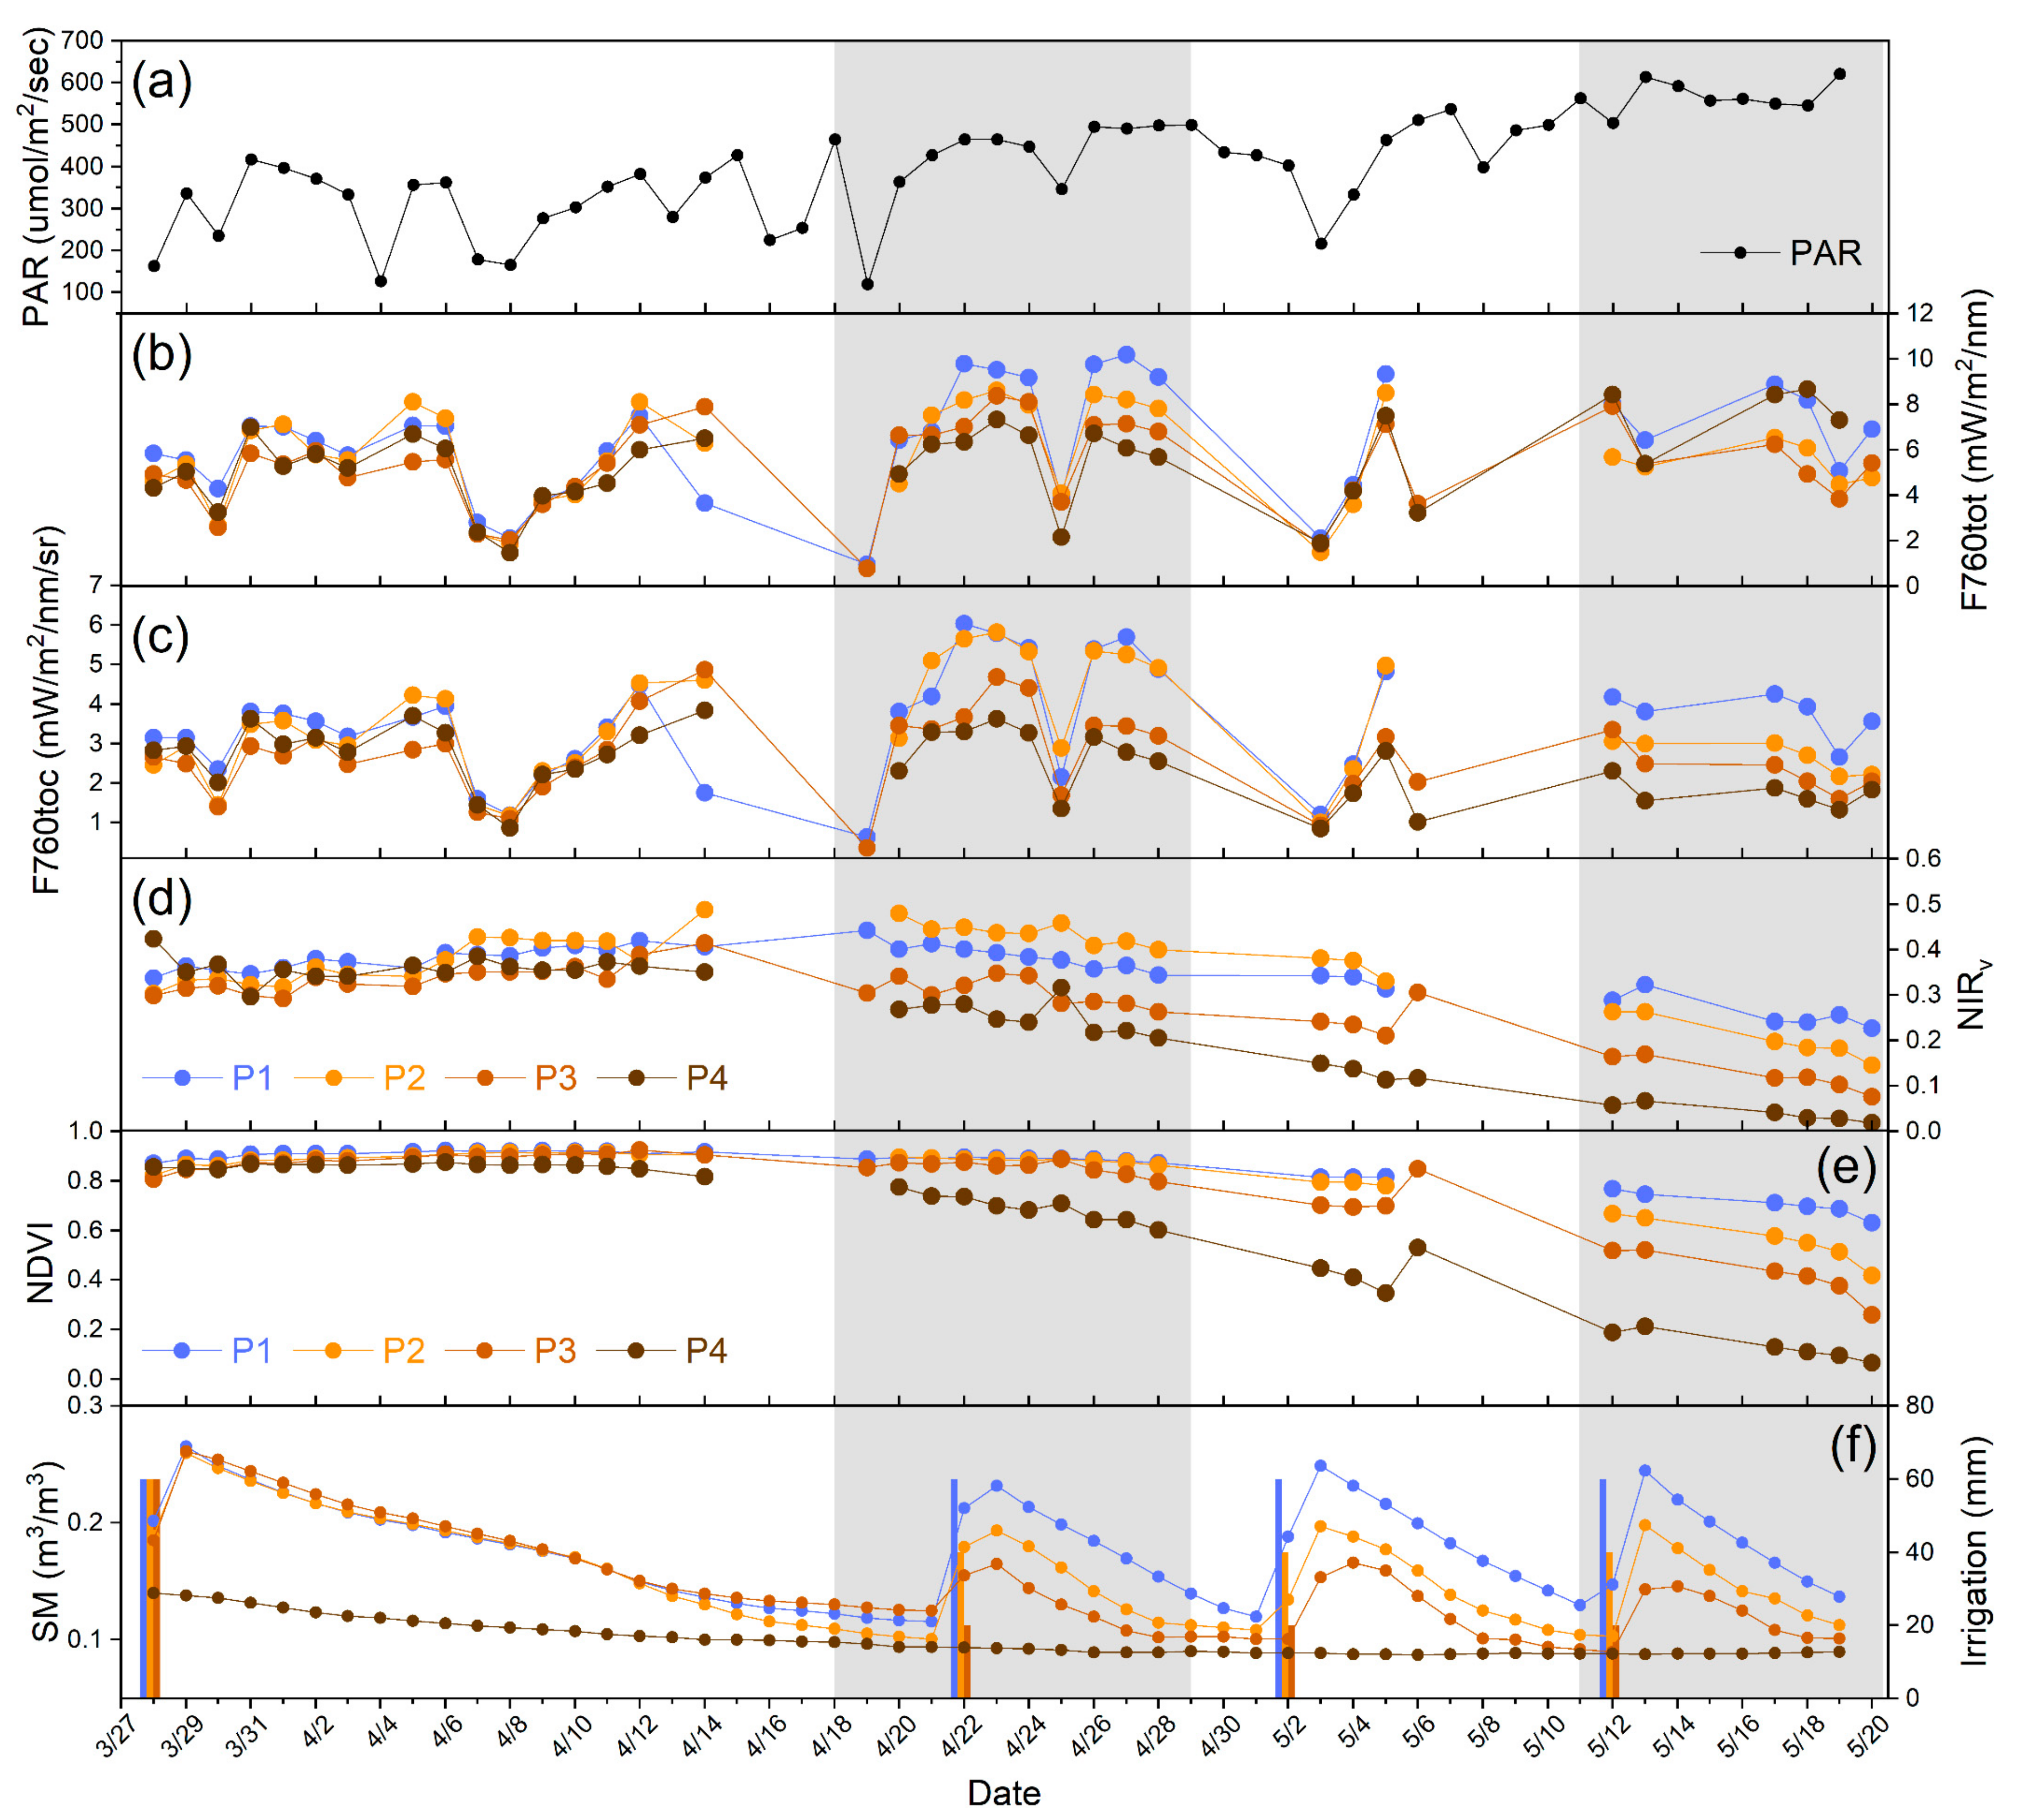
In order to discuss the responses of F760tot to different drought levels over four plots, here, the seasonal patterns of F760tot in comparison with F760toc, the NDVI, and NIRv were analyzed to illustrate the detailed relationships of these parameters with drought development. As shown in Figure 4, the drought levels of the four plots (P1 > P2 > P3 > P4 from wet to drought) was successfully established, thus supporting exploring the utility of F760tot for drought monitoring according to Liu et al. [14]. It was clearly observed that the F760tot, F760toc, and VIs showed different seasonal patterns; that is, the mean values of F760tot as well as F760toc were generally consistent with a trend of going up slightly first (27 March to 24 April) and then going down slightly (24 April to 20 May), and some valleys for F760tot and F760toc were perfectly matched with the low values of SR as mentioned above (Figure 4a–c), indicating the potential links between them. The VI values were characterized as a smoothly declining trend during the growing season (Figure 4d,e). The different seasonal patterns suggested that the SIF emissions of the wheat were susceptible to the influences of various factors compared with the VIs.
Given the different drought levels, there were similarities and differences between the performance of F760tot as well as F760toc and the VIs in the four plots. As for the similarities, the values of all variables of the four plots exhibited a difference in gradient consistent with the drought level (P1 > P2 > P3 > P4) in the growing season after irrigation, such as in the period of the second rectangle (11–20 May). These results indicate that all variables had the potential to respond to the irrigation-induced variations in SM during sustained and prolonged droughts. However, on the contrary, the F760tot values of P4 were higher than its values for P1 in the period of the second rectangle (Figure 4b), which may have been related to premature yellowing of the wheat leaves during long-term droughts. As for the differences, these mainly involved that the response time of F760tot, F760toc, and NIRv to droughts were obviously ahead of the NDVI in the period of the first rectangle (18–29 April), thus indicating the rapid response of F760tot, F760toc, and NIRv to the onset of a drought, and among them, the response patterns of F760toc and F760tot to a drought were quite similar (i.e., responding simultaneously to the second irrigation (22 April) on a daily scale).
The newly proposed NIRv index appeared to respond more rapidly to droughts than the NDVI, but the magnitudes of its values of P1 and P2 were opposed to the different drought levels between them, and the order of NIRv values matched with the drought levels until the third irrigation. That aside, a rapid response difference between F760tot, F760toc, and the NDVI for the irrigation-induced variation of SM was also observed. For instance, a sudden rise happened with F760tot and F760toc of the four plots after irrigation, especially in the second irrigation (22 April to 20 May), while the values of the NDVI showed a smooth trend, indicating an accumulative effect of the drought. Conclusively, it could be inferred that both F760tot and F760toc had an edge over the VIs in the early detection of droughts.
Additionally, the seasonal patterns of AF76toc and AF76tot (SIF/PAR, normalized by PAR) under different intensities of droughts were also analyzed. Overall, SIF/PAR showed similar trends of change with those of SIF (Figure 5); that is, its values for the four plots were generally directly proportional to the drought levels. Specifically, as shown in Figure 5a,b, the fluctuation of SIF/PAR was reduced after eliminating the effect of PAR on SIF. In the first rectangle of two irrigations, the AF760 values of the four plots were displayed in the order of P2 > P1 > P3 > P4 for AF760toc and P1 > P2 > P3 > P4 for AF760tot. In the second rectangle of the four irrigations, the AF760 values of the four plots were shown in the order of P1 > P2 > P3 > P4 for AF760toc and P1 > P4 > P2 > P3 for AF760tot.
In order to further investigate the impact of F760tot on droughts, the drought-induced decreases, especially those caused by SM, in the NDVI, NIRv, F760toc, and F760tot between P1 and the other plots are explored in Figure 6. The theoretical basis for this analysis was that the field experiment took the SM as the control condition, and other properties such as the illumination, temperature, and wheat of the four plots were basically similar. Therefore, the differences for P1 and the other plots directly represented the impact of SM droughts on different variables. As shown in Figure 6, the drought-induced decreases of the four variables gradually increased along with the aggravation of the drought, ranging from 40% to 90%. In the same intensities of droughts, the drought-induced decreases of the four variables also gradually increased as the drought progressed, except for F760tot in an extreme drought.
As for the NDVI, it exhibited a later response to the onset of a drought than other variables and decreased more dramatically for the long-term drought than SIF, particularly in extreme droughts. As for NIRv, it seemed to have a compromise in performance between the SIF and NDVI in early drought monitoring, and among these four variables, the drought-induced decreases of NIRv and the NDVI were gradually higher than those of SIF, whereas in a moderate drought, the NIRv values of P2 were conversely higher than those of P1. Given the SIF variables, the F760tot values decreased more than other variables when in response to the onset of a moderate drought, and the decreases of F760tot were slightly less than those of F760toc.

3.2. Relationships between PAR and Growth Parameters with Seasonal F760tot

SIF was increasingly used for crop stress monitoring, but it remained challenging to reveal the effects of the environmental and growth parameters on SIF emissions during long-running droughts. For example, more and more researchers have proven that the PAR is the primary environmental parameter driving SIF variations at different time scales (Yang et al., 2015). As shown in Figure 7, a relatively strong correlation between F760toc and the PAR of four plots (r value = 0.736 for P1) was found, and the correlation coefficients declined with the drought levels (P1–P4, r value: 0.7~0.4). After being obtained by normalizing F760toc for f esc , F760tot appeared to have a stronger correlation relationship with the PAR (r value: ~0.8 for P1), and compared with F760toc, there was only a minimal drop of the r value from 0.799 (P1) to 0.75 (P4), which seemed to suffer fewer effects from the drought for the relationship between F760tot and the PAR. In terms of the APAR, the better correlations between them of P1–P3 were found, whereas in P4, F760tot and the APAR exhibited a weak positive relationship.
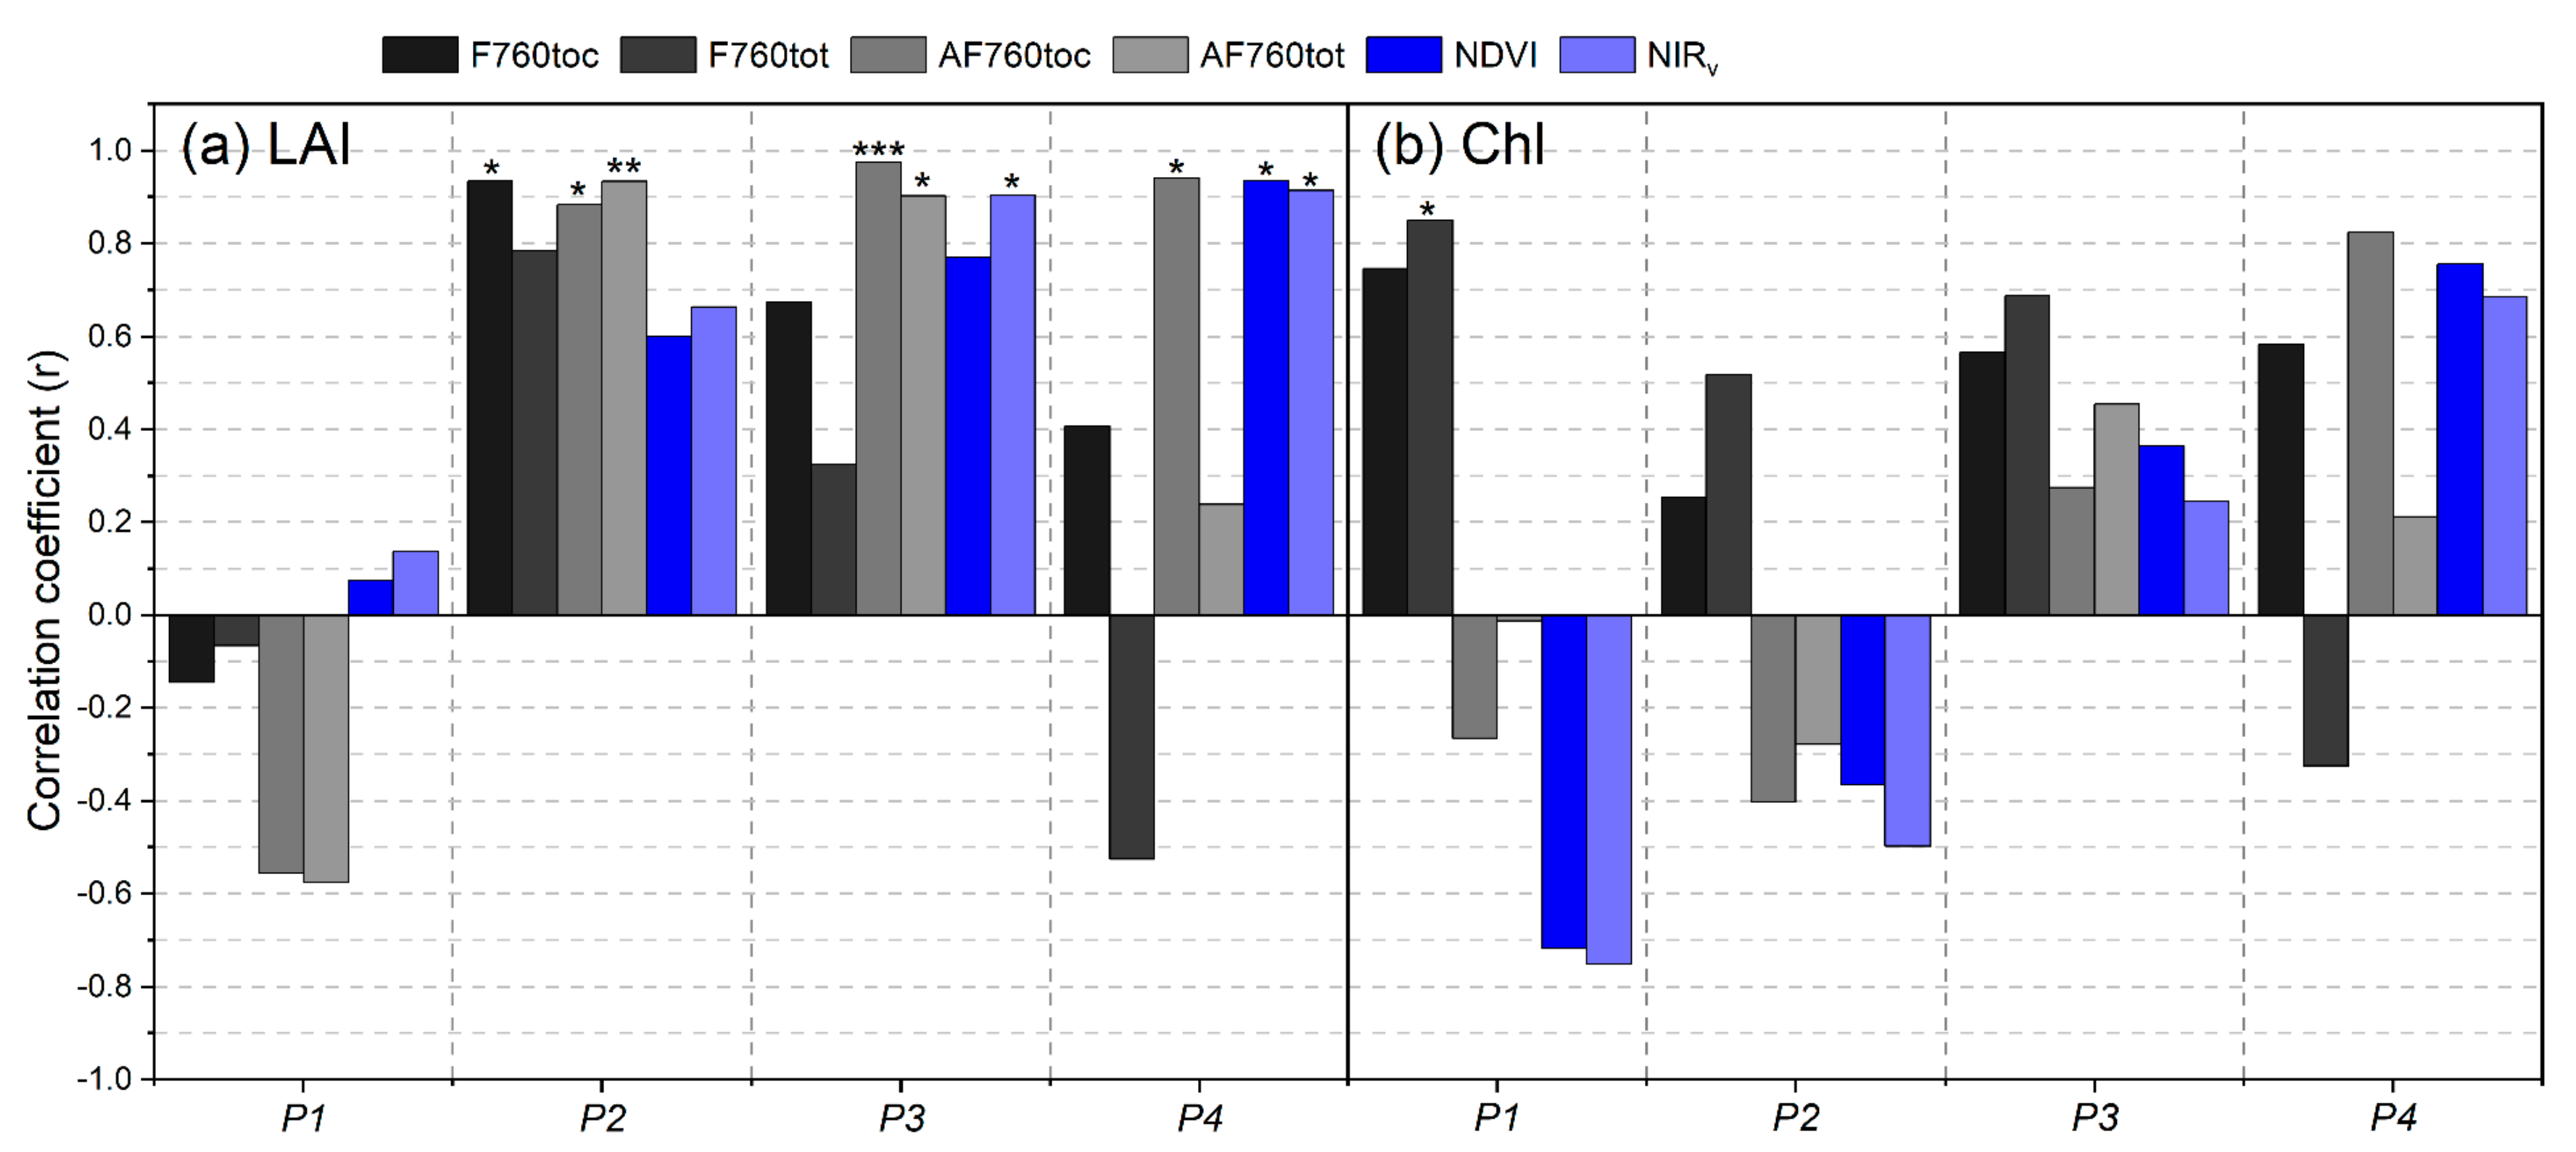
Apart from the PAR, LAI and Chl are two growth parameters that will dramatically reduce when crops experience water stress, and these two parameters also influence the emission of SIF. Therefore, partial correlation analysis was then applied to explore the relationship between the SIF and VIs with LAI and Chl in Figure 8. Here, the LAI and Chl measurements seemed to be insufficient for rigorous analysis, but it is noted that our analyses were considered in the global perspective and focused on the results that had been tested for significance.
First, the average correlation of LAI with SIF (r values > 0.6) was greater than that of Chl with a significant positive correlation, indicating that LAI could have had much more of an impact on SIF emissions than Chl over the growing season under different drought levels. Then, as depicted in Figure 8a for LAI, the impact of LAI on F760toc usually exceeded that of F760tot from P1 to P3. This suggested that SIF was less prone to vegetation canopy structures after downscaling to the leaf level, whereas for P4 in an extreme drought, a similar impact from LAI was observed on F760toc and F760tot. As with AF760toc and AF760tot, the former was more related to LAI from P1 to P2, and the latter was more linked to LAI from P1 to P2. Among them, AF760toc showed the most significant correlation with LAI (r value: 0.92, p < 0.001). As depicted in Figure 8b for Chl, F760tot was more related to Chl than F760toc from P1 to P3, indicating that the former was closely integrated with the plant physiology. F760tot showed the most significant correlation with Chl, whereas the impact of Chl on F760toc was less than that of F760tot for P4 under an extreme drought. As for AF760toc and AF760tot, the impact of Chl on AF760toc was usually superior to that of AF760tot for P1, P2, and P4 instead of P3.

3.3. Relationships of Root Zone Soil Moisture with F760tot

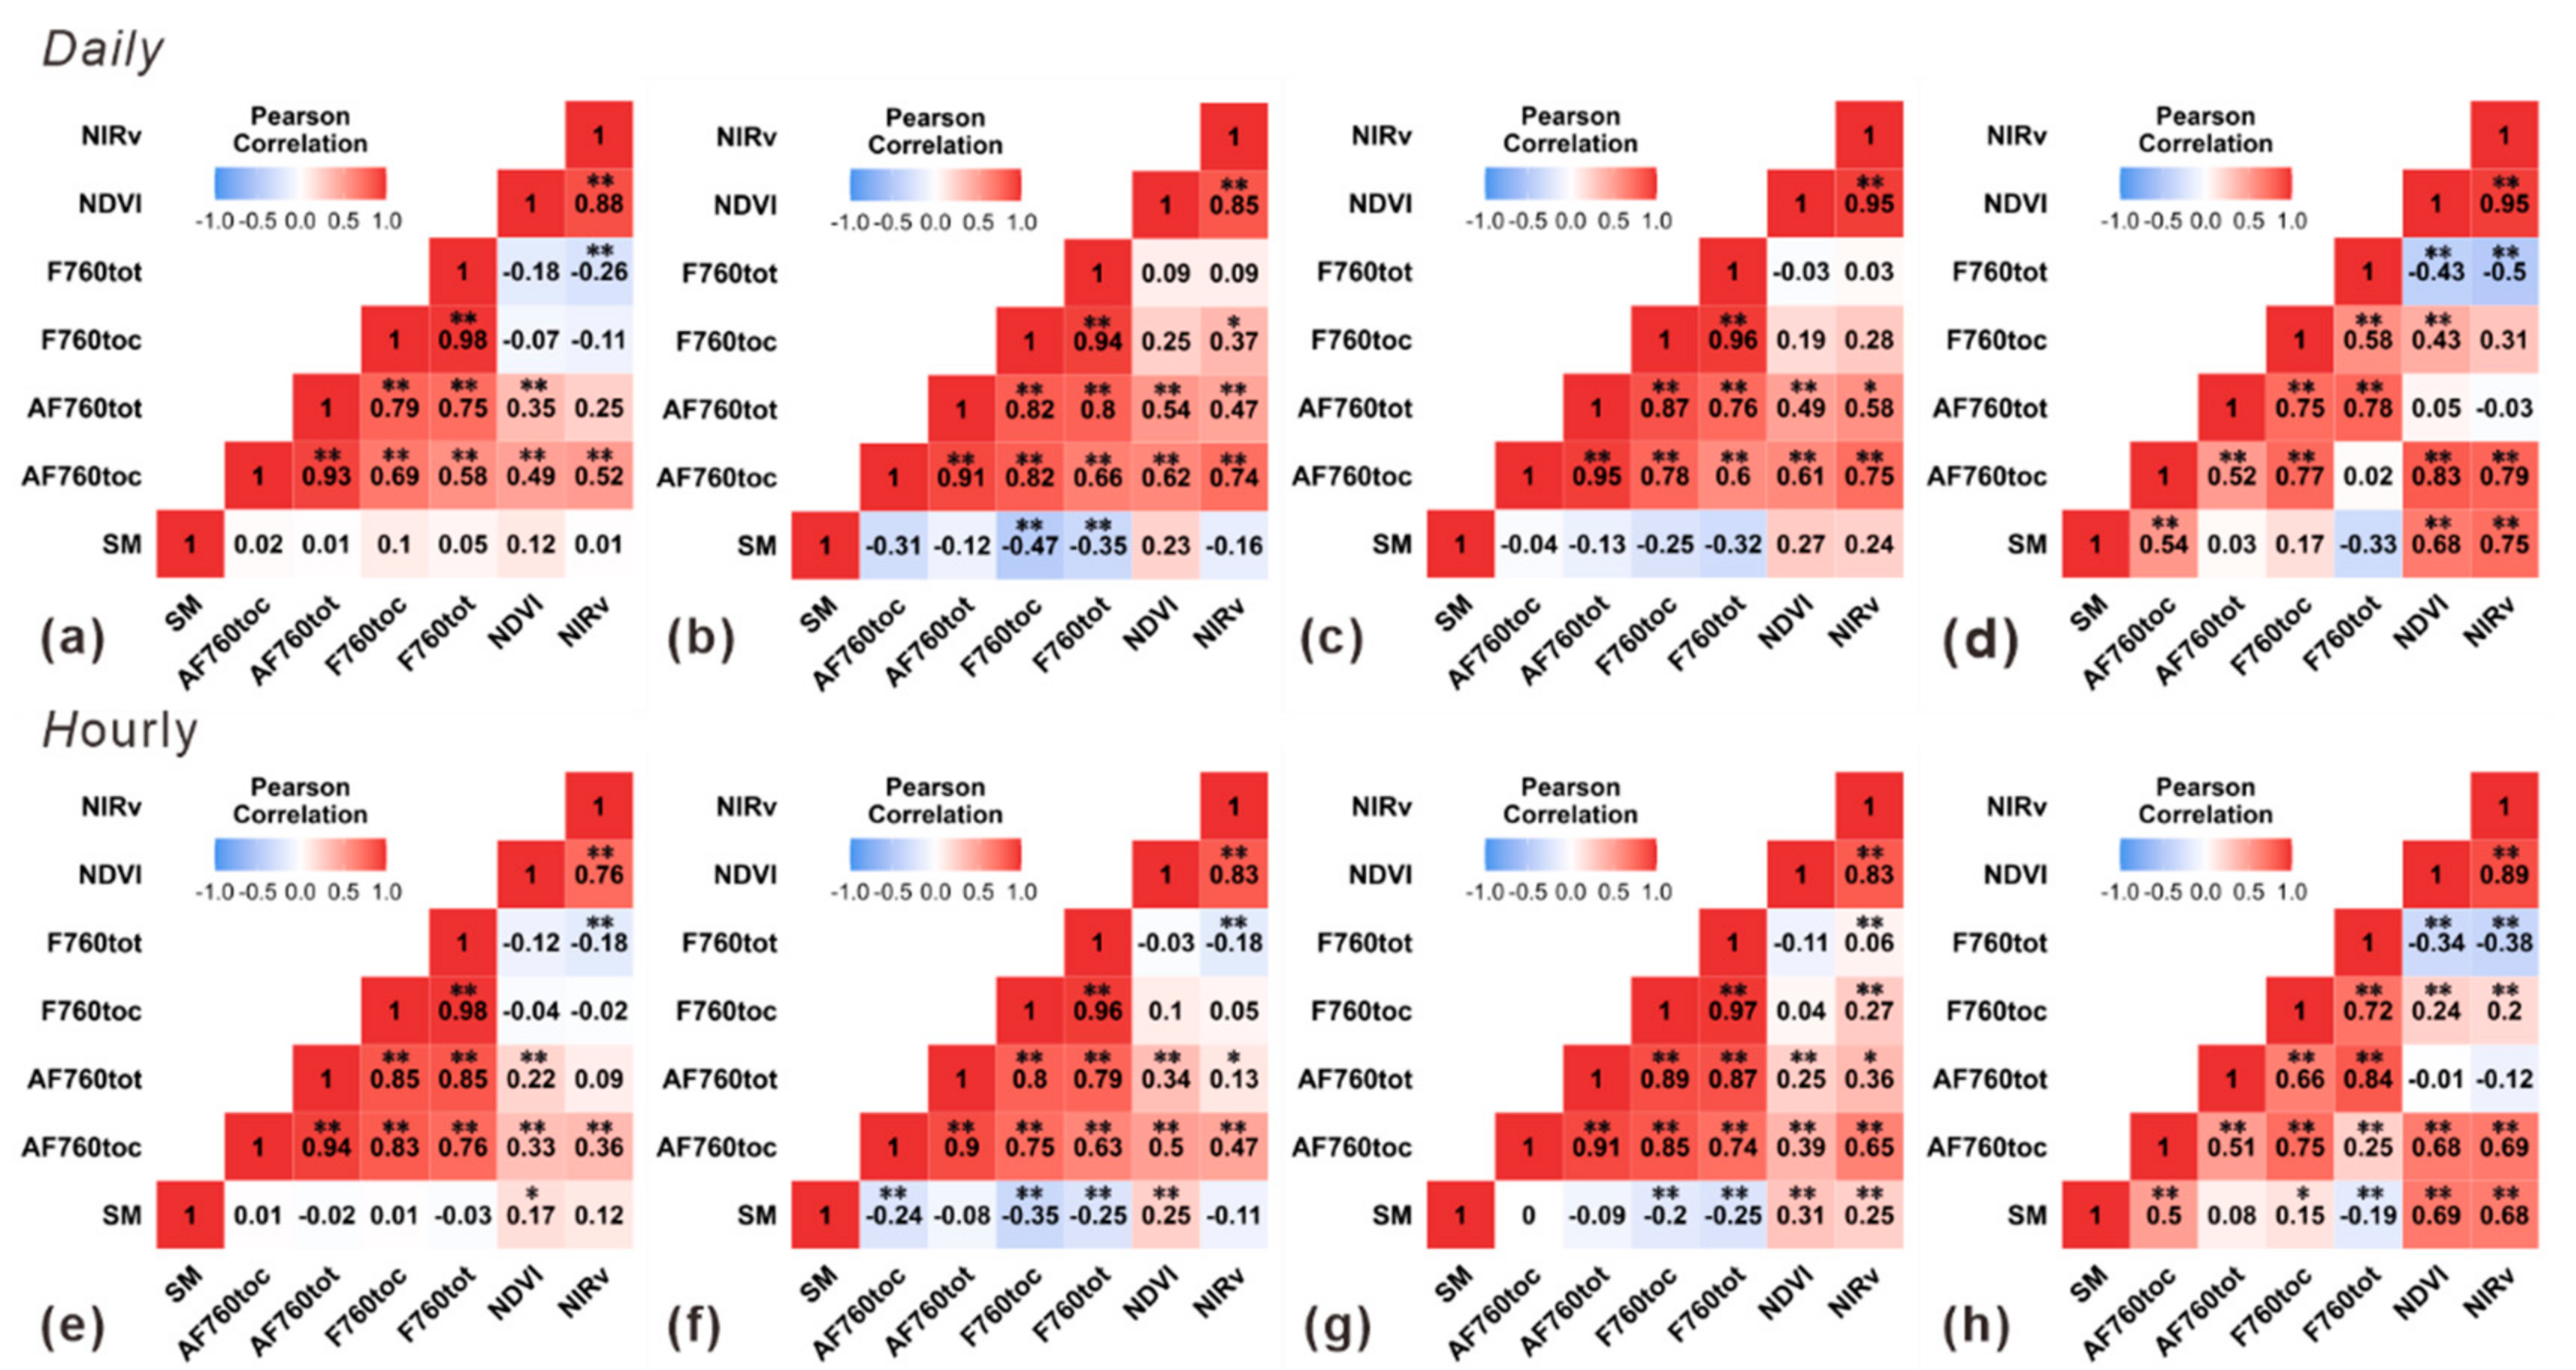
As mentioned in the previous section, the PAR is the common driving force for the dynamics of SIF, whereas in Figure 7, such a driving effect declined for four plots along with the drought levels, thus indicating the involvement of SM in SIF variations. Pearson analysis was then applied to further investigate the relationships between F760tot with SM in different time scales (Figure 9). On the daily and hourly scales, it was obvious that the impacts of SM on F760tot and the VIs were becoming close, along with an increase in drought stress. For P1 with no drought, SM seemed to have little influence on F760tot and the VIs. As the drought intensified from P2 to P4, the response of F760tot and the VIs tended to be different. The correlations between the NDVI and NIRv (r values: 0.68 and 0.75) with SM were positively much greater than those with SIF. As for SIF, only AF760toc exhibited the most positive relationship with SM (r values: 0.54 for P4), and the reason for this may lie in that there were strong correlation relationships between AF760toc and the VIs.
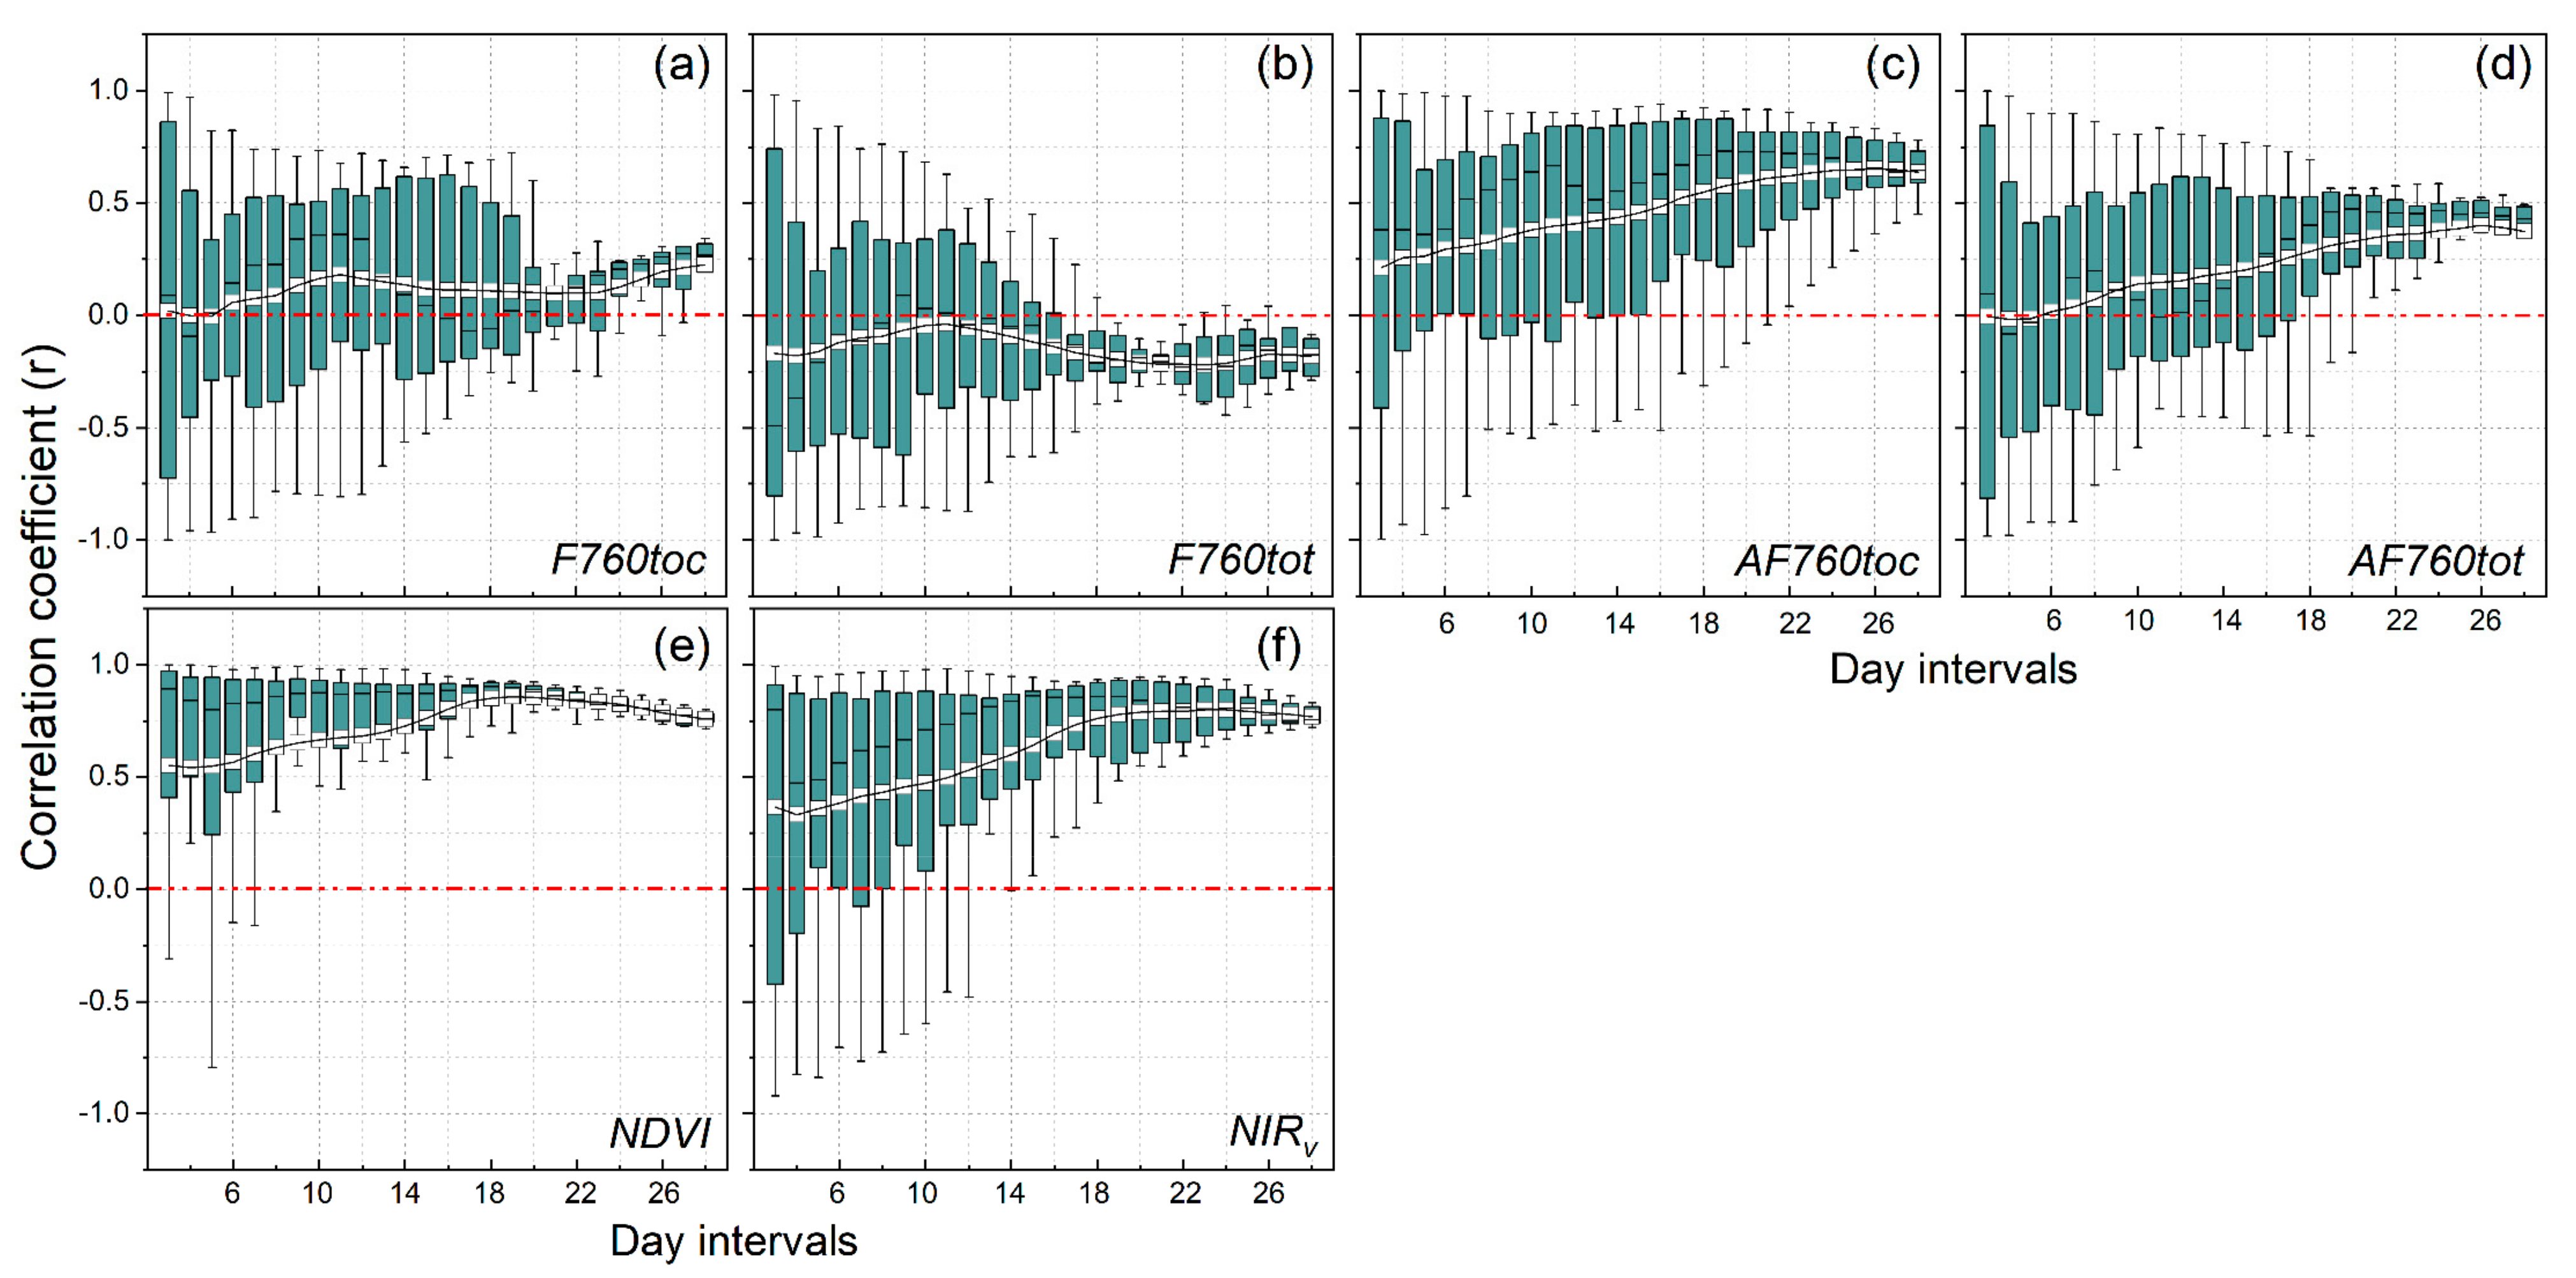
The previous analysis was conducted using the whole data from the growing season. Furthermore, taking P4 as example, the relationships between F760tot and the VIs with SM in the 20-cm layer under different time windows from 3 days to 28 days (Figure 10) were explored, aiming to reveal the distribution of correlation coefficients under a drought. There were similarities and differences between the performances of F760tot and the VIs with SM of P4 (extreme drought). It was confirmed that the correlation coefficients of different parameters showed the larger distribution of numerical data in the short time window and became concentrated along with the increase of time steps. Meanwhile, different variables containing SIF, SIF/PAR, and the VIs had their unique patterns. For example, the relationship of F760tot and F760toc with SM was weak, and AF760 and the VIs showed an increasing and positive trend correlation coefficient with SM.
The correlations of SM in the 20-cm layer (SM) with lagged SIF (F760toc and F760tot) as well with lagged VIs (NDVI and NIRv) were also explored in Figure 11. In order to figure out their relationships under different time windows (from 1 week to 4 weeks), the r values using data from P4 representing an extreme drought were calculated. First, the correlations of SIF-SM and VI-SM presented a steady increasing trend and had little amplitude fluctuation with the increase in the time windows, and the correlations of the latter exceeded that of the former using the data over the growing season, suggesting that the VIs were more applicable for the drought lasting for a long time scale. In the time window of 1 week (Figure 11a), the r values of SIF-SM had a similar pattern to the trigonometric curve, and the r values of VI-SM increased in the range of 8 days and then kept consistent (r values > 0.75). Specifically, the r values of SIF-SM were higher than that of VI-SM when the time lag was ~5 days (r values > 0.7), and the latter exceeded that of the former when the time lag was ~9 days. This further indicated that SIF outperformed the VIs in early drought monitoring. In other panels, especially in Figure 11c,d, it is obvious that the VIs had a strong relationship with SM in different time lags, while F760tot turned out to decouple with SM in time lags of about 3 or 4 weeks.

4. Discussions

Here, the responses of F760tot to different intensities of droughts are investigated, and then the relationships between F760tot and other variables with PAR and growth parameters, especially with root zone soil moisture over a seasonal timescale, are explored. The discussions are presented below.

4.1. Pros and Cons of F760tot for Drought Monitoring

The first main result lied in that F760tot and F760toc were better than the NDVI at early drought monitoring, which is consistent with previous research such as that by Lee et al. [7] and Liu et al. [14]. On this basis, it was further found that both F760tot and F760toc had the advantage of early crop drought monitoring, and they exhibited similar responses to the onset of a drought (Figure 4b,c, Figure 10 and Figure 11). SIFtot was downscaled from the canopy to leaf level and outperformed SIFtoc at estimating the GPP [15]. In general, it should be less influenced by canopy structures and more closely related to the plant physiology, which was consistent with the results of Figure 8. The reason for the similar response of these two is that it was incapable of capturing the onset of a drought earlier in time compared with SIFtoc as observed in nadir viewing, because the latter was representative among different observation directions due to its effectiveness in removing the directional effects and reducing the uncertainties induced by varying sun-target-sensor geometries [18].
However, although the response times of F760tot and F760toc to droughts were similar, further studies (Figure 6) demonstrated that F760tot had the potential for detecting moderate droughts because it had more of a decrease than other variables in moderate droughts. Specifically, SIFtot could represent the overall chlorophyll fluorescence emissions, which could reflect more of a decrease of fluorescence emissions under the same level of drought, therefore possibly improving early monitoring for moderate droughts.
Another main result was that the NDVI and NIRv outperformed F760tot in long-term drought monitoring over the growing season. As depicted in Figure 9, Figure 10 and Figure 11, the r values between the VIs and SM up to ~0.75 were higher than that of F760tot and F760toc, regardless of the different time windows or whether the water stress hysteresis effects were considered. Specifically, it was obvious that due to the weakness of F760tot and F760toc signals and the influence of many factors, the values of F760tot and F760toc fluctuated dramatically during the growing season compared with the VIs in Figure 4 and even showed a slow, regular up and down movement in the time window of 1 week in Figure 11a. The values of the NDVI, in contrast, maintained a smooth, continuous curve in the seasonal scale in Figure 4 and tended to rise during the first 8 days and stabilize in the rest (Figure 11a). Additionally, according to Figure 4 and Figure 5 and previous studies [25], although the relationship of F760toc with PAR gradually decreased with the increasing severity of the drought, a pronounced day-to-day variation in the SIF pattern was highly correlated with that of PAR, so the daily accumulated values of PAR varied in accordance with the fluctuation of SIF during the growing season, thus leading to the weak correlations between SIF with SM.
Here, the drought is defined by the moisture deficits of the root zone. More and more studies have proven that the SIF emissions were sensitive to drought stress, which could be attributed to the decrease in carboxylation capacity and the increase in non-photochemical quenching. For example, compared with VPD, SM is the dominant driver of dryness stress on ecosystem production that is characterized by SIF [43]. Similarly, using SIF as a proxy for GPP, Dang et al. [44] demonstrated that SM plays a more important role, and SIF is very sensitive to aridity gradients in arid and semi-arid ecosystems. The results coincided with our reports. Based on this sensitivity, Yu et al. [45] integrated the relationship of the photosynthesis rate and photosystem II operating efficiency into SUCROS97 and improved the prediction of biomass under a drought. Aside from that, Cannière et al. [46] proposed a framework for parametrizing the water stress function using SIF in the AgroC crop growth model and improved the estimates of actual evapotranspiration during the stressed periods.
In terms of the two results, it was noted that F760tot could respond rapidly to droughts, and the NDVI was more sensitive to long-term water deficits. The main reason for this is that SIF is strongly correlated with photosynthesis and serves as an indicator of photosynthetic activity [47], thus prompting SIF to respond near-instantaneously to rapid adjustments in the photosynthetic machinery [48] and highlighting its potential to improve the present drought detection approach [49]. From the physiological perspective, there are three possible fates for solar radiation absorbed by plant chlorophyll molecules, including photosynthesis (PQ), heat (NPQ), and emitted fluorescence, and the relationship between them is generally competitive but actually neither unique nor simple [50]. For example, the relationships between steady state fluorescence and photochemistry under low and high light (or light-statured conditions with increasing irradiance and moisture) stress were a negative and positive correlation, respectively [51]. Under prolonged drought conditions, a decrease in SM (i.e., a decrease in soil water potential) would induce a decrease in plant water potential in order to absorb as much water as possible from the soil. Moreover, plants need to decrease transpiration to limit their water loss by regulating the opening and closing of the stomata on the leaf surface. However, the closing of the stomata prevents plants from taking up carbon dioxide (CO2), thus limiting the dark reaction of photosynthesis and reducing the photosynthetic rate. It was expected that drought stress significantly decreased the leaf photosynthesis, and here, the SIF emissions also reduced along with the drought levels (Figure 4). Therefore, the relationship between photosynthesis and fluorescence has a positive correlation. Plants can decrease the rate of photosynthesis rapidly in response to a drought, which similarly reduces SIF values quickly based on the positive and strong correlation between them. In contrast, the NDVI was mainly influenced by many factors, such as the chlorophyll content, LAI, and other indirect drivers such as the total plant cover, biomass, plant, and SM. These factors tend to decline gradually under prolonged drought conditions and lead to the late response of NDVI to SM changes reflecting the accumulative effect [52].
There is one important variable of SIF normalized by PAR (AF760) that provides a better understanding of their contributions to F760. It can be found that in extreme droughts (P4), the correlation between AF760 and SM was enhanced at different time scales and time windows compared with F760 (Figure 9, Figure 10 and Figure 11). This finding proves the necessity of normalizing SIF by PAR in drought monitoring. Moreover, the correlation between AF760toc and the growth parameters (Chl and LAI) was enhanced (R2 from 0.4 to 0.85 and R2 from 0.45 to 0.65, respectively), as well as the degree of enhancement improving along with the severity of the drought, which may explain the better correlation between AF760toc and SM than that of F760. This coincides with the findings by Sun et al. [53] that SIF normalized by PAR can improve the net impacts of droughts on SIF.

4.2. Evaluation of NIRv for Drought Monitoring

NIRv, a newly proposed index which aims to address the mixed pixel problem and aspects of photosynthetic capacity [54], is highly correlated with SIF and can be used as the proxy of GPP (Wang et al., 2021) [55]. It has been demonstrated that NIRv and SIF exhibit similar performances for estimating GPP [56], while their differences have not been systematically explored under drought stress [57]. Generally, SIF is strongly driven by PAR or APAR (Figure 7), and NIRv is theoretically independent of PAR or APAR. SIF is less impacted by the soil background, and similarly, NIRv also has the potential for disentangling the vegetation signal from the soil’s brightness and capturing the depth distributions of the canopy’s photosynthetic capacity. Therefore, many studies have been conducted. For example, Wang et al. [58] demonstrated that NIRv and SIF were complementary for GPP estimation; that is, NIRv outperformed the other proxies in non-evergreen sparsely vegetated areas, whereas SIF performed best in high-productivity areas. The main reason for this lies in that the inherent noise associated with SIF retrieval [59] hindered the capturing of GPP dynamics. Aside from that, other NIRv-based variables such as NIRv,Rad, defined as the product of observed NIR radiance and the NDVI, has great potential for estimating the GPP from satellite remote sensing data [60].
As for drought monitoring, there are many indices for monitoring droughts in different scales, and each index has its advantages and limitations. For example, Wei et al. [61] provided a systematic study on evaluating the single drought indices, combined drought indices, and in situ drought indices for monitoring droughts across China. The results indicated that different drought indices have specific performance for drought monitoring in different land use types in China, and this research provided an effective way to explore the potential of different drought indices for monitoring droughts. Orimoloye et al. [62] utilized the Moderate Resolution Imaging Spectroradiometer (MODIS) EVI products to calculate the Vegetation Condition Monitoring Index (VCI), which was proven to be suited for monitoring drought disasters.
Meanwhile, for NIRv, for instance, during the 2012 North American drought, NIRv rapidly declined in parallel with the GPP, while the NDVI showed little deviation compared with non-drought years [63]. During the 2018 drought in northwestern Europe, strong reductions in SIF and NIRv were observed, corresponding to the occurrence of reduced precipitation [64]. Liu et al. [24] selected a severe drought event in 2016 over the Hulun Buir grasslands as an example and explored the potential of SIF and NIRv for drought detection and monitoring. Specifically, many parameters, including the VIs, self-calibrating PDSI, precipitation, SM, surface water storage, and land surface temperature were acquired to detect and characterize the drought event. Meanwhile, according to the composition of SIFtoc, the satellite SIF was used to calculate SIFyield (normalized by APAR), the physiological SIF emission yield, and SIFtot. The results indicated that NIRv outperformed other VIs in drought monitoring, with the largest decrease among the VIs, which was consistent with our study. For lag time analysis, similar results showing that SIF had a shorter lag time than the VIs in responding to meteorological droughts were found. Considering the relationship between NIRv and SM, Buitink et al. [65] used two satellite-derived vegetation indices, NIRv and Vegetation Optical Depth (VOD), and two SM networks for the 2018 agricultural drought in a lowland area. The results indicated that NIRv had the potential to infer the critical SM content. In this study, it was noted that in Figure 4, the NIRv values of four plots appeared to separate in the order of P2 > P1 > P3 > P4 in the first rectangle, thus indicating its greater potential for early drought monitoring than a VI. Furthermore, NIRv had a stronger correlation relationship with SM and the growth parameters in extreme droughts regardless of the different time windows or time lags (Figure 9, Figure 10 and Figure 11). This also highlights its ability for long-term drought monitoring.

5. Conclusions

Here, the continuous ground measurements of SIF and the environmental and crop growth parameters of four plots under different levels of droughts for wheat crops were carried out, thus systematically exploring the potential of F760tot for drought monitoring. The results indicated that:
(1)
F760tot was capable of distinguishing the differences in different drought levels and responded quickly to the onset of moderate droughts compared with other variables, which appeared to have the greatest decrease;
(2)
compared with F760toc, F760tot appeared to be more related to the physiology and was subjected to the canopy structure less, but these relationships varied in extreme droughts; and
(3)
F760tot contained effective information on SM in terms of the correlations in short time lags, and the VIs were more strongly correlated with SM in the longer time lags. The results of this study demonstrate that F760tot was more sensitive to moderate droughts that usually appeared in the early stages of drought stress in plants, which may be attributed to the representation of the total emitted SIF and less influence from the canopy structure.
Conclusively, F760tot has great potential for early drought detection and monitoring. Our findings may contribute to mitigating the risk of agricultural droughts. In addition to these findings, because of the reabsorption effect, further works can be conducted to explore the performance of the total emitted SIF at the red band for drought monitoring. Aside from that, structural equation modeling (SEM) is a statistical technique that can be used to reveal the relationships of the observed and latent variables, and further studies are needed to use this method to illustrate the potential relationships between SIF and other variables, thus contributing to understand its driving factors.

Author Contributions

Conceptualization, J.L., Q.S. and J.W.; data curation, J.L. and Q.S.; funding acquisition, J.W.; investigation, L.L. and W.Z.; methodology, J.L., Q.S., L.L. and W.Z.; project administration, J.W.; resources, J.W. and L.L.; software, J.L. and W.Z.; supervision, J.W.; validation, J.L., Q.S., J.W. and L.L.; visualization, J.L.; writing—original draft, J.L.; writing—review and editing, J.L., Q.S., J.W., L.L. and W.Z. All authors have read and agreed to the published version of the manuscript.

Funding

This research was funded by the National Natural Science Foundation of China, grant numbers 42071401 and 41671424, and the National Key Research and Development Program of China, grant number 2017YFB0504102.

Institutional Review Board Statement

Not applicable.

Informed Consent Statement

Not applicable.

Data Availability Statement

Not applicable.

Conflicts of Interest

The authors declare no conflict of interest.

References

  1. Van Loon, A.F.; Gleeson, T.; Clark, J.; Van Dijk, A.I.J.M.; Stahl, K.; Hannaford, J.; Di Baldassarre, G.; Teuling, A.J.; Tallaksen, L.M.; Uijlenhoet, R.; et al. Drought in the Anthropocene. Nat. Geosci. 2016, 9, 89–91. [Google Scholar] [CrossRef] [Green Version]
  2. Dai, A. Drought under global warming: A review. WIREs Clim. Chang. 2011, 2, 45–65. [Google Scholar] [CrossRef] [Green Version]
  3. Rhee, J.; Im, J.; Carbone, G.J. Monitoring agricultural drought for arid and humid regions using multi-sensor remote sensing data. Remote Sens. Environ. 2010, 114, 2875–2887. [Google Scholar] [CrossRef]
  4. Asner, G.P.; Alencar, A. Drought impacts on the Amazon forest: The remote sensing perspective. New Phytol. 2010, 187, 569–578. [Google Scholar] [CrossRef] [PubMed]
  5. Xu, S.; Atherton, J.; Riikonen, A.; Zhang, C.; Oivukkamäki, J.; MacArthur, A.; Honkavaara, E.; Hakala, T.; Koivumäki, N.; Liu, Z.; et al. Structural and photosynthetic dynamics mediate the response of SIF to water stress in a potato crop. Remote Sens. Environ. 2021, 263, 112555. [Google Scholar] [CrossRef]
  6. Frankenberg, C.; Fisher, J.B.; Worden, J.; Badgley, G.; Saatchi, S.S.; Lee, J.; Toon, G.C.; Butz, A.; Jung, M.; Kuze, A.; et al. New global observations of the terrestrial carbon cycle from GOSAT: Patterns of plant fluorescence with gross primary productivity. Geophys. Res. Lett. 2011, 38, L17706. [Google Scholar] [CrossRef] [Green Version]
  7. Lee, J.; Frankenberg, C.; van der Tol, C.; Berry, J.A.; Guanter, L.; Boyce, C.K.; Fisher, J.B.; Morrow, E.; Worden, J.R.; Asefi, S.; et al. Forest productivity and water stress in Amazonia: Observations from GOSAT chlorophyll fluorescence. Proc. R. Soc. B 2013, 280, 20130171. [Google Scholar] [CrossRef] [Green Version]
  8. Fabrice, D.; Yves, G.; Sébastien, C.; Antoine, F.; Abderrahmane, O.; Albert, O.; Ismaël, M. Continuous Monitoring of Canopy Level Sun-Induced Chlorophyll Fluorescence During the Growth of a Sorghum Field. IEEE Trans. Geosci. Remote Sens. 2012, 50, 4292–4300. [Google Scholar]
  9. Guan, K.; Berry, J.A.; Zhang, Y.; Joiner, J.; Guanter, L.; Badgley, G.; Lobell, D.B. Improving the monitoring of crop productivity using spaceborne solar-induced fluorescence. Glob. Chang. Biol. 2016, 22, 716–726. [Google Scholar] [CrossRef]
  10. Jia, M.; Colombo, R.; Rossini, M.; Celesti, M.; Zhu, J.; Cogliati, S.; Cheng, T.; Tian, Y.; Zhu, Y.; Cao, W.; et al. Estimation of leaf nitrogen content and photosynthetic nitrogen use efficiency in wheat using sun-induced chlorophyll fluorescence at the leaf and canopy scales. Eur. J. Agron. 2021, 122, 126192. [Google Scholar] [CrossRef]
  11. Oscar, P.; Pablo, J.Z.; John, R.M.; Guadalupe, S.; Elias, F. Detection of water stress in orchard trees with a high-resolution spectrometer through chlorophyll fluorescence in-filling of the O2-A band. IEEE Trans. Geosci. Remote Sens. 2005, 43, 2860–2869. [Google Scholar]
  12. Wang, S.; Huang, C.; Zhang, L.; Lin, Y.; Cen, Y.; Wu, T. Monitoring and Assessing the 2012 Drought in the Great Plains: Analyzing Satellite-Retrieved Solar-Induced Chlorophyll Fluorescence, Drought Indices, and Gross Primary Production. Remote Sens. 2016, 8, 61. [Google Scholar] [CrossRef] [Green Version]
  13. Shen, Q.; Liu, L.; Zhao, W.; Yang, J.; Han, X.; Tian, F.; Wu, J. Relationship of surface soil moisture with solar-induced chlorophyll fluorescence and normalized difference vegetation index in different phenological stages: A case study of Northeast China. Environ. Res. Lett. 2021, 16, 24039. [Google Scholar] [CrossRef]
  14. Liu, L.; Yang, X.; Zhou, H.; Liu, S.; Zhou, L.; Li, X.; Yang, J.; Han, X.; Wu, J. Evaluating the utility of solar-induced chlorophyll fluorescence for drought monitoring by comparison with NDVI derived from wheat canopy. Sci. Total Environ. 2018, 625, 1208–1217. [Google Scholar] [CrossRef]
  15. Lu, X.; Liu, Z.; Zhao, F.; Tang, J. Comparison of total emitted solar-induced chlorophyll fluorescence (SIF) and top-of-canopy (TOC) SIF in estimating photosynthesis. Remote Sens. Environ. 2020, 251, 112083. [Google Scholar] [CrossRef]
  16. Liu, L.Y.; Liu, X.J.; Wang, Z.H.; Zhang, B. Measurement and Analysis of Bidirectional SIF Emissions in Wheat Canopies. IEEE Trans. Geosci. Remote Sens. 2016, 54, 2640–2651. [Google Scholar] [CrossRef]
  17. He, L.; Chen, J.M.; Liu, J.; Mo, G.; Joiner, J. Angular normalization of GOME-2 Sun-induced chlorophyll fluorescence observation as a better proxy of vegetation productivity. Geophys. Res. Lett. 2017, 44, 5691–5699. [Google Scholar] [CrossRef]
  18. Hao, D.; Zeng, Y.; Qiu, H.; Biriukova, K.; Celesti, M.; Migliavacca, M.; Rossini, M.; Asrar, G.R.; Chen, M. Practical approaches for normalizing directional solar-induced fluorescence to a standard viewing geometry. Remote Sens. Environ. 2020, 255, 112171. [Google Scholar] [CrossRef]
  19. Romero, J.M.; Cordon, G.B.; Lagorio, M.G. Modeling re-absorption of fluorescence from the leaf to the canopy level. Remote Sens. Environ. 2018, 204, 138–146. [Google Scholar] [CrossRef]
  20. Liu, X.; Guanter, L.; Liu, L.; Damm, A.; Malenovský, Z.; Rascher, U.; Peng, D.; Du, S.; Gastellu-Etchegorry, J. Downscaling of solar-induced chlorophyll fluorescence from canopy level to photosystem level using a random forest model. Remote Sens. Environ. 2019, 231, 110772. [Google Scholar] [CrossRef]
  21. Zeng, Y.; Badgley, G.; Dechant, B.; Ryu, Y.; Chen, M.; Berry, J.A. A practical approach for estimating the escape ratio of near-infrared solar-induced chlorophyll fluorescence. Remote Sens. Environ. 2019, 232, 111209. [Google Scholar] [CrossRef] [Green Version]
  22. Zhang, Z.; Chen, J.M.; Guanter, L.; He, L.; Zhang, Y. From Canopy-Leaving to Total Canopy Far-Red Fluorescence Emission for Remote Sensing of Photosynthesis: First Results From TROPOMI. Geophys. Res. Lett. 2019, 46, 12030–12040. [Google Scholar] [CrossRef]
  23. Dechant, B.; Ryu, Y.; Badgley, G.; Zeng, Y.; Berry, J.A.; Zhang, Y.; Goulas, Y.; Li, Z.; Zhang, Q.; Kang, M.; et al. Canopy structure explains the relationship between photosynthesis and sun-induced chlorophyll fluorescence in crops. Remote Sens. Environ. 2020, 241, 111733. [Google Scholar] [CrossRef] [Green Version]
  24. Liu, Y.; Dang, C.; Yue, H.; Lyu, C.; Dang, X. Enhanced drought detection and monitoring using sun-induced chlorophyll fluorescence over Hulun Buir Grassland, China. Sci. Total Environ. 2021, 770, 145271. [Google Scholar] [CrossRef]
  25. Yang, X.; Tang, J.; Mustard, J.F.; Lee, J.; Rossini, M.; Joiner, J.; Munger, J.W.; Kornfeld, A.; Richardson, A.D. Solar-induced chlorophyll fluorescence that correlates with canopy photosynthesis on diurnal and seasonal scales in a temperate deciduous forest. Geophys. Res. Lett. 2015, 42, 2977–2987. [Google Scholar] [CrossRef]
  26. James, A.P.; Fred, C.G. The Fraunhofer Line Discriminator MKII-an Airborne Instrument for Precise and Standardized Ecological Luminescence Measurement. IEEE Trans. Geosci. Remote Sens. 1975, 24, 306–313. [Google Scholar]
  27. Meroni, M.; Busetto, L.; Colombo, R.; Guanter, L.; Moreno, J.; Verhoef, W. Performance of Spectral Fitting Methods for vegetation fluorescence quantification. Remote Sens. Environ. 2010, 114, 363–374. [Google Scholar] [CrossRef]
  28. Meroni, M.; Rossini, M.; Guanter, L.; Alonso, L.; Rascher, U.; Colombo, R.; Moreno, J. Remote sensing of solar-induced chlorophyll fluorescence: Review of methods and applications. Remote Sens. Environ. 2009, 113, 2037–2051. [Google Scholar] [CrossRef]
  29. Joiner, J.; Guanter, L.; Lindstrot, R.; Voigt, M.; Vasilkov, A.P.; Middleton, E.M.; Huemmrich, K.F.; Yoshida, Y.; Frankenberg, C. Global monitoring of terrestrial chlorophyll fluorescence from moderate-spectral-resolution near-infrared satellite measurements: Methodology, simulations, and application to GOME-2. Atmos. Meas. Tech. 2013, 6, 2803–2823. [Google Scholar] [CrossRef] [Green Version]
  30. Li, S.; Gao, M.; Li, Z.; Duan, S.; Leng, P. Uncertainty analysis of SVD-based spaceborne far–red sun-induced chlorophyll fluorescence retrieval using TanSat satellite data. Int. J. Appl. Earth Obs. Geoinf. 2021, 103, 102517. [Google Scholar] [CrossRef]
  31. Yang, K.; Ryu, Y.; Dechant, B.; Berry, J.A.; Hwang, Y.; Jiang, C.; Kang, M.; Kim, J.; Kimm, H.; Kornfeld, A.; et al. Sun-induced chlorophyll fluorescence is more strongly related to absorbed light than to photosynthesis at half-hourly resolution in a rice paddy. Remote Sens. Environ. 2018, 216, 658–673. [Google Scholar] [CrossRef]
  32. Chang, C.Y.; Guanter, L.; Frankenberg, C.; Köhler, P.; Gu, L.; Magney, T.S.; Grossmann, K.; Sun, Y. Systematic Assessment of Retrieval Methods for Canopy Far-Red Solar-Induced Chlorophyll Fluorescence Using High-Frequency Automated Field Spectroscopy. J. Geophys. Res. Biogeosci. 2020, 125, e2019J–e5533J. [Google Scholar] [CrossRef]
  33. Asrar, G.; Myneni, R.B.; Choudhury, B.J. Spatial heterogeneity in vegetation canopies and remote sensing of absorbed photosynthetically active radiation: A modeling study. Remote Sens. Environ. 1992, 41, 85–103. [Google Scholar] [CrossRef]
  34. Huemmrich, K.F.; Goward, S.N. Vegetation canopy PAR absorptance and NDVI: An assessment for ten tree species with the SAIL model. Remote Sens. Environ. 1997, 61, 254–269. [Google Scholar] [CrossRef]
  35. Yang, P.; Prikaziuk, E.; Verhoef, W.; van der Tol, C. SCOPE 2.0: A model to simulate vegetated land surface fluxes and satellite signals. Geosci. Model Dev. 2021, 14, 4697–4712. [Google Scholar] [CrossRef]
  36. Sims, D.A.; Gamon, J.A. Relationships between leaf pigment content and spectral reflectance across a wide range of species, leaf structures and developmental stages. Remote Sens. Environ. 2002, 81, 337–354. [Google Scholar] [CrossRef]
  37. Gitelson, A.A.; Peng, Y.; Huemmrich, K.F. Relationship between fraction of radiation absorbed by photosynthesizing maize and soybean canopies and NDVI from remotely sensed data taken at close range and from MODIS 250m resolution data. Remote Sens. Environ. 2014, 147, 108–120. [Google Scholar] [CrossRef] [Green Version]
  38. Tucker, C.J. Red and photographic infrared linear combinations for monitoring vegetation. Remote Sens. Environ. 1979, 8, 127–150. [Google Scholar] [CrossRef] [Green Version]
  39. Rondeaux, G.; Steven, M.; Baret, F. Optimization of soil-adjusted vegetation indices. Remote Sens. Environ. 1996, 55, 95–107. [Google Scholar] [CrossRef]
  40. Stenberg, P.; Mõttus, M.; Rautiainen, M. Photon recollision probability in modelling the radiation regime of canopies—A review. Remote Sens. Environ. 2016, 183, 98–108. [Google Scholar] [CrossRef]
  41. Yang, P.; van der Tol, C. Linking canopy scattering of far-red sun-induced chlorophyll fluorescence with reflectance. Remote Sens. Environ. 2018, 209, 456–467. [Google Scholar] [CrossRef]
  42. Liu, X.; Liu, L.; Hu, J.; Guo, J.; Du, S. Improving the potential of red SIF for estimating GPP by downscaling from the canopy level to the photosystem level. Agric. For. Meteorol. 2020, 281, 107846. [Google Scholar] [CrossRef]
  43. Liu, L.; Gudmundsson, L.; Hauser, M.; Qin, D.; Li, S.; Seneviratne, S.I. Soil moisture dominates dryness stress on ecosystem production globally. Nat. Commun. 2020, 11, 4892. [Google Scholar] [CrossRef] [PubMed]
  44. Dang, C.; Shao, Z.; Huang, X.; Qian, J.; Cheng, G.; Ding, Q.; Fan, Y. Assessment of the importance of increasing temperature and decreasing soil moisture on global ecosystem productivity using solar-induced chlorophyll fluorescence. Glob. Chang. Biol. 2021, 28, 2066–2080. [Google Scholar] [CrossRef]
  45. Yu, S.; Zhang, N.; Kaiser, E.; Li, G.; An, D.; Sun, Q.; Chen, W.; Liu, W.; Luo, W. Integrating chlorophyll fluorescence parameters into a crop model improves growth prediction under severe drought. Agric. For. Meteorol. 2021, 303, 108367. [Google Scholar] [CrossRef]
  46. De Cannière, S.; Herbst, M.; Vereecken, H.; Defourny, P.; Jonard, F. Constraining water limitation of photosynthesis in a crop growth model with sun-induced chlorophyll fluorescence. Remote Sens. Environ. 2021, 267, 112722. [Google Scholar] [CrossRef]
  47. Verrelst, J.; van der Tol, C.; Magnani, F.; Sabater, N.; Rivera, J.P.; Mohammed, G.; Moreno, J. Evaluating the predictive power of sun-induced chlorophyll fluorescence to estimate net photosynthesis of vegetation canopies: A SCOPE modeling study. Remote Sens. Environ. 2016, 176, 139–151. [Google Scholar] [CrossRef]
  48. Porcar-Castell, A.; Tyystjärvi, E.; Atherton, J.; van der Tol, C.; Flexas, J.; Pfündel, E.E.; Moreno, J.; Frankenberg, C.; Berry, J.A. Linking chlorophyll a fluorescence to photosynthesis for remote sensing applications: Mechanisms and challenges. J. Exp. Bot. 2014, 65, 4065–4095. [Google Scholar] [CrossRef]
  49. Zhang, Q.; Zhang, X.; Li, Z.; Wu, Y.; Zhang, Y. Comparison of Bi-Hemispherical and Hemispherical-Conical Configurations for In Situ Measurements of Solar-Induced Chlorophyll Fluorescence. Remote Sens. 2019, 11, 2642. [Google Scholar] [CrossRef] [Green Version]
  50. Wohlfahrt, G.; Gerdel, K.; Migliavacca, M.; Rotenberg, E.; Tatarinov, F.; Müller, J.; Hammerle, A.; Julitta, T.; Spielmann, F.M.; Yakir, D. Sun-induced fluorescence and gross primary productivity during a heat wave. Sci. Rep. 2018, 8, 14169. [Google Scholar] [CrossRef]
  51. Rosema, A.; Snel, J.F.H.; Zahn, H.; Buurmeijer, W.F.; Van Hove, L.W.A. The Relation between Laser-Induced Chlorophyll Fluorescence and Photosynthesis. Remote Sens. Environ. 1998, 65, 143–154. [Google Scholar] [CrossRef]
  52. Ji, L.; Peters, A.J. Assessing vegetation response to drought in the northern Great Plains using vegetation and drought indices. Remote Sens. Environ. 2003, 87, 85–98. [Google Scholar] [CrossRef]
  53. Sun, Y.; Fu, R.; Dickinson, R.; Joiner, J.; Frankenberg, C.; Gu, L.; Xia, Y.; Fernando, N. Drought onset mechanisms revealed by satellite solar-induced chlorophyll fluorescence: Insights from two contrasting extreme events. J. Geophys. Res. Biogeosci. 2015, 120, 2427–2440. [Google Scholar] [CrossRef]
  54. Badgley, G.; Field, C.B.; Berry, J.A. Canopy near-infrared reflectance and terrestrial photosynthesis. Sci. Adv. 2017, 3, 1602244. [Google Scholar] [CrossRef] [Green Version]
  55. Wang, S.; Zhang, Y.; Ju, W.; Qiu, B.; Zhang, Z. Tracking the seasonal and inter-annual variations of global gross primary production during last four decades using satellite near-infrared reflectance data. Sci. Total Environ. 2021, 755, 142569. [Google Scholar] [CrossRef]
  56. Li, X.; Xiao, J.; He, B.; Altaf Arain, M.; Beringer, J.; Desai, A.R.; Emmel, C.; Hollinger, D.Y.; Krasnova, A.; Mammarella, I.; et al. Solar-induced chlorophyll fluorescence is strongly correlated with terrestrial photosynthesis for a wide variety of biomes: First global analysis based on OCO-2 and flux tower observations. Glob. Chang. Biol. 2018, 24, 3990–4008. [Google Scholar] [CrossRef]
  57. He, L.; Wood, J.D.; Sun, Y.; Magney, T.; Dutta, D.; Köhler, P.; Zhang, Y.; Yin, Y.; Frankenberg, C. Tracking Seasonal and Interannual Variability in Photosynthetic Downregulation in Response to Water Stress at a Temperate Deciduous Forest. J. Geophys. Res. Biogeosci. 2020, 125, e2018J–e5002J. [Google Scholar] [CrossRef]
  58. Wang, X.; Biederman, J.A.; Knowles, J.F.; Scott, R.L.; Turner, A.J.; Dannenberg, M.P.; Köhler, P.; Frankenberg, C.; Litvak, M.E.; Flerchinger, G.N.; et al. Satellite solar-induced chlorophyll fluorescence and near-infrared reflectance capture complementary aspects of dryland vegetation productivity dynamics. Remote Sens. Environ. 2022, 270, 112858. [Google Scholar] [CrossRef]
  59. Köhler, P.; Fischer, W.W.; Rossman, G.R.; Grotzinger, J.P.; Doughty, R.; Wang, Y.; Yin, Y.; Frankenberg, C. Mineral Luminescence Observed from Space. Geophys. Res. Lett. 2021, 48, e2021G–e95227G. [Google Scholar] [CrossRef]
  60. Wu, G.; Guan, K.; Jiang, C.; Peng, B.; Kimm, H.; Chen, M.; Yang, X.; Wang, S.; Suyker, A.E.; Bernacchi, C.J.; et al. Radiance-based NIRv as a proxy for GPP of corn and soybean. Environ. Res. Lett. 2020, 15, 34009. [Google Scholar] [CrossRef]
  61. Wei, W.; Zhang, J.; Zhou, L.; Xie, B.; Zhou, J.; Li, C. Comparative evaluation of drought indices for monitoring drought based on remote sensing data. Environ. Sci. Pollut. Res. 2021, 28, 20408–20425. [Google Scholar] [CrossRef] [PubMed]
  62. Orimoloye, I.R.; Belle, J.A.; Ololade, O.O. Drought disaster monitoring using MODIS derived index for drought years: A space-based information for ecosystems and environmental conservation. J. Environ. Manag. 2021, 284, 112028. [Google Scholar] [CrossRef] [PubMed]
  63. Badgley, G.; Anderegg, L.D.L.; Berry, J.A.; Field, C.B. Terrestrial gross primary production: Using NIRV to scale from site to globe. Glob. Chang. Biol. 2019, 25, 3731–3740. [Google Scholar] [CrossRef] [PubMed]
  64. Smith, N.E.; Kooijmans, L.M.; Koren, G.; van Schaik, E.; van der Woude, A.M.; Wanders, N.; Ramonet, M.; Xueref-Remy, I.; Siebicke, L.; Manca, G. Spring enhancement and summer reduction in carbon uptake during the 2018 drought in northwestern Europe. Philos. Trans. R. Soc. B 2020, 375, 20190509. [Google Scholar] [CrossRef]
  65. Buitink, J.; Swank, A.M.; van der Ploeg, M.; Smith, N.E.; Benninga, H.J.F.; van der Bolt, F.; Carranza, C.D.U.; Koren, G.; van der Velde, R.; Teuling, A.J. Anatomy of the 2018 agricultural drought in the Netherlands using in situ soil moisture and satellite vegetation indices. Hydrol. Earth Syst. Sci. 2020, 24, 6021–6031. [Google Scholar] [CrossRef]
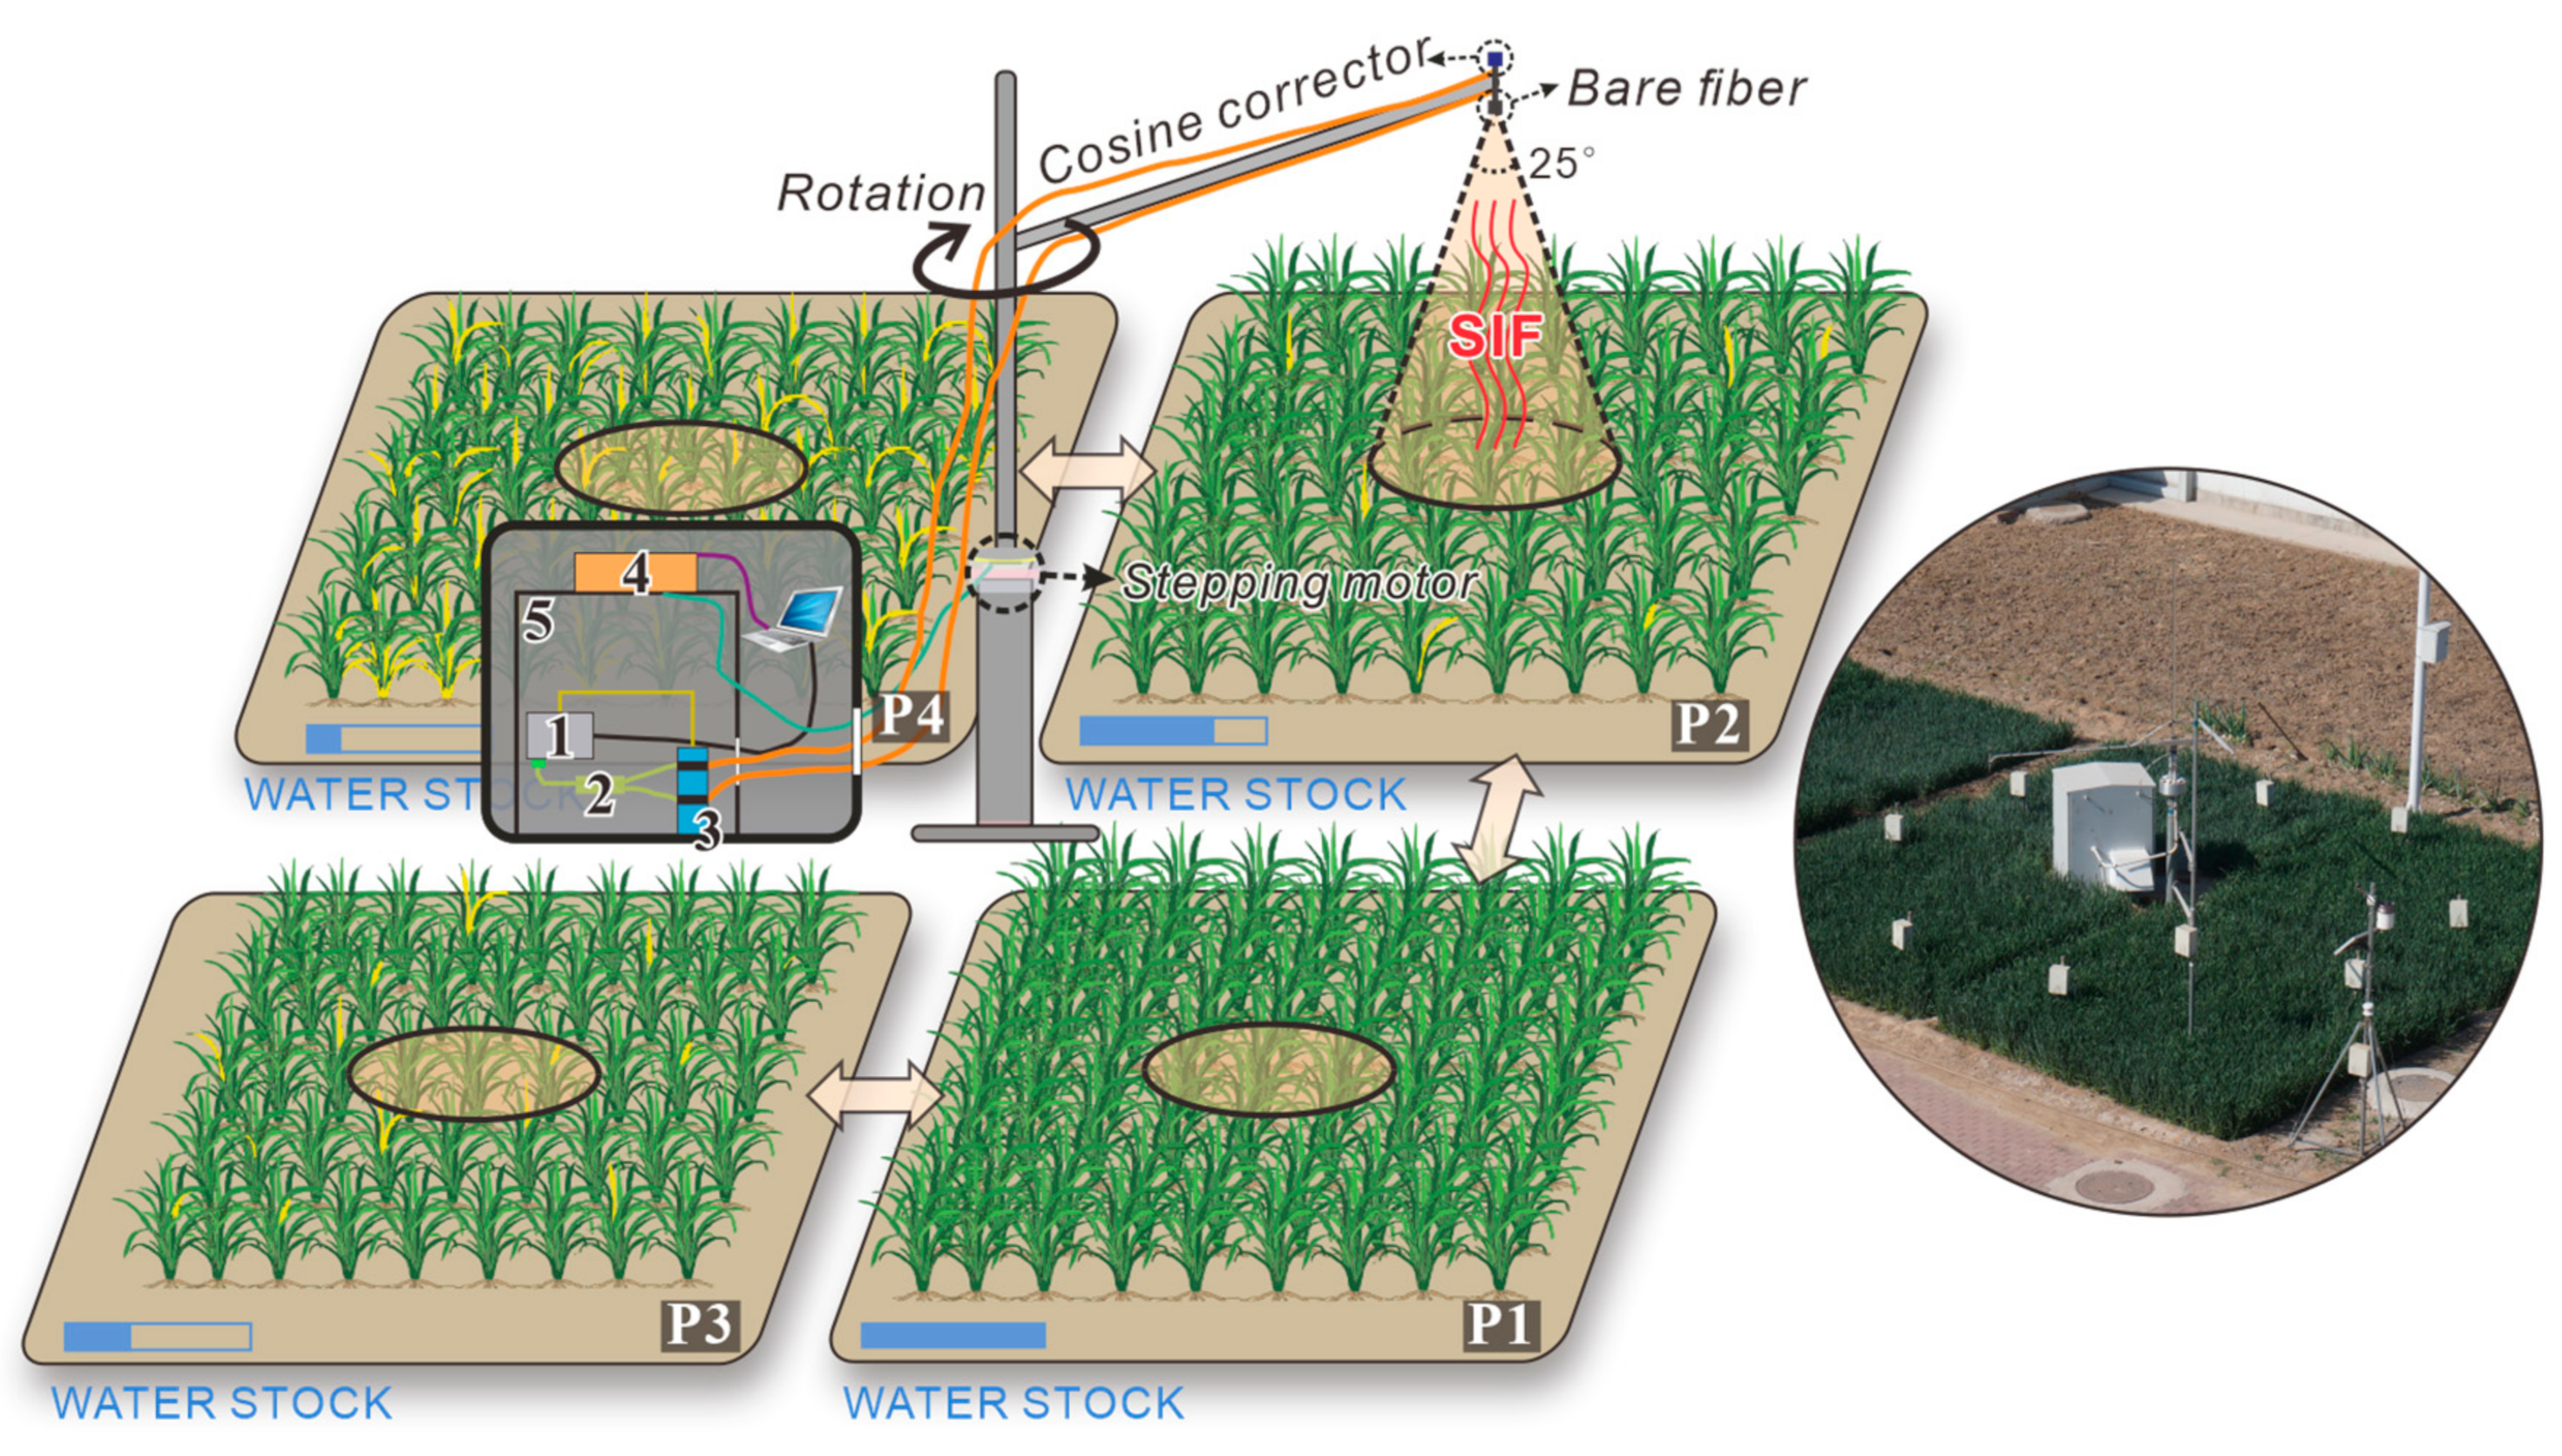
Figure 1. Experimental set-up (left) of solar-induced chlorophyll fluorescence measurements on four plots (P1~P4) with different irrigation treatments and a field photo (right). 1 = HR2000+ spectrometer; 2 = optic fiber; 3 = electronic switch; 4 = manipulator; 5 = incubator.
Remotesensing 14 01357 g001
Figure 3. Overview of the meteorological conditions during the entire measurement campaign (from 28 March 2017 to 19 May 2017): (a) vapor pressure deficit (VPD, kPa), (b) air temperature (Ta, °C), and (c) solar radiation (SR, W/m2). White dash-dotted lines in panels (ac) show several valleys of SR during the growing season.
Remotesensing 14 01357 g003
Figure 4. Seasonal patterns of (a) PAR, (b) F760tot, (c) F760toc, (d) NIRv, (e) NDVI, and (f) SM and irrigation. Each dot line represents the daily mean value of the measurements, with blue dots for plot 1 (P1) and orange to dark black for plots 2–4 (P2–P4). Gray transparent rectangles in panels (ac) indicate the different response period of SIF and VIs to different drought levels.
Remotesensing 14 01357 g004
Figure 5. Seasonal patterns of (a) AF760toc and (b) AF760tot. The color and style of the dot lines and rectangles are the same as Figure 4, and the black dash-dotted lines in panels (a–c) indicate the irrigation for four plots.
Remotesensing 14 01357 g005
Figure 6. Drought-induced decrease in different variables including NDVI, NIRv, F760toc, and F760tot between P1 and (a) P2, (b) P3, and (c) P4.
Remotesensing 14 01357 g006
Figure 7. Relationship between hourly PAR, APAR, and F760toc (blue) or F760tot (golden) in the field campaign collected from four plots (P1–P4). The blue or golden lines with band denote the regression line and 95% confidence interval, respectively. Significance was performed according to two-tailed test (ns: p > 0.05. * p < 0.05. ** p < 0.01. *** p < 0.001).
Remotesensing 14 01357 g007
Figure 8. Partial correlation coefficients (r) of (a,b) with F760toc, F760tot, AF760toc, AF760tot, NDVI, and NIRv based on daily measurements. Significance was performed according to two-tailed test (ns: p > 0.05. * p < 0.05. ** p < 0.01. *** p < 0.001).
Remotesensing 14 01357 g008
Figure 9. Heatmap of the correlation matrix generated by the Pearson correlation coefficient shows the relationships of SM with SIF and VI at seasonal scale (upper panel) and diurnal scale (lower panel) in (a,e) plot 1, (b,f) plot 2, (c,g) plot 3, and (d,h) plot 4. Significance levels of p < 0.05, p < 0.01, and p < 0.001 are indicated by *, **, and ***, respectively.
Remotesensing 14 01357 g009
Figure 10. Boxplots of correlations between (a) F760toc, (b) F760tot, (c) AF760toc, (d) AF760tot, (e) the NDVI, (f) NIRv, and soil moisture in 20-cm soil layer from P4 with different day intervals. Each data represents the daily mean value of the measurements.
Remotesensing 14 01357 g010
Figure 11. Correlations between F760toc, F760tot, NDVI, NIRv, and soil moisture in 20-cm soil layer from P4 with different time windows in time lags of (a) 1 week, (b) 2 weeks, (c) 3 weeks, and (d) 4 weeks. Note that 1–4 weeks represents the temporal resolution of data. The horizontal axis represents the number of days that soil moisture precedes SIF or VIs. Each datum represents the daily mean value of the measurements.
Remotesensing 14 01357 g011
Table 1. Irrigation treatments for four plots.
PlotP1P2P3P4
03/281 m31 m31 m30
04/221 m30.6 m30.4 m30
05/021 m30.6 m30.4 m30
05/121 m30.6 m30.4 m30
Table 2. Parameters of winter wheat measurements at Fangshan Comprehensive Experimental Station in 2017 in Beijing, China.
CategoryParameterMethod or DeviceInterval
SpectrumIrradiance (mW/m2/nm)
Radiance (mW/m2/nm/sr)
HR2000+~6 min
MeteorologyPrecipitation (mm)HOBO U30 USB Weather Station Data Logger, Onset5 min
Pressure (kPa)
Solar radiation (SR, 300–1100, W/m2)
Air temperature (Ta, °C)
Relative humidity (RH, %)
SoilMoisture (20 cm, m3/m3)S-SMC-M005, Onset1 h
RadiationPAR (400–700 nm, umol/m2/s)S-LIA-M003, Onset5 min
VegetationLeaf area index (LAI, m2/m2)LAI-2200C~1 week
Mean tilt angle (MTA, °)
Chlorophyll content (Chl, %)SPAD-502
Relative water content of leaf (RWC, %)Oven drying method
Table 3. Main input parameters for the SCOPE simulations.
ParameterValuesUnitDescription
Cab20, 25, 30, 35, 40, 45, 50, 55, 60, 65, 70, 75, 80μg/cm2Leaf chlorophyll a + b content
Cdm0.012g/cm2Dry matter content
Cw0.009cmLeaf water equivalent layer
N1.4/Leaf mesophyll scattering parameter
SMC8~25m3/m3Soil moisture content
LAI1, 2, 3, 4, 5m2/m2Leaf area index
LIDFa−0.35/Leaf inclination parameter
LIDFb−0.15/Bimodality parameter
FQE0.01/Fluorescence quantum yield efficiency
SZA20, 25, 30, 35, 40, 45, 50, 55, 60degreeSolar zenith angle
Table 4. Mathematical formulations and references for the VIs.
EquationReference
NDVI 705 = NIR Ref Rededge Ref NIR Ref + Rededge Ref (Sims and Gamon, 2002) [36]
WDRVI = 0.1 NIR Ref Rededge Ref 0.1 NIR Ref + Rededge Ref (Gitelson et al., 2014) [37]
NDVI = NIR Ref Red Ref NIR Ref + Red Ref (Tucker, 1979) [38]
OSAVI = 1.6 NIR Ref Red Ref NIR Ref + Red Ref + 0.16 (Rondeaux et al., 1996) [39]
Publisher’s Note: MDPI stays neutral with regard to jurisdictional claims in published maps and institutional affiliations.