Article

Satellite-Based Diagnosis and Numerical Verification of Ozone Formation Regimes over Nine Megacities in East Asia

1
Institute of Environmental Studies, Pusan National University, Busan 46241, Korea
2
Climate & Air Quality Research Department, National Institute of Environmental Research, Incheon 22689, Korea
3
School of STEM, University of Washington Bothell, Bothell, WA 98011, USA
4
Harvard-Smithsonian Center for Astrophysics, Cambridge, MA 02138, USA
5
Department of Atmospheric Sciences, Pusan National University, Busan 46241, Korea
*
Author to whom correspondence should be addressed.
Remote Sens. 2022, 14(5), 1285; https://doi.org/10.3390/rs14051285
Submission received: 28 December 2021 / Revised: 23 February 2022 / Accepted: 3 March 2022 / Published: 5 March 2022

Abstract

:
Urban photochemical ozone (O3) formation regimes (NOx- and VOC-limited regimes) at nine megacities in East Asia were diagnosed based on near-surface O3 columns from 900 to 700 hPa, nitrogen dioxide (NO2), and formaldehyde (HCHO), which were inferred from measurements by ozone-monitoring instruments (OMI) for 2014–2018. The nine megacities included Beijing, Tianjin, Hebei, Shandong, Shanghai, Seoul, Busan, Tokyo, and Osaka. The space-borne HCHO–to–NO2 ratio (FNR) inferred from the OMI was applied to nine megacities and verified by a series of sensitivity tests of Weather Research and Forecasting model with Chemistry (WRF-Chem) simulations by halving the NOx and VOC emissions. The results showed that the satellite-based FNRs ranged from 1.20 to 2.62 and the regimes over the nine megacities were identified as almost NOx-saturated conditions, while the domain-averaged FNR in East Asia was >2. The results of WRF–Chem sensitivity modeling show that O3 increased when the NOx emissions reduced, whereas VOC emission reduction showed a significant decrease in O3, confirming the characteristics of VOC-limited conditions in all of the nine megacities. When both NOx and VOC emissions were reduced, O3 decreased in most cities, but increased in the three lowest-FNRs megacities, such as Shanghai, Seoul, and Tokyo, where weakened O3 titration caused by NOx reduction had a larger enough effect to offset O3 suppression induced by the decrease in VOCs. Our model results, therefore, indicated that the immediate VOC emission reduction is a key controlling factor to decrease megacity O3 in East Asia, and also suggested that both VOC and NOx reductions may not be of broad utility in O3 abatement in megacities and should be considered judiciously in highly NOx-saturated cities in East Asia.

1. Introduction

Ozone (O3) is increasing in East Asia at a higher rate because of the rapid industrialization and urbanization over the years, and has been regulated since the 2000s in East Asian countries [1,2,3,4]. In China, total nitrogen oxides (NOx = NO (nitric oxide) + NO2 (nitrogen dioxide)) have been on a downward trend since 2013 due to China’s implementation of China’s Five-Year Plan (FYP) air pollution control policies during 2013–2017 [1,2]. South Korea has enforced stringent regulation policies for NOx since the early 2000s [3,4], and in Japan, O3 reduction measures have been imposed to reduce traffic emissions since the 1990s, resulting in the reduction of volatile organic compounds (VOCs) and NOx emissions, which have decreased by 50% and 54%, respectively [5]. Nevertheless, a persistent increase in ground-level O3 has been observed in many areas of East Asia [5,6,7]. Studies on the impacts of O3 regulation and emission reduction policies have been conducted targeting O3 abatement over East Asian megacities, including the Pearl River Delta region [8], Hebei Province, [7,9], and Yangtze River Delta region [10] in China, and several megacities in Japan and Korea [11,12]. These studies have shown non-linear changes in response to the reduction of urban emissions.
Recent studies have emphasized efficient measures of O3 reduction over the megacities. Several studies have shown that HCHO increased in urban areas in the summer, especially during 2005–2012, and NO2 decreased over northeast Asia (i.e., the Beijing, Tianjin, and Hebei regions) in the winter during 2013–2018 [13,14]. Both these trends led to an enhancement of the annual average O3 in urban areas of China and Korea, reflecting an NOx-saturated O3 regime. A more pronounced increase in the wintertime O3 was observed in recent years (2013–2018), resulting from the significantly reduced NOx titration effect in winter [13,15] in the aftermath of the rapid decrease in NO2 over megacities in East Asia. Many measurement-based O3 diagnoses at the megacity scale were found to be associated with urban emission policies. However, these studies [12,14,16,17] have limitations because in situ measurements do not fully cover an entire city’s area, covering only the partial targeted areas of megacities [12,18,19,20].
Space-borne observations covering spatially broader areas in East Asia have been developed by utilizing a high-resolution satellite observation. However, satellite measurement is not limited to the surface or tropospheric atmosphere, but it is a column-integrated measurement, which has hindered surface-focused photochemical VOC- or NOx-regime identification. Recently it has become possible to extract near-surface (or tropospheric) O3 from satellite signals due to the help of recent and sophisticated satellite retrieval algorithms, thereby enabling large-scale spatiotemporal analysis of the lower tropospheric atmosphere [21].
Lee et al., (2021) analyzed non-surface O3 from satellite measurements using the ozone-monitoring instrument (OMI) [16], including variations in the HCHO–to–NO2 ratio (FNR) from relevant chemical species, such as NO2 and HCHO, and analyzed 900–700 hPa tropospheric O3 formation regimes targeting megacities in East Asia. The near-surface O3, NO2, and HCHO were diagnosed by Lee et al. (2021) [16] for 2005–2018, and the persistence of NOx-saturation in most megacities was verified against a variety of in situ measurements. They pointed out that, at present, NOx emission reduction under these NOx-saturated conditions in megacities might contribute to increased O3 owing to the relatively weaker titration induced by NOx reduction throughout large urban areas in East Asia. As a follow-up study, the current study aims to verify the NOx-saturated regimes by utilizing a numerical air quality model and evaluating the effectiveness of O3 control strategies in megacities in East Asia.
Analysis of model sensitivity is useful to evaluate the reliability of a hypothesis, such as the efficiency of O3 management planning. In this study, therefore, we carried out model sensitivity tests to verify the O3 formation regimes (NOx- and VOC-limited regimes) over nine megacities in East Asia. We first characterized the 5 yr average spatial FNR distributions for 2014–2018 in East Asia based on the near-surface O3, NO2, and HCHO concentrations taken from OMI. Next, modeling experiments were carried out to ensure that the satellite-based diagnosis of O3 formation was robust in terms of O3 abatements in megacities in East Asia. As a regional air quality model, a 3-D chemistry online model, Weather Research and Forecasting model with Chemistry (WRF-Chem), was employed to simulate recent spatiotemporal variations in FNR. In addition, several VOC and NOx emission reduction sensitivity tests were conducted to diagnose the megacity-centered O3 formation regimes over the Korea–United States Air Quality (KORUS-AQ) campaign period (1 May–12 June). KORUS-AQ aircraft measurements were used to verify the results of the model. The nine megacities that were considered in this study were Beijing (BJ), Tianjin (TJ), Hebei (HB), Shandong (SD), and Shanghai (SH) in China, Seoul (SU) and Busan (BS) in South Korea, and Osaka (OS) and Tokyo (TK) in Japan. The results of this study are expected to lead to the identification of the O3 regime and provide essential data for planning a strategy to reduce the concentrations of O3 in several megacities in East Asia.

2. Data and Methods

2.1. OMI Satellite Measurements

We analyzed the O3 partial column (900–700 hPa) data for the period of 2014–2018 that were retrieved from satellite OMI measurements [21]. The retrieval algorithm and other relevant descriptions of the OMI Ozone Profile (OMPROFOZ) research product, NASA OMI standard NO2 product, and OMI standard HCHO product are described in detail in previous studies [16,21,22,23]. It should be noted that satellite retrievals of ozone measurements (900–700 hPa) have uncertainties ranging from 6 to 35% in the troposphere [24,25,26,27] and are still in development. Despite the limited vertical resolution and precision, satellite observations have been shown to detect ozone enhancements caused by biomass burning over Africa [28], anthropogenic pollution over central and eastern China [29], the transport of anthropogenic pollution in the free troposphere [30], stratospheric ozone intrusion [31], and the Tibetan middle tropospheric ozone minimum in June due to the Asian summer monsoon [32]. In addition, the retrieved ozone profiles have also been used to quantify the global tropospheric budget of ozone and evaluate the effectiveness of the current chemistry–climate models in reproducing the observations of Sauvage et al. (2007) [33], Zhang et al. (2010) [34], and Hu et al. (2017) [35]. The detailed OMI tropospheric NO2 and HCHO column data for the spatiotemporal variations of tropospheric ozone precursors in our analysis were described previously by Lee et al. (2021) [16]. In assessing the changes in the OMI measurements and model results, linear regression analysis was employed to identify the mean and standard deviations of the increasing/decreasing rates.

2.2. Air Quality Model: WRF–Chem

WRF–Chem (ver. 4.0), a three-dimensional regional air quality model, was used for conducting sensitivity tests of the emission reductions of NOx and VOC. Our modeling domain covers the northeast Asian region, including central and eastern China, as illustrated in Figure 1. As a meteorological module, WRF–Chem has a horizontal domain consisting of 174 × 128 grid cells with a grid spacing of 27 km, and its vertical layers are composed of 30 full-sigma levels. The initial and boundary meteorological conditions were obtained from reanalysis data from the National Center for Environmental Prediction (NCEP)’s global forecast system that has a horizontal resolution of 0.25° × 0.25°. In the chemistry module, we employed the Regional Atmospheric Chemistry (RACM) Earth System Research Laboratory (ESRL) scheme [36] for gas-phase chemistry. As a gas–to–aerosol conversion module, we used the updated Modal Aerosol Dynamics model for the Europe/Volatility Basis Set (MADE/VBS) mechanism, including secondary organic aerosol formation processes [37,38]. The WRF–Chem model domains are depicted in Figure 1, and the model configurations for the major physics and chemistry schemes are listed in Table S1.

2.3. Design of Sensitivity Tests and Ascertaining Reduction in Emissions

Several numerical sensitivity simulations were designed to examine the O3 formation regime and their reduction effects on O3 abatement through the WRF–Chem air quality model. The sensitivity experiments included conditional experiments by changing the emissions of precursor gases, NOx, and VOCs alternatively and simultaneously. Table 1 summarizes the specific descriptions of the sensitivity experiments conducted in this study. A control case, together with a series of sensitivity experiments, where NOx and VOC were halved separately, was performed (Table 1). Note that we applied anthropogenic VOC emission reductions with no change in natural VOC emissions. In developing megacity-centered emission control policies, it can be anticipated that prioritizing the control of target species (NOx, VOC, or both) developed in the current study could be of great importance to achieve efficient O3 control policies.
We first carried out a control run (referred to as the base case) as a reference case for comparison with other sensitivity simulations. As the sensitivity test cases, six experiments (EXP1–EXP6) were designed and conducted by alternatively reducing the NOx or VOC emissions, and these were compared with the base case. It should also be noted that, apart from the difference in the emission reductions of the precursors of O3, other factors, such as the meteorological inputs and model settings of the six scenarios, were all identical.
EXP1–3 were conducted to ascertain which of the two individual emission reductions was efficient in East Asian megacities. On the other hand, in EXP4–6, we reduced emissions only in upwind areas (East China), and they were designed to examine the response of O3 in downwind regions to changes in upwind emissions. A previous study confirmed that satellite-based measurements of O3 in the Asia-Pacific region have shown an increasing trend, and therefore, the transport of O3 can have a large impact. As major Chinese cities showed VOC-limited or transition (from NOx to a VOC-limited regime) statuses in a non-linear manner, megacities in downwind areas are influenced by the long-range transport (LRT) of O3. Therefore, EXP4–6 experiments can provide information on non-linear source-receptor relations through the LRT process over East Asia.
As input for anthropogenic emissions in the simulations, the KORUSv5 emission dataset developed by the joint research group of the Konkuk University and the National Institute of Environmental Research [39] was used. These data shared by the KORUS-AQ Campaign Research Group contain the latest information and reflect the emissions with respect to 2015 as the base year [40]. The history of emission assessment from KORUSv2 to KORUSv5 was also found in previous studies [20,40] based on both DC-8 aircraft- and in-situ measurements during the KORUS-AQ campaign. As the biogenic emission module, Model of Emissions of Gases and Aerosols from Nature (MEGAN) version 2.04 [41] was used and it was coupled into the WRF–Chem model. Fire emissions were taken from the Fire INventory of the National Center for Atmospheric Research (FINN) [42] derived from the Moderate Resolution Imaging Spectroradiometer (MODIS) fire count data with a high-resolution (1 km) horizontal grid spacing.
Figure S1 shows the spatial distributions of NOx and VOC emissions. The NOx and VOC emissions listed in the KORUSv5 emission dataset were respectively 22,514 Gg yr.−1 and 28,356 Gg yr.−1 in China, 1076 Gg yr.−1 and 996 Gg yr.−1 in South Korea, and 1771 Gg yr.−1 and 892 Gg yr.−1 in Japan. Thus, the national total VOC emissions were higher than those of NOx emissions only in China among the three countries. In South Korea and Japan, the VOC/NOx ratios were <1 in most regions, indicating high NOx emissions. However, in China, the VOC/NOx ratios were >5, indicating relatively high ratios of VOCs in most regions, except around Hebei province, including BJ, TJ, and HB, where the NOx emissions were high (Figure S1). The total emissions of East China are larger than those of the other regions/countries; therefore, the atmosphere of the downwind regions as well as Eastern China is affected via the LRT process by the policy on regulation of emissions in China. We carried out WRF–Chem model simulations of the changes in O3 concentrations when the NOx and VOC emissions are reduced in upstream areas (i.e., East China) by 50% each (EXP4–6, as listed in Table 1), and investigated the responses in downwind areas, and contrasted with the first three scenarios where we halved precursor emissions over the entire East Asian domain (EXP1–3, as listed in Table 1).

2.4. KORUS-AQ Campaign

The KORUS-AQ campaign has been conducted to observe air quality across the Korean Peninsula and its surroundings. It was carried out as an international, multi-organizational mission created by the National Institute of Environmental Research of South Korea and the National Aeronautics and Space Administration of the United States. The main goal of the KORUS-AQ campaign was to examine the factors contributing to air quality problems over the Korean Peninsula. The KORUS-AQ campaign collected comprehensive and detailed air pollutants including both trace gases and aerosol particle properties from aircraft, ground sites, and ships, with extensive spatial and vertical coverage from 1 May 2016 to 12 June 2016. Further details on the KORUS-AQ campaign can be found in Crawford et al. (2021) [43].

3. Results

3.1. Validation of Models

Park et al. (2021) [40] have evaluated the participating multiple models in KORUS-AQ campaign simulation, including WRF–Chem, Geos–Chem, CAMx, CMAQ, and others for the base case simulations against DC-8 aircraft measurements for the entire period of the KORUS-AQ campaign in 2016. As a participating model in this model intercomparison study, our base case of WRF–Chem simulation in the current study was also evaluated against other models, and aircraft and surface observations [40]. The WRF–Chem model evaluations against surface observations were performed by employing statistical metrics: Pearson correlation coefficient (R), Index of Agreement (IOA), normalized mean bias (NMB), and root–mean–square–error (RMSE). The definitions of R, IOA, NMB, and RMSE can be found in earlier studies [44,45], and the detailed validation results of our WRF–Chem simulations are listed in Table S2.
The WRF–Chem model simulations for the entire campaign period capture the spatiotemporal patterns of O3 against surface observations, with average NMB of −29, 30, and −7% for O3, NO2, and toluene, respectively [40] (Table S2). In addition, this comparison against DC-8 aircraft also demonstrated that the modeled overall O3 vertical variations were satisfactorily captured by the model, with R of 0.67, NMB of −36%, and RMSE of 21.2 ppb, respectively, as indicated in Table S2. The calculated IOA of 0.53~0.73 for O3 is apparently more than 0.5, the level of good grades discussed in earlier studies [46]. Therefore, we do not expect model biases to change the major findings of the present study. Detailed model evaluations for several models (including our simulations) during KORUS-AQ are found in Park et al. (2021) [40]. The results of the comparisons of the WRF–Chem with DC-8 aircraft measurements during the KORUS-AQ campaign period for some case studies can be also found elsewhere [47,48].

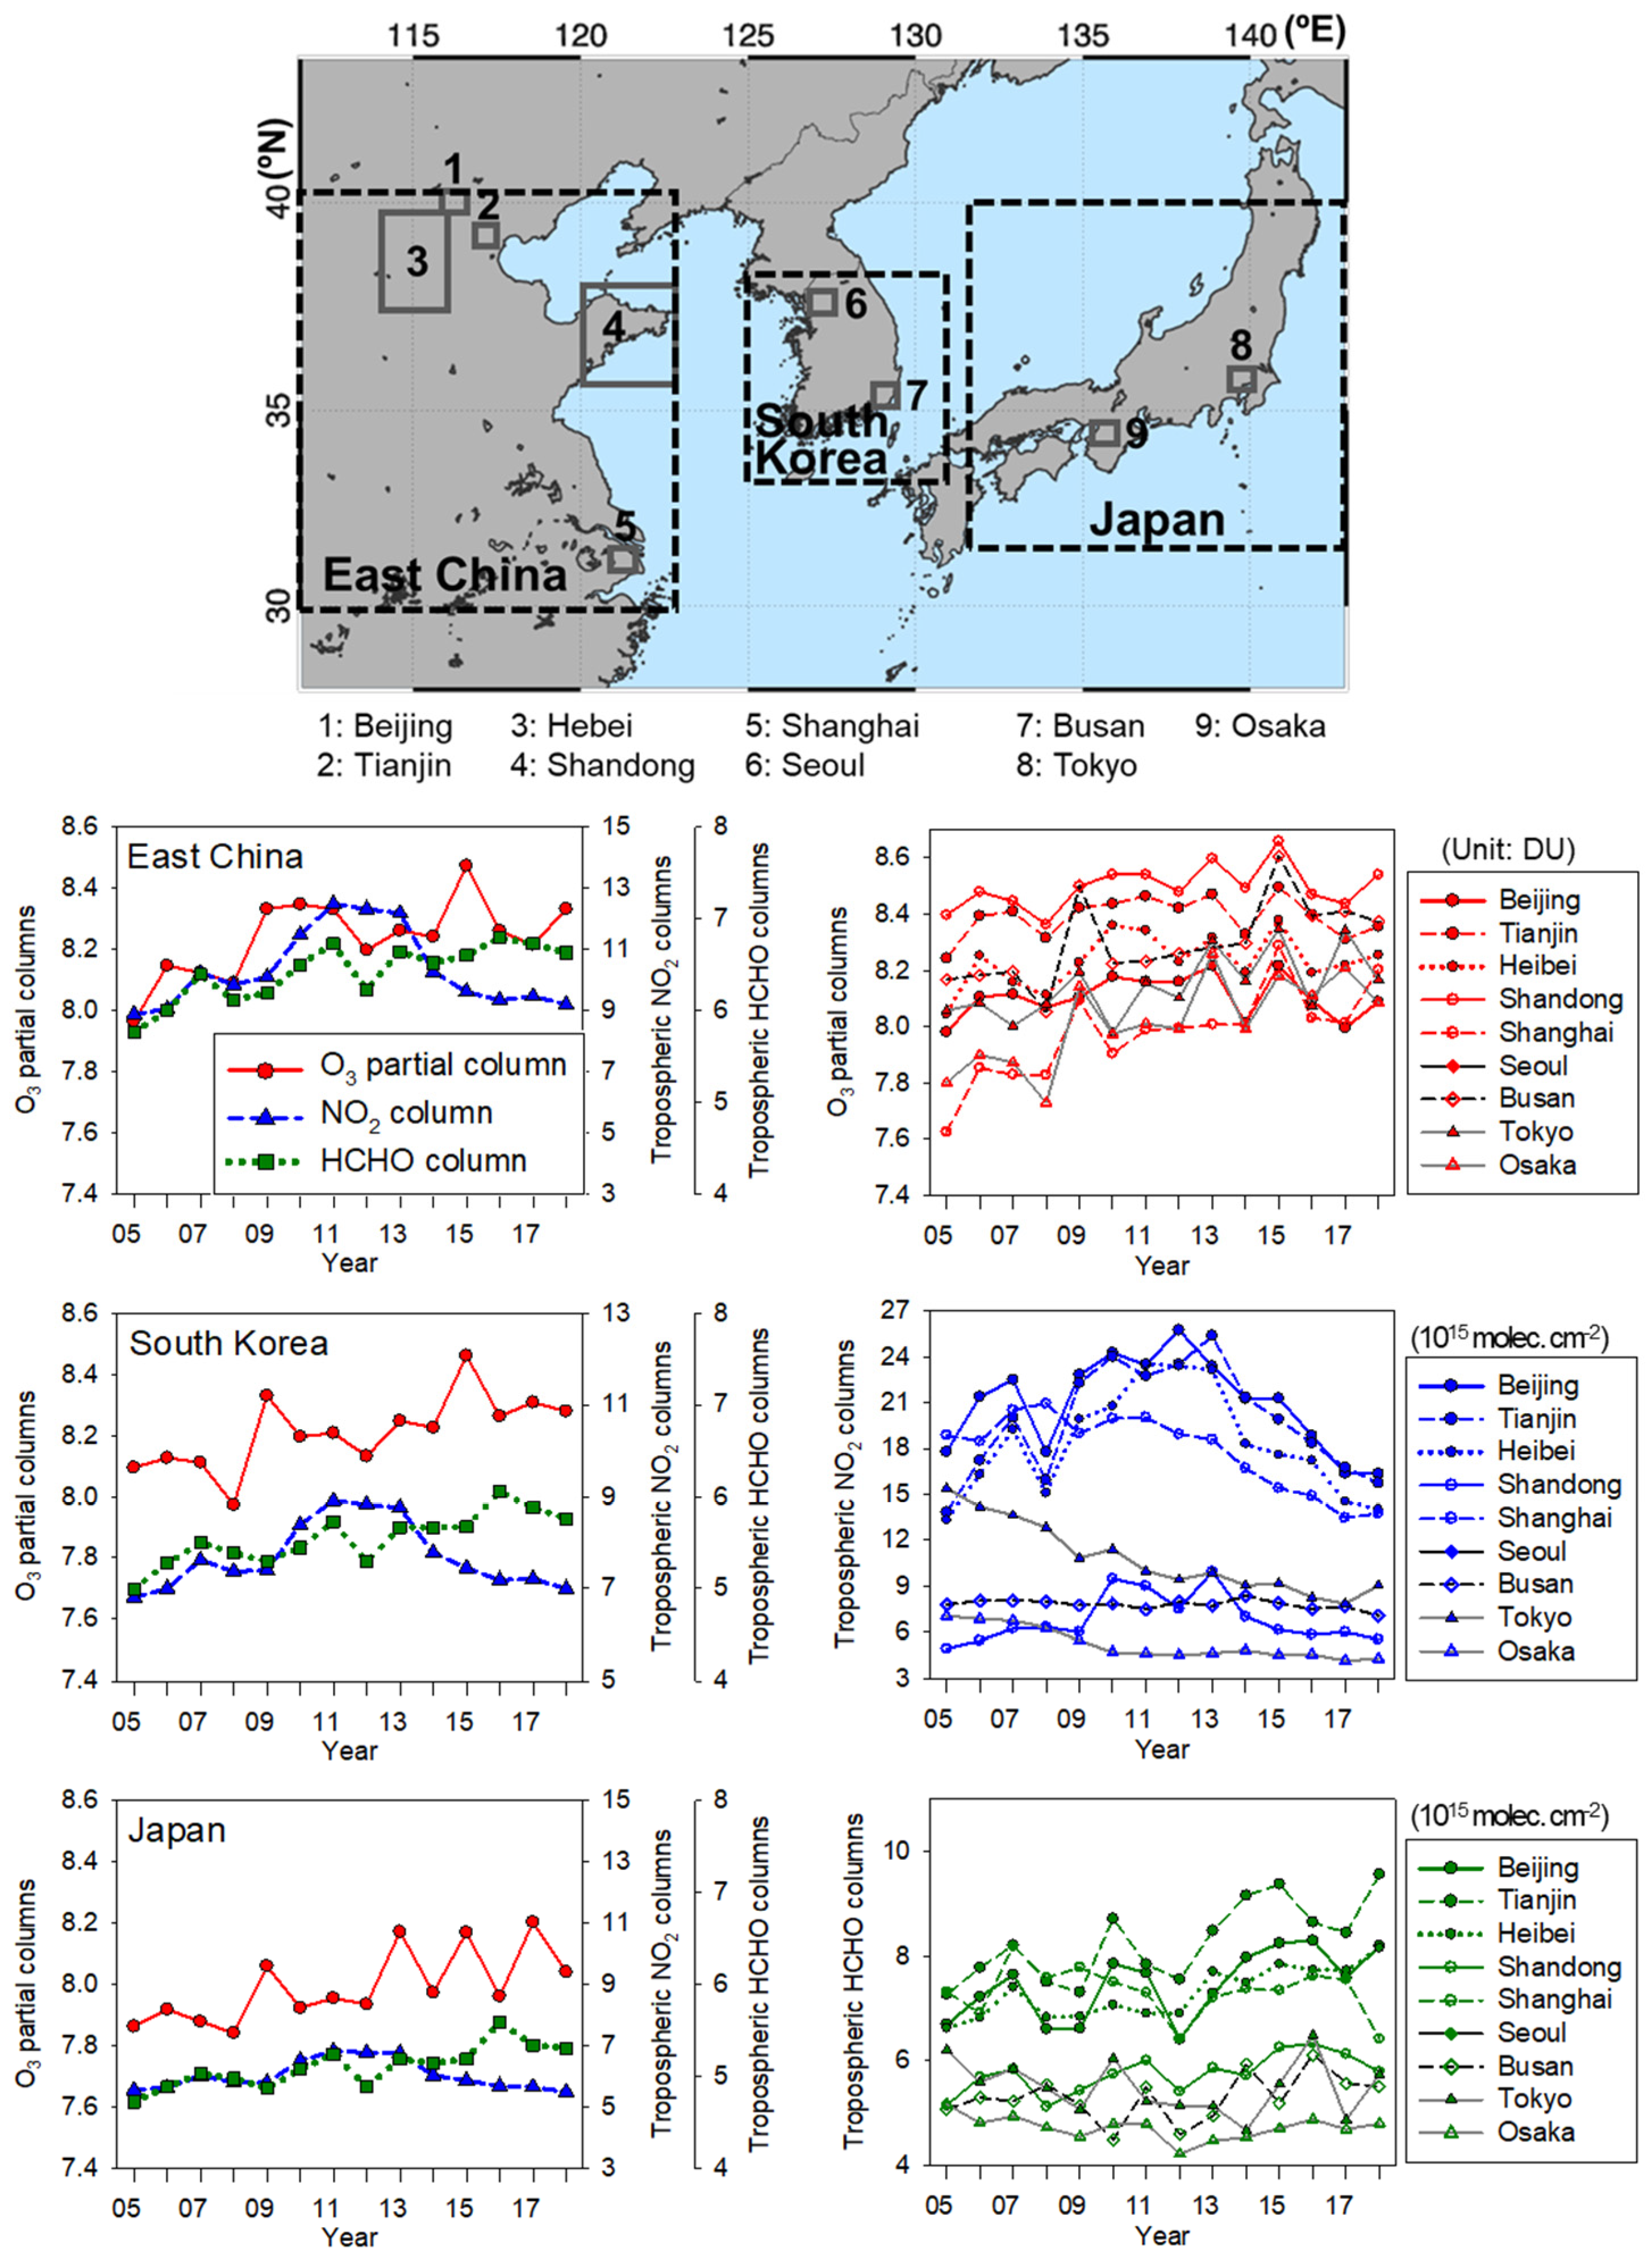
3.2. Satellite Measurements of Near-Surface O3, NO2, and HCHO in East Asia

The relationships between O3, NOx, and VOCs were explored for a recent 5 yr period (2014–2018) from an OMI-based retrieved column. Figure 2 shows the satellite-retrieved 900–700 hPa O3 and its precursor gases, such as NO2 and HCHO, over East Asia. As shown in Figure 2, the domain-averaged near-surface O3 partial columns in three sub-divided areas (East China, Korea, and Japan) show increasing trends, with rates of +0.2 DU (2–3%) per 10 yr for China, South Korea, and Japan. O3 in the nine individual megacities showed similar increasing trends with different concentrations, clearly indicating the increasing trends in all countries, even after 2013, when the severe NOx emission reduction plan was implemented in East China.
The NO2 column increased approximately 1.5 times during 2005–2013 in East China, and showed a decreasing trend since then. It can be clearly seen that the NO2 columns of China decreased owing to the reduction of NOx emissions in 2017, which decreased by ~17% compared to that in 2010 because of strong regulations, particularly in BJ and its surrounding regions from 2013 onward [49,50]. Owing to this regulation policy, not only NO2, but also the emissions of SO2 (~−62%), CO (~−27%), and PM2.5 (~−35%) decreased significantly from 2012 onward. The NO2 concentrations in the nine megacities in East China showed the direct influences of emission regulations, with a significant decrease in NO2 since 2013 (Figure 2). In South Korea and Japan, the range of variations in the NO2 column was relatively low, but it gradually decreased over the last 20 years.
The HCHO column exhibited a minor (but detectable) steadily increasing trend (~5%) in all three countries, with similar change trends, including the decreasing (2011–2012) and increasing (2012–2013) trends in HCHO. However, the emissions of NMVOCs increased by 11% for the same period [50,51], and the HCHO columns showed a small increasing trend. As a result, the ozone column concentrations showed an overall increasing trend, despite the decreasing NO2 emissions caused by emission mitigation since 2013, indicating VOC-limited regimes, especially in the considered megacities in East Asia.

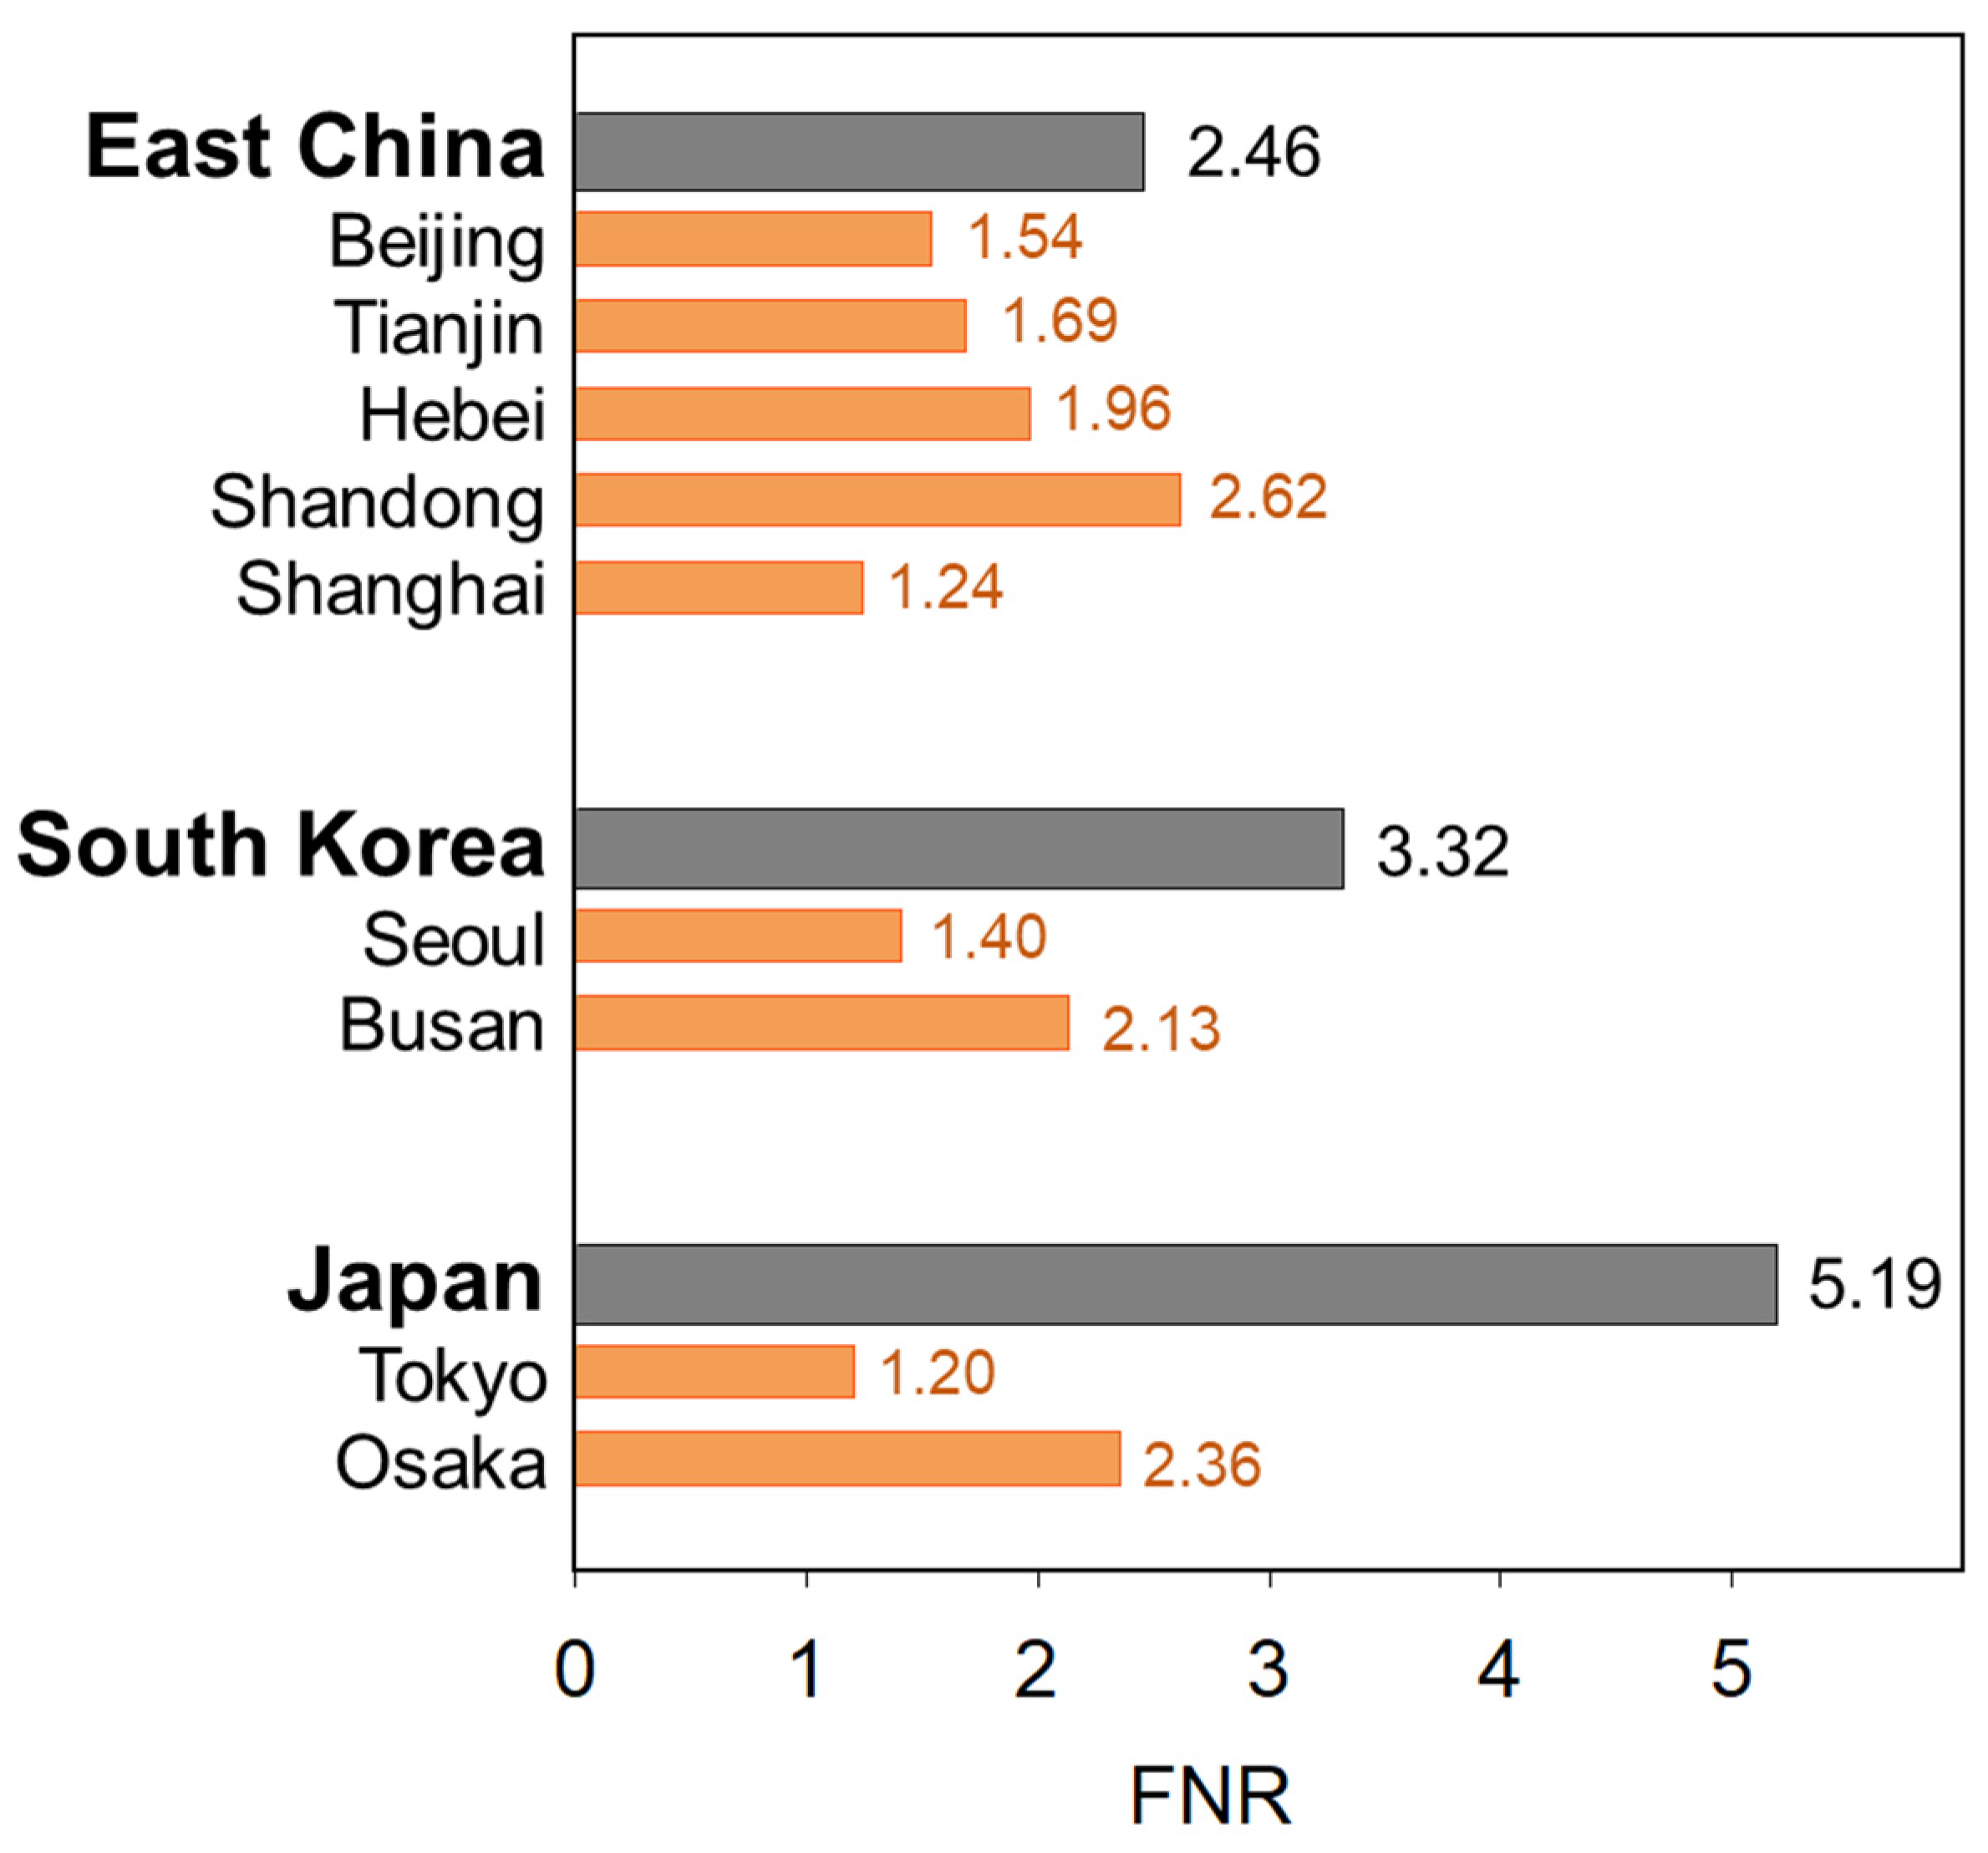
3.3. Formaldehyde–to–NOx Ratio (FNR) of the Nine Megacities in East Asia

Figure 3 shows the spatial distributions of satellite-derived FNR, together with the near-surface O3, NO2 (used as a mark of NOx), and HCHO (used as a mark of VOC), over the recent 5 yr period (2014–2018), and Figure 4 indicates the 5 yr average FNR for the nine megacities. Here, FNR is one of the good indicators for differentiating between NOx-limited and VOC-limited regimes; however, it should be noted that the FNR classification may differ depending on the region and time of day [52,53]. We classified FNR < 1.0 as VOC-limited, FNR > 2.0 as NOx-limited, and 1.0–2.0 as transition phases [16,52] in Figure 3. The domain-averaged FNR over China, South Korea, and Japan derived in the current study was 2.46–5.19 during 2014–2018 (Figure 3), and the resultant FNR in the nine megacities were recognized to be >1.20 (slightly greater than VOC-limited), which were much lower than those averaged in the domain (Figure 4). Therefore, we conventionally used a regime of FNR < 1.5 (or slightly greater) as ‘NOx-saturated’ in this study, where NOx reduction led to O3 increases to explore more extensively the smaller FNRs focusing on the nine megacities. Of the nine megacities, Shanghai (1.24), Seoul (1.40), and Tokyo (1.20) were clearly identified as NOx-saturated regimes, where significantly lower FNR values were shown. In summary, the near-surface O3 columns over main cities in East Asia had an increasing trend, despite the rapid reductions in the NO2 columns with lower FNRs, especially in the main megacities in recent years (Figure 2, Figure 3 and Figure 4).
Lee et al. (2021) [16] described the spatiotemporal FNRs during 2005–2018 over the same area, including the main megacities, and pointed out the rapid shift from an NOx-saturated to an NOx-limited regime, and the main cause was the lower FNR (FNR = 1.79 ± 0.50) than that of domain average (FNR = 3.66 ± 1.40) due to the rapid decrease in NO2 since 2013 with steadily increasing HCHO (see Figure 2, Figure 3 and Figure 4). These tendencies were also consistent with the emission trends of NOx and VOCs [3,4,50]. For example, it was reported that non-methane anthropogenic VOC emissions in China increased by 11% from 2010 to 2017 [50], which is in accordance with the trends in the HCHO columns, as described in this study, showing a low rate of increase caused by insufficient regulations for VOC emissions. These trends and studies suggest NOx-saturated O3 formation regimes with VOC-limited characteristics in the megacities in East Asia, and, as a next step, prioritizing the target precursor is of the utmost importance in determining effective O3 control strategies. One of the most useful approaches in control strategy evaluation is employing sensitivity simulation tests in photochemical air quality models to investigate how O3 concentrations change in response to prescribed decreases in emissions of NOx and/or VOCs (i.e., Table 1).

3.4. Numerical Results on Reduction of Emissions

3.4.1. Experiments EXP1–3

Figure 5 and Table S3 show the results of the WRF–Chem sensitivity modeling by halving the emissions of NOx and VOCs alternatively over the entire modeling domain. As indicated in Figure 5, the NOx reduction case (EXP1) increased O3 by up to 29.6% in all nine megacities, with the exception of SD in China, where O3 decreased slightly by −3.6%. This strongly implies a NOx-saturated regime for all megacities (except for SD), and significant cuts in NOx emissions should be needed to allow the O3 formation regime to shift in megacities, especially in BJ, SH, SU, and TK, which had the lowest FNRs in East Asia, as indicated in Figure 4. This is also consistent with the fact that, when NOx emissions were reduced in the NOx-saturated regime, O3 increased, as demonstrated by the United States Environmental Protection Agency’s empirical kinetic modeling approach [54].
In contrast, the VOC emission reduction case (EXP2) showed the opposite response to that of the NOx emission reduction case (EXP1), showing an O3 decrease of up to ~20.4% in all megacities (Figure 5). In EXP2, O3 reduced by a maximum of −6.6 ppbv (−12.7% at SD) and −6.5 ppbv (−20.4% at SH), and a minimum of −0.6 ppbv (−1.7% at TK), reflecting the NOx-saturated regimes in all nine megacities. This result indicated that immediate VOC emission reduction is a robust abatement strategy to decrease megacity O3 in East Asia.
When both NOx and VOCs were reduced (EXP3), BJ, TJ, and BS showed no specific responses, presumably due to the offset caused by almost equal opposite impacts from either NOx or VOC emission reductions. However, HB and SD showed a considerable O3 decrease of −11.5%, whereas SH, SU, and TK unexpectedly showed an increase in O3 of up to +14.1%. It should be noted in Figure 4 that three FNRs were found to be the lowest at 1.24, 1.40, and 1.20 in the three cities of BJ, SU, and TK among the nine megacities.
Therefore, these significantly lower FNRs (and thus NOx-saturated regime) are expected to increase O3 in some megacities owing to the excessively weakened NOx titration. It could be possible that a decrease in NOx leads to an increase in ozone production efficiency (OPE) through the significantly weakened NOx titration effect, especially in the highly NOx-saturated regime [12], thereby overwhelming the O3 suppression induced by a decrease in VOCs. This suggests that VOC emission reduction is a key control strategy for O3 decrease in megacities in East Asia, while both VOC and NOx reductions may not be useful to abate O3 in some cities with highly NOx-saturated conditions.
However, there are still many uncertainties in modeling studies, and more reliable adequacy of control strategies would be guaranteed under the premise of more reliable emission input data and model validation. However, other megacities, except for the above-mentioned four cities, i.e., TJ, HB, SD, and OS, showed that O3 decreased by −1.4%, −4.6%, −11.5%, and −1.3%, respectively, clearly indicating that the VOC-reduction case (EXP2) showed an O3 decrease efficiency by more than twice compared to both reduction cases (EXP3). Therefore, an immediate or short-term O3 abatement policy can be developed until the time when long-term significant changes in FNR are evidenced in East Asia.

3.4.2. Experiments EXP4–6

In East Asia, westerly wind prevails, and the regional O3 in downwind areas varies by LRT process. Numerous studies have addressed the impacts of the LRT process over the East Asia and Asia-Pacific area [55,56,57,58,59,60,61,62], including the trans-Pacific transport between East Asia and the U.S. [63,64,65,66,67,68,69,70,71]. For this purpose, EXP4–6 were designed to assess the LRT process in East Asia and to estimate how the changes in O3 in South Korea and Japan are simulated to be accompanied by emission reductions in East China, based on emission reductions (Table 1) by halving the emissions only in East China without changing the emissions in South Korea and Japan.
Figure 6 shows the results of EXP4–6 with the tendencies of O3 in nine megacitiesAs expected, there were no differences between experiment sets EXP1–3 and EXP4–6 in the megacities in East China, whereas other megacities in downwind areas exhibited considerable differences. For example, NOx reduction in East China (EXP4) reduced O3 by −2.2 ppbv (−7.6%), −2.4 ppbv (−5.9%), −1.5 ppbv (−3.8%), and −1.7 ppbv (−4.8%) in SU, BU, TK, and OS, respectively, indicating a maximum reduction of almost −10%. Of particular interest is the opposite result to the EXP1 case, where NOx reduction was imposed over the entire East Asian domain. The reduction in the emissions of VOCs in E. China (EXP5) indicated reductions in O3 in downwind areas by −2.1 ppb (−7.2%), −2.2 ppb (−5.4%), −0.9 ppbv (−2.3%), and −0.9 ppbv (−2.5%) in SU, BU, TK, and OS, respectively, indicating small changes in O3 of ~10%, but covering all nine megacities.
When both NOx and VOCs were reduced (EXP6) in East China, O3 was reduced by –3.6 ppbv (−12.3%), −3.9 ppbv (−9.6%), −2.1 ppbv (−5.5%), and −2.3 ppbv (−6.7%) in SU, BU, TK, and OS, respectively, indicating that the reduction efficiencies increased by more than twice those of EXP4 and EXP5, with a maximum reduction rate of up to −12.3% in SU. Therefore, it can be concluded that, in these experiments (EXP4–6), South Korea and Japan showed modest benefits (approximately ~10% O3 decrease) in terms of either NOx or VOC emission reduction, while the case of the reduction of both (EXP6) had a more pronounced impact, with decreases of O3 larger than 10% in downstream areas. EXP6 suggested how the Chinese reduction of precursors emissions can reduce O3 in South Korea and Japan in East Asia.
As pointed out in Section 3.4.1, it was concluded that reducing local VOC emissions is an immediate and effective approach for local areas. EXP4-6 also showed that the O3 changes in downwind areas were accompanied considerably by changes in the precursors of O3 change in the upstream area. Of three tests (EXP4–6), EXP6 with the highest emission reduction efficiency was the most influential; downwind regions had relatively lower emissions of VOC than those in upwind areas, which was different from the NOx-saturated conditions of China, and, as a result, more alleviated O3 production might appear through the LRT process of precursors emitted from China. Therefore, as the regulation policies of East Asia are changing, studies that continuously track the changes in O3 trends from both emission reduction and transboundary processes should be continued to provide feedback to the policy establishment.

4. Discussion and Conclusions

Photochemical O3 formation is influenced by VOC/NOx ratios, and its formation regimes are generally classified as either NOx-limited (or close to VOC-limited) regimes based on non-linear O3–NOx–VOC reactions. The identification of the O3 formation regime is an important tool for making O3-reduction policies, such as NOx vs. VOC control priority. In the current study, we extracted space-borne lower free tropospheric column-integrated O3 using a sophisticated retrieval algorithm and FNR from satellite measurements was used as a proxy variable of the VOC/NOx ratio to characterize O3 formation regimes. Our results estimated from space-borne measurements of the FNR distributions showed NOx-saturation and VOC-sensitive conditions with lower FNR in the nine megacities. We also verified these O3 formation regimes by employing sensitivity tests of photochemical air quality simulations.
For the numerical sensitivity tests, a base run together with six emission reduction simulations (EXP1-6) were employed. EXP1–3 confirmed the satellite-measured FNR characteristics in megacities, which showed that the reduction of VOC emissions (EXP2) in all nine megacities or both NOx and VOC (EXP3) in the cities (except for three cities, i.e., Shanghai, Seoul, and Tokyo) was the best solution for decreasing O3. However, when both NOx and VOC emissions were reduced, three highly low-FNR megacities, i.e., Shanghai, Seoul, and Tokyo, showed increases in O3 via the weakened NOx titration process, which had a larger O3 enhancement influence that was enough to offset, or more than enough to make up for, the O3 suppression caused by the decrease in VOCs. Therefore, it suggests that both reductions may not be of broad utility in O3 abatement over cities with NOx-saturated regimes, such as Beijing and Shanghai, Seoul, and Tokyo, which are diagnosed to be highly NOx-saturated. This also suggests that VOC reduction should be prioritized, and thus regulations on VOC reduction will be a good starting point for enforcement in megacities. The reduction of both NOx and VOCs should be considered judiciously in a few highly NOx-saturated cities. Recently, as China established a new emission reduction strategy with a reduction in VOC emissions in 2018, East Asia is expected to undergo a new phase in the O3-sensitivity regime. There have been reports of various process pattern changes in numerous urban areas in accordance with China’s Air Pollution Action Plan for 2013–2017. However, for the entire East Asia area, continuous monitoring of the space-borne behavior of O3 based on the reduction of VOC or NOx is required to effectively reduce O3.
In addition, we also confirmed the importance of LRT process in controlling O3 concentrations in downwind areas by emission reductions in upstream areas, through which O3 or its precursors were transported from East China or Central Asia to downwind areas. EXP4-6 showed that the O3 generated through LRT in China not only influences the change in the O3 concentration in the downwind region, but also the precursors themselves, even in trace amounts, must be involved in the O3 production reaction in downwind air in downstream megacities when emissions in China are reduced, as prescribed in EXP4 and EXP5. EXP6 showed a more pronounced effect on O3 changes in downwind areas. This indicates that reduction in the emissions of both NOx and VOCs may be more efficient for controlling O3 when the LRT process prevails, suggesting the importance of international cooperation for the development of O3 abatement policies in the East.
In the current study, our analysis period does not cover the pandemic of coronavirus disease 2019 (COVID-19) that is affecting the trend of O3 and other pollutants [72,73,74]. In our next satellite–model coupled study, therefore, the impact of the country-level scale of emissions reduction arising from lockdowns during COVID-19 will be evaluated over the megacities in East Asia. In addition, we did not consider the influence of inter-annual meteorological and climatological variabilities on O3 changes, which are of importance for the interpretation of annual and decadal air pollutant variabilities; therefore, it would also be necessary to investigate the possible meteorological and climatological reasons for the long-term O3 variabilities over the megacities in East Asia.
Finally, a regional 3-D air quality model, such as WRF–Chem, is essential and useful for control strategy evaluation, and also constitutes one of the major tools for tackling the O3 problem. Nevertheless, there still exist many uncertainties in air quality modeling. Prime among these is VOC emission [75,76] together with NOx emission inventories [77] in East Asia, and the chances of incorrect or uncertain use of input data must be minimized.

Supplementary Materials

The following are available online at https://www.mdpi.com/article/10.3390/rs14051285/s1, Table S1: WRF–Chem configuration, Table S2: Summary statistics for comparison between the WRF–Chem simulations and observed O3 and NO2 concentrations by surface and aircraft measurement for the KORUS-AQ campaign period (May 2016), Table S3: Simulated O3 concentrations at 9 megacities averaged over the KORUS-AQ campaign period (May 2016) for the base case plus 3 emission reduction scenarios (unit: ppbv), Table S4: Simulated O3 concentrations at 9 megacities averaged over the KORUS-AQ campaign period (May 2016) for the base case plus 3 Chinese emission reduction scenarios (unit: ppbv), Figure S1: Horizontal distributions of emissions for NOx, SO2, toluene, and HCHO (KORUS-AQ v.5) used in this study.

Author Contributions

Conceptualization, H.-J.L., D.A.J. and C.-H.K.; Data curation, J.B., X.L. and G.G.A.; formal analysis, H.-Y.J. and L.-S.C.; Investigation, J.-B.L.; Methodology, L.-S.C.; Visualization, H.-Y.J., Y.-J.J., G.-H.Y. and J.-M.K.; Writing—original draft preparation, H.-J.L.; Writing—review and editing, D.A.J. and C.-H.K. All authors have read and agreed to the published version of the manuscript.

Funding

This research was supported by the Basic Science Research Program through the National Research Foundation of Korea (NRF) funded by the Ministry of Education (2020R1A6A1A03044834 and 2019R1I1A1A01060445). GGA acknowledges funding from the NASA Science of Terra, Aqua, and Suomi NPP program (grant number 80NSSC18K0691), NASA Making Earth System Data Records for Use in Research Environments program (grant number 80NSSC18M0091), and the NOAA AC4 program (grant number NA18OAR431010).

Institutional Review Board Statement

Not applicable.

Informed Consent Statement

Not applicable.

Data Availability Statement

OMI O3 satellite data are available from https://avdc.gsfc.nasa.gov/pub/data/satellite/Aura/OMI/V03/L2/OMPROFOZ/ (accessed on 5 January 2022); OMI NO2 satellite data are available from https://aura.gesdisc.eosdis.nasa.gov/data/Aura_OMI_Level2/OMNO2.003/ (accessed on 5 January 2022); OMI HCHO satellite data are available from https://aura.gesdisc.eosdis.nasa.gov/data/Aura_OMI_Level2/OMHCHO.003/ (accessed on 5 January 2022); Contact Cheol-Hee Kim ([email protected]) or Hyo-Jung Lee ([email protected]) for WRF–Chem data requests.

Acknowledgments

We would like to express our gratitude to the OMI Science Team for providing satellite data. The authors are also grateful to the anonymous reviewers for their comments.

Conflicts of Interest

The authors declare no conflict of interest.

References

  1. China State Council. Action Plan on Prevention and Control of Air Pollution; China State Council: Beijing, China, 2013. (In Chinese) [Google Scholar]
  2. Jin, Y.; Andersson, H.; Zhang, S. Air pollution control policies in China: A retrospective and prospects. Int. J. Environ. Res. Public Health 2016, 12, 1219. [Google Scholar] [CrossRef] [PubMed] [Green Version]
  3. Kim, Y.P.; Lee, G. Trend of Air Quality in Seoul: Policy and Science. Aerosol Air Qual. Res. 2018, 18, 2141–2156. [Google Scholar] [CrossRef] [Green Version]
  4. Vellingiri, K.; Kim, K.-H.; Jeon, J.Y.; Brown, R.J.C.; Jung, M.C. Changes in NOx and O3 concentrations over a decade at a central urban area of Seoul, Korea. Atmos. Environ. 2015, 112, 116–125. [Google Scholar] [CrossRef]
  5. Akimoto, H.; Mori, Y.; Sasaki, K.; Nakanishi, H.; Ohizumi, T.; Itano, Y. Analysis of monitoring data of ground-level ozone in Japan for long-term trend during 1990–2010: Causes of temporal and spatial variation. Atmos. Environ. 2015, 102, 302–310. [Google Scholar] [CrossRef]
  6. Wang, Y.; Lampel, J.; Xie, P.; Beirle, S.; Li, A.; Wu, D.; Wagner, T. Ground-based MAX-DOAS observations of tropospheric aerosols, NO2, SO2 and HCHO in Wuxi, China, from 2011 to 2014. Atmos. Chem. Phys. 2017, 17, 2189–2215. [Google Scholar] [CrossRef] [Green Version]
  7. Jo, Y.-J.; Lee, H.-J.; Jo, H.-Y.; Woo, J.-H.; Kim, Y.; Lee, T.; Heo, G.; Park, S.-M.; Jung, D.; Park, J.; et al. Changes in inorganic aerosol compositions over the Yellow Sea area from impact of Chinese emissions mitigation. Atmos. Res. 2020, 240, 104948. [Google Scholar] [CrossRef]
  8. Li, X.B.; Yuan, B.; Parrish, D.D.; Chen, D.; Song, Y.; Yang, S.; Liu, Z.; Shao, M. Long-term trend of ozone in southern China reveals future mitigation strategy for air pollution. Atmos. Environ. 2021, 269, 118869. [Google Scholar] [CrossRef]
  9. Gao, S.; Bai, Z.; Liang, S.; Yu, H.; Chen, L.; Sun, Y.; Mao, J.; Zhang, H.; Ma, Z.; Azzi, M.; et al. Simulation of surface ozone over Hebei province, China using Kolmogorov-Zurbenko and artificial neural network (KZ-ANN) combined model. Atmos. Environ. 2021, 261, 118599. [Google Scholar] [CrossRef]
  10. An, J.; Zou, J.; Wang, J.; Lin, X.; Zhu, B. Differences in ozone photochemical characteristics between the megacity Nanjing and its suburban surroundings, Yangtze River Delta, China. Environ. Sci. Pollut. Res. 2015, 22, 19607–19617. [Google Scholar] [CrossRef]
  11. Akimoto, H.; Nagashima, T.; Li, J.; Fu, J.S.; Ji, D.; Tan, J.; Wang, Z. Comparison of surface ozone simulation among selected regional models in MICS-Asia III—Effects of chemistry and vertical transport for the causes of difference. Atmos. Chem. Phys. 2019, 19, 603–615. [Google Scholar] [CrossRef] [Green Version]
  12. Chang, L.S.; Choi, J.Y.; Son, J.; Lee, S.; Lee, D.; Jo, Y.J.; Kim, C.H. Interpretation of decadal-scale ozone production efficiency in the Seoul Metropolitan Area: Implication for ozone abatement. Atmos. Environ. 2020, 243, 117846. [Google Scholar] [CrossRef]
  13. Li, Y.; Cheng, M.; Guo, Z.; He, Y.; Zhang, X.; Cui, X.; Chen, S. Increase in Surface Ozone over Beijing-Tianjin-Hebei and the Surrounding Areas of China Inferred from Satellite Retrievals, 2005–2018. Aerosol Air Qual. Res. 2020, 20, 2170–2184. [Google Scholar] [CrossRef] [Green Version]
  14. Wang, Y.; Shen, L.; Wu, S.; Mickley, L.; He, J.; Hao, J. Sensitivity of surface ozone over China to 2000–2050 global changes of climate and emissions. Atmos. Environ. 2013, 75, 374–382. [Google Scholar] [CrossRef]
  15. Kleinman, L.I. Low and high NOx tropospheric photochemistry. J. Geophys. Res. Atmos. 1994, 99, 16831–16838. [Google Scholar] [CrossRef]
  16. Lee, H.-J.; Chang, L.-S.; Jaffe, D.A.; Bak, J.; Liu, X.; Abad, G.G.; Jo, H.-Y.; Jo, Y.-J.; Lee, J.-B.; Kim, C.-H. Ozone Continues to Increase in East Asia Despite Decreasing NO2: Causes and Abatements. Remote Sens. 2021, 13, 2177. [Google Scholar] [CrossRef]
  17. Souri, A.H.; Nowlan, C.R.; Wolfe, G.M.; Lamsal, L.N.; Chan Miller, C.E.; Abad, G.G.; Janz, S.J.; Fried, A.; Blake, D.R.; Weinheimer, A.J.; et al. Revisiting the Effectiveness of HCHO/NO2 Ratios for Inferring Ozone Sensitivity to Its Precursors using High Resolution Airborne Remote Sensing Observations in a High Ozone Episode during the KORUS-AQ Campaign. Atmos. Environ. 2020, 224, 117341. [Google Scholar] [CrossRef]
  18. Schroeder, J.; Crawford, J.; Ahn, J.-Y.; Chang, L.; Fried, A.; Walega, J.; Weinheimer, A.; Montzka, D.; Hall, S.; Ullmann, K.; et al. Observation-based modelling of ozone chemistry in the Seoul metropolitan area during the Korea-United States Air Quality Study (KORUS-AQ). Elementa-Sci. Anthrop. 2020, 8, 3. [Google Scholar] [CrossRef]
  19. Kim, H.; Gil, J.; Lee, M.; Jung, J.; Whitehill, A.; Szykman, J.; Lee, G.; Kim, D.S.; Cho, S.; Ahn, J.Y.; et al. Factors Controlling Surface Ozone in the Seoul Metropolitan Area during the KORUS-AQ Campaign. Elementa-Sci. Anthrop. 2020, 8, 46. [Google Scholar] [CrossRef]
  20. Oak, Y.J.; Park, R.J.; Schroeder, J.; Crawford, J.; Blake, D.; Weinheimer, A.; Woo, J.-H.; Kim, S.-W.; Yeo, H.; Fried, A.; et al. Evaluation of simulated O3 production efficiency during the KORUS-AQ campaign: Implications for anthropogenic NOx emissions in Korea. Elementa-Sci. Anthrop. 2019, 7, 56. [Google Scholar] [CrossRef]
  21. Liu, X.; Bhartia, P.K.; Chance, K.; Spurr, R.J.D.; Kurosu, T.P. Ozone profile retrievals from the Ozone Monitoring Instrument. Atmos. Chem. Phys. 2010, 10, 2521–2537. [Google Scholar] [CrossRef] [Green Version]
  22. Huang, G.; Liu, X.; Chance, K.; Yang, K.; Bhartia, P.K.; Cai, Z.; Allaart, M.; Ancellet, G.; Calpini, B.; Coetzee, G.J.R.; et al. Validation of 10-year SAO OMI Ozone Profile (PROFOZ) product using ozonesonde observations. Atmos. Meas. Tech. 2017, 10, 2455–2475. [Google Scholar] [CrossRef] [Green Version]
  23. Bak, J.; Liu, X.; Kim, J.H.; Chance, K.; Haffner, D.P. Validation of OMI total ozone retrievals from the SAO ozone profile algorithm and three operational algorithms with Brewer measurements. Atmos. Chem. Phys. 2015, 15, 667–683. [Google Scholar] [CrossRef] [Green Version]
  24. Fu, D.; Worden, J.R.; Liu, X.; Kulawik, S.S.; Bowman, K.W.; Natraj, V. Characterization of ozone profiles derived from Aura TES and OMI radiances. Atmos. Chem. Phys. 2013, 13, 3445–3462. [Google Scholar] [CrossRef] [Green Version]
  25. Fu, D.; Kulawik, S.S.; Miyazaki, K.; Bowman, K.W.; Worden, J.R.; Eldering, A.; Livesey, N.J.; Teixeira, J.; Irion, F.W.; Herman, R.L.; et al. Retrievals of tropospheric ozone profiles from the synergism of AIRS and OMI: Methodology and validation. Atmos. Meas. Tech. 2018, 11, 5587–5605. [Google Scholar] [CrossRef] [Green Version]
  26. Cuesta, J.; Eremenko, M.; Liu, X.; Dufour, G.; Cai, Z.; Höpfner, M.; von Clarmann, T.; Sellitto, P.; Foret, G.; Gaubert, B.; et al. Satellite observation of lowermost tropospheric ozone by multispectral synergism of IASI thermal infrared and GOME-2 ultraviolet measurements over Europe. Atmos. Chem. Phys. 2013, 13, 9675–9693. [Google Scholar] [CrossRef] [Green Version]
  27. Zoogman, P.; Liu, X.; Suleiman, R.M.; Pennington, W.F.; Flittner, D.E.; Al-Saadi, J.A.; Hilton, B.B.; Nicks, D.K.; Newchurch, M.J.; Carr, J.L.; et al. Tropospheric emissions: Monitoring of pollution (TEMPO). J. Quant. Spectrosc. Radiat. Transf. 2016, 17–39. [Google Scholar] [CrossRef] [Green Version]
  28. Munro, R.; Siddans, R.; Reburn, W.; Kerridge, B. Direct measurement of tropospheric ozone distributions from space. Nature 1998, 392, 168–171. [Google Scholar] [CrossRef]
  29. Hayashida, S.; Liu, X.; Ono, A.; Yang, K.; Chance, K. Observation of ozone enhancement in the lower troposphere over East Asia from a space-borne ultraviolet spectrometer. Atmos. Chem. Phys. 2015, 15, 9865–9881. [Google Scholar] [CrossRef] [Green Version]
  30. Jiang, Z.; Worden, J.R.; Jones, D.B.A.; Lin, J.-T.; Verstraeten, W.W.; Henze, D.K. Constraints on Asian ozone using Aura TES, OMI and Terra MOPITT. Atmos. Chem. Phys. 2015, 15, 99–112. [Google Scholar] [CrossRef] [Green Version]
  31. Pittman, J.V.; Pan, L.L.; Wei, J.C.; Irion, F.W.; Liu, X.; Maddy, E.S.; Barnet, C.D.; Chance, K.; Gao, R.S. Evaluation of AIRS, IASI, and OMI ozone profile retrievals in the extratropical tropopause region using in situ aircraft measurements. J. Geophys. Res. 2009, 114, D24109. [Google Scholar] [CrossRef] [Green Version]
  32. Liu, Y.; Wang, Y.; Liu, X.; Cai, Z.; Chance, K. Tibetan middle tropospheric ozone minimum in June discovered from GOME observations. Geophys. Res. Lett. 2009, 36, L05814. [Google Scholar] [CrossRef] [Green Version]
  33. Sauvage, B.; Martin, R.V.; Van Donkelaar, A.; Liu, X.; Chance, K.; Jaeglé, L.; Palmer, P.I.; Wu, S.; Fu, T.-M. Remote sensed and in situ constraints on processes affecting tropical tropospheric ozone. Atmos. Chem. Phys. 2007, 7, 815–838. [Google Scholar] [CrossRef] [Green Version]
  34. Zhang, L.; Jacob, D.J.; Liu, X.; Logan, J.A.; Chance, K.; Eldering, A.; Bojkov, B.R. Intercomparison methods for satellite measurements of atmospheric composition: Application to tropospheric ozone from TES and OMI. Atmos. Chem. Phys. 2010, 10, 4725–4739. [Google Scholar] [CrossRef] [Green Version]
  35. Hu, L.; Jacob, D.J.; Liu, X.; Zhang, Y.; Zhang, L.; Kim, P.S.; Sulprizio, M.P.; Yantosca, R.M. Global budget of tropospheric ozone: Evaluating recent model advances with satellite (OMI), aircraft (IAGOS), and ozonesonde observations. Atmos. Environ. 2017, 167, 323–334. [Google Scholar] [CrossRef]
  36. Kim, S.-W.; Heckel, A.; Frost, G.J.; Richter, A.; Gleason, J.; Burrows, J.P.; McKeen, S.; Hsie, E.-Y.; Granier, C.; Trainer, M. NO2 columns in the western United States observed from space and simulated by a regional chemistry model and their implications for NOx emissions. J. Geophys. Res. 2009, 114, D11301. [Google Scholar] [CrossRef] [Green Version]
  37. Ackermann, I.J.; Hass, H.; Memmesheimer, M.; Ebel, A.; Binkowski, F.S.; Shankar, U. Modal aerosol dynamics model for Europe: Development and first applications. Atmos. Environ. 1998, 32, 2981–2999. [Google Scholar] [CrossRef]
  38. Ahmadov, R.; McKeen, S.A.; Robinson, A.; Bahreini, R.; Middlebrook, A.; de Gouw, J.; Meagher, J.; Hsie, E.; Edgerton, E.; Shaw, S.; et al. A volatility basis set model for summertime secondary organic aerosols over the eastern United States in 2006. J. Geophys. Res. 2012, 117, D06301. [Google Scholar] [CrossRef]
  39. Jang, Y.; Lee, Y.; Kim, J.; Kim, Y.; Woo, J.-H. Improvement China Point Source for Improving Bottom-Up Emission Inventory. Asia-Pac. J. Atmos. Sci. 2020, 56, 107–118. [Google Scholar] [CrossRef]
  40. Park, R.J.; Oak, Y.J.; Emmons, L.K.; Kim, C.H.; Pfister, G.G.; Carmichael, G.R.; Saide, P.E.; Cho, S.Y.; Kim, S.; Woo, J.H.; et al. Multi-model intercomparisons of air quality simulations for the KORUS-AQ campaign. Elementa-Sci. Anthrop. 2021, 9, 00139. [Google Scholar] [CrossRef]
  41. Guenther, A.; Karl, T.; Harley, P.; Wiedinmyer, C.; Palmer, P.I.; Geron, C. Estimates of global terrestrial isoprene emissions using MEGAN (Model of Emissions of Gases and Aerosols from Nature). Atmos. Chem. Phys. 2006, 6, 3181–3210. [Google Scholar] [CrossRef] [Green Version]
  42. Wiedinmyer, C.; Akagi, S.K.; Yokelson, R.J.; Emmons, L.K.; Al-Saadi, J.A.; Orlando, J.J.; Soja, A.J. The Fire INventory from NCAR (FINN): A high resolution global model to estimate the emissions from open burning. Geosci. Model Dev. 2011, 4, 625–641. [Google Scholar] [CrossRef] [Green Version]
  43. Crawford, J.H.; Ahn, J.-Y.; Al-Saadi, J.; Chang, L.; Emmons, L.K.; Kim, J.; Lee, G.; Park, J.-H.; Park, R.J.; Woo, J.H.; et al. The Korea–United States Air Quality (KORUS-AQ) field study. Elementa-Sci. Anthrop. 2021, 9, 00163. [Google Scholar] [CrossRef]
  44. Emery, C.; Liu, Z.; Russell, A.G.; Odman, M.T.; Yarwood, G.; Kumar, N. Recommendations on statistics and benchmarks to assess photochemical model performance. J. Air Waste Manag. Assoc. 2017, 67, 582–598. [Google Scholar] [CrossRef] [PubMed] [Green Version]
  45. Bilal, M.; Nazeer, M.; Nichol, J.E.; Bleiweiss, M.P.; Qiu, Z.; Jäkel, E.; Campbell, J.R.; Atique, L.; Huang, X.; Lolli, S. A Simplified and Robust Surface Reflectance Estimation Method (SREM) for Use over Diverse Land Surfaces Using Multi-Sensor Data. Remote Sens. 2019, 11, 1344. [Google Scholar] [CrossRef] [Green Version]
  46. Hurley, P.J. The Air Pollution Model (TAPM) Version 2: Technical Description; CSIRO: Clayton, Australia, 2002. [Google Scholar]
  47. Lee, H.J.; Jo, H.Y.; Song, C.K.; Jo, Y.J.; Park, S.Y.; Kim, C.H. Sensitivity of Simulated PM2.5 Concentrations over Northeast Asia to Different Secondary Organic Aerosol Modules during the KORUS-AQ Campaign. Atmosphere 2020, 11, 1004. [Google Scholar] [CrossRef]
  48. Park, S.Y.; Kim, C.H. Interpretation of Aerosol Effects on Precipitation Susceptibility in Warm Clouds Inferred from Satellite Measurements and Model Evaluation over Northeast Asia. J. Atmos. Sci. 2021, 78, 1947–1963. [Google Scholar] [CrossRef]
  49. de Foy, B.; Lu, Z.; Streets, D.G. Satellite NO2 retrievals suggest China has exceeded its NOx reduction goals from the twelfth Five-Year Plan. Sci. Rep. 2016, 6, 35912. [Google Scholar] [CrossRef] [Green Version]
  50. Zheng, B.; Tong, D.; Li, M.; Liu, F.; Hong, C.; Geng, G.; Li, H.; Li, X.; Peng, L.; Ji, Q.; et al. Trends in China’s anthropogenic emissions since 2010 as the consequence of clean air actions. Atmos. Chem. Phys. 2018, 18, 14095–14111. [Google Scholar] [CrossRef] [Green Version]
  51. Zheng, C.H.; Shen, J.; Zhang, Y.; Huang, W.; Zhu, Z.; Wu, X.; Chen, L.; Gao, X.; Cen, K. Quantitative assessment of industrial VOC emissions in China: Historical trend, spatial distribution, uncertainties, and projection. Atmos. Environ. 2017, 150, 116–125. [Google Scholar] [CrossRef]
  52. Jin, X.; Holloway, T. Spatial and temporal variability of ozone sensitivity over China observed from the Ozone Monitoring Instrument. J. Geophys. Res. 2015, 120, 7229–7246. [Google Scholar] [CrossRef]
  53. Jin, X.; Fiore, A.M.; Murray, L.T.; Valin, L.C.; Lamsal, L.N.; Duncan, B.; Boersma, K.F.; Smedt, I.D.; González Abad, G.; Chance, K.; et al. Evaluating a space-based indicator of surface ozone-NOx-VOC sensitivity over midlatitude source regions and application to decadal trends. J. Geophys. Res. 2017, 122, 10439–10461. [Google Scholar] [CrossRef]
  54. .Dodge, M.C. Effect of Selected Parameters on Predictions of a Photochemical Model; EPA-600/3-77-048; U.S. Environmental Protection Agency: Research Triangle Park, NC, USA, 1977.
  55. Oh, I.B.; Kim, Y.K.; Hwang, M.K.; Kim, C.H.; Kim, S.; Song, S.K. Elevated ozone layers over the Seoul Metropolitan Region in Korea: Evidence for long-range ozone transport from eastern China and its contribution to surface concentrations. J. Appl. Meteorol. Clim. 2010, 49, 203–220. [Google Scholar] [CrossRef]
  56. Park, I.-S.; Choi, W.-J.; Lee, T.-Y.; Lee, S.-J.; Han, J.-S.; Kim, C.-H. Simulation of long-range transport of air pollutants over Northeast Asia using a comprehensive acid deposition model. Atmos. Environ. 2005, 39, 4075–4085. [Google Scholar] [CrossRef]
  57. Kim, J.-M.; Lee, H.-J.; Jo, H.-Y.; Jo, Y.-J.; Kim, C.-H. Vertical Characteristics of Secondary Aerosols Observed in the Seoul and Busan Metropolitan Areas of Korea during KORUS-AQ and Associations with Meteorological Conditions. Atmosphere 2021, 12, 1451. [Google Scholar] [CrossRef]
  58. Lee, H.J.; Jo, H.Y.; Park, S.Y.; Jo, Y.J.; Jeon, W.; Ahn, J.Y.; Kim, C.H. A Case Study of the Transport/Transformation of Air Pollutants over the Yellow Sea during the MAPS 2015 Campaign. J. Geophys. Res-Atmos. 2019, 124, 6532–6553. [Google Scholar] [CrossRef]
  59. Jo, H.Y.; Kim, C.H. Identification of Long-Range Transported Haze Phenomena and Their Meteorological Features over Northeast Asia. J. Appl. Meteorol. Climatol. 2013, 52, 1318–1328. [Google Scholar] [CrossRef]
  60. Lee, H.J.; Jo, H.Y.; Kim, S.W.; Park, M.S.; Kim, C.H. Impacts of Atmospheric Vertical Structures on Transboundary Aerosol Transport from China to South Korea. Sci. Rep. 2019, 9, 13040. [Google Scholar] [CrossRef] [PubMed]
  61. Kim, C.H.; Meng, F.; Kajino, M.; Lim, J.H.; Tang, W.; Lee, J.J.; Kiriyama, Y.; Woo, J.H.; Sato, K.; Kitada, T.; et al. Comparative Numerical Study of PM2.5 in Exit-and-Entrance Areas Associated with Transboundary Transport over China, Japan, and Korea. Atmosphere 2021, 12, 469. [Google Scholar] [CrossRef]
  62. Kim, C.H.; Park, S.Y.; Kim, Y.J.; Chang, L.S.; Song, S.K.; Moon, Y.S.; Song, C.K. A Numerical Study on Indicators of Long-range Transport Potential for Anthropogenic Particulate Matters over Northeast Asia. Atmos. Environ. 2012, 58, 35–44. [Google Scholar] [CrossRef]
  63. Jaffe, D.A.; Parrish, D.; Goldstein, A.; Price, H.; Harris, J. Increasing background ozone during spring on the west coast of North America. Geophys. Res. Lett. 2003, 30, 1613. [Google Scholar] [CrossRef] [Green Version]
  64. Verstraeten, W.W.; Neu, J.L.; Williams, J.E.; Bowman, K.W.; Worden, J.R.; Boersma, K.F. Rapid increases in tropospheric ozone production and export from China. Nat. Geosci. 2015, 8, 690–695. [Google Scholar] [CrossRef]
  65. Cooper, O.R.; Forster, C.; Parrish, D.; Trainer, M.; Dunlea, E.; Ryerson, T.; Hubler, G.; Fehsenfeld, F.; Nicks, D.; Holloway, J.; et al. A case study of transpacific warm conveyor belt transport: Influence of merging airstreams on trace gas import to North America. J. Geophys. Res. 2004, 109, D23S08. [Google Scholar] [CrossRef]
  66. Zhang, L.; Jaffe, D.A. Trends and sources of ozone and sub-micron aerosols at the Mt. Bachelor observatory (MBO) during 2004–2015. Atmos. Environ. 2017, 165, 143–154. [Google Scholar] [CrossRef]
  67. Zhang, L.; Jacob, D.J.; Boersma, K.F.; Jaffe, D.A.; Olson, J.R.; Bowman, K.W.; Worden, J.R.; Thompson, A.M.; Avery, M.A.; Cohen, R.C.; et al. Transpacific transport of ozone pollution and the effect of recent Asian emission increases on air quality in North America: An integrated analysis using satellite, aircraft, ozonesonde, and surface observations. Atmos. Chem. Phys. 2008, 8, 6117–6136. [Google Scholar] [CrossRef] [Green Version]
  68. Cooper, O.R.; Parrish, D.D.; Stohl, A.; Trainer, M.; Nédélec, P.; Thouret, V.; Cammas, J.P.; Oltmans, S.J.; Johnson, B.J.; Tarasick, D.; et al. Increasing springtime ozone mixing ratios in the free troposphere over western North America. Nature 2010, 463, 344–348. [Google Scholar] [CrossRef]
  69. Parrish, D.D.; Dunlea, E.J.; Atlas, E.L.; Schauffler, S.; Donnelly, S.; Stroud, V.; Goldstein, A.H.; Millet, D.B.; McKay, M.; Jaffe, D.A.; et al. Changes in the photochemical environment of the temperate North Pacific troposphere in response to increased Asian emissions. J. Geophys. Res. 2004, 109, D23S18. [Google Scholar] [CrossRef]
  70. Jaffe, D.A.; Cooper, O.R.; Fiore, A.M.; Henderson, B.H.; Tonnesen, G.S.; Russell, A.G.; Henze, D.K.; Langford, A.O.; Lin, M.; Moore, T. Scientific assessment of background ozone over the U.S.: Implications for air quality management. Elementa-Sci. Anthrop. 2018, 6, 56. [Google Scholar] [CrossRef]
  71. Gratz, L.E.; Jaffe, D.A.; Hee, J.R. Causes of increasing ozone and decreasing carbon monoxide in springtime at the Mt. Bachelor Observatory from 2004 to 2013. Atmos. Environ. 2015, 109, 323–330. [Google Scholar] [CrossRef]
  72. Filonchyk, M.; Peterson, M. Air Quality Changes in Shanghai, China, and the Surrounding Urban Agglomeration during the COVID-19 Lockdown. J. Geovis. Spat. Anal. 2020, 4, 22. [Google Scholar] [CrossRef]
  73. Ghahremanloo, M.; Lops, Y.; Choi, Y.; Mousavinezhad, S. Impact of the COVID-19 outbreak on air pollution levels in East Asia. Sci. Total Environ. 2021, 754, 142226. [Google Scholar] [CrossRef]
  74. Wang, Y.; Wen, Y.; Wang, Y.; Zhang, S.; Zhang, K.M.; Zheng, H.; Xing, J.; Wu, Y.; Hao, J. Four-Month Changes in Air Quality during and after the COVID-19 Lockdown in Six Megacities in China. Environ. Sci. Technol. Lett. 2020, 7, 802–808. [Google Scholar] [CrossRef]
  75. Kim, C.-H.; Park, S.-U.; Song, C.-K. A simple semi-empirical photochemical model for the simulation of ozone concentration in the Seoul metropolitan area in Korea. Atmos. Environ. 2005, 39, 5597–5607. [Google Scholar] [CrossRef]
  76. Kim, C.-H.; Kim, Y.-K.; Lee, H.-W.; Seo, K.-H. A Simple Method for Simulating Horizontal Ozone Concentration Fields over Coastal Areas: A Case Study of the Seoul Metropolitan Area, Korea. Terr. Atmos. Ocean. Sci. 2009, 20, 355–363. [Google Scholar] [CrossRef] [Green Version]
  77. Gao, M.; Carmichael, G.R.; Saide, P.E.; Lu, Z.; Yu, M.; Streets, D.G.; Wang, Z. Response of winter fine particulate matter concentrations to emission and meteorology changes in North China. Atmos. Chem. Phys. 2016, 16, 11837–11851. [Google Scholar] [CrossRef] [Green Version]
Figure 1. Domain for satellite measurement analysis and WRF–Chem modeling. Locations of the nine megacities are also denoted.
Remotesensing 14 01285 g001
Figure 2. Three sub-divided analysis areas: East China, S. Korea, and Japan, including nine megacities (as defined in Figure 1) and time series of the O3 (900–700 hPa) (unit: Dobson Unit), tropospheric NO2 (unit: 1015 molecules cm−2), and HCHO (unit: 1015 molecules cm−2) columns for 2005–2018. Rectangular boxes represent the sizes of the nine megacities for the OMI column averages.
Remotesensing 14 01285 g002
Figure 3. Spatial distributions of (a) satellite-derived FNR and Ozone Monitoring Instrument (OMI) satellite measurements of the (b) lower tropospheric (900–700 hPa) O3 partial column, (c) tropospheric NO2 column, and (d) tropospheric HCHO column in East Asia averaged for 2014–2018.
Remotesensing 14 01285 g003
Figure 4. Five-year (2014–2018) average FNRs for East China, South Korea, and Japan, and the nine megacities.
Remotesensing 14 01285 g004
Figure 5. Monthly (May 2016) averaged O3 concentrations in nine megacities in East Asia simulated from the impacts of three 50% emission reduction scenarios, including the reduction of NOx (EXP1), VOCs (EXP2), and both (NOx + VOCs; EXP3) in the entire East Asia domain. Rectangular boxes represent the sizes of the nine megacities for OMI column averages, and the black numbers in parentheses indicate the average surface O3 concentrations (unit: ppbv) of the control experiment for the 2016 baseline year. Red, green, and yellow indicate the percentages of O3 increase and decrease compared with the average value of the control experiment in the results of EXP1, EXP2, and EXP3, respectively.
Remotesensing 14 01285 g005
Figure 6. Monthly (May 2016) averaged O3 concentrations in nine cities in East Asia simulated from the impacts of three 50% emission reduction scenarios in East China, as described in Table 1. The black numbers in parentheses indicate the average surface O3 concentrations (unit: ppbv) of the control experiment for the baseline year of 2016. Red indicates the percentages of increase and decrease of O3 in the results showing the reduction of NOx in the experiment (EXP4), green represents the reduction of VOCs (EXP5), and yellow represents the reduction of both NOx and VOCs (EXP6) when compared with the average values of the control experiment.
Remotesensing 14 01285 g006
Table 1. Simulation scenarios for the WRF–Chem model used in this study.
ExperimentsEmission ScenariosEmission Reduction
Base caseKORUSv5 emission (for 2015)-
EXP150% reduction of NOx emissionsEntire Domain
EXP250% reduction of VOC emissionsEntire Domain
EXP350% reduction of NOx and VOC emissionsEntire Domain
EXP450% reduction of NOx emissionEast China
EXP550% reduction of VOC emissionsEast China
EXP650% reduction of NOx and VOC emissionsEast China
Publisher’s Note: MDPI stays neutral with regard to jurisdictional claims in published maps and institutional affiliations.

