
The Extensive Parameters as a Tool to Monitoring the Volcanic Activity: The Case Study of Vulcano Island (Italy)

 , , ,
, , ,
Abstract
:1. Introduction
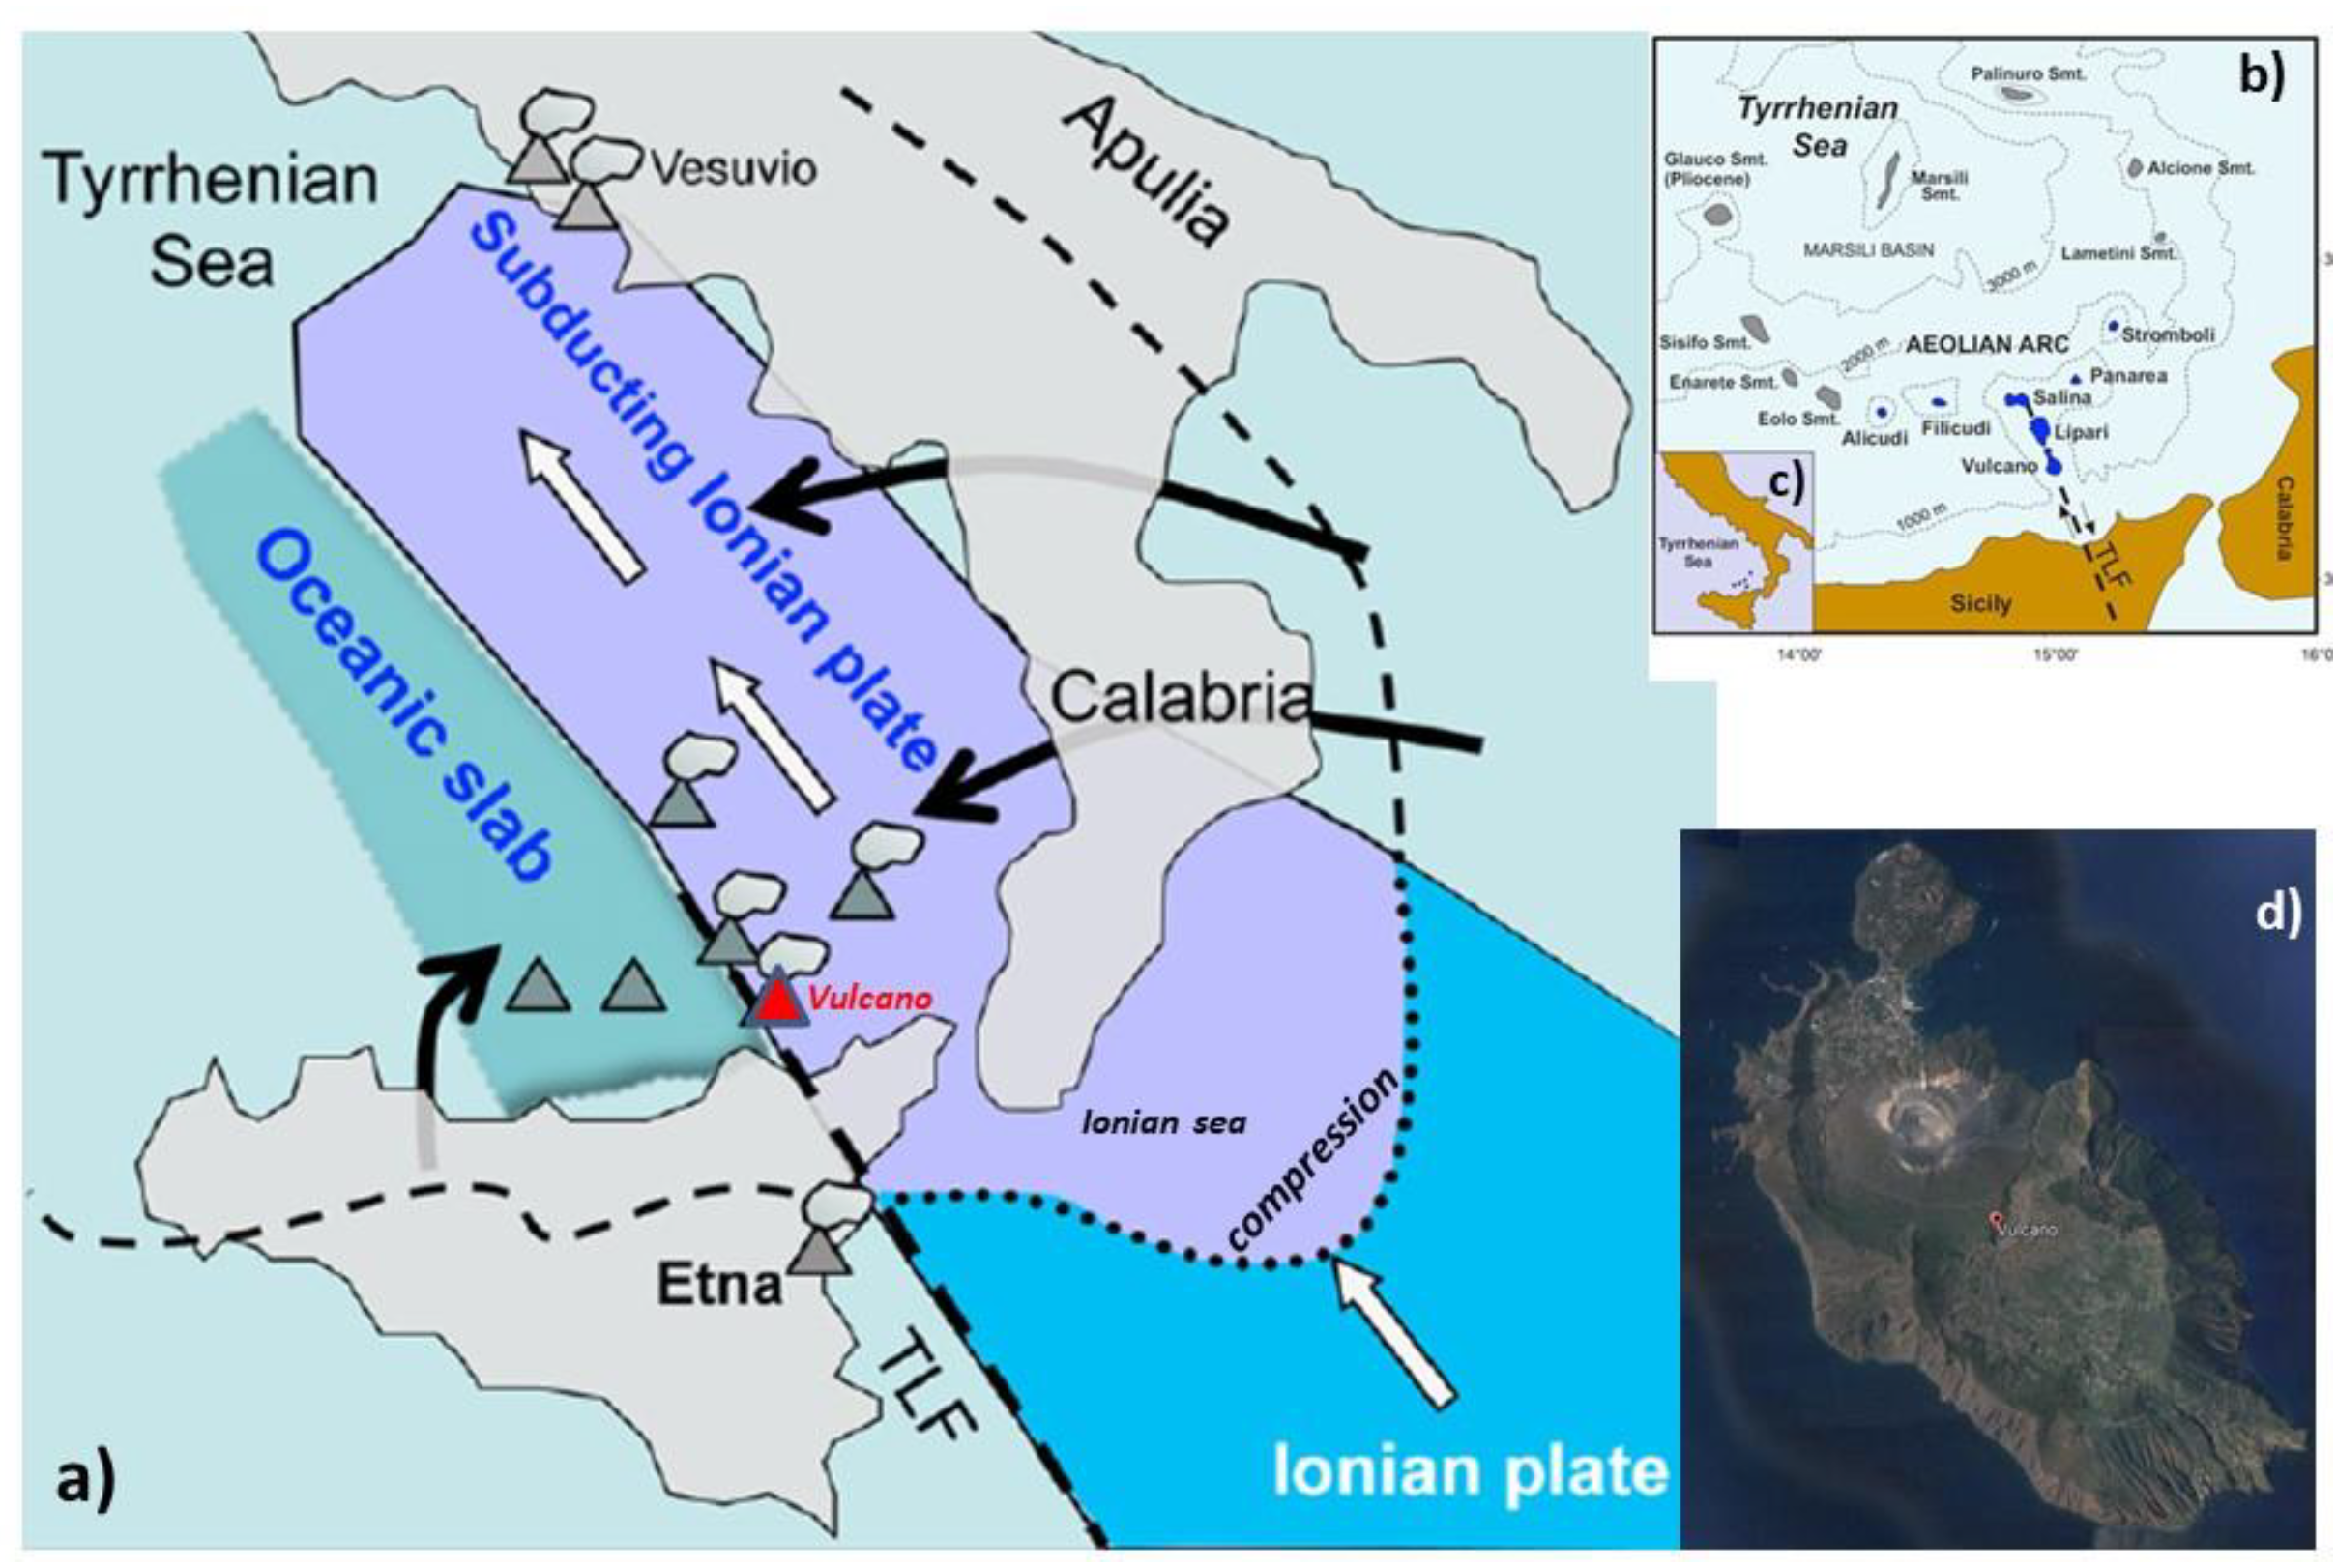
2. Geological and Volcanological Background
3. Materials and Methods
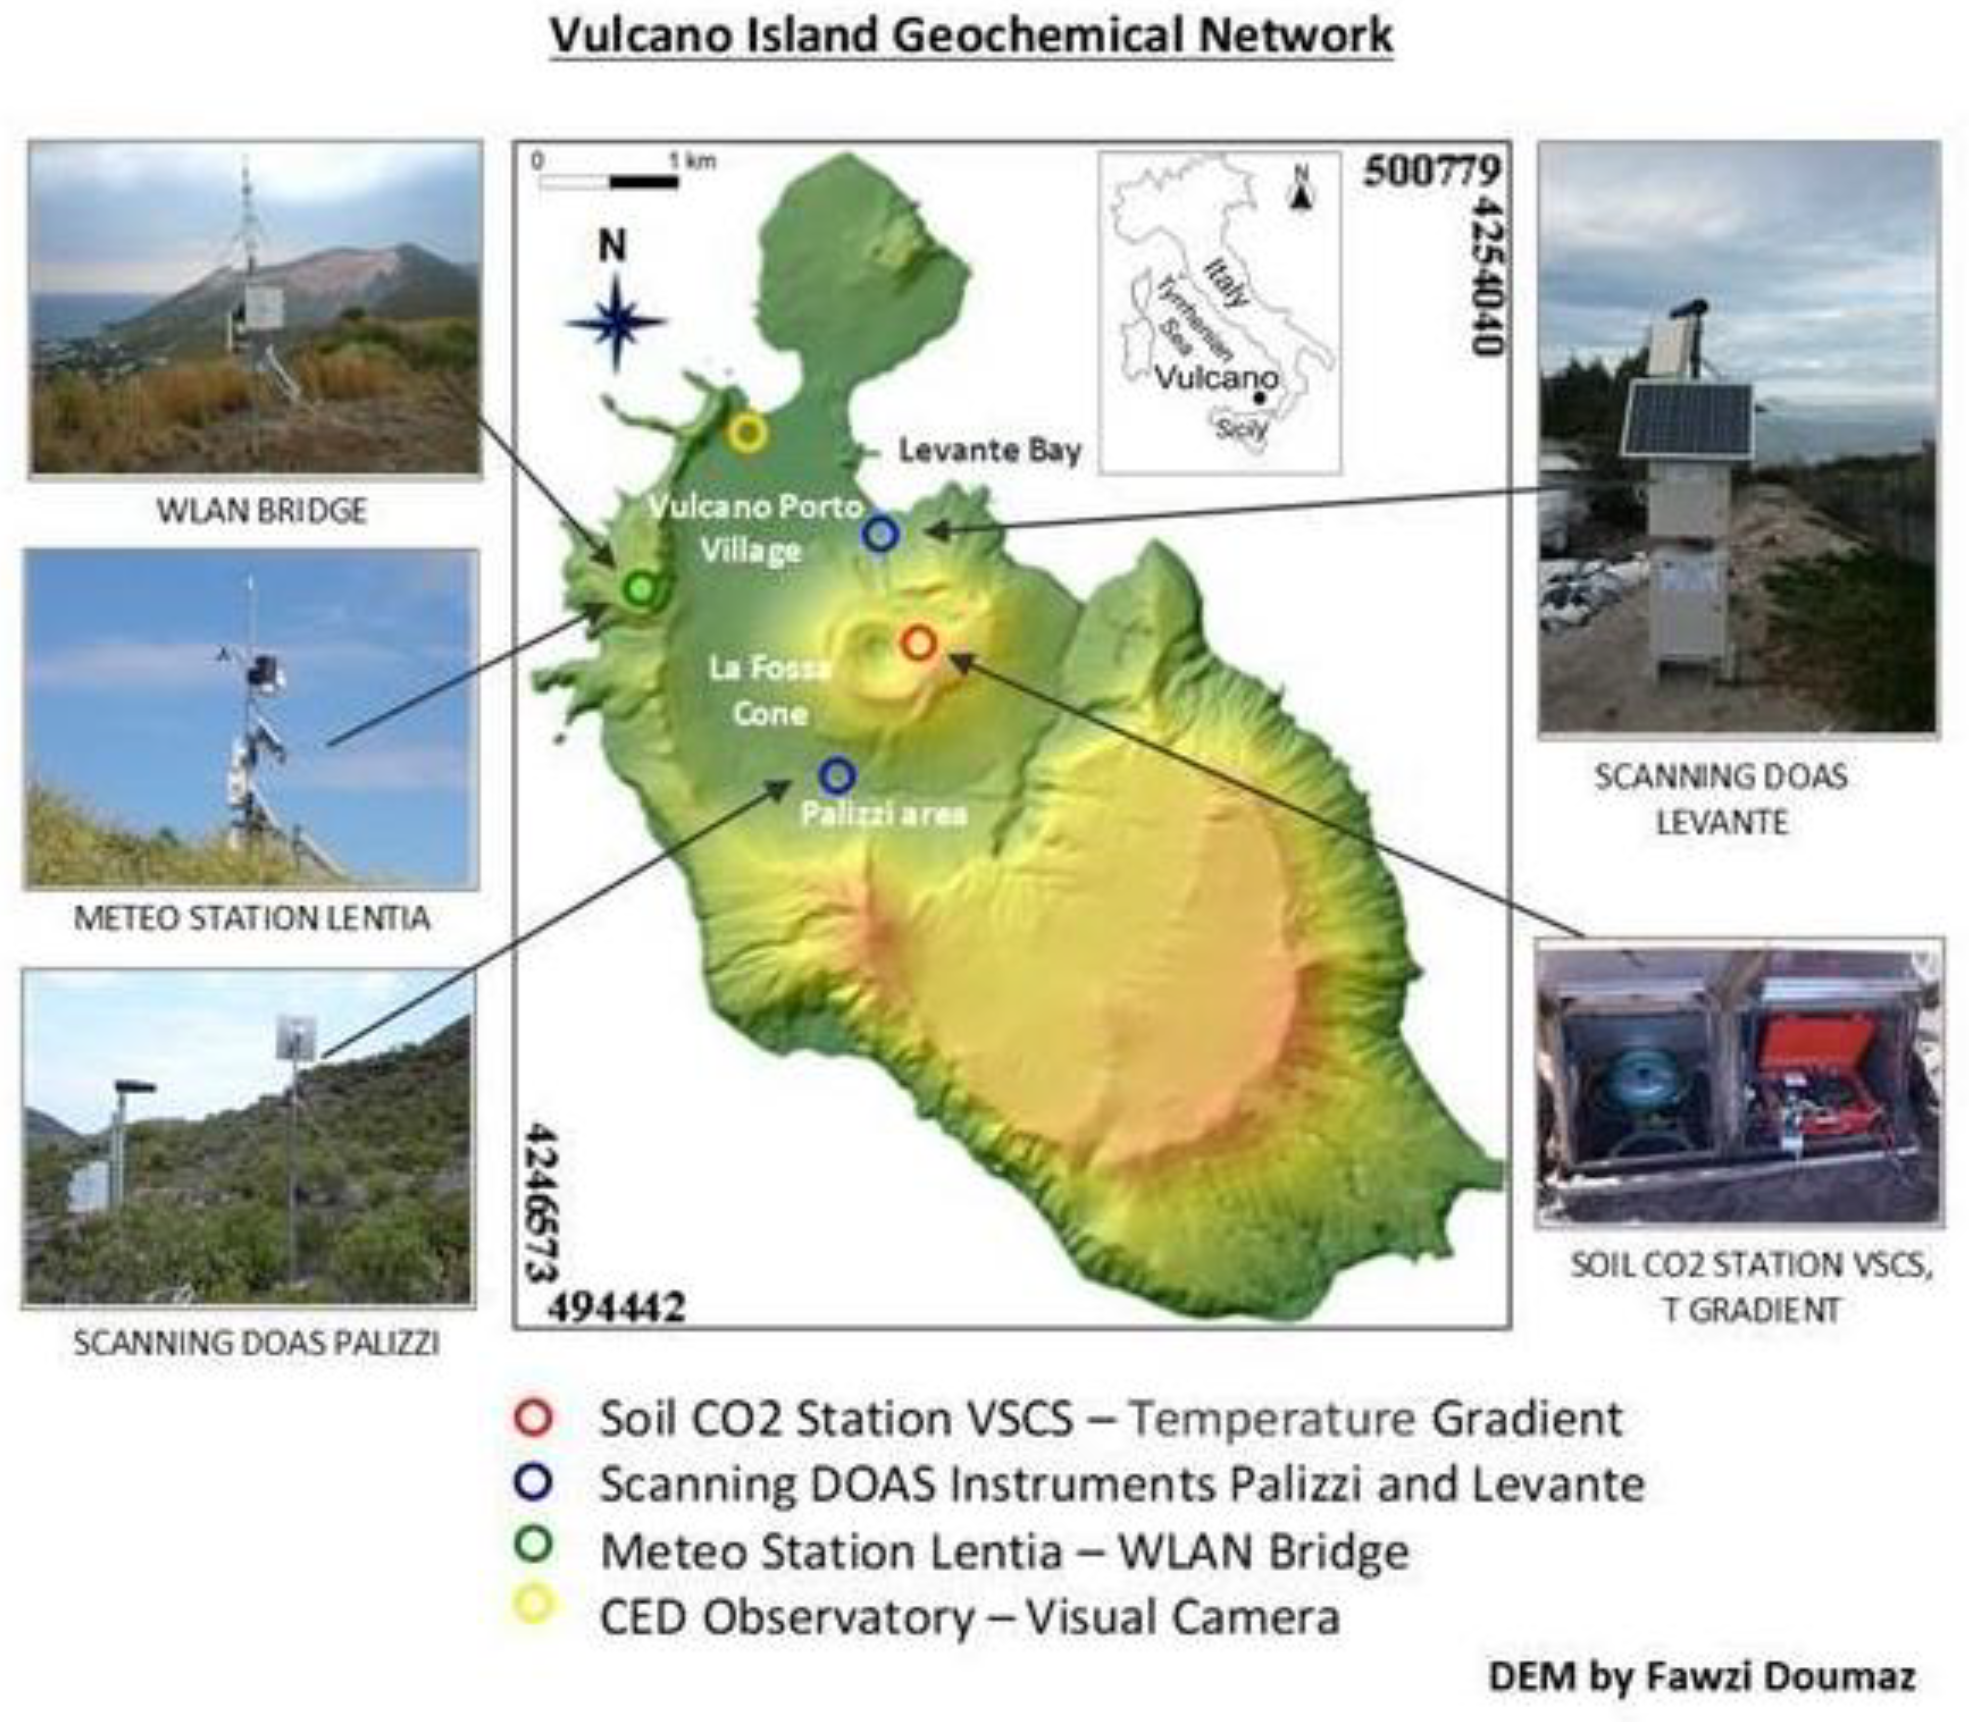
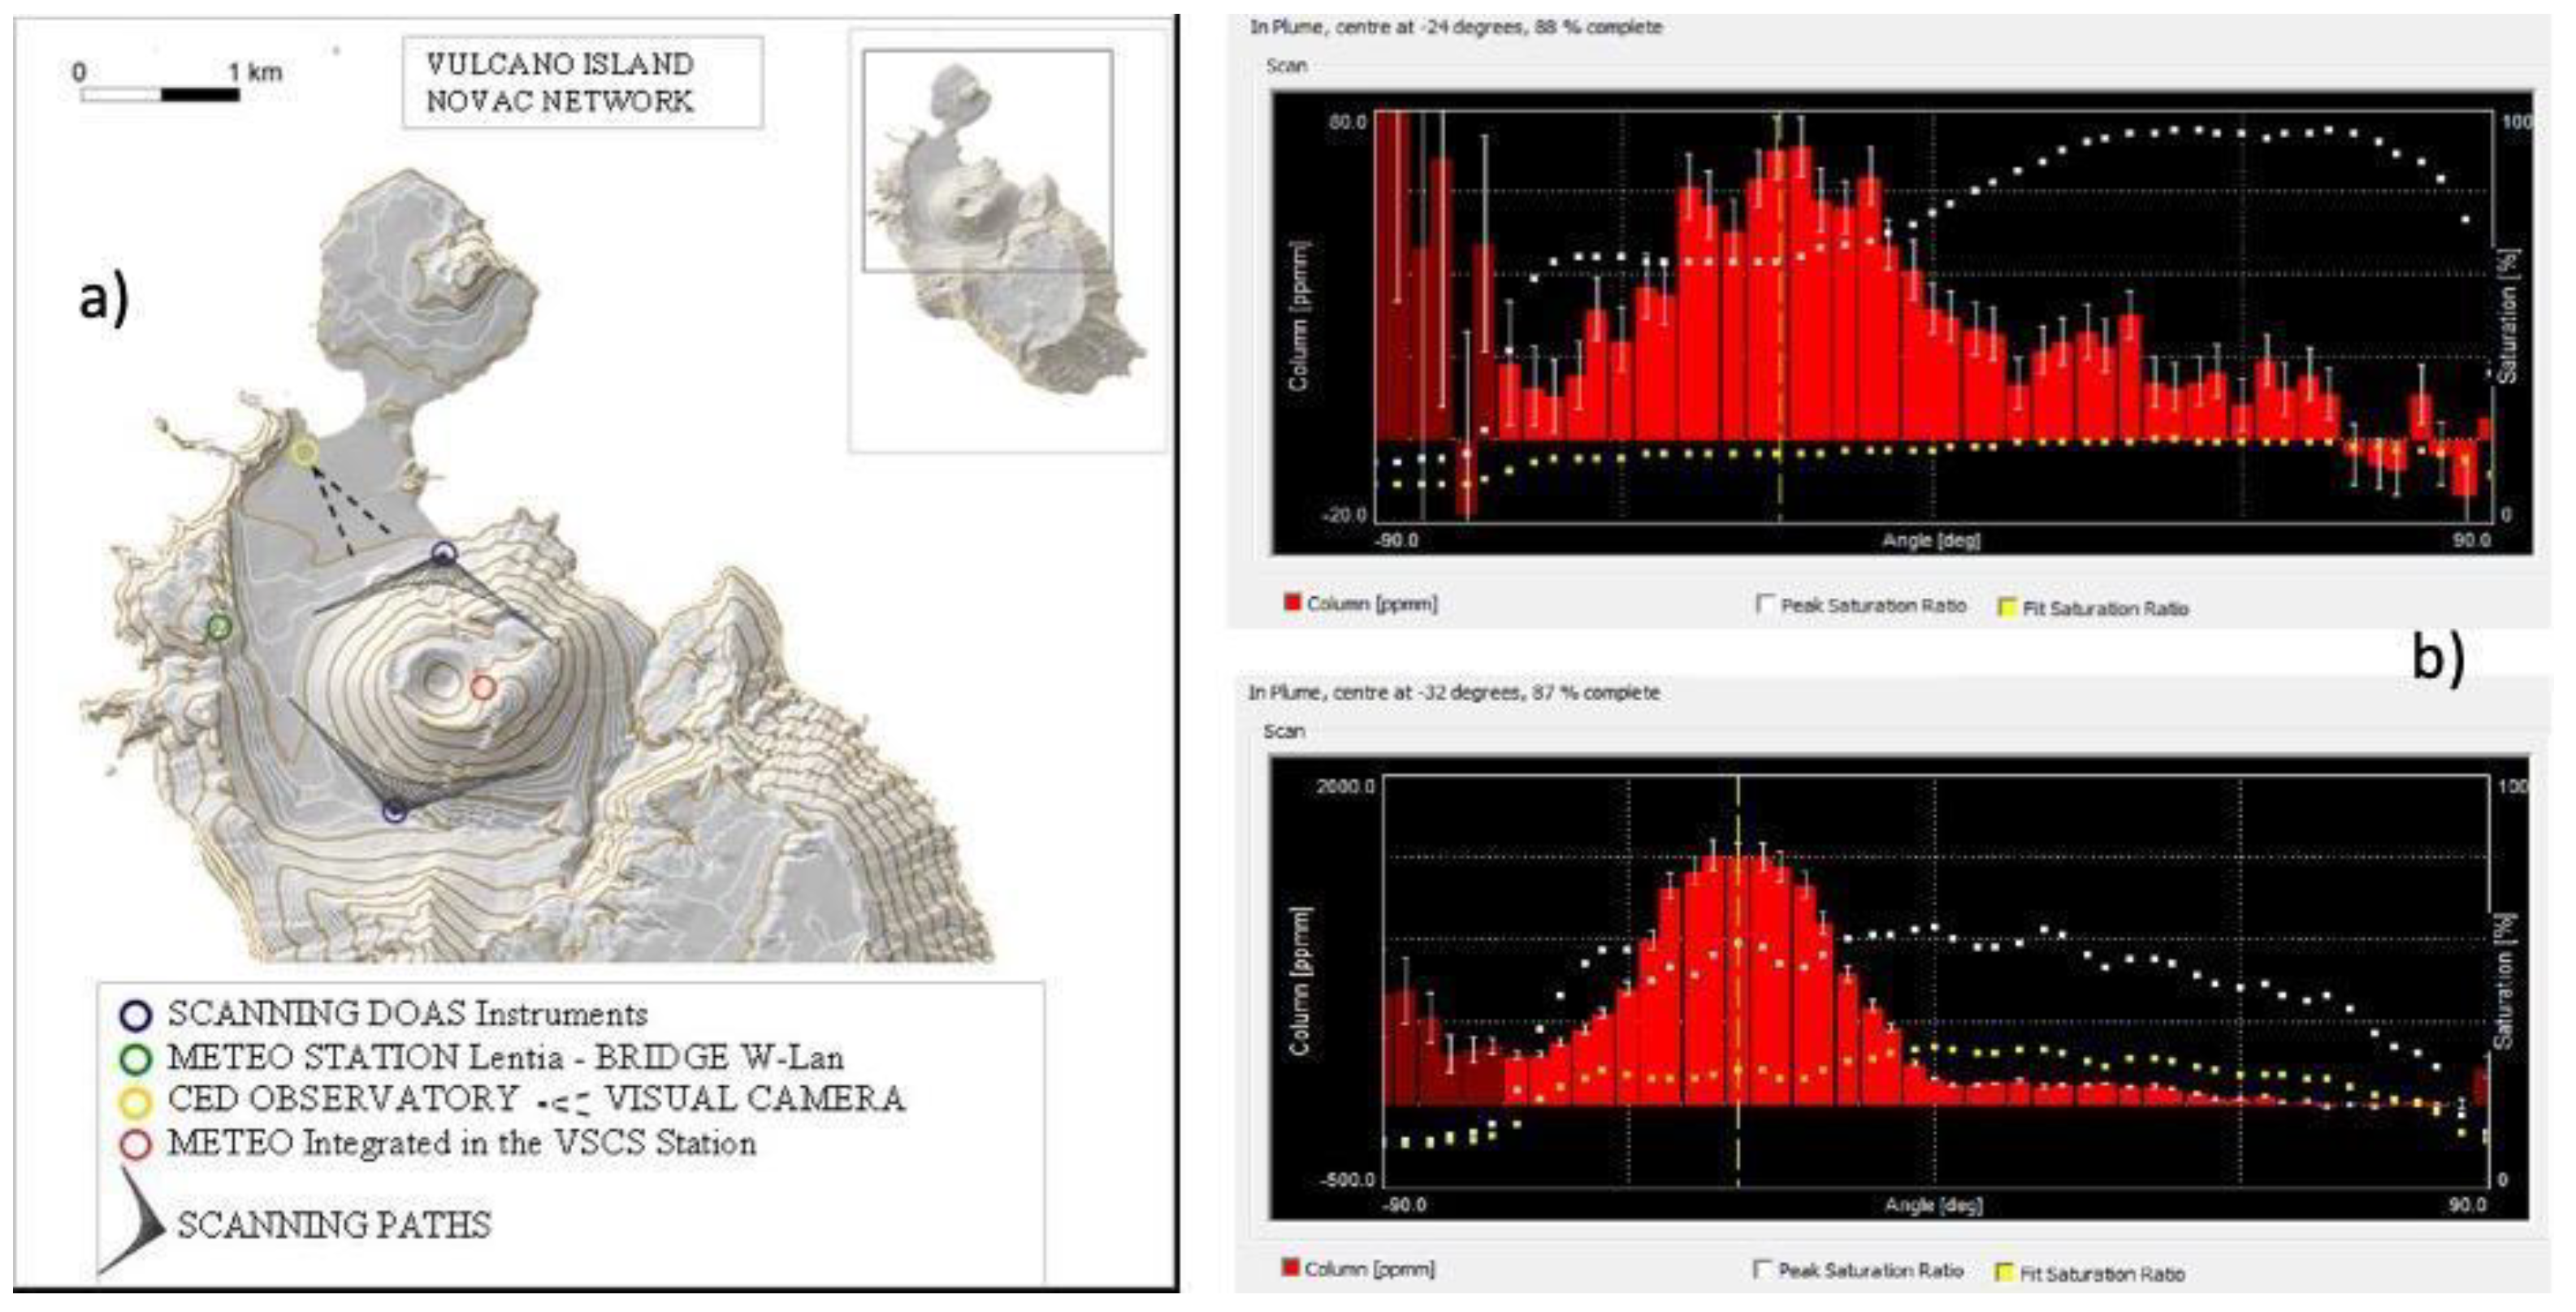
3.1. Plume SO2 Fluxes, Network and Methodology of the UV Scanning DOAS Network on Vulcano Island
3.2. Environmental Parameters Network (Lentia and La Fossa Crater)
3.3. Soil CO2 Fluxes, Methodology
3.4. Soil CO2 Output, Methodology and Campaigns
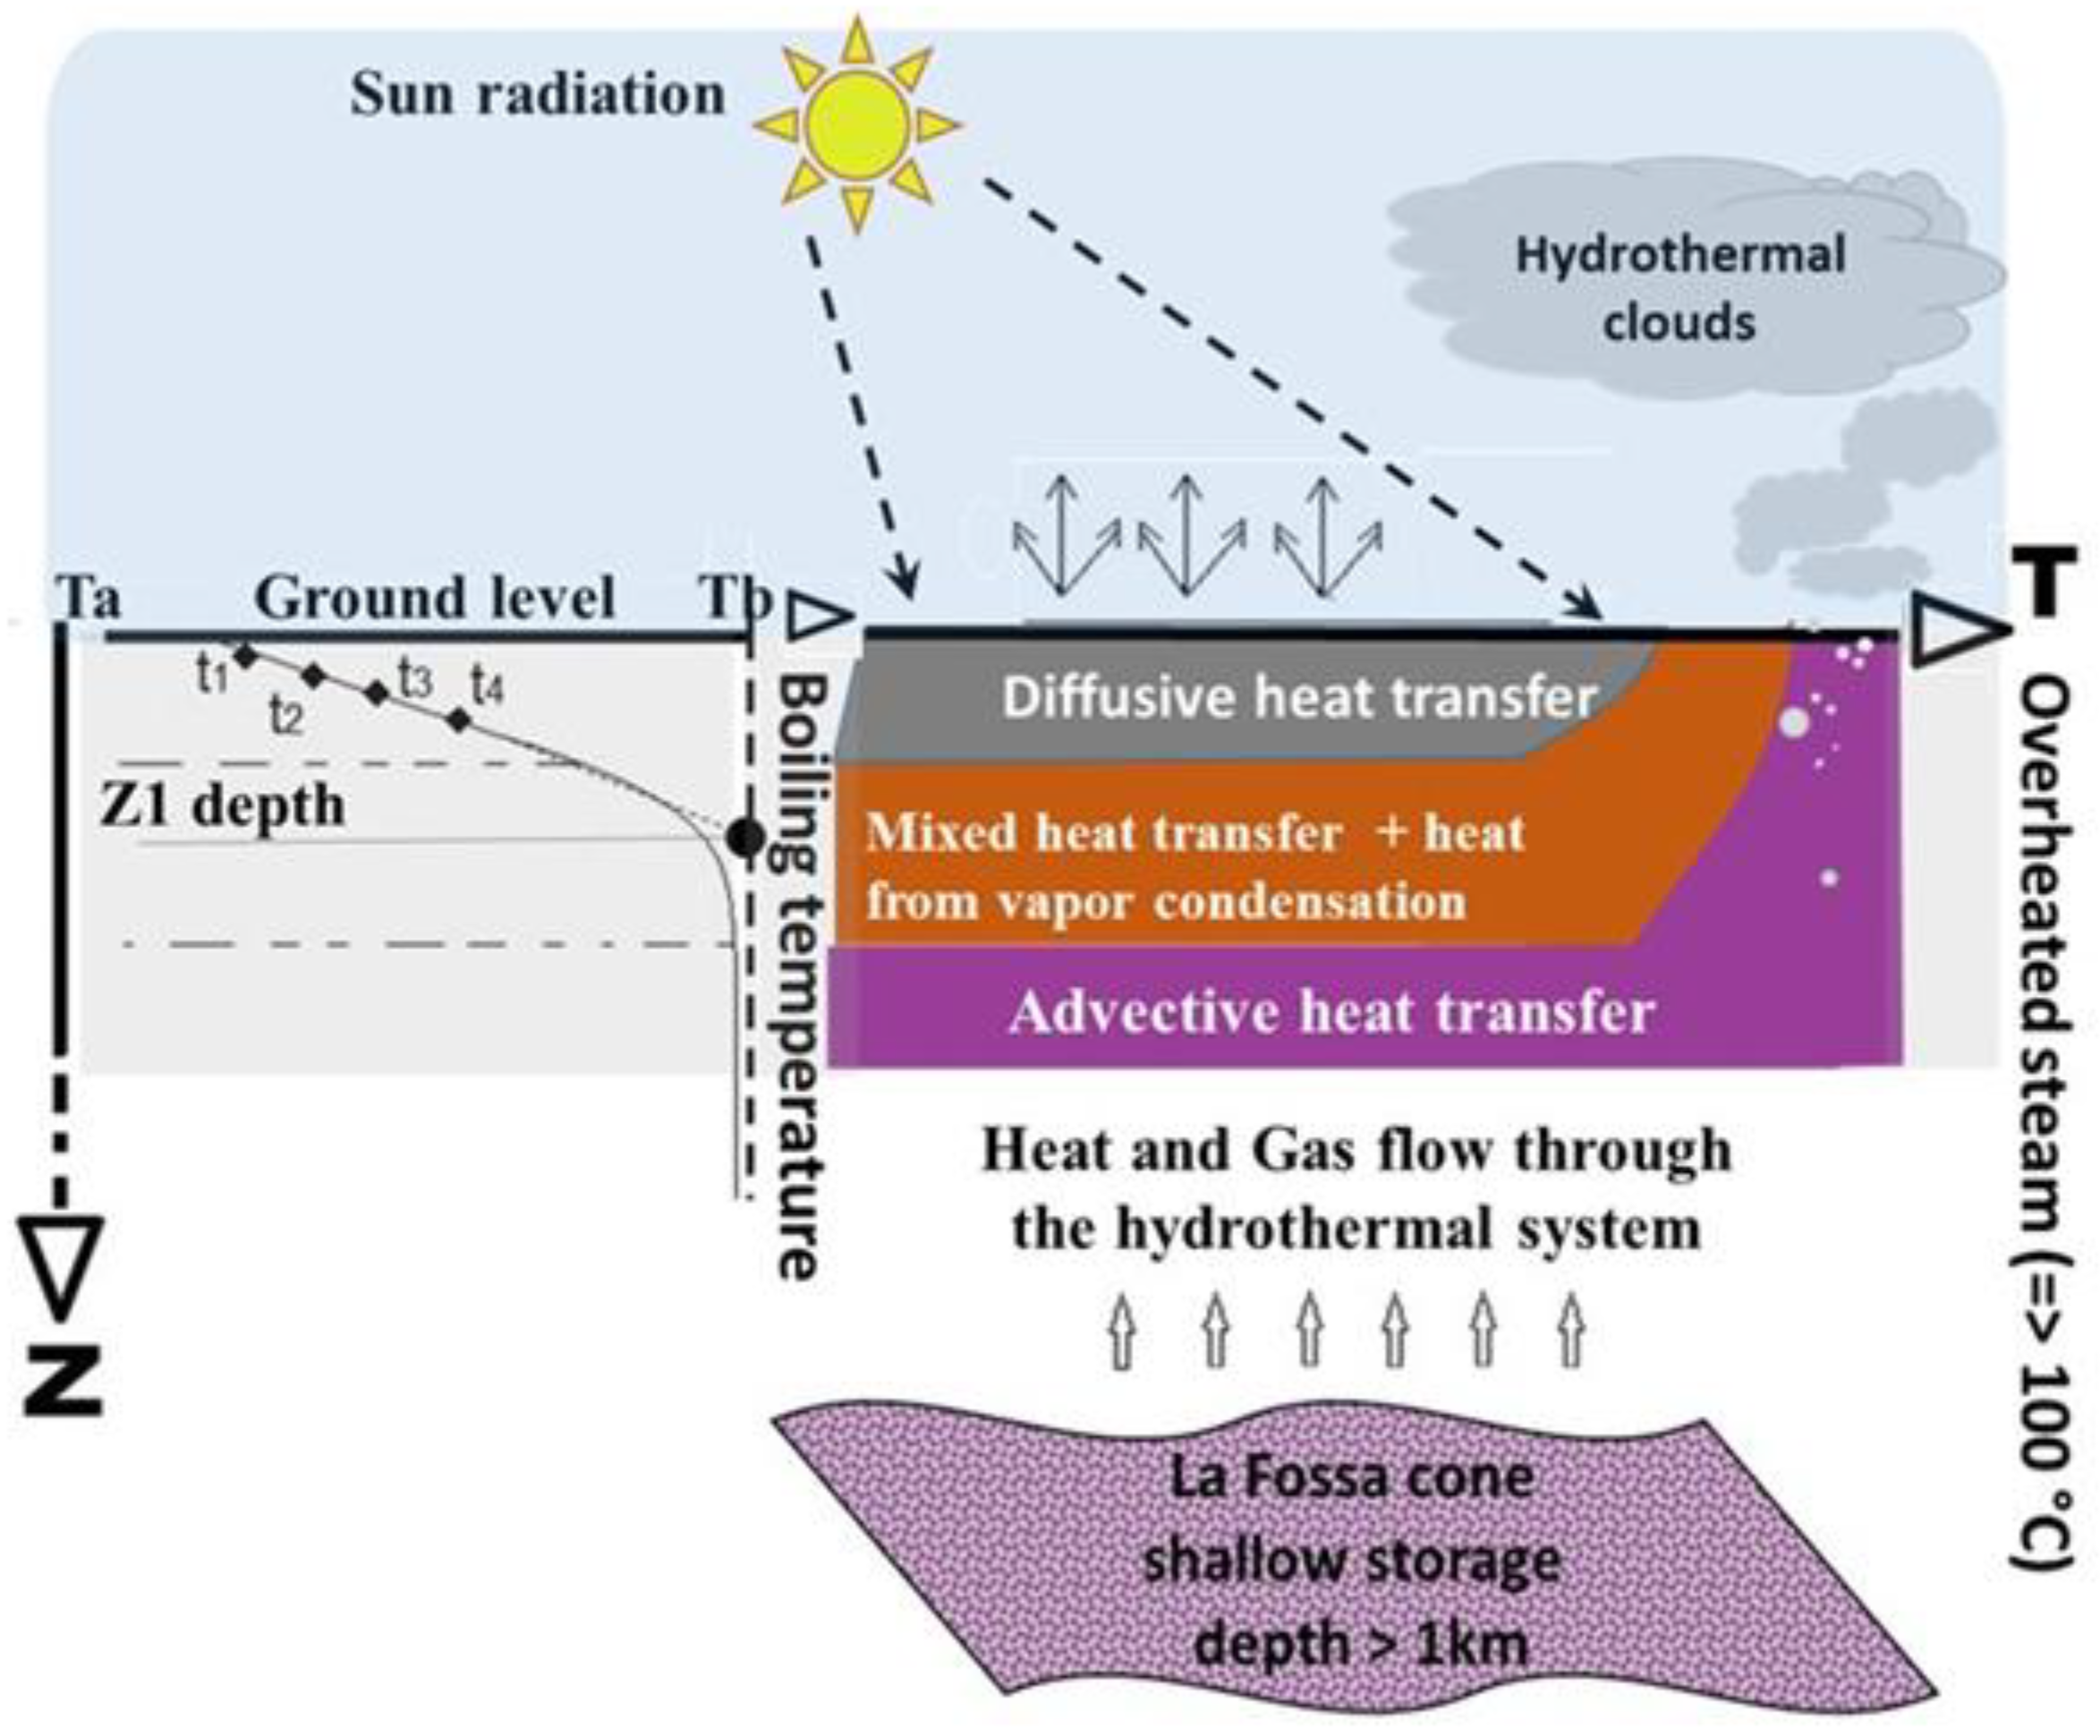
3.5. Thermal Gradient and Heat Fluxes
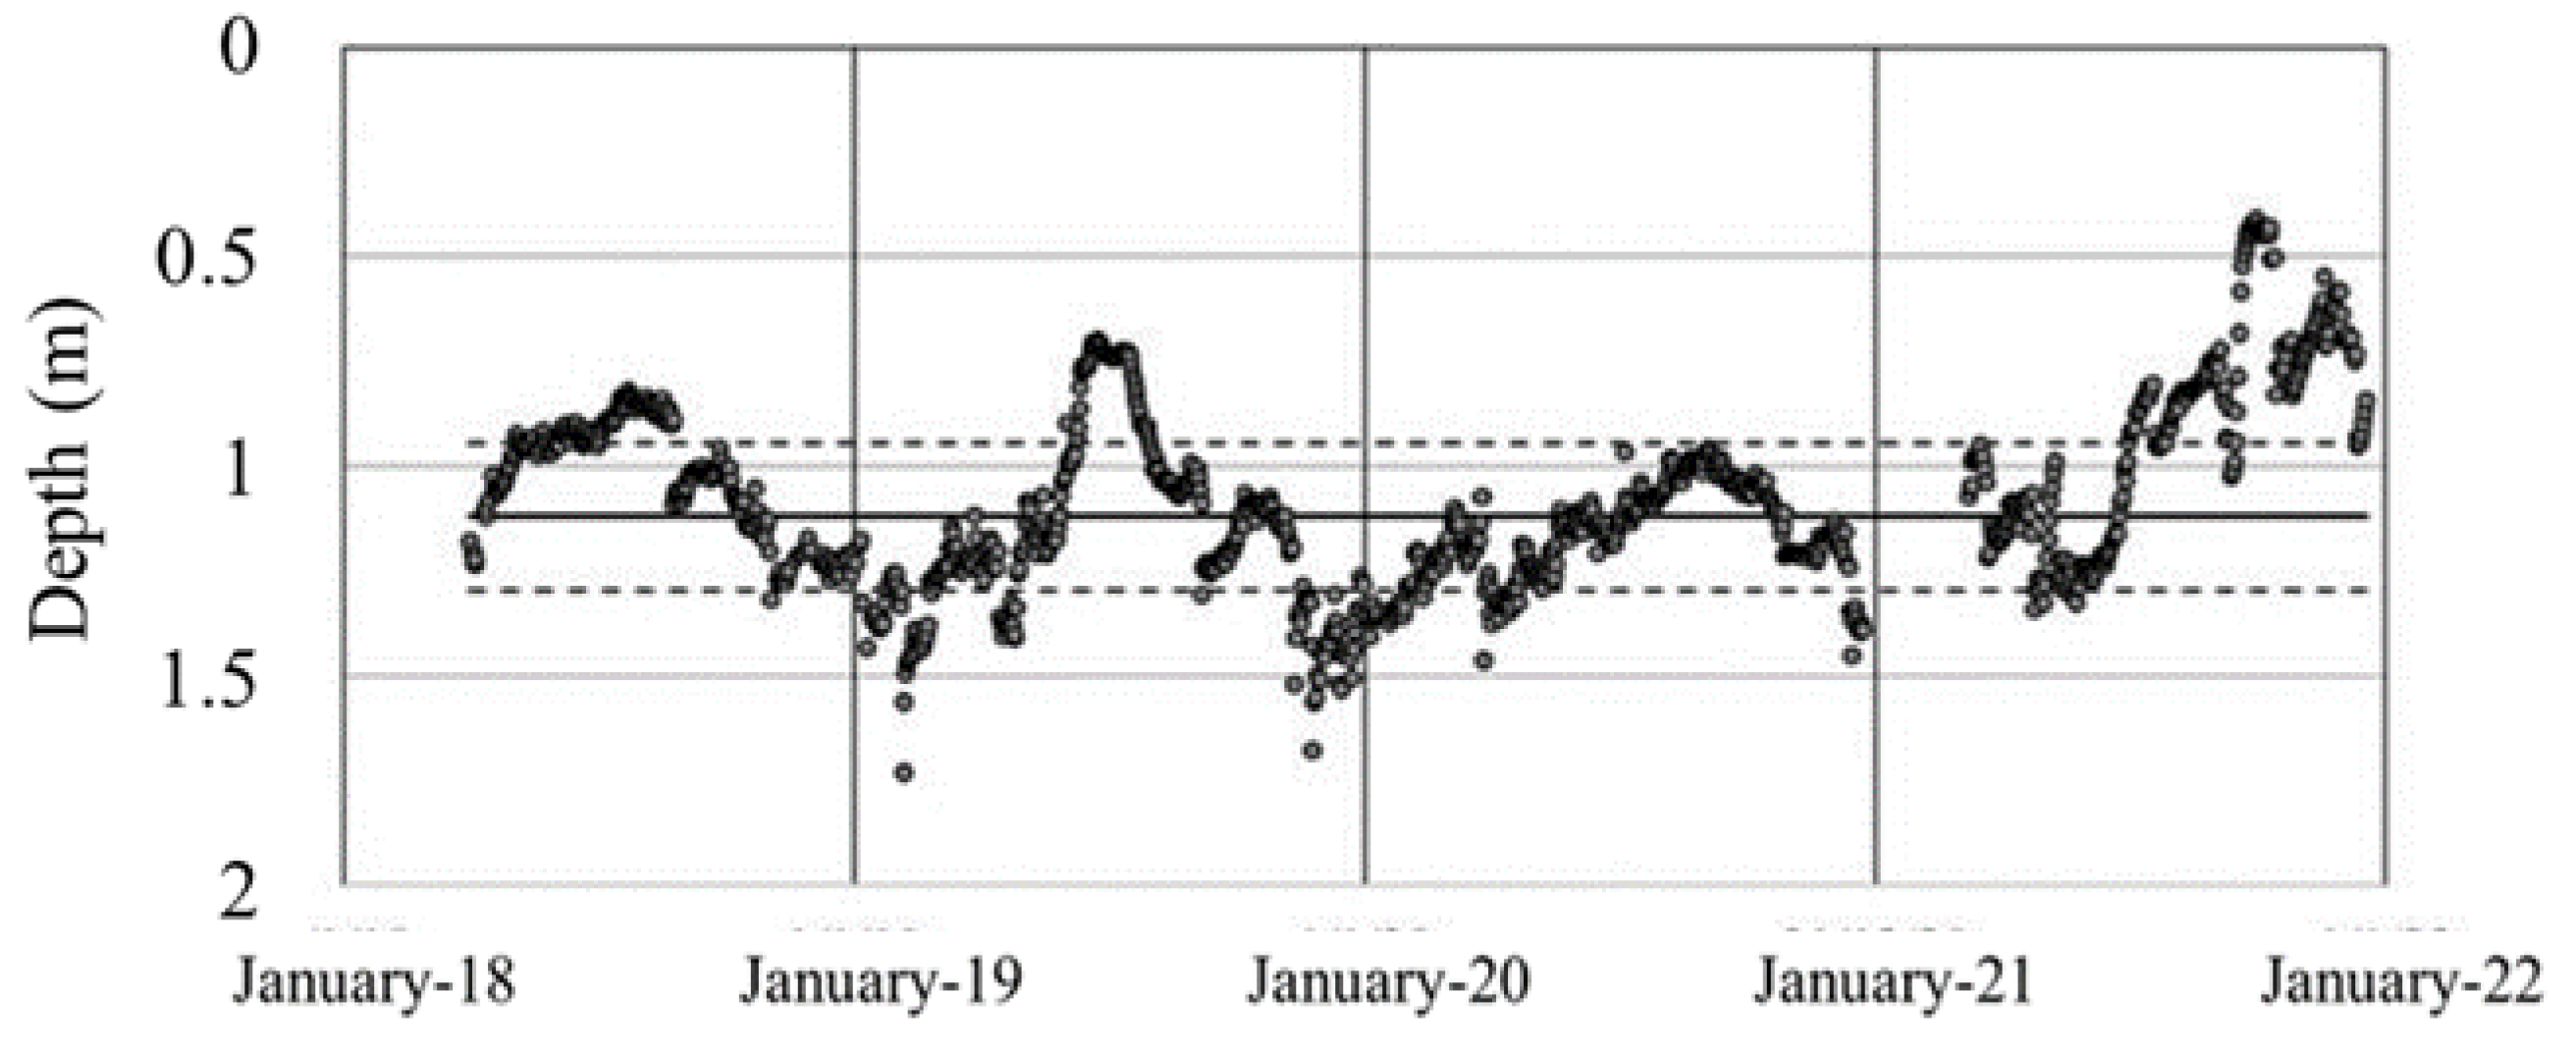
3.5.1. Depth Limit of the Conductive Layer (Z1)
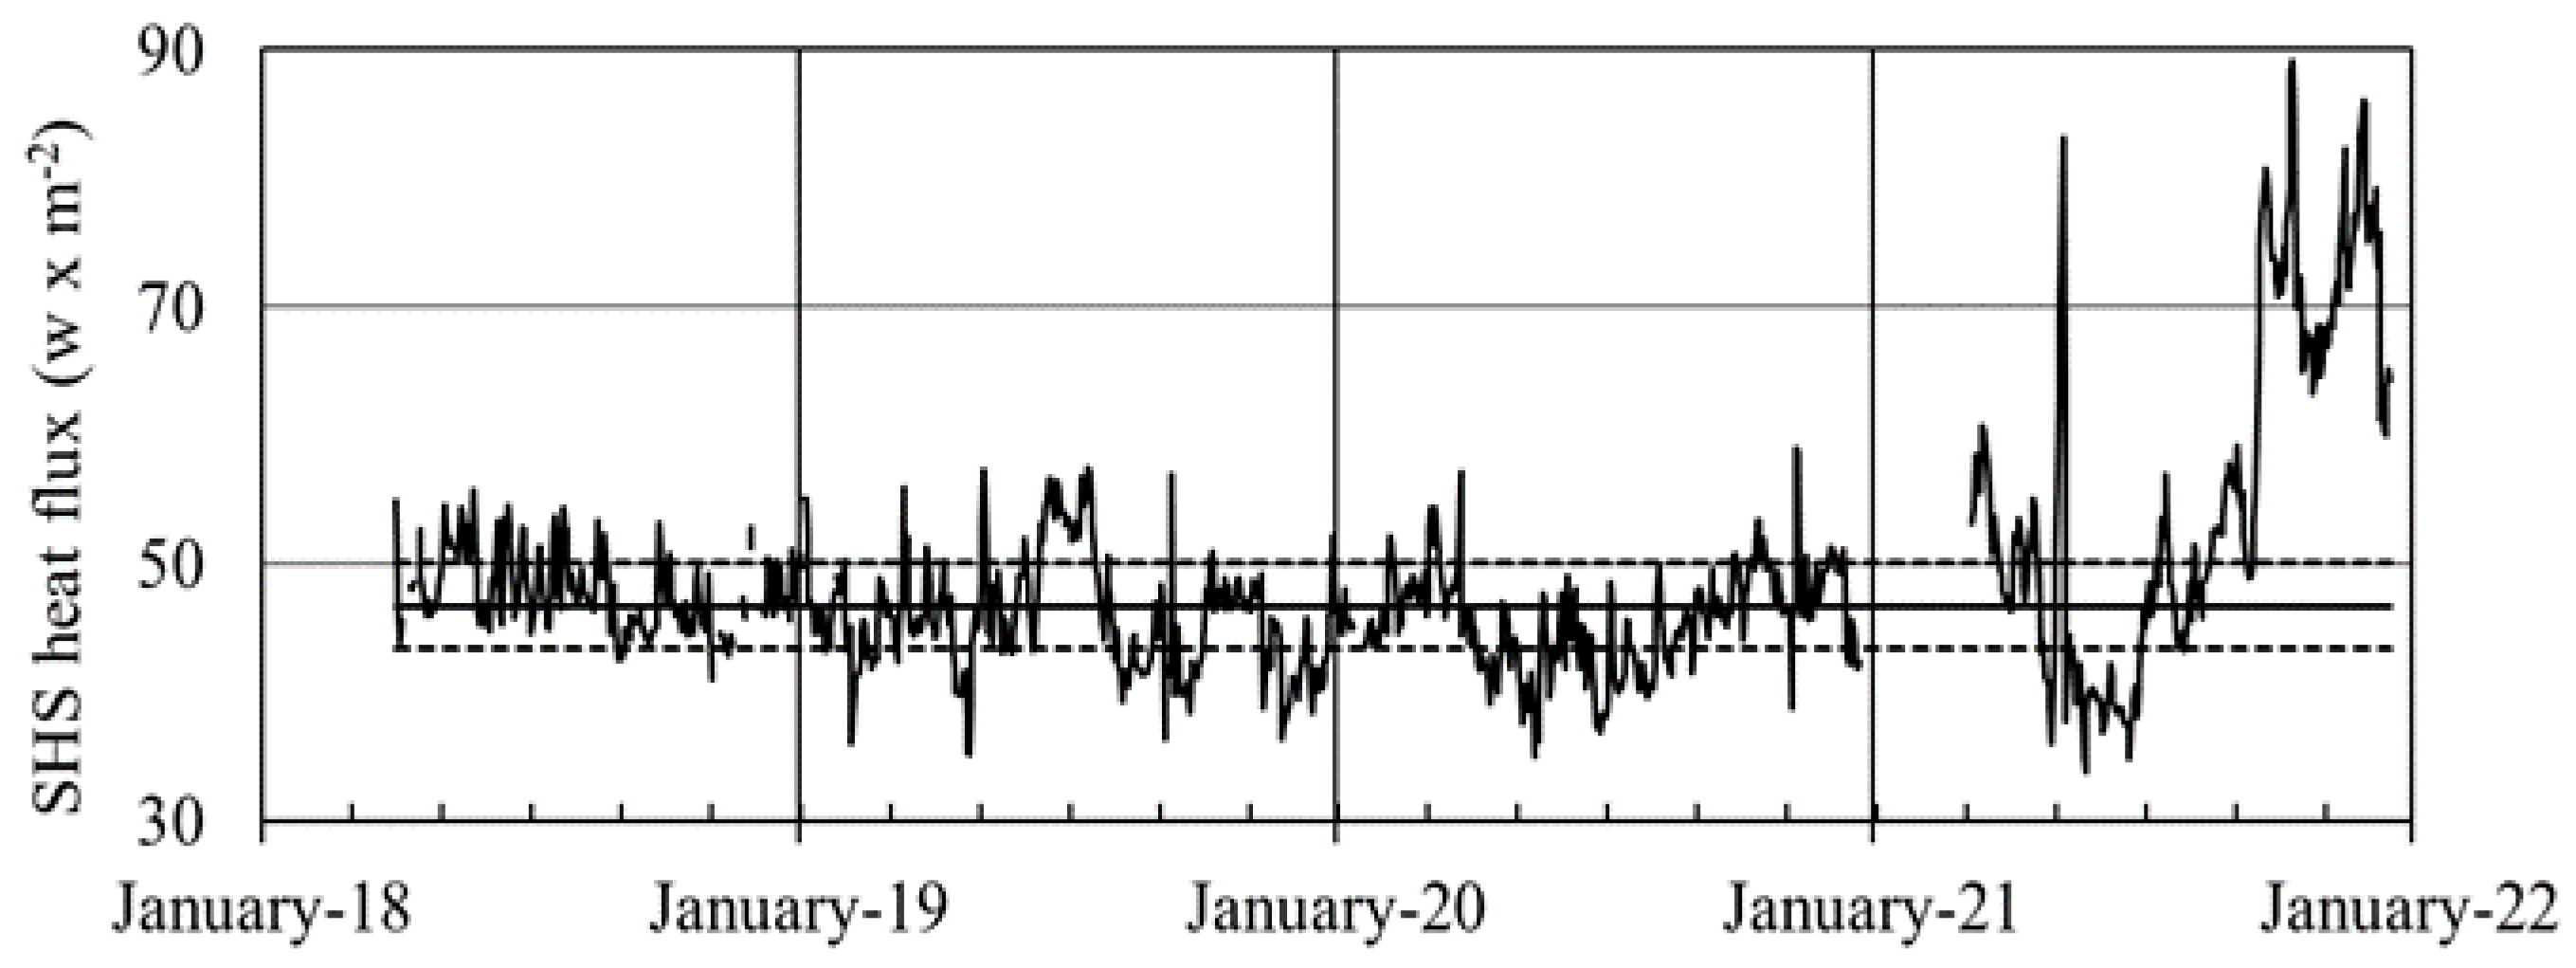
3.5.2. Heat Flux of the Steam Heated Ground (SHS-Flux)
4. Results
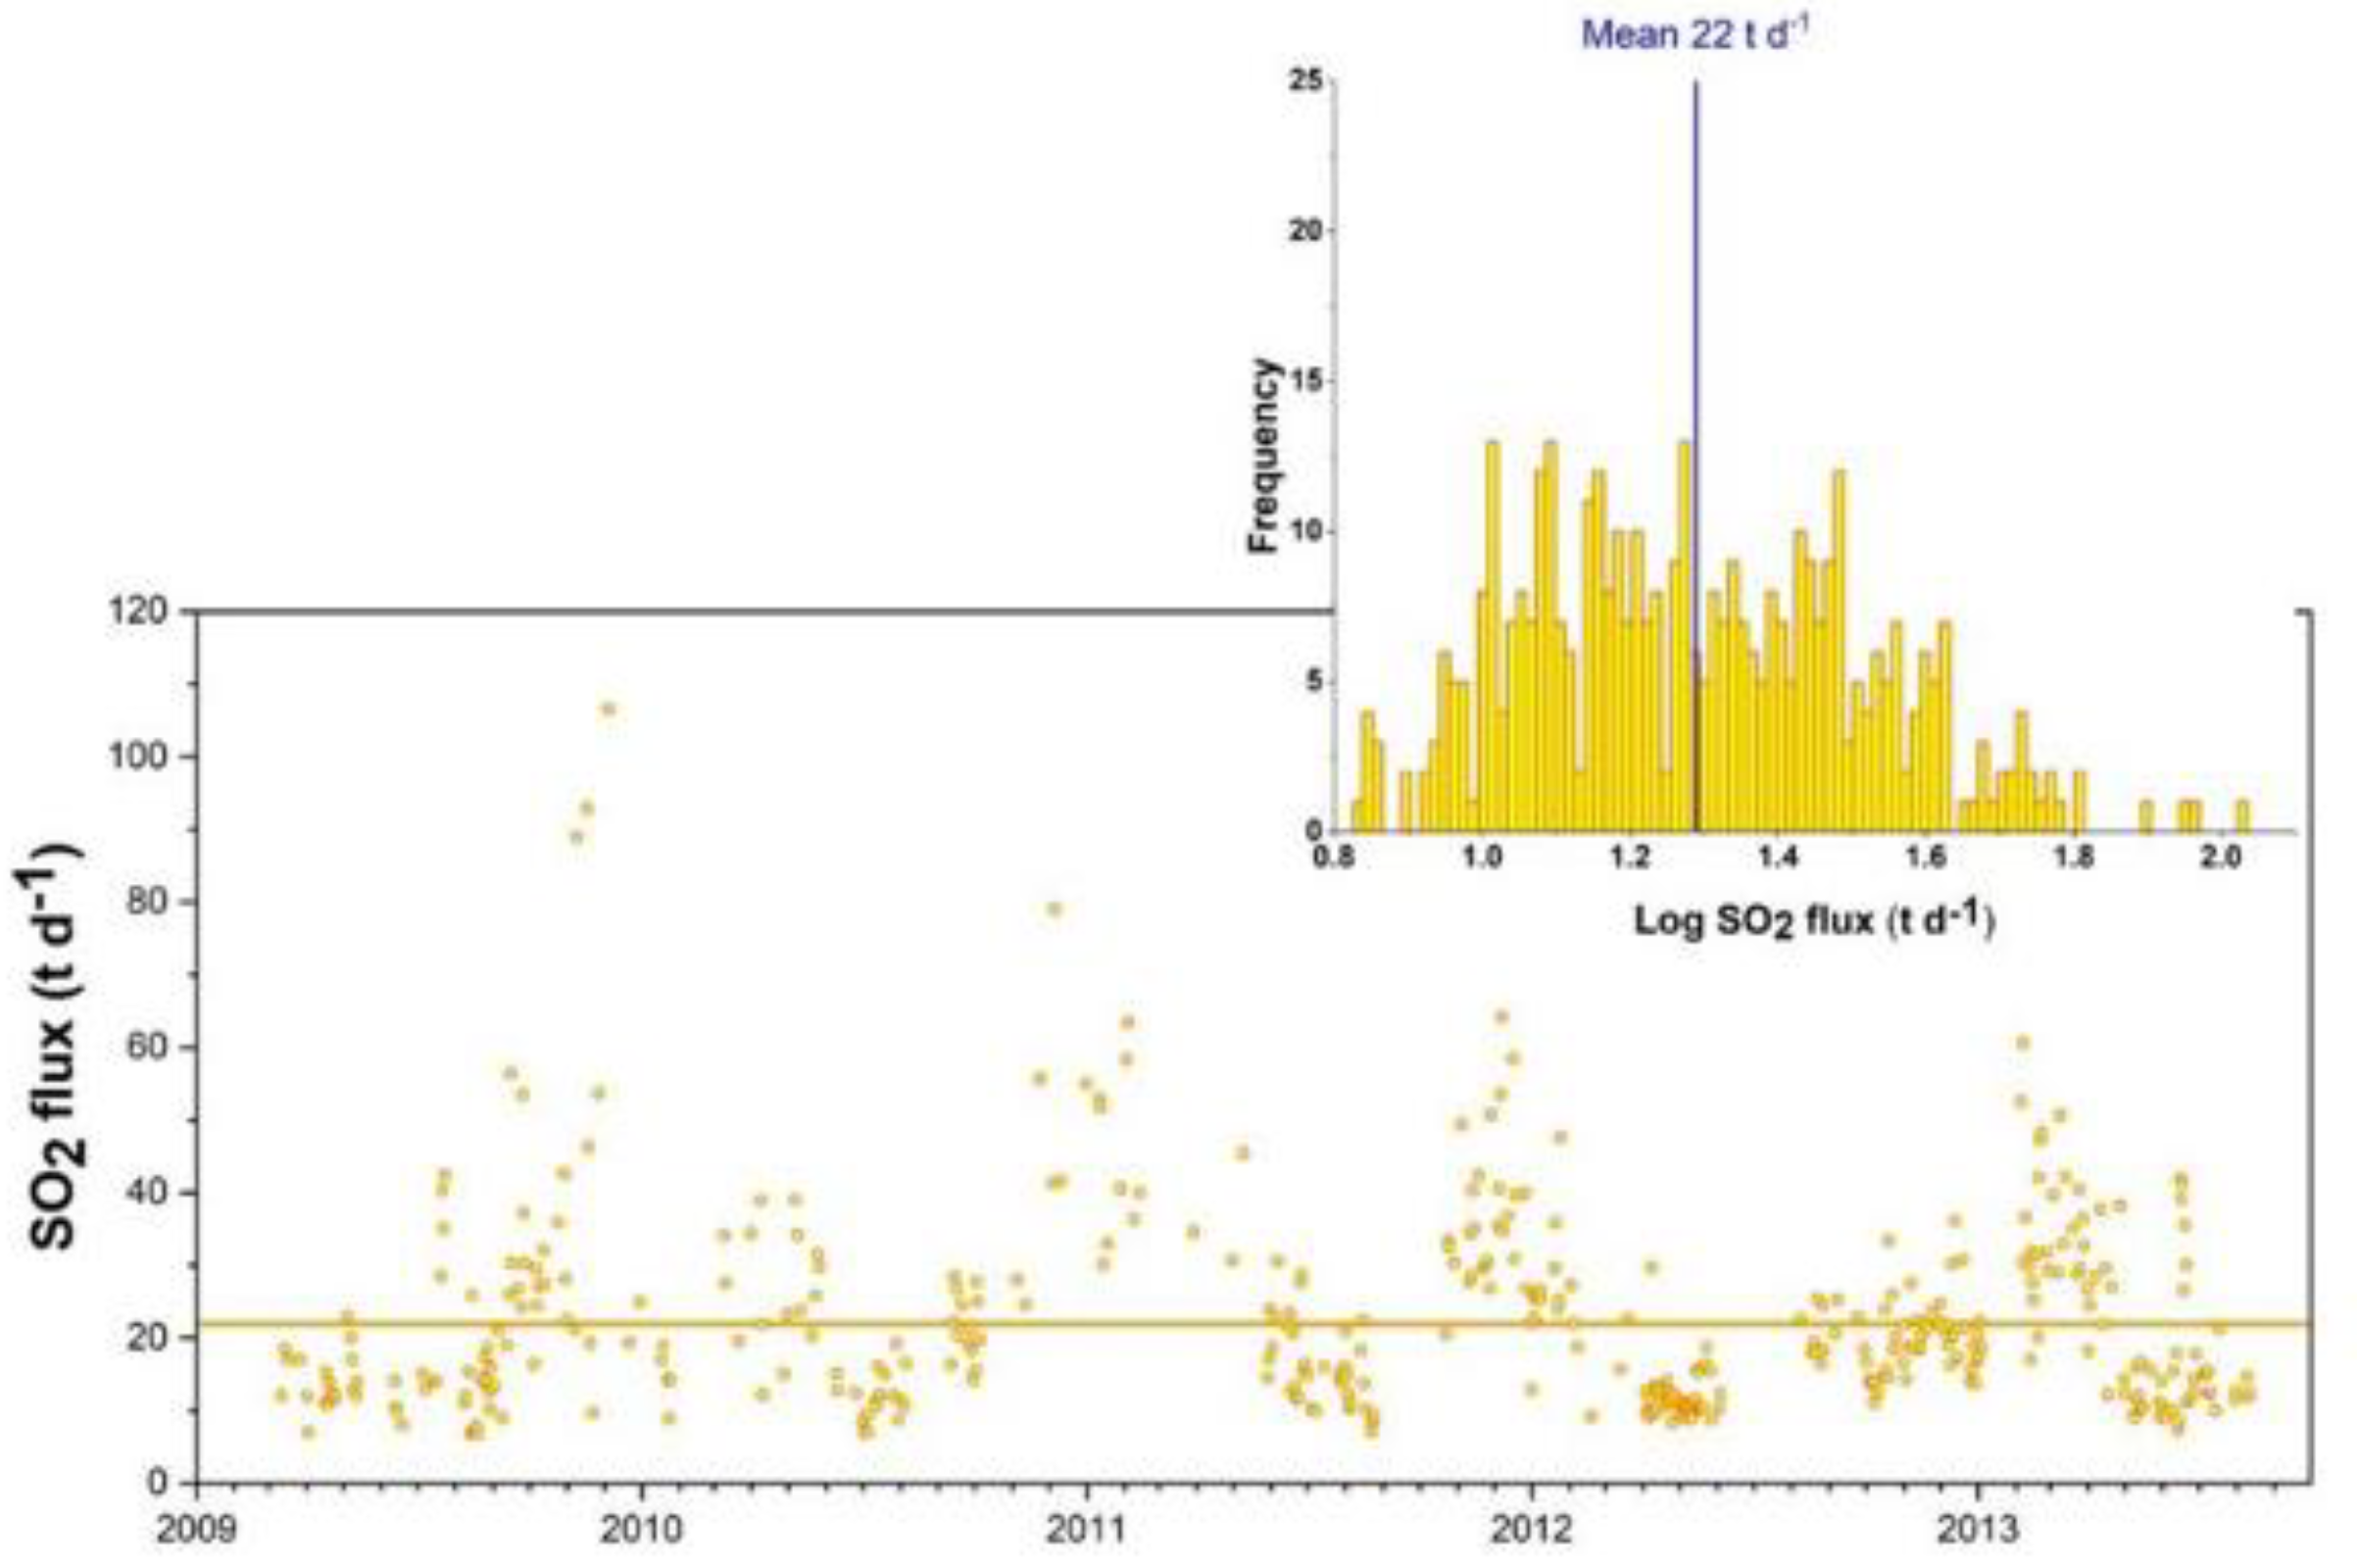
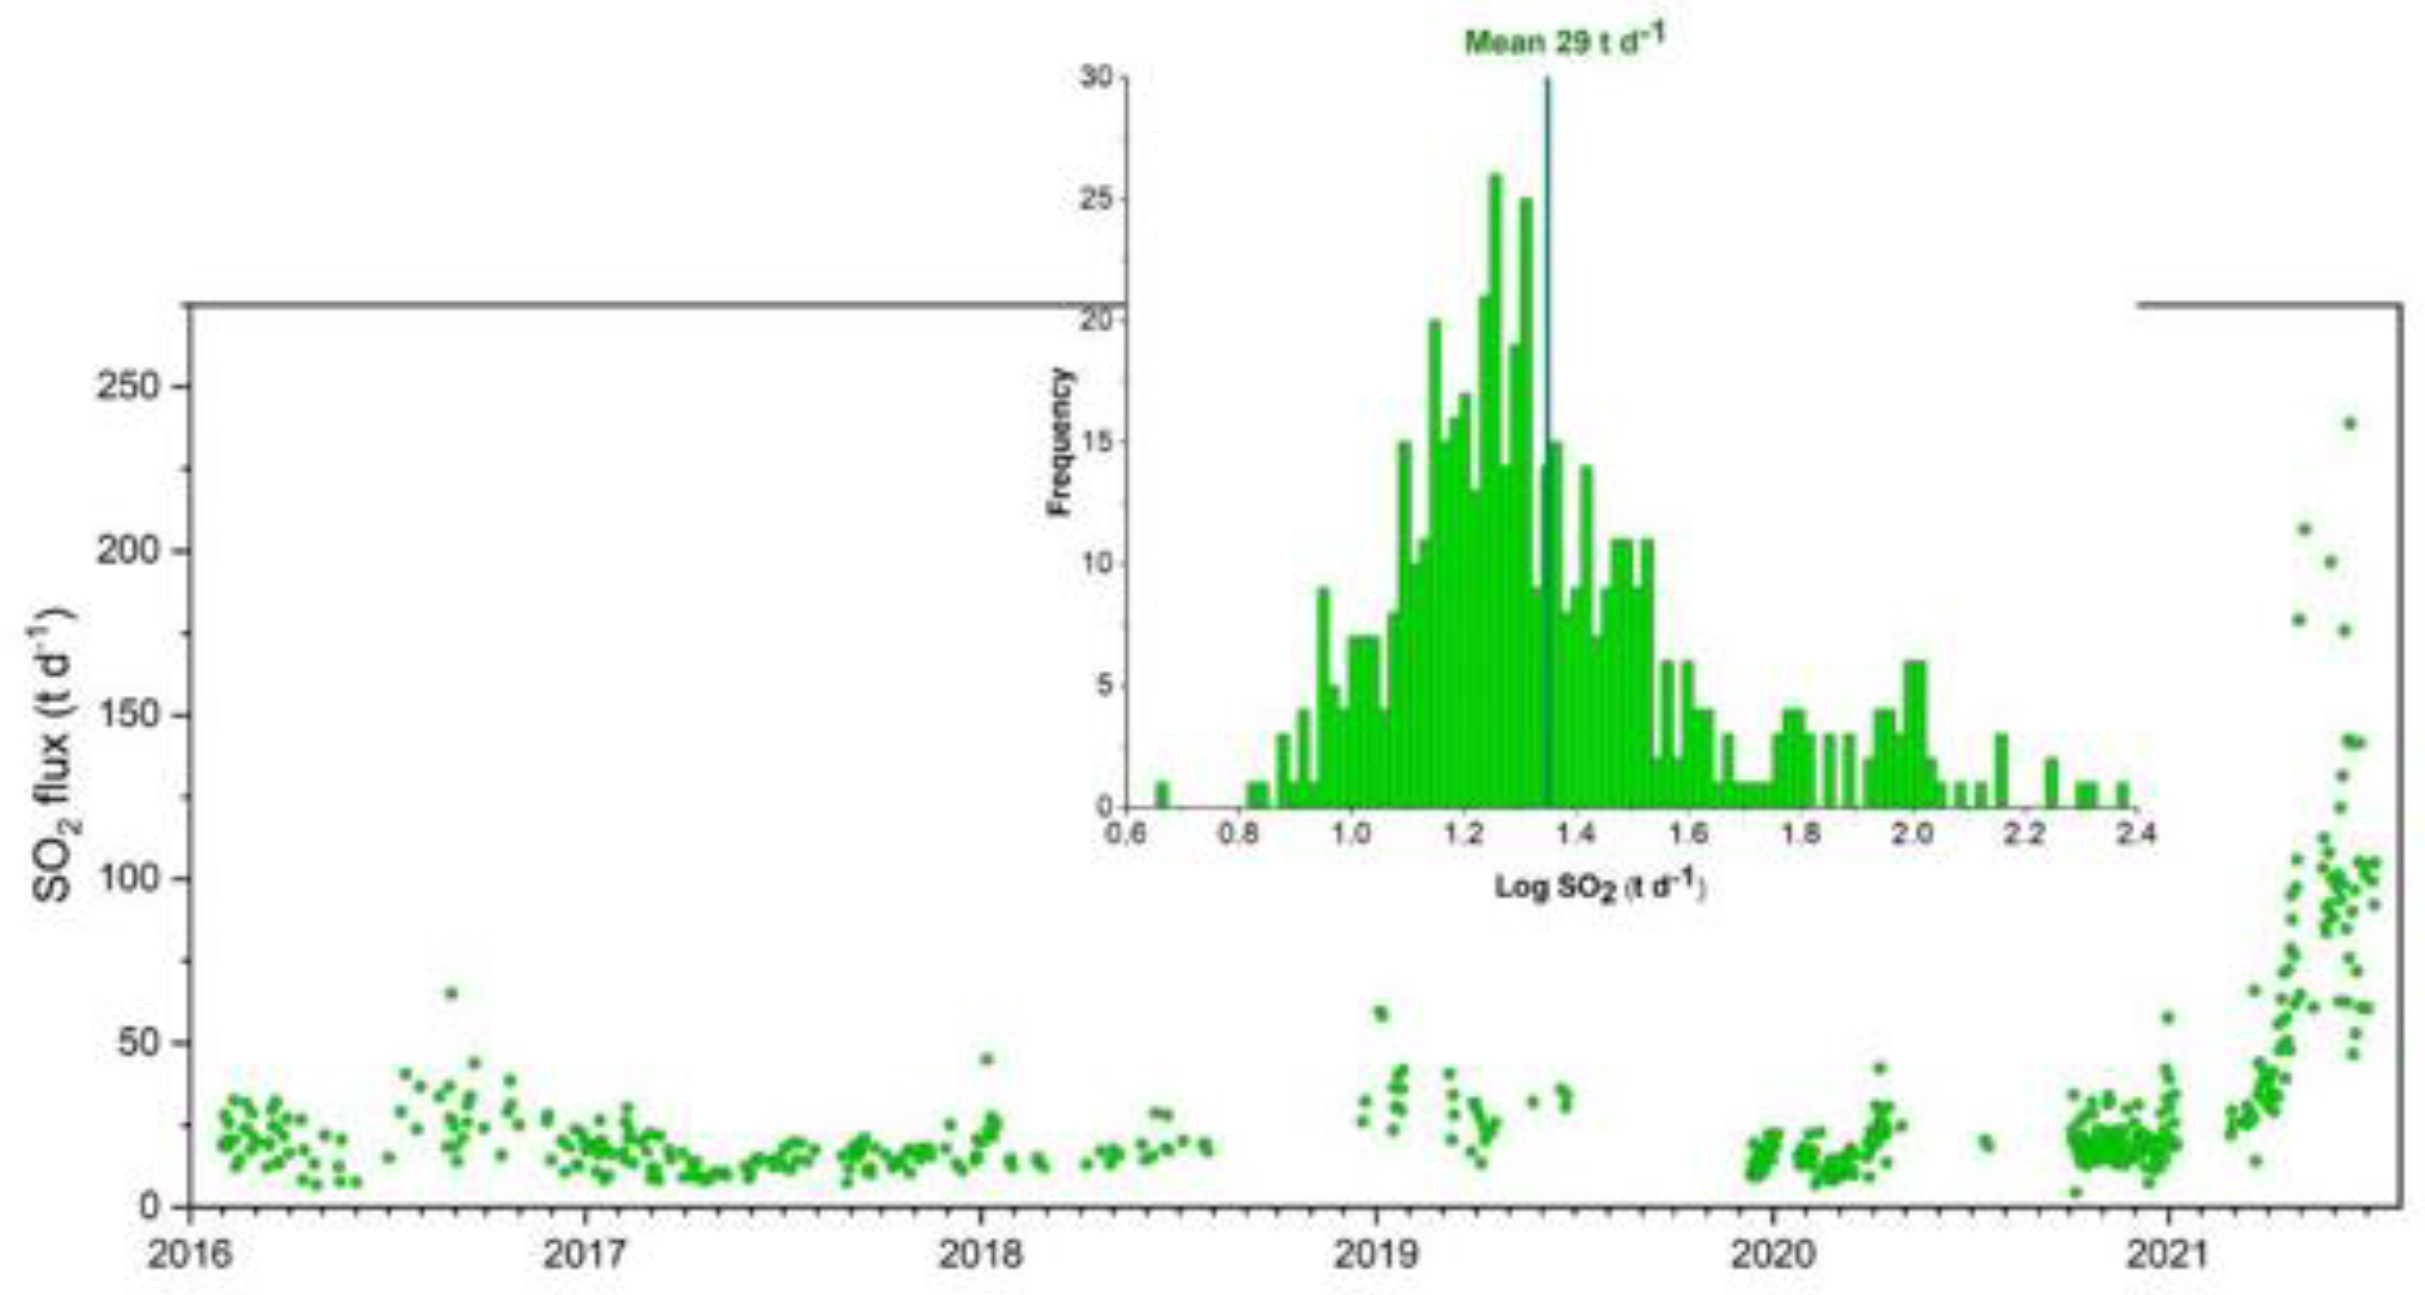
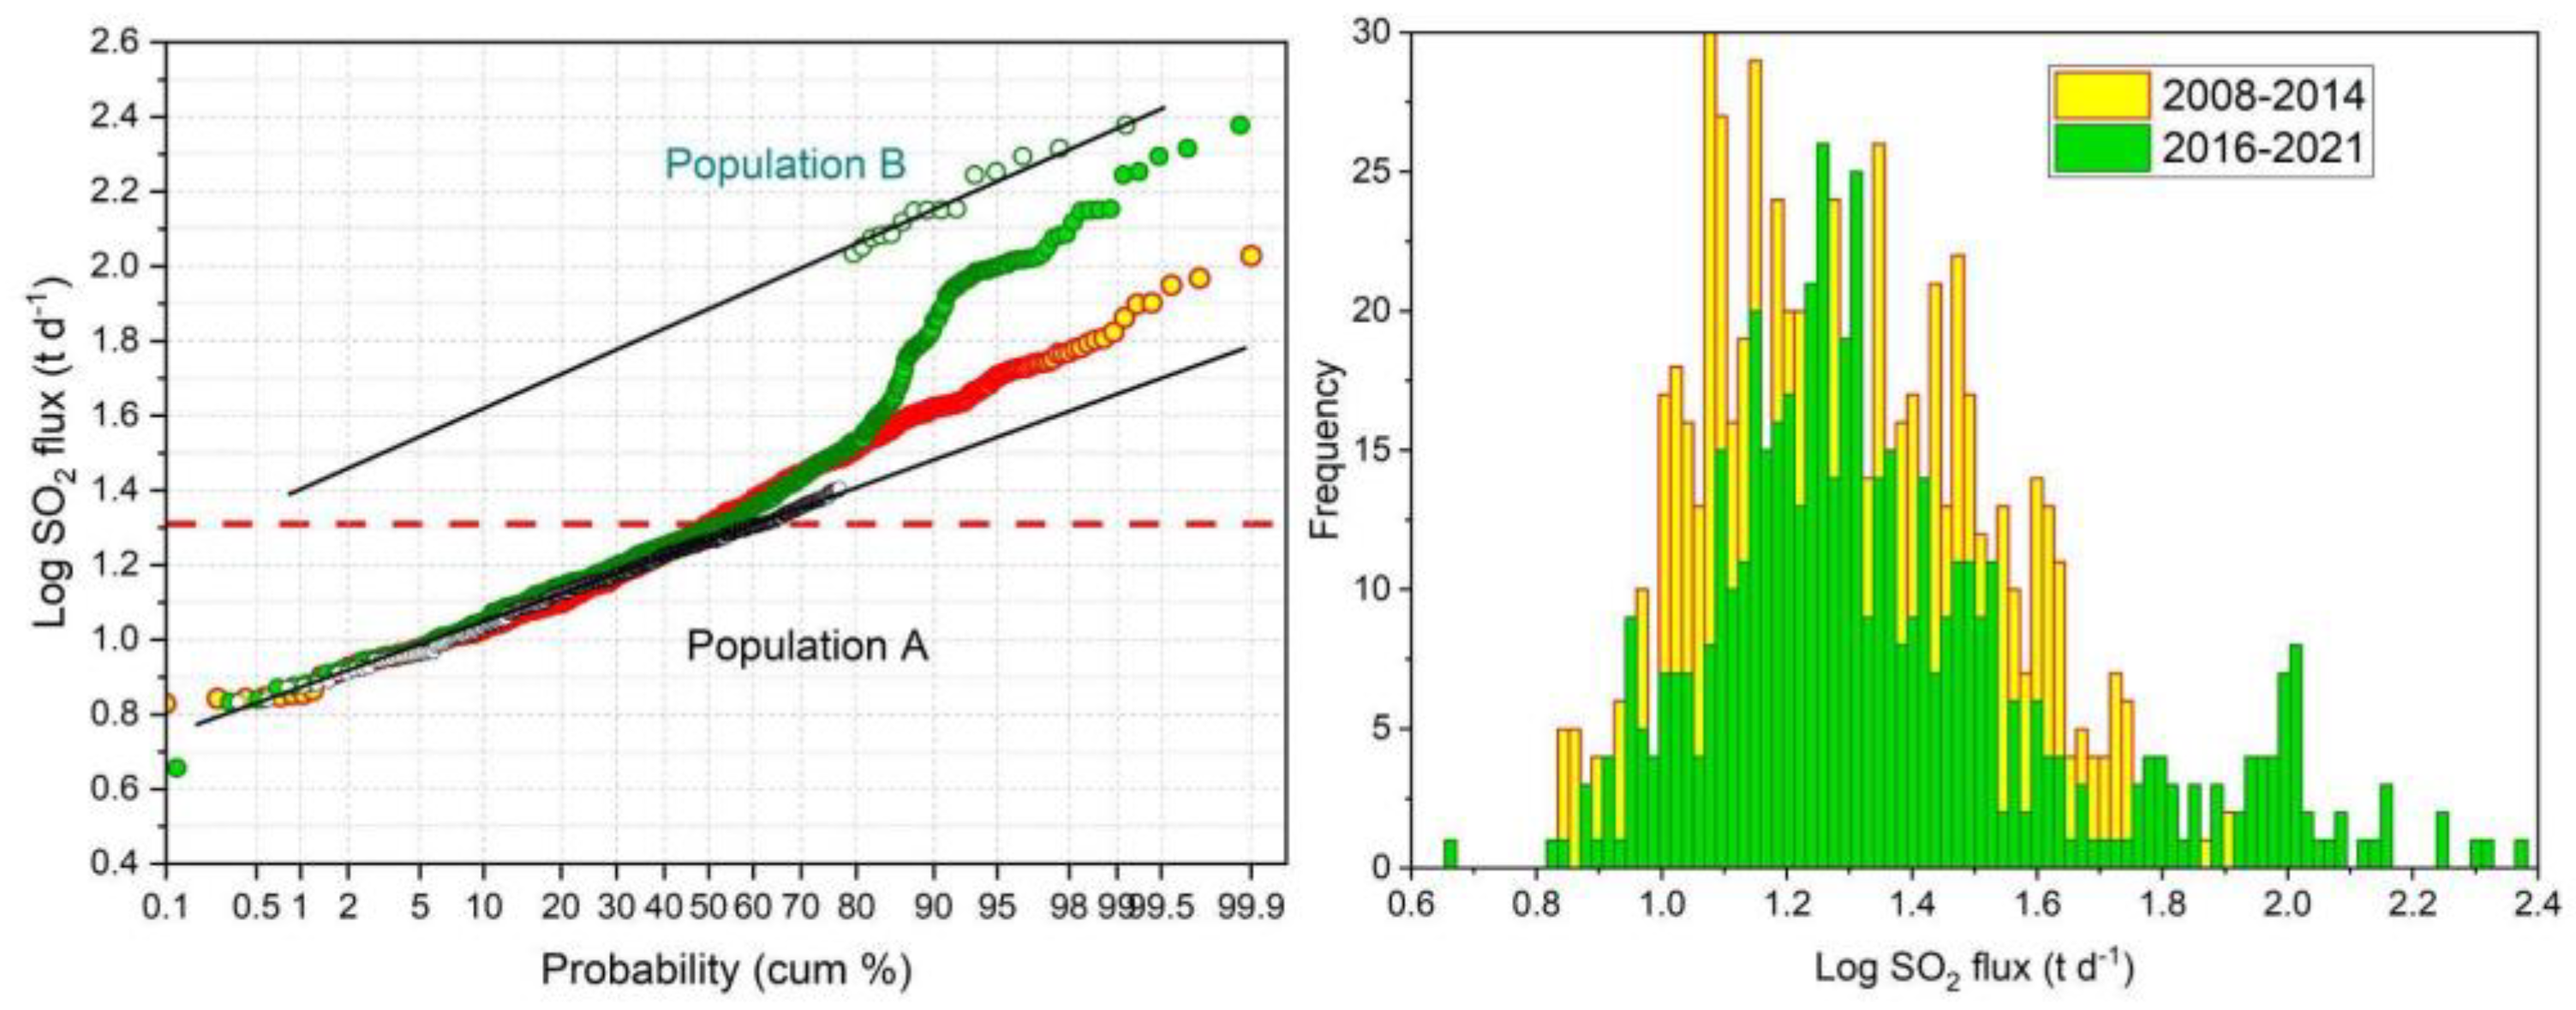
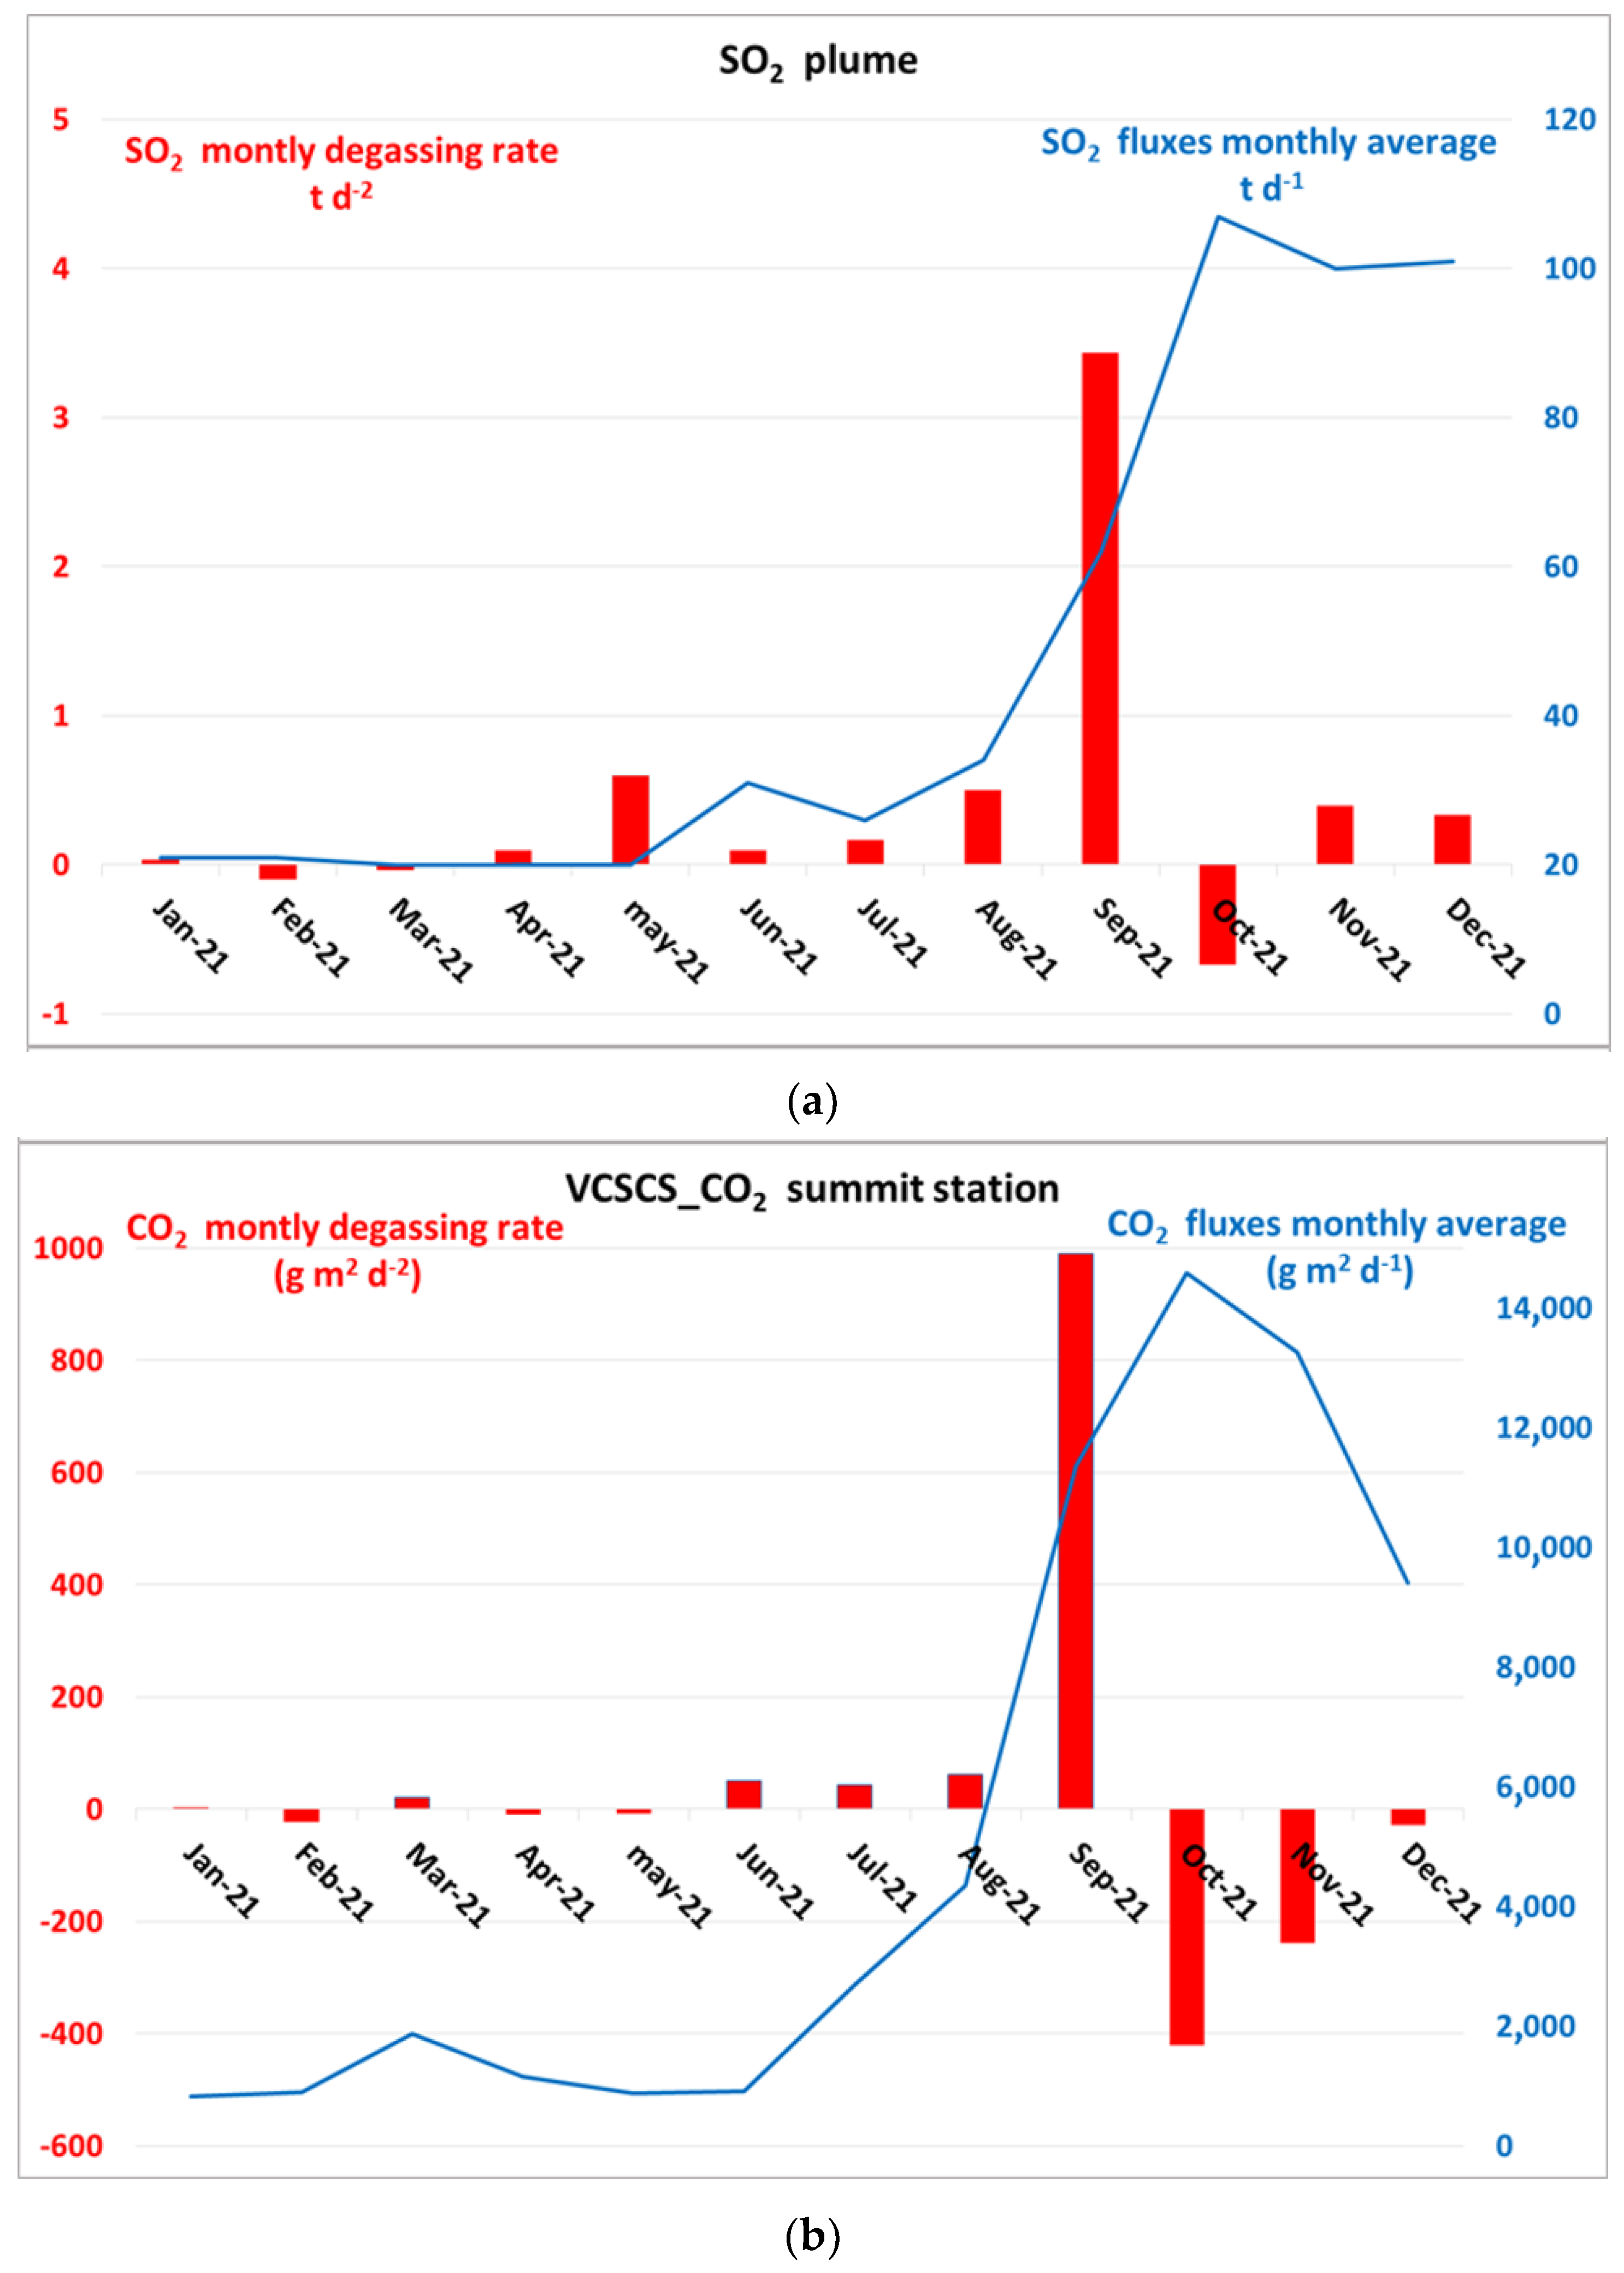
4.1. SO2 Plume Fluxes
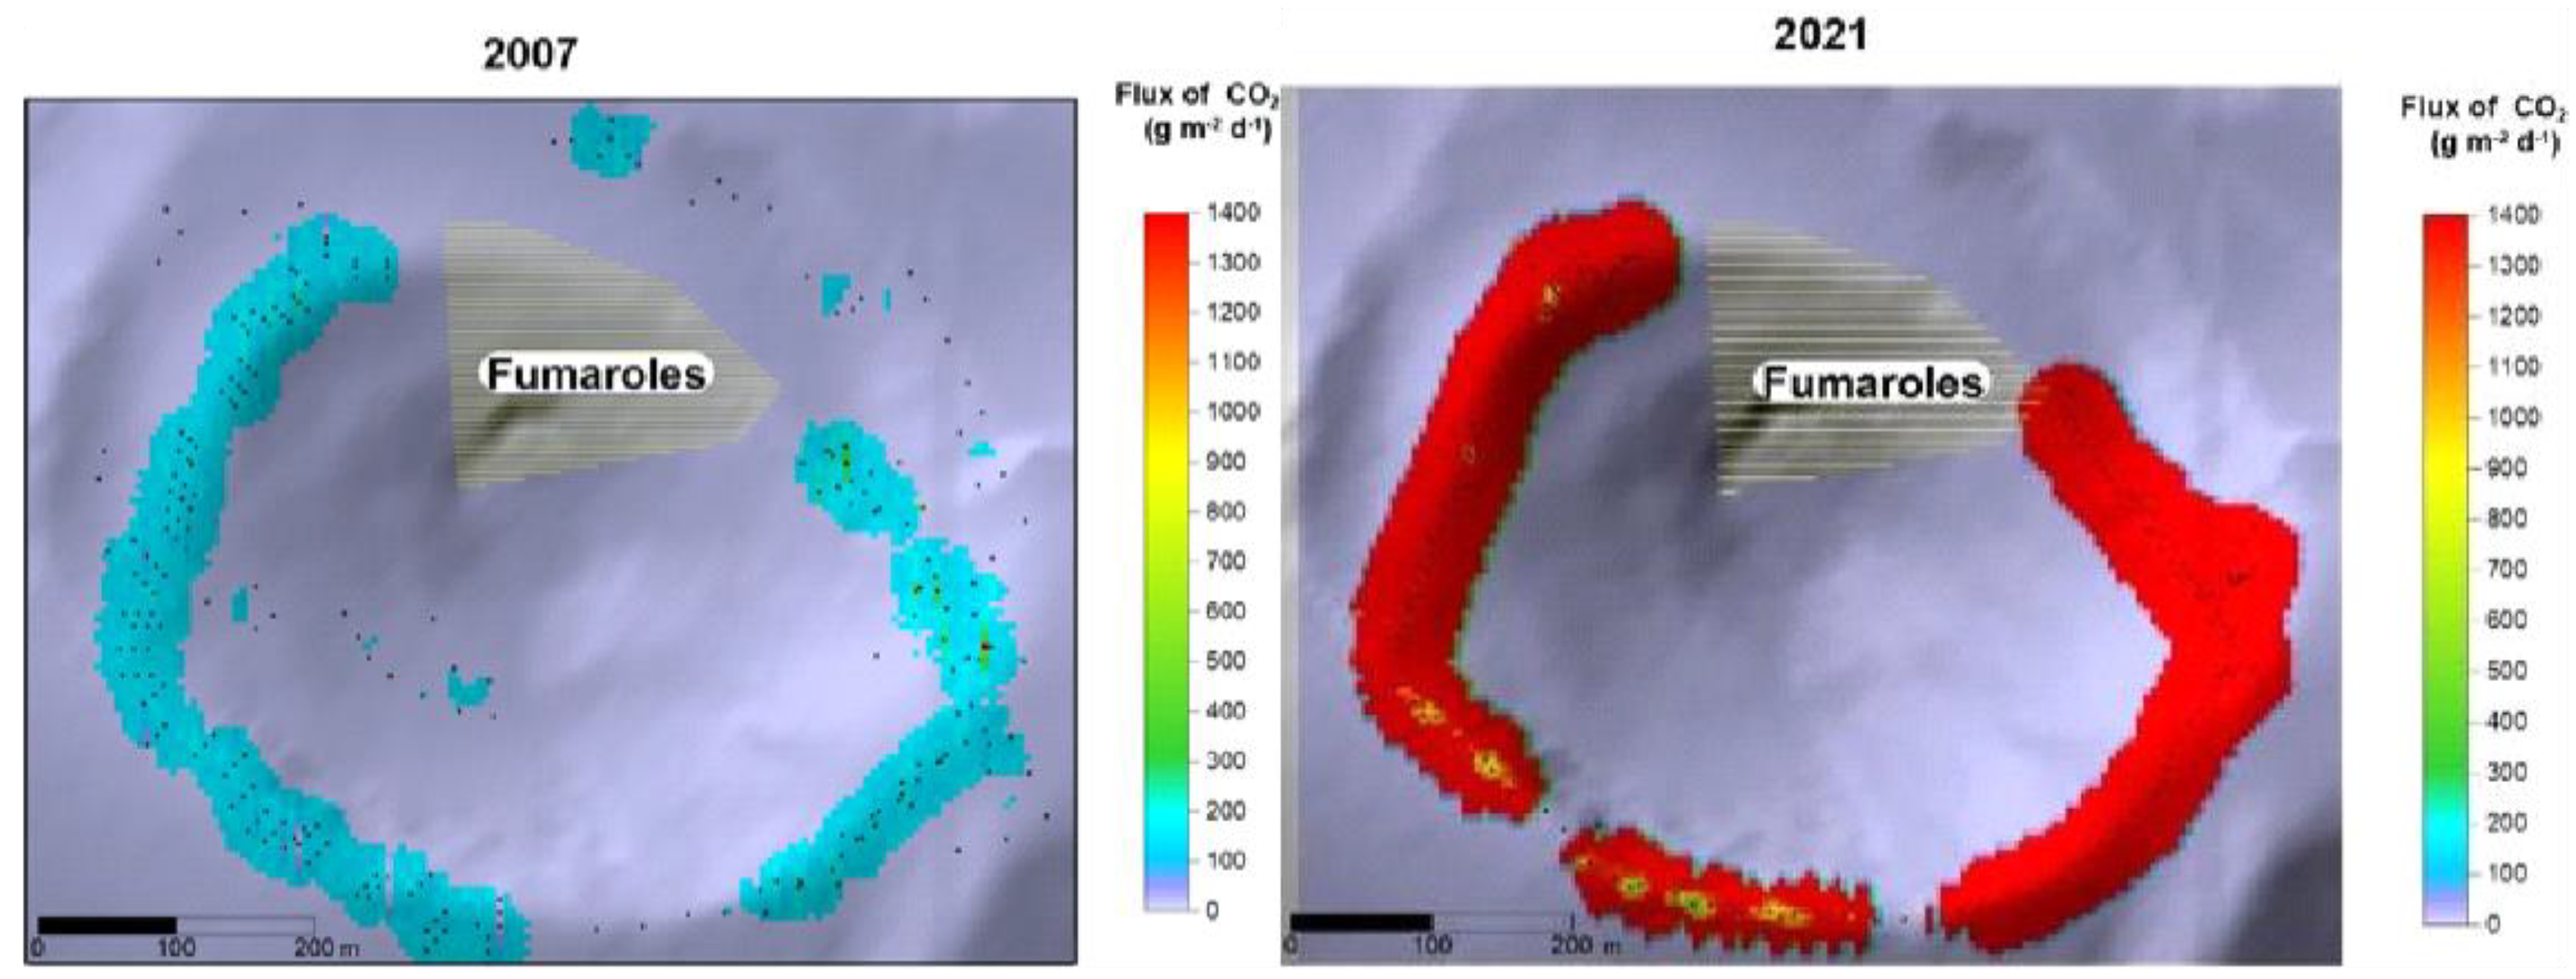
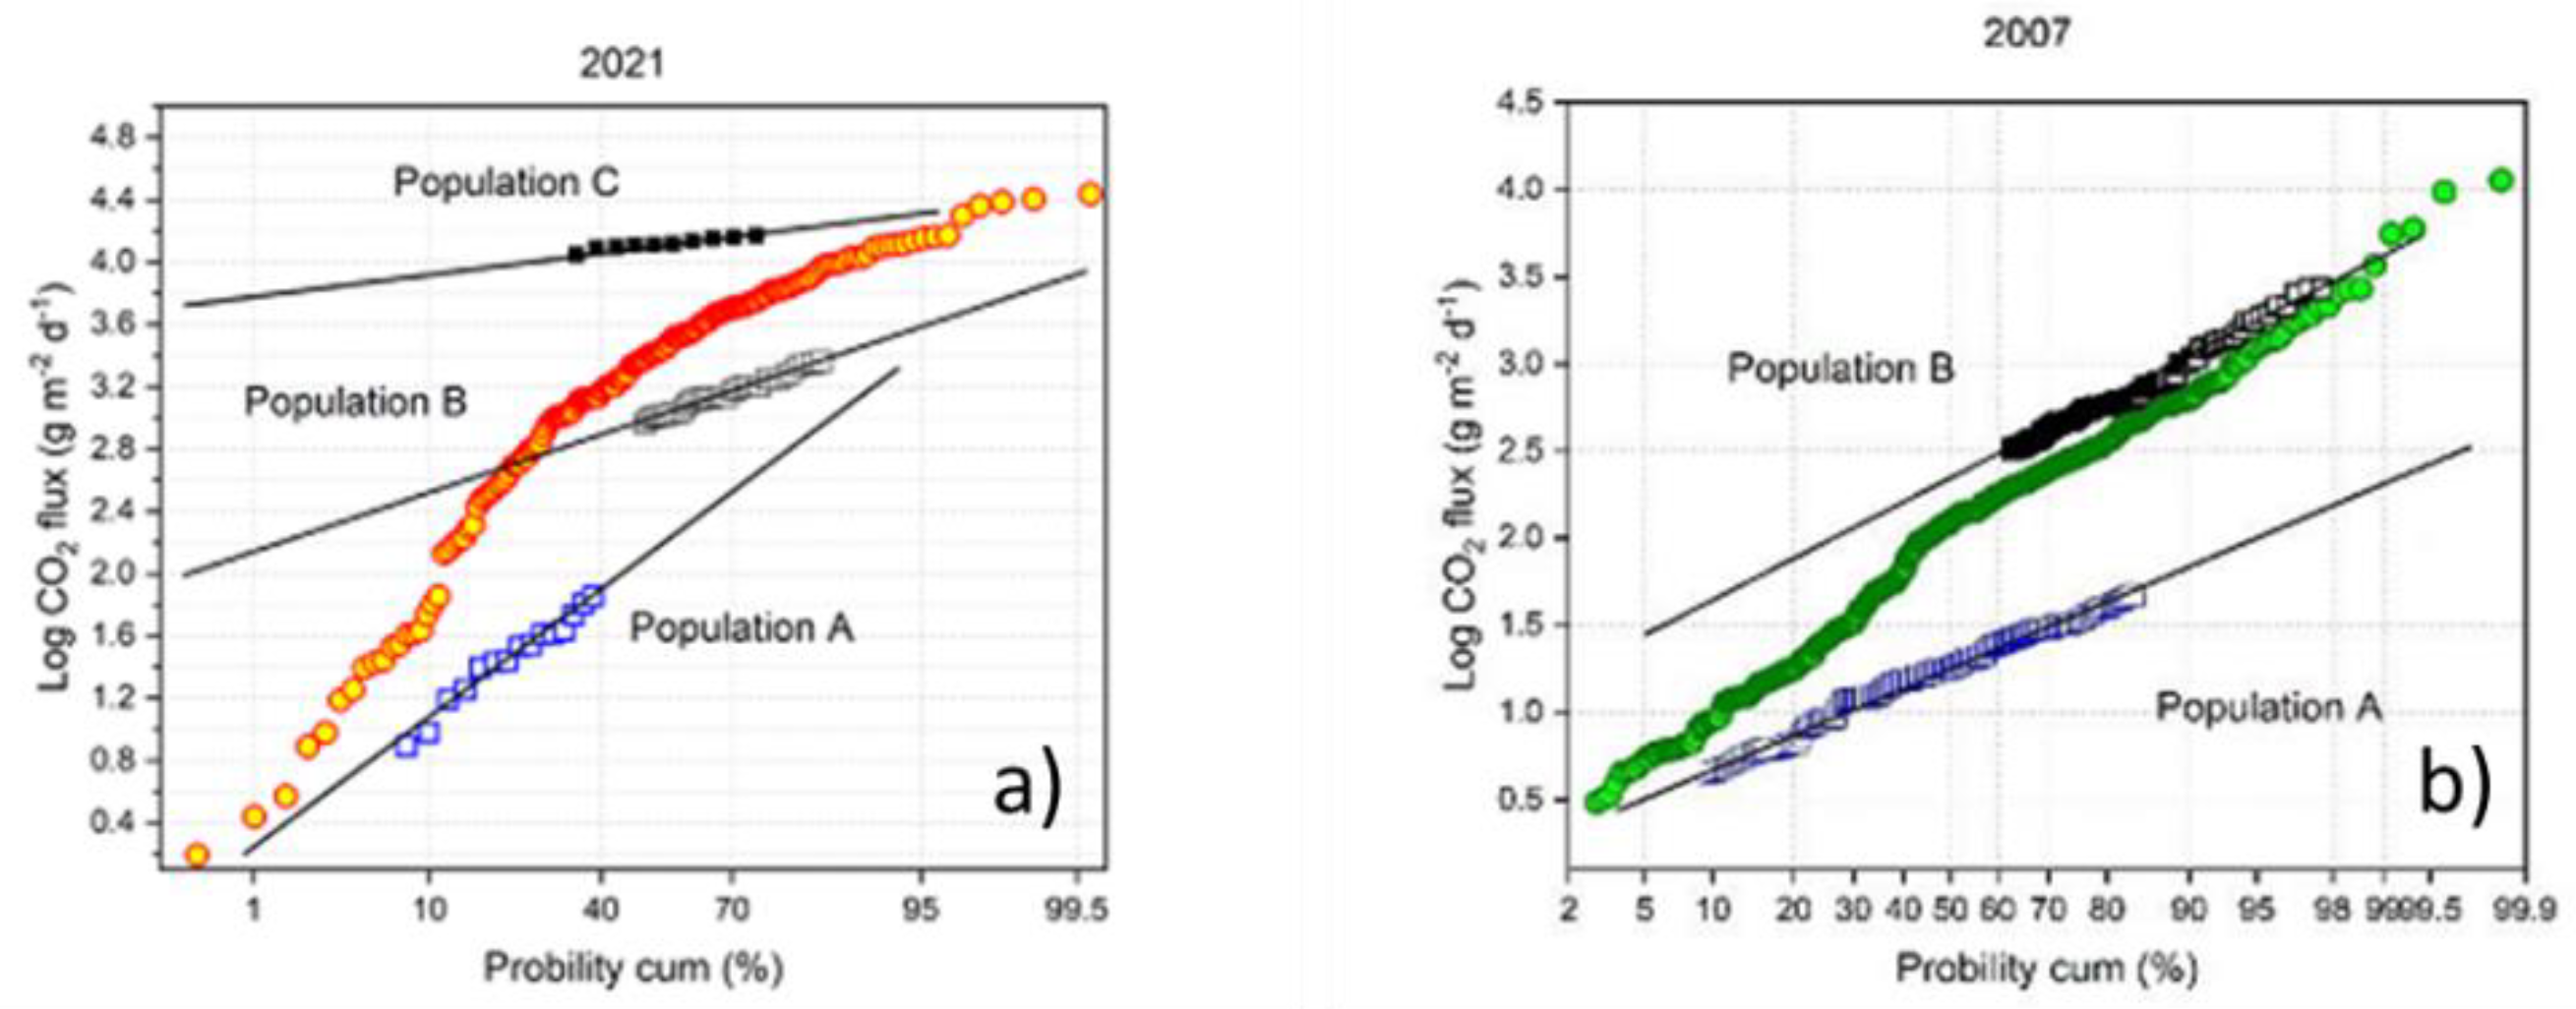
4.2. Soil CO2 Fluxes
4.3. Soil CO2 Output
4.4. Thermal Monitoring
5. Discussion
6. Conclusions
Author Contributions
Funding
Data Availability Statement
Acknowledgments
Conflicts of Interest
References
- Inguaggiato, S.; Diliberto, I.S.; Federico, C.; Paonita, A.; Vita, F. Review of the evolution of geochemical monitoring, networks and methodologies applied to the volcanoes of the Aeolian Arc (Italy). Earth Sci. Rev. 2018, 176, 241–276. [Google Scholar] [CrossRef]
- Diliberto, I.S. Cyclic Behavior in the Fumaroles Output Detected by Direct Measurement of Temperature of the Ground. Eng. Proc. 2021, 5, 47. [Google Scholar] [CrossRef]
- Camarda, M.; De Gregorio, S.; Capasso, G.; Di Martino, R.M.R.; Gurrieri, S.; Prano, V. The monitoring of natural soil CO2 emissions: Issues and perspectives. Earth Sci. Rev. 2019, 198, 102928. [Google Scholar] [CrossRef]
- Capasso, G.; Favara, R.; Inguaggiato, S. Chemical features and isotopic composition of gaseous manifestations on Vulcano Island, Aeolian Islands, Italy: An interpretative model of fluid circulation. Geochim. Cosmochim. Acta 1997, 61, 3425–3440. [Google Scholar] [CrossRef]
- Inguaggiato, S.; Calderone, L.; Inguaggiato, C.; Mazot, A.; Morici, S.; Vita, F. Long-time variation of soil CO2 fluxes at summit crater of Vulcano (Italy). Bull. Volcanol. 2012, 74, 1859–1863. [Google Scholar] [CrossRef]
- Inguaggiato, S.; Mazot, A.; Diliberto, I.S.; Inguaggiato, C.; Madonia, P.; Rouwet, D.; Vita, F. Total CO2 output from Vulcano island (Aeolian Islands, Italy). Geochem. Geophys. Geosys. 2012, 13, 1–19. [Google Scholar] [CrossRef]
- Vita, F.; Inguaggiato, S.; Bobrowski, N.; Calderone, L.; Galle, B.; Parello, F. Continuous SO2 flux measurements for Vulcano Island, Italy. Ann. Geophys. 2012, 55, 2. [Google Scholar] [CrossRef]
- Paonita, A.; Federico, C.; Bonfanti, P.; Capasso, G.; Inguaggiato, S.; Italiano, F.; Madonia, P.; Pecoraino, G.; Sortino, F. The episodic and abrupt geochemical changes at La Fossa fumaroles (Vulcano Island, Italy) and related constraints on the dynamics, structure, and compositions of the magmatic system. Geochim. Cosmochim. Acta. 2013, 120, 158–178. [Google Scholar] [CrossRef]
- Federico, C.; Capasso, G.; Paonita, A.; Favara, R. Effects of steam-heating processes on a stratified volcanic aquifer: Stable isotopes and dissolved gases in thermal waters of Vulcano Island (Aeolian archipelago). J. Volcanol. Geotherm. Res. 2010, 192, 178–190. [Google Scholar] [CrossRef]
- Aiuppa, A.; Burton, M.; Mure, F.; Inguaggiato, S. Intercomparison of volcanic gas monitoring methodologies performed on Vulcano Island, Italy. Geophys. Res. Lett. 2004, 31, L02610. [Google Scholar] [CrossRef]
- Aiuppa, A.; Inguaggiato, S.; McGonigle, A.J.S.; O’Dwyer, M.; Oppenheimer, C.; Padgett, M.J.; Rouwet, D.; Valenza, M. H2S fluxes from Mt. Etna, Stromboli, and Vulcano (Italy) and implications for the sulfur budget at volcanoes. Geochim. Cosmochim. Acta 2004, 69, 1861–1871. [Google Scholar] [CrossRef]
- O’Dwyer, M.; Padgett, M.J.; McGonigle, A.J.S.; Oppenheimer, C.; Inguaggiato, S. Real-time measurement of volcanic H2S and SO2 concentrations by UV spectroscopy. Geopys. Res. Lett. 2003, 30, 1652. [Google Scholar] [CrossRef]
- Carapezza, M.; Nuccio, P.M.; Valenza, M. Genesis and evolution of the fumaroles of vulcano (Aeolian Islands, Italy): A geochemical model. Bull. Volcanol. 1981, 44, 547–563. [Google Scholar] [CrossRef]
- Barberi, F.; Neri, G.; Valenza, M.; Villari, L. 1987–1990 unrest at Vulcano. Acta Vulcanol. 1991, 1, 95–106. [Google Scholar]
- Capasso, G.; Inguaggiato, S.; Nuccio, P.M.; Pecoraino, G.; Sortino, F. Compositional evolution of the fumarolic gases emitted at the crater of Vulcano during 1987–1993. In Proceedings of the Independent Publishers Group World Organization of Volcano Observatories Meeting, Guadalupe, CA, USA, 13–17 December 1993; pp. 109–126. [Google Scholar]
- Cioni, R.; D’Amore, F. A genetic model for the crater fumaroles of Vulcano island (Sicily, Italy). Geothermics 1984, 13, 375–384. [Google Scholar] [CrossRef]
- Chiodini, G.; Cioni, R.; Falsaperla, S.; Guidi, M.; Marini, L.; Montalto, A. Geochemical and seismological investigations at Vulcano (Aeolian Islands) during 1978–1989. J. Geophys. Res. 1992, 97, 11025–11032. [Google Scholar] [CrossRef]
- Badalamenti, B.; Chiodini, G.; Cioni, R.; Favara, R.; Francofonte, S.; Gurrieri, S.; Hauser, S.; Inguaggiato, S.; Italiano, F.; Magro, G.; et al. Special field workshop at Vulcano (Aeolian Islands) during summer 1988. Geochemical results. Acta Vulcanol. 1991, 1, 223–227. [Google Scholar]
- Capasso, G.; Favara, R.; Francofonte, S.; Inguaggiato, S. Chemical and isotopic variations in fumarolic discharge and thermal waters at Vulcano Island (Aeolian Island, Italy) during 1996: Evidence of resumed volcanic activity. J. Volcanol. Geotherm. Res. 1999, 88, 167–175. [Google Scholar] [CrossRef]
- Diliberto, I.S. Long-term monitoring on a closed-conduit volcano: A 25-year long time-series of temperatures recorded at La Fossa cone (Vulcano Island). J. Volcanol. Geotherm. Res. 2017, 346, 151–160. [Google Scholar] [CrossRef]
- Cannata, A.; Diliberto, I.S.; Alparone, S.; Gambino, S.; Gresta, S.; Liotta, M.; Madonia, P.; Milluzzo, V.; Aliotta, M.; Montalto, P. Multiparametric Approach in Investigating Volcano-Hydrothermal Systems: The Case Study of Vulcano (Aeolian Islands, Italy). Pure Appl. Geophys. 2012, 169, 167–182. [Google Scholar] [CrossRef]
- Capasso, G.; Federico, C.; Madonia, P.; Paonita, A. Response of the shallow aquifer of the volcano-hydrothermal system during the recent crises at Vulcano Island (Aeolian Archipelago, Italy). J. Volcanol. Geotherm. Res. 2014, 273, 70–80. [Google Scholar] [CrossRef]
- Girona, T.; Costa, F.; Newhall, C.; Taisne, B. On depressurization of volcanic magma reservoirs by passive degassing. J. Geophys. Res. Solid Earth 2014, 119, 8667–8687. [Google Scholar] [CrossRef]
- Maldonado, L.F.M.; Inguaggiato, S.; Jaramillo, M.T.; Garzon Valencia, G.; Mazot, A. Volatiles and energy released by Puracè volcano. Bull. Volcanol. 2017, 79, 84. [Google Scholar] [CrossRef]
- Inguaggiato, S.; Vita, F.; Cangemi, M.; Mazot, A.; Sollami, A.; Calderone, L.; Morici, S.; Jacome Paz, M.P. Stromboli volcanic activity variations inferred by fluids geochemistry observations: Sixteen years of continuous soil CO2 fluxes monitoring (2000–2015). Chem. Geol. 2017, 469, 69–84. [Google Scholar] [CrossRef]
- Inguaggiato, S.; Cardellini, C.; Taran, Y.; Kalacheva, E. The CO2 flux from hydrothermal systems of the Karymsky volcanic Centre, Kamchatka. J. Volcanol. Geotherm. Res. 2017, 346, 1–9. [Google Scholar] [CrossRef]
- Inguaggiato, S.; Vita, F.; Rouwet, D.; Bobrowski, N.; Morici, S.; Sollami, A. Geochemical evidence of the renewal of volcanic activity inferred from CO2 soil and SO2 plume fluxes: The 2007 Stromboli eruption (Italy). Bull. Volcanol. 2011, 73, 443–456. [Google Scholar] [CrossRef]
- Inguaggiato, S.; Vita, F.; Cangemi, M.; Calderone, L. Increasing Summit Degassing at the Stromboli Volcano and Relationships with Volcanic Activity (2016–2018). Geosciences 2019, 9, 176. [Google Scholar] [CrossRef] [Green Version]
- Inguaggiato, S.; Vita, F.; Cangemi, M.; Calderone, L. Changes in CO2 Soil Degassing Style as a Possible Precursor to Volcanic Activity: The 2019 Case of Stromboli Paroxysmal Eruptions. Appl. Sci. 2020, 10, 4757. [Google Scholar] [CrossRef]
- Inguaggiato, S.; Vita, F.; Cangemi, M.; Inguaggiato, C.; Calderone, L. The Monitoring of CO2 Soil Degassing as Indicator of Increasing Volcanic Activity: The Paroxysmal Activity at Stromboli Volcano in 2019–2021. Geosciences 2021, 11, 169. [Google Scholar] [CrossRef]
- Jacome Paz, M.P.; Taran, Y.; Inguaggiato, S.; Collard, N. CO2 flux and chemistry of El Chichon crater lake (Mexico) in the period 2013–2015: Evidence for the enhanced volcano activity. Geophys. Res. Lett. 2016, 43, 127–134. [Google Scholar] [CrossRef] [Green Version]
- Diliberto, I.S.; Gurrieri, S.; Valenza, M. Relationships between diffuse CO2 emissions and volcanic activity on the island of Vulcano (Aeolian Islands, Italy) during the period 1984–1994. Bull. Volcanol. 2002, 64, 219–228. [Google Scholar] [CrossRef]
- Granieri, D.; Carapezza, M.L.; Chiodini, G.; Avino, R.; Caliro, S.; Ranaldi, M.; Tarchini, L. Correlated increase in CO2 fumarolic content and diffuse emission from La Fossa crater (Vulcano, Italy): Evidence of volcanic unrest or increasing gas release from a stationary deep magma body? Geophys. Res. Lett. 2006, 33, L13316. [Google Scholar] [CrossRef]
- Carapezza, M.L.; Granieri, D. CO2 soil flux at Vulcano (Italy): Comparison of active and passive methods and application to the identification of actively degassing structure. Appl. Geochem. 2004, 19, 73–88. [Google Scholar] [CrossRef]
- Chiodini, G.; Granieri, D.; Avino, R.; Caliro, S.; Costa, A.; Werner, C. Carbon dioxide diffuse degassing and estimation of heat release from volcanic and hydrothermal systems. J. Geophys. Res. 2005, 110, B08204. [Google Scholar] [CrossRef]
- Aubert, M.; Diliberto, S.; Finizola, A.; Chebli, Y. Double origin of hydrothermal convective flux variations in the Fossa of Vulcano (Italy). Bull. Volcanol. 2008, 70, 743–751. [Google Scholar] [CrossRef]
- Aubert, M.; Alparone, S. Variation d’origine sismique du flux de chaleur convectif dans La Fossa de Vulcano (Italie). Comptes Rendus L’academie Sci. Ser. II A Earth Planet Sci. 2000, 330, 603–610. [Google Scholar] [CrossRef]
- Diliberto, I.S. Long-term variations of fumaroles temperatures on Vulcano Island (Italy). Ann. Geophys. 2011, 54, 2011. [Google Scholar] [CrossRef]
- Diliberto, I.S. Time series analysis of high temperature fumaroles monitored on the island of Vulcano (Aeolian Archipelago, italy). J. Volcanol. Geotherm. Res. 2013, 264, 150–163. [Google Scholar] [CrossRef]
- Ruch, J.; Vezzoli, L.; De Rosa, R.; Di Lorenzo, R.; Acocella, V. Magmatic control along a strike—Slip volcanic arc: The central Aeolian arc (Italy). Tectonics 2016, 35, 407–424. [Google Scholar] [CrossRef] [Green Version]
- Peccerillo, A.; De Astis, G.; Faraone, D.; Forni, F.; Frezzotti, M.L. Compositional variations of magmas in the Aeolian arc: Implications for petrogenesis and geodynamics. Geol. Soc. Lond. Mem. 2013, 37, 491–510. [Google Scholar] [CrossRef]
- Peccerillo, A.; Frezzotti, M.L.; De Astis, G.; Ventura, G. Modeling the magma plumbing system of Vulcano (Aeolian Islands, Italy) by integrated fluid-inclusion geobarometry, petrology, and geophysics. Geology 2006, 34, 17–20. [Google Scholar] [CrossRef]
- De Astis, G.; Lucchi, F.; Dellino, P.; La Volpe, L.; Tranne, C.A.; Frezzotti, M.L.; Peccerillo, A. Geology, volcanic history and petrology of Vulcano (central Aeolian archipelago). Geol. Soc. Lond. Mem. 2013, 37, 281–349. [Google Scholar] [CrossRef]
- Neri, G.; Barberi, B.; Oliva, G.; Orecchio, B. Spatial variation of seismogenic stress orientations in Sicily, south Italy. Phys. Earth Planet. Inter. 2005, 148, 175–191. [Google Scholar] [CrossRef]
- Goes, S.; Giardini, D.; Jenny, S.; Hollenstein, C.; Kahle, H.-G.; Geiger, A. A recent reorganization in the south-central Mediterranean. Earth Planet. Sci. Lett. 2004, 226, 335–345. [Google Scholar] [CrossRef]
- Billi, A.; Barberi, G.; Faccenna, C.; Neri, G.; Pepe, F.; Sulli, A. Tectonics and seismicity of the Tindary Fault System, southern Italy: Crustal deformations at the transition between ongoing contractional and extensional domains located above the edge of a subducting slab. Tectonics 2006, 25, TC2006. [Google Scholar] [CrossRef] [Green Version]
- D’Agostino, N.; Selvaggi, G. Crustal motion along the Eurasia-Nubia plate boundary in the Calabrian Arc and Sicily and active extension in the Messina Straits from GPS measurements. J. Geophys. Res. 2004, 109, B11402. [Google Scholar] [CrossRef]
- Keller, J. The island of Vulcano. Rend. Soc. Italy Miner. Petr. 1980, 36, 369–414. [Google Scholar]
- Lanza, R.; Zanella, E. Paleomagnetic secular variation at Vulcano (Aeolian islands) during the last 135 kyr. Earth Planet. Sci. Lett. 2003, 213, 321–336. [Google Scholar] [CrossRef]
- Gioncada, A.; Sbrana, A. “La Fossa Caldera”, Vulcano: Inferences from deep drillings. Acta Vulcanol. 1991, 1, 115–126. [Google Scholar]
- Frazzetta, G.; Gillot, P.Y.; La Volpe, L.; Sheridan, M.F. Volcanic hazards at Fossa of Vulcano: Data from the last 6000 years. Bull. Volcanol. 1984, 47, 105–124. [Google Scholar] [CrossRef]
- Ventura, G.; Vilardo, G.; Milano, G.; Pino, N.A. Relationships among crustal structure volcanism and strike-slip tectonics in the Lipari-Vulcano volcanic complex (Aeolian Islands, Southern Tyrrhenian Sea, Italy). Phys. Earth Planet Inter. 1999, 116, 31–52. [Google Scholar] [CrossRef]
- Fusillo, R.; Di Traglia, F.; Gioncada, A.; Pistolesi, M.; Wallace, P.J.; Rosi, M. Deciphering post-caldera volcanism: Insight into the Vulcanello (Island of Vulcano, Southern Italy) eruptive activity based on geological and petrological constraints. Bull. Volcanol. 2015, 77, 1–23. [Google Scholar] [CrossRef]
- Platt, U.; Stutz, J. Differential Optical Absorption Spectroscopy Principles and Applications; Physics of Earth and Space Environments; Springer: Berlin/Heidelberg, Germany, 2008; p. 597. ISBN 978-3-540-75776-4. [Google Scholar]
- Platt, U. Differential optical absorption spectroscopy (DOAS). In Air Monitoring by Spectroscopic Techniques; Chemical Analysis Series; Sigrist, M.W., Ed.; John Wiley & Sons Inc.: Hoboken, NJ, USA, 1994; Volume 127, pp. 27–83. [Google Scholar]
- Edmonds, M.; Herd, H.; Galle, B.; Oppenheimer, C. Automated, high time-resolution measurements of SO2 flux at Soufriere Hills Volcano, Montserrat. West Indies Bull. Volcanol. 2003, 65, 578–586. [Google Scholar] [CrossRef]
- Kern, C.; Masias, P.; Apaza, F.; Reath, K.A.; Platt, U. Remote measurement of high preeruptive water vapor emissions at Sabancaya volcano by passive differential optical absorption spectroscopy. J. Geophys. Res. Solid Earth 2017, 122, 3540–3564. [Google Scholar] [CrossRef]
- Vita, F.; Kern, C.; Inguaggiato, S. Development of a portable active long-path differential optical absorption spectroscopy system for volcanic gas measurements. J. Sens. Sens. Syst. 2014, 3, 355–367. [Google Scholar] [CrossRef] [Green Version]
- Galle, B.; Johansson, M.; Rivera, C.; Zhang, Y.; Kihlman, M.; Kern, C.; Lehmann, T.; Platt, U.; Arellano, S.; Hidalgo, S. Network for Observation of Volcanic and Atmospheric Change (NOVAC): A global network for volcanic gas monitoring -Network layout and instrument description. J. Geophys. Res. 2010, 115, D05304. [Google Scholar] [CrossRef]
- Arellano, S.; Galle, B.; Apaza, F.; Avard, G.; Barrington, C.; Bobrowski, N.; Bucarey, C.; Burbano, V.; Burton, M.; Chacon, Z.; et al. Synoptic analysis of a decade of daily measurements of SO2 emission in the troposphere from volcanoes of the global ground-based Network for Observation of Volcanic and Atmospheric Change. Earth Syst. Sci. Data 2021, 13, 1167–1188. [Google Scholar] [CrossRef]
- Vita, F.; Arellano, S.; Inguaggiato, S.; Galle, B. SO2 Flux of-VULCANO-Volcano from the NOVAC Data-Base, [Data Set], v.001, The NOVAC Database 2020. Available online: https://doi.org/10.17196/novac.vulcano.001 (accessed on 30 November 2021). [CrossRef]
- Galle, B.; Delgado, H.; Garzon, G.; Vogel, L.; Platt, U. NOVAC Project Final Report, EU-FP6; Chalmers University of Technology: Gothenburg, Sweden, 2011; p. 100. [Google Scholar]
- IUPAC. Compendium of Chemical Terminology, 2nd ed.; The “Gold, Book”; McNaught, A.D., Wilkinson, A., Eds.; Blackwell Scientific Publications: Oxford, UK, 1997; Online version (2019-) created by Chalk, S.J.; ISBN 0-9678550-9-8. [Google Scholar] [CrossRef]
- Platt, U.; Perner, D. Measurements of Atmospheric Trace Gases by Long Path Differential UV/Visible Absorption Spectroscopy. In Optical and Laser Remote Sensing; Killinger, D.A., Mooradien, A., Eds.; Springer Verlag: New York, NY, USA, 1983; pp. 95–105. [Google Scholar]
- Johansson, M. NOVACProject/NovacPPP: NovacPPP (Post Processing Program); Version 2.0.0; Zenodo: Geneve, Switzerland, 2021. [Google Scholar] [CrossRef]
- Johansson, M.; Galle, B.; Zhang, Y.; Rivera, C. The dual-beam mini-DOAS technique–measurements of volcanic gas emission, plume height and plume speed with a single instrument. Bull. Volcanol. 2009, 71, 747–751. [Google Scholar] [CrossRef]
- Chiodini, G.; Cioni, R.; Guidi, M.; Raco, B.; Marini, L. Soil CO2 flux measurements in volcanic and geothermal areas. Appl. Geochem. 1998, 13, 543–552. [Google Scholar] [CrossRef]
- Sinclair, A.J. Selection of threshold values in geochemical data using probability graphs. J. Geochem. Explor. 1974, 3, 129–149. [Google Scholar] [CrossRef]
- Deutsch, C.; Journel, A. GSLIB: Geostatistical Software and User’s Guide, 2nd ed.; Oxford University Press: New York, NY, USA, 1998; 369p. [Google Scholar]
- Aubert, M. Practical evaluation of steady heat discharge from dormant active volcanoes: Case study of Vulcarolo fissure (Mount Etna, Italy). J. Volcanol. Geotherm. Res. 1999, 92, 413–429. [Google Scholar] [CrossRef]
- Aubert, M.; Alparone, S. Hydrothermal convective flux variation related to a seismo-tectonic crisis in the Fossa of Vulcano (Italy). CR Geosci. 2000, 330, 603–610. [Google Scholar]
- Gaudin, D.; Ricci, T.; Finizola, A.; Delcher, E.; Alparone, S.; Barde-Cabusson, S.; Brothelande, E.; Di Gangi, F.; Gambino, S.; Inguaggiato, S.; et al. Heat flux-based strategies for the thermal monitoring of sub-fumarolic areas: Examples from Vulcano and La Soufriere de Guadeloupe. J. Volcanol. Geotherm. Res. 2017, 343, 122–134. [Google Scholar] [CrossRef] [Green Version]
- Diliberto, I.S.; Gagliano Candela, E.; Morici, S.; Pecoraino, G.; Bellomo, S.; Bitetto, M.; Longo, M. Changes in heat release by hydrothermal circulation monitored during an eruptive cycle on Mount Etna (Italy). Bull. Volcanol. 2018, 80, 4. [Google Scholar] [CrossRef]
- David, M. Geostatistical Ore Reserve Estimation; Developments in Geomathematics; Elsevier: New York, NY, USA, 1977; Volume 2, 363p. [Google Scholar]
- Barberi, F.; Bertagnini, A.; Landi, P.; Principe, C. A review on phreatic eruptions and their precursors. J. Volcanol. Geotherm. Res. 1992, 52, 231–246. [Google Scholar] [CrossRef]
- Selva, J.; Bonadonna, C.; Branca, S.; De Astis, G.; Gambino, S.; Paonita, A.; Ricciardi, A. Multiple hazards and paths to eruptions: A review of the volcanic system of Vulcano (Aeolian Islands, Italy). Earth Sci. Rev. 2020, 207, 103186. [Google Scholar] [CrossRef]


| Date | Number of Samples | Area (m2) | Total CO2 Output (t/d) | Standard Deviation (t/d) | Total CO2 Output (t/d) Area of 440,755 m2 |
|---|---|---|---|---|---|
| Sep-2021 | 164 | 88,900 | 312 | 7.1 | 1547 |
| Sep-2007 | 244 | 70,575 | 15 | 0.6 | 94 |
| Crater 2021 | |||
|---|---|---|---|
| Population of CO2 Flux | Mean Flux of CO2 (g m−2 d−1) | 90% Confidence Interval (g m−2 d−1) | Proportion (%) |
| A | 606 | 336–1679 | 29 |
| B | 1343 | 1150–1629 | 57 |
| C | 13,518 | 12,816–14,789 | 14 |
| Crater 2007 | |||
| A | 30 | 28–34 | 40 |
| B | 455 | 414–512 | 60 |
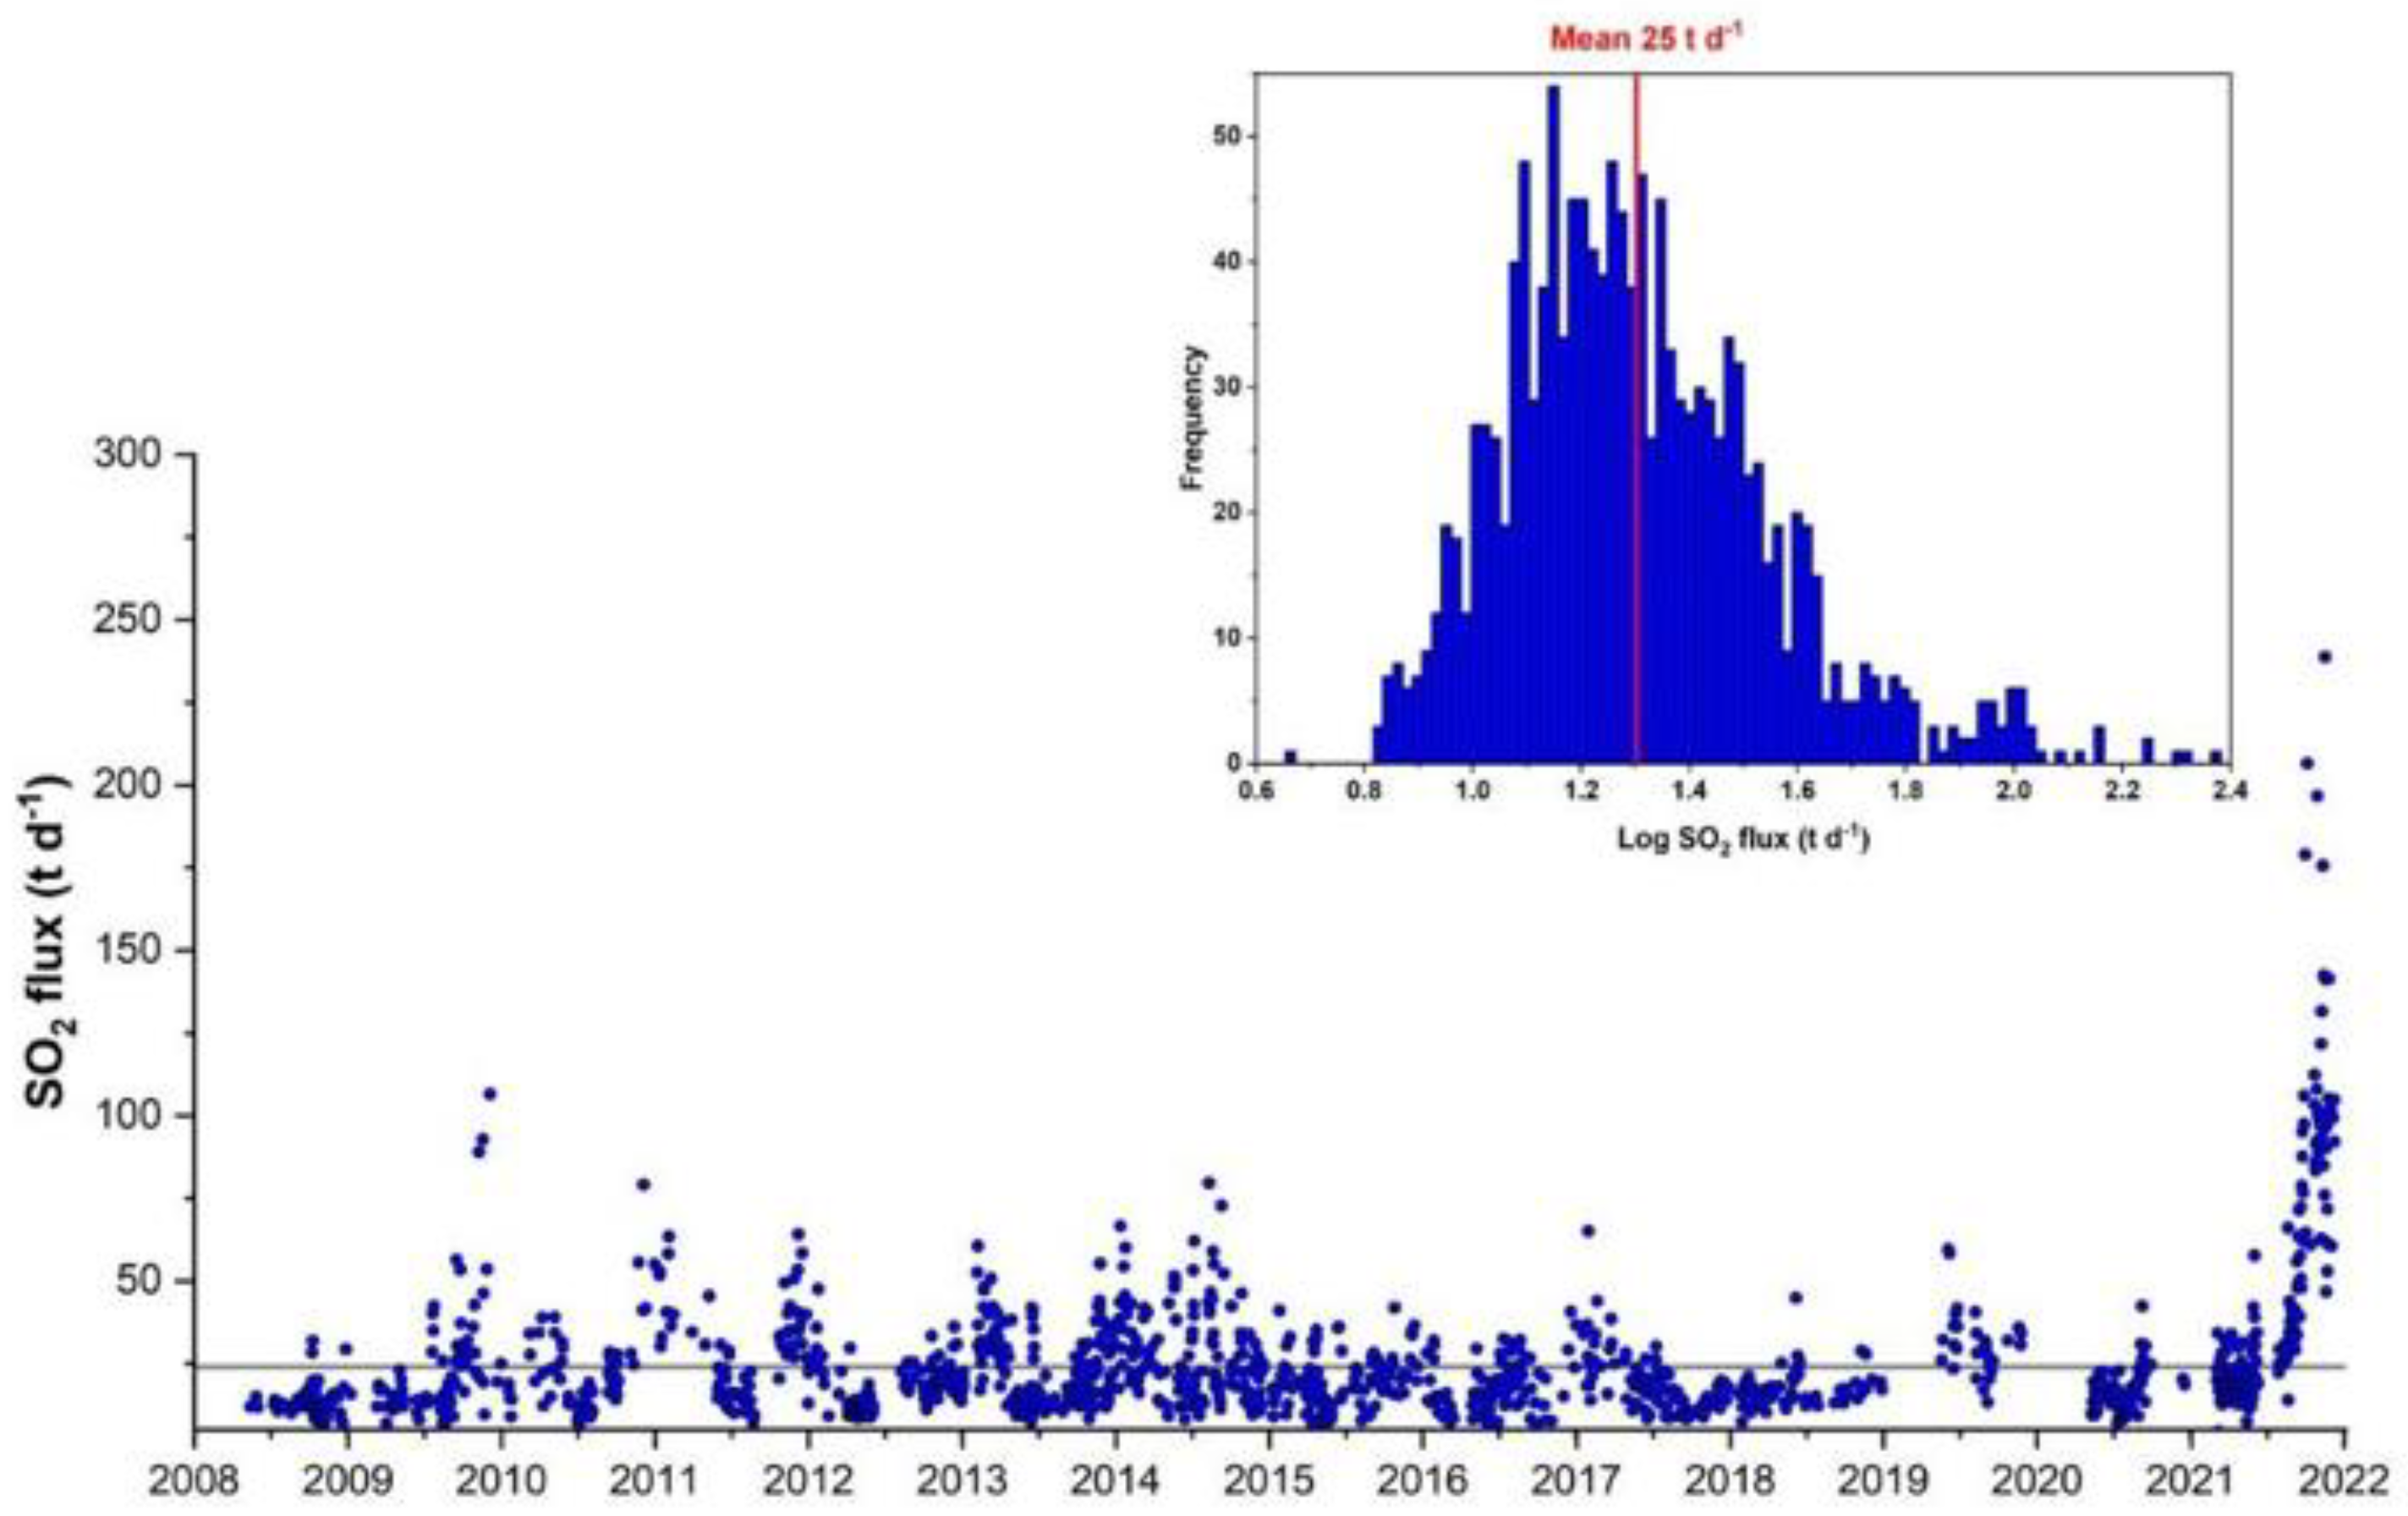
| Population of SO2 Flux | Mean Flux of SO2 (t d−1) | 90% Confidence Interval (t d−1) | Proportion (%) |
|---|---|---|---|
| A | 19.5 | 18.8–20.4 | 86 |
| B | 85 | 77–95 | 14 |
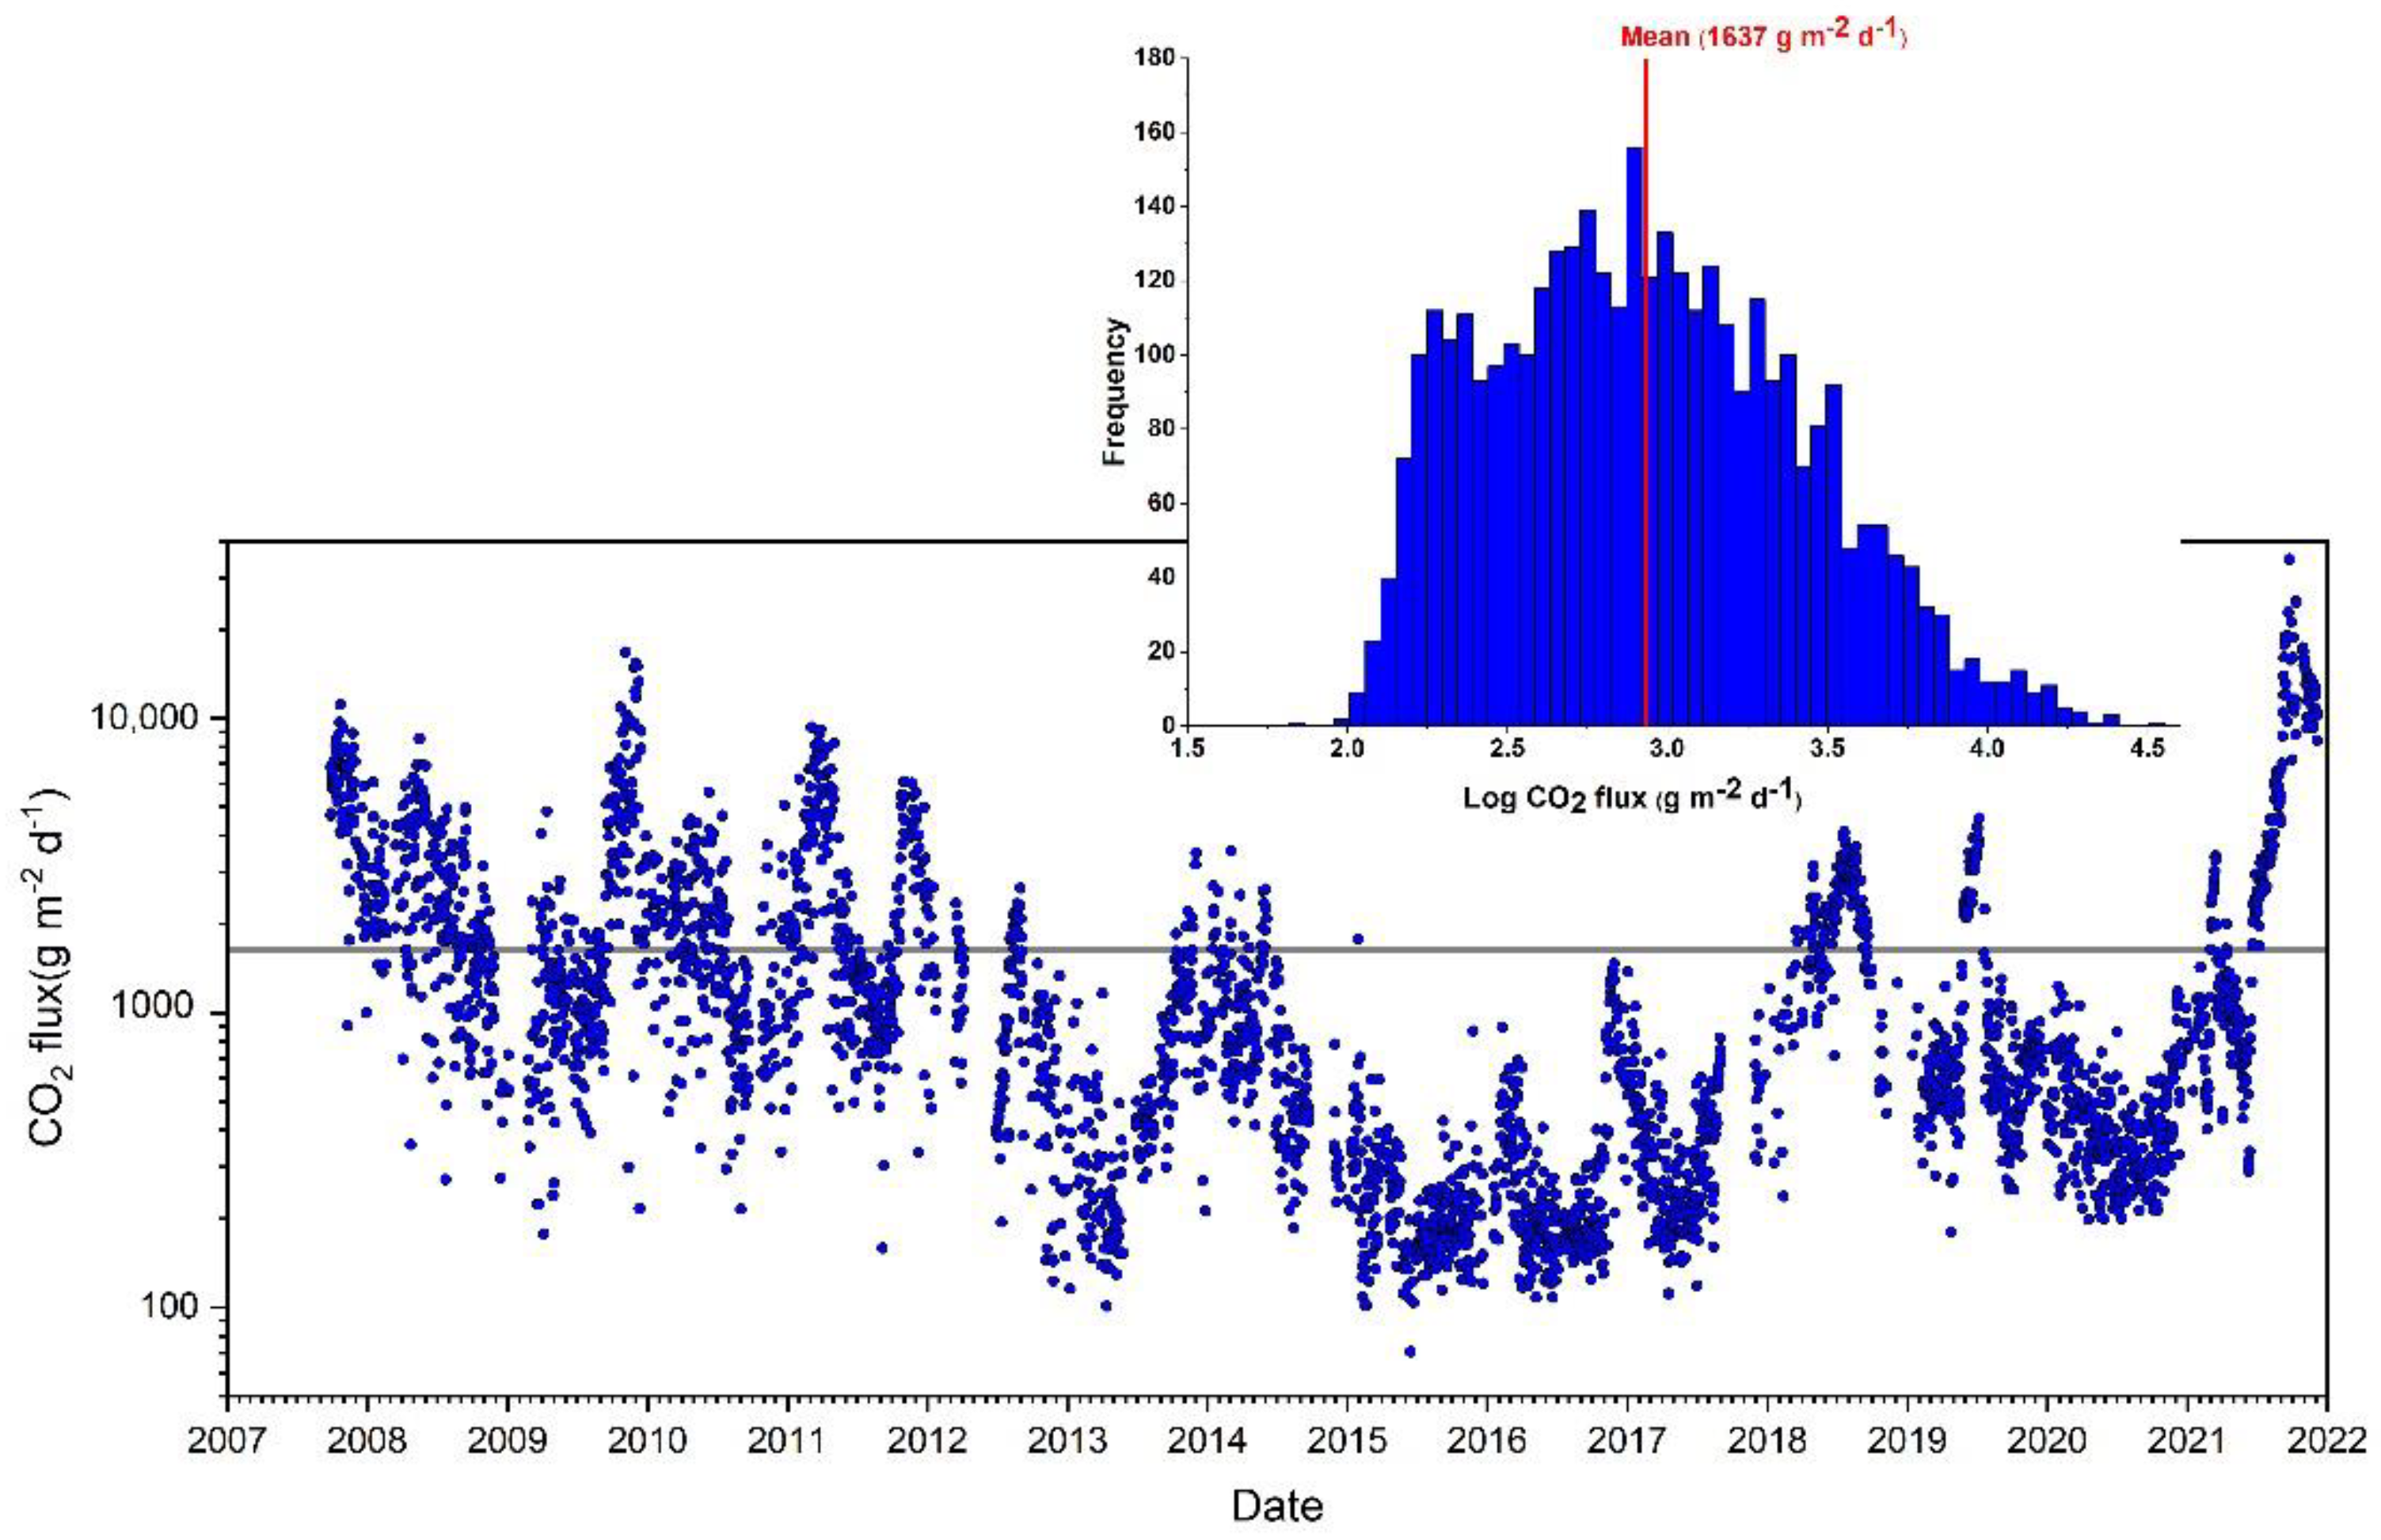
| Population of CO2 Flux | Mean Flux of CO2 (g m−2 d−1) | 90% Confidence Interval (g m−2 d−1) | Proportion (%) |
|---|---|---|---|
| A | 180 | 177–184 | 10 |
| B | 663 | 635–693 | 85 |
| C | 8155 | 7676–8726 | 5 |
Publisher’s Note: MDPI stays neutral with regard to jurisdictional claims in published maps and institutional affiliations. |
© 2022 by the authors. Licensee MDPI, Basel, Switzerland. This article is an open access article distributed under the terms and conditions of the Creative Commons Attribution (CC BY) license (https://creativecommons.org/licenses/by/4.0/).
Share and Cite
Inguaggiato, S.; Vita, F.; Diliberto, I.S.; Mazot, A.; Calderone, L.; Mastrolia, A.; Corrao, M. The Extensive Parameters as a Tool to Monitoring the Volcanic Activity: The Case Study of Vulcano Island (Italy). Remote Sens. 2022, 14, 1283. https://doi.org/10.3390/rs14051283
Inguaggiato S, Vita F, Diliberto IS, Mazot A, Calderone L, Mastrolia A, Corrao M. The Extensive Parameters as a Tool to Monitoring the Volcanic Activity: The Case Study of Vulcano Island (Italy). Remote Sensing. 2022; 14(5):1283. https://doi.org/10.3390/rs14051283
Chicago/Turabian StyleInguaggiato, Salvatore, Fabio Vita, Iole Serena Diliberto, Agnes Mazot, Lorenzo Calderone, Andrea Mastrolia, and Marco Corrao. 2022. "The Extensive Parameters as a Tool to Monitoring the Volcanic Activity: The Case Study of Vulcano Island (Italy)" Remote Sensing 14, no. 5: 1283. https://doi.org/10.3390/rs14051283
APA StyleInguaggiato, S., Vita, F., Diliberto, I. S., Mazot, A., Calderone, L., Mastrolia, A., & Corrao, M. (2022). The Extensive Parameters as a Tool to Monitoring the Volcanic Activity: The Case Study of Vulcano Island (Italy). Remote Sensing, 14(5), 1283. https://doi.org/10.3390/rs14051283