
In-Flight Relative Radiometric Calibration of a Wide Field of View Directional Polarimetric Camera Based on the Rayleigh Scattering over Ocean

 ,
,  , , ,
, , , 
Abstract
:
1. Introduction
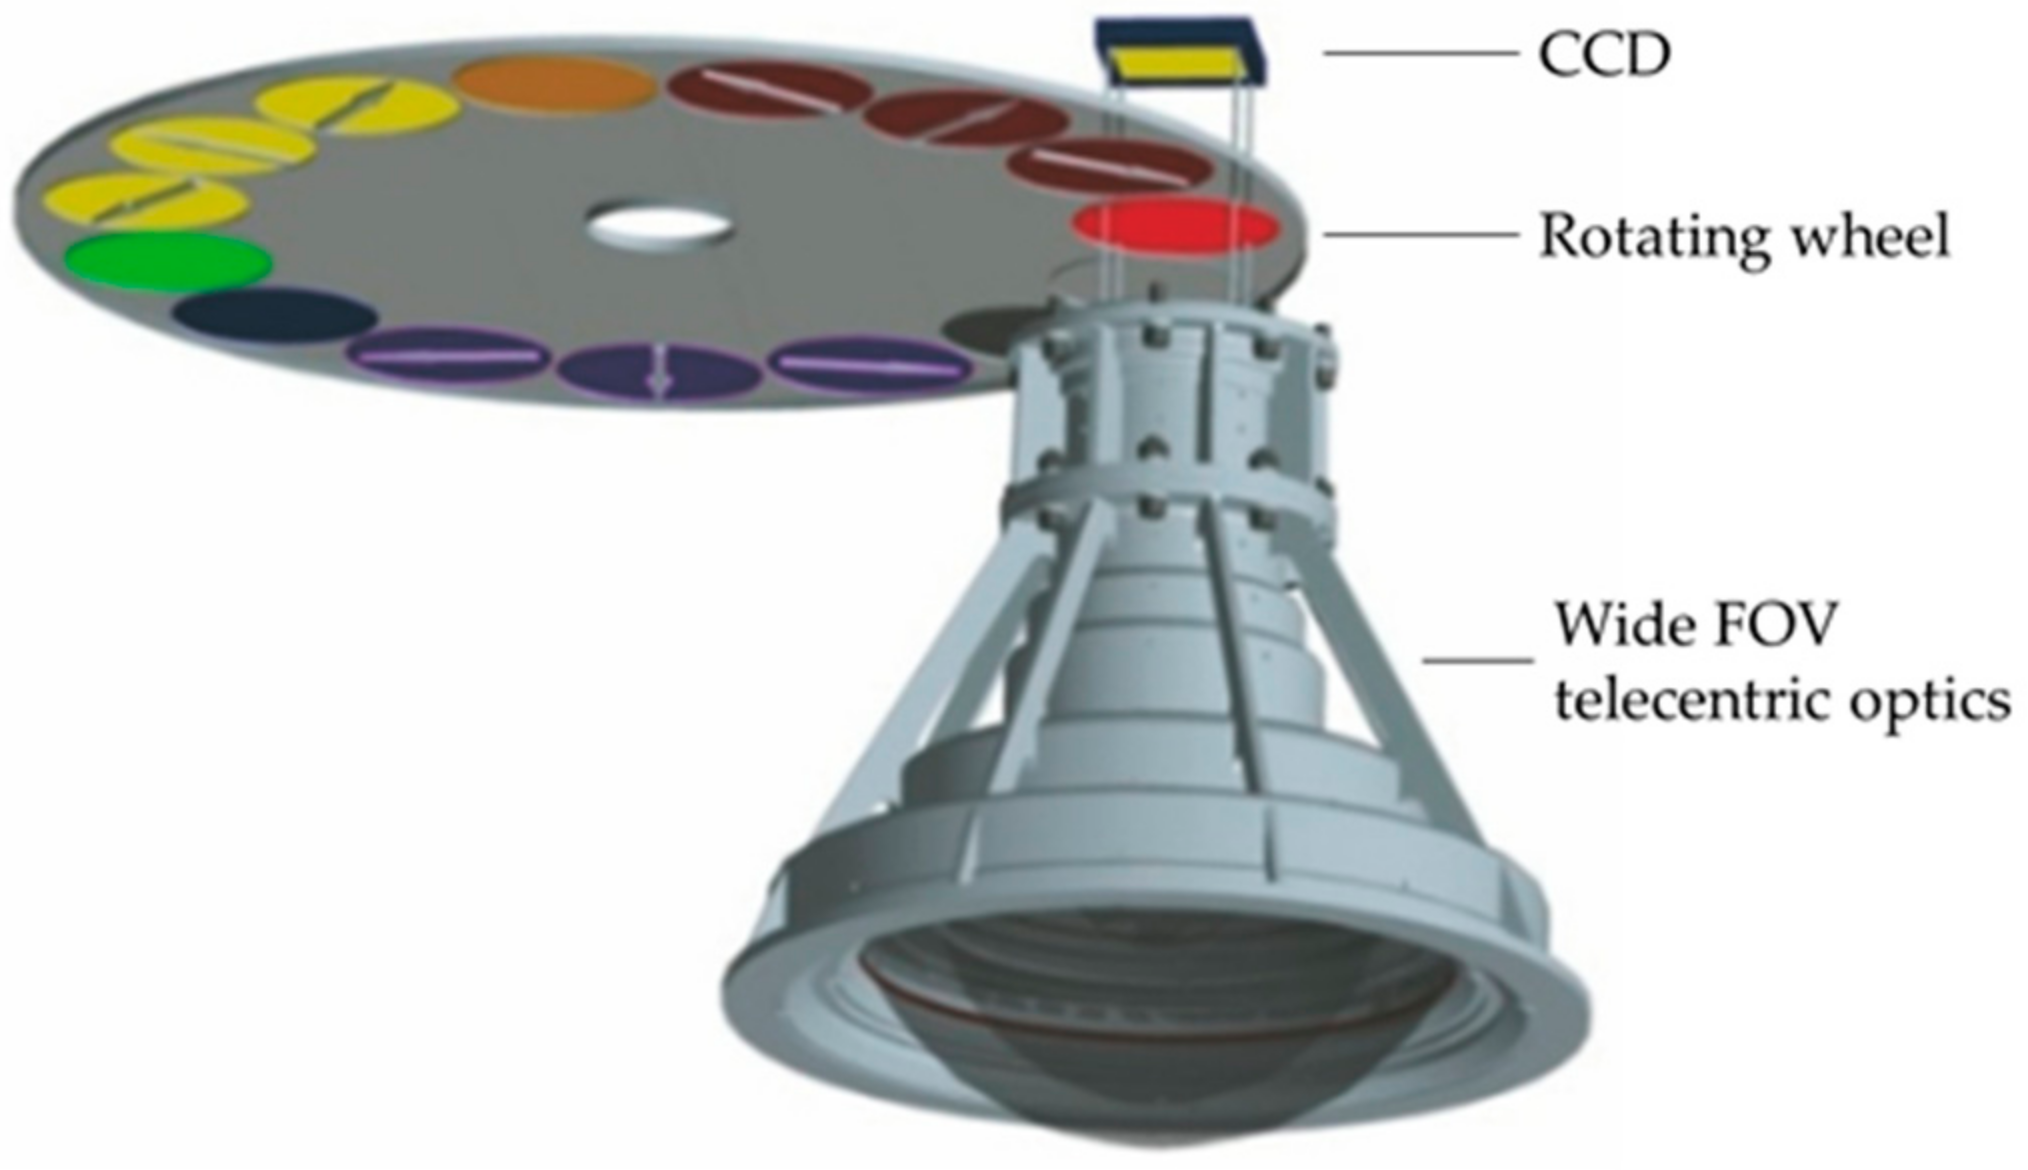
2. DPC Instrument
3. Methods
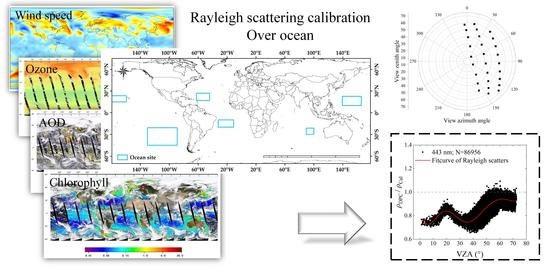
3.1. Absolute Calibration Using Rayleigh Scattering
3.2. Relative Radiometric Calibration by Rayleigh Samples Statistics
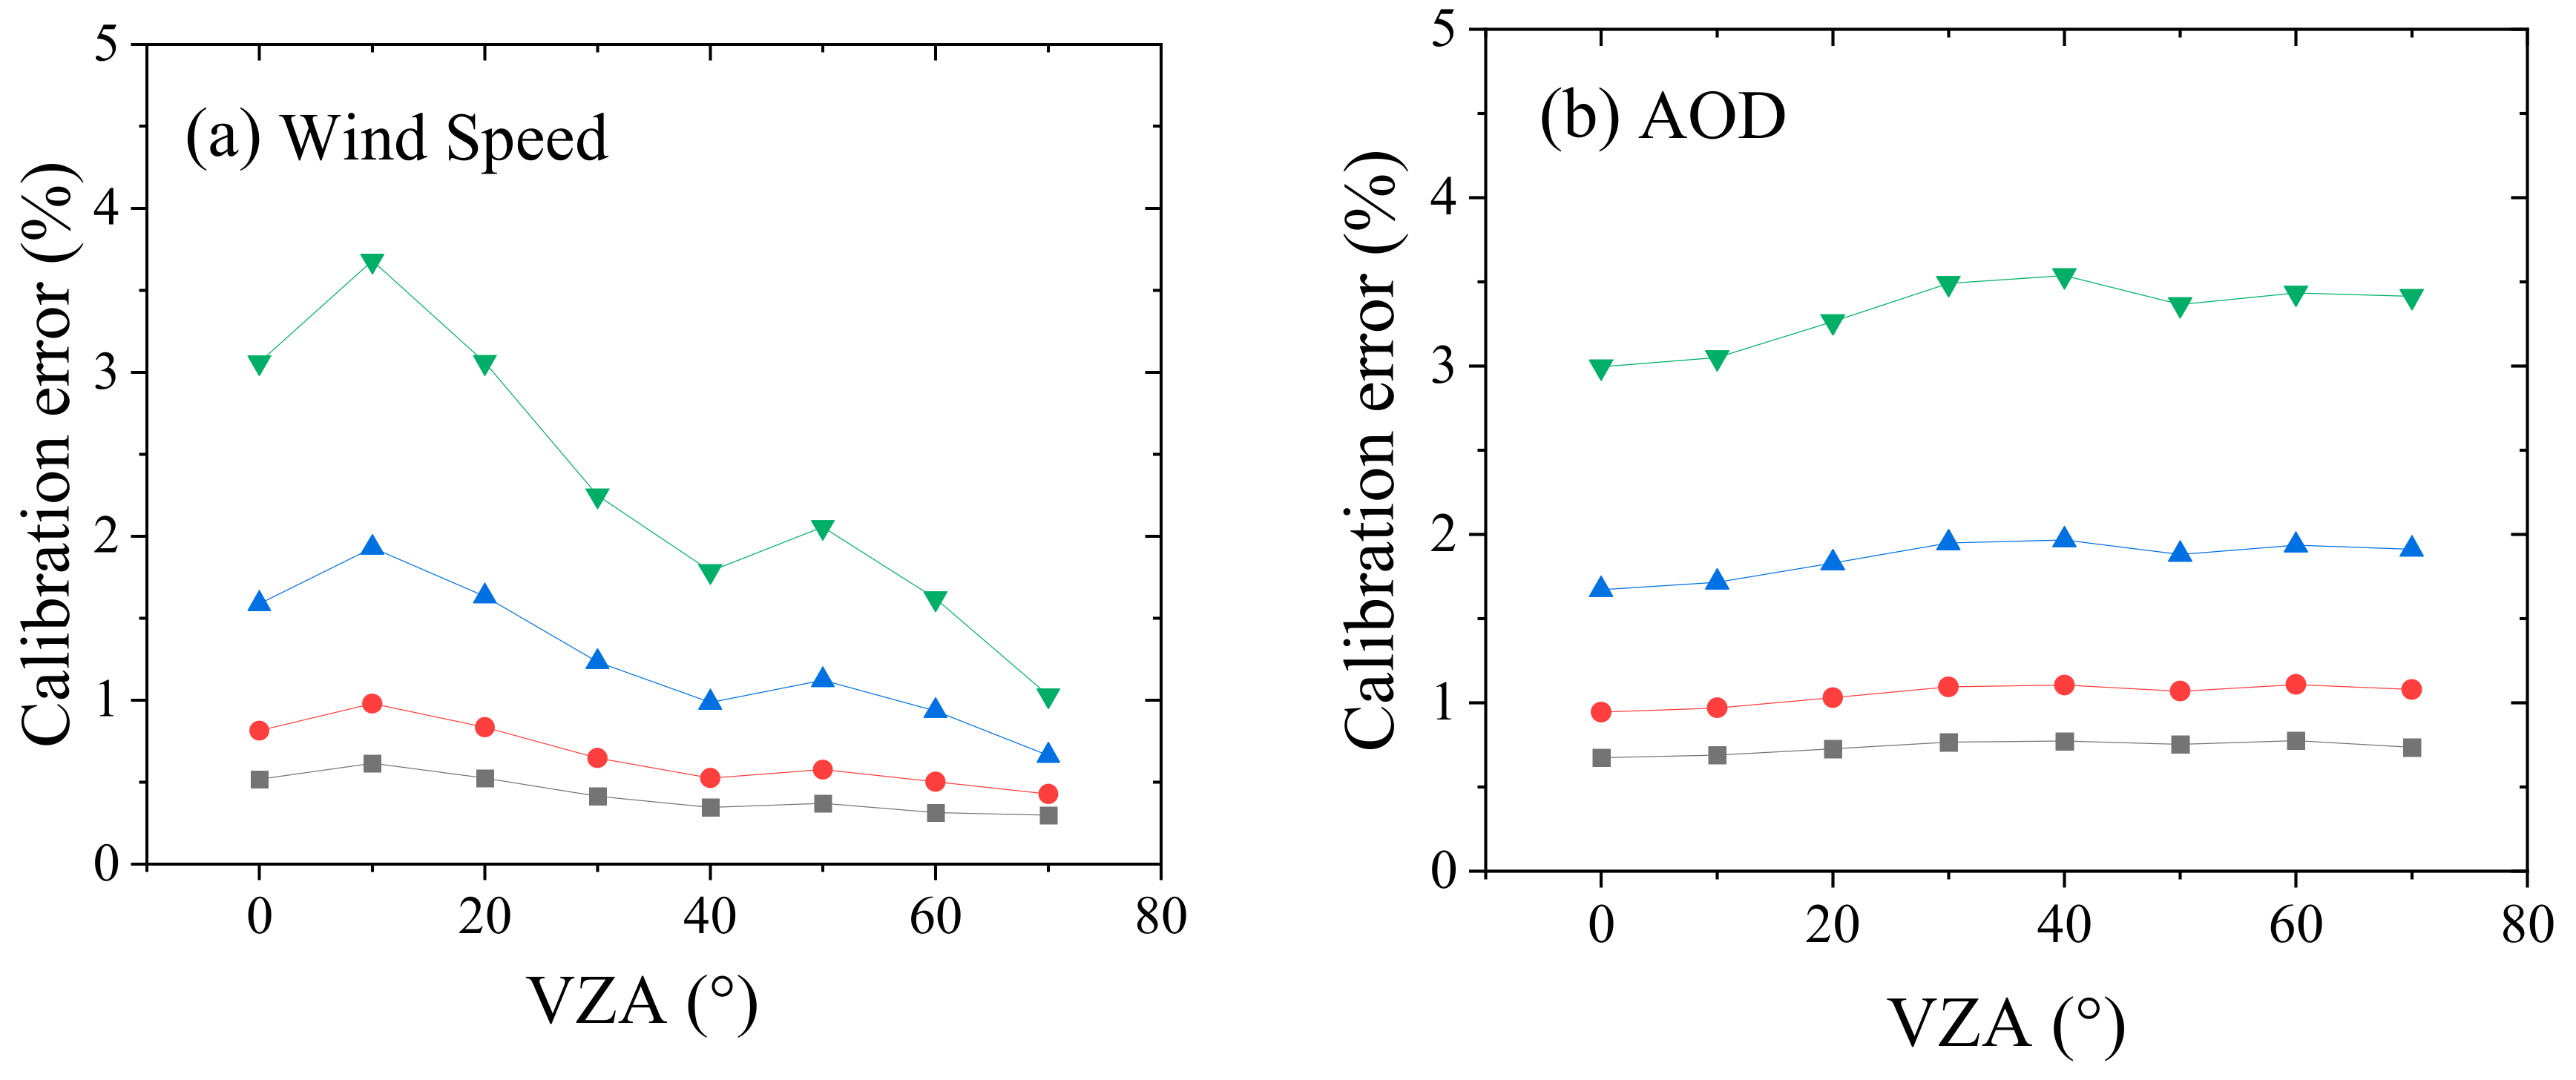
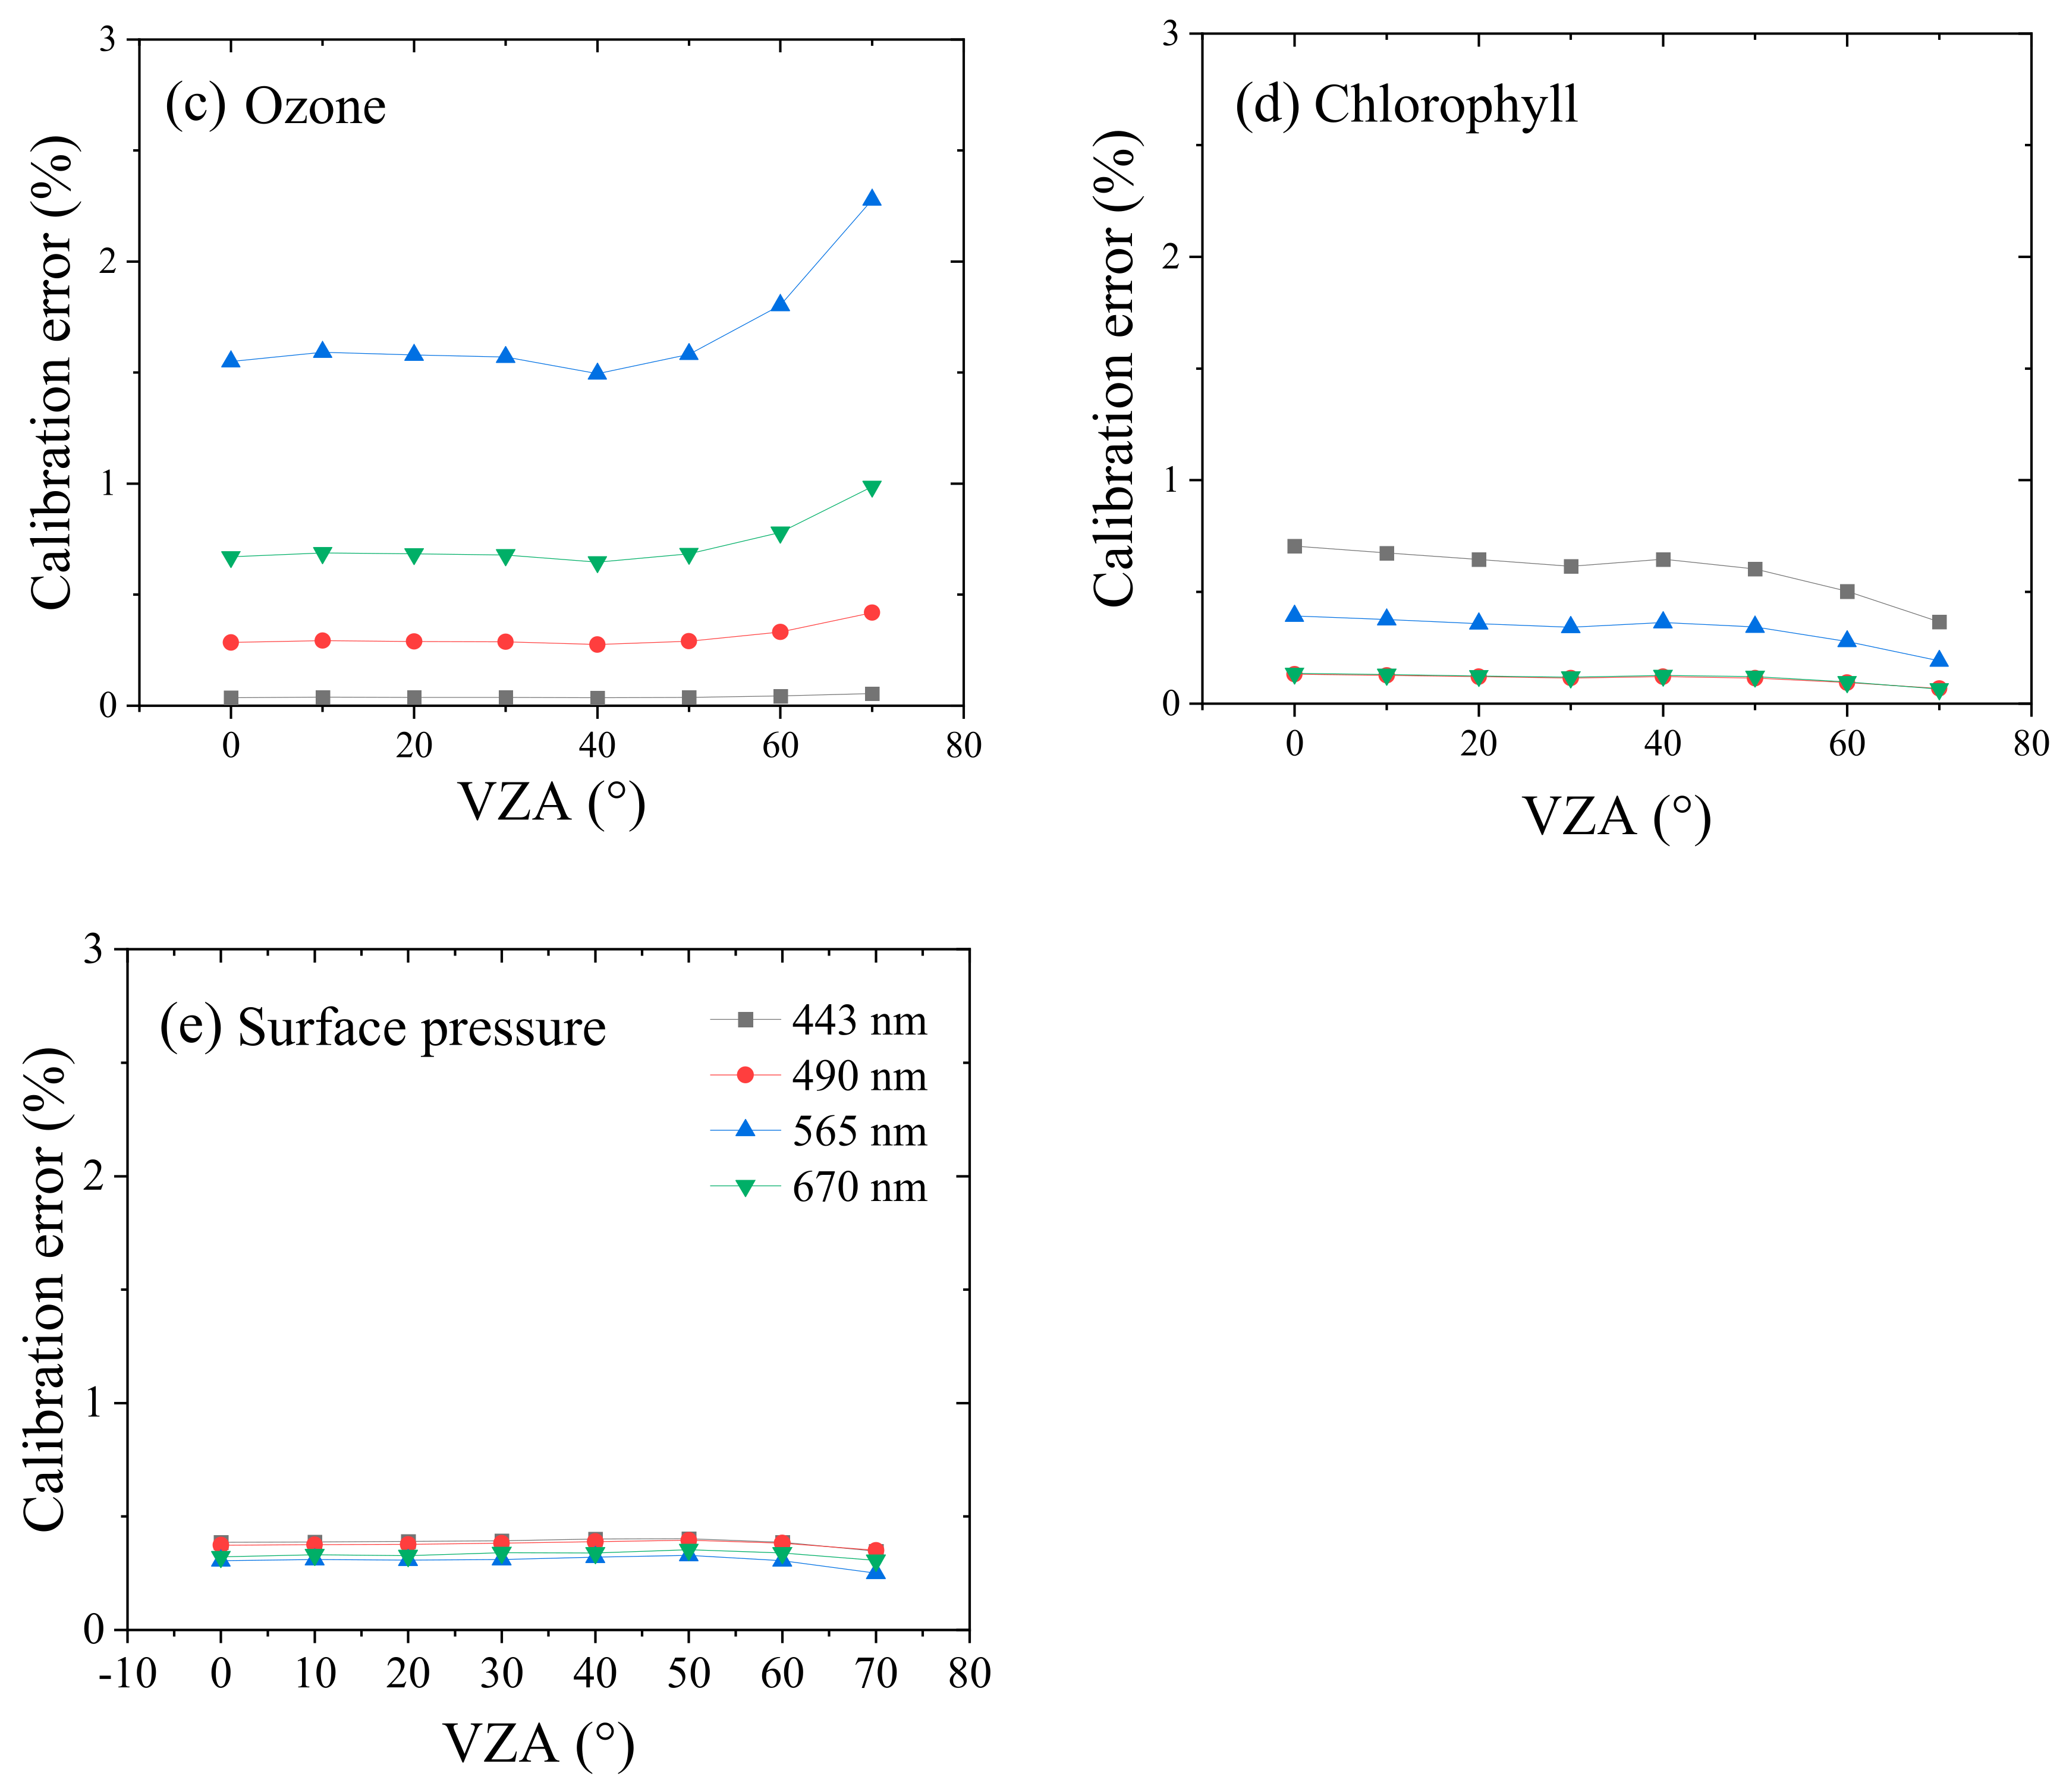
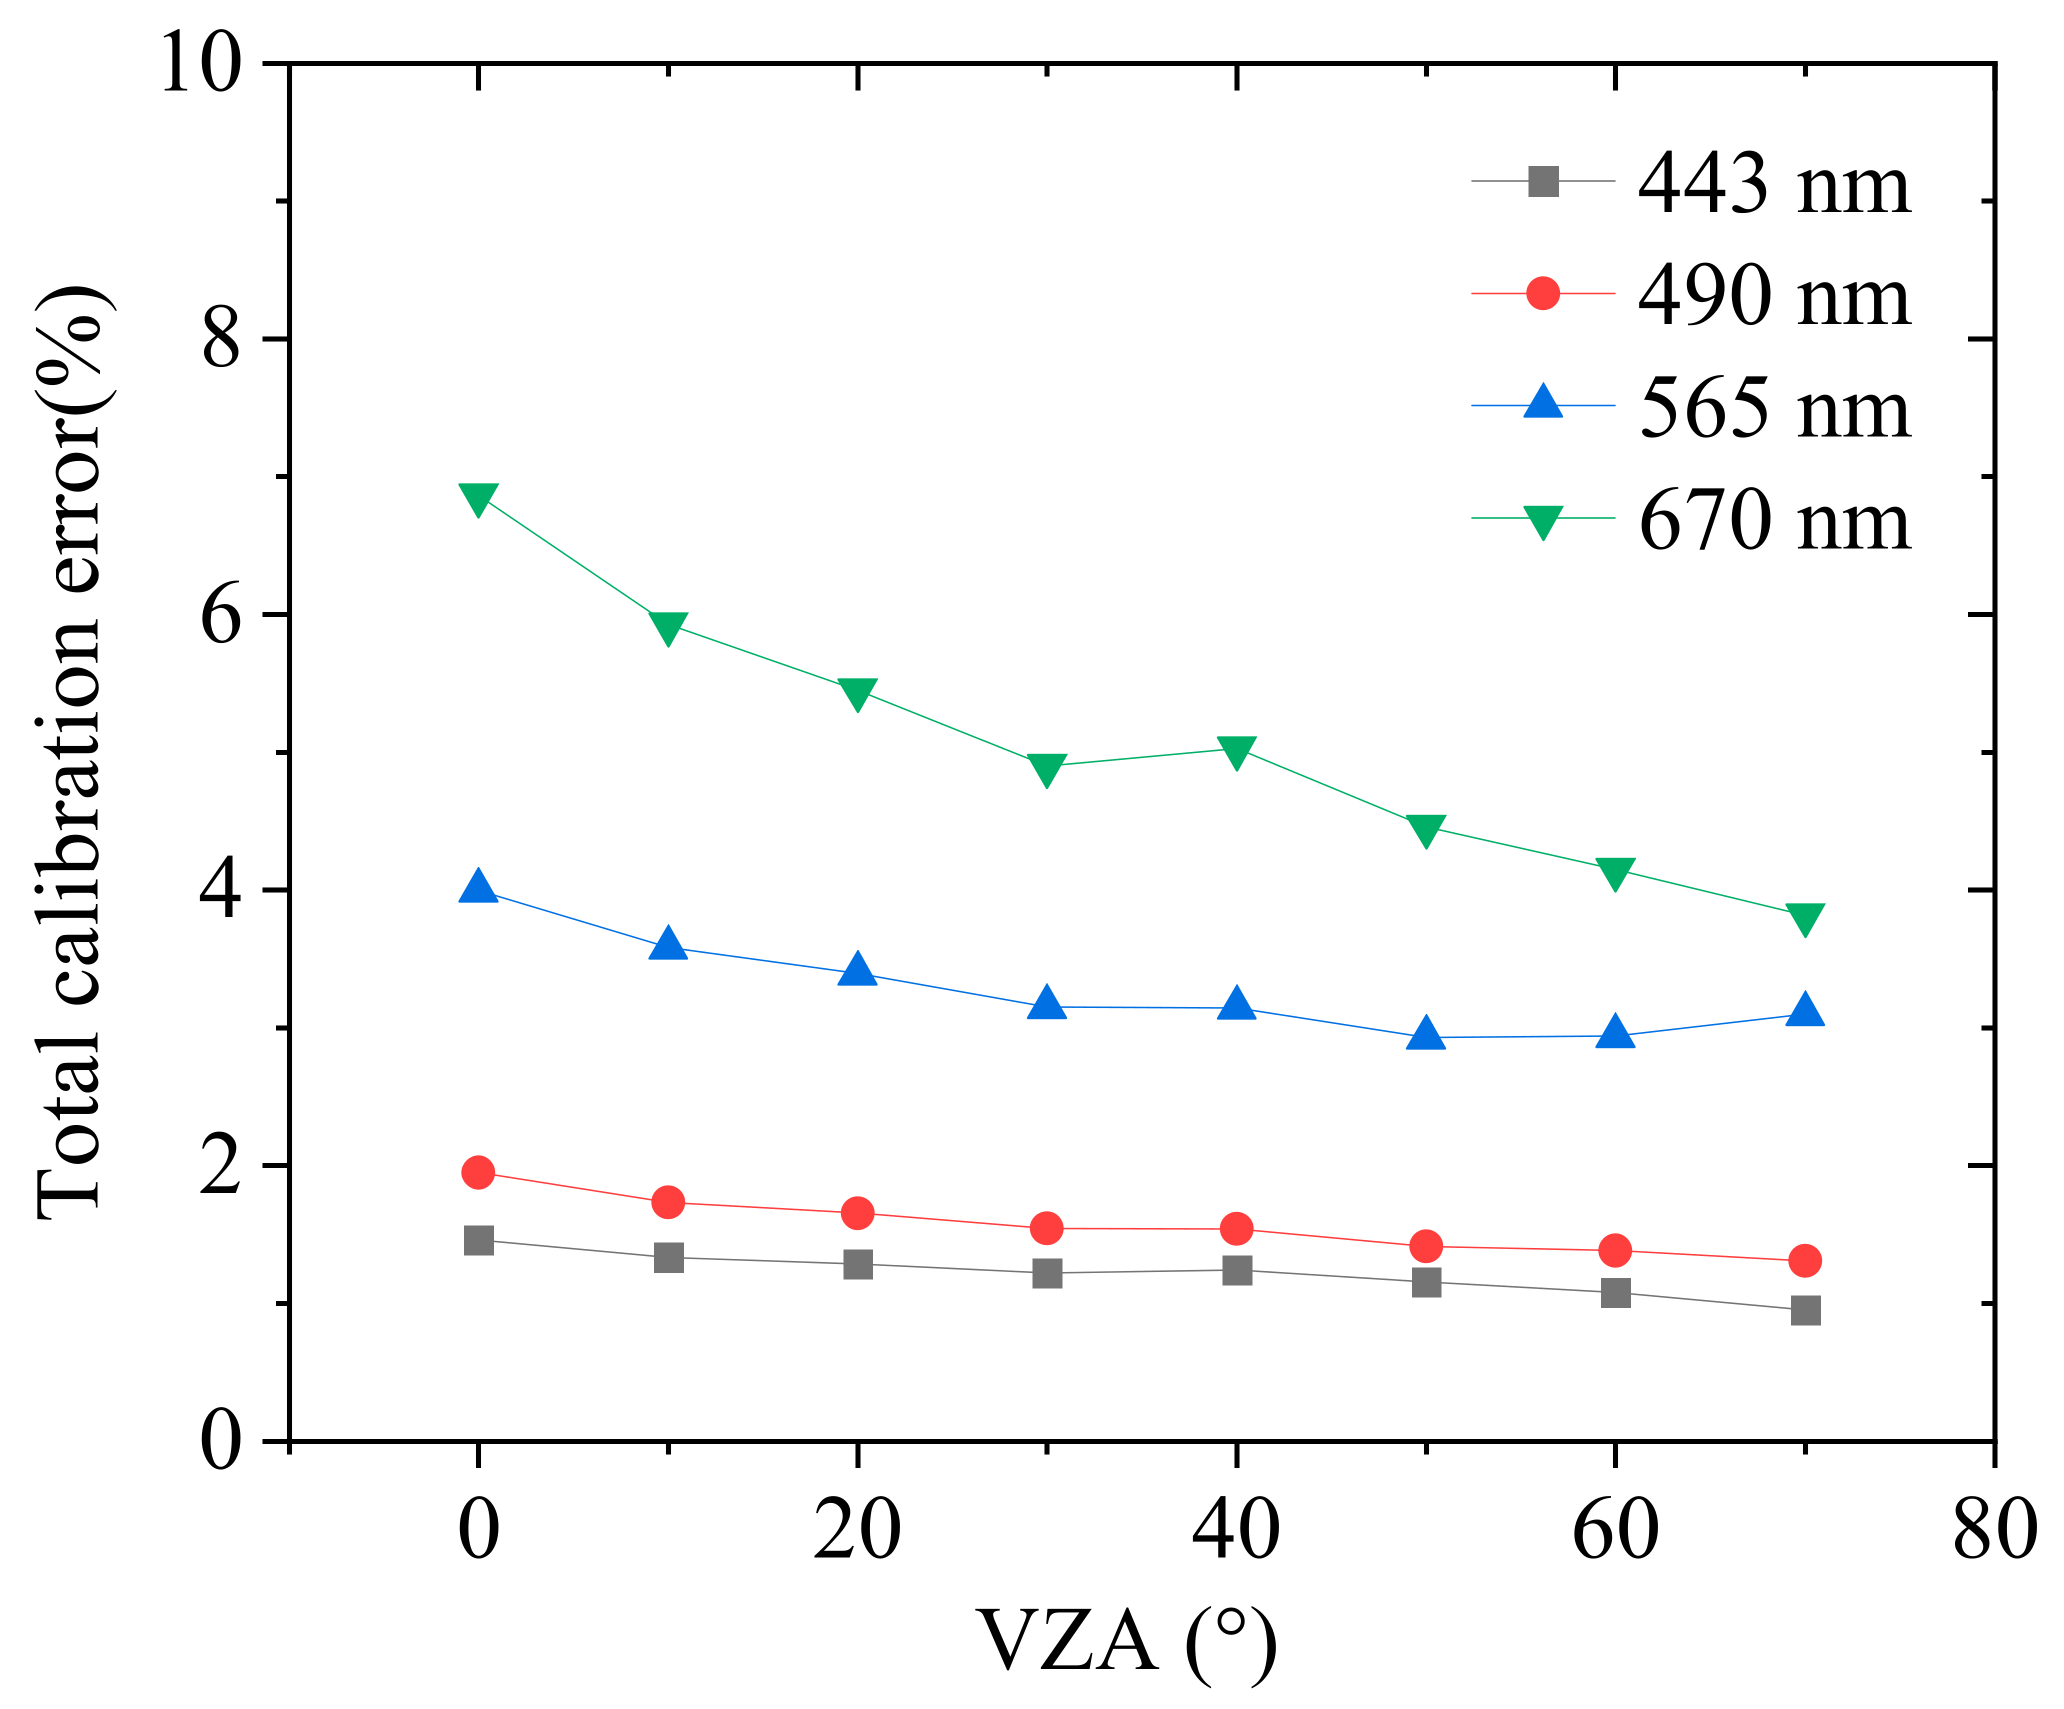
3.3. Error Budget
4. Results
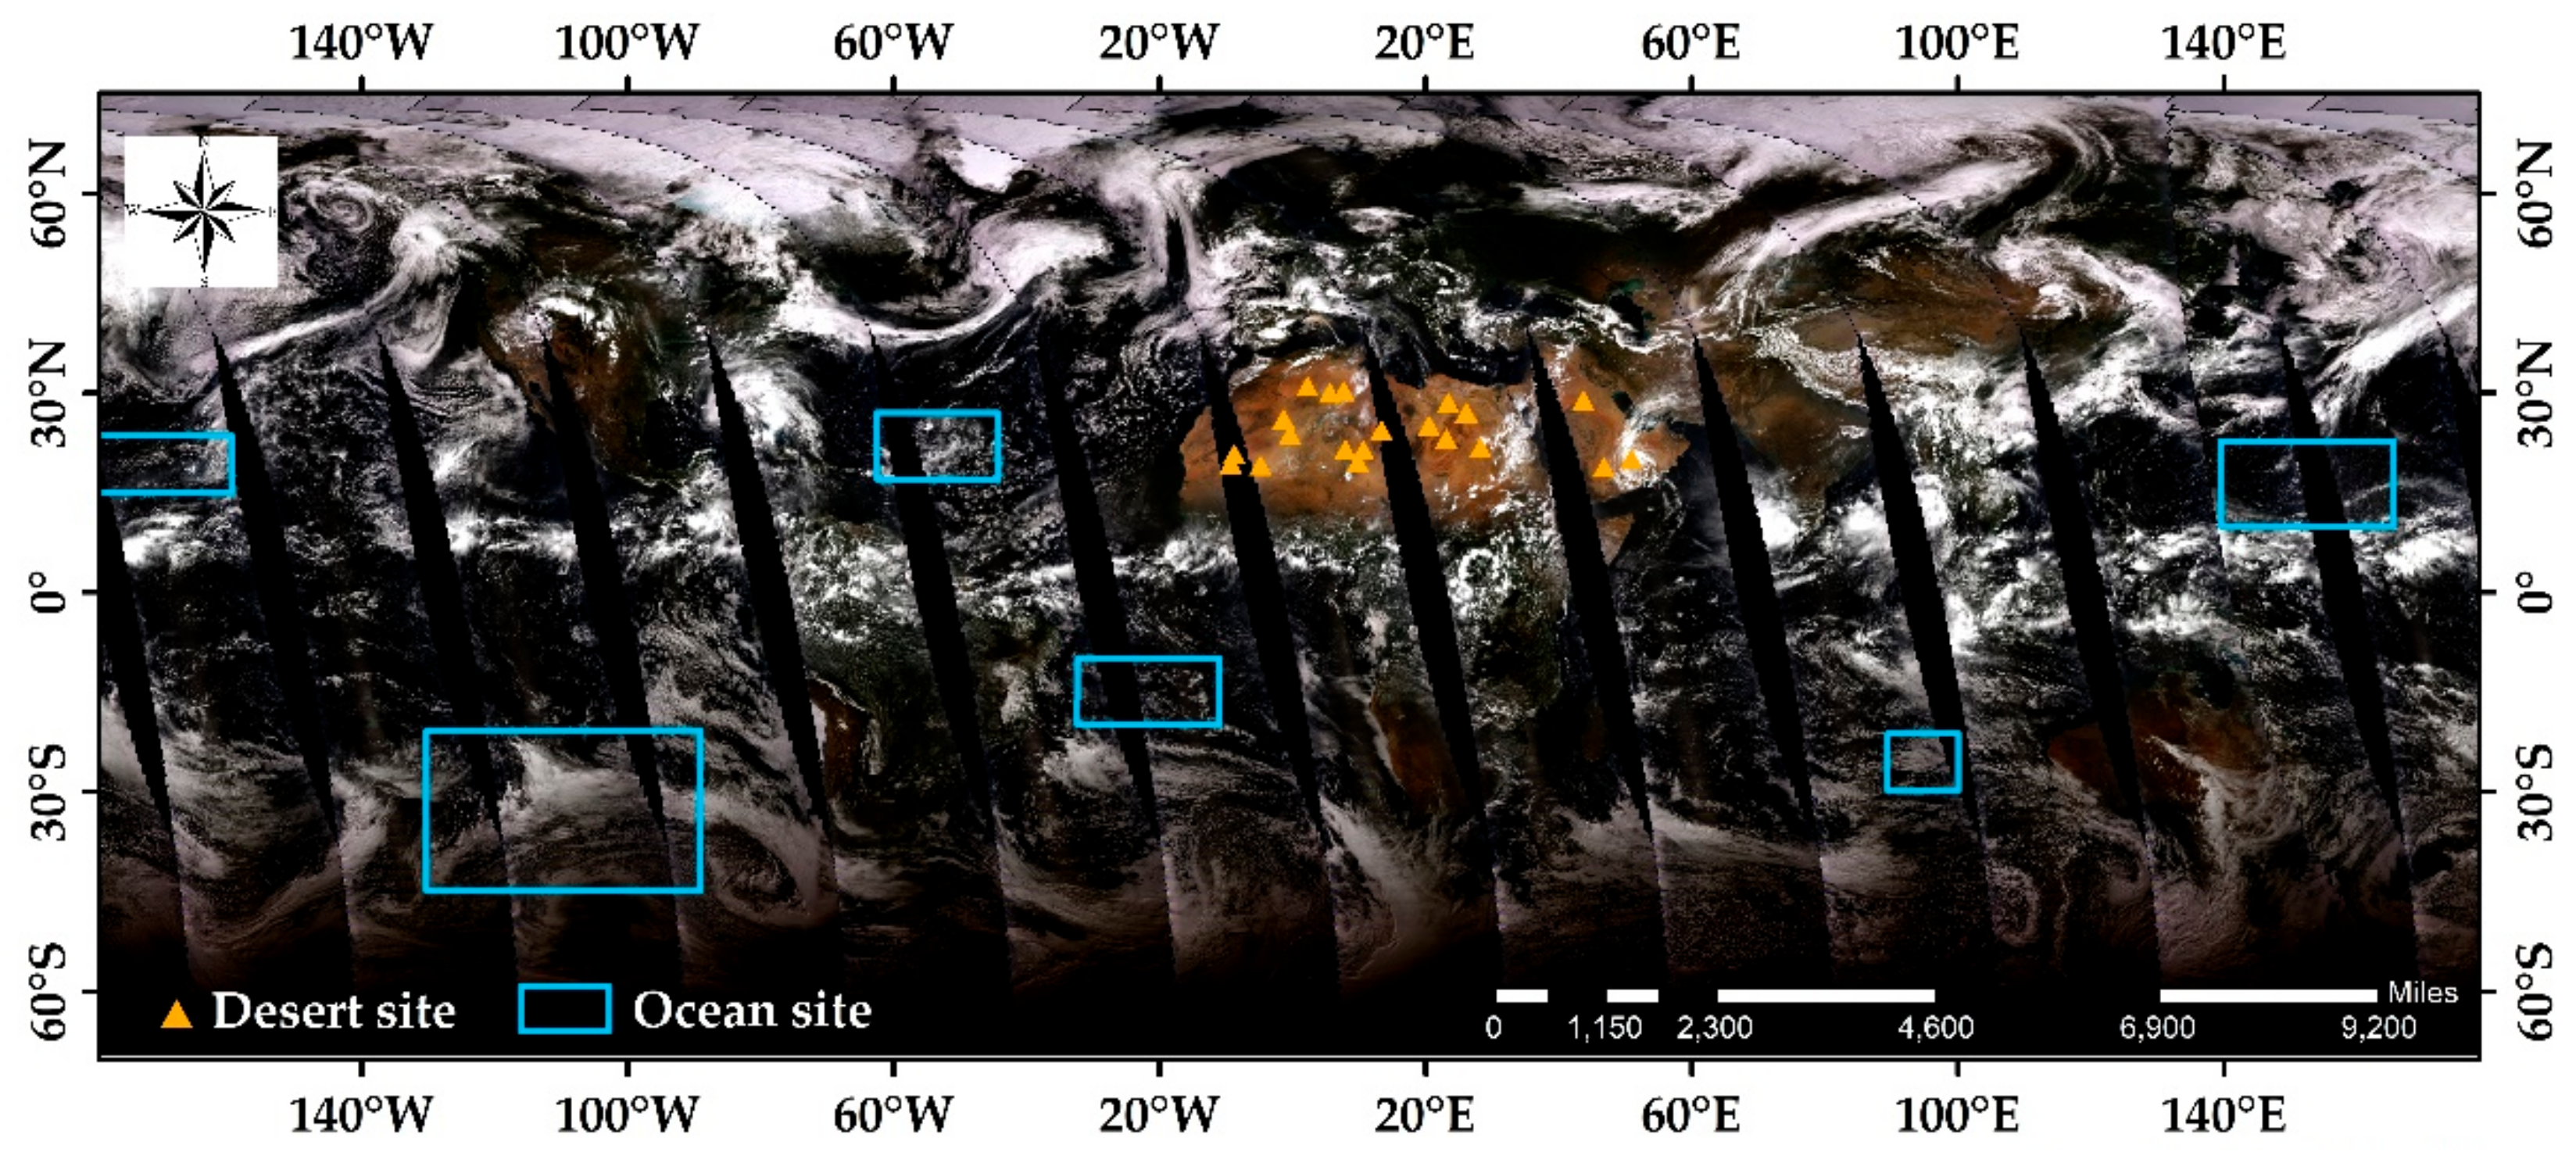
4.1. Data
4.2. Temporal Evolution of DPC Radiometric Sensitivity
4.2.1. Temporal Drift of the Total Radiometric Response over the FOV
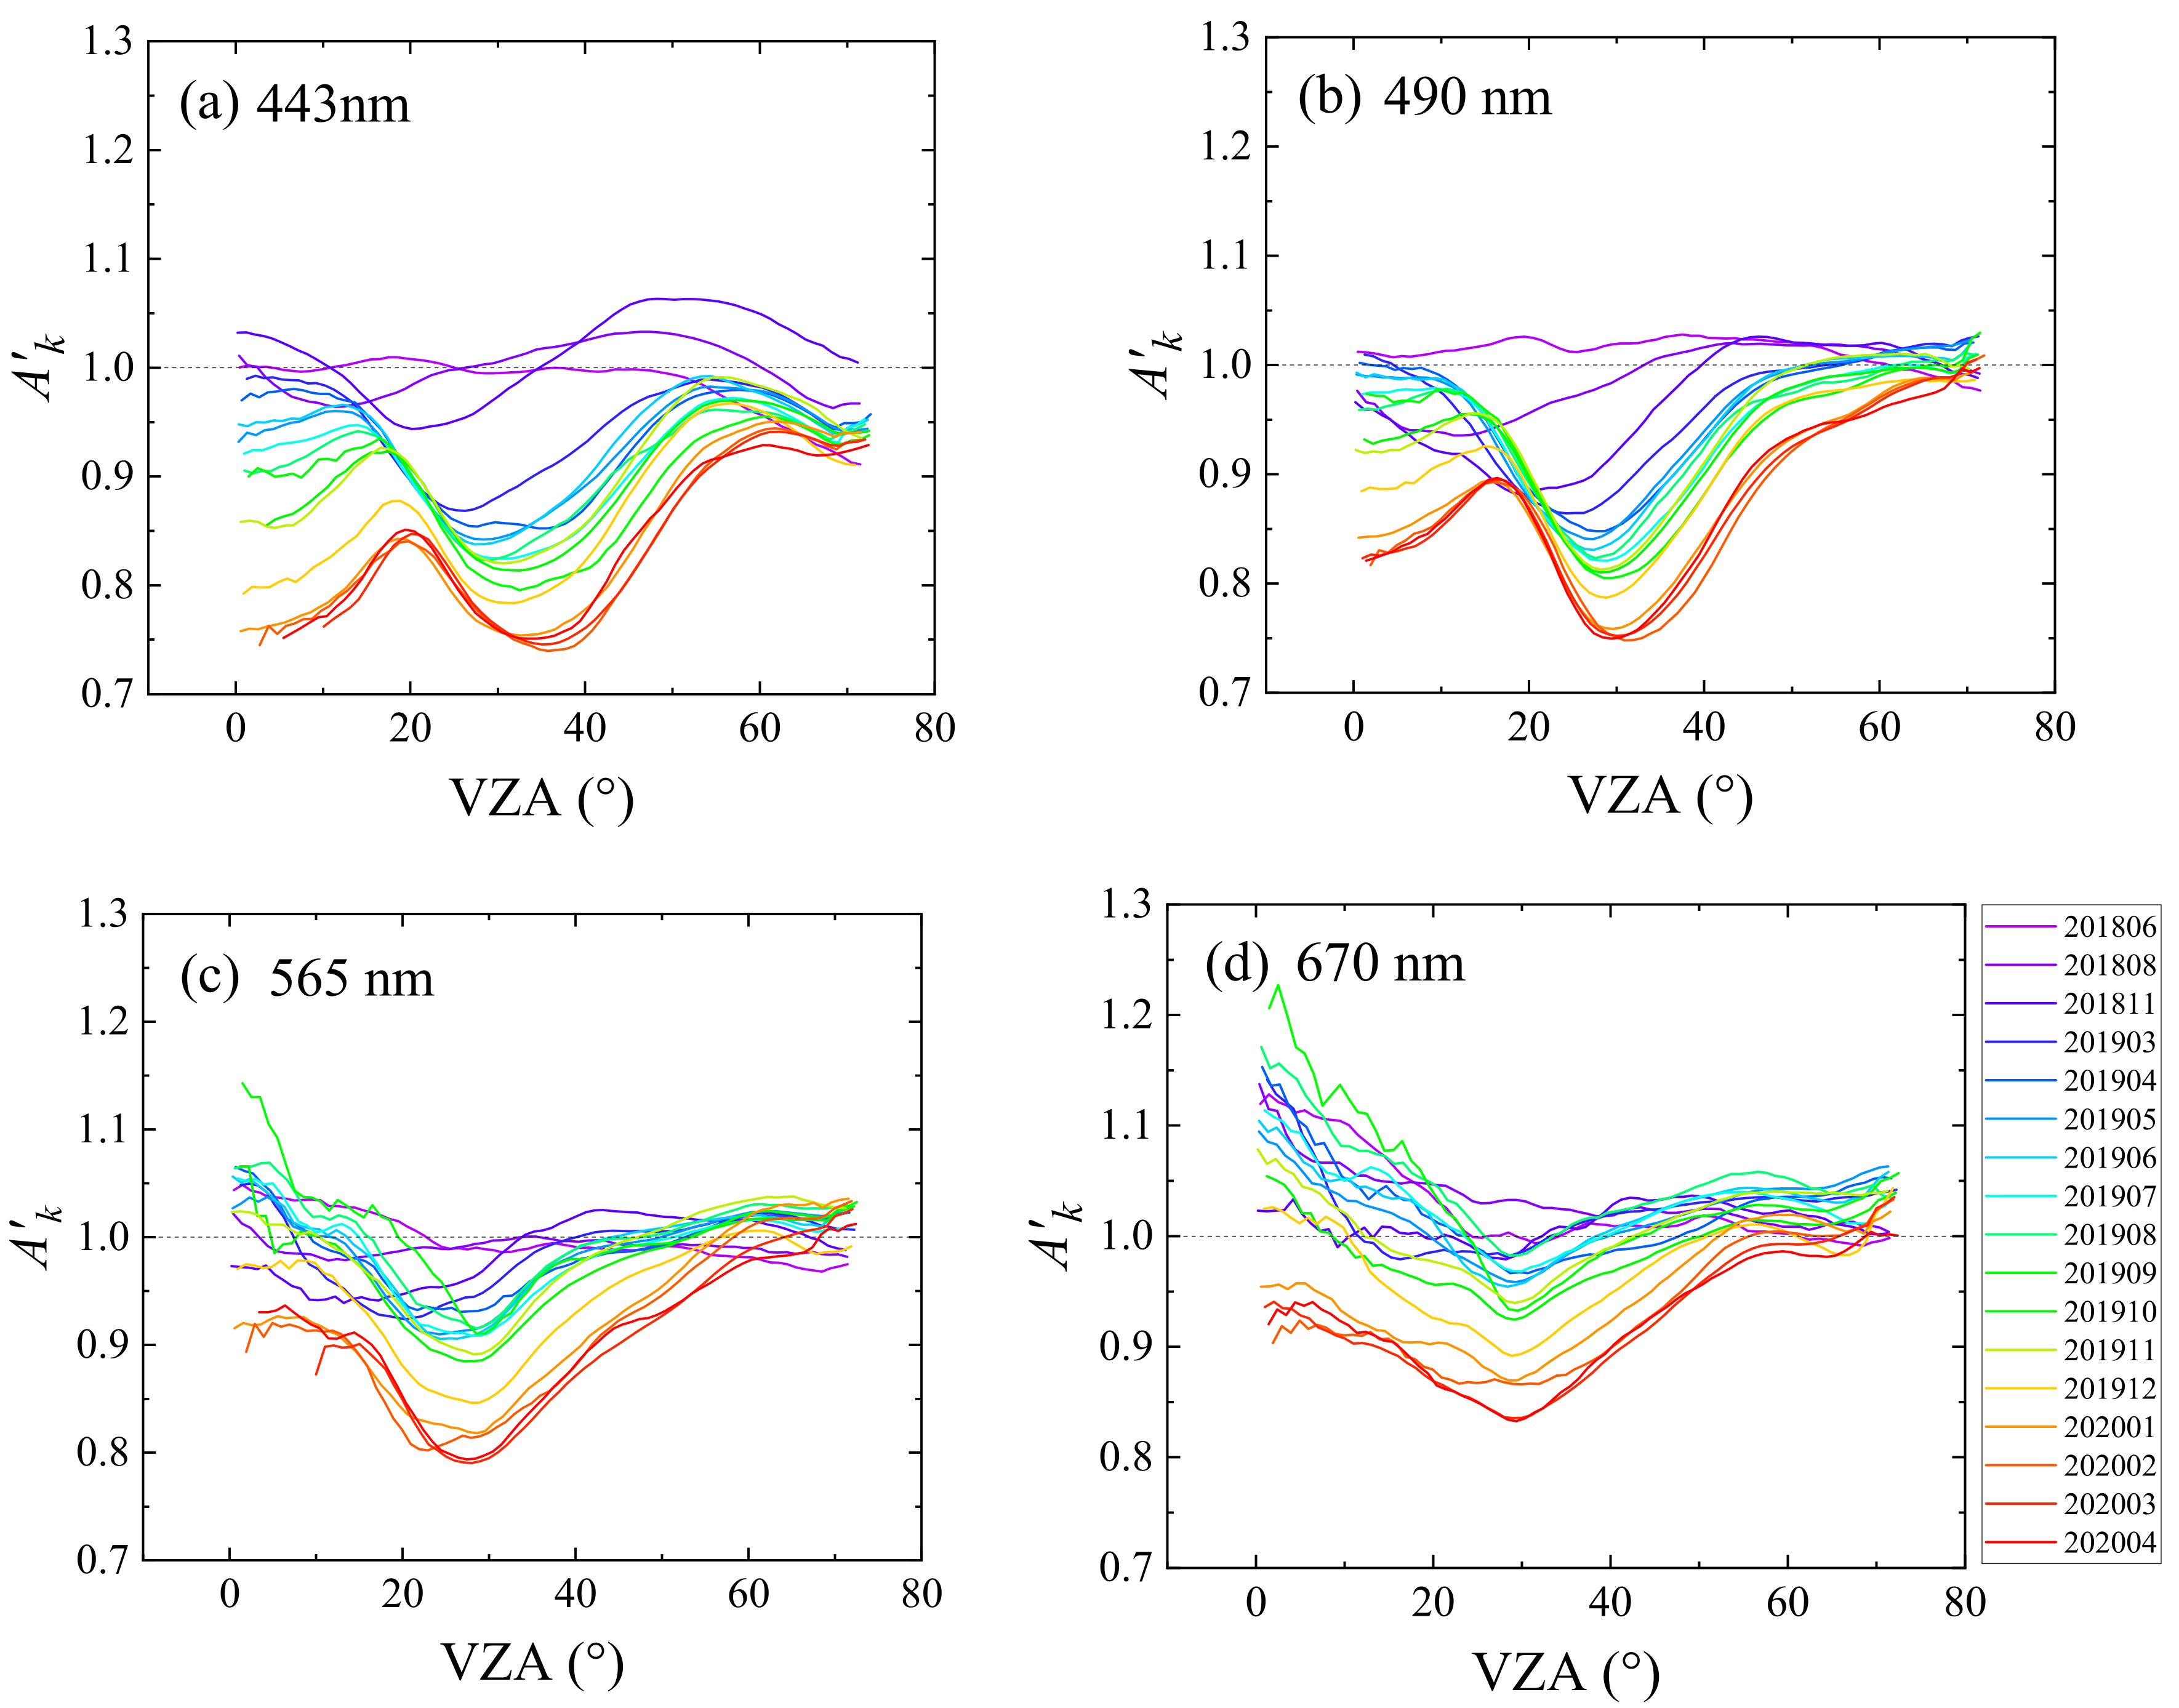
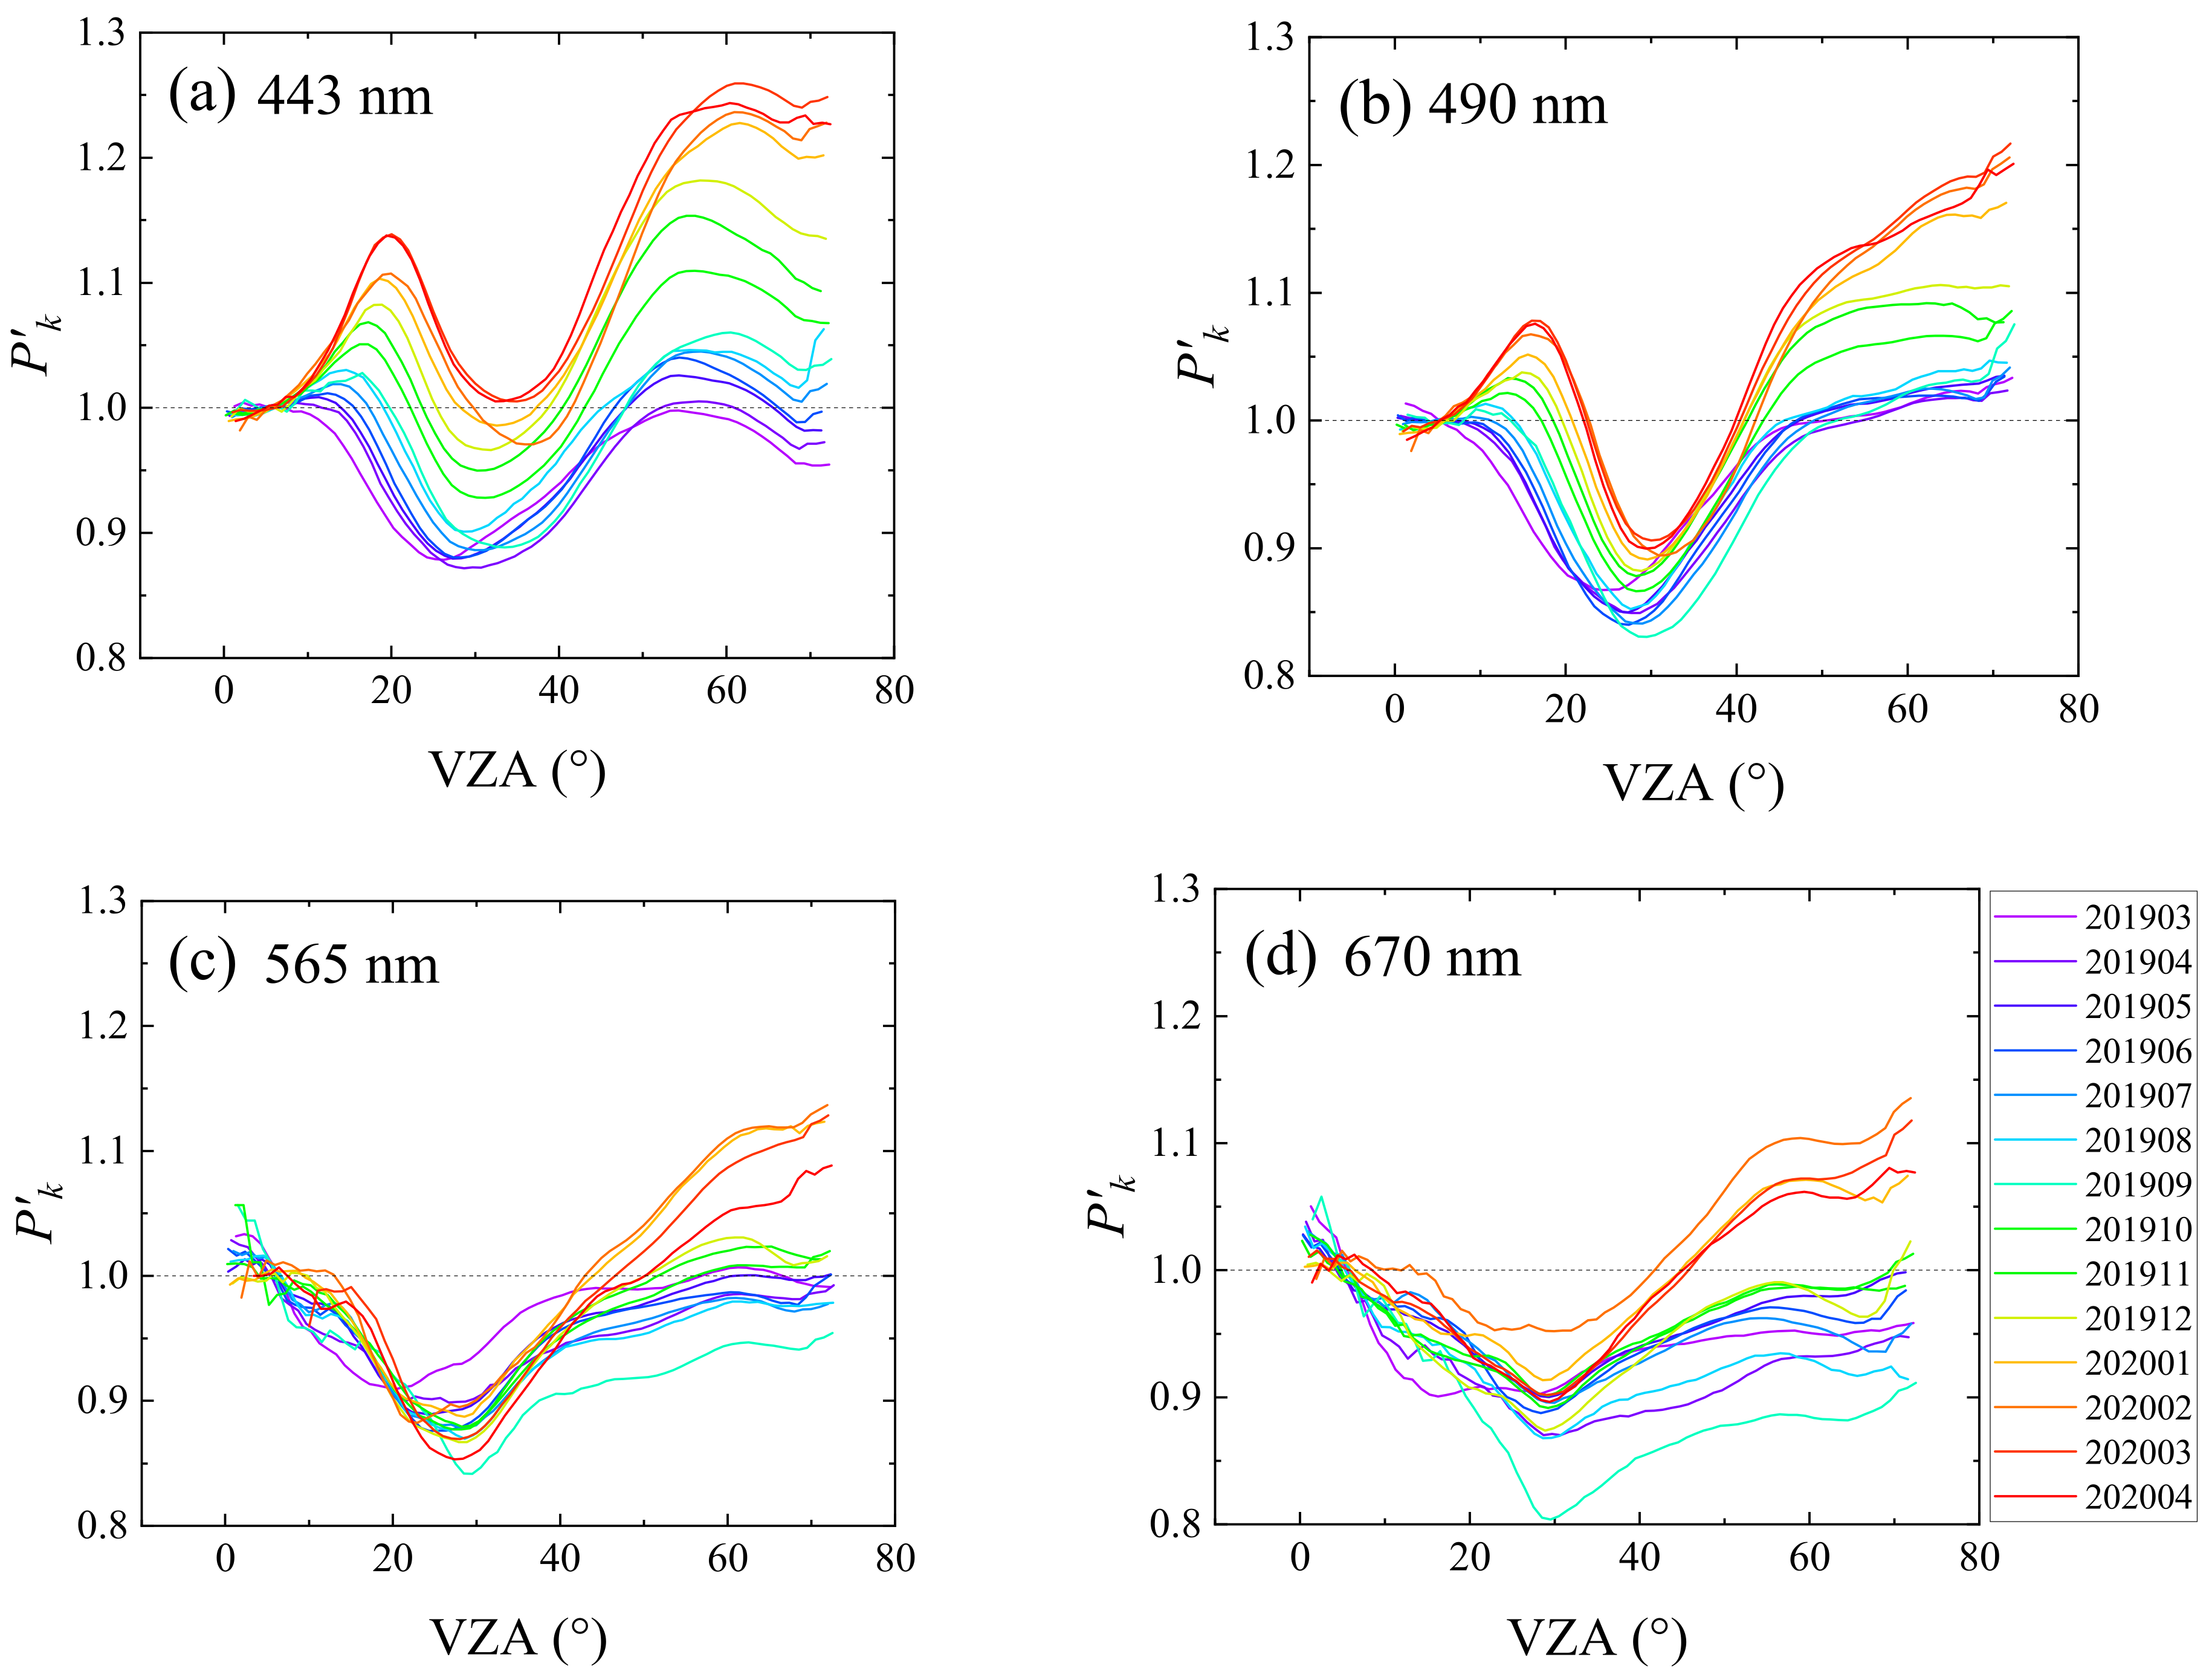
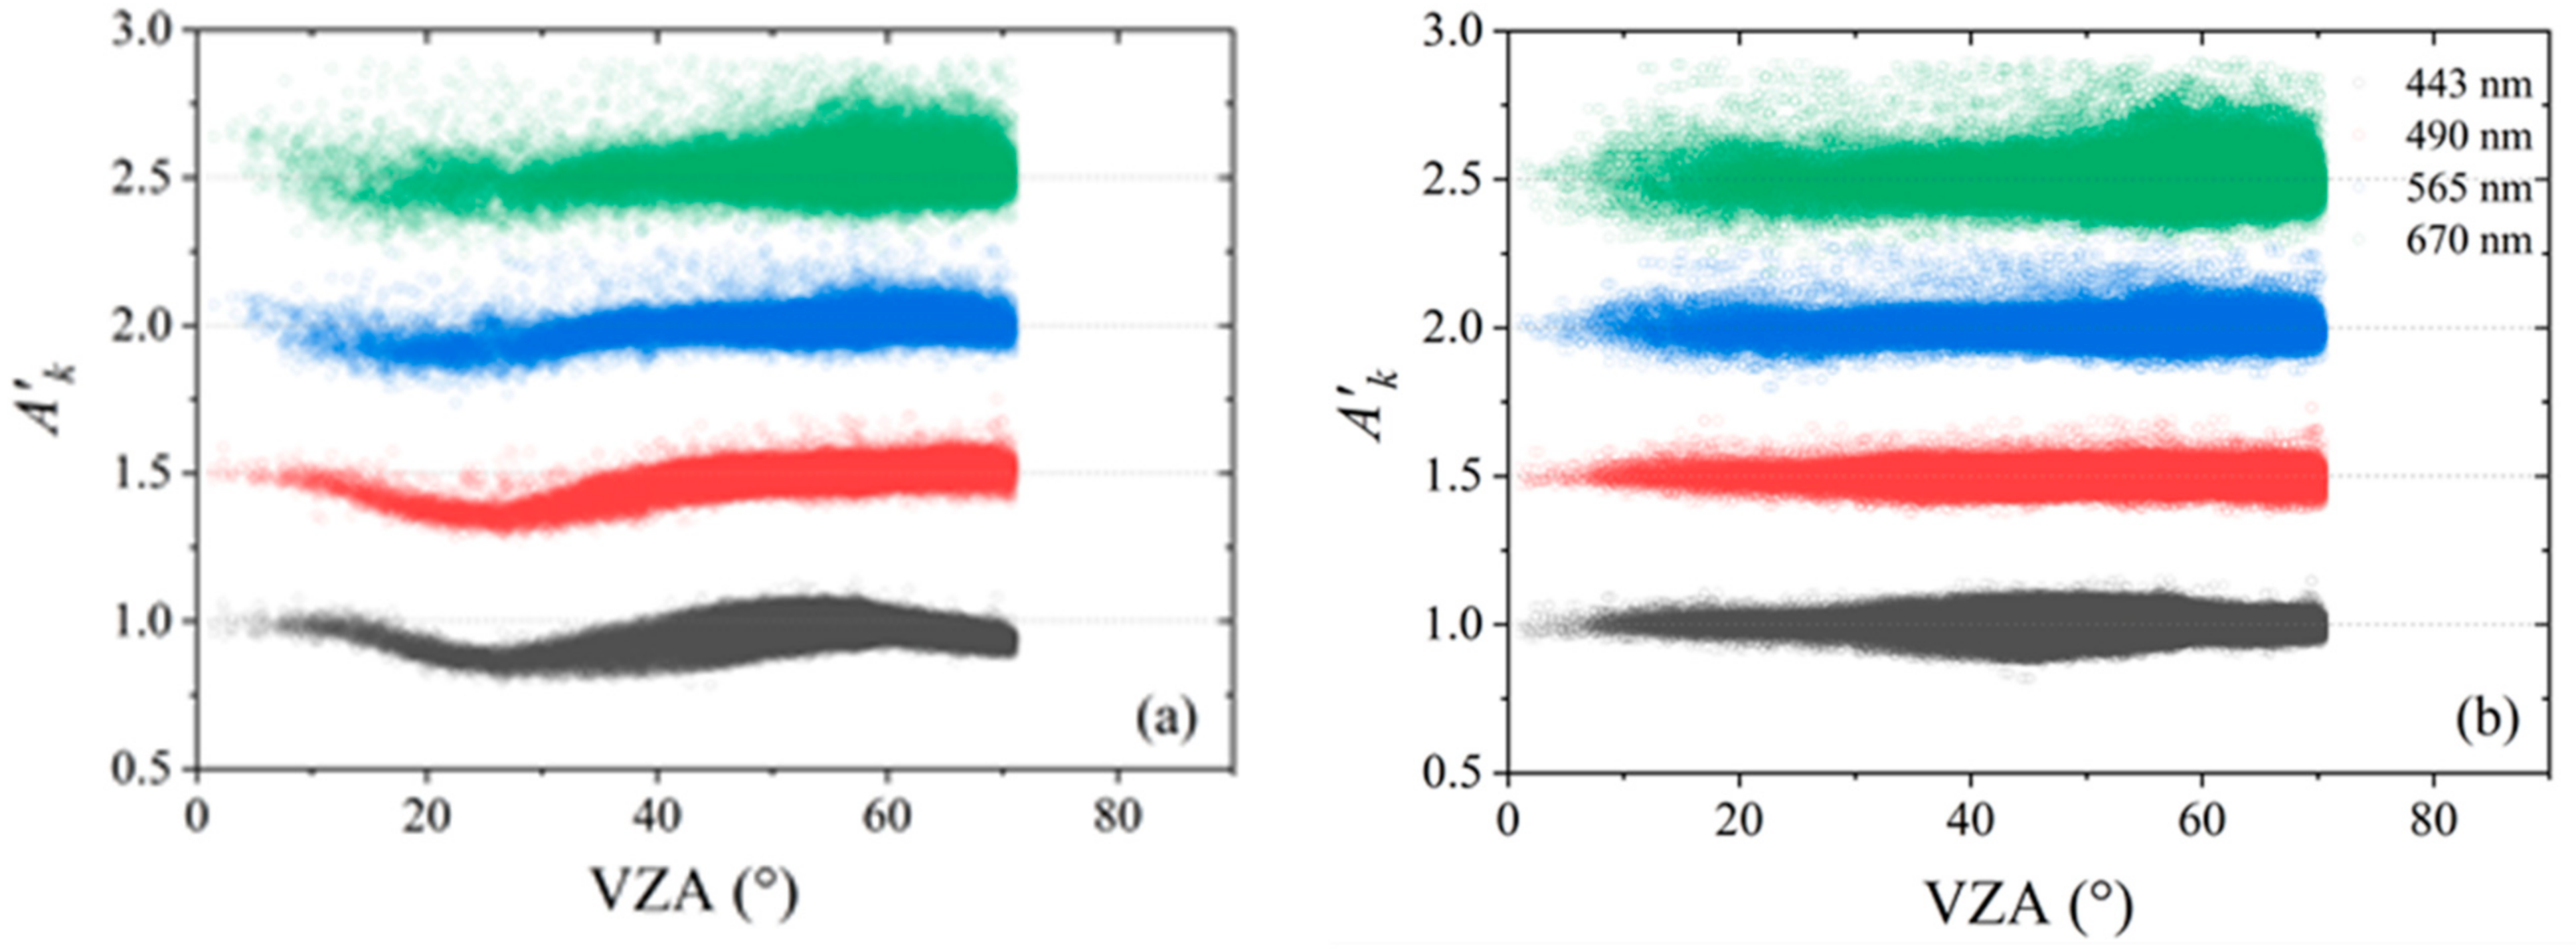
4.2.2. Temporal Drift of the Relative Radiometric Response over the FOV
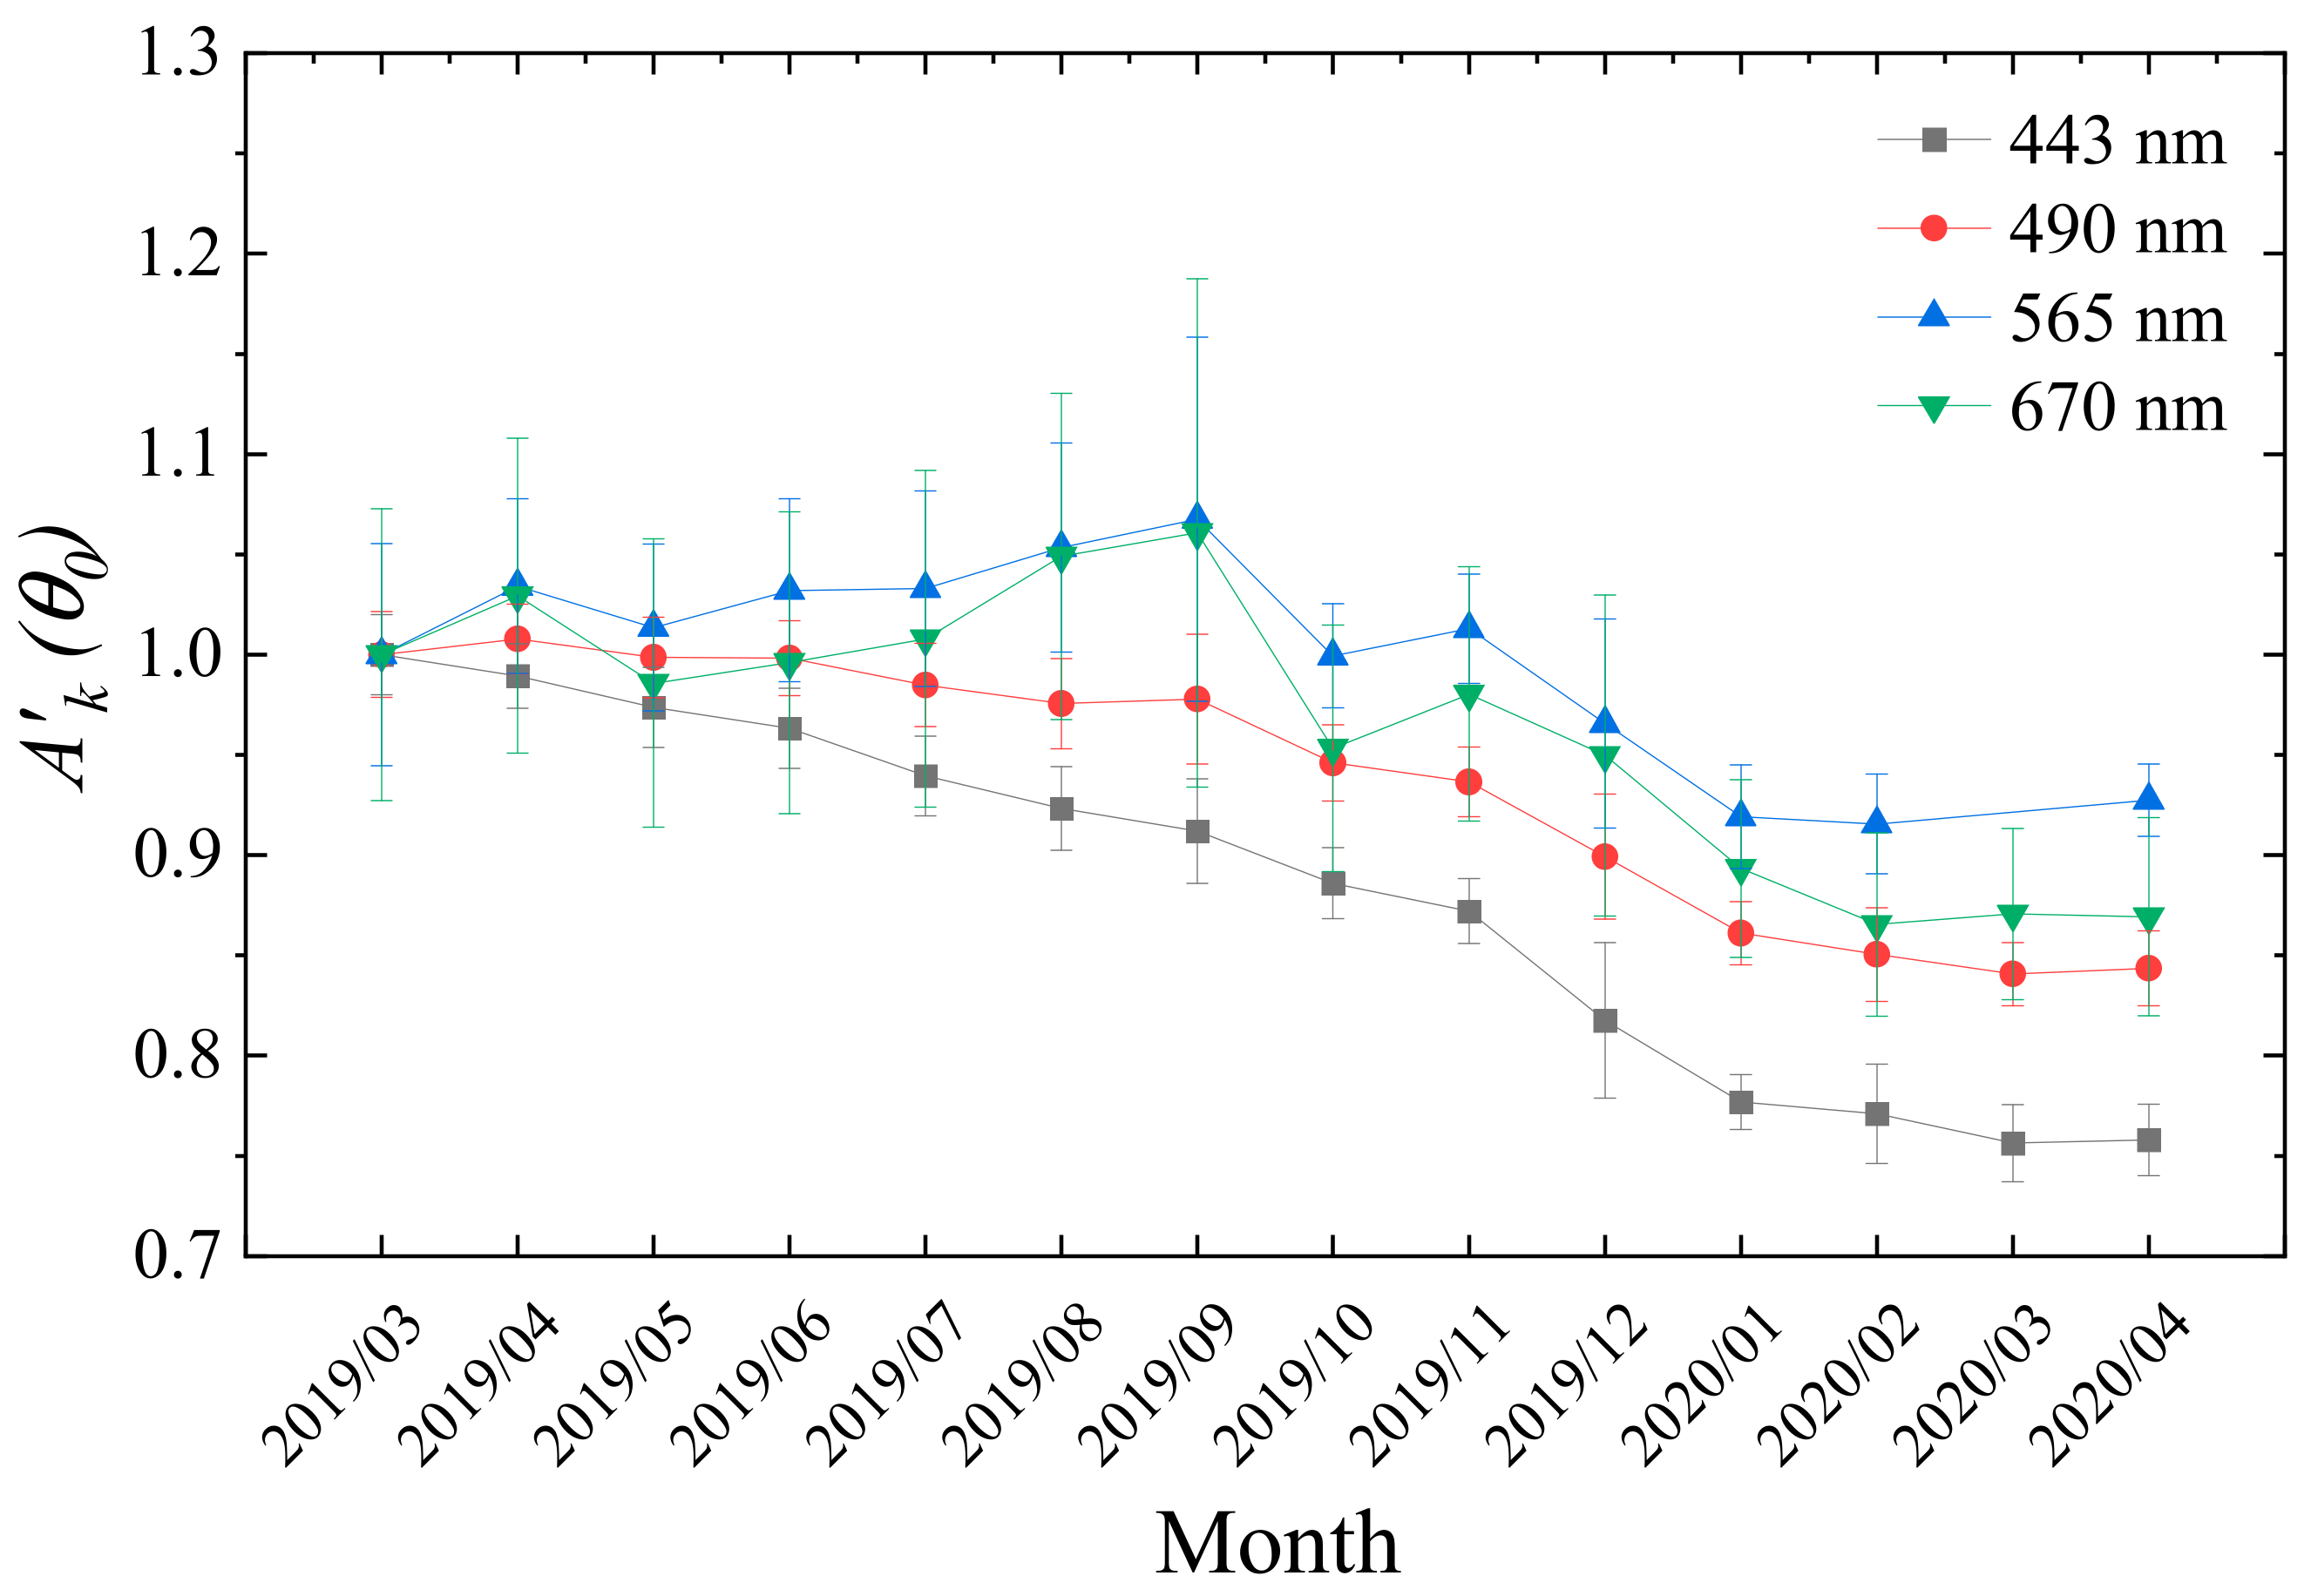
4.2.3. Temporal Drift of the Absolute Radiometric Coefficients
5. Validation of the Results
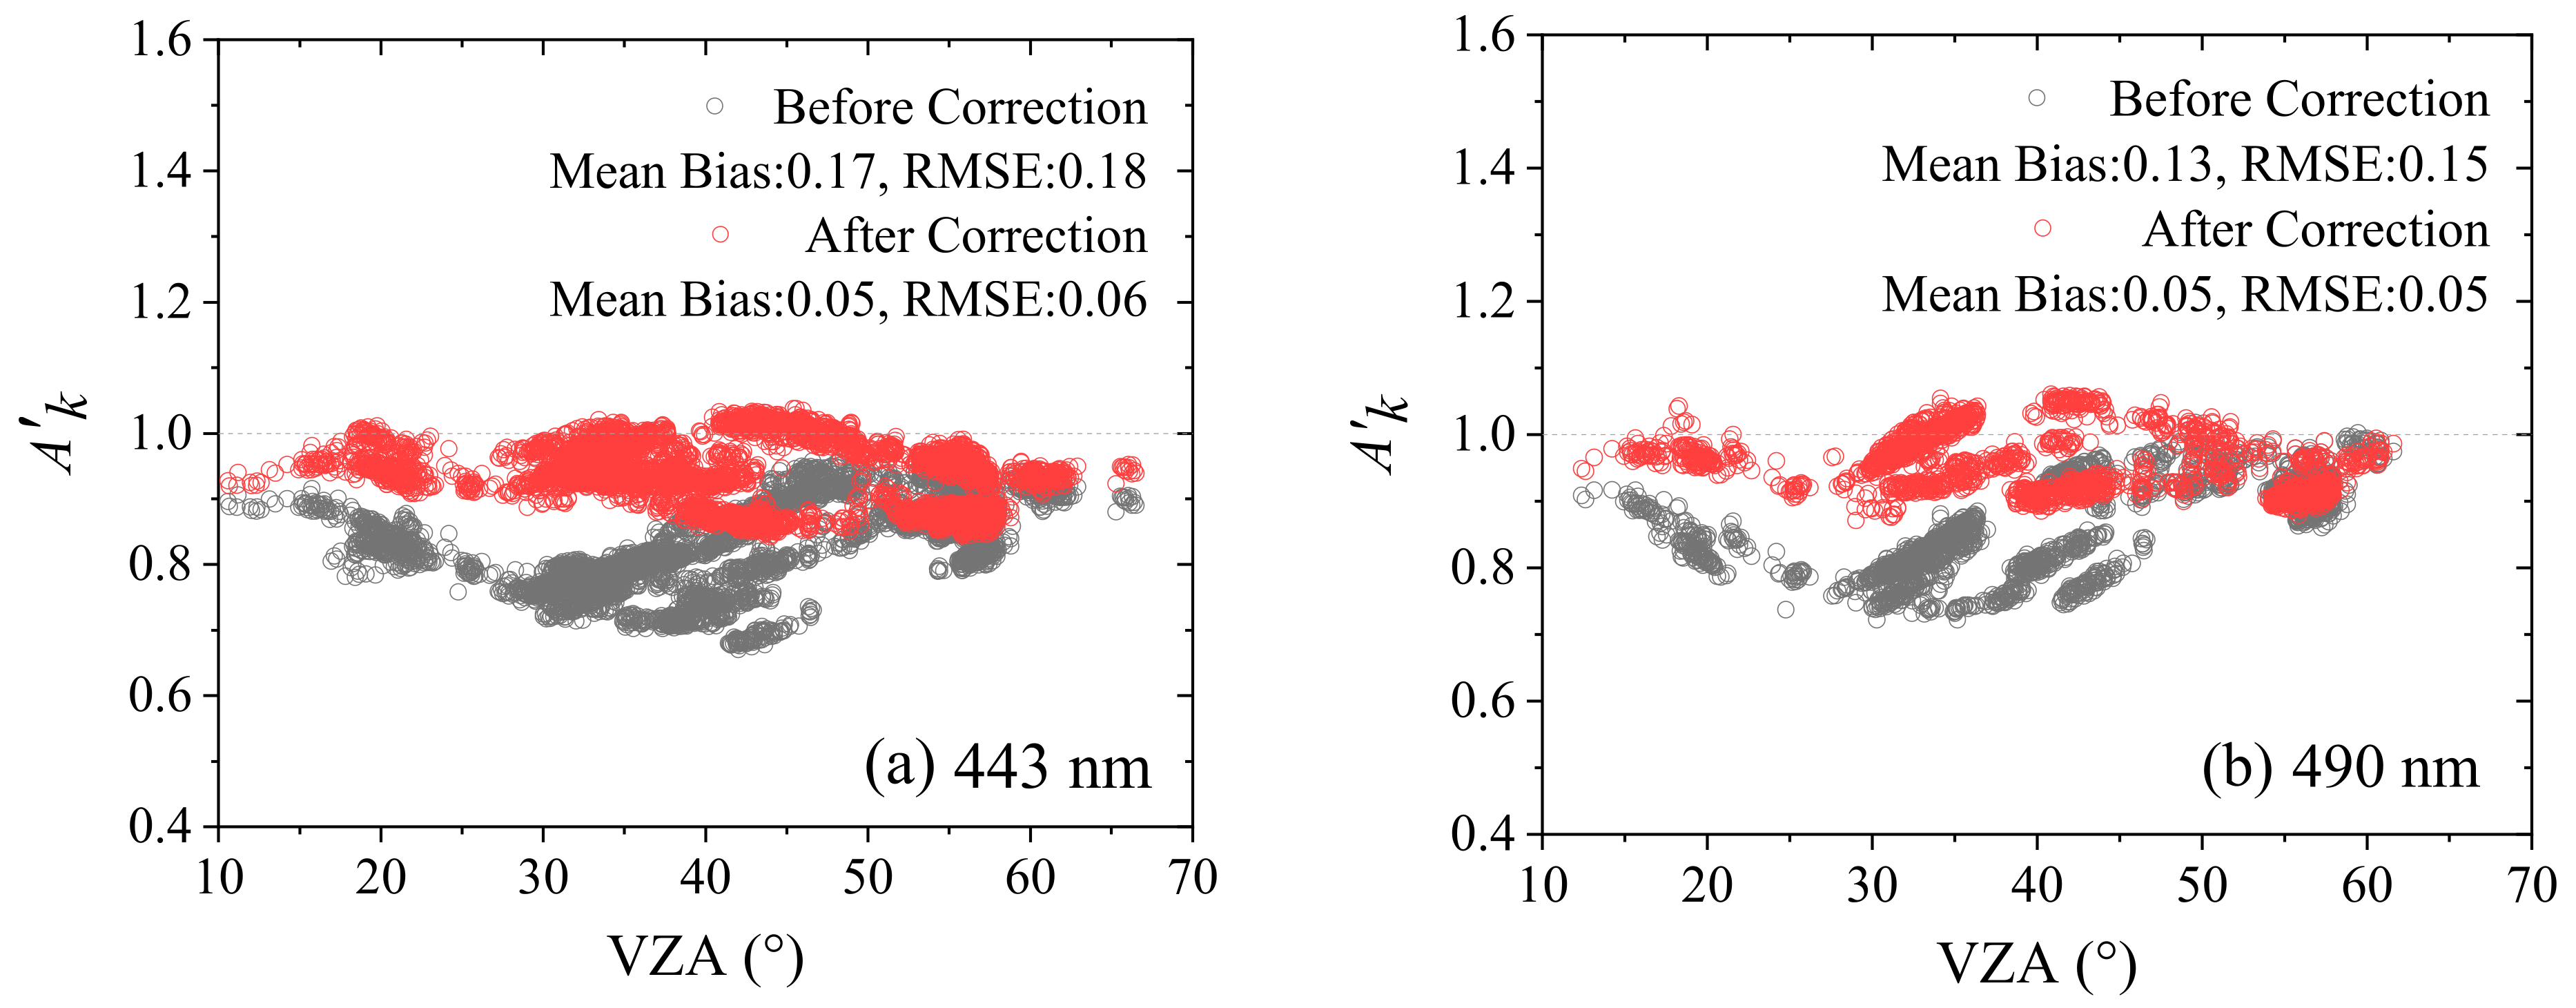
5.1. Self-Consistency Validation
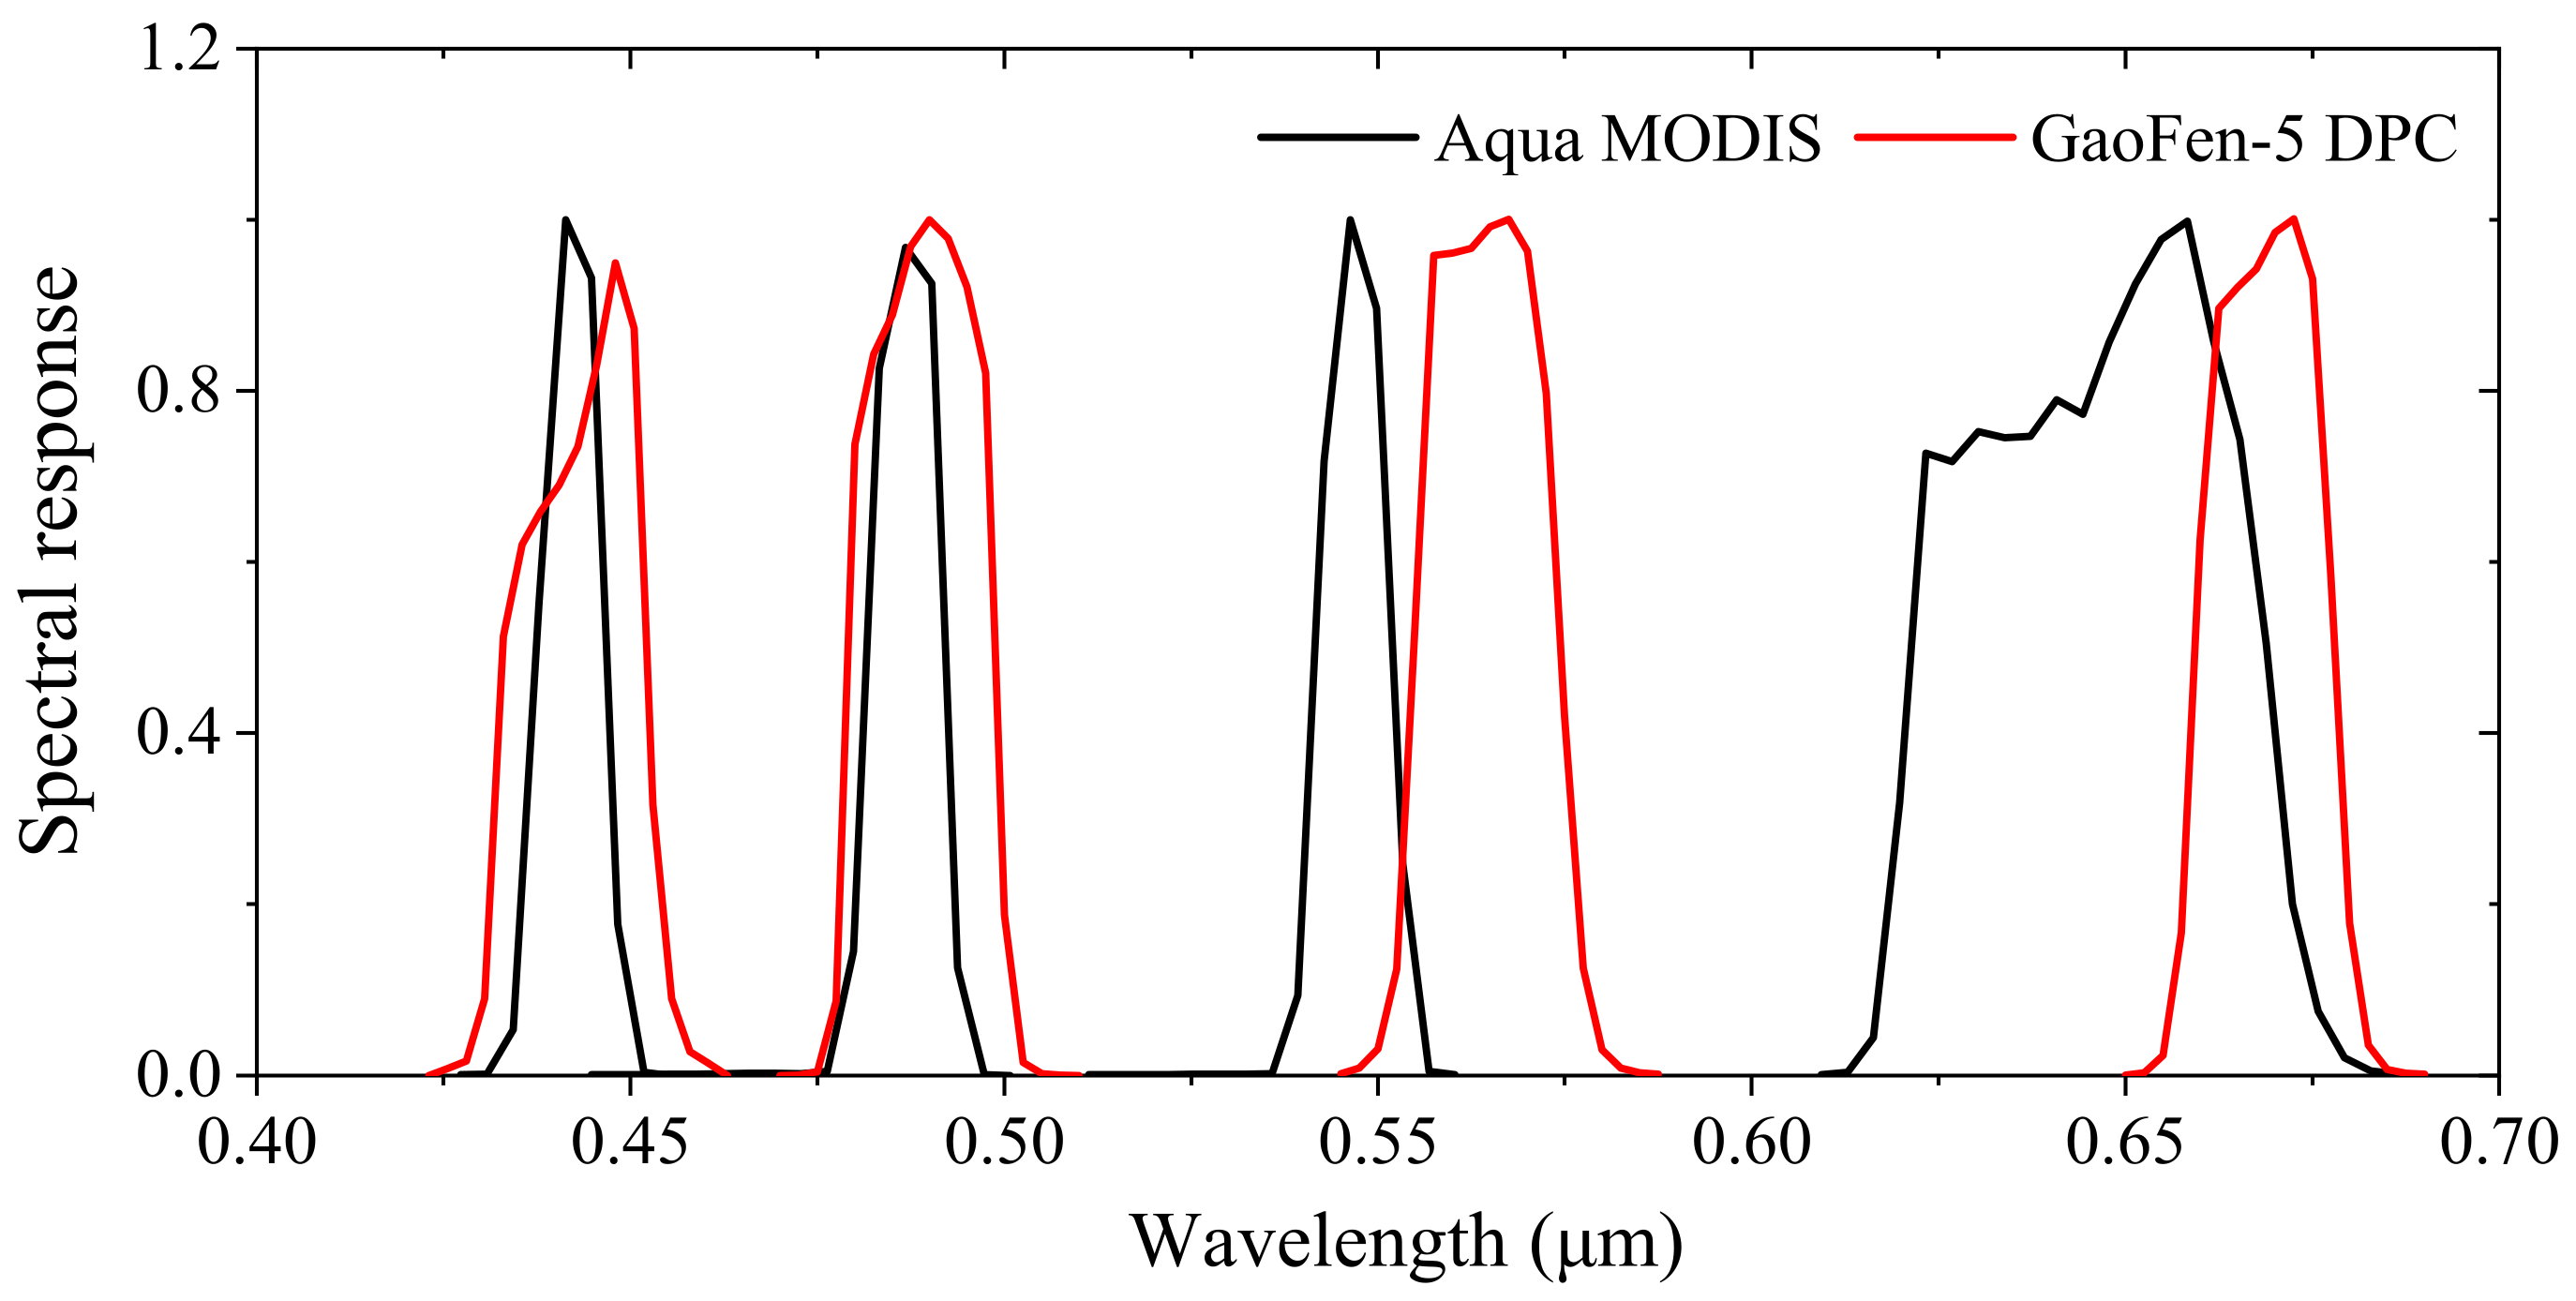
5.2. Verification by Cross Calibration with MODIS over Desert Sites
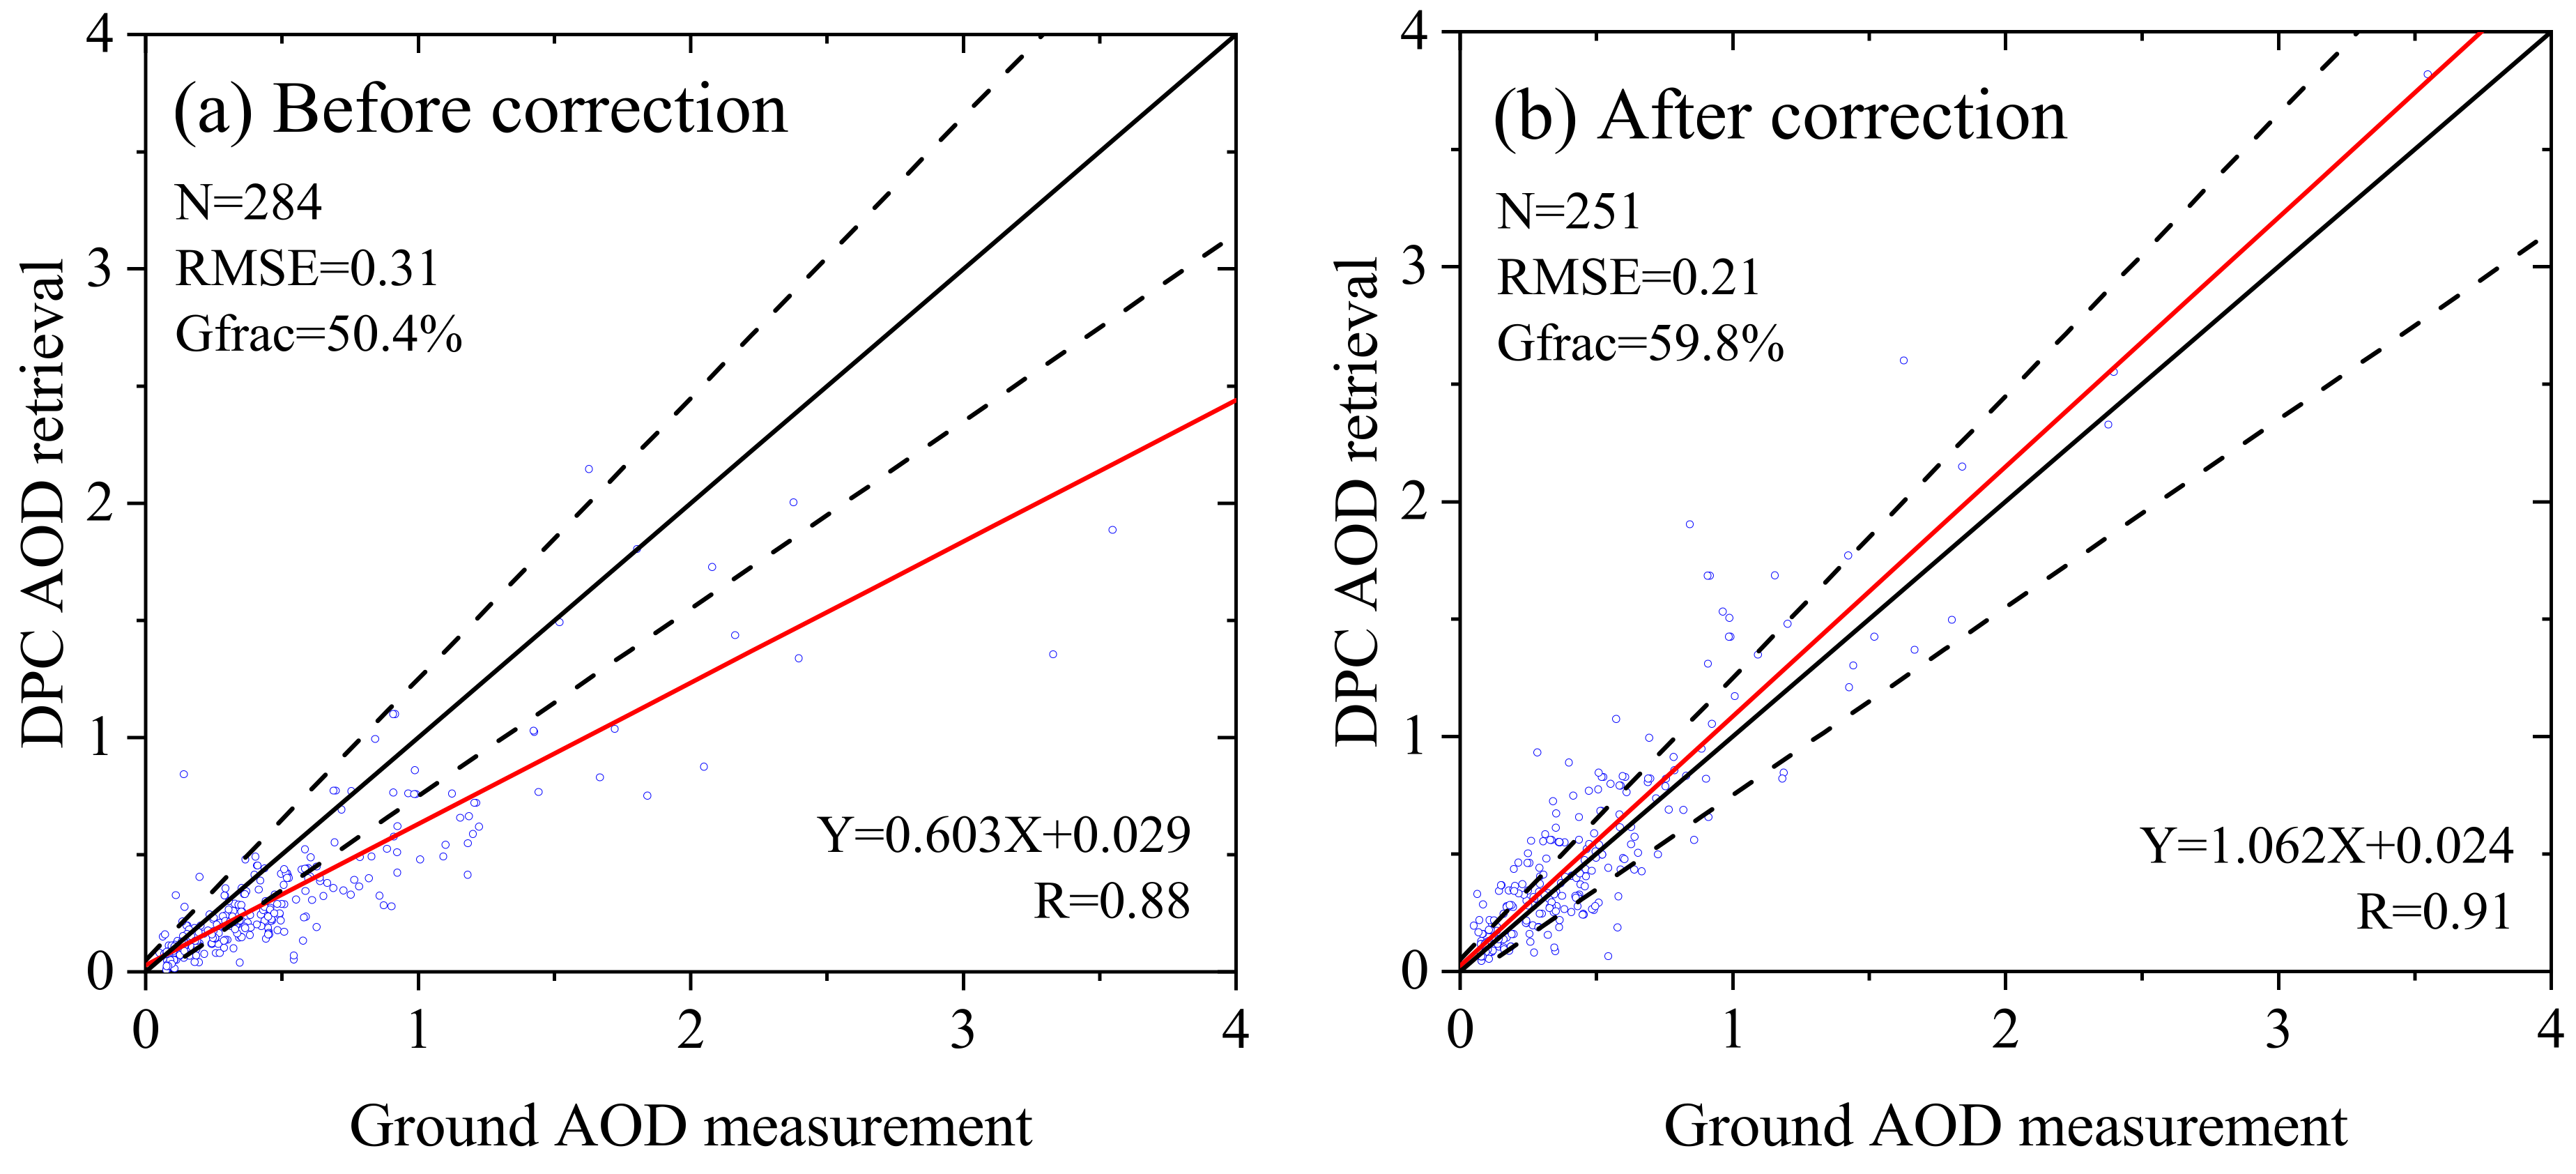
5.3. Verification by Improving the AOD Product
6. Conclusions
Author Contributions
Funding
Institutional Review Board Statement
Informed Consent Statement
Data Availability Statement
Acknowledgments
Conflicts of Interest
Appendix A

| Band | Month | B0(E-01) | B1(E-02) | B2(E-03) | B3(E-05) | B4(E-07) | B5(E-08) | B6(E-10) |
|---|---|---|---|---|---|---|---|---|
| 443 nm | 2019/03 | 9.6639 | 1.5350 | −1.4400 | 2.2013 | 6.1170 | −1.7493 | 1.1166 |
| 2019/04 | 9.7453 | 1.1020 | −0.6462 | −2.7131 | 19.5955 | −3.4302 | 1.8965 | |
| 2019/05 | 9.7502 | 1.0750 | −0.5746 | −3.2068 | 21.0176 | −3.6076 | 1.9753 | |
| 2019/06 | 9.8363 | 0.3620 | 0.6601 | −10.4115 | 39.6778 | −5.8323 | 2.9745 | |
| 2019/07 | 9.8893 | −0.2630 | 1.8000 | −17.1225 | 57.4140 | −8.0078 | 3.9858 | |
| 2019/08 | 9.9466 | −0.6450 | 2.3900 | −20.1063 | 63.8235 | −8.6143 | 4.1908 | |
| 2019/09 | 10.0670 | −1.3260 | 3.3100 | −24.2876 | 72.2820 | −9.3691 | 4.4184 | |
| 2019/10 | 9.9804 | −1.2080 | 3.4700 | −25.7637 | 77.0388 | −10.0258 | 4.7445 | |
| 2019/11 | 10.0723 | −1.9270 | 4.6900 | −32.8372 | 95.8306 | −12.3572 | 5.8386 | |
| 2019/12 | 10.2969 | −2.9530 | 5.8200 | −37.8952 | 106.9370 | −13.5305 | 6.3167 | |
| 2020/01 | 10.2640 | −3.2500 | 6.4200 | −40.2411 | 108.8190 | −13.2205 | 5.9452 | |
| 2020/02 | 10.6663 | −5.0440 | 8.6200 | −50.8551 | 133.2590 | −15.9164 | 7.0921 | |
| 2020/03 | 10.6436 | −4.9440 | 8.5400 | −50.4991 | 132.6210 | −15.8723 | 7.0849 | |
| 2020/04 | 10.5217 | −4.3580 | 7.8600 | −47.5064 | 126.7420 | −15.3559 | 6.9203 | |
| 490 nm | 2019/03 | 9.7715 | 1.9670 | −3.0100 | 12.9375 | −23.2533 | 1.8139 | −0.4771 |
| 2019/04 | 9.6730 | 2.3200 | −3.1100 | 12.1584 | −18.9917 | 1.1227 | −0.1081 | |
| 2019/05 | 9.6635 | 2.3670 | −3.1200 | 11.9071 | −17.7142 | 0.9106 | 0.0083 | |
| 2019/06 | 9.6947 | 1.9610 | −2.2500 | 6.0098 | −0.9373 | −1.2313 | 1.0217 | |
| 2019/07 | 9.5101 | 2.4940 | −2.5800 | 7.0270 | −2.9429 | −0.9880 | 0.8950 | |
| 2019/08 | 9.5269 | 2.2400 | −2.0400 | 3.6803 | 5.7921 | −2.0184 | 1.3506 | |
| 2019/09 | 9.5336 | 1.7750 | −1.0500 | −2.4981 | 22.8231 | −4.1639 | 2.3596 | |
| 2019/10 | 9.6888 | 1.1500 | −0.1368 | −7.4012 | 35.2836 | −5.6579 | 3.0376 | |
| 2019/11 | 9.6859 | 0.9360 | 0.4382 | −11.1619 | 45.8123 | −6.9971 | 3.6738 | |
| 2019/12 | 9.6134 | 0.9530 | 0.5195 | −11.7803 | 47.5799 | −7.2204 | 3.7794 | |
| 2020/01 | 9.7351 | 0.0386 | 2.0200 | −19.7973 | 65.9922 | −9.0999 | 4.4793 | |
| 2020/02 | 9.6997 | −0.0920 | 2.5400 | −23.2691 | 75.4733 | −10.2709 | 5.0202 | |
| 2020/03 | 9.6732 | 0.0957 | 2.2800 | −21.9549 | 72.5307 | −9.9750 | 4.9115 | |
| 2020/04 | 9.2962 | 1.6170 | 0.4575 | −12.8336 | 50.8436 | −7.5213 | 3.8441 | |
| 565 nm | 2019/03 | 10.5619 | −0.8320 | −0.8383 | 7.6900 | −21.7704 | 2.6529 | −1.1958 |
| 2019/04 | 10.0140 | 1.0590 | −2.1700 | 10.5964 | −22.0062 | 2.0932 | −0.7502 | |
| 2019/05 | 10.0418 | 0.9780 | −2.0300 | 9.6084 | −18.9396 | 1.6722 | −0.5401 | |
| 2019/06 | 10.1014 | 0.6220 | −1.4200 | 5.6972 | −7.8270 | 0.2350 | 0.1522 | |
| 2019/07 | 9.8543 | 1.5510 | −2.3800 | 10.1655 | −18.5332 | 1.5041 | −0.4333 | |
| 2019/08 | 10.2167 | 0.3810 | −1.3700 | 6.3378 | −11.5477 | 0.9073 | −0.2449 | |
| 2019/09 | 10.0578 | 1.1460 | −2.4000 | 10.9869 | −20.9131 | 1.7825 | −0.5526 | |
| 2019/10 | 9.8873 | 1.1990 | −1.8000 | 6.7803 | −9.2663 | 0.3376 | 0.1141 | |
| 2019/11 | 9.9139 | 1.1580 | −1.6900 | 5.7335 | −5.7305 | −0.1552 | 0.3557 | |
| 2019/12 | 9.6085 | 2.2390 | −2.8300 | 10.7984 | −16.6471 | 0.9946 | −0.1201 | |
| 2020/01 | 9.6194 | 2.2440 | −2.8700 | 11.6022 | −20.2395 | 1.6082 | −0.4733 | |
| 2020/02 | 8.6279 | 5.2320 | −5.4700 | 21.4538 | −38.8702 | 3.3287 | −1.0892 | |
| 2020/03 | 7.8343 | 6.5590 | −6.4700 | 25.0900 | −45.7703 | 3.9853 | −1.3350 | |
| 2020/04 | 6.8971 | 9.1380 | −8.9100 | 35.8502 | −69.6268 | 6.5565 | −2.4095 | |
| 670 nm | 2019/03 | 11.0199 | −3.0330 | 1.9800 | −7.3261 | 15.3412 | −1.6382 | 0.6884 |
| 2019/04 | 10.3899 | −1.0990 | 0.7239 | −4.1420 | 12.6602 | −1.7396 | 0.8683 | |
| 2019/05 | 10.3432 | −0.8860 | 0.5659 | −3.8563 | 13.2152 | −1.9357 | 1.0056 | |
| 2019/06 | 10.3466 | −1.0100 | 1.0000 | −7.3694 | 24.3504 | −3.4743 | 1.7784 | |
| 2019/07 | 10.3241 | −0.8080 | 0.6400 | −5.0342 | 17.3024 | −2.4938 | 1.2721 | |
| 2019/08 | 10.4927 | −1.2730 | 0.8747 | −5.7385 | 18.3070 | −2.5422 | 1.2680 | |
| 2019/09 | 10.4829 | −1.0820 | 0.3574 | −2.1194 | 8.6613 | −1.4289 | 0.8010 | |
| 2019/10 | 10.4079 | −1.1860 | 0.7206 | −4.1144 | 13.3273 | −1.9300 | 1.0027 | |
| 2019/11 | 10.2380 | −0.6380 | 0.3846 | −4.0810 | 16.8243 | −2.6873 | 1.4698 | |
| 2019/12 | 10.1484 | −0.3330 | 0.1849 | −4.1750 | 19.6457 | −3.2837 | 1.8404 | |
| 2020/01 | 10.1481 | −0.5790 | 0.7103 | −6.1315 | 21.4229 | −3.0841 | 1.5653 | |
| 2020/02 | 10.0271 | −0.0794 | 0.2909 | −5.0614 | 21.0868 | −3.2612 | 1.7234 | |
| 2020/03 | 9.9585 | 0.2910 | −0.1911 | −2.6749 | 15.5124 | −2.6457 | 1.4648 | |
| 2020/04 | 9.5060 | 2.1790 | −2.3900 | 8.3306 | −11.2585 | 0.4806 | 0.0591 |
References
- Levy, R.C.; Mattoo, S.; Munchak, L.A.; Remer, L.A.; Hsu, N.C. The Collection 6 MODIS aerosol products over land and ocean. Atmos. Meas. Tech. 2013, 6, 2989–3034. [Google Scholar] [CrossRef] [Green Version]
- Solomon, S.D.; Qin, D.; Manning, M.; Chen, Z.; Marquis, M.; Avery, K.B.; Tignor, M.; Miller, H.L. Contribution of Working Group I to the Fourth Assessment Report of the Intergovernmental Panel on Climate Change; Cambridge University Press: Cambridge, UK, 2013. [Google Scholar]
- Helder, D.L. Comparison of MSS relative radiometric calibration methods. Proc. SPIE—Int. Soc. Opt. Eng. 1993, 1938, 46–55. [Google Scholar]
- Xiong, X.; Chiang, K.; Esposito, J.; Guenther, B.; Barnes, W. MODIS on-orbit calibration and characterization. Metrologia 2003, 40, S89. [Google Scholar] [CrossRef]
- Meygret, A.; Dinguirard, M.C.; Henry, P.J.; Poutier, L.; Hazane, P. SPOT Histogram data base. Proc. SPIE—Int. Soc. Opt. Eng. 1997, 2957, 322–331. [Google Scholar]
- Horn, B.; Woodham, R.J. Destriping LANDSAT MSS images by histogram modification. Comput. Graph. Image Processing 1979, 10, 69–83. [Google Scholar] [CrossRef] [Green Version]
- Wang, M.; Chen, C.; Pan, J.; Zhu, Y.; Chang, X. A Relative Radiometric Calibration Method Based on the Histogram of Side-Slither Data for High-Resolution Optical Satellite Imagery. Remote Sens. 2018, 10, 381. [Google Scholar] [CrossRef] [Green Version]
- Henderson, B.G.; Krause, K.S. Relative radiometric correction of QuickBird imagery using the side-slither technique on orbit. Proc. SPIE—Int. Soc. Opt. Eng. 2004, 5542, 426–436. [Google Scholar]
- Pagnutti, M.; Ryan, R.E.; Kelly, M.; Holekamp, K.; Zanoni, V.; Thome, K.; Schiller, S. Radiometric characterization of IKONOS multispectral imagery. Remote Sens. Environ. 2003, 88, 53–68. [Google Scholar] [CrossRef] [Green Version]
- Bindschadler, R.; Choi, H. Characterizing and correcting Hyperion detectors using ice-sheet images. IEEE Trans. Geosci. Remote Sens. 2003, 41, 1189–1193. [Google Scholar] [CrossRef]
- Butler, J.J.; Krause, K.S.; Xiong, J. QuickBird relative radiometric performance and on-orbit long term trending. In Proceedings of the Earth Observing Systems XI, San Diego, CA, USA, 7 September 2006. [Google Scholar]
- Deschamps, P.Y.; Breon, F.M.; Leroy, M.; Podaire, A.; Bricaud, A.; Buriez, J.C.; Seze, G. The POLDER mission: Instrument characteristics and scientific objectives. IEEE Trans. Geosci. Remote Sens. 1994, 32, 598–615. [Google Scholar] [CrossRef]
- Fougnie, B. Improvement of the PARASOL Radiometric In-Flight Calibration Based on Synergy Between Various Methods Using Natural Targets. IEEE Trans. Geosci. Remote Sens. 2016, 54, 2140–2152. [Google Scholar] [CrossRef]
- Fougnie, B.; Henry, P.J.; Cabot, F.; Meygret, A.; Laubies, M.-C. Vegetation: In-flight multiangular calibration. In Proceedings of the Earth Observing Systems V, San Diego, CA, USA, 15 November 2000; pp. 331–338. [Google Scholar]
- Cosnefroy, H.; Soule, P.; Briottet, X.; Hagolle, O.; Cabot, F. POLDER multiangular calibration using desert sites: Method and performances. Proc. SPIE—Int. Soc. Opt. Eng. 1997, 3221, 141–148. [Google Scholar]
- Chen, F.; Luo, D.; Li, S.; Yang, B.; Sun, L.; Ge, S.; Hong, J. The Operational Inflight Radiometric Uniform Calibration of a Directional Polarimetric Camera. Remote Sens. 2021, 13, 3823. [Google Scholar] [CrossRef]
- Vermote, E.; Santer, R.; Deschamps, P.Y.; Herman, M. In-flight calibration of large field of view sensors at short wavelengths using Rayleigh scattering. Int. J. Remote Sens. 1992, 13, 3409–3429. [Google Scholar] [CrossRef]
- Hagolle, O.; Goloub, P.; Deschamps, P.Y.; Cosnefroy, H.; Briottet, X.; Bailleul, T.; Nicolas, J.M.; Parol, F.; Lafrance, B.; Herman, M. Results of POLDER in-flight calibration. IEEE Trans. Geosci. Remote Sens. 1999, 37, 1550–1566. [Google Scholar] [CrossRef] [Green Version]
- Huang, C.; Xiang, G.; Chang, Y.; Han, L.; Zhang, M.; Li, S.; Tu, B.; Meng, B.; Hong, J. Pre-flight calibration of a multi-angle polarimetric satellite sensor directional polarimetric camera. Opt Express 2020, 28, 13187–13215. [Google Scholar] [CrossRef] [PubMed]
- Chen, X.; Xing, J.; Liu, L.; Li, Z.; Mei, X.; Fu, Q.; Xie, Y.; Ge, B.; Li, K.; Xu, H. In-Flight Calibration of GF-1/WFV Visible Channels Using Rayleigh Scattering. Remote Sens. 2017, 9, 513. [Google Scholar] [CrossRef] [Green Version]
- Vermote, E.F.; Tanré, D.; Deuze, J.L.; Herman, M.; Morcette, J.-J. Second simulation of the satellite signal in the solar spectrum, 6S: An overview. IEEE Trans. Geosci. Remote Sens. 1997, 35, 675–686. [Google Scholar] [CrossRef] [Green Version]
- Qie, L.; Li, Z.; Zhu, S.; Xu, H.; Xie, Y.; Qiao, R.; Hong, J.; Tu, B. In-flight radiometric and polarimetric calibration of the Directional Polarimetric Camera onboard the GaoFen-5 satellite over the ocean. Appl. Opt. 2021, 60, 7186–7199. [Google Scholar] [CrossRef]
- Frouin, R. In-Flight Calibration of Satellite Ocean-Colour Sensors; Reports of the International Ocean-Colour Coordinating Group; International Ocean-Colour Coordinating Group: Dartmouth, NS, Canada, 2013. [Google Scholar]
- Fougnie, B.; Llido, J.; Gross-Colzy, L.; Henry, P.; Blumstein, D. Climatology of oceanic zones suitable for in-flight calibration of space sensors. In Proceedings of the Earth Observing Systems XV, San Diego, CA, USA, 27 August 2010; p. 78070S. [Google Scholar]
- Hou, M.L.Z.; Xie, Y.; Rui, Q.; Xie, Y.; Qie, L.; Shi, Z. Research on Spectral Feature Cloud Detection Method of Directional Polarimetric Camera on Chinese Satellite. J. Atmos. Environ. Opt. 2022, accepted. [Google Scholar]
- Zhu, S.; Chen, X.; Liu, L.; Qie, L.; Li, Z.; Ma, J.; Ge, S.; Hong, J.; Li, X.; Gao, H. Evaluation of radiometric performance of MODIS visible bands using the Rayleigh scattering method. J. Appl. Remote Sens. 2019, 13. [Google Scholar] [CrossRef]
- Antón, M.; López, M.; Vilaplana, J.M.; Kroon, M.; Mcpeters, R.; Bañón, M.; Serrano, A. Validation of OMI-TOMS and OMI-DOAS total ozone column using five Brewer spectroradiometers at the Iberian peninsula. J. Geophys. Res. Atmos. 2009, 114. [Google Scholar] [CrossRef]
- Werdell, P.J.; Bailey, S.W. An improved bio-optical data set for ocean color algorithm development and satellite data product variation. Remote Sens. Environ. 2005, 98, 122–140. [Google Scholar] [CrossRef]
- Kalnay, E.; Kanamitsu, M.; Kistler, R.; Collins, W.; Deaven, D.; Gandin, L.; Iredell, M.; Saha, S.; White, G.; Woollen, J.; et al. The NCEP/NCAR 40-Year Reanalysis Project. Bull. Am. Meteorol. Soc. 1996, 77, 437–472. [Google Scholar] [CrossRef] [Green Version]
- Xiong, J.; Toller, G.; Chiang, V.; Sun, J.; Esposito, J.; Barnes, W. MODIS Level 1B Algorithm Theoretical Basis Document; NASA MODIS Characterization Support Team: Washington, DC, USA, 2005. [Google Scholar]
- Angal, A.; Xiong, X.; Shrestha, A. Cross-Calibration of MODIS Reflective Solar Bands With Sentinel 2A/2B MSI Instruments. IEEE Trans. Geosci. Remote Sens. 2020, 58, 5000–5007. [Google Scholar] [CrossRef]
- Cosnefroy, H.; Leroy, M.; Briottet, X. Selection and characterization of Saharan and Arabian desert sites for the calibration of optical satellite sensors. Remote Sens. Environ. 1996, 58, 101–114. [Google Scholar] [CrossRef]
- Lacherade, S.; Fougnie, B.; Henry, P.; Gamet, P. Cross Calibration Over Desert Sites: Description, Methodology, and Operational Implementation. IEEE Trans. Geosci. Remote Sens. 2013, 51, 1098–1113. [Google Scholar] [CrossRef]
- Angal, A.; Xiong, X.; Wu, A.; Changler, G.; Choi, T. Multitemporal Cross-Calibration of the Terra MODIS and Landsat 7 ETM+ Reflective Solar Bands. IEEE Trans. Geosci. Remote Sens. 2013, 51, 1870–1882. [Google Scholar] [CrossRef]
- Hsu, N.C.; Jeong, M.J.; Bettenhausen, C.; Sayer, A.M.; Tsay, S.C. Enhanced Deep Blue aerosol retrieval algorithm: The second generation. J. Geophys. Res. Atmos. 2013, 118, 9296–9315. [Google Scholar] [CrossRef]
- Roujean, J.L.; Leroy, M.; Deschamps, P.Y. A bidirectional reflectance model of the Earth’s surface for the correction of remote sensing data. J. Geophys. Res. Atmos. 1992, 97, 20455–20468. [Google Scholar] [CrossRef]
- Ge, B.; Li, Z.; Liu, L.; Yang, L.; Chen, X.; Hou, W.; Zhang, Y.; Li, D.; Li, L.; Qie, L. A dark target method for Himawari-8/AHI aerosol retrieval: Application and validation. IEEE Trans. Geosci. Remote Sens. 2018, 57, 381–394. [Google Scholar] [CrossRef]
- Ge, B.; Mei, X.; Li, Z.; Hou, W.; Xie, Y.; Zhang, Y.; Xu, H.; Li, K.; Wei, Y. An improved algorithm for retrieving high resolution fine-mode aerosol based on polarized satellite data: Application and validation for POLDER-3. Remote Sens. Environ. 2020, 247, 111894. [Google Scholar] [CrossRef]
- Li, Z.; Xu, H.; Li, K.; Li, D.; Xie, Y.; Li, L.; Zhang, Y.; Gu, X.; Zhao, W.; Tian, Q. Comprehensive study of optical, physical, chemical, and radiative properties of total columnar atmospheric aerosols over China: An overview of Sun–Sky Radiometer Observation Network (SONET) measurements. Bull. Am. Meteorol. Soc. 2018, 99, 739–755. [Google Scholar] [CrossRef]
- Li, Z.; Li, D.; Li, K.; Xu, H.; Chen, X.; Chen, C.; Xie, Y.; Li, L.; Li, L.; Li, W. Sun-sky radiometer observation network with the extension of multi-wavelength polarization measurements. J. Remote Sens. 2015, 19, 495–519. [Google Scholar]
| Input Parameters | Range of Values | Step | Typical Uncertainty |
|---|---|---|---|
| SZA (°) | 0–70 | 10 | / |
| VZA (°) | 0–70 | 10 | |
| RAA (°) | 0–180 | 20 | |
| Wind speed (m/s) | 0–6 | 1 | 2 |
| AOD | 0–0.1 | 0.01 | ±0.01 |
| Chlorophyll a (mg/m3) | 0–0.1 | 0.01 | ±41% |
| Ozone (cm∙atm) | 0.2–0.3 | 0.05 | ±5% |
| Surface pressure (Pa) | 1013.0 | / | 100.0 |
| Parameters | Solar and Viewing Geometry | AOD | Ozone | Chlorophyll a | Wind Speed | Surface Pressure |
|---|---|---|---|---|---|---|
| Source | GaoFen-5 DPC L1 | Aqua MODIS MYD04 | OMI Aura OMTO3 | VIIRS S-NPP | NCEP | NCEP |
| Resolution | 3.3 km | 3 km | 0.25° | 1 km | 0.33 × 1° | 0.33 × 1° |
| Range | Glint angle > 40° | 0–0.1 | / | 0–0.1 (mg/m3) | 0–5 (m/s) | / |
| 443 nm | 490 nm | 565 nm | 670 nm | |
|---|---|---|---|---|
| March 2019 | 0.97928 | 0.99557 | 1.02854 | 1.09767 |
| April 2019 | 0.96276 | 0.9903 | 1.02864 | 1.07094 |
| May 2019 | 0.95836 | 0.98908 | 1.03009 | 1.06744 |
| June 2019 | 0.93963 | 0.98292 | 1.0352 | 1.07831 |
| July 2019 | 0.92182 | 0.97144 | 1.0415 | 1.10143 |
| August 2019 | 0.91068 | 0.96649 | 1.06219 | 1.1394 |
| September 2019 | 0.88247 | 0.94461 | 1.06055 | 1.06196 |
| October 2019 | 0.86582 | 0.92903 | 1.01267 | 1.04444 |
| November 2019 | 0.83213 | 0.90583 | 0.98540 | 1.03578 |
| December 2019 | 0.81023 | 0.89222 | 0.97609 | 1.02021 |
| January 2020 | 0.76575 | 0.84847 | 0.92015 | 0.94465 |
| February 2020 | 0.75005 | 0.83131 | 0.90909 | 0.92225 |
| March 2020 | 0.74709 | 0.83094 | 0.93363 | 0.92615 |
| April 2020 | 0.74842 | 0.8334 | 0.93042 | 0.92908 |
| Parameters | Data Source | Spatial Resolution | Threshold |
|---|---|---|---|
| δVZA | DPC L1/MYD021 km | DPC (3.3 km)/MODIS (1 km) | 5° |
| δSZA | 5° | ||
| δRAA | 10° | ||
| AOD | MYDL2 | 10 km | <0.4 |
| BRDF | VIIRS | 1 km | / |
Publisher’s Note: MDPI stays neutral with regard to jurisdictional claims in published maps and institutional affiliations. |
© 2022 by the authors. Licensee MDPI, Basel, Switzerland. This article is an open access article distributed under the terms and conditions of the Creative Commons Attribution (CC BY) license (https://creativecommons.org/licenses/by/4.0/).
Share and Cite
Zhu, S.; Li, Z.; Qie, L.; Xu, H.; Ge, B.; Xie, Y.; Qiao, R.; Xie, Y.; Hong, J.; Meng, B.; et al. In-Flight Relative Radiometric Calibration of a Wide Field of View Directional Polarimetric Camera Based on the Rayleigh Scattering over Ocean. Remote Sens. 2022, 14, 1211. https://doi.org/10.3390/rs14051211
Zhu S, Li Z, Qie L, Xu H, Ge B, Xie Y, Qiao R, Xie Y, Hong J, Meng B, et al. In-Flight Relative Radiometric Calibration of a Wide Field of View Directional Polarimetric Camera Based on the Rayleigh Scattering over Ocean. Remote Sensing. 2022; 14(5):1211. https://doi.org/10.3390/rs14051211
Chicago/Turabian StyleZhu, Sifeng, Zhengqiang Li, Lili Qie, Hua Xu, Bangyu Ge, Yisong Xie, Rui Qiao, Yanqing Xie, Jin Hong, Binghuan Meng, and et al. 2022. "In-Flight Relative Radiometric Calibration of a Wide Field of View Directional Polarimetric Camera Based on the Rayleigh Scattering over Ocean" Remote Sensing 14, no. 5: 1211. https://doi.org/10.3390/rs14051211
APA StyleZhu, S., Li, Z., Qie, L., Xu, H., Ge, B., Xie, Y., Qiao, R., Xie, Y., Hong, J., Meng, B., Tu, B., & Chen, F. (2022). In-Flight Relative Radiometric Calibration of a Wide Field of View Directional Polarimetric Camera Based on the Rayleigh Scattering over Ocean. Remote Sensing, 14(5), 1211. https://doi.org/10.3390/rs14051211