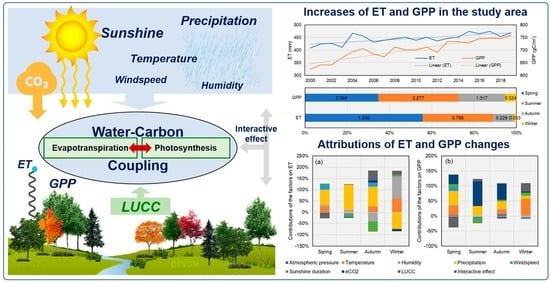
Attributions of Evapotranspiration and Gross Primary Production Changes in Semi-Arid Region: A Case Study in the Water Source Area of the Xiong’an New Area in North China
Abstract
:1. Introduction
2. Methods
2.1. Study Area
2.2. Dataset
2.3. The Improved Water-Carbon Coupling DTVGM Ecohydrological Model
2.4. Quantification of the Effects on ET and GPP
3. Results
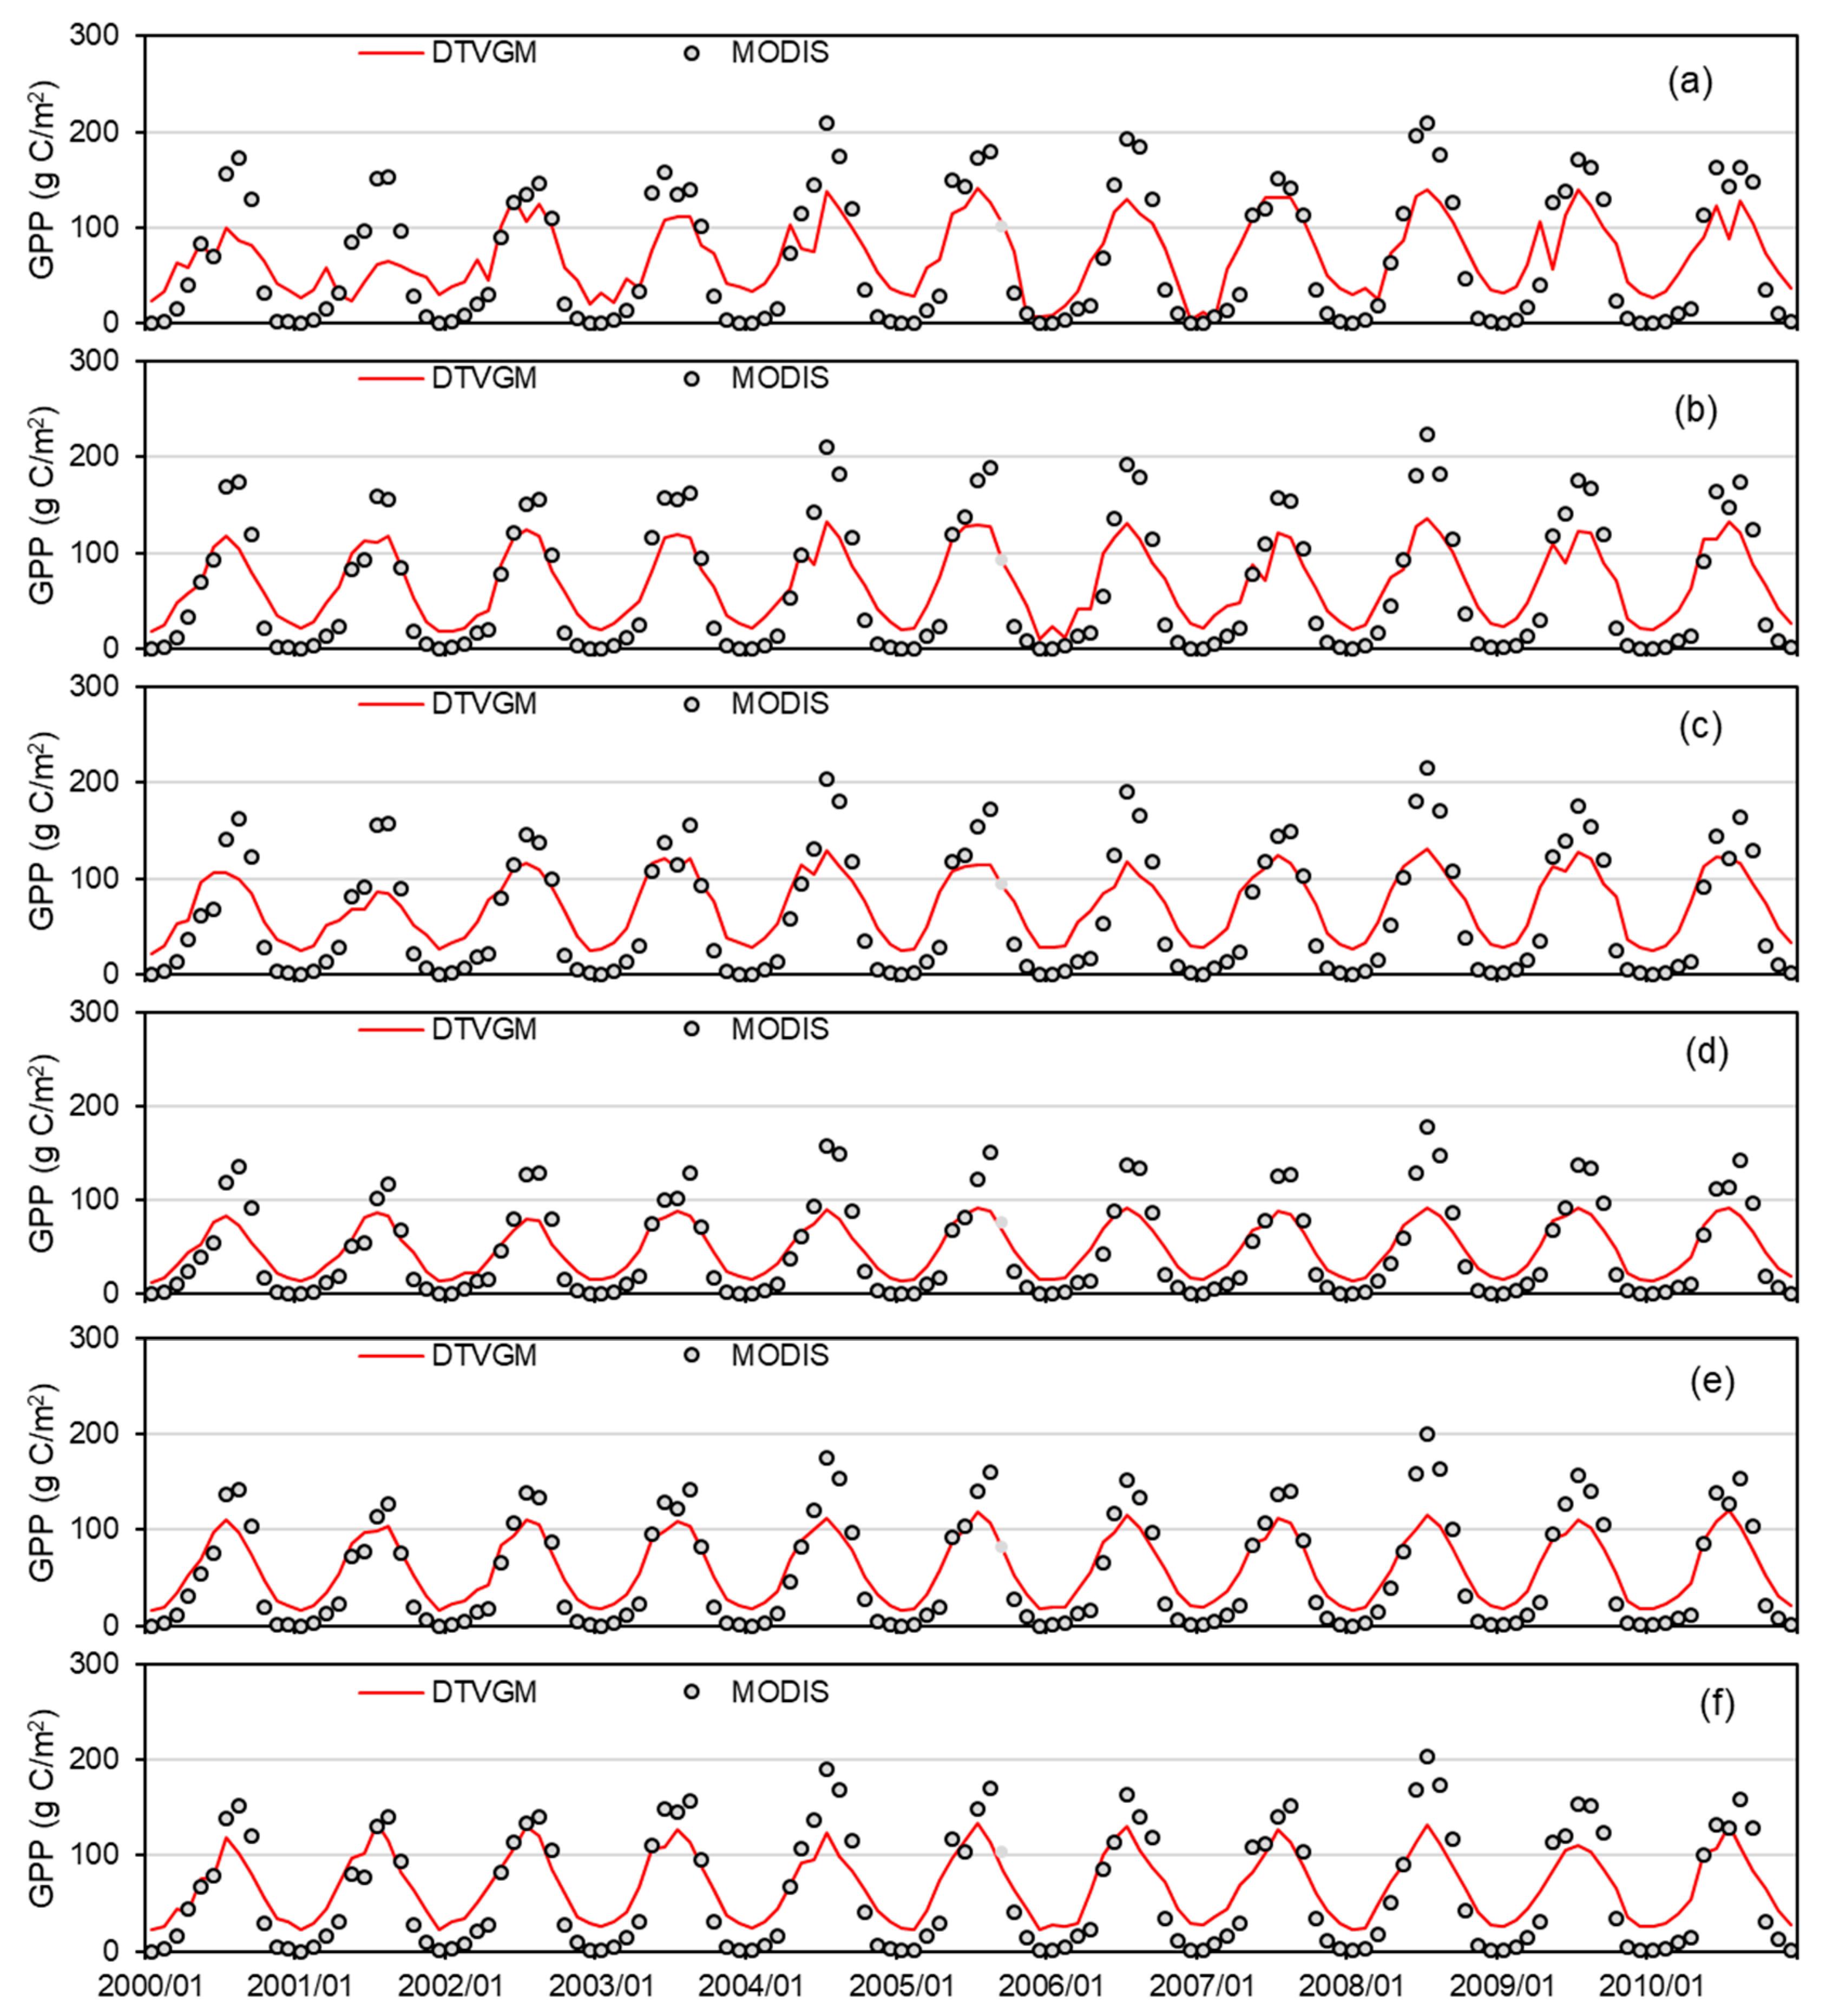
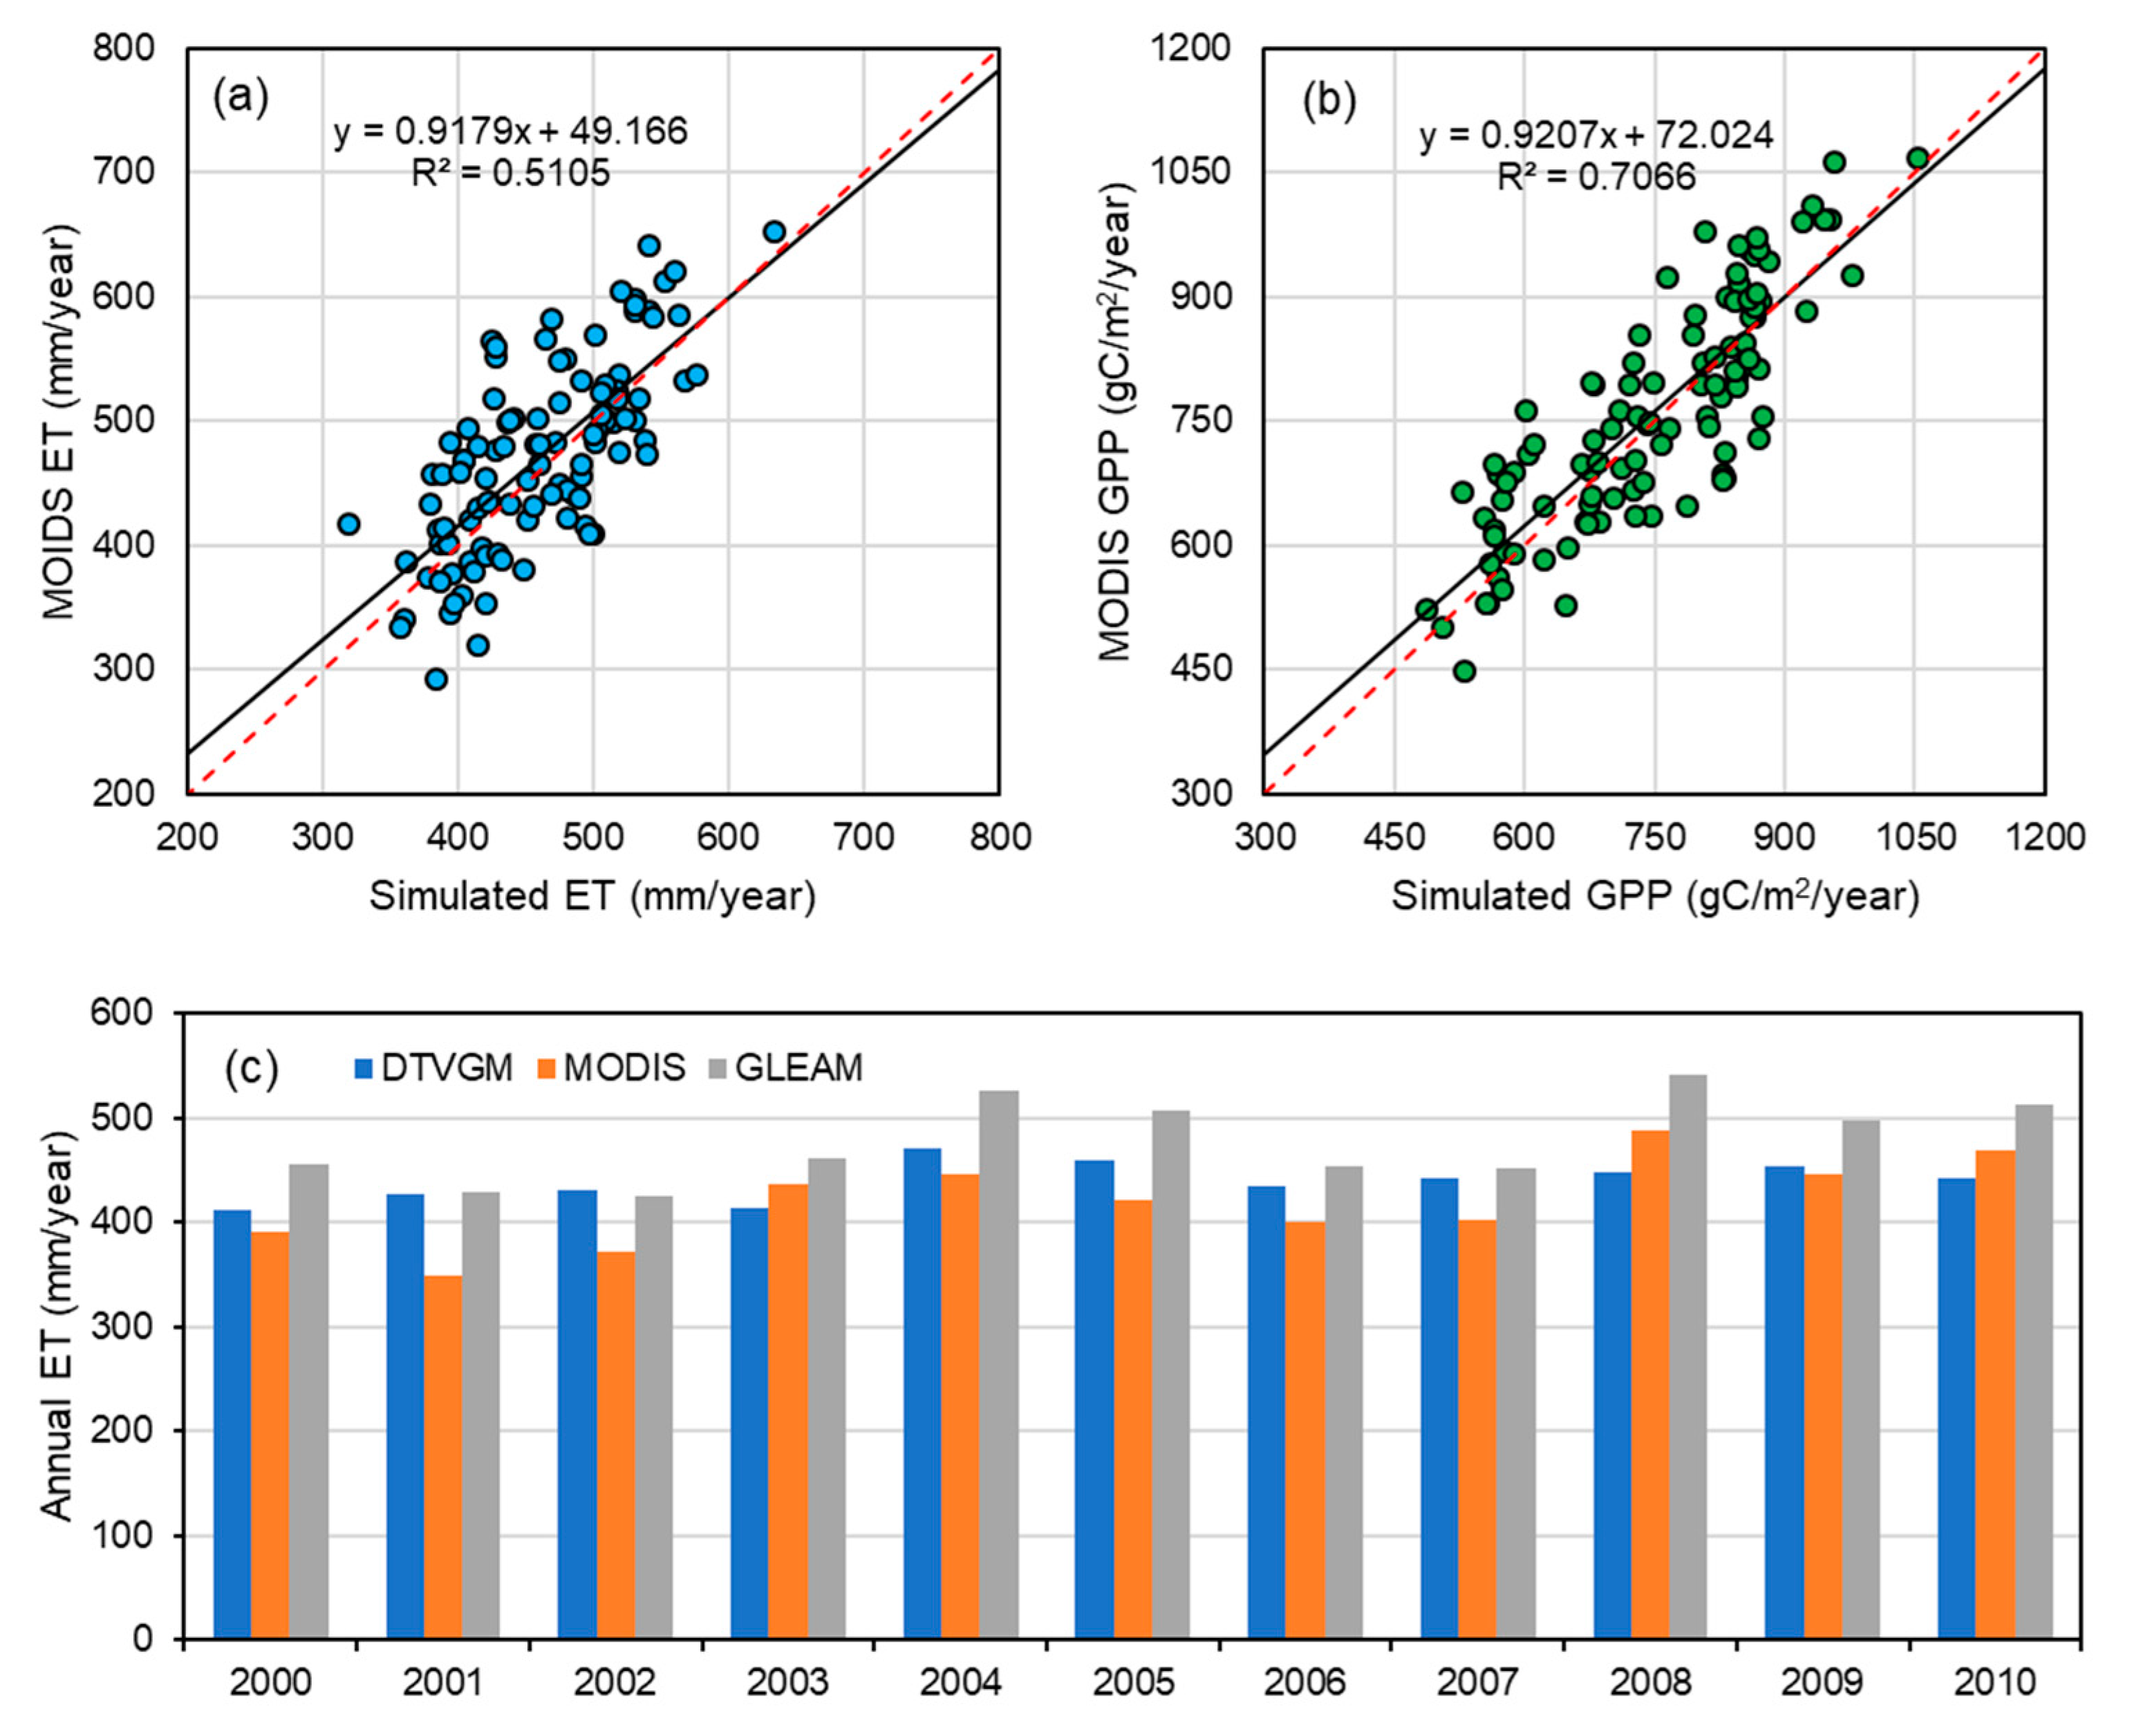
3.1. Model Performance
3.2. Changes in Climate Variables and Land Coverage
- (1)
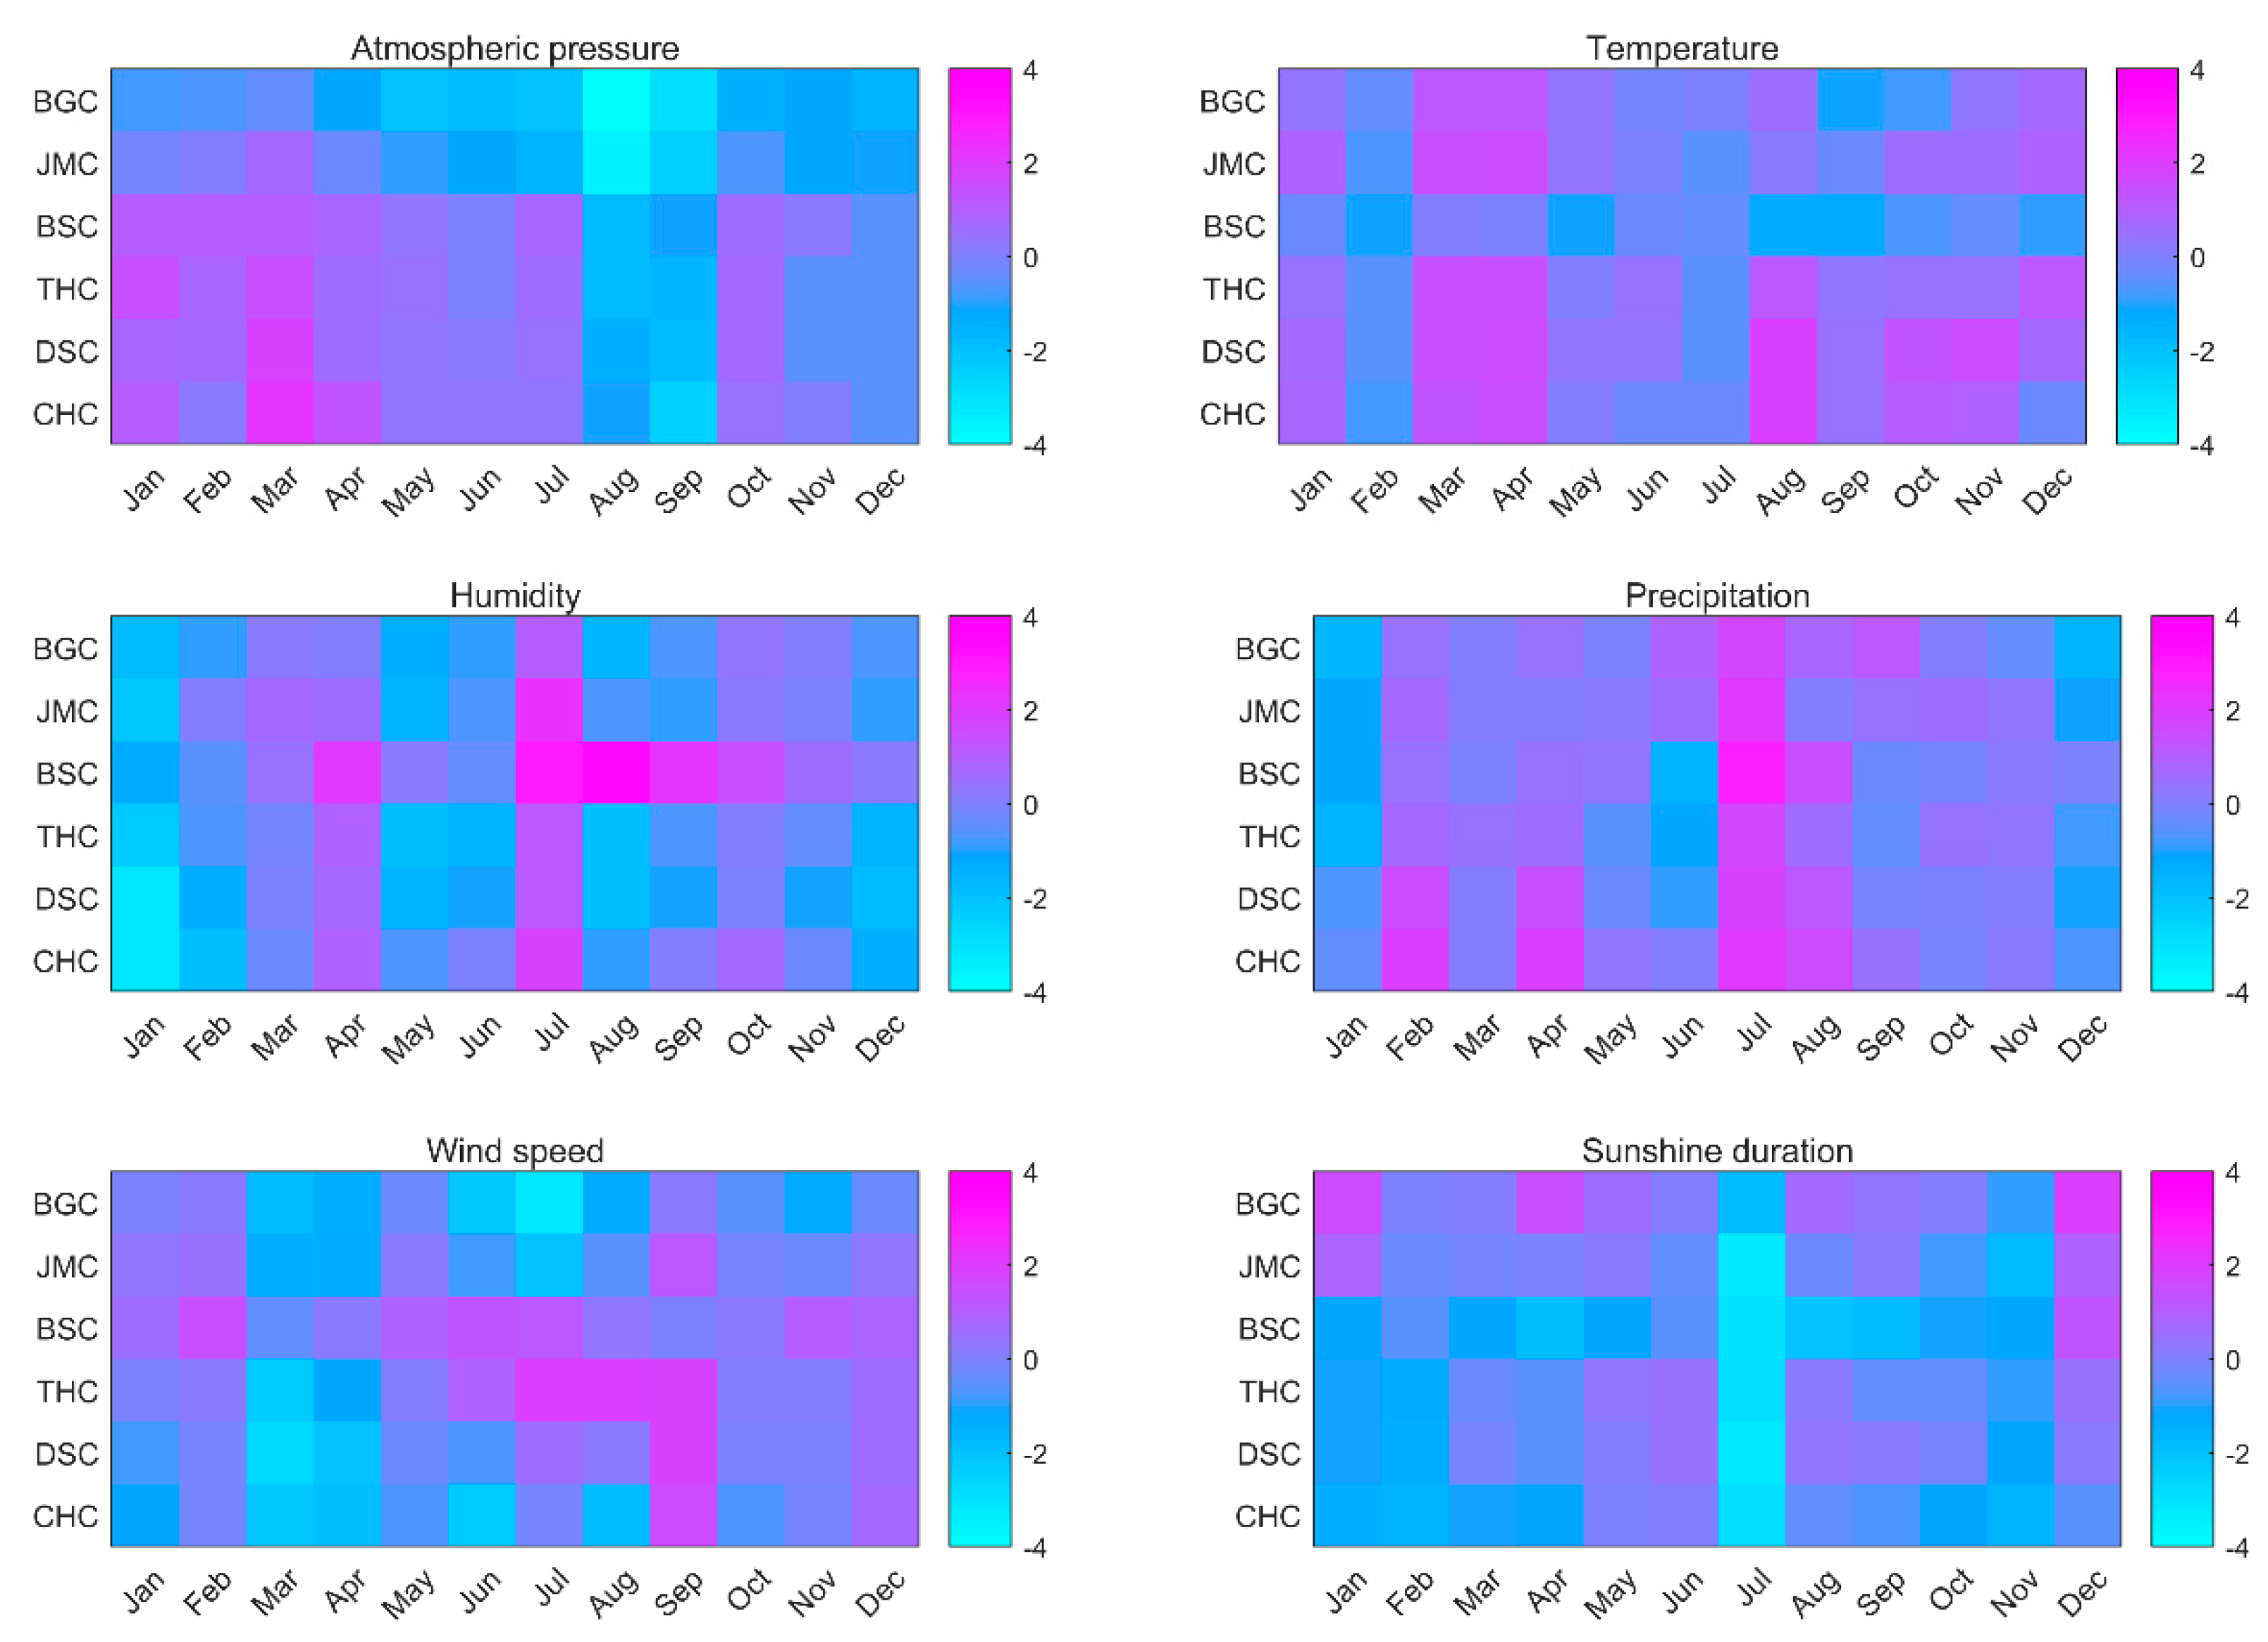
- Changes in the climate variables
- (2)
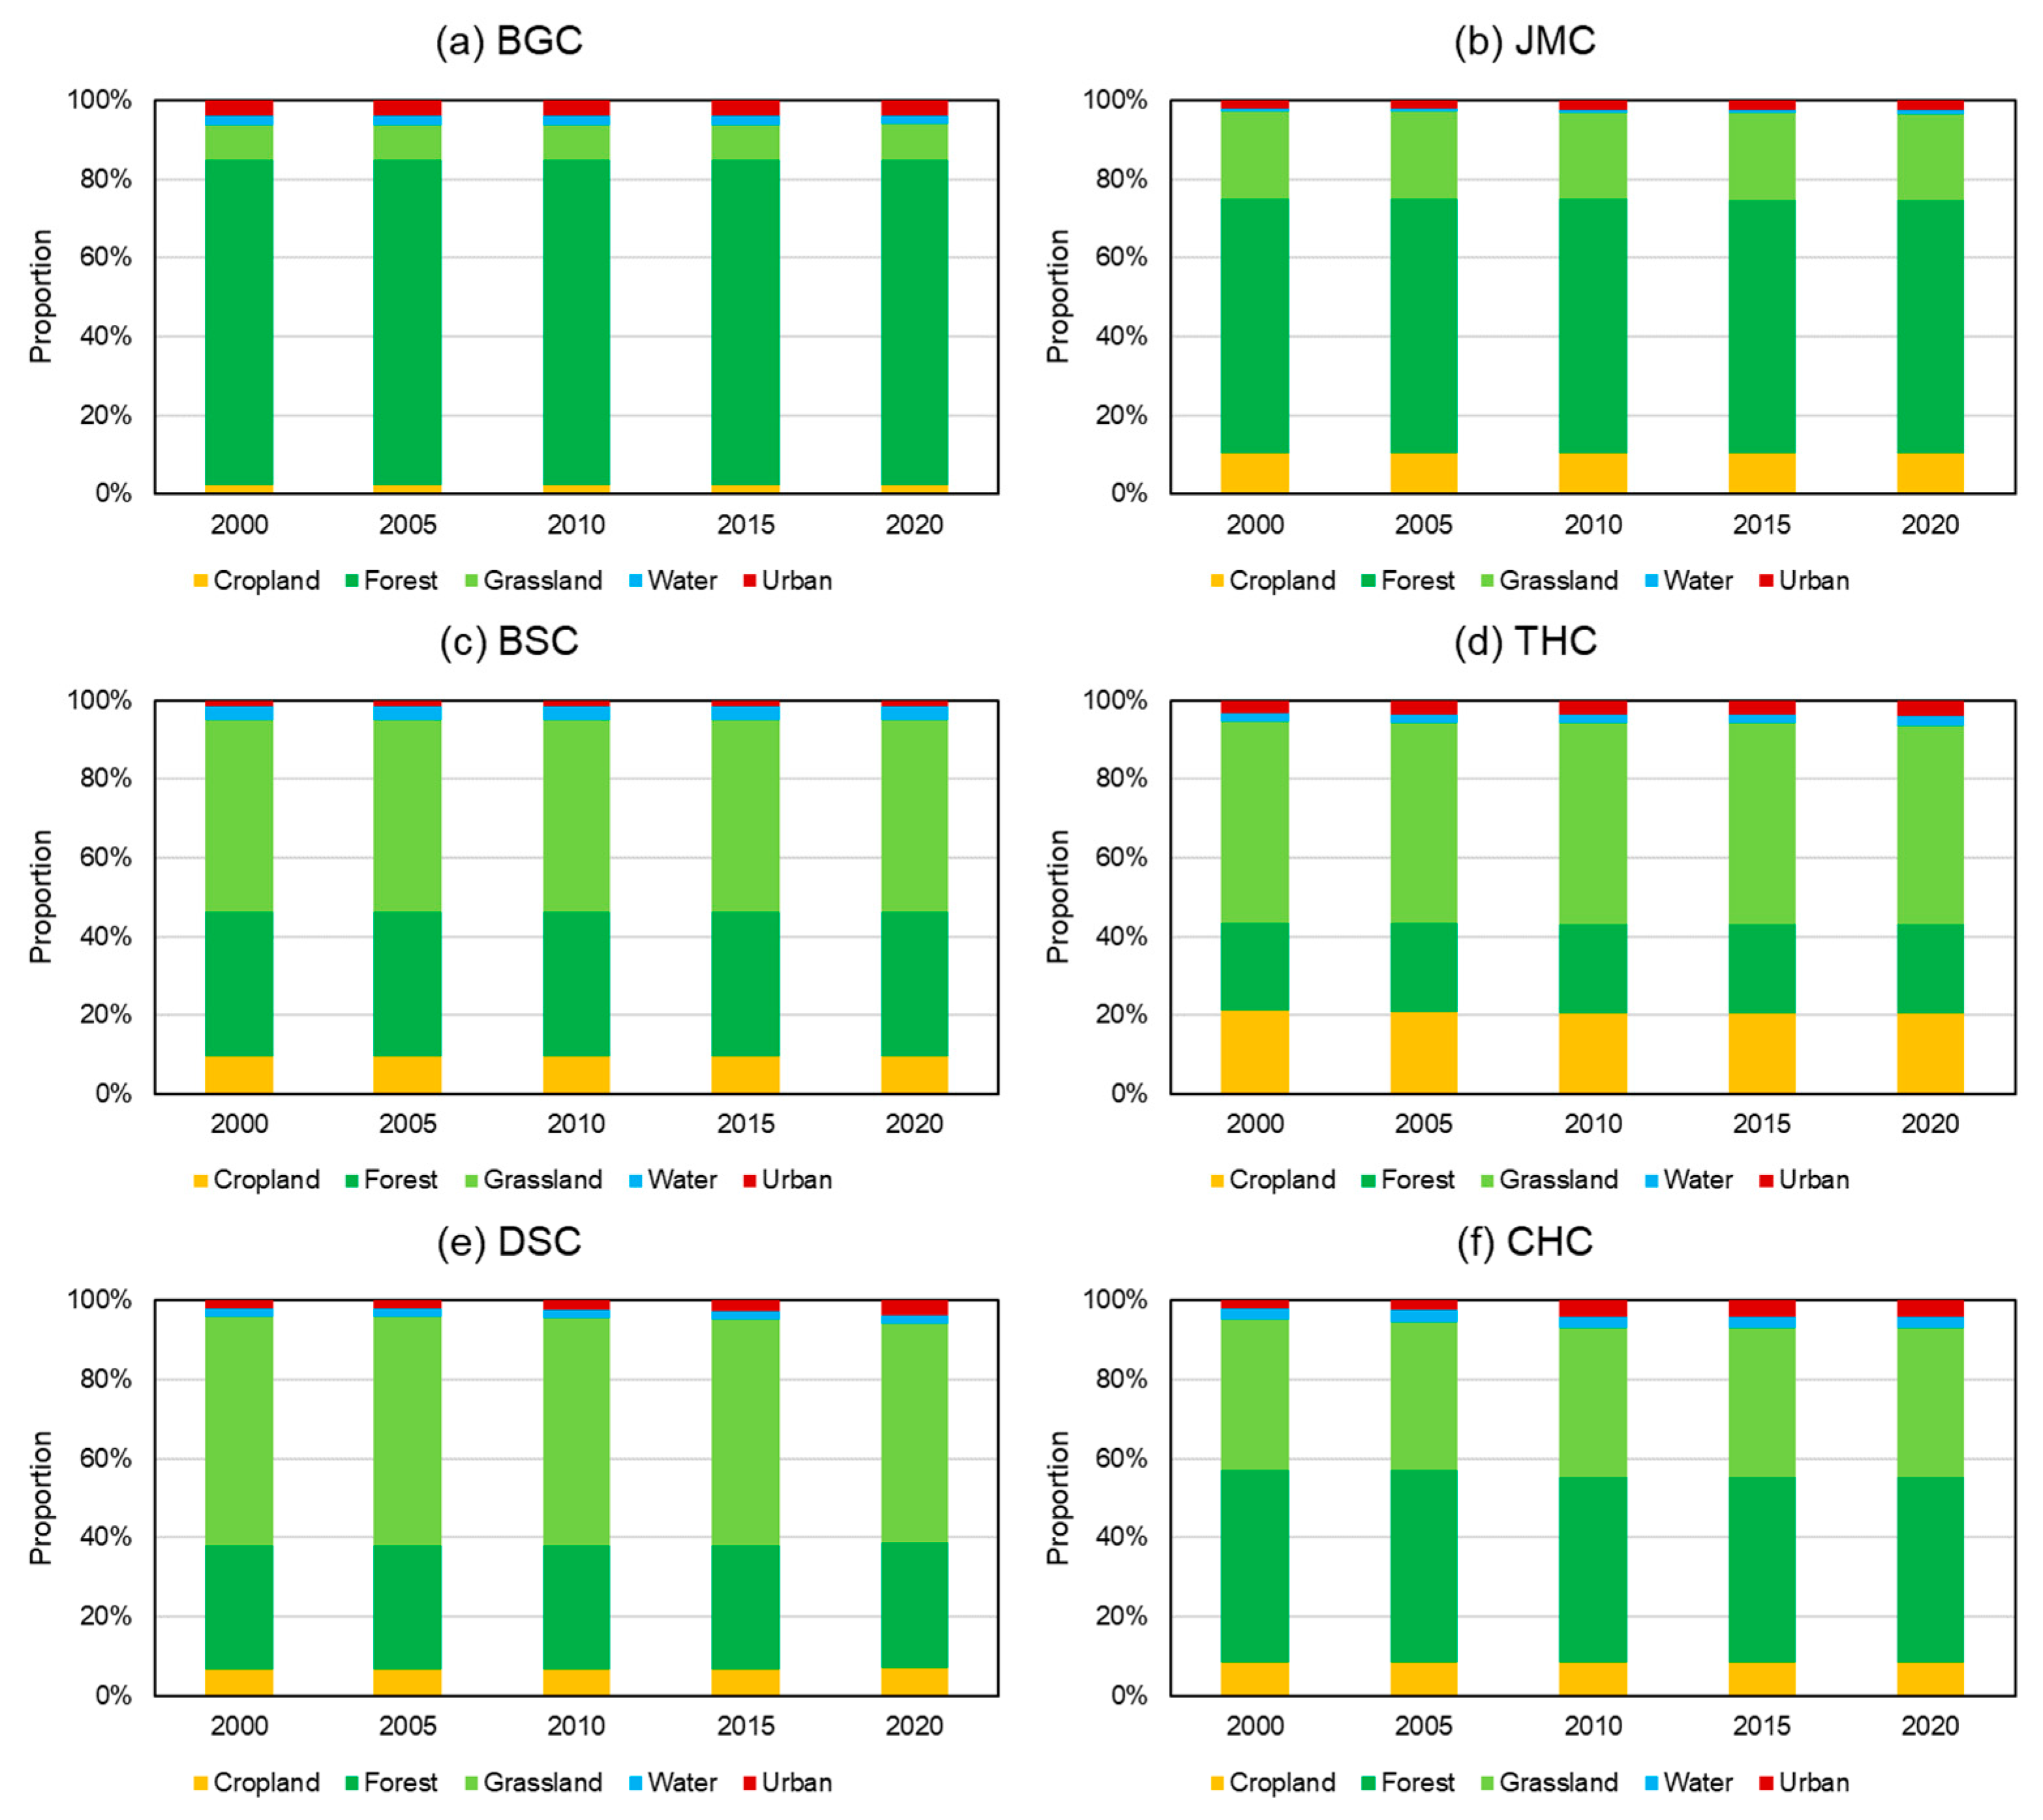
- Land-use and cover change
3.3. Changes in ET and GPP
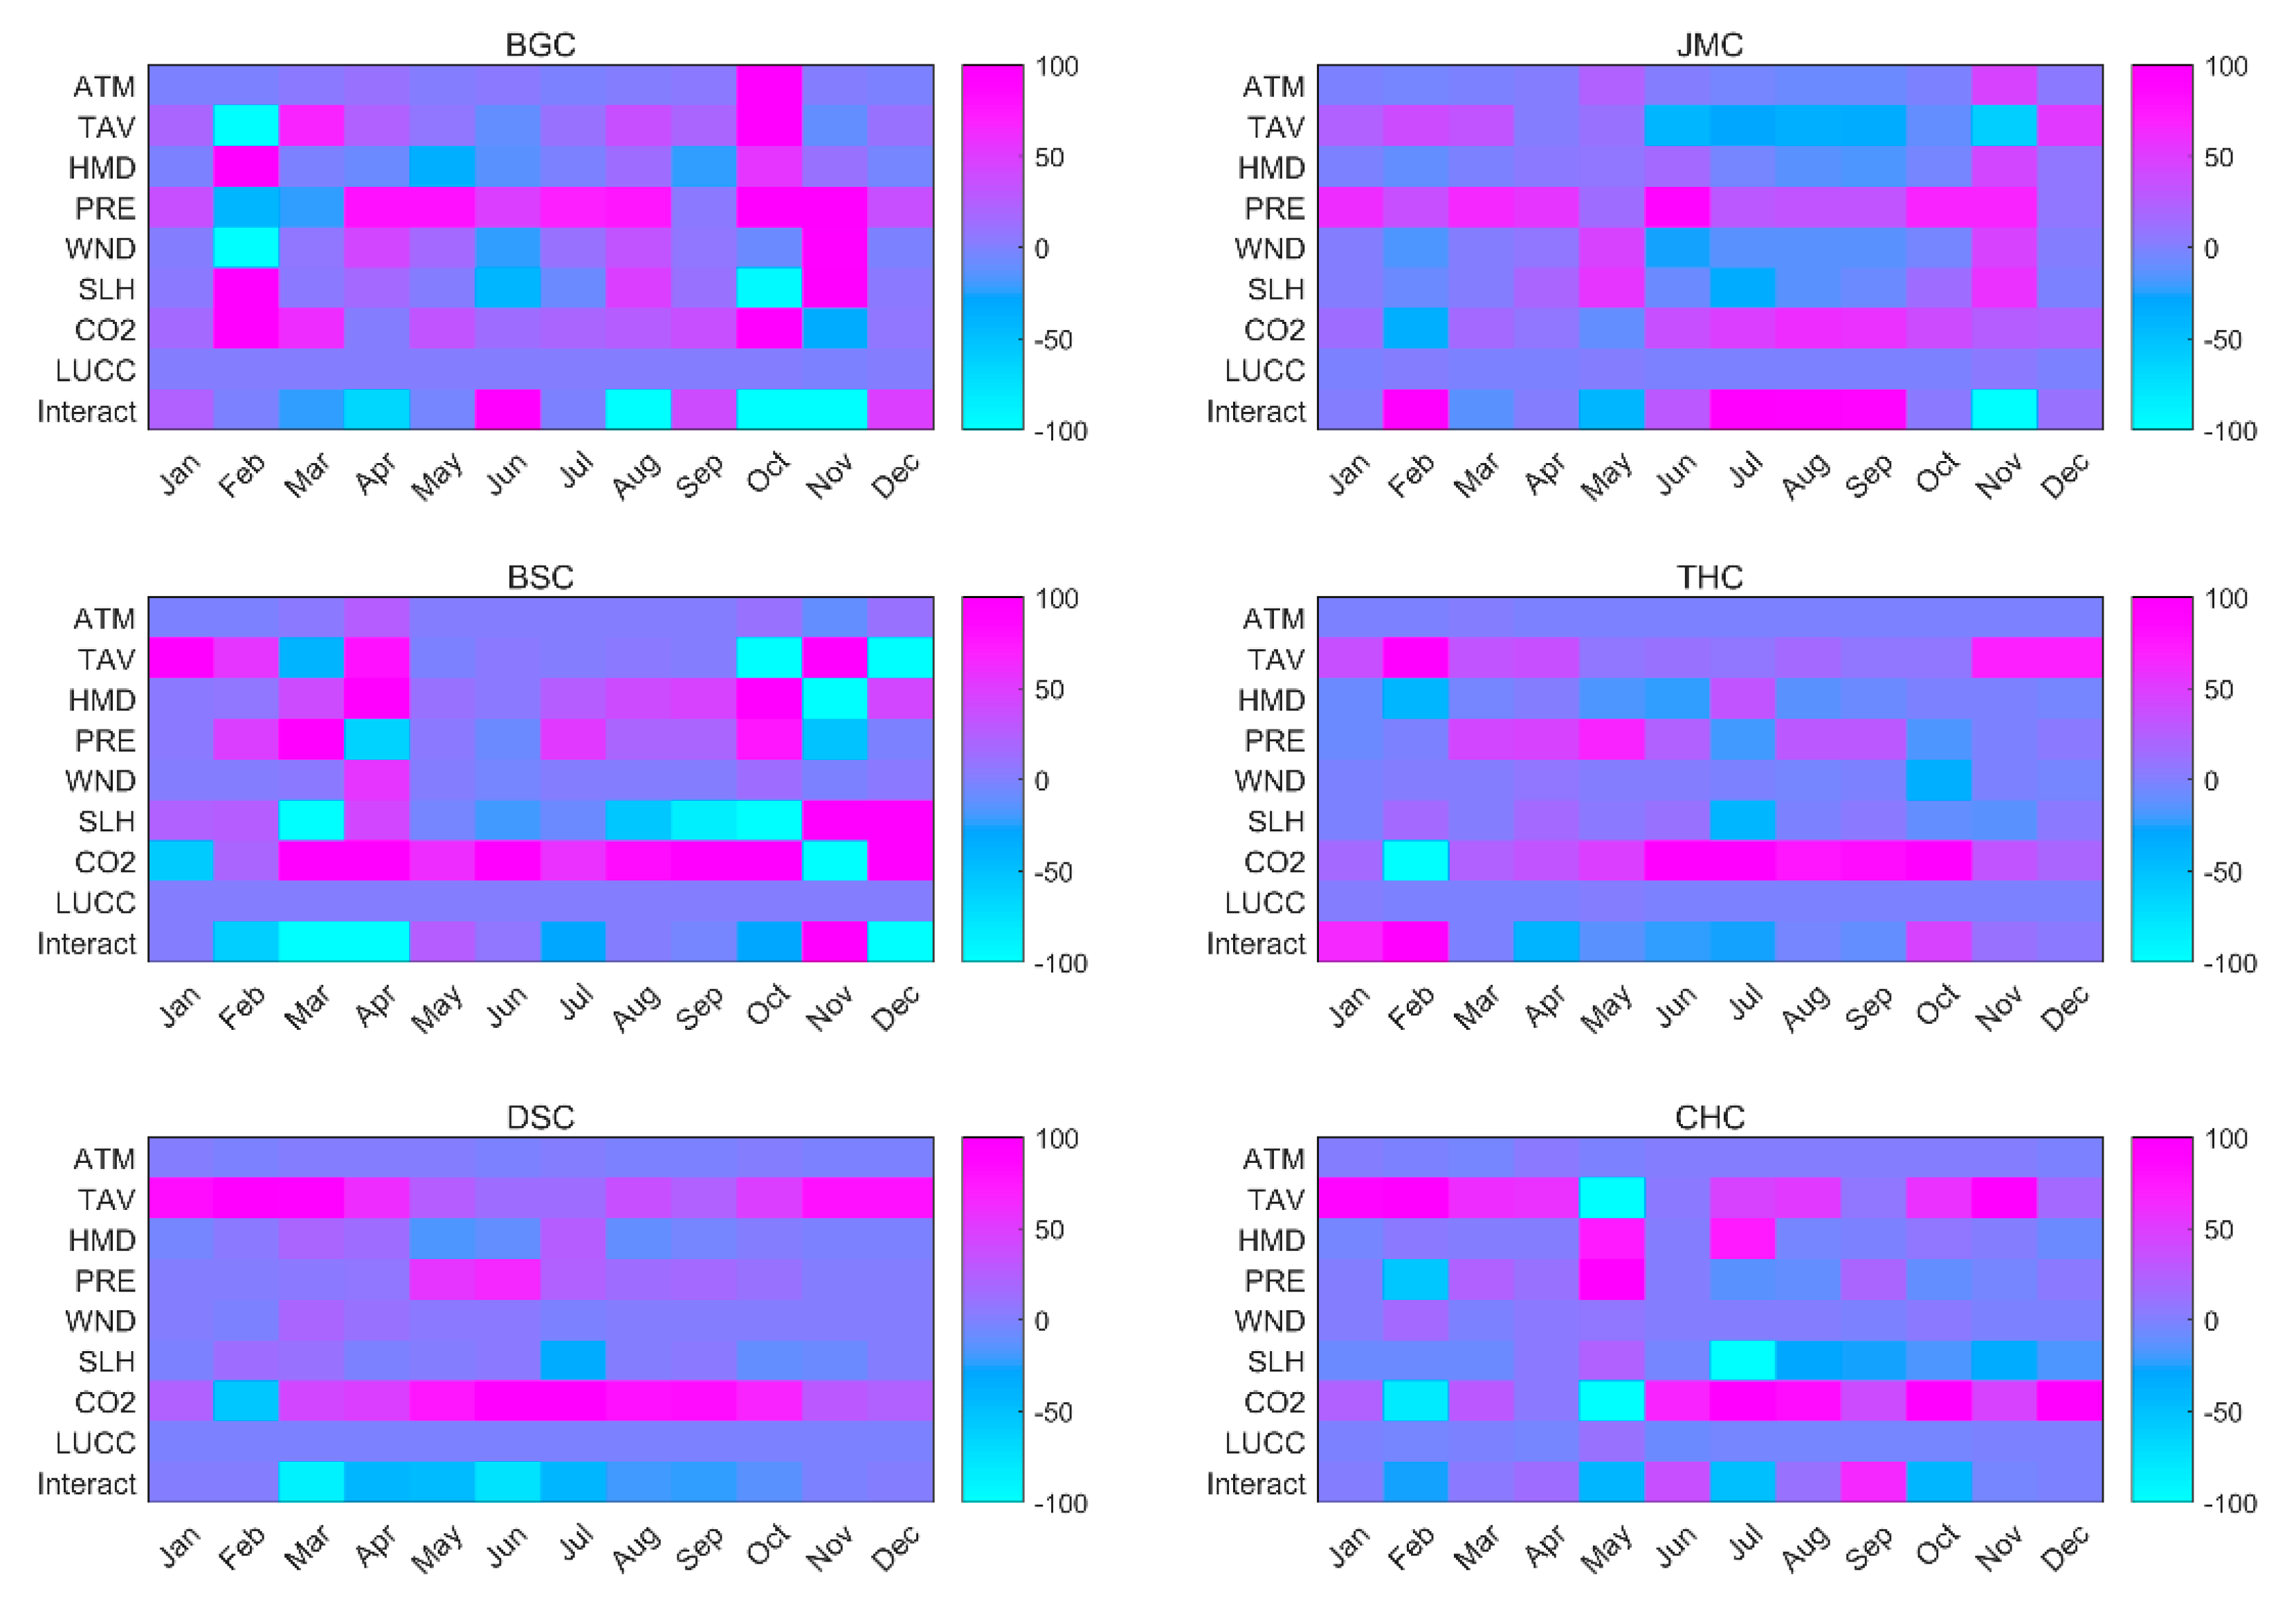
3.4. Attributing Changes in ET and GPP
- (1)
- Attributing changes in ET
- (2)
- Attributing changes in GPP
4. Discussion
5. Conclusions
Supplementary Materials
Author Contributions
Funding
Institutional Review Board Statement
Informed Consent Statement
Data Availability Statement
Acknowledgments
Conflicts of Interest
References
- Li, C.; Zhang, Y.; Shen, Y.; Kong, D.; Zhou, X. LUCC-Driven Changes in Gross Primary Production and Actual Evapotranspiration in Northern China. J. Geophys. Res. Atmos. 2020, 125, e2019JD031705. [Google Scholar] [CrossRef]
- Lu, N.; Chen, S.; Wilske, B.; Sun, G.; Chen, J. Evapotranspiration and soil water relationships in a range of disturbed and undisturbed ecosystems in the semi-arid Inner Mongolia, China. J. Plant Ecol. 2011, 4, 49–60. [Google Scholar] [CrossRef] [Green Version]
- Wang, Y.; Zhang, Y.; Yu, X.; Jia, G.; Liu, Z.; Sun, L.; Zheng, P.; Zhu, X. Grassland soil moisture fluctuation and its relationship with evapotranspiration. Ecol. Indic. 2021, 131, 108196. [Google Scholar] [CrossRef]
- Zhou, S.; Williams, A.P.; Lintner, B.R.; Berg, A.M.; Zhang, Y.; Keenan, T.F.; Cook, B.I.; Hagemann, S.; Seneviratne, S.I.; Gentine, P. Soil moisture–atmosphere feedbacks mitigate declining water availability in drylands. Nat. Clim. Chang. 2021, 11, 38–44. [Google Scholar] [CrossRef]
- Yuan, W.; Liu, S.; Yu, G.; Bonnefond, J.-M.; Chen, J.; Davis, K.; Desai, A.R.; Goldstein, A.H.; Gianelle, D.; Rossi, F.; et al. Global estimates of evapotranspiration and gross primary production based on MODIS and global meteorology data. Remote Sens. Environ. 2010, 114, 1416–1431. [Google Scholar] [CrossRef] [Green Version]
- Zhang, X.; Liu, K.; Li, X.; Wang, S.; Wang, J. Vulnerability assessment and its driving forces in terms of NDVI and GPP over the Loess Plateau, China. Phys. Chem. Earth Parts A/B/C 2022, 125, 103106. [Google Scholar] [CrossRef]
- Feng, X.; Fu, B.; Piao, S.; Wang, S.; Ciais, P.; Zeng, Z.; Lü, Y.; Zeng, Y.; Li, Y.; Jiang, X.; et al. Revegetation in China’s Loess Plateau is approaching sustainable water resource limits. Nat. Clim. Chang. 2016, 6, 1019–1022. [Google Scholar] [CrossRef]
- Wolf, S.; Keenan, T.F.; Fisher, J.B.; Baldocchi, D.D.; Desai, A.R.; Richardson, A.D.; Scott, R.L.; Law, B.E.; Litvak, M.E.; Brunsell, N.A.; et al. Warm spring reduced carbon cycle impact of the 2012 US summer drought. Proc. Natl. Acad. Sci. USA 2016, 113, 5880–5885. [Google Scholar] [CrossRef] [Green Version]
- Gentine, P.; Green, J.K.; Guérin, M.; Humphrey, V.; Seneviratne, S.I.; Zhang, Y.; Zhou, S. Coupling between the terrestrial carbon and water cycles—A review. Environ. Res. Lett. 2019, 14, 83003. [Google Scholar] [CrossRef]
- Pascolini-Campbell, M.; Reager, J.T.; Chandanpurkar, H.A.; Rodell, M. A 10 per cent increase in global land evapotranspiration from 2003 to 2019. Nature 2021, 593, 543–547. [Google Scholar] [CrossRef]
- Madani, N.; Parazoo, N.C.; Kimball, J.S.; Ballantyne, A.P.; Reichle, R.H.; Maneta, M.; Saatchi, S.; Palmer, P.I.; Liu, Z.; Tagesson, T. Recent Amplified Global Gross Primary Productivity Due to Temperature Increase Is Offset by Reduced Productivity Due to Water Constraints. AGU Adv. 2020, 1, e2020AV000180. [Google Scholar] [CrossRef]
- Zhan, S.; Song, C.; Wang, J.; Sheng, Y.; Quan, J. A Global Assessment of Terrestrial Evapotranspiration Increase Due to Surface Water Area Change. Earth’s Future 2019, 7, 266–282. [Google Scholar] [CrossRef] [PubMed] [Green Version]
- Zheng, Y.; Shen, R.; Wang, Y.; Li, X.; Liu, S.; Liang, S.; Chen, J.M.; Ju, W.; Zhang, L.; Yuan, W. Improved estimate of global gross primary production for reproducing its long-term variation, 1982–2017. Earth Syst. Sci. Data 2020, 12, 2725–2746. [Google Scholar] [CrossRef]
- Sakalli, A.; Cescatti, A.; Dosio, A.; Gücel, M.U. Impacts of 2 °C global warming on primary production and soil carbon storage capacity at pan-European level. Clim. Serv. 2017, 7, 64–77. [Google Scholar] [CrossRef]
- Swann, A.L.S.; Hoffman, F.M.; Koven, C.D.; Randerson, J.T. Plant responses to increasing CO 2 reduce estimates of climate impacts on drought severity. Proc. Natl. Acad. Sci. USA 2016, 113, 10019–10024. [Google Scholar] [CrossRef] [Green Version]
- Zhang, D.; Liu, X.; Zhang, L.; Zhang, Q.; Gan, R.; Li, X. Attribution of Evapotranspiration Changes in Humid Regions of China from 1982 to 2016. J. Geophys. Res. Atmos. 2020, 125, e2020JD032404. [Google Scholar] [CrossRef]
- Hu, S.; Mo, X. Attribution of Long-Term Evapotranspiration Trends in the Mekong River Basin with a Remote Sensing-Based Process Model. Remote Sens. 2021, 13, 303. [Google Scholar] [CrossRef]
- Li, S.; Wang, G.; Sun, S.; Fiifi Tawia Hagan, D.; Chen, T.; Dolman, H.; Liu, Y. Long-term changes in evapotranspiration over China and attribution to climatic drivers during 1980–2010. J. Hydrol. 2021, 595, 126037. [Google Scholar] [CrossRef]
- Liu, W.; Mo, X.; Liu, S.; Lin, Z.; Lv, C. Attributing the changes of grass growth, water consumed and water use efficiency over the Tibetan Plateau. J. Hydrol. 2021, 598, 126464. [Google Scholar] [CrossRef]
- Wang, L.; Li, M.; Wang, J.; Li, X.; Wang, L. An analytical reductionist framework to separate the effects of climate change and human activities on variation in water use efficiency. Sci. Total Environ. 2020, 727, 138306. [Google Scholar] [CrossRef]
- Dass, P.; Rawlins, M.A.; Kimball, J.S.; Kim, Y. Environmental controls on the increasing GPP of terrestrial vegetation across northern Eurasia. Biogeosciences 2016, 13, 45–62. [Google Scholar] [CrossRef] [Green Version]
- Xie, S.; Mo, X.; Hu, S.; Liu, S. Contributions of climate change, elevated atmospheric CO2 and human activities to ET and GPP trends in the Three-North Region of China. Agric. For. Meteorol. 2020, 295, 108183. [Google Scholar] [CrossRef]
- Li, Y.; Zhang, Y.; Lv, J. Interannual variations in GPP in forest ecosystems in Southwest China and regional differences in the climatic contributions. Ecol. Inform. 2022, 69, 101591. [Google Scholar] [CrossRef]
- He, G.; Zhao, Y.; Wang, J.; Gao, X.; He, F.; Li, H.; Zhai, J.; Wang, Q.; Zhu, Y. Attribution analysis based on Budyko hypothesis for land evapotranspiration change in the Loess Plateau, China. J. Arid Land 2019, 11, 939–953. [Google Scholar] [CrossRef] [Green Version]
- Cuddington, K.; Fortin, M.-J.; Gerber, L.R.; Hastings, A.; Liebhold, A.; O’Connor, M.; Ray, C. Process-based models are required to manage ecological systems in a changing world. Ecosphere 2013, 4, 1–12. [Google Scholar] [CrossRef]
- Zhang, Y.; Chiew, F.H.S.; Liu, C.; Tang, Q.; Xia, J.; Tian, J.; Kong, D.; Li, C. Can Remotely Sensed Actual Evapotranspiration Facilitate Hydrological Prediction in Ungauged Regions Without Runoff Calibration? Water Resour. Res. 2020, 56, e2019WR026236. [Google Scholar] [CrossRef]
- Mo, X.; Liu, S.; Chen, X.; Hu, S. Variability, tendencies, and climate controls of terrestrial evapotranspiration and gross primary productivity in the recent decade over China. Ecohydrology 2018, 11, e1951. [Google Scholar] [CrossRef]
- Liu, Y.; Mo, X.; Hu, S.; Chen, X.; Liu, S. Attribution analyses of evapotranspiration and gross primary productivity changes in Ziya-Daqing basins, China during 2001–2015. Theor. Appl. Climatol. 2020, 139, 1175–1189. [Google Scholar] [CrossRef]
- Kim, D.; Baik, J.; Umair, M.; Choi, M. Water use efficiency in terrestrial ecosystem over East Asia: Effects of climate regimes and land cover types. Sci. Total Environ. 2021, 773, 145519. [Google Scholar] [CrossRef]
- Ye, L.; Cheng, L.; Liu, P.; Liu, D.; Zhang, L.; Qin, S.; Xia, J. Management of vegetative land for more water yield under future climate conditions in the over-utilized water resources regions: A case study in the Xiong’an New area. J. Hydrol. 2021, 600, 126563. [Google Scholar] [CrossRef]
- Moiwo, J.P.; Yang, Y.; Li, H.; Han, S.; Yang, Y. Impact of water resource exploitation on the hydrology and water storage in Baiyangdian Lake. Hydrol. Process. 2010, 24, 3026–3039. [Google Scholar] [CrossRef]
- Hu, S.; Liu, C.; Zheng, H.; Wang, Z.; Yu, J. Assessing the impacts of climate variability and human activities on streamflow in the water source area of Baiyangdian Lake. J. Geogr. Sci. 2012, 22, 895–905. [Google Scholar] [CrossRef]
- Wang, H.; Lv, X.; Zhang, M. Sensitivity and attribution analysis of vegetation changes on evapotranspiration with the Budyko framework in the Baiyangdian catchment, China. Ecol. Indic. 2021, 120, 106963. [Google Scholar] [CrossRef]
- Xia, J.; Wang, G.; Tan, G.; Ye, A.; Huang, G.H. Development of distributed time-variant gain model for nonlinear hydrological systems. Sci. China Ser. D Earth Sci. 2005, 48, 713–723. [Google Scholar] [CrossRef]
- Wang, G.; Xia, J.; Chen, J. Quantification of effects of climate variations and human activities on runoff by a monthly water balance model: A case study of the Chaobai River basin in northern China. Water Resour. Res. 2009, 45, W00A11. [Google Scholar] [CrossRef] [Green Version]
- Zhan, C.; Song, X.; Xia, J.; Tong, C. An efficient integrated approach for global sensitivity analysis of hydrological model parameters. Environ. Model. Softw. 2013, 41, 39–52. [Google Scholar] [CrossRef]
- Zeng, S.; Xia, J.; Chen, X.; Zou, L.; Du, H.; She, D. Integrated land-surface hydrological and biogeochemical processes in simulating water, energy and carbon fluxes over two different ecosystems. J. Hydrol. 2020, 582, 124390. [Google Scholar] [CrossRef]
- Chen, J.; Liu, J.; Cihlar, J.; Goulden, M. Daily canopy photosynthesis model through temporal and spatial scaling for remote sensing applications. Ecol. Model. 1999, 124, 99–119. [Google Scholar] [CrossRef] [Green Version]
- Cheng, L.; Zhang, L.; Wang, Y.-P.; Yu, Q.; Eamus, D.; O’Grady, A. Impacts of elevated CO2, climate change and their interactions on water budgets in four different catchments in Australia. J. Hydrol. 2014, 519, 1350–1361. [Google Scholar] [CrossRef]
- Mann, H.B. Nonparametric Tests against Trend. Econometrica 1945, 13, 245. [Google Scholar] [CrossRef]
- Kendall, M.G. Rank Correlation Methods; Griffin: London, UK, 1975. [Google Scholar]
- Martens, B.; Miralles, D.G.; Lievens, H.; van der Schalie, R.; de Jeu, R.A.M.; Fernández-Prieto, D.; Beck, H.E.; Dorigo, W.A.; Verhoest, N.E.C. GLEAM v3: Satellite-based land evaporation and root-zone soil moisture. Geosci. Model Dev. 2017, 10, 1903–1925. [Google Scholar] [CrossRef] [Green Version]
- Turner, D.P.; Ritts, W.D.; Cohen, W.B.; Gower, S.T.; Running, S.W.; Zhao, M.; Costa, M.H.; Kirschbaum, A.A.; Ham, J.M.; Saleska, S.R.; et al. Evaluation of MODIS NPP and GPP products across multiple biomes. Remote Sens. Environ. 2006, 102, 282–292. [Google Scholar] [CrossRef]
- Propastin, P.; Ibrom, A.; Knohl, A.; Erasmi, S. Effects of canopy photosynthesis saturation on the estimation of gross primary productivity from MODIS data in a tropical forest. Remote Sens. Environ. 2012, 121, 252–260. [Google Scholar] [CrossRef]
- Shim, C.; Hong, J.; Hong, J.; Kim, Y.; Kang, M.; Malla Thakuri, B.; Kim, Y.; Chun, J. Evaluation of MODIS GPP over a complex ecosystem in East Asia: A case study at Gwangneung flux tower in Korea. Adv. Space Res. 2014, 54, 2296–2308. [Google Scholar] [CrossRef] [Green Version]
- Ma, J.; Xiao, X.; Miao, R.; Li, Y.; Chen, B.; Zhang, Y.; Zhao, B. Trends and controls of terrestrial gross primary productivity of China during 2000–2016. Environ. Res. Lett. 2019, 14, 84032. [Google Scholar] [CrossRef] [Green Version]
- Yang, D.; Sun, F.; Liu, Z.; Cong, Z.; Lei, Z. Interpreting the complementary relationship in non-humid environments based on the Budyko and Penman hypotheses. Geophys. Res. Lett. 2006, 33, L18402. [Google Scholar] [CrossRef]
- Moiwo, J.P.; Tao, F. Contributions of precipitation, irrigation and soil water to evapotranspiration in (semi)-arid regions. Int. J. Climatol. 2015, 35, 1079–1089. [Google Scholar] [CrossRef]
- Helbig, M.; Waddington, J.M.; Alekseychik, P.; Amiro, B.D.; Aurela, M.; Barr, A.G.; Black, T.A.; Blanken, P.D.; Carey, S.K.; Chen, J.; et al. Increasing contribution of peatlands to boreal evapotranspiration in a warming climate. Nat. Clim. Chang. 2020, 10, 555–560. [Google Scholar] [CrossRef]
- Jarvis, A.J.; Mansfield, T.A.; Davies, W.J. Stomatal behaviour, photosynthesis and transpiration under rising CO2. Plant Cell Environ. 1999, 22, 639–648. [Google Scholar] [CrossRef]
- Sun, Z.; Wang, X.; Yamamoto, H.; Tani, H.; Zhong, G.; Yin, S.; Guo, E. Spatial pattern of GPP variations in terrestrial ecosystems and its drivers: Climatic factors, CO2 concentration and land-cover change, 1982–2015. Ecol. Inform. 2018, 46, 156–165. [Google Scholar] [CrossRef]
- Chen, Z.; Yu, G.; Ge, J.; Sun, X.; Hirano, T.; Saigusa, N.; Wang, Q.; Zhu, X.; Zhang, Y.; Zhang, J.; et al. Temperature and precipitation control of the spatial variation of terrestrial ecosystem carbon exchange in the Asian region. Agric. For. Meteorol. 2013, 182–183, 266–276. [Google Scholar] [CrossRef]
- Yuan, W.; Zheng, Y.; Piao, S.; Ciais, P.; Lombardozzi, D.; Wang, Y.; Ryu, Y.; Chen, G.; Dong, W.; Hu, Z.; et al. Increased atmospheric vapor pressure deficit reduces global vegetation growth. Sci. Adv. 2019, 5, eaax1396. [Google Scholar] [CrossRef] [PubMed] [Green Version]
- Yan, H.; Wang, S.Q.; Wang, J.B.; Shugart, H.H. Changes of Light Components and Impacts on Interannual Variations of Photosynthesis in China Over 2000–2017 by Using a Two-Leaf Light Use Efficiency Model. J. Geophys. Res. Biogeosci. 2020, 125, e2020JG005735. [Google Scholar] [CrossRef]
- Hu, L.; Fan, W.; Ren, H.; Liu, S.; Cui, Y.; Zhao, P. Spatiotemporal Dynamics in Vegetation GPP over the Great Khingan Mountains Using GLASS Products from 1982 to 2015. Remote Sens. 2018, 10, 488. [Google Scholar] [CrossRef] [Green Version]
- Eamus, D.; Hatton, T.; Cook, P.; Colvin, C. Ecohydrology; CSIRO Publishing: Clayton, Australia, 2006; ISBN 9780643094093. [Google Scholar]
- Zscheischler, J.; Fischer, E.M. The record-breaking compound hot and dry 2018 growing season in Germany. Weather Clim. Extrem. 2020, 29, 100270. [Google Scholar] [CrossRef]
- Li, J.; Wang, Z.; Wu, X.; Zscheischler, J.; Guo, S.; Chen, X. A standardized index for assessing sub-monthly compound dry and hot conditions with application in China. Hydrol. Earth Syst. Sci. 2021, 25, 1587–1601. [Google Scholar] [CrossRef]
- Li, W.; Pan, R.; Jiang, Z.; Chen, Y.; Li, L.; Luo, J.-J.; Zhai, P.; Shen, Y.; Yu, J. Future changes in the frequency of extreme droughts over China based on two large ensemble simulations. J. Clim. 2021, 1, 6023–6025. [Google Scholar] [CrossRef]
- Klein, T.; Yakir, D.; Buchmann, N.; Grünzweig, J.M. Towards an advanced assessment of the hydrological vulnerability of forests to climate change-induced drought. New Phytol. 2014, 201, 712–716. [Google Scholar] [CrossRef]
- Chen, S.; Huang, Y.; Wang, G. Detecting drought-induced GPP spatiotemporal variabilities with sun-induced chlorophyll fluorescence during the 2009/2010 droughts in China. Ecol. Indic. 2021, 121, 107092. [Google Scholar] [CrossRef]

| Catchment | Dominant Land Cover | Area (km2) | ||
|---|---|---|---|---|
| Forest | Grassland | Cropland | ||
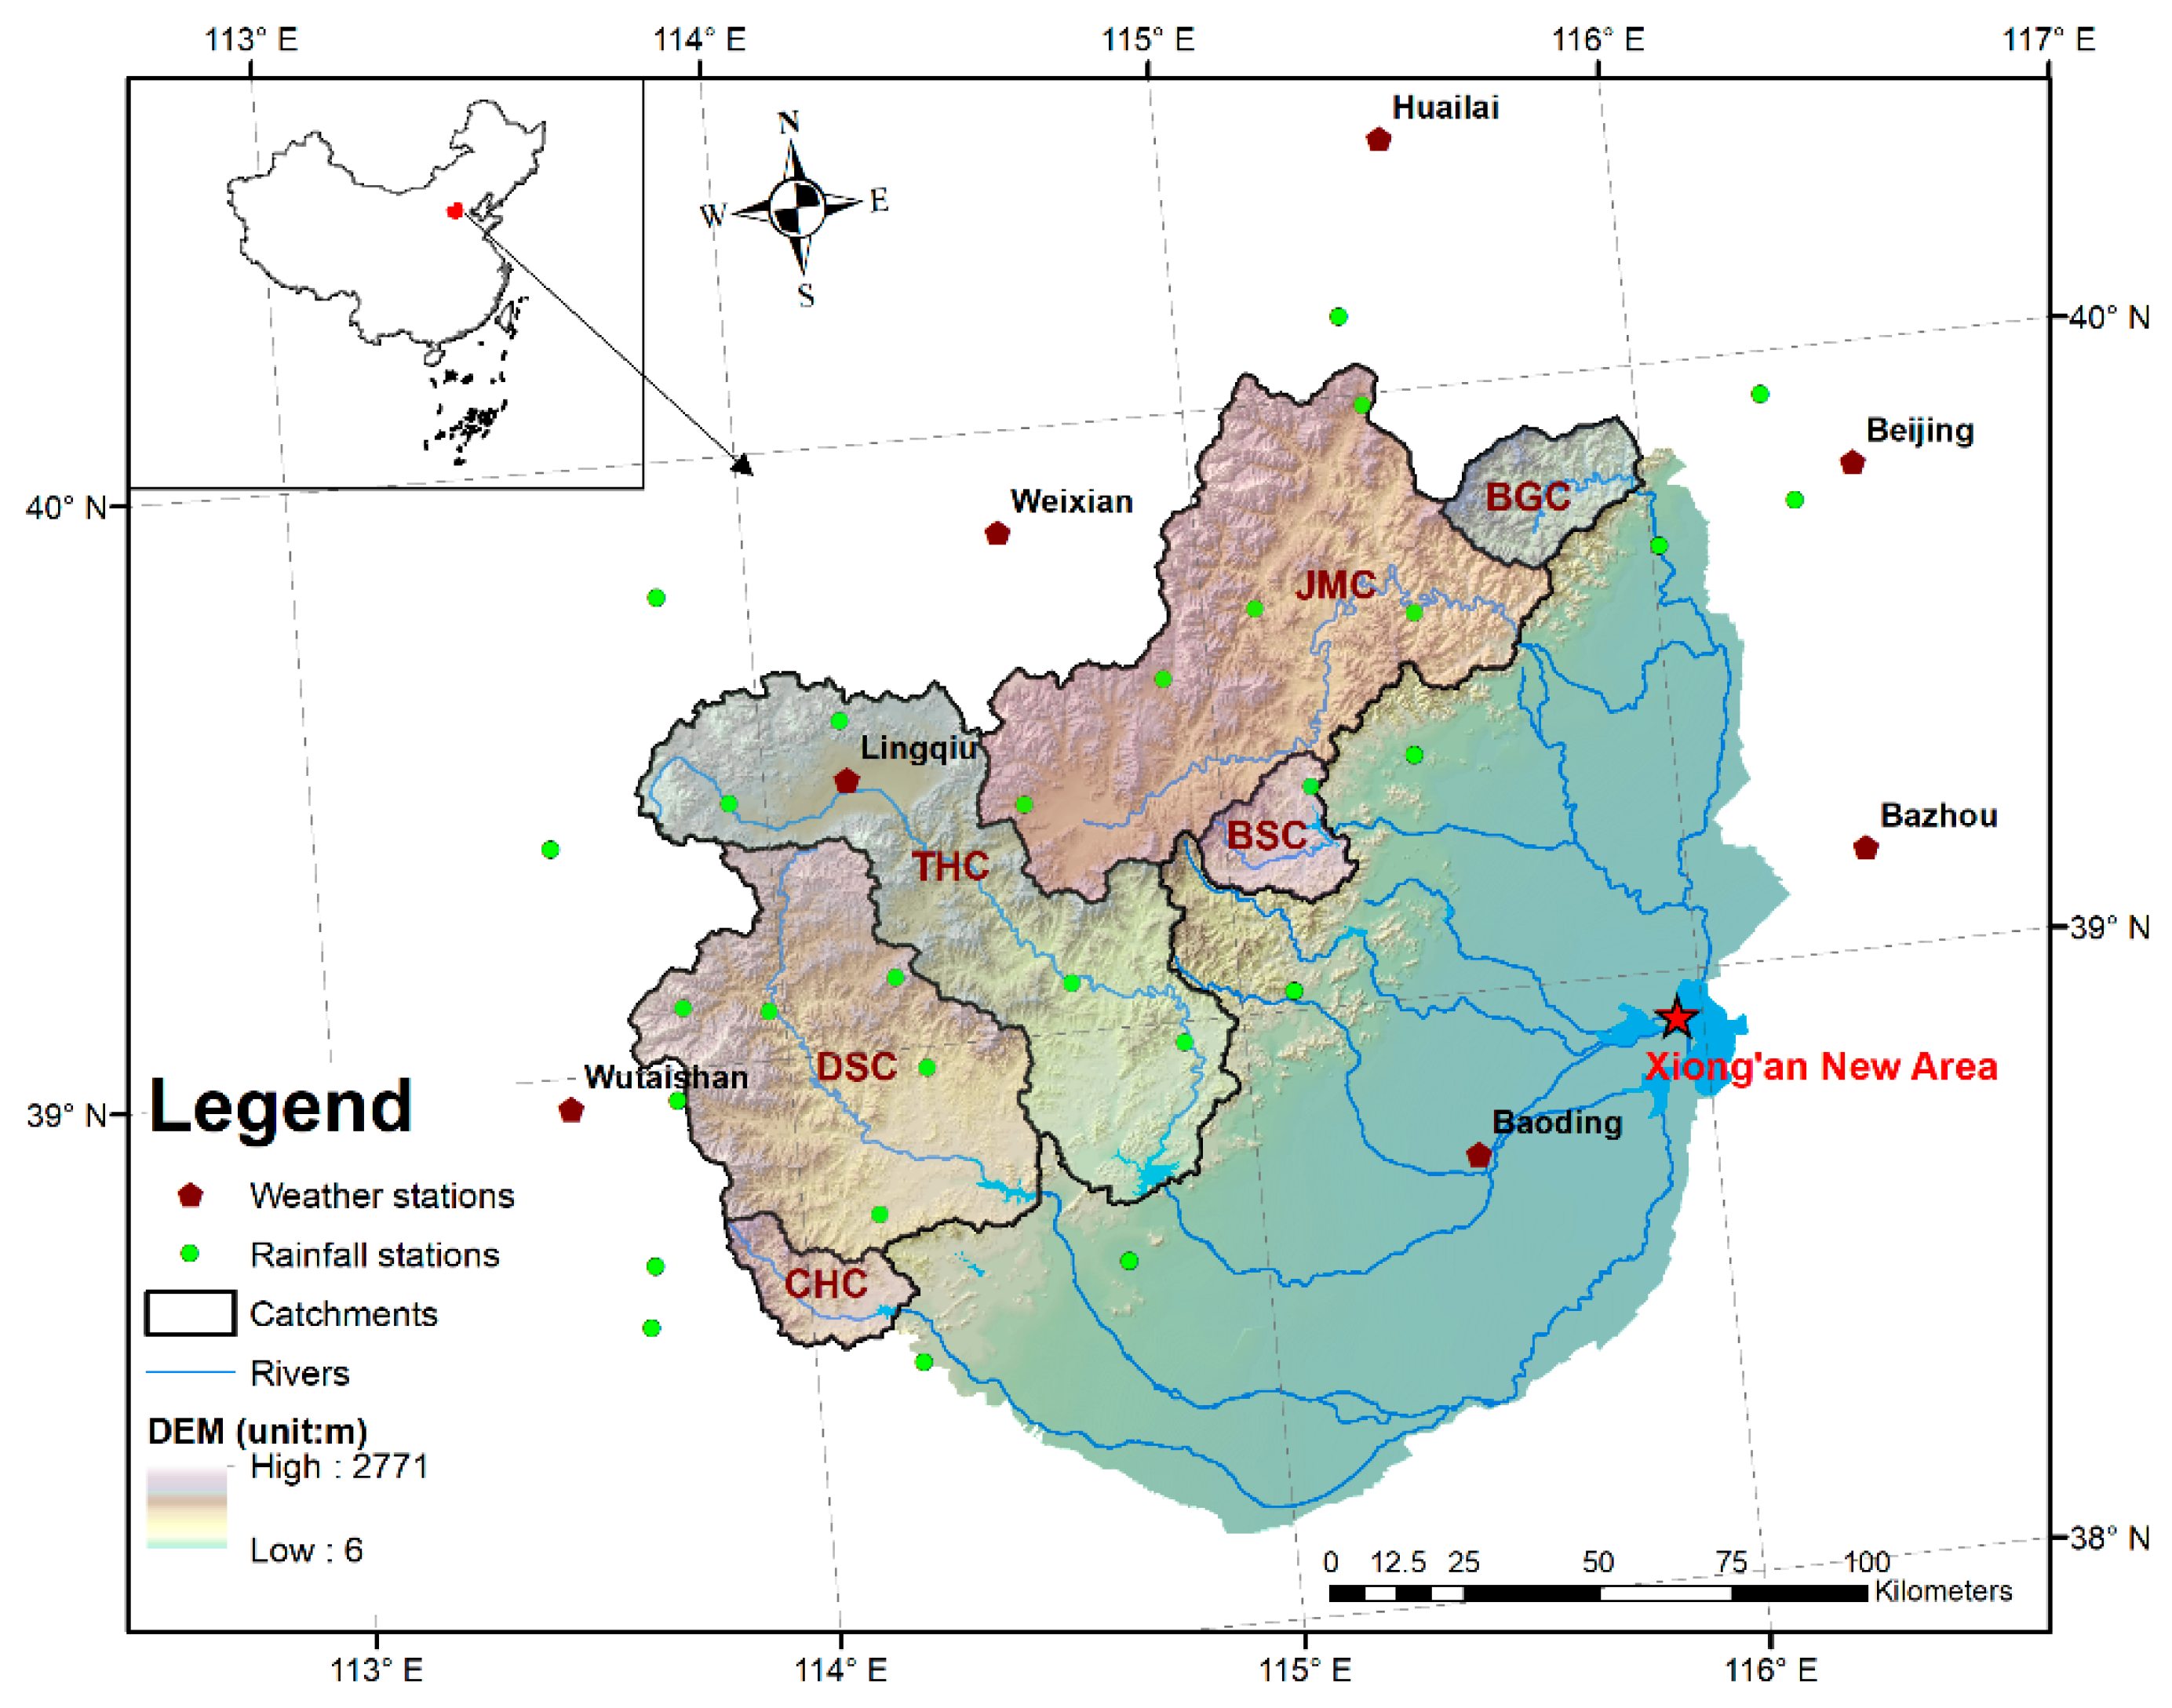
| Baigouhe | 83% | 9% | 2% | 641.17 |
| Jumahe | 64% | 22% | 10% | 4801.27 |
| Baishahe | 36% | 49% | 10% | 493.67 |
| Tanghe | 22% | 50% | 21% | 4257.41 |
| Dashahe | 32% | 55% | 7% | 3688.61 |
| Cihe | 47% | 38% | 8% | 483.51 |
| Scenarios | Scenario Name | Descriptions |
|---|---|---|
| S0 | Baseline | All the driving factors including historical meteorological variables, CO2 and land coverage are used to drive the model. |
| S1 | Atmospheric pressure-detrend | The atmospheric pressure is detrended using historical records. |
| S2 | Temperature-detrend | The temperature is detrended using historical records. |
| S3 | Humidity-detrend | The relative humidity is detrended using historical records. |
| S4 | Precipitation-detrend | The precipitation is detrended using historical records. |
| S5 | Windspeed-detrend | The windspeed is detrended using historical records. |
| S6 | Solar radiation-detrend | The sunshine duration is detrended using historical records. |
| S7 | Carbon dioxide-detrend | The carbon dioxide is detrended using historical records. |
| S8 | Land use and cover changes | The land use is set at 2000 using historical records. |
| S9 | All-detrend and no land use change | All the meteorological variables and CO2 are detrended and the land use is set at 2000. |
| Catchment | ET | GPP | ||||
|---|---|---|---|---|---|---|
| RE | r | RMSE (mm) | RE | r | RMSE (g C/m2) | |
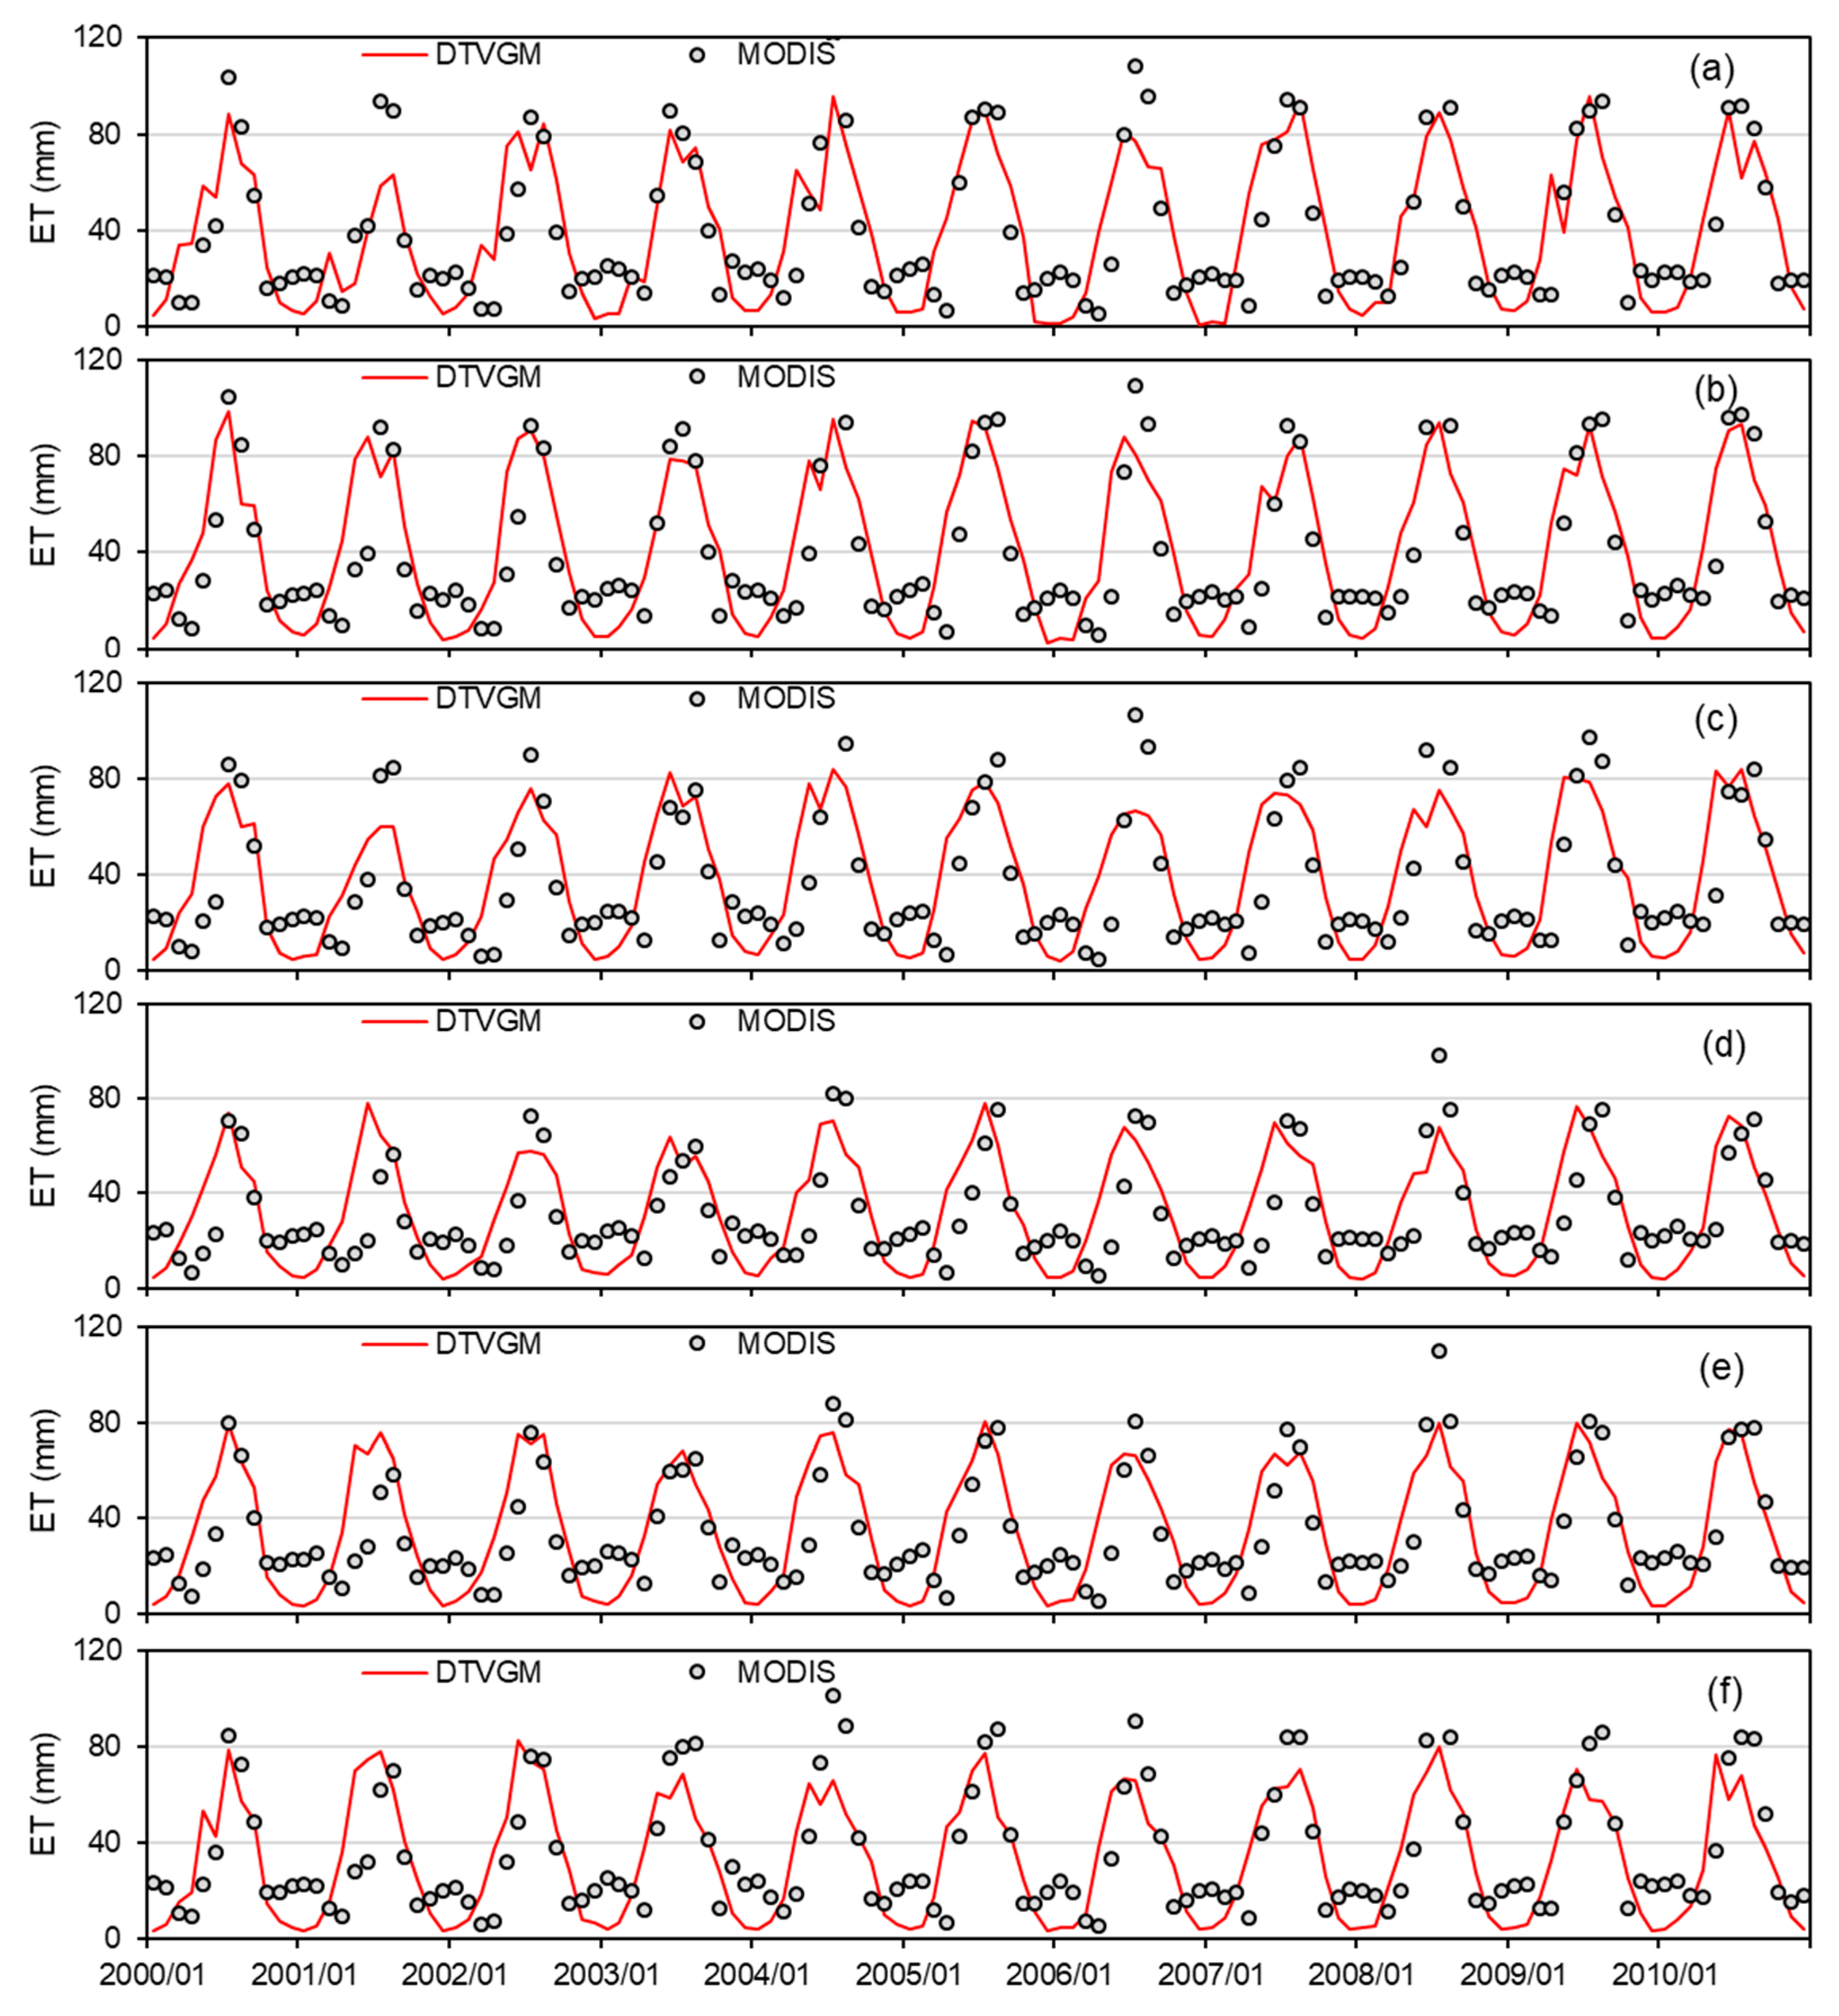
| BGC | 0.6% | 0.80 | 0.62 | 6.1% | 0.86 | 1.20 |
| JMC | 5.9% | 0.79 | 0.67 | 7.9% | 0.94 | 1.17 |
| BSC | 5.9% | 0.73 | 0.67 | 17.8% | 0.90 | 1.24 |
| THC | 6.0% | 0.66 | 0.60 | 4.3% | 0.93 | 0.91 |
| DSC | 3.5% | 0.74 | 0.59 | 10.1% | 0.95 | 0.90 |
| CHC | 6.8% | 0.76 | 0.61 | 11.0% | 0.94 | 1.01 |
| Catchment | Atmospheric Pressure | Temperature | Humidity | Precipitation | Windspeed | Sunshine Duration | CO2 | |||||||
|---|---|---|---|---|---|---|---|---|---|---|---|---|---|---|
| Slope (kP/a) | Zc | Slope (°C/a) | Zc | Slope (%/a) | Zc | Slope (mm/a) | Zc | Slope (m/s/a) | Zc | Slope (hour/a) | Zc | Slope (ppmv/a) | Zc | |
| BGC | −0.01 | −1.3 | 0.01 | 0.75 | −0.13 | −1.27 | 10.51 | 2.37 *** | −0.01 | −2.11 ** | 0.01 | 0.29 | 2.24 | 6.13 *** |
| JMC | −0.01 | −1.2 | 0.02 | 1.27 | −0.08 | −0.68 | 7.54 | 2.24 ** | 0.00 | −0.68 | −0.01 | −1.33 | 2.24 | 6.13 *** |
| BSC | 0.00 | 0.88 | −0.04 | −1.72 * | 0.20 | 1.52 | 11.15 | 2.17 ** | 0.01 | 0.36 | −0.05 | −2.89 *** | 2.24 | 6.13 *** |
| THC | 0.00 | 0.23 | 0.03 | 1.78 * | −0.25 | −2.24 ** | 5.36 | 1.52 | 0.00 | 0.1 | −0.02 | −1.14 | 2.24 | 6.13 *** |
| DSC | 0.00 | 0.75 | 0.04 | 1.98 ** | −0.27 | −2.43 *** | 8.44 | 2.43 *** | −0.01 | −1.98 ** | −0.02 | −1.33 | 2.24 | 6.13 *** |
| CHC | 0.00 | 1.4 | 0.03 | 1.4 | −0.12 | −0.88 | 11.98 | 2.37 *** | −0.03 | −2.43 *** | −0.04 | −2.76 *** | 2.24 | 6.13 *** |
| Catchment | Cropland | Forest | Grassland | Water | Urban | |||||
|---|---|---|---|---|---|---|---|---|---|---|
| Slope (km2/a) | Zc | Slope (km2/a) | Zc | Slope (km2/a) | Zc | Slope (km2/a) | Zc | Slope (km2/a) | Zc | |
| BGC | 0.00 | 0.00 | 0.04 | 0.75 | 0.00 | 0.00 | 0.00 | 0.00 | −0.04 | −0.75 |
| JMC | −0.52 | −2.00 ** | −0.56 | −2.00 ** | −0.10 | −1.00 | 0.00 | 0.00 | 1.18 | 2.00 ** |
| BSC | 0.00 | 0.00 | 0.00 | 0.00 | 0.00 | 0.00 | 0.00 | 0.00 | 0.00 | 0.00 |
| THC | −1.00 | −1.50 | 0.32 | 1.50 | −1.18 | −1.25 | −0.08 | 0.00 | 1.94 | 2.25 ** |
| DSC | 0.28 | 0.60 | 0.34 | 0.70 | −3.76 | −2.00 ** | −0.04 | −0.75 | 3.18 | 2.00 ** |
| CHC | 0.00 | 0.00 | −0.44 | −0.75 | −0.12 | −1.50 | 0.00 | 0.00 | 0.56 | 1.50 |
| Catchment | ET | GPP | ||||
|---|---|---|---|---|---|---|
| Annual ET (mm) | Slope (mm/a) | Zc | Annual GPP (gC/m2) | Slope (gC/m2/a) | Zc | |
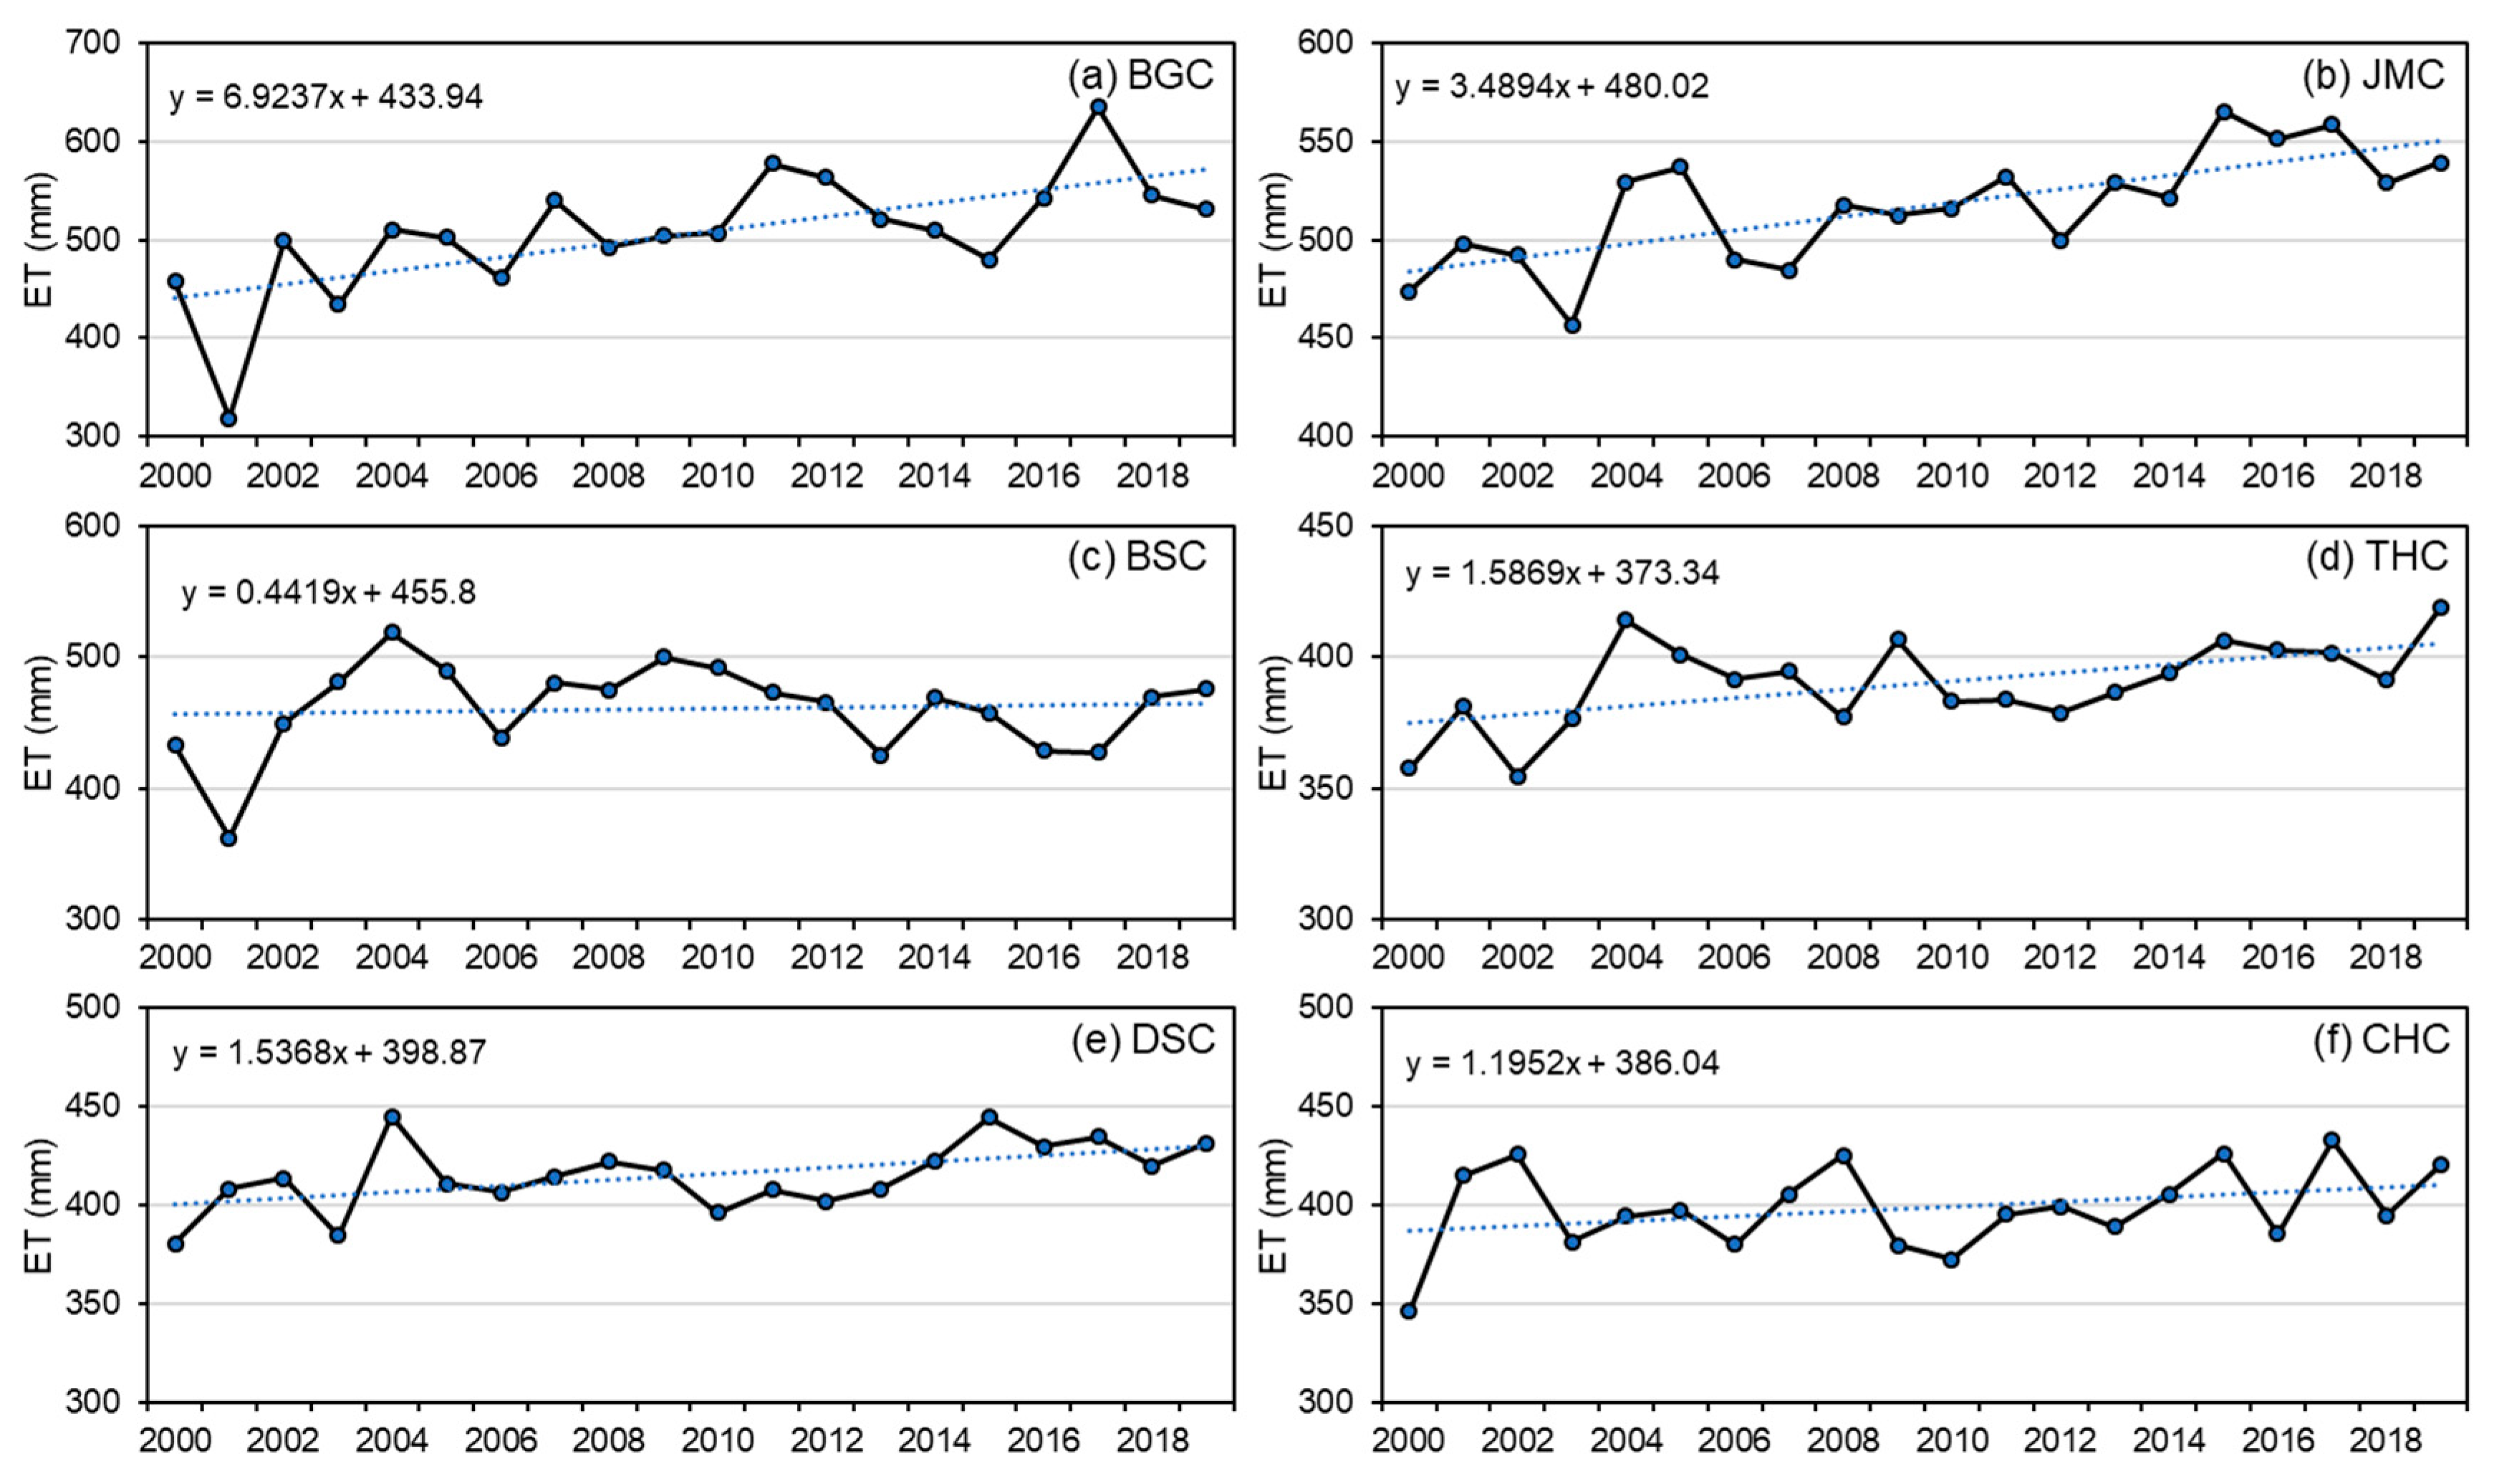
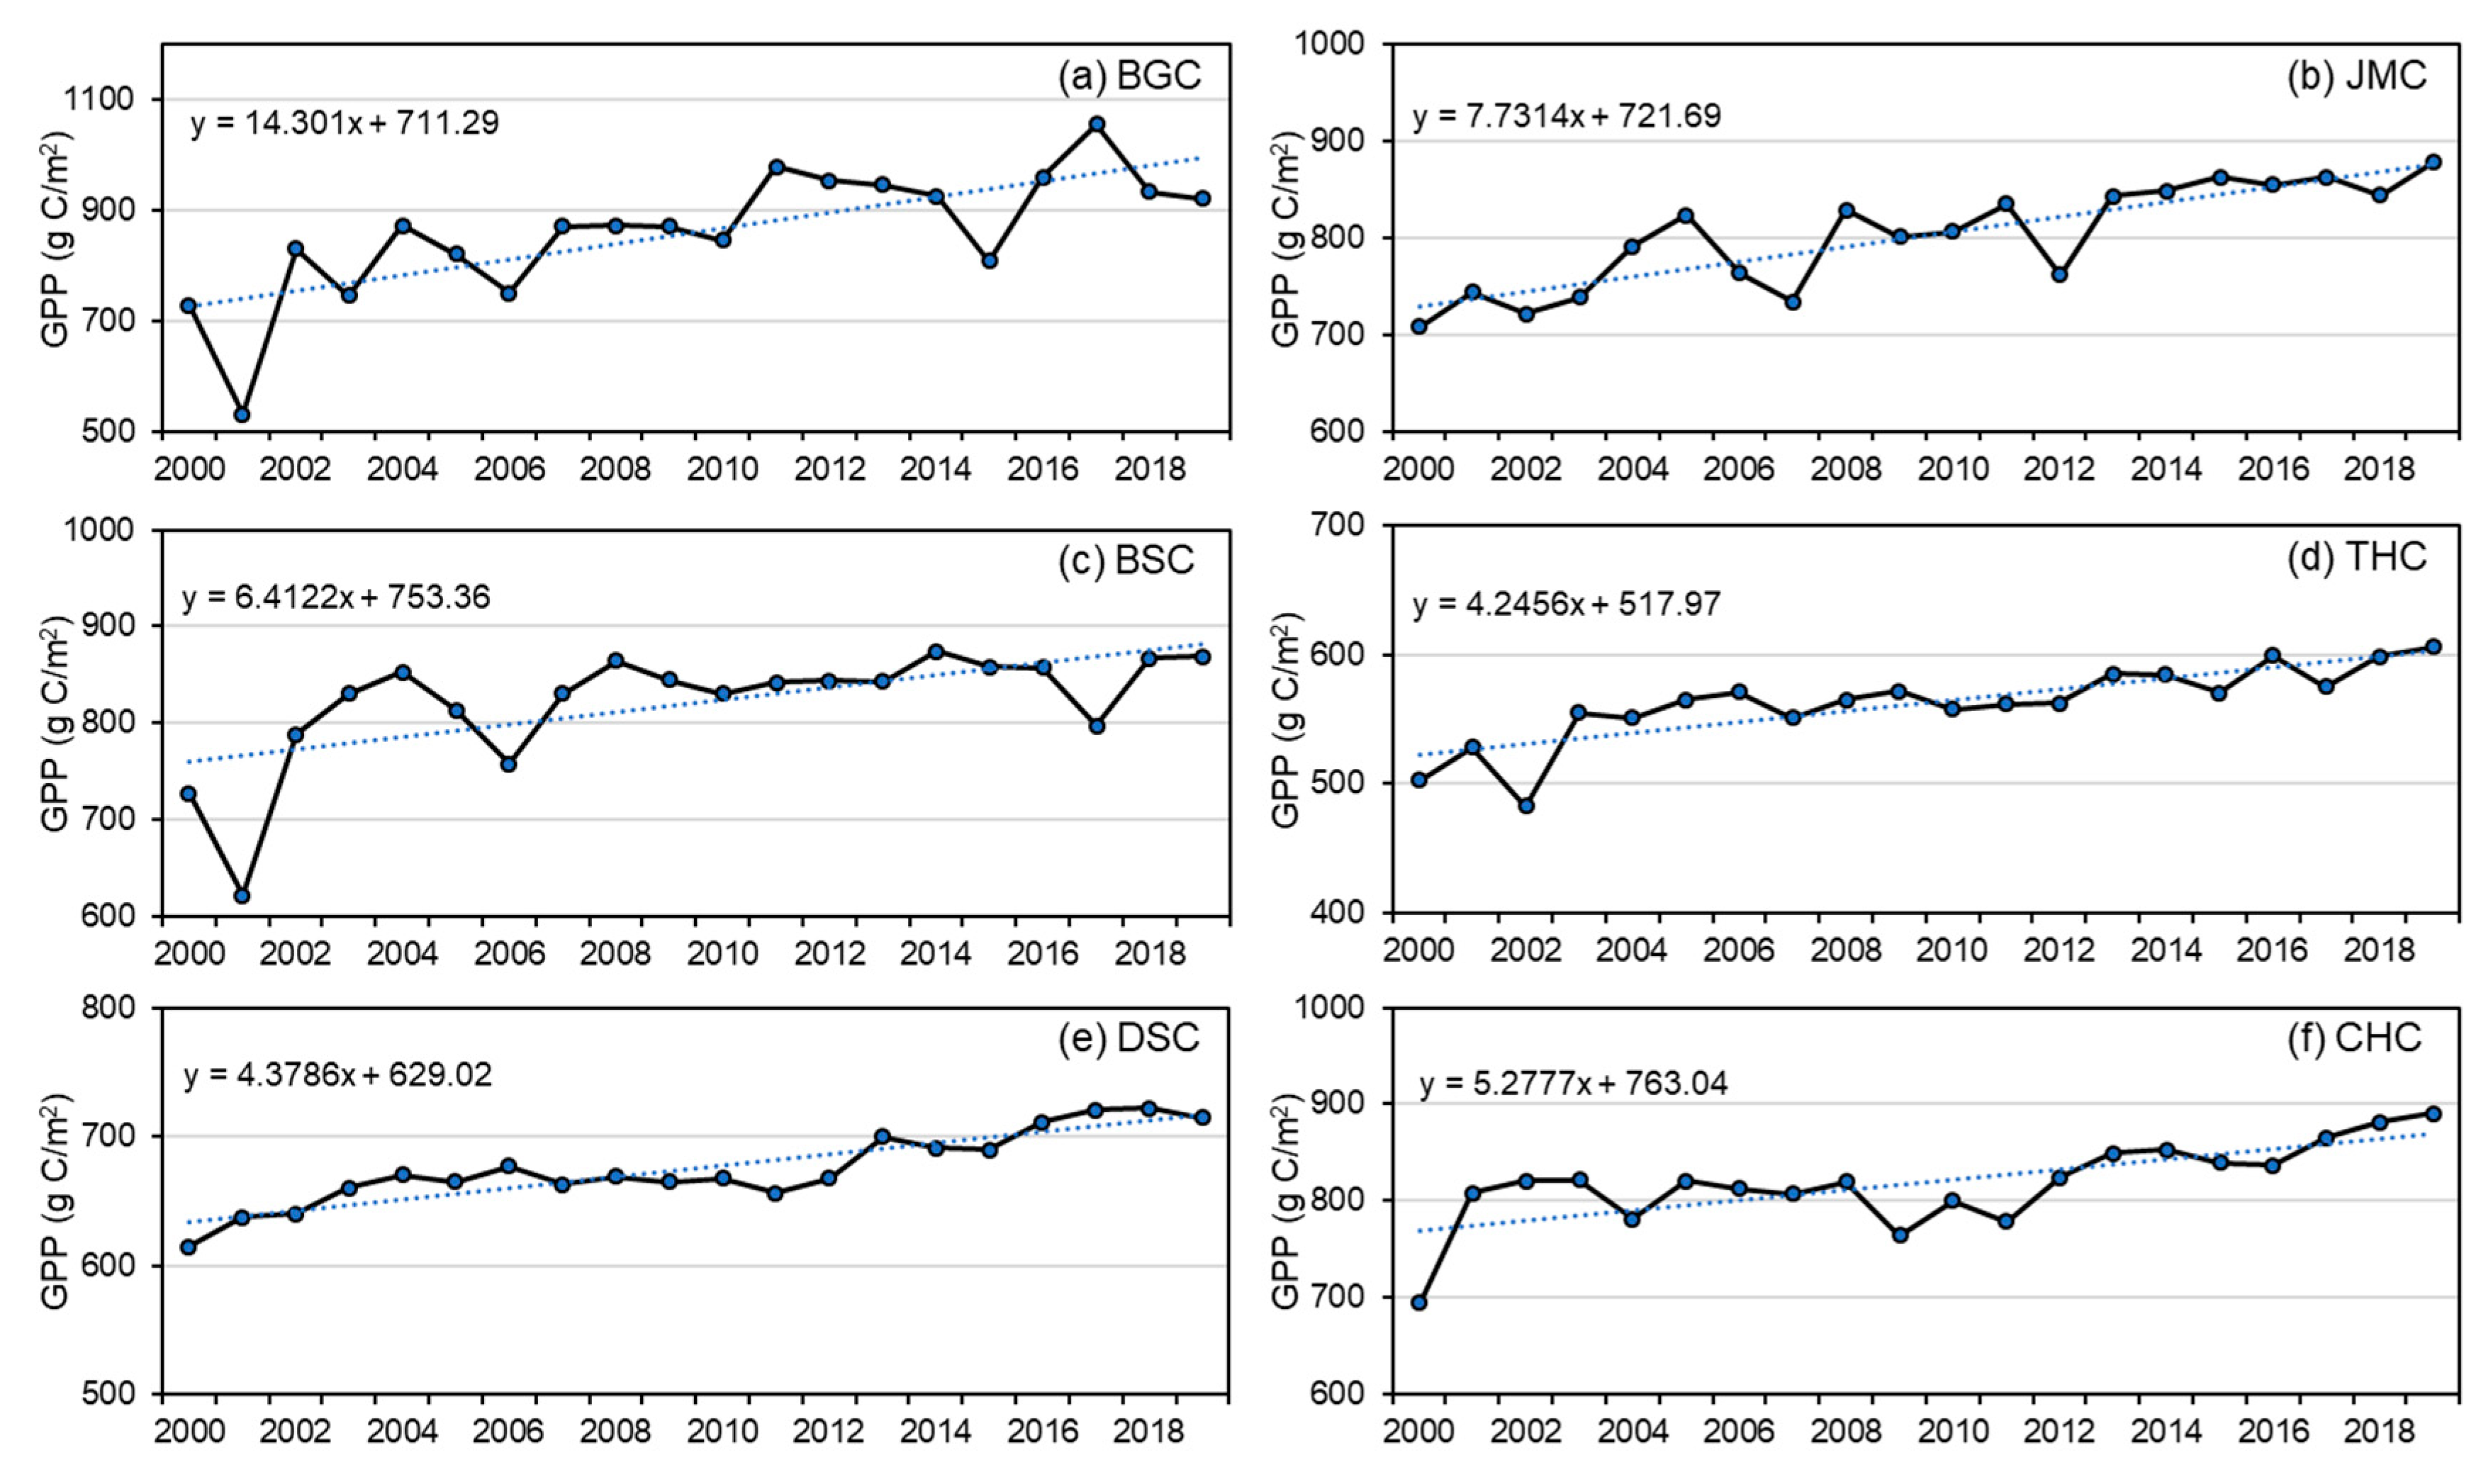
| BGC | 506.64 | 6.92 | 3.15 *** | 861.45 | 14.30 | 3.15 *** |
| JMC | 516.66 | 3.49 | 3.15 *** | 802.87 | 7.73 | 4.51 *** |
| BSC | 460.44 | 0.44 | 0.55 | 820.69 | 6.41 | 3.28 *** |
| THC | 390.01 | 1.59 | 2.30 ** | 562.55 | 4.25 | 4.32 *** |
| DSC | 415.01 | 1.54 | 2.37 *** | 675.00 | 4.38 | 4.25 *** |
| CHC | 398.59 | 1.20 | 1.14 | 818.46 | 5.28 | 3.21 *** |
| Mean | 446.67 | 2.40 | 2.50 *** | 702.57 | 6.00 | 4.24 *** |
| Catchment | Atmospheric Pressure | Temperature | Humidity | Precipitation | Windspeed | Sunshine Duration | CO2 | LUCC | Interact |
|---|---|---|---|---|---|---|---|---|---|
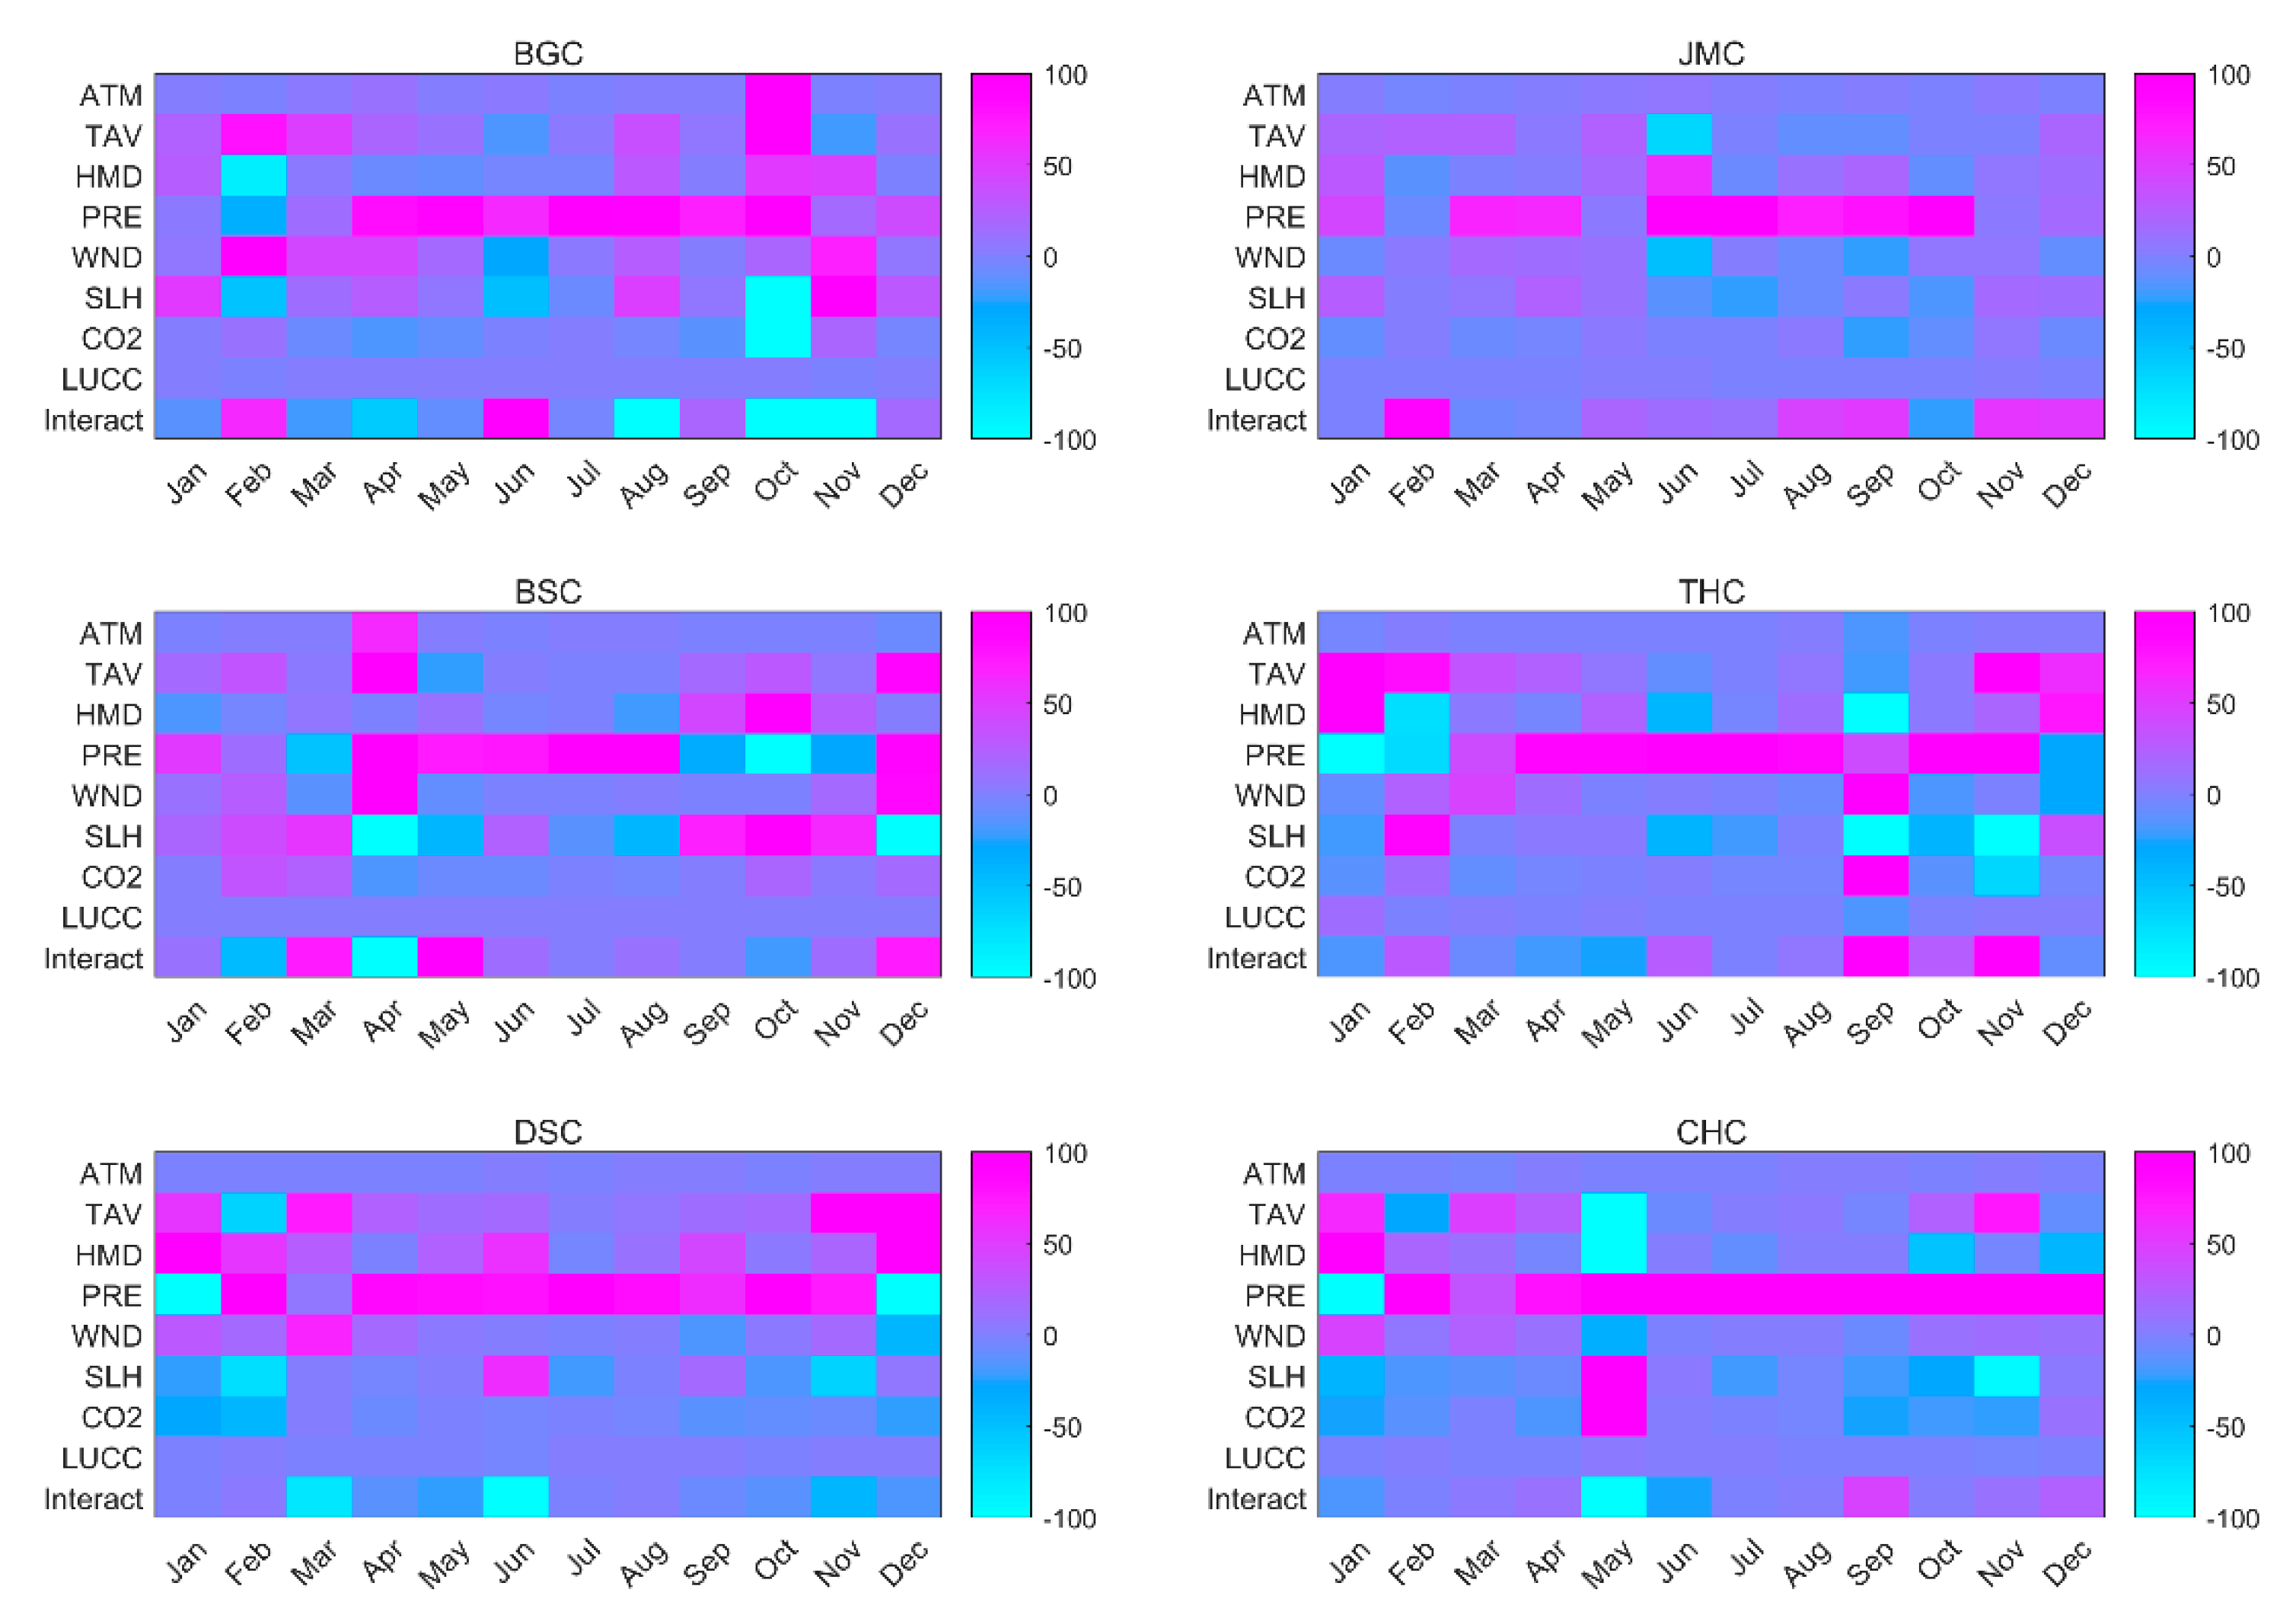
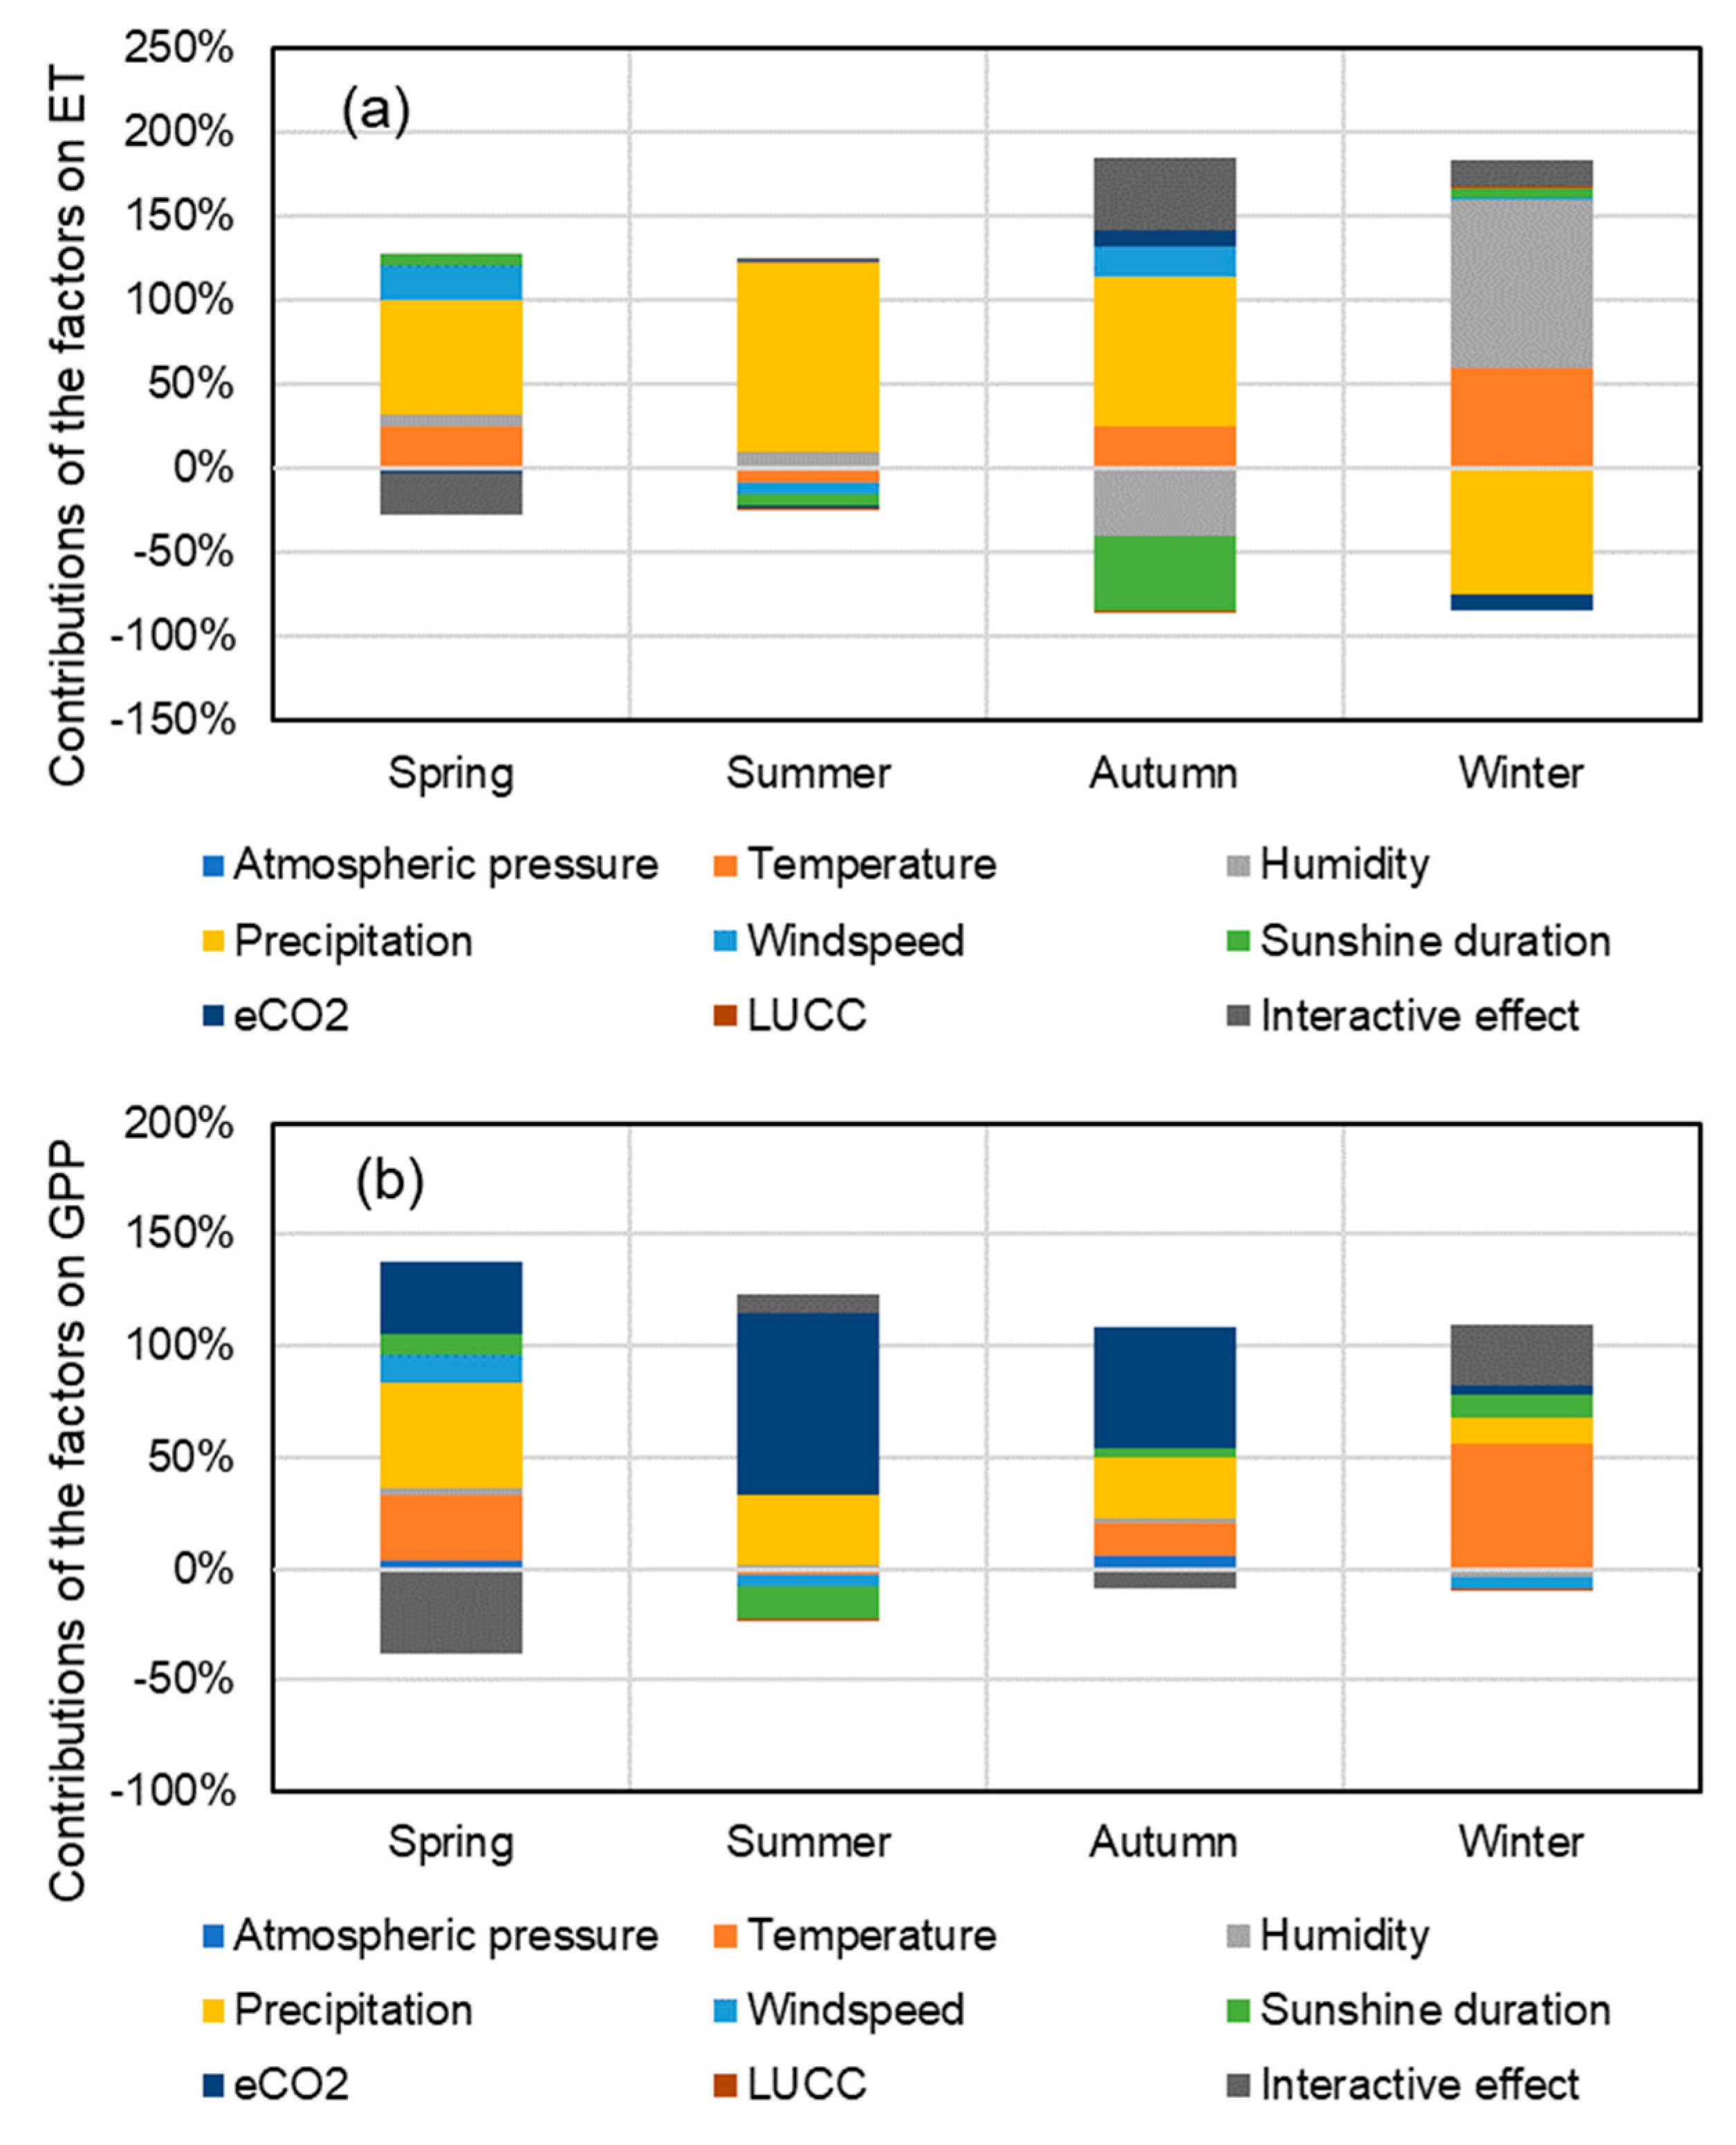
| BGC | 3.5% | 10.5% | 0.4% | 90.7% | 7.9% | −0.8% | −5.2% | 0.2% | −7.2% |
| JMC | −4.3% | 19.4% | −7.4% | 106.0% | −7.9% | −16.0% | −10.8% | −0.3% | 21.2% |
| BSC | 0.9% | −5.0% | −12.8% | 164.1% | −0.9% | −42.5% | −2.9% | 0.0% | −0.8% |
| THC | −0.2% | 8.5% | 8.9% | 104.9% | 0.5% | −10.2% | −6.4% | −0.1% | −5.9% |
| DSC | −0.1% | 11.8% | 9.2% | 97.5% | 4.7% | −7.5% | −4.1% | −0.1% | −11.5% |
| CHC | 0.2% | 13.0% | −3.0% | 104.3% | 4.7% | −17.2% | −9.7% | −0.6% | 8.4% |
| Mean | −1.3% | 12.8% | 2.0% | 104.8% | −0.8% | −12.4% | −7.2% | −0.2% | 2.3% |
| Catchment | Atmospheric Pressure | Temperature | Humidity | Precipitation | Windspeed | Sunshine Duration | CO2 | LUCC | Interact |
|---|---|---|---|---|---|---|---|---|---|
| BGC | 4.9% | 15.9% | −6.3% | 57.7% | 6.1% | −4.8% | 25.3% | 0.3% | 0.8% |
| JMC | −8.1% | 26.3% | −13.7% | 49.8% | −15.2% | −11.2% | 33.1% | −0.6% | 39.5% |
| BSC | 3.7% | −9.2% | 35.4% | 20.9% | 4.9% | −39.5% | 108.3% | 0.0% | −24.4% |
| THC | −0.4% | 21.3% | −5.2% | 31.3% | −1.2% | 0.4% | 66.2% | −0.5% | −11.9% |
| DSC | 0.0% | 41.9% | 1.2% | 22.5% | 5.5% | −3.4% | 73.8% | −1.9% | −39.7% |
| CHC | 1.1% | 45.7% | 2.0% | −6.6% | 1.0% | −21.3% | 66.8% | −4.9% | 16.1% |
| Mean | −2.4% | 27.8% | −4.8% | 34.8% | −3.5% | −6.8% | 56.7% | −1.0% | −0.8% |
Publisher’s Note: MDPI stays neutral with regard to jurisdictional claims in published maps and institutional affiliations. |
© 2022 by the authors. Licensee MDPI, Basel, Switzerland. This article is an open access article distributed under the terms and conditions of the Creative Commons Attribution (CC BY) license (https://creativecommons.org/licenses/by/4.0/).
Share and Cite
Zeng, S.; Du, H.; Xia, J.; Wu, J.; Yang, L. Attributions of Evapotranspiration and Gross Primary Production Changes in Semi-Arid Region: A Case Study in the Water Source Area of the Xiong’an New Area in North China. Remote Sens. 2022, 14, 1187. https://doi.org/10.3390/rs14051187
Zeng S, Du H, Xia J, Wu J, Yang L. Attributions of Evapotranspiration and Gross Primary Production Changes in Semi-Arid Region: A Case Study in the Water Source Area of the Xiong’an New Area in North China. Remote Sensing. 2022; 14(5):1187. https://doi.org/10.3390/rs14051187
Chicago/Turabian StyleZeng, Sidong, Hong Du, Jun Xia, Jian Wu, and Linhan Yang. 2022. "Attributions of Evapotranspiration and Gross Primary Production Changes in Semi-Arid Region: A Case Study in the Water Source Area of the Xiong’an New Area in North China" Remote Sensing 14, no. 5: 1187. https://doi.org/10.3390/rs14051187
APA StyleZeng, S., Du, H., Xia, J., Wu, J., & Yang, L. (2022). Attributions of Evapotranspiration and Gross Primary Production Changes in Semi-Arid Region: A Case Study in the Water Source Area of the Xiong’an New Area in North China. Remote Sensing, 14(5), 1187. https://doi.org/10.3390/rs14051187


