Article

Development of a Landscape-Based Multi-Metric Index to Assess Wetland Health of the Poyang Lake

1
Key Laboratory of Poyang Lake Wetland and Watershed Research, Jiangxi Normal University, Ministry of Education, Nanchang 330022, China
2
School of Geography and Environment, Jiangxi Normal University, Nanchang 330022, China
3
China Key Laboratory of Watershed Eco-Geological Processes, Ministry of Natural Resources, Nanchang 330022, China
4
School of Life Sciences, Jiangxi Normal University, Nanchang 330022, China
5
Analytical & Testing Center, Jiangxi Normal University, Nanchang 330022, China
*
Author to whom correspondence should be addressed.
Remote Sens. 2022, 14(5), 1082; https://doi.org/10.3390/rs14051082
Submission received: 13 January 2022 / Revised: 15 February 2022 / Accepted: 20 February 2022 / Published: 23 February 2022

Abstract

:
Human-induced changes in landscapes are one of the major drivers of wetland loss and degradation. The Poyang Lake wetland in China has been experiencing severe degradation due to human disturbance and landscape modification. Indicators to assess the condition of this wetland are thus needed urgently. Here, a landscape-based multi-metric index (LMI) is developed to evaluate the condition of the Poyang Lake wetland. Twenty-three candidate metrics that have been applied to wetland health assessment in published studies were tested. Metrics that show strong discriminative power to identify reference and impaired sites, having significant correlations with either benthic macroinvertebrate- or vegetation-based indices of biotic integrity (B-IBI or V-IBI), were chosen to form the LMI index. Five of these metrics (largest patch index, modified normalized differential built-up index, Shannon’s diversity index, connectance index, and cultivated land stress index) were selected as our LMI metrics. A 2 km buffer zone around sample sites had the strongest explanatory power of any spatial scale on IBIs, suggesting that protecting landscapes at local scales is essential for wetland conservation. The LMI scores ranged between 1.05 and 5.00, with a mean of 3.25, suggesting that the condition of the Poyang Lake wetland is currently in the “fair” category. The areas along lakeshores were mainly in poor or very poor conditions, while the less accessible inner areas were in better conditions. This study demonstrates significant links between landscape characteristics and wetland biotic integrity, which validates the utility of satellite imagery-derived data in assessing wetland health. The LMI method developed in this study can be used by land managers to quickly assess broad regions of the Poyang Lake wetland.

1. Introduction

Wetlands provide many indispensable ecological services and are among the most important ecosystems [1]. Large-scale land use changes driven by population growth and urbanization have greatly altered the landscape patterns of wetlands and the surrounding areas. It is estimated that more than half of wetlands in the world have been severely threatened, mainly owing to drainage and conversion into other land-use types (e.g., cultivated and built-up land), and remaining wetlands continue to be threatened [2]. The loss and degradation of wetlands weaken their ability to support ecosystem functions such as water purification, pollutant degradation, and climate regulation, which inevitably threatens the welfare of human beings as well as other organisms [3]. It is therefore necessary to understand influences of changes in land uses on wetland ecosystems and how best to balance human needs with the sustainability of natural ecosystems.
A healthy ecosystem has the capacity to supply sufficient ecological services and to sustain high biodiversity and productivity while remaining resistant to stresses [1]. Land use plays important roles in ecological and environmental changes, and landscape patterns have previously been analyzed in relation to ecosystem health and integrity [4,5]. It is hypothesized that an ecosystem with a higher proportion of human-modified and fragmented landscapes usually suffers stronger anthropogenic disturbances, and the ecosystem is therefore likely in a worse condition [6]. Landscape metrics that indicate ecosystem resilience, structural stability, and primary productivity are usually used to assess ecosystem conditions [7,8]. For example, Jafary et al. [9] used five metrics (normalized difference vegetation index (NDVI), grassland pattern, land use change, landscape diversity, and vegetation coverage) to assess the condition of the Taleghan watershed, Iran. Peng et al. [8] assessed the ecosystem health of Lijiang City using land use and landscape derived indicators, including the average normalized difference vegetation index (NDVI), landscape heterogeneity index, patch cohesion of forest land, and ecosystem elasticity coefficient. The limitation of previous approaches is that they typically use landscape metrics (e.g., NDVI, the landscape contagion index (CONT), and forest coverage) that are widely applied in other studies for health assessment without any metric selection procedure, although the effects of landscape attributes vary among ecosystems.
Various indices have been proposed as a measurement of wetland health, among which biological indices (e.g., the index of biotic integrity) are most commonly adopted [10,11]. Field-based data are collected at individual sample sites. Ecological health of the wetland is assessed based on characteristics of biological assemblages [12,13]. For example, the US Environmental Protection Agency compiled an extensive dataset of environmental variables (physic-chemical parameters of water and sediment) and biological assemblages that were sampled from 3045 sites of wadeable streams in the USA [11]. A macroinvertebrate-based index was developed based on this dataset for biological assessment on the streams. Although an assessment based on field-sampled biological data can be highly accurate and reliable, it also requires sufficient expertise and abundant manpower, materials, and financial resources. In addition, sample sites usually represent a small part of the survey region, and it is difficult to sample the entire region. Thus, there is a need for methods that can evaluate the condition of the entire region to obtain more spatially accurate information for wetland management, land planning, and policy decision making. Significant relationships between biological assemblage attributes and landscape patterns have been previously established [14,15]. For example, Hrodey et al. [16] found that fish abundance and overall biotic integrity can be well predicted by the percent of forests upstream of sample sites, riparian land use types, and watershed area. Identifying broad-scale landscape attributes that are significantly correlated with field-sampled biological indicators of ecosystem health is therefore a possible solution for the assessment of a large region.
As the largest freshwater lake of China, Poyang Lake is among the few lakes that are freely hydrologically connected with the Yangtze River [17]. Water levels of the lake vary dramatically within a year, ranging from about 7 m in winter to more than 20 m in summer [18], mainly due to the remarkable seasonal variation of precipitation in the lake catchment. The dramatic fluctuation of water levels leads to the intra-annual shift of lake water and wetland. The Poyang Lake wetland maintains a high level of freshwater biodiversity and is the home of many threatened species (e.g., oriental storks). However, this wetland has been suffering severe disturbances for the past decades due to the high human population density in its catchment [19]. It is therefore urgent to develop quantitative indices for monitoring the impact of human activities and for assessing the condition of the ecosystem. In this study, we aim to develop a landscape-based multi-metric index (LMI) for the Poyang Lake wetland by correlating landscape characteristics with field-based biological indicators. We then predict the wetland health of the entire study area using the developed LMI.

2. Materials and Methods
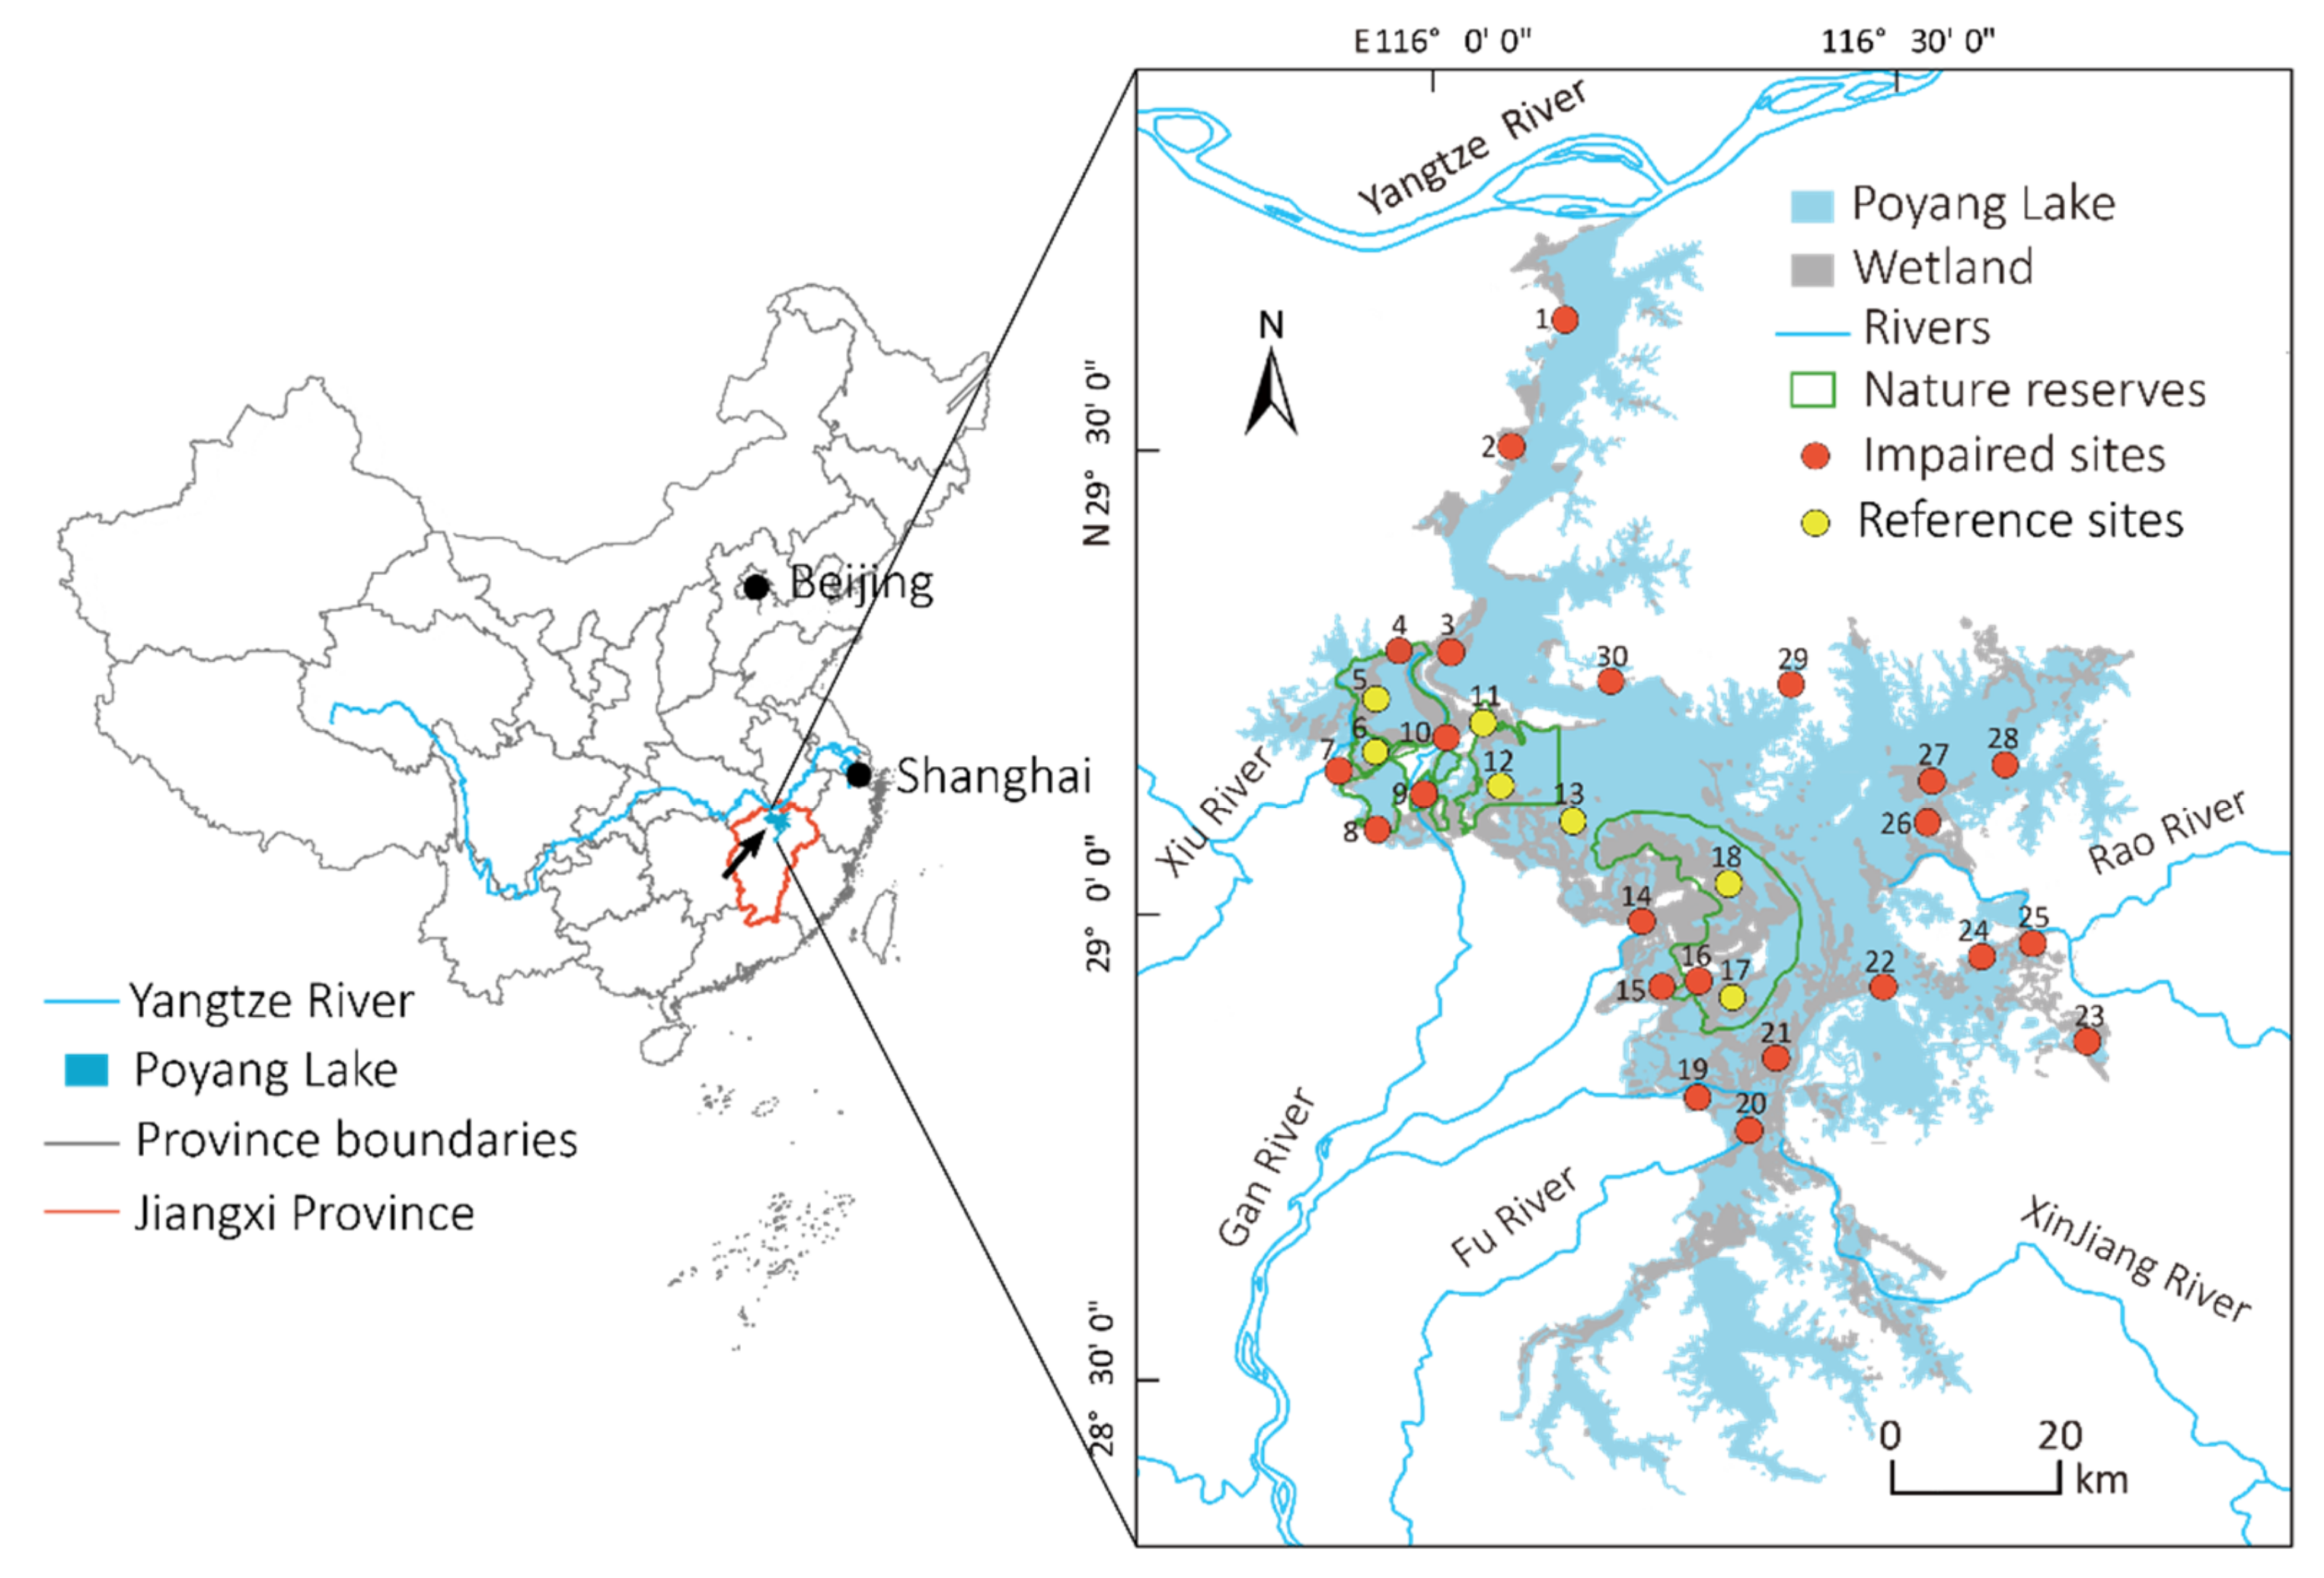
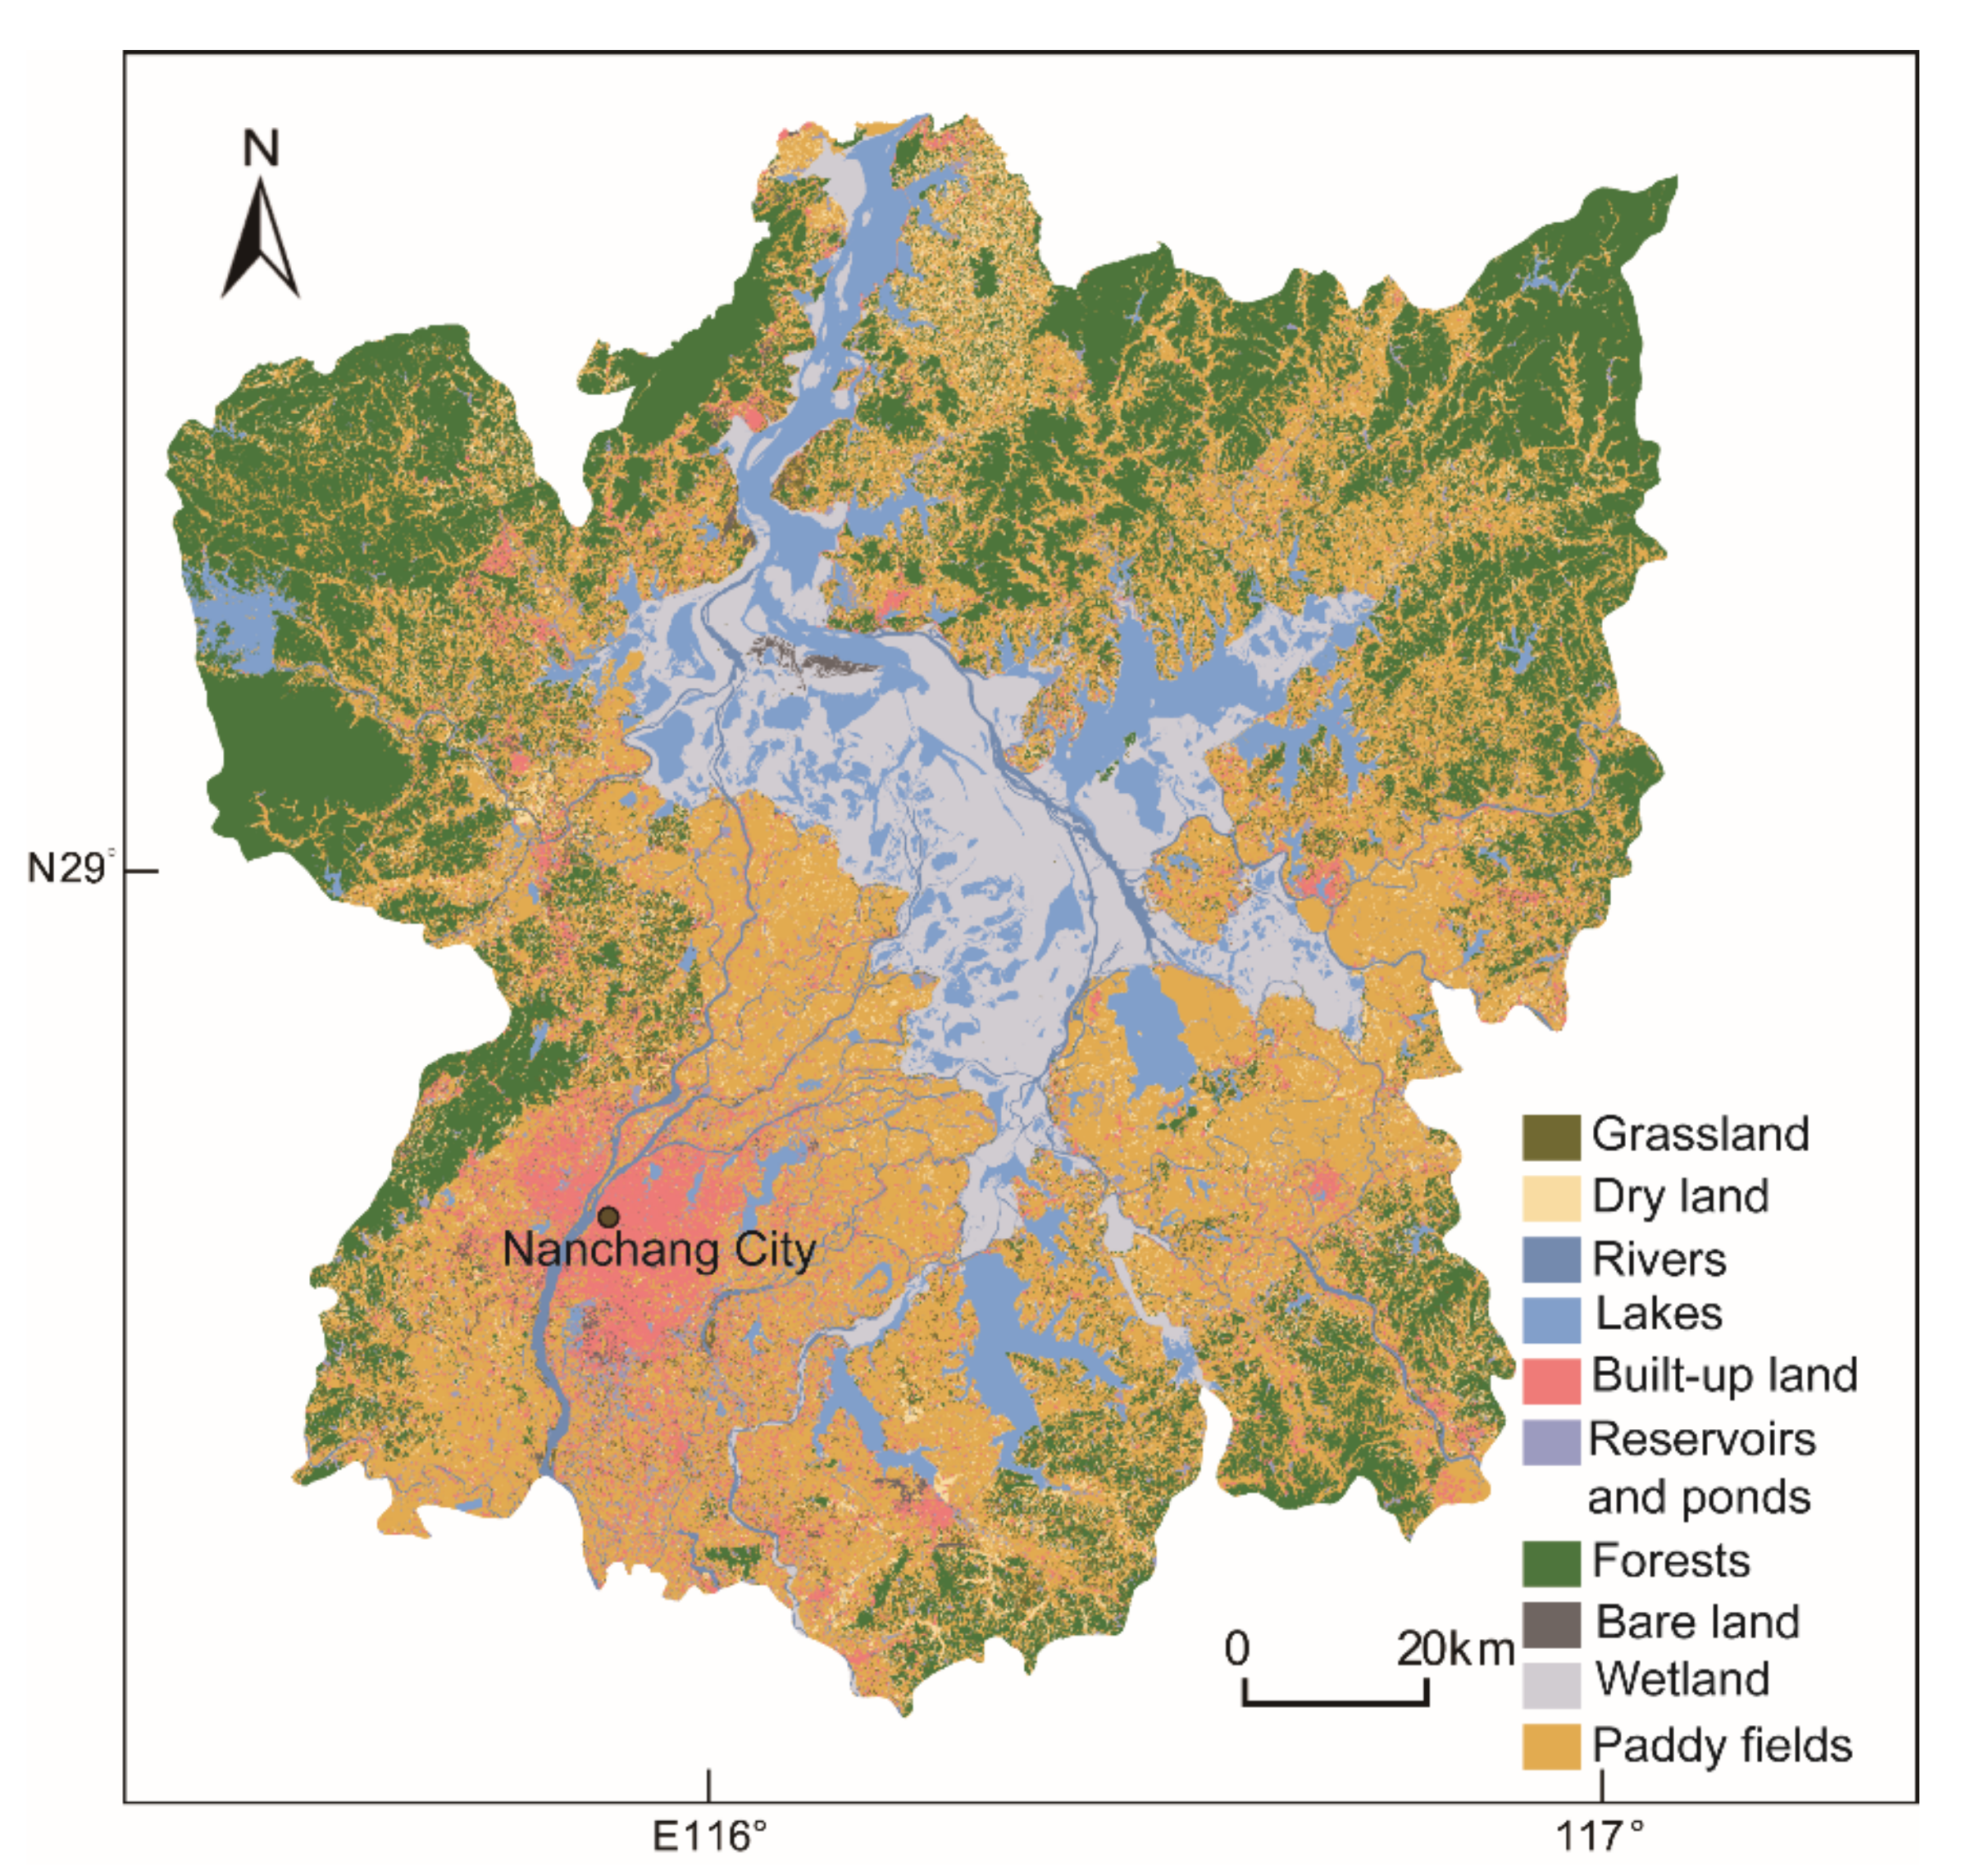
2.1. Study Area

Poyang Lake situates in the north part of Jiangxi Province and on the south bank of the Yangtze River (Figure 1) [20]. It receives inflows from major rivers within its catchment and discharges into the Yangtze River [21]. Water levels of the lake are determined by precipitation in the catchment, as well as inflow and outflow between the lake and its hydrologically connected rivers. Water area of the lake varies dramatically in different seasons and is more than 3000 km2 in summer and less than 1000 km2 in winter [22]. The wetland area emerging in winter serves as the habitat for migratory birds (e.g., white cranes, oriental storks, and swan geese) [23]. Land use across the watershed mainly consists of forests, cultivated land, built-up land, and open water [24].
The Poyang Lake region refers to the eleven counties surrounding or nearby the Poyang Lake and has a total area of 26,950 km2 [25]. It has a human population of more than 11 million and is one of the areas with the highest population density in China (ca. 410 inhabitants/km2) [26]. The Poyang Lake region is well known for the high production of rice due to fertile soil and is among the areas with intensive agriculture in China [27]. In addition, industries have been developing rapidly in the Poyang Lake region, especially mining and manufacturing [28]. The fast economic development has greatly changed regional land cover and landscapes [23]. Human-altered landscapes (e.g., built-up land), which have caused aggravated environmental pollution and ecological degradation in the region [29], have increased considerably.

2.2. Data Collection and Processing

Based on a randomized systematic design, 30 sample sites were selected in the Poyang Lake wetland [30]. Specifically, Poyang Lake was stratified into five segments (south, north, west, east, and central). The number of sample sites within a segment was proportional to the area of wetland in the segment. Sample sites were then picked at random in each segment. Field data surveys and sampling were conducted on these sites during September and October 2015. Human activities, land use, and biological information in and around the sample sites were recorded. Water quality parameters, including pH and dissolved oxygen (DO), were measured using portable multi-parameter monitoring equipment (the YSI 6600 data sonde, YSI Inc., Yellow Springs, OH, USA). One liter of water was sampled at each site. Additional water quality parameters were measured in laboratory by referring to the standards given in “Water and Wastewater Monitoring Method” [31], including nitrate-nitrogen (NO3−-N), bio-chemic oxygen demand in manganese (CODMn), total nitrogen (TN), heavy metals, total phosphorus (TP), and ammonium nitrogen (NH4+-N).
Landsat-8 OLI images with zero cloud coverage acquired in 2015 were used for land use classification. The spatial resolution of the images was 30 m. All Landsat imageries were obtained from the website (https://earthexplorer.usgs.gov; assessed on 20 December 2019) of the United States Geological Survey. First, multiple bands were combined to create a composite image in ENVI 5.3 image processing software. Next, the FLAASH module was used for radiometric and atmospheric corrections. In addition, the Universal Transverse Mercator (UTM) was used to minimize geometric distortion. The spatial resolution of satellite products was improved by the image enhancement technique using wavelet resolution merging, which improved the spatial resolution from 30 m × 30 m to 15 m × 15 m. Ground truth data were collected from 120 sites during field surveys conducted in 2015. These sites were selected using a random stratified method and included all land use types to be classified. The maximum likelihood (MLC) supervised classification technique was used for image classification and land use identification of each selected image [32]. Ground truth data of 60 sites were used as the training data in supervised classification. Some classes of spectral disorder could not be separated by classification, so visual interpretation was used to separate them. Landsat images were classified into ten categories: built-up land, forest land, grassland, cultivated land (including paddy field and dry land), rivers, lakes, wetlands, reservoirs and ponds, and bare land. The accuracy of land use classification was assessed by using ground truth data at the other 60 sites as references.
Images from Sentinel-2A MSI were acquired in October 2015 from the official Copernicus Open Access Data Hub (https://scihub.copernicus.eu/dhus/#/home; assessed on 20 December 2019). Sentinel-2A MSI has thirteen reflective bands (four 10 m visible and NIR bands; six 20 m red edge, NIR and SWIR bands; and three 60 m bands for characterizing aerosol, water vapor correction, and cirrus clouds) [33]. All images were atmospherically corrected by the Sen2Cor processor which is designed for vegetation and land. The SNAP software was used for image processing. The images were resampled at 20 m using SNAP interpolation tools to calculate remote sensing indicators.

2.3. Candidate Metrics

Nineteen landscape and four remote sensing indicators were compiled as the candidate metrics to evaluate the condition of the Poyang Lake wetland (Table 1). These metrics are considered useful for wetland health assessment in published studies, e.g., [34,35,36]. Landscape and remote sensing metrics were computed in Fragstats 4.2 [37] and SNAP, respectively. Land use data and remote sensing images within the watershed and within circular buffers of 200 m, 500 m, 1 km, 2 km, 5 km, 10 km, and 15 km were extracted for each sample site to calculate the candidate metrics for quantifying the influences of landscape patterns at different spatial scales on the wetland health. Watershed boundaries were delineated for each sample site based on the elevational data derived from the digital elevation model with a spatial resolution of thirty arc-second in ArcGIS 10.2.

2.4. Reference Site Selection

A reference site refers to a sample site that is not or rarely disturbed by human activities, and it represents the most pristine state of a wetland. Setting a reference can provide a benchmark for evaluating to what extent current conditions have deviated from reference conditions. Since there are almost no areas undisturbed by humans in Poyang Lake, sample sites that suffered the least human disturbances were chosen as the reference sites. Three aspects of the environment, including water quality, land use patterns, and field-observed human disturbances, were evaluated for reference site selection [19]. Specifically, water quality of a reference site should at least fall within the “fair” category, i.e., TN ≤ 1.00 mg/L, TP ≤ 0.20 mg/L, CODMn ≤ 6.00 mg/L, NH4+ − N ≤ 1.00 mg/L, NO3− − N ≤ 1.00 mg/L, DO > 5.00 mg/L, Cd ≤ 0.005 mg/L, and Cu ≤ 1.00 mg/L [38]. According to China’s inland surface water quality standards, water quality can be classified as five categories: level I (excellent, water in source areas and not contaminated), level II (good, slightly contaminated and suitable for drinking after simple treatments), level III (fair, not suitable for drinking but harmless in direct contact with the water), level IV (poor, suitable for agricultural irrigation), and level V (very poor, seriously contaminated) [38]. Water quality of Poyang Lake varies between level III and level V, and it is difficult to find the areas with “good” water quality [39,40]. In addition, the percent of human-altered land use (including cultivated and built-up land) within 500 m of the sample site was less than 5% at these reference sites. There were no human disturbances (e.g., mining, mowing, and municipal wastewaters) observed within a 500 m buffer zone [41]. A total of 7 and 23 sample sites were identified as the reference and impaired sites, respectively, according to the site classification criteria (Figure 1). Six reference sites (sites 5, 6, 11, 12, 17, and 18) were situated within national nature reserves in which anthropogenic disturbances had been strictly controlled. One other reference site (site 13) was near the reserves.

2.5. Spatial Scales and Metric Selection

Ordinary least-squares models were employed to detect the predictive ability of landscape and remote sensing variables at each spatial scale on scores of benthic macroinvertebrate- and vegetation-based indices of biotic integrity (B-IBI and V-IBI), respectively. These two indices were developed to assess the condition of the Poyang Lake wetland based on attributes of benthic macroinvertebrate and macrophyte assemblages [19,42]. The B-IBI includes five biological metrics (the number of taxa, the number of predator taxa, average score per taxon (ASPT) index, percentage of Diptera individuals, and Shannon–Wiener diversity index) [42], while the V-IBI includes seven different metrics (numbers of invasive species, submerged species and tolerant species in a sample site, cover of Phalaris arundinacea L., percentages of obligate wetland species, perennial species, and species with both sexual and vegetative propagation) [19]. Larger B-IBI and V-IBI values indicate better wetland health. A stepwise backward selection procedure was performed to select the most parsimonious multi-variable model based on the Akaike information criterion (AIC) [43]. The adjusted R2 value of the most parsimonious model was used to indicate the explanatory power of landscape and remote sensing variables at a specific spatial scale on wetland conditions in the Poyang Lake. The spatial scale at which the model had the highest R2 value was considered the most appropriate scale for the wetland health assessment.
Three different processes were conducted for metric selection (Figure 2) [44]. First, the relevance of landscape and remote sensing metrics with B-IBI and V-IBI was measured by Pearson’s correlation coefficients. Only metrics that significantly correlated with either B-IBI or V-IBI (p < 0.05) were retained. Second, values of each retained metric were compared between reference and impaired sites within a boxplot. Overlap degree between interquartile (IQ) ranges (i.e., box, the first quartile to the third quartile) in the boxplot was used to evaluate the discriminatory power of the metric. If interquartile ranges did not overlap, an IQ score of 3 would be assigned. If interquartile ranges overlapped but did not exceed the median values, an IQ score of 2 would be assigned. If one median fell in the range of the other box, an IQ score of 1 would be assigned. If both medians fell in the range of the other box, a score of 0 would be assigned [45]. Metrics with high discriminatory power (IQ ≥ 2) were further screened. Third, the redundancy of the remained metrics was evaluated by Pearson correlations. If Pearson’s correlation coefficients were ≥0.75, the metrics were considered redundant. The highest mutually correlated metrics that had the lowest correlation with other metrics were retained.

2.6. Metric Scoring and Wetland Health Assessment

For metrics that had positive relationships with either B-IBI or V-IBI, the 95th percentile of metric values at the reference sites was used as expectation value (“Upper anchor”), while the 5th percentile at the impaired sites was used as threshold value (“Lower anchor”) [46]. The metric was rescaled using the following equation:
M e t r i c   v a l u e = S i t e   v a l u e L o w e r   a n c h o r U p p e r   a n c h o r L o w e r   a n c h o r
For metrics that had negative relationships with either B-IBI or V-IBI, the 5th percentile of values at the reference sites represented the “Upper anchor”, while the 95th percentile at the impaired sites represented the “Lower anchor”. The metrics were then rescaled using the following equation:
M e t r i c   v a l u e = L o w e r   a n c h o r S i t e   v a l u e L o w e r   a n c h o r U p p e r   a n c h o r
If the scaled value was <0 or >1, a value of 0 or 1 would be assigned. This ensured the scaled metric values were varying between 0 and 1. The scaled values of each individual metric were then summed up as the LMI score for a sample site. The LMI score range of all sample sites was divided into equal-sized subranges to present five wetland health categories [47]: “excellent” (equivalent to reference condition), “good” (near the reference level), “fair” (experiencing anthropogenic disturbances), “poor” (under intense anthropogenic disturbances), and “very poor” (ecosystem highly degraded).
Wetland area of Poyang Lake (i.e., the emergent area or area with water depth < 6 m in winter) was divided into 200 m × 200 m grid cells. The selected landscape and remote sensing metrics were calculated at the appropriate spatial scale, scored, and summed as the wetland health score for each grid cell. Grid cells were assigned one of the five health status categories based on its LMI score.

2.7. Assessment Result Validation

We used the local disturbance index (LOD) to validate the LMI assessment results. LOD is an index to measure anthropogenic disturbance intensity through field observations and has been adopted by many published studies for habitat quality assessment [48,49]. This index counted the number of anthropogenic disturbances observed in field, including roads, buildings, channel revetment, cultivated land, mining, pipes, parks and lawns, trash and landfill, pasture, and dikes. It was calculated as:
LOD = k = 1 n 1 D i + 1
where n represents the number of disturbance types observed at a sample site, and Di is the distance of disturbance i (km) to the sample site. If the health scores of sample sites derived from landscape and the remote sensing metrics had significant correlations with LOD, we considered the landscape and remote sensing metrics useful for evaluating wetland condition. All analyses were conducted in statistical software R [50].

3. Results

3.1. Land Uses

The overall accuracy of land use classification was 91.67%. Cultivated land (dry land and paddy fields) was the dominant class, occupying 42.41% of the area of the Poyang Lake region. Forest was another dominant type of land use, accounting for 25.49% of the area (Figure 3). Built-up land was mainly found in the southwestern corner of this region, where a large city (Nanchang City) with nearly 6 million people is located and occupies 5.94% of the total area. Other land cover classes, including grassland, reservoirs, ponds, and bare land, were minor, with coverage ranging from 0.62% to 2.65%. Wetland, lakes, and paddy fields were the main land use classes around the sample sites.

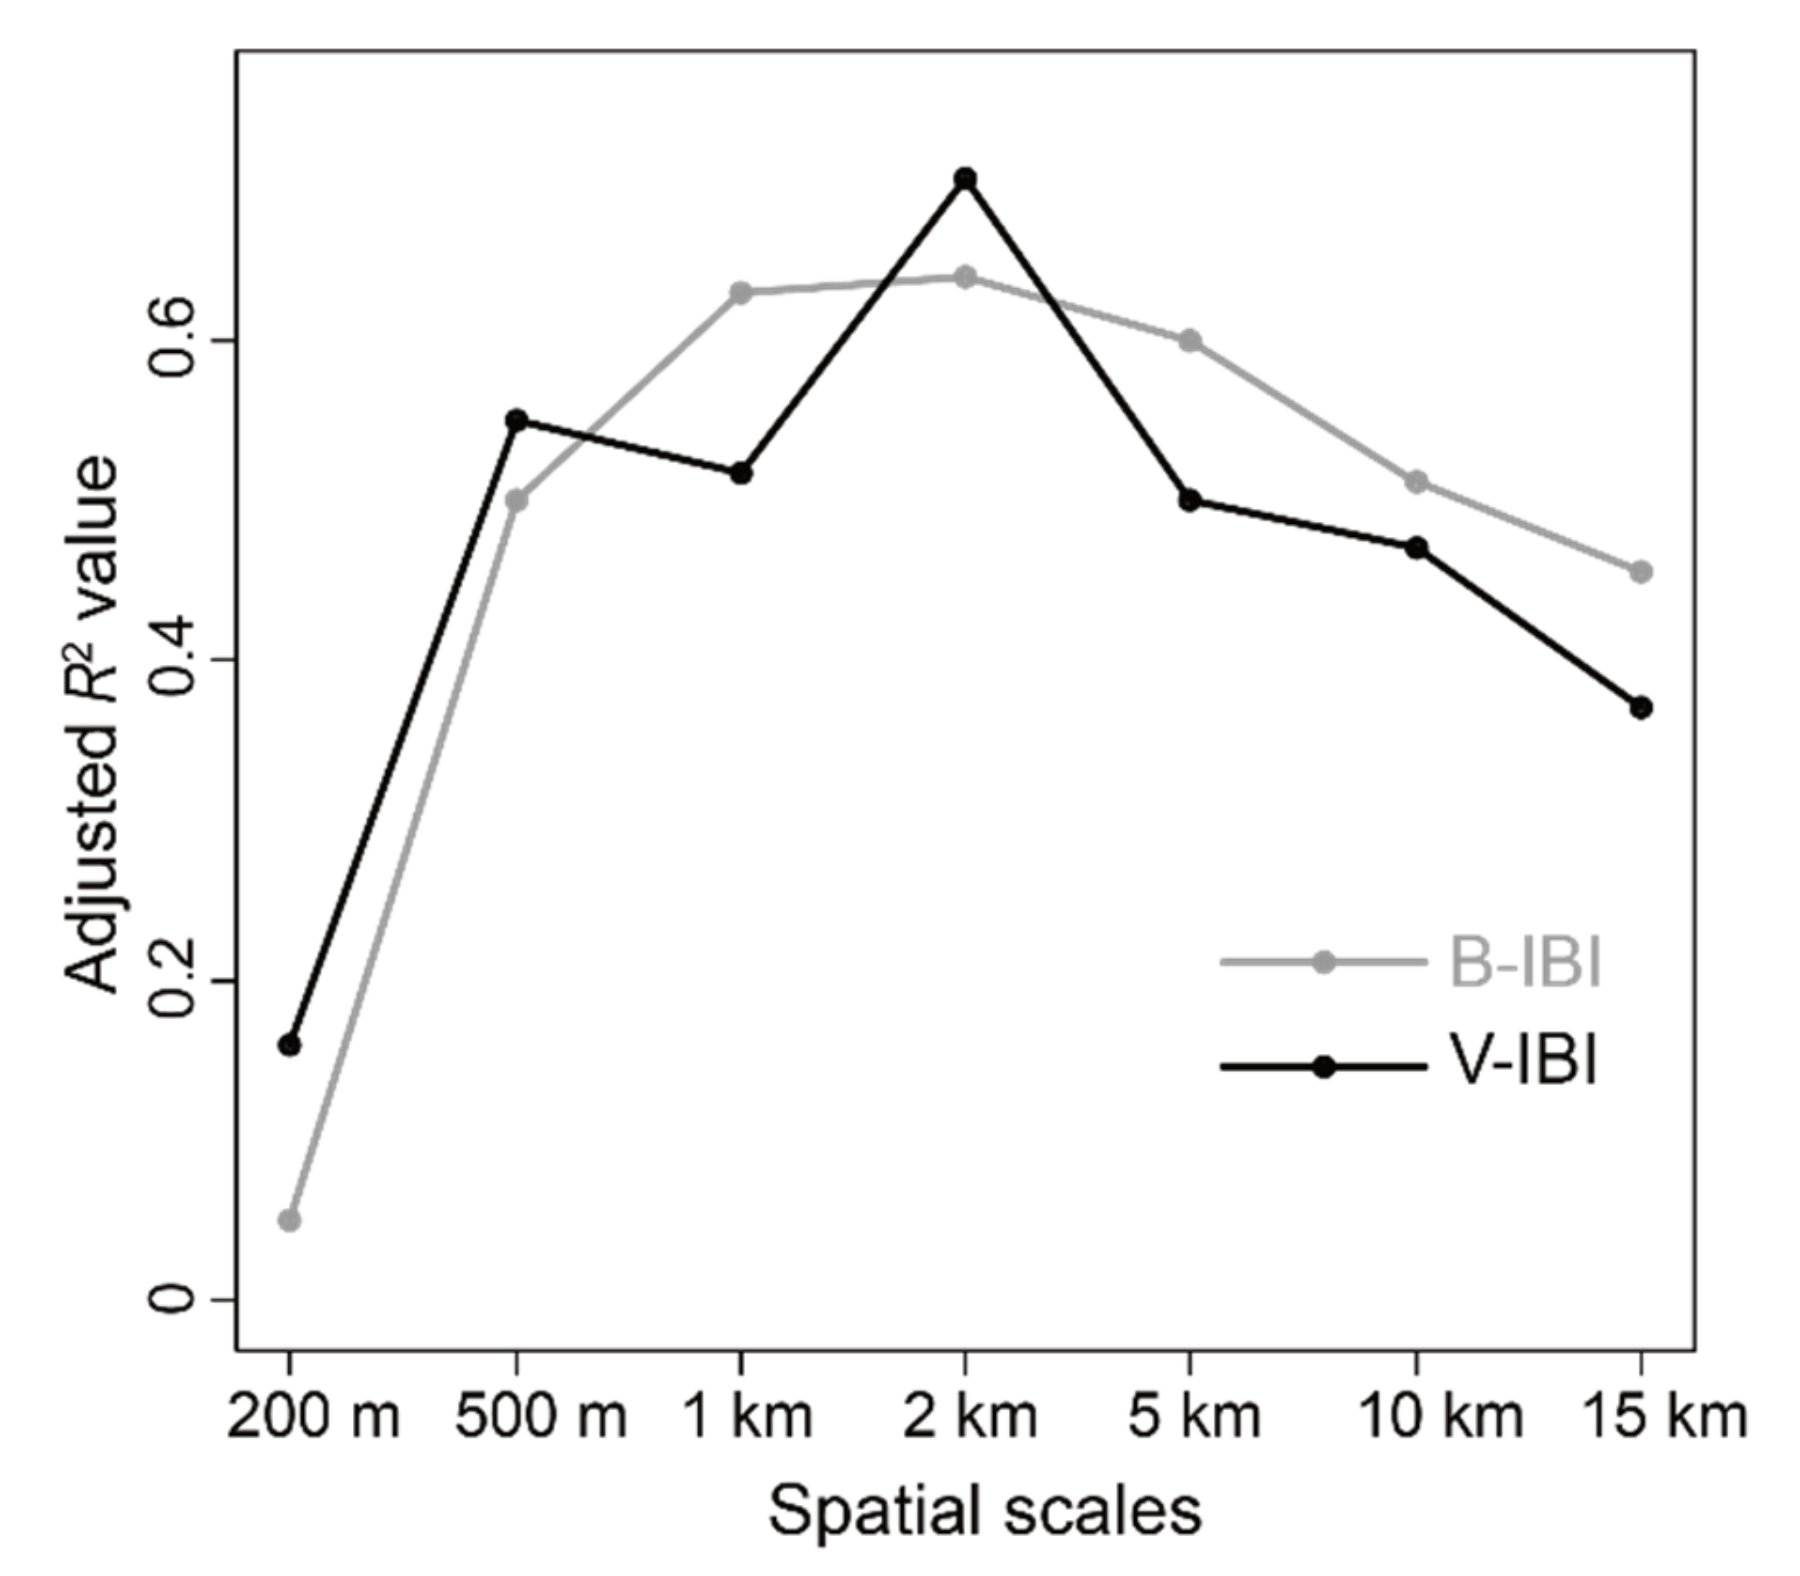
3.2. Explanatory Power of Landscape and Remote Sensing Variables on IBIs

Multivariate regressions were applied to determine the explanatory power of landscape and remote sensing variables of watersheds and different buffer zones on B-IBI and V-IBI. Watershed landscapes explained 57% and 51% of the variation in B-IBI and V-IBI, respectively. Hump-shaped relationships were found between R2 values of multivariate regression models and buffer radii (Figure 4). R2 values of multivariate models for both B-IBI and V-IBI peaked in the 2 km buffer zone (R2 = 0.64 and 0.71, respectively, p < 0.001). Thus, we selected the 2 km buffer zone as the most appropriate spatial scale at which wetland health of Poyang Lake were assessed via landscape and remote sensing indicators.

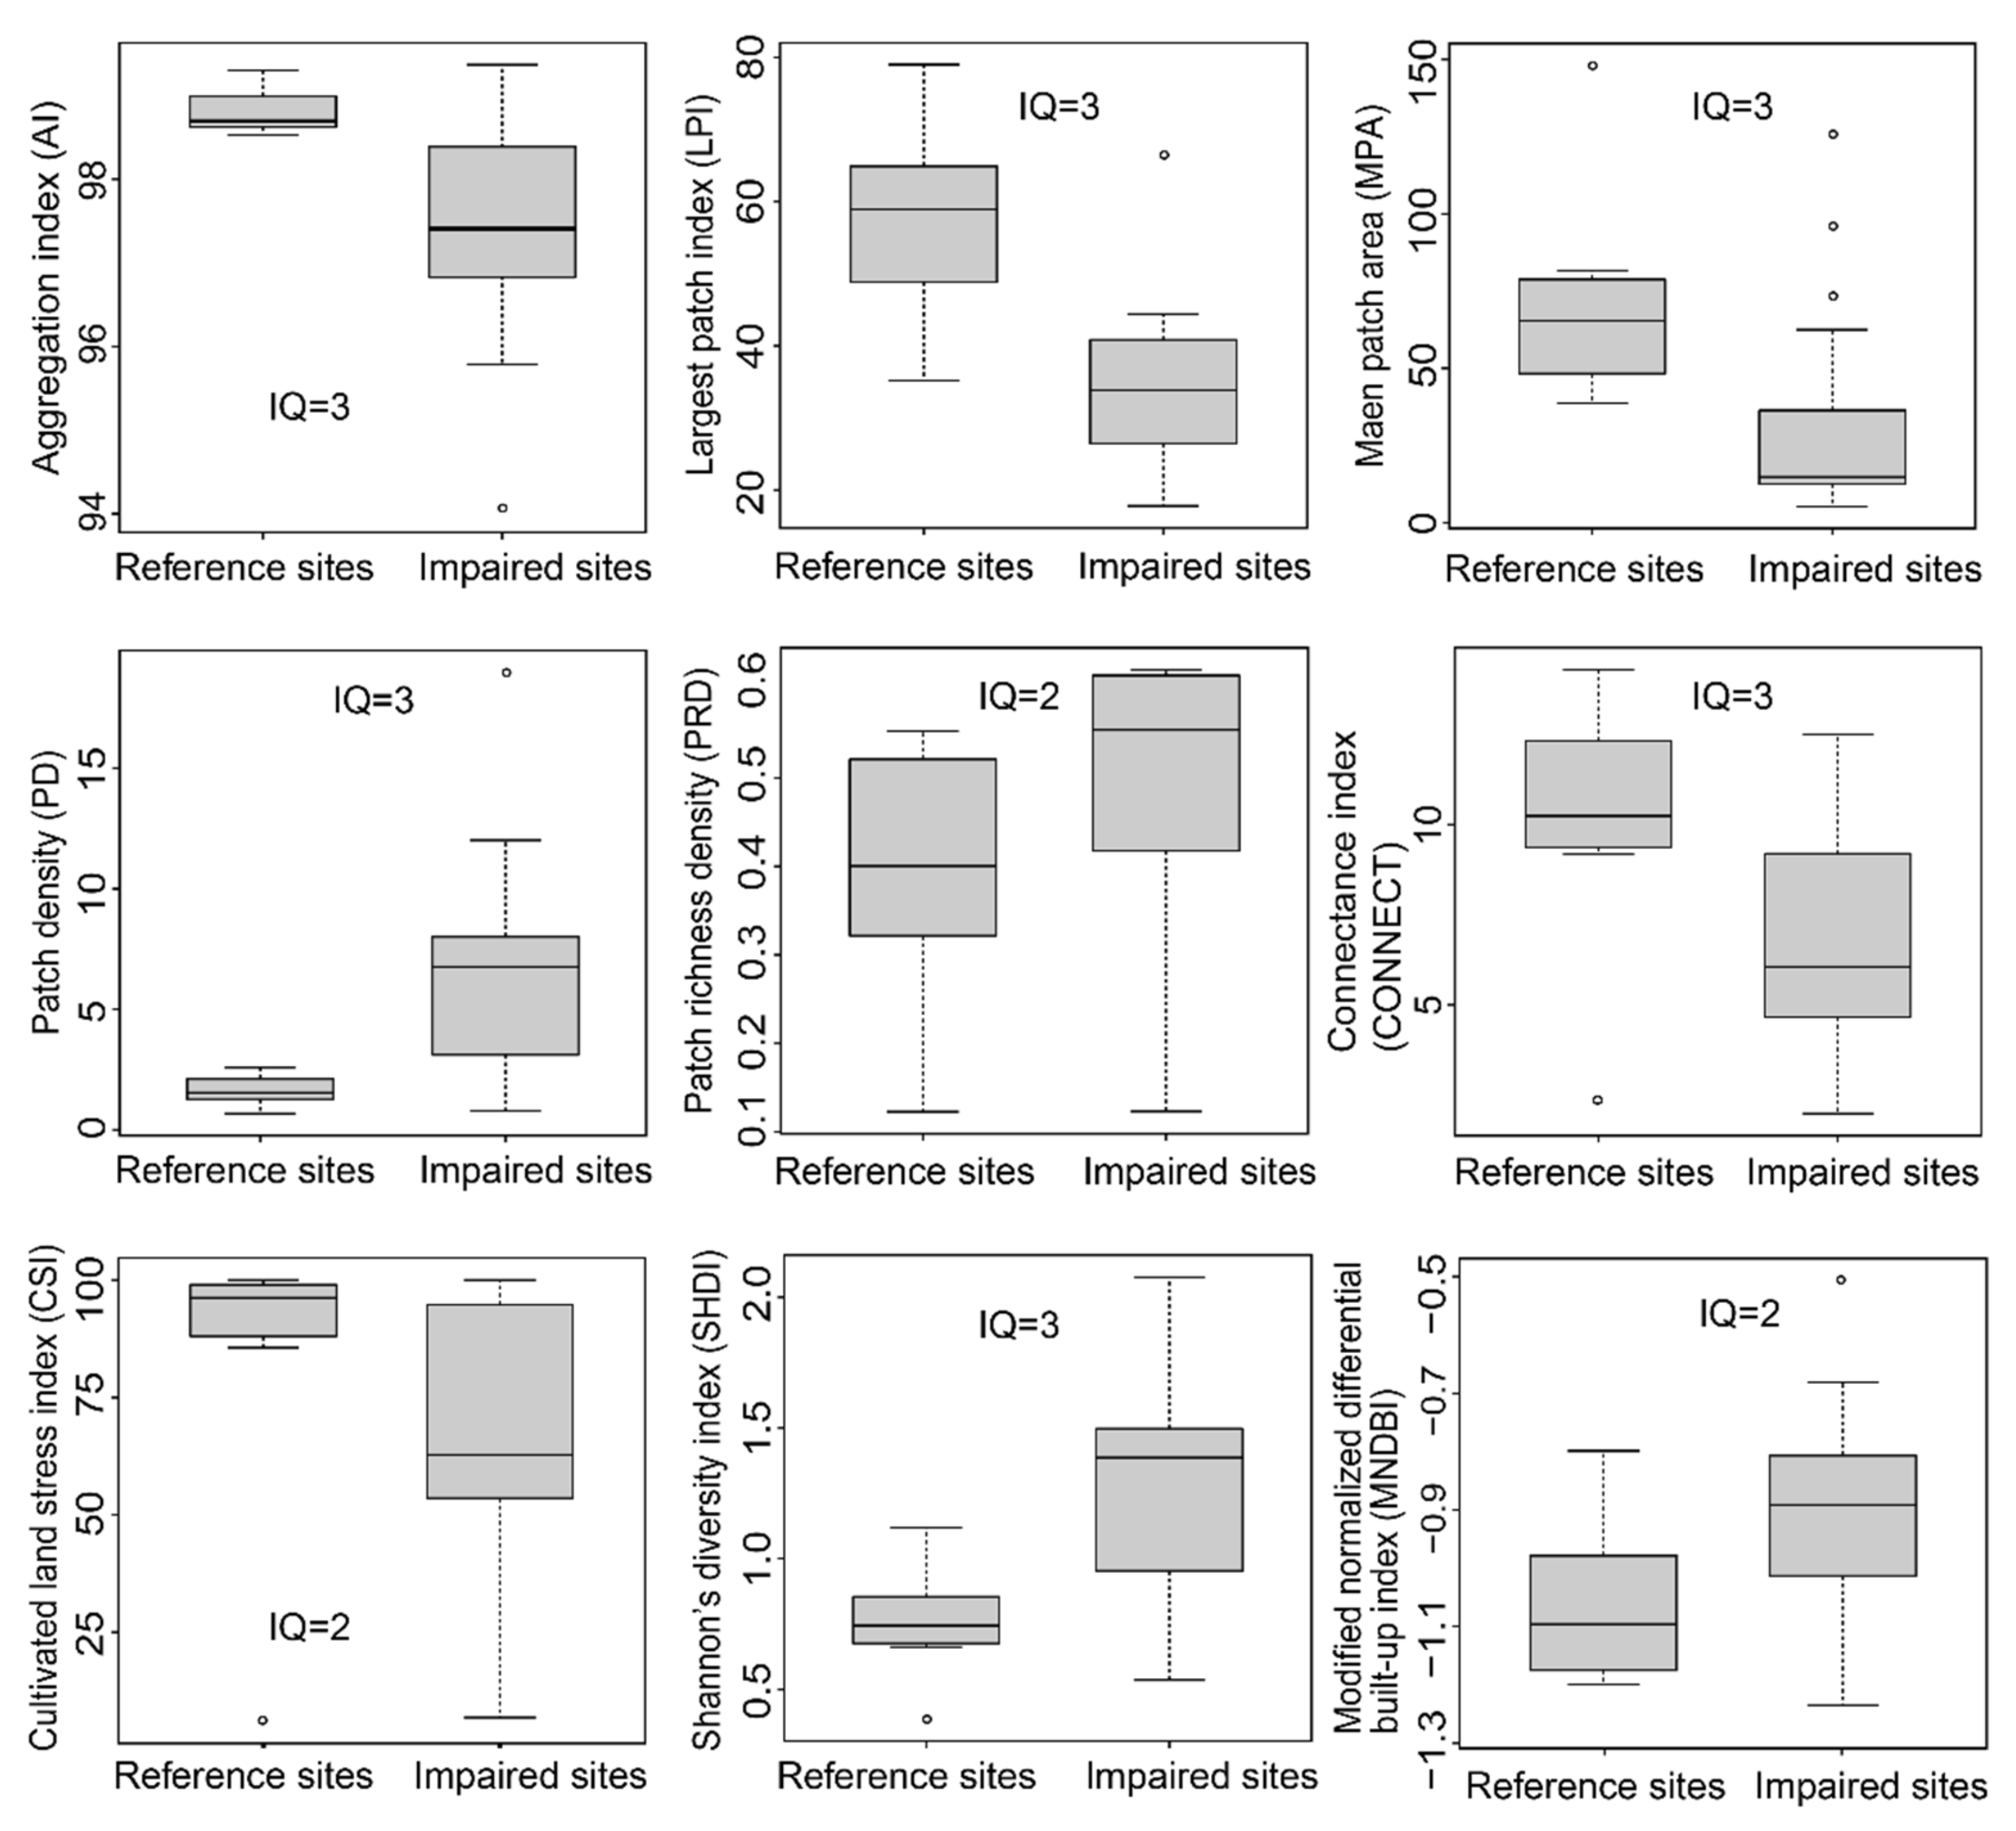
3.3. Metric Selection

Seven of all of the candidate metrics, Shannon’s evenness index (SHEI), hydrological regulation index (HRI), contagion index (CONTAG), mean patch fractal dimension (FRAC_MN), modified normalized difference water index (MNDWI), normalized differential built-up index (NDBI), and normalized differential vegetation index (NDVI), were not significantly correlated with either B-IBI or V-IBI (p ≥ 0.05; Table 2), and were thus rejected. Nine of the retained metrics had IQ scores ≥2, demonstrating the power to discriminate the reference from impaired sites, and were retained (Figure 5). Among the nine metrics, connectance index (CONNECT), largest patch index (LPI), and modified normalized differential built-up index (MNDBI) were not strongly correlated with other candidate metrics (Pearson’s |r| ≤ 0.75; Table 3) and were identified as the core LMI metrics. Mean patch size (AREA_MN), patch density (PD), Shannon’s diversity index (SHDI), aggregation index (AI), and patch richness density (PRD) had strong correlations with each other (r > 0.75, p < 0.001; Table 3), while AREA_MN, cultivated land stress index (CSI), PD, and PRD were also highly mutually correlated (r > 0.75; Table 3). Only CSI, AI, and SHDI were retained for subsequent analyses, because the other three metrics (AREA_MN, PD, and PRD) were highly correlated with all six candidate metrics. AI and SHDI were also highly correlated (r > 0.75). SHDI was retained because SHDI was more strongly correlated with B-IBI and V-IBI (r = −0.48 and −0.56, respectively, p < 0.01; Table 2) than AI (r = 0.36 and 0.40, respectively, p < 0.05). Finally, five metrics (CONNECT, CSI, LPI, SHDI, and MNDBI) that were not strongly correlated to each other were selected as the LMI metrics on which wetland health of Poyang Lake was assessed.

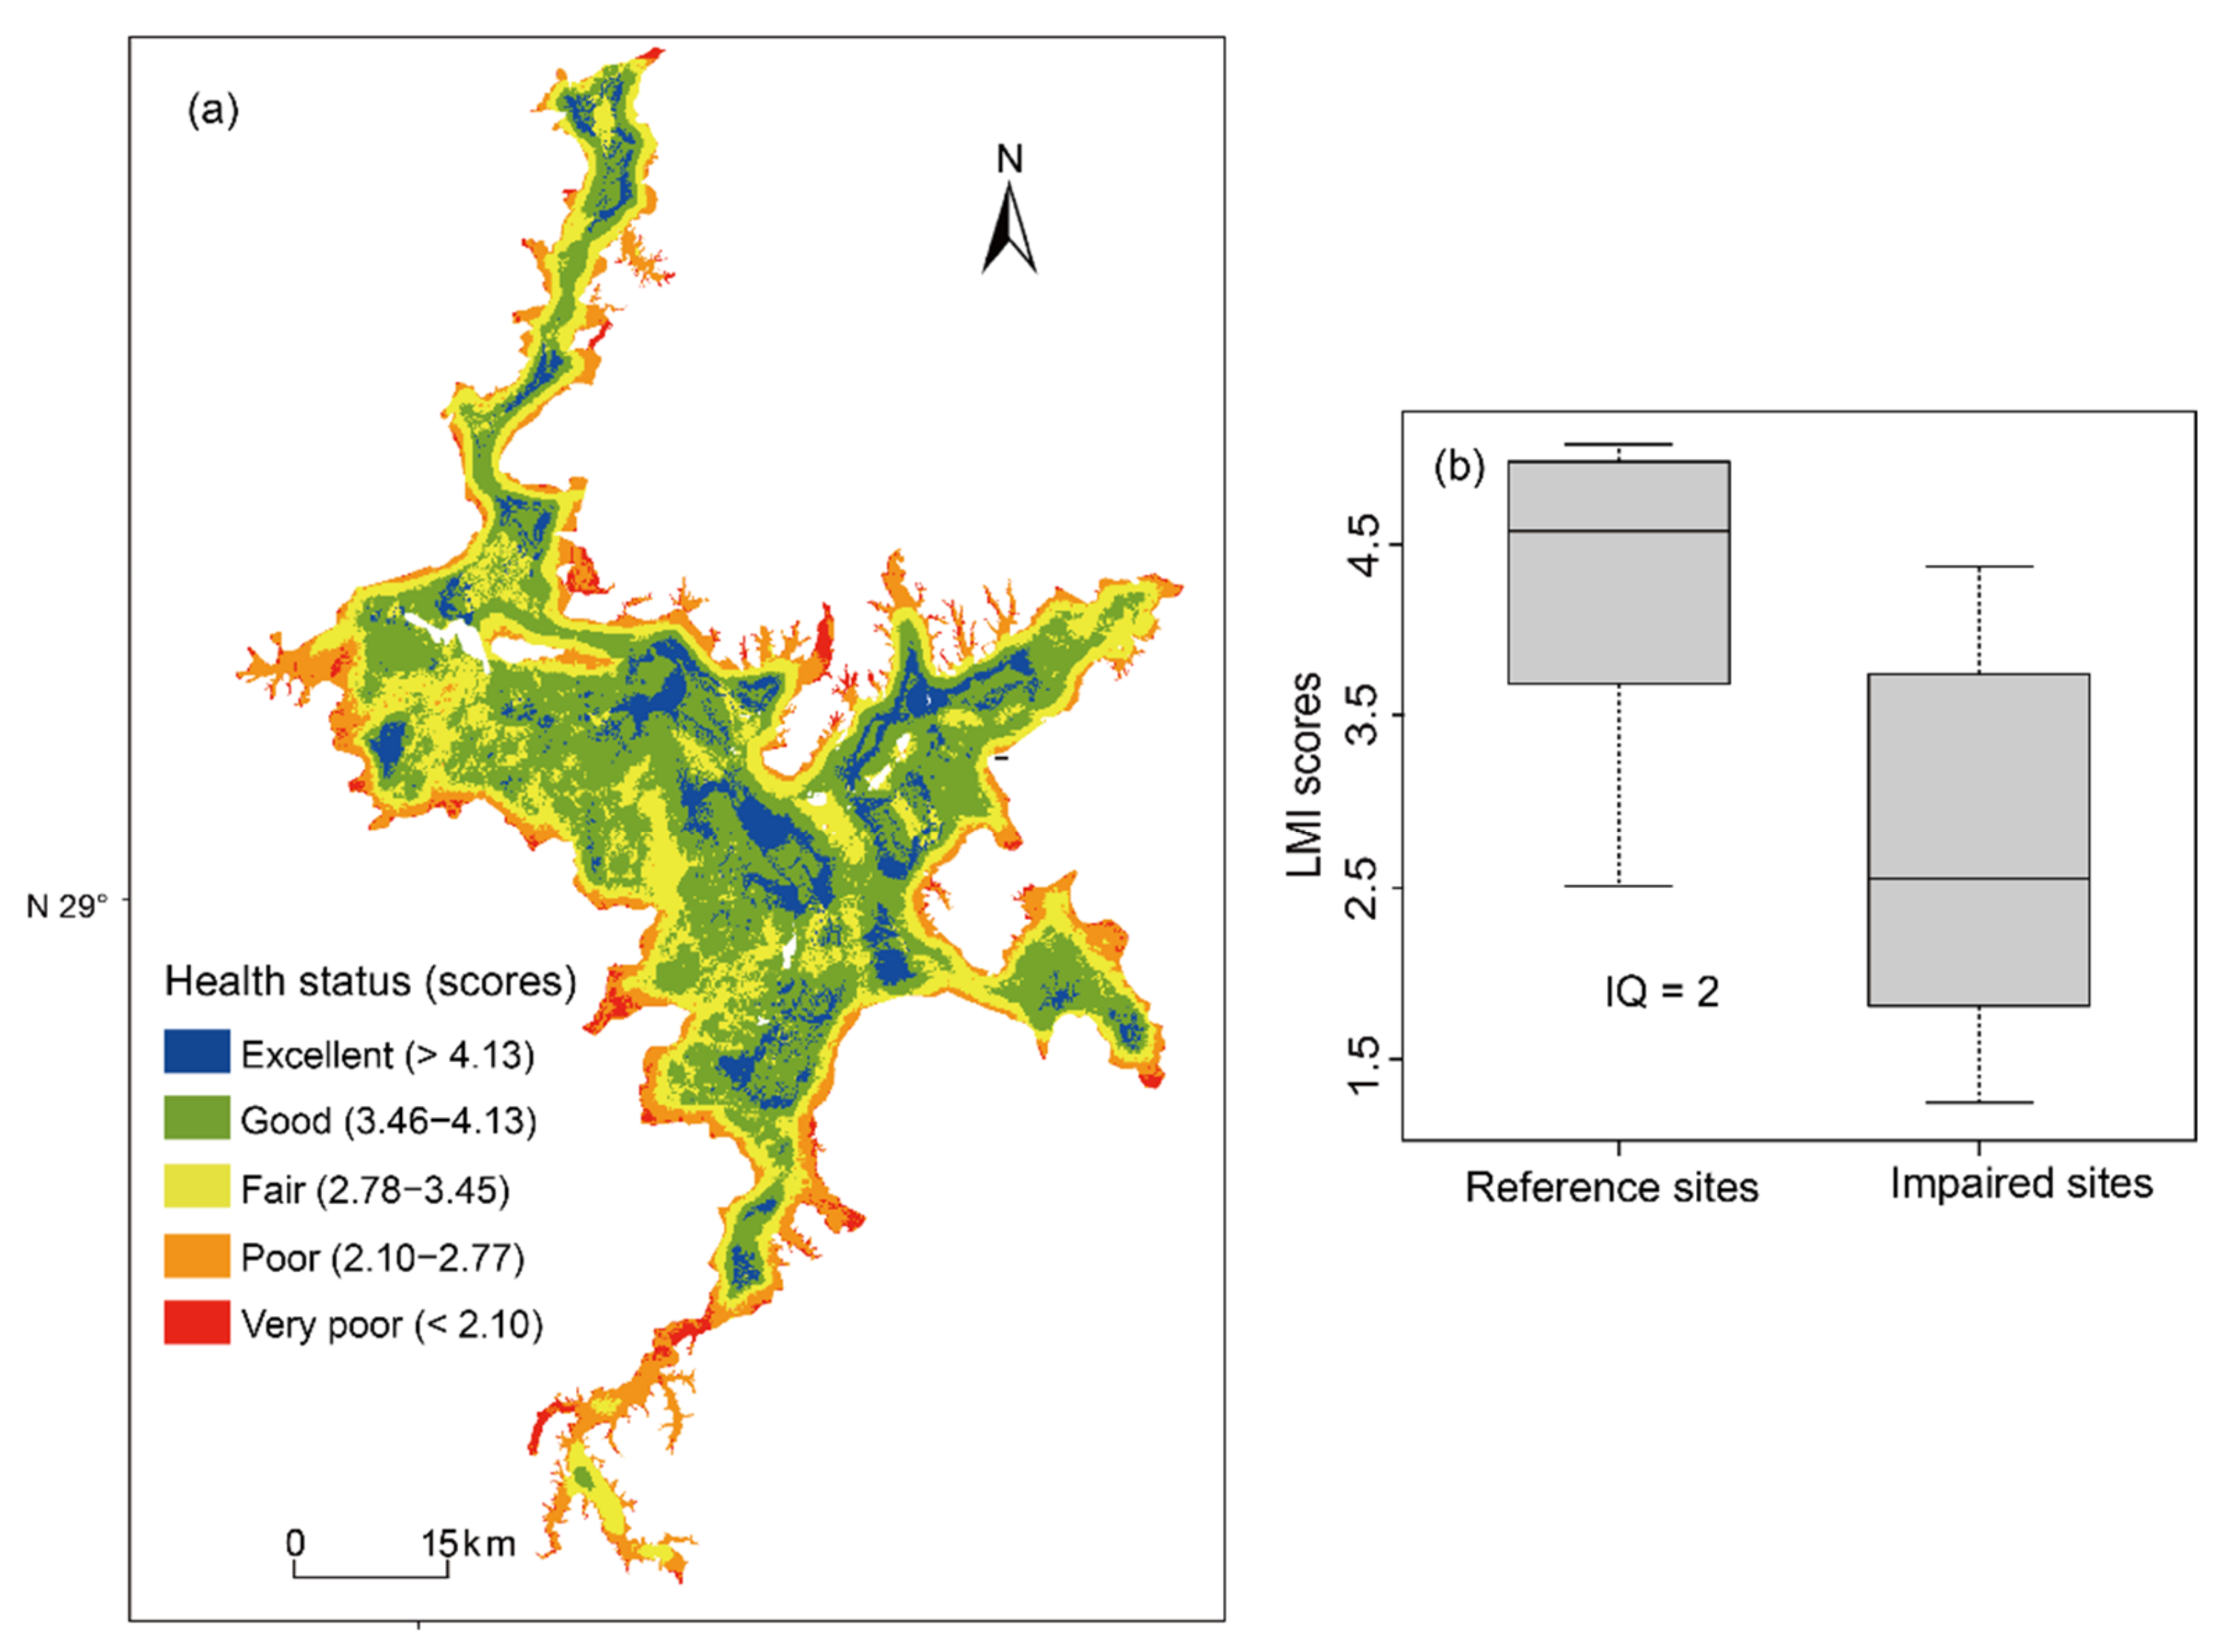
3.4. Wetland Health Assessment

The LMI scores of Poyang Lake varied between 1.05 and 5.00, with a mean of 3.25. A total of 10% of the total area was rated as excellent, 38% was good, 27% was fair, 18% was poor, and 7% was very poor (Figure 6a). Areas rated as excellent or good were generally in the inner parts of the lake, whereas areas rated as poor or very poor were mostly along the lakeshore. The overall status of the wetland was assessed as fair according to the mean LMI score. There was a striking difference (IQ = 2) in LMI scores between reference and impaired sites (Figure 6b). LMI scores were significantly correlated with B-IBI, V-IBI, and LOD at the 30 sample sites (Pearson’s r = 0.56, 0.50, and 0.59, respectively, p < 0.001; Figure 7), indicating that the LMI can be used as the surrogate for field-based wetland health assessment.

4. Discussion

4.1. Landscape and Remote Sensing Metrics

Four landscape (LPI, CONNECT, SHDI, and CSI) and one remote sensing (MNDBI) metric were selected as the LMI metrics to evaluate the condition of the Poyang Lake wetland. LPI quantifies the percent of the area that is occupied by the largest patch and indicates dominance [51]. CONNECT measures landscape connectivity that can facilitate the movement of environment elements (e.g., water) and biological organisms from one patch to another [52,53]. LPI and CONNECT showed positive relationships with IBIs (Table 2), indicating that higher LPI and CONNECT values are linked to better health. The landscapes around the sample sites in Poyang Lake were dominated by natural wetlands and lake area (Figure 1 and Figure 3). Our results suggest that a higher dominance of natural wetlands and lake area and better connectivity of habitat patches indicate a healthier status. This is because a higher percent of natural wetlands and lake area suggests a lower proportion of human-altered land use in the landscape. Connectivity is a mechanism that supports ecological processes in wetlands [54]. It is important to improve the connectivity of habitat patches because it helps increase the resistance of spatially structured organism populations to external disturbances.
SHDI measures the diversity of patches in the landscape. Our results showed that SHDI had a negative relationship with the IBIs (Table 2). This result indicates that more diversified landscapes are associated with poorer health conditions, likely because increased patch diversity means that human-altered land use types have also increased (e.g., cultivated and built-up land). CSI and MNDBI represent the percentages of cultivated land and impervious surface (including highway, and roads, and built-up land) in the landscape, respectively. The Poyang Lake region is a main rice-producing area in China and has been densely populated for decades. Agricultural and municipal wastewater causes severe environmental pollution in Poyang Lake and increases nitrogen and phosphorus in water [39,55]. The negative relationships that CSI and MNDBI had with IBIs (Table 2) indicate that reducing agricultural and impervious land cover in the surrounding landscape is important for improving the condition of the Poyang Lake wetland.
This study demonstrates significant links between landscape characteristics and wetland biotic integrity, which may validate the utility of satellite imagery-derived metrics for assessing wetland health. Compared with field-based biological methods (e.g., IBI methods) that are usually labor intensive and time consuming, landscape and remote sensing indicators derived from satellite imagery provide a cost- and time-efficient method for wetland assessment and monitoring. As a contrast to biological methods that can only assess the condition of individual sample sites, the LMI is robust enough to predict the wetland health of the entire study area at a relatively fine spatial resolution. This advantage should be particularly useful for identifying specific areas that appear stressed and warrant further management. The LMI method can provide a quick and simple method for land managers and environmental planners to assess broad areas of land, and to implement long-term and high-frequency monitoring on the Poyang Lake wetland, especially due to its low cost of money and time.

4.2. Spatial Scales for Wetland Health Assessment

We found that landscapes within the 2 km buffer zone of sample sites had the strongest explanatory power on the IBIs (Figure 4). The result is in line with previous findings that marsh bird and amphibian assemblages are more sensitive to smaller-scale (≤1 km) disturbances in the Great Lakes [56]. This is likely because land use and human disturbance at local scales directly influence habitat quality [57], while the effects at larger spatial scales are mainly mediated through processes (e.g., surface runoff) that are likely to be affected by other factors including topography, soil properties, and vegetation cover. This result differs from the studies that indicate that watershed landscape has a stronger impact on river water quality than does riparian buffer zone [58,59]. The landscape around Poyang Lake is relatively flat and well-covered with vegetation, which may slow the surface runoff and mitigate the effects of the watershed landscape on the wetland [60,61]. Our results suggest that protecting landscapes around Poyang Lake at small scales (≤2 km; for example, reducing cultivated and impervious land-cover) is important for conserving the entire wetland [62].

4.3. Wetland Health Assessment in the Poyang Lake

Wetland health of Poyang Lake was, in general, assessed as “fair” (Figure 6), which is consistent with the assessment results using the B-IBI [42]. The areas near the lakeshore were mostly assessed as poor or very poor because of stronger human disturbances in these areas, while the less accessible inner areas were in better condition. The problem with using the LMI to assess wetland health is that environmental degradation caused by point sources of pollution cannot be detected. For example, the IBIs suggested that the sample sites in the estuarine wetlands generally had poor health because wetland health was strongly negatively affected by the pollutants from rivers [19,42]. Nevertheless, IBIs were still significantly correlated with the LMI scores (Figure 7), suggesting that the LMI can be used as the surrogate for field-based wetland health assessment [63].

5. Conclusions

Five landscape and remote sensing metrics (LPI, CONNECT, SHDI, CSI, and MNDBI) were selected as the LMI metrics, based on their correlation with the IBIs and their discriminative ability between reference and impaired sites. Landscapes have stronger explanatory power on the IBIs at smaller (≤2 km) than at larger spatial scales, which indicates that protecting landscapes at local scales around Poyang Lake (e.g., reducing the percentage of agricultural and impervious land cover) is crucial to conserve the wetland. The overall health of the wetland was assessed as “fair” according to the LMI scores. The areas near the lakeshore are mainly in fair or poor condition, while the less accessible inner areas are in better condition.
This study demonstrates significant links between landscape characteristics and wetland biotic integrity, which validates the utility of satellite imagery-derived data in assessing wetland health. Wetland assessments using landscape-based metrics are more cost and time efficient and have better spatial coverage than biological methods. The LMI index developed here could be used as a powerful tool for land managers by providing quick and effective methods to assess broad areas of Poyang Lake, and to identify the areas that appear stressed, which will enable funds to be reserved for more in-depth analyses in areas identified as poor or very poor. By correlating field-based biological indices with satellite imagery-derived metrics, this study represents an example of a landscape-based multi-metric index developed to assess the health status of aquatic ecosystems.

Author Contributions

Conceptualization, D.L., L.L., W.Y., Q.Y., M.J., G.L. and M.C.; methodology, D.L., L.L., Q.H., M.J., M.C., B.Y., Y.X. and J.Z.; software, D.L., L.L. and W.Y.; validation, D.L., L.L., M.J., Y.X., W.Y., Y.X. and J.Z.; formal analysis, D.L., L.L., W.Y., Q.Y., Q.H., Y.X. and J.Z.; investigation, D.L., L.L., Q.H., G.L., M.J. and W.Y.; resources, D.L., L.L., Q.Y. and W.Y.; data curation, Y.X., J.Z., G.L., D.L., J.Z, L.L., M.C., B.Y. and Y.X.; writing—original draft preparation, W.Y., Q.Y., D.L., L.L., M.J., Y.X., J.Z. and Q.H.; writing—review and editing, M.J., G.L., W.Y., Q.Y., D.L., L.L., M.C. and B.Y.; visualization, D.L. and B.Y.; supervision, W.Y.; project administration, M.J., Q.H., W.Y. and Q.Y.; funding acquisition, Q.Y., W.Y. and Q.H. All authors have read and agreed to the published version of the manuscript.

Funding

This research was funded by the National Natural Science Foundation of China under award numbers 41967055, 41561097, and 32060275. This study was also funded by the Natural Science Foundation of Jiangxi Province, grants 20212BAB203023 and 20212ACB203006.

Institutional Review Board Statement

Not Applicable.

Informed Consent Statement

Not Applicable.

Data Availability Statement

The biological and environmental data presented in this study are available from the corresponding author upon reasonable request. Landsat imageries were obtained from the United States Geological Survey (USGS) website (https://earthexplorer.usgs.gov; assessed on 23 December 2019). Elevation data were obtained from a global digital elevation model (DEM, https://www.usgs.gov/centers/eros/science/usgs-eros-archive-digital-elevation-global-30-arc-second-elevation-gtopo30?qt-science_center_objects=0#qt-science_center_objects; assessed on 2 November 2019).

Acknowledgments

We would like to thank Adam Thomas Devlin at Jiangxi Normal University and Elizabeth Tokarz at Yale University for their assistance with English language and grammatical editing.

Conflicts of Interest

The authors declare no conflict of interest.

References

  1. Costanza, R.; d’Arge, R.; De Groot, R.; Farber, S.; Grasso, M.; Hannon, B.; Limburg, K.; Naeem, S.; O’neill, R.V.; Paruelo, J. The value of the world’s ecosystem services and natural capital. Nature 1997, 387, 253–260. [Google Scholar] [CrossRef]
  2. Davidson, N.C. How much wetland has the world lost? Long-term and recent trends in global wetland area. Mar. Freshw. Res. 2014, 65, 934–941. [Google Scholar] [CrossRef]
  3. Zedler, J.B.; Kercher, S. Wetland resources: Status, trends, ecosystem services, and restorability. Annu. Rev. Environ. Resour. 2005, 30, 39–74. [Google Scholar] [CrossRef] [Green Version]
  4. Hasan, S.S.; Zhen, L.; Miah, M.G.; Ahamed, T.; Samie, A. Impact of land use change on ecosystem services: A review. Environ. Dev. 2020, 34, 100527. [Google Scholar] [CrossRef]
  5. Cheng, X.; Chen, L.; Sun, R.; Kong, P. Land use changes and socio-economic development strongly deteriorate river ecosystem health in one of the largest basins in China. Sci. Total Environ. 2018, 616–617, 376–385. [Google Scholar] [CrossRef] [PubMed]
  6. Xie, X.; Fang, B.; Xu, H.; He, S.; Li, X. Study on the coordinated relationship between Urban Land use efficiency and ecosystem health in China. Land Use Policy 2021, 102, 105235. [Google Scholar] [CrossRef]
  7. Yu, G.; Yu, Q.; Hu, L.; Zhang, S.; Fu, T.; Zhou, X.; He, X.; Liu, Y.A.; Wang, S.; Jia, H. Ecosystem health assessment based on analysis of a land use database. Appl. Geogr. 2013, 44, 154–164. [Google Scholar] [CrossRef]
  8. Peng, J.; Liu, Y.; Li, T.; Wu, J. Regional ecosystem health response to rural land use change: A case study in Lijiang City, China. Ecol. Indic. 2017, 72, 399–410. [Google Scholar] [CrossRef]
  9. Jafary, P.; Sarab, A.A.; Tehrani, N.A. Ecosystem health assessment using a Fuzzy Spatial Decision Support System in Taleghan watershed before and after dam construction. Environ. Process. 2018, 5, 807–831. [Google Scholar] [CrossRef]
  10. Ruaro, R.; Gubiani, É.A.; Hughes, R.M.; Mormul, R.P. Global trends and challenges in multimetric indices of biological condition. Ecol. Indic. 2020, 110, 105862. [Google Scholar] [CrossRef]
  11. Stoddard, J.L.; Herlihy, A.T.; Peck, D.V.; Hughes, R.M.; Whittier, T.R.; Tarquinio, E. A process for creating multimetric indices for large-scale aquatic surveys. J. N. Am. Benthol. Soc. 2008, 27, 878–891. [Google Scholar] [CrossRef]
  12. Ruaro, R.; Gubiani, É.A. A scientometric assessment of 30 years of the Index of Biotic Integrity in aquatic ecosystems: Applications and main flaws. Ecol. Indic. 2013, 29, 105–110. [Google Scholar] [CrossRef]
  13. Xu, L.; Yang, W.; You, Q.; Yang, T.; Huang, Q.; Wang, Y. The recent advances in applications of index of biotic integrity on the assessment of wetland ecological health. Jiangxi Norm. Univ. (Nat. Sci. Ed.) 2017, 41, 104–109. [Google Scholar]
  14. Angel Martínez-Morales, M. Landscape patterns influencing bird assemblages in a fragmented neotropical cloud forest. Biol. Conserv. 2005, 121, 117–126. [Google Scholar] [CrossRef]
  15. Pyne, M.I.; Rader, R.B.; Christensen, W.F. Predicting local biological characteristics in streams: A comparison of landscape classifications. Freshw. Biol. 2007, 52, 1302–1321. [Google Scholar] [CrossRef]
  16. Hrodey, P.; Sutton, T.; Frimpong, E.; Simon, T. Land-use impacts on watershed health and integrity in Indiana warmwater streams. Am. Midl. Nat. 2009, 161, 76–95. [Google Scholar] [CrossRef]
  17. Han, X.; Chen, X.; Feng, L. Four decades of winter wetland changes in Poyang Lake based on Landsat observations between 1973 and 2013. Remote Sens. Environ. 2015, 156, 426–437. [Google Scholar] [CrossRef]
  18. You, Q.; Fang, N.; Jian, M.; Hu, Q.; Yao, B.; Liu, D.; Yang, W. A reliability-resilience-vulnerability framework for measuring the influence of changes in water level fluctuations on lake conditions. Ecol. Indic. 2022, 134, 108468. [Google Scholar] [CrossRef]
  19. Yang, W.; You, Q.; Fang, N.; Xu, L.; Zhou, Y.; Wu, N.; Ni, C.; Liu, Y.; Liu, G.; Yang, T.; et al. Assessment of wetland health status of Poyang Lake using vegetation-based indices of biotic integrity. Ecol. Indic. 2018, 90, 79–89. [Google Scholar] [CrossRef]
  20. Li, Y.; Zhang, Q.; Cai, Y.; Tan, Z.; Wu, H.; Liu, X.; Yao, J. Hydrodynamic investigation of surface hydrological connectivity and its effects on the water quality of seasonal lakes: Insights from a complex floodplain setting (Poyang Lake, China). Sci. Total Environ. 2019, 660, 245–259. [Google Scholar] [CrossRef]
  21. Zhang, Q.; Ye, X.-C.; Werner, A.D.; Li, Y.-L.; Yao, J.; Li, X.-H.; Xu, C.-Y. An investigation of enhanced recessions in Poyang Lake: Comparison of Yangtze River and local catchment impacts. J. Hydrol. 2014, 517, 425–434. [Google Scholar] [CrossRef] [Green Version]
  22. Zhang, Q.; Xiao, M.; Li, J.; Singh, V.P.; Wang, Z. Topography-based spatial patterns of precipitation extremes in the Poyang Lake basin, China: Changing properties and causes. J. Hydrol. 2014, 512, 229–239. [Google Scholar] [CrossRef]
  23. Tang, X.; Li, H.; Xu, X.; Yang, G.; Liu, G.; Li, X.; Chen, D. Changing land use and its impact on the habitat suitability for wintering Anseriformes in China’s Poyang Lake region. Sci. Total Environ. 2016, 557–558, 296–306. [Google Scholar] [CrossRef]
  24. Ye, X.; Zhang, Q.; Bai, L.; Hu, Q. A modeling study of catchment discharge to Poyang Lake under future climate in China. Quat. Int. 2011, 244, 221–229. [Google Scholar] [CrossRef]
  25. Luo, Z.; Shi, X.; Han, L.; Nie, L. A study on carbon emission effects of changes in land use in poyang lake region. Acta Agric. Univ. Jiangxiensis 2013, 35, 1074–1081. [Google Scholar] [CrossRef]
  26. Zhong, Y.; Lu, Y. The coupling relationship between population and economic in Poyang Lake ecological economic zone. Econ. Geogr. 2011, 31, 195–200. [Google Scholar] [CrossRef]
  27. Zhang, X.; Yi, Y.; Yang, Z. The long-term changes in food web structure and ecosystem functioning of a shallow lake: Implications for the lake management. J. Environ. Manag. 2022, 301, 113804. [Google Scholar] [CrossRef]
  28. He, Y.; Che, T.; Wang, Y. Ecological footprint and endogenous economic growth in the Poyang Lake Area in China based on empirical analysis of panel data model. J. Resour. Ecol. 2012, 3, 367–372. [Google Scholar] [CrossRef]
  29. Sun, C.; Zhen, L.; Giashuddin Miah, M. Comparison of the ecosystem services provided by China’s Poyang Lake wetland and Bangladesh’s Tanguar Haor wetland. Ecosyst. Serv. 2017, 26, 411–421. [Google Scholar] [CrossRef]
  30. Herlihy, A.T.; Larsen, D.P.; Paulsen, S.G.; Urquhart, N.S.; Rosenbaum, B.J. Designing a spatially balanced, randomized site selection process for regional stream surveys: The EMAP Mid-Atlantic pilot study. Environ. Monit. Assess. 2000, 63, 95–113. [Google Scholar] [CrossRef]
  31. Ministry of Environmental Protection of the People’s Republic of China. Standard Methods for the Analysis of Water and Wastewater; China Environmental Science Press: Beijing, China, 2012.
  32. Shawul, A.A.; Chakma, S. Spatiotemporal detection of land use/land cover change in the large basin using integrated approaches of remote sensing and GIS in the Upper Awash basin, Ethiopia. Environ. Earth Sci. 2019, 78, 141. [Google Scholar] [CrossRef]
  33. García-Llamas, P.; Suárez-Seoane, S.; Fernández-Guisuraga, J.M.; Fernández-García, V.; Fernández-Manso, A.; Quintano, C.; Taboada, A.; Marcos, E.; Calvo, L. Evaluation and comparison of Landsat 8, Sentinel-2 and Deimos-1 remote sensing indices for assessing burn severity in Mediterranean fire-prone ecosystems. Int. J. Appl. Earth Obs. Geoinf. 2019, 80, 137–144. [Google Scholar] [CrossRef]
  34. Sun, T.; Lin, W.; Chen, G.; Guo, P.; Zeng, Y. Wetland ecosystem health assessment through integrating remote sensing and inventory data with an assessment model for the Hangzhou Bay, China. Sci. Total Environ. 2016, 566, 627–640. [Google Scholar] [CrossRef]
  35. Saha, T.K.; Pal, S. Exploring physical wetland vulnerability of Atreyee river basin in India and Bangladesh using logistic regression and fuzzy logic approaches. Ecol. Indic. 2019, 98, 251–265. [Google Scholar] [CrossRef]
  36. Gupta, S.; Islam, S.; Hasan, M.M. Analysis of impervious land-cover expansion using remote sensing and GIS: A case study of Sylhet sadar upazila. Appl. Geogr. 2018, 98, 156–165. [Google Scholar] [CrossRef]
  37. Mcgarigal, K.S.; Cushman, S.A.; Neel, M.C.; Ene, E. FRAGSTATS: Spatial Pattern Analysis Program for Categorical Maps. Available online: https://www.fs.usda.gov/treesearch/pubs/3064 (accessed on 4 July 2020).
  38. Ministry of Environmental Protection of the People’s Republic of China. Environmental Quality Standard for Surface Water (GB3838-2002). Available online: http://mee.gov.cn/ywgz/fgbz/bz/bzwb/shjbh/shjzlbz/200206/W020061027509896672057.pdf (accessed on 15 March 2018).
  39. Fang, N.; Liu, L.; You, Q.; Tian, N.; Wu, Y.; Yang, W. Effects of land use types at different spatial scales on water quality in Poyang Lake wetland. Environ. Sci. 2019, 40, 5348–5357. [Google Scholar]
  40. Chen, X.; Zhang, Y.; Zhang, L.; Chen, L.; Lu, J. Distribution characteristic of nitrogen and phosphorus in Lake Poyang during high water period. J. Lake Sci. 2013, 25, 643–648. [Google Scholar]
  41. Huang, Q.; Gao, J.; Cai, Y.; Yin, H.; Gao, Y.; Zhao, J.; Liu, L.; Huang, J. Development and application of benthic macroinvertebrate-based multimetric indices for the assessment of streams and rivers in the Taihu Basin, China. Ecol. Indic. 2015, 48, 649–659. [Google Scholar] [CrossRef]
  42. You, Q.; Yang, W.; Jian, M.; Hu, Q. A comparison of metric scoring and health status classification methods to evaluate benthic macroinvertebrate-based index of biotic integrity performance in Poyang Lake wetland. Sci. Total Environ. 2021, 761, 144112. [Google Scholar] [CrossRef] [PubMed]
  43. Johnson, J.B.; Omland, K.S. Model selection in ecology and evolution. Trends Ecol. Evol. 2004, 19, 101–108. [Google Scholar] [CrossRef] [PubMed]
  44. Uzarski, D.G.; Burton, T.M.; Cooper, M.J.; Ingram, J.W.; Timmermans, S.T. Fish habitat use within and across wetland classes in coastal wetlands of the five Great Lakes: Development of a fish-based index of biotic integrity. J. Great Lakes Res. 2005, 31, 171–187. [Google Scholar] [CrossRef]
  45. Barbour, M.; Gerritsen, J.; Griffith, G.; Frydenborg, R.; McCarron, E.; White, J.; Bastian, M. A framework for biological criteria for Florida streams using benthic macroinvertebrates. J. N. Am. Benthol. Soc. 1996, 15, 185–211. [Google Scholar] [CrossRef]
  46. Vander Laan, J.J.; Hawkins, C.P.; Olson, J.R.; Hill, R.A. Linking land use, in-stream stressors, and biological condition to infer causes of regional ecological impairment in streams. Freshw. Sci. 2013, 32, 801–820. [Google Scholar] [CrossRef] [Green Version]
  47. Couceiro, S.R.M.; Hamada, N.; Forsberg, B.R.; Pimentel, T.P.; Luz, S.L.B. A macroinvertebrate multimetric index to evaluate the biological condition of streams in the Central Amazon region of Brazil. Ecol. Indic. 2012, 18, 118–125. [Google Scholar] [CrossRef]
  48. Kaufmann, P.R.; Levine, P.; Robison, E.G.; Seeliger, C.; Peck, D.V. Quantifying Physical Habitat in Wadeable Streams EPA/620/R-99/003; US Environmental Protection Agency: Washington, DC, USA, 1999.
  49. Ligeiro, R.; Hughes, R.M.; Kaufmann, P.R.; Macedo, D.R.; Firmiano, K.R.; Ferreira, W.R.; Oliveira, D.; Melo, A.S.; Callisto, M. Defining quantitative stream disturbance gradients and the additive role of habitat variation to explain macroinvertebrate taxa richness. Ecol. Indic. 2013, 25, 45–57. [Google Scholar] [CrossRef] [Green Version]
  50. R Core Team. R: A Language and Environment for Statistical Computing. Available online: https://www.R-project.org/ (accessed on 3 August 2020).
  51. Bu, H.; Meng, W.; Zhang, Y.; Wan, J. Relationships between land use patterns and water quality in the Taizi River basin, China. Ecol. Indic. 2014, 41, 187–197. [Google Scholar] [CrossRef]
  52. Tischendorf, L.; Fahrig, L. How should we measure landscape connectivity? Landsc. Ecol. 2000, 15, 633–641. [Google Scholar] [CrossRef]
  53. Spanowicz, A.G.; Jaeger, J.A. Measuring landscape connectivity: On the importance of within-patch connectivity. Landsc. Ecol. 2019, 34, 2261–2278. [Google Scholar] [CrossRef]
  54. Zamberletti, P.; Zaffaroni, M.; Accatino, F.; Creed, I.F.; De Michele, C. Connectivity among wetlands matters for vulnerable amphibian populations in wetlandscapes. Ecol. Model. 2018, 384, 119–127. [Google Scholar] [CrossRef]
  55. Hu, C.; Zhang, P.; Zeng, S.; Zhou, W. The temporal and spatial distribution characteristics of different species Nitrogen in Poyang Lake. J. Jiangxi Norm. Univ. (Nat. Sci. Ed.) 2012, 36, 213–217. [Google Scholar] [CrossRef]
  56. Crewe, T.L.; Timmermans, S.T. Assessing Biological Integrity of Great Lakes Coastal Wetlands Using Marsh Bird and Amphibian Communities. Project # WETLAND3-EPA-01 Technical Report, Marsh Monitoring Program, Bird Studies Canada 2005. Available online: http://glc.org/wp-content/uploads/2016/10/CWC-Bird-Amphib-IBI-Report.pdf (accessed on 16 July 2020).
  57. Jovanovska, D.; Swetnam, R.D.; Tweed, F.S.; Melovski, L. Assessing the landscape visual quality of Shar Planina, North Macedonia. Landsc. Ecol. 2020, 35, 2805–2823. [Google Scholar] [CrossRef]
  58. Pratt, B.; Chang, H. Effects of land cover, topography, and built structure on seasonal water quality at multiple spatial scales. J. Hazard. Mater. 2012, 209, 48–58. [Google Scholar] [CrossRef]
  59. Sliva, L.; Williams, D.D. Buffer zone versus whole catchment approaches to studying land use impact on river water quality. Water Res. 2001, 35, 3462–3472. [Google Scholar] [CrossRef]
  60. You, Q.; Fang, N.; Liu, L.; Yang, W.; Zhang, L.; Wang, Y. Effects of land use, topography, climate and socio-economic factors on geographical variation pattern of inland surface water quality in China. PLoS ONE 2019, 14, e0217840. [Google Scholar] [CrossRef] [PubMed]
  61. Liu, L.; Yang, W.; You, Q.; Jian, M.; Liu, D.; Fang, N.; Yang, T.; Wang, Y.; Peng, Y. Water quality assessment of Poyang Lake wetland using radar-type charts. J. Hydroecol. 2020, 41, 131–138. [Google Scholar]
  62. Huang, J.; Li, Q.; Pontius, R.G.; Klemas, V.; Hong, H. Detecting the dynamic linkage between landscape characteristics and water quality in a subtropical coastal watershed, Southeast China. Environ. Manag. 2013, 51, 32–44. [Google Scholar] [CrossRef] [PubMed]
  63. Wu, Y.; Yang, W. Indicators and implementing methods of wetland biodiversity monitoring: Taking Great Lakes coastal wetlands as an example. Biodivers. Sci. 2015, 23, 527–535. [Google Scholar] [CrossRef]
Figure 1. Thirty sites were sampled for collecting environmental and biological data in the Poyang Lake wetland.
Remotesensing 14 01082 g001
Figure 2. The procedure for selecting metrics of the landscape-based health index. B-IBI, benthic macroinvertebrate-based index of biotic integrity; V-IBI, vegetation-based index of biotic integrity; IQ, interquartile range score.
Remotesensing 14 01082 g002
Figure 3. Land use patterns in the Poyang Lake region, as interpreted from Landsat-8 OLI images acquired in 2015.
Remotesensing 14 01082 g003
Figure 4. R2 values of the most parsimonious multivariate linear models for benthic macroinvertebrate- (B-IBI) and vegetation-based (V-IBI) indices of biotic integrity using landscape and remote sensing metrics in different buffer zones of sample sites as the explanatory variables.
Remotesensing 14 01082 g004
Figure 5. Discriminatory power of nine landscape and remote sensing metrics for reference and impaired sites. IQ is the abbreviation for interquartile range score. Boxes are interquartile ranges (25–75%). Range bars indicate maximal and minimal values of non-outliers. The bars in boxes are medians.
Remotesensing 14 01082 g005
Figure 6. Conditions of the Poyang Lake wetland assessed using landscape-based multi-metric index (LMI) (a) and discriminatory power of the LMI scores between reference and impaired sites (b). IQ is the abbreviation for interquartile range score, boxes are interquartile ranges (25–75%), bars in boxes are medians, range bars indicate maximal and minimal values of non-outliers.
Remotesensing 14 01082 g006
Figure 7. Relationship of the landscape-based multi-metric index (LMI) scores with benthic macroinvertebrate-based index of biotic integrity (B-IBI), vegetation-based index of biotic integrity (V-IBI), and local disturbance index (LOD). Black lines show linear fits. ** p < 0.01; *** p < 0.001.
Remotesensing 14 01082 g007
Table 1. Candidate landscape and remote sensing metrics for assessing the condition of the Poyang Lake wetland.
NumberLandscape and Remote Sensing Metrics (Abbreviation)DescriptionCalculation
1Patch richness density (PRD)Number of patch types per 100 hectares P R D = m A × 100 × 10000
2Patch density (PD)Number of patches per 100 hectares P D = N A × 100 × 10000
3Patch richness (PR)Number of patch types P R = m
4Mean patch size (AREA_MN)Mean size of the landscape patch A R E A M N = A N 1 1000
5Number of patches (NP)Number of patches of total landscape area N P = N
6Patch cohesion index (COHESION)Connectedness of the corresponding patch type C O H E S I O N = 1 i = 1 m j = 1 n p i j i = 1 m j = 1 n p i j a i j 1 1 Z 1 × 100
7Mean patch fractal dimension (FRAC_MN)Mean perimeter of the landscape patch F R A C M N = 2 ln 0.25 p i j ln A N
8Largest patch index (LPI)Percent of total area in the largest patch (%) L P I = m a x a i j A × 100
9Landscape shape index (LSI)Measures shape regularity of the landscape L S I = 0.25 E A
10Connectance index (CONNECT)Measures the functional connectedness of the corresponding patch type C O N N E C T = i = 1 m j k n c i j k i = 1 m n i n i 1 2 × 100
11Contagion index (CONTAG)Tendency of land use types to be aggregated (%) C O N T A G = 1 + i = 1 m k = 1 m P i g i k / k = 1 m g i k ln P i g i k / k = 1 m g i k 2 ln m × 100
12Landscape division index (DIVISION)Degree of separation of patch types D I V I S I O N = 1 i = 1 m j = 1 n a i j A 2
13Shannon’s diversity index (SHDI)Patch diversity S H D I = i = 1 m P i ln P i
14Aggregation index (AI)Tendency of a particular land use type to be aggregated A I = i = 1 m g i i m a x g i i P i × 100
15Landscape development intensity index (LDI)Measures the anthropological pressures of the corresponding area L D I = i = 1 n % L U i × L D I i
16Shannon’s evenness index (SHEI)Measures the relative abundance of different patch types S H E I = i = 1 m P i l n P i / l n m
17Hydrological regulation index (HRI)Percentage of lake, river, ponds, and wetland of the corresponding land use area-
18Cultivated land stress index (CSI)Percentage of paddy field and dry land of the corresponding land use area-
19Building pressure index (BPI)Percentage of built land of the corresponding land use area-
20Normalized differential vegetation index (NDVI)Scaled measurement of density and intensity of green vegetation growth in satellite image N D V I = N I R R e d / N I R + R e d
21Modified normalized difference water index (MNDWI)Measures water body and wetland presence in the corresponding area M N D W I = G r e e n S W I R / G r e e n + S W I R
22Modified normalized differential built-up index (MNDBI)Measures the impervious land cover of the corresponding area M N D B I = N D B I N D V I M N D W I
23Normalized differential built-up index (NDBI)Measures urban area of the corresponding area N D B I = S W I R N I R / S W I R + N I R
A: total landscape area; E: total length of edges in landscape; N: total number of patches; n: number of land use types; m: number of patch types; Pi: ratio of the area occupied by land use type i and the total landscape area; pij: perimeter of patch j of land use type i; gik: number of adjacencies between pixels of land use types i and k using double-count method; aij: area of patch j of land use type i; ni: number of patches of land use type i; cijk: joining between patches j and k of patch type i based on a specified threshold distance; LDIi: coefficient of landscape development intensity for land use i; %LUi: percent of land use type i in landscape. gi and max-gii are the number and maximum number of like adjacencies (joins) between pixels of land use type i using single-count method, respectively; NIR and Red correspond to near-infrared and red spectral bands of Sentinel-2A, respectively; Green and SWIR are the green and shortwave infrared bands, respectively; NIR and SWIR refer to shortwave near-infrared and infrared bands, respectively.
Table 2. Pairwise Pearson’s correlation coefficients of nine candidate metrics.
PDNPFRAC_MNLPIPRDPR
B-IBI−0.42−0.420.320.44−0.22−0.22
V-IBI−0.52−0.520.070.51−0.47−0.46
AREA_MNLSICONTAGCONNECTCOHESIONDIVISION
B-IBI0.39−0.370.170.370.43−0.33
V-IBI0.52−0.490.180.580.53−0.51
SHEISHDIAIHRICSIBPI
B-IBI−0.16−0.480.360.32−0.46−0.34
V-IBI−0.21−0.560.400.27−0.48−0.54
LDINDBINDVIMNDBIMNDWI-
B-IBI−0.41−0.320.04−0.390.23-
V-IBI−0.43−0.230.11−0.410.18-
AI, aggregation index; AREA_MN, mean patch size; CONNECT, connectance index; CSI, cultivated land stress index; LPI, largest patch index; MNDBI, modified normalized differential built-up index; PD, patch density; SHDI, Shannon’s diversity index; PRD, patch richness density.
Table 3. Pearson’s correlation coefficients of B-IBI and V-IBI with the 23 candidate metrics used in this study.
PDLPIAREA_MNCONNECTPRDSHDIAICSIMNDBI
PD1.00--------
LPI−0.471.00-------
AREA_MN−1.000.471.00------
CONNECT−0.590.180.591.00-----
PRD0.81−0.40−0.81−0.411.00----
SHDI0.82−0.65−0.82−0.430.711.00---
AI−0.950.530.950.51−0.77−0.821.00--
CSI0.76−0.26−0.76−0.630.760.60−0.671.00-
MNDBI0.52−0.18−0.52−0.570.340.37−0.460.431.00
PD, patch density; NP, number of patches; FRAC_MN, mean patch fractal dimension; LPI, largest patch index; PRD, patch richness density; PR, patch richness; AREA_MN, mean patch size; LSI, landscape shape index; CONTAG, contagion index; CONNECT, connectance index; COHESION, patch cohesion index; DIVISION, landscape division index; SHEI, Shannon’s evenness index; SHDI, Shannon’s diversity index; AI, aggregation index; HRI, hydrological regulation index; CSI, cultivated land stress index; BPI, building pressure index; LDI, landscape development intensity index; NDBI, normalized differential built-up index; NDVI, normalized differential vegetation index; MNDBI, modified normalized differential built-up index; MNDWI, modified normalized difference water index. B-IBI and V-IBI represent benthic macroinvertebrate- and vegetation-based indices of biotic integrity, respectively.
Publisher’s Note: MDPI stays neutral with regard to jurisdictional claims in published maps and institutional affiliations.

