Technical Note

Centennial Total Solar Irradiance Variation

1
Royal Observatory of Belgium, Ringlaan 3, 1180 Brussels, Belgium
2
ETRO Department, Vrije Universiteit Brussel, Pleinlaan 2, 1050 Brussels, Belgium
3
LATMOS, CNRS, 78280 Guyancourt, France
*
Author to whom correspondence should be addressed.
Remote Sens. 2022, 14(5), 1072; https://doi.org/10.3390/rs14051072
Submission received: 4 January 2022 / Revised: 4 February 2022 / Accepted: 16 February 2022 / Published: 22 February 2022
(This article belongs to the Section Atmospheric Remote Sensing)

Abstract

:
Total Solar Irradiance (TSI) quantifies the solar energy received by the Earth and therefore is of direct relevance for a possible solar influence on climate change on Earth. We analyse the TSI space measurements from 1991 to 2021, and we derive a regression model that reproduces the measured daily TSI variations with a Root Mean Square Error (RMSE) of 0.17 W/m2. The daily TSI regression model uses the MgII core to wing ratio as a facular brightening proxy and the Photometric Sunspot Index (PSI) as a measure of sunspot darkening. We reconstruct the annual mean TSI backwards to 1700 based on the Sunspot Number (SN), calibrated on the space measurements with an RMSE of 0.086 W/m2. The analysis of the 11 year running mean TSI reconstruction confirms the existence of a 105 year Gleissberg cycle. The TSI level of the current grand minimum is only about 0.15 W/m2 higher than the TSI level of the grand minimum in the beginning of the 18th century.

1. Introduction

The climate on Earth is determined by the balance between the incoming solar radiation—quantified by the Total Solar Irradiance (TSI)—and the outgoing terrestrial radiation. A change in TSI is a solar force of climate change on Earth; therefore, the TSI needs to be monitored as an Essential Climate Variable (ECV) [1].
The first measurement of TSI from space was made in 1969 [2], and continuous monitoring of the TSI with space radiometers started in 1978 [3]. In general, TSI radiometers measure at different absolute levels [4], and are subject to ageing due to solar exposure [5]. Several authors have proposed so-called TSI composite time series quantifying the long-term TSI variation as measured by the space instruments [5,6,7,8,9].
From the available TSI composites, it is now well-established that the TSI varies in phase with the 11 year sunspot cycle [10]. In particular, there is a short-term TSI decrease—referred to as sunspot darkening—when a sunspot characterised by a strong surface magnetic field occurs. There is also a longer-term TSI increase—referred to as facular brightening—caused by the facula, characterised by an intermediate-strength magnetic field, which form when a sunspot decays and which have a significantly longer lifetime than the original sunspot.
On top of the 11 year solar cycle TSI variation, there exists a longer-term variation of the ’quiet sun’ [11]. The TSI level observed during the 11 year cycle minima has long been a matter of speculation. Following [12], it was believed that the sun evolved from the so-called ’Maunder Minimum’ from about 1645 until 1715 when the 11 year cycle amplitude was minimal, to a so-called ’Grand Modern Maximum’ [13], where the 11 year cycle amplitude is supposed to be maximal. Centennial TSI reconstructions, such as the one of [14], used for the characterisation of solar climate forcing by the Intergovernmental Panel on Climate Change (IPCC), include a slow increase in the ’quiet sun’ TSI level from the Maunder Minimum to the Grand Modern Maximum by 1.25 W/m2 over a period of about 300 years. Table 1 gives an overview of the TSI increase since the Maunder Minimum found by different studies.
Recently, the Sunspot Index and Long-term Solar Observations (SILSO) Sunspot Number (SN) have been revised [20,21]. Following the latest insights, the Grand Modern Maximum does not exist, and so the 300 year increase in the TSI level from the Maunder Minimum to the Grand Modern Maximum should also be revisited. Independently from the SN revision, from an analysis of the extended 2008–2009 solar minimum, ref. [18] came to the conclusion that the TSI increase from the Maunder Minimum to the present needs to be revised. In addition, the careful intercomparison of all available space radiometer TSI time series in [9] indicates no variation of the quiet sun TSI level over a 32 year period from 1984 to 2016 within a 95% uncertainty of ±0.17 W/m2.
The goal of this paper is to reconstruct the centennial TSI variation back to 1700 based on the available TSI space measurements and the revised SN, in agreement with the insights from [18]. This new centennial TSI reconstruction is a paradigm shift [22] compared to the long-held belief based on [12] that there was a significant increase in the TSI, and hence solar climate change forcing, from the Maunder Minimum to the present. In Section 2, we review the available TSI space measurements and TSI regression models reproducing the sunspot darkening and facular brightening from observations of the solar surface magnetic field. In Section 3, we reconstruct the TSI variation back to 1700 based on the revised SN.

2. Materials and Methods
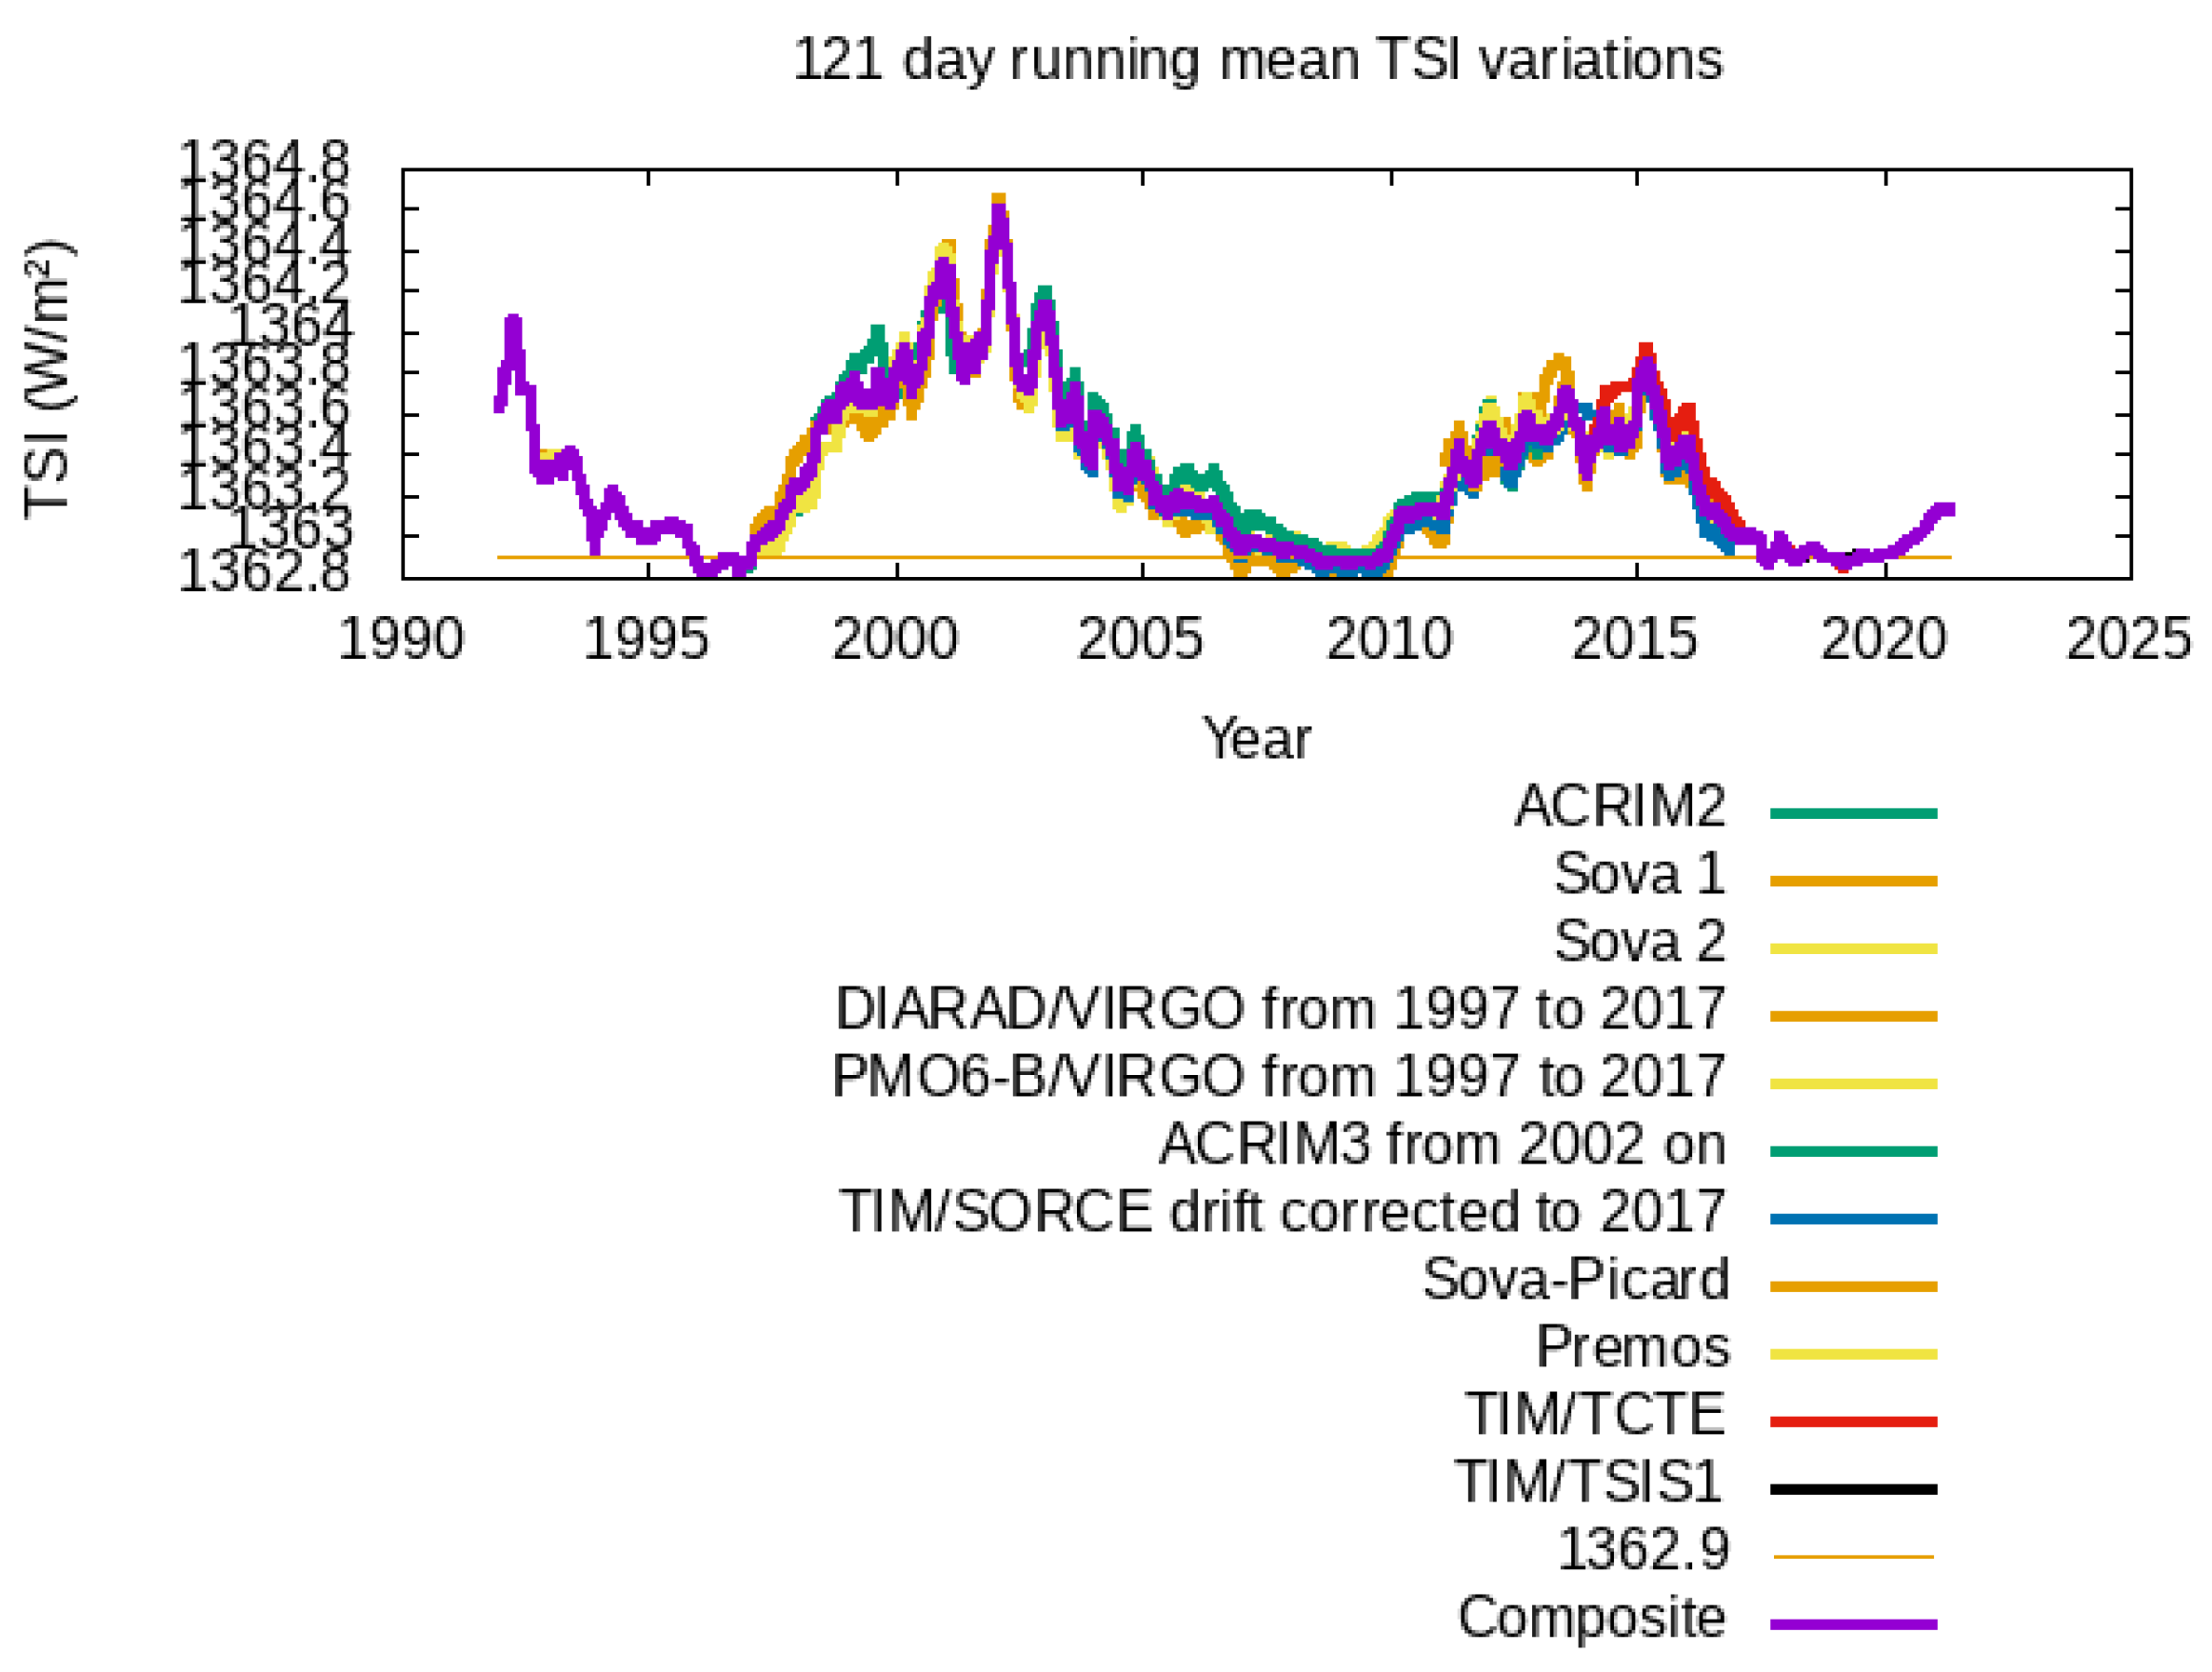
2.1. TSI Composite

The TSI quantifies the amount of solar energy that is received by the Earth [23]. The TSI is defined as the amount of solar power that reaches the Earth per unit surface perpendicular to the Sun–Earth direction at the mean Sun–Earth distance. The TSI is measured from space by electrical substitution cavity radiometers.
In [9], a TSI composite time series T S I ( t ) was constructed by compositing the measurement time series T S I i ( t ) of individual TSI instruments with index i. In summary, the compositing technique consists of the following steps:
  • The T S I i ( t ) are scaled with an instrument adjustment factor a i , such that the adjusted time series a i T S I i ( t ) have the same absolute level. The reference absolute level is the one from the Differential Absolute Radiometer (DIARAD) instrument, as part of the Solar Variability and Irradiance Monitor (SOVIM) experiment on the International Space Station (ISS) [24], with application of the new calibration procedure of [25]. The corresponding TSI level at solar minimum, also known as the quiet sun TSI level, is 1362.9 W/m2.
  • The adjusted time series a i T S I i ( t ) are quality-controlled by intercomparison. Parts of individual time series which differ too much from the other time series—for details, see [9]—are removed, and the Total Irradiance Monitor (TIM) on the Solar Radiation and Climate Experiment (SORCE) satellite [26] is corrected for its apparent linear drift compared to the other TSI radiometers. This results in quality-controlled adjusted time series a i T S I i q c ( t ) .
  • For every day t, the composite T S I ( t ) is calculated as the mean of the available time series a i T S I i q c ( t ) :
    T S I ( t ) = i a i T S I i q c ( t ) i
Here, we extend the work of [9] by adding the recent TSI time series measured by the TIM instruments on the Total Solar Irradiance Calibration Transfer Experiment (TCTE) [27] and on the Total and Spectral Solar Irradiance Sensor (TSIS) 1 [28] and by omitting the oldest and apparently less-reliable measurements on the Earth Radiation Budget (ERB)/Nimbus-7 experiment [3], on the Earth Radiation Budget Satellite (ERBS) [29] and the Active Cavity Radiometer Irradiance Monitor (ACRIM) 1 [30]. The 121 day running means of the resulting quality-controlled adjusted time series a i T S I i q c ( t ) are illustrated in Figure 1. As in [9], the period of 121 days averaging is chosen to remove the short-term solar variability, e.g., due to sunspot darkening linked to the average solar rotation period of 27 days [31], while highlighting the instrumental differences and the climate-relevant long-term solar variation linked to facular brightening.
The characteristics of the individual TSI time series are summarised in Table 2.
The resulting composite TSI timeseries T S I i ( t ) is illustrated in Figure 2. The daily mean TSI values are shown in purple, and the 121 day running mean values are shown in green.
To quantify the deviation between individual TSI time series and the composite, the Root Mean Square Differences (RMSD) between the composite and the longest individual TSI time series are given in Table 3.

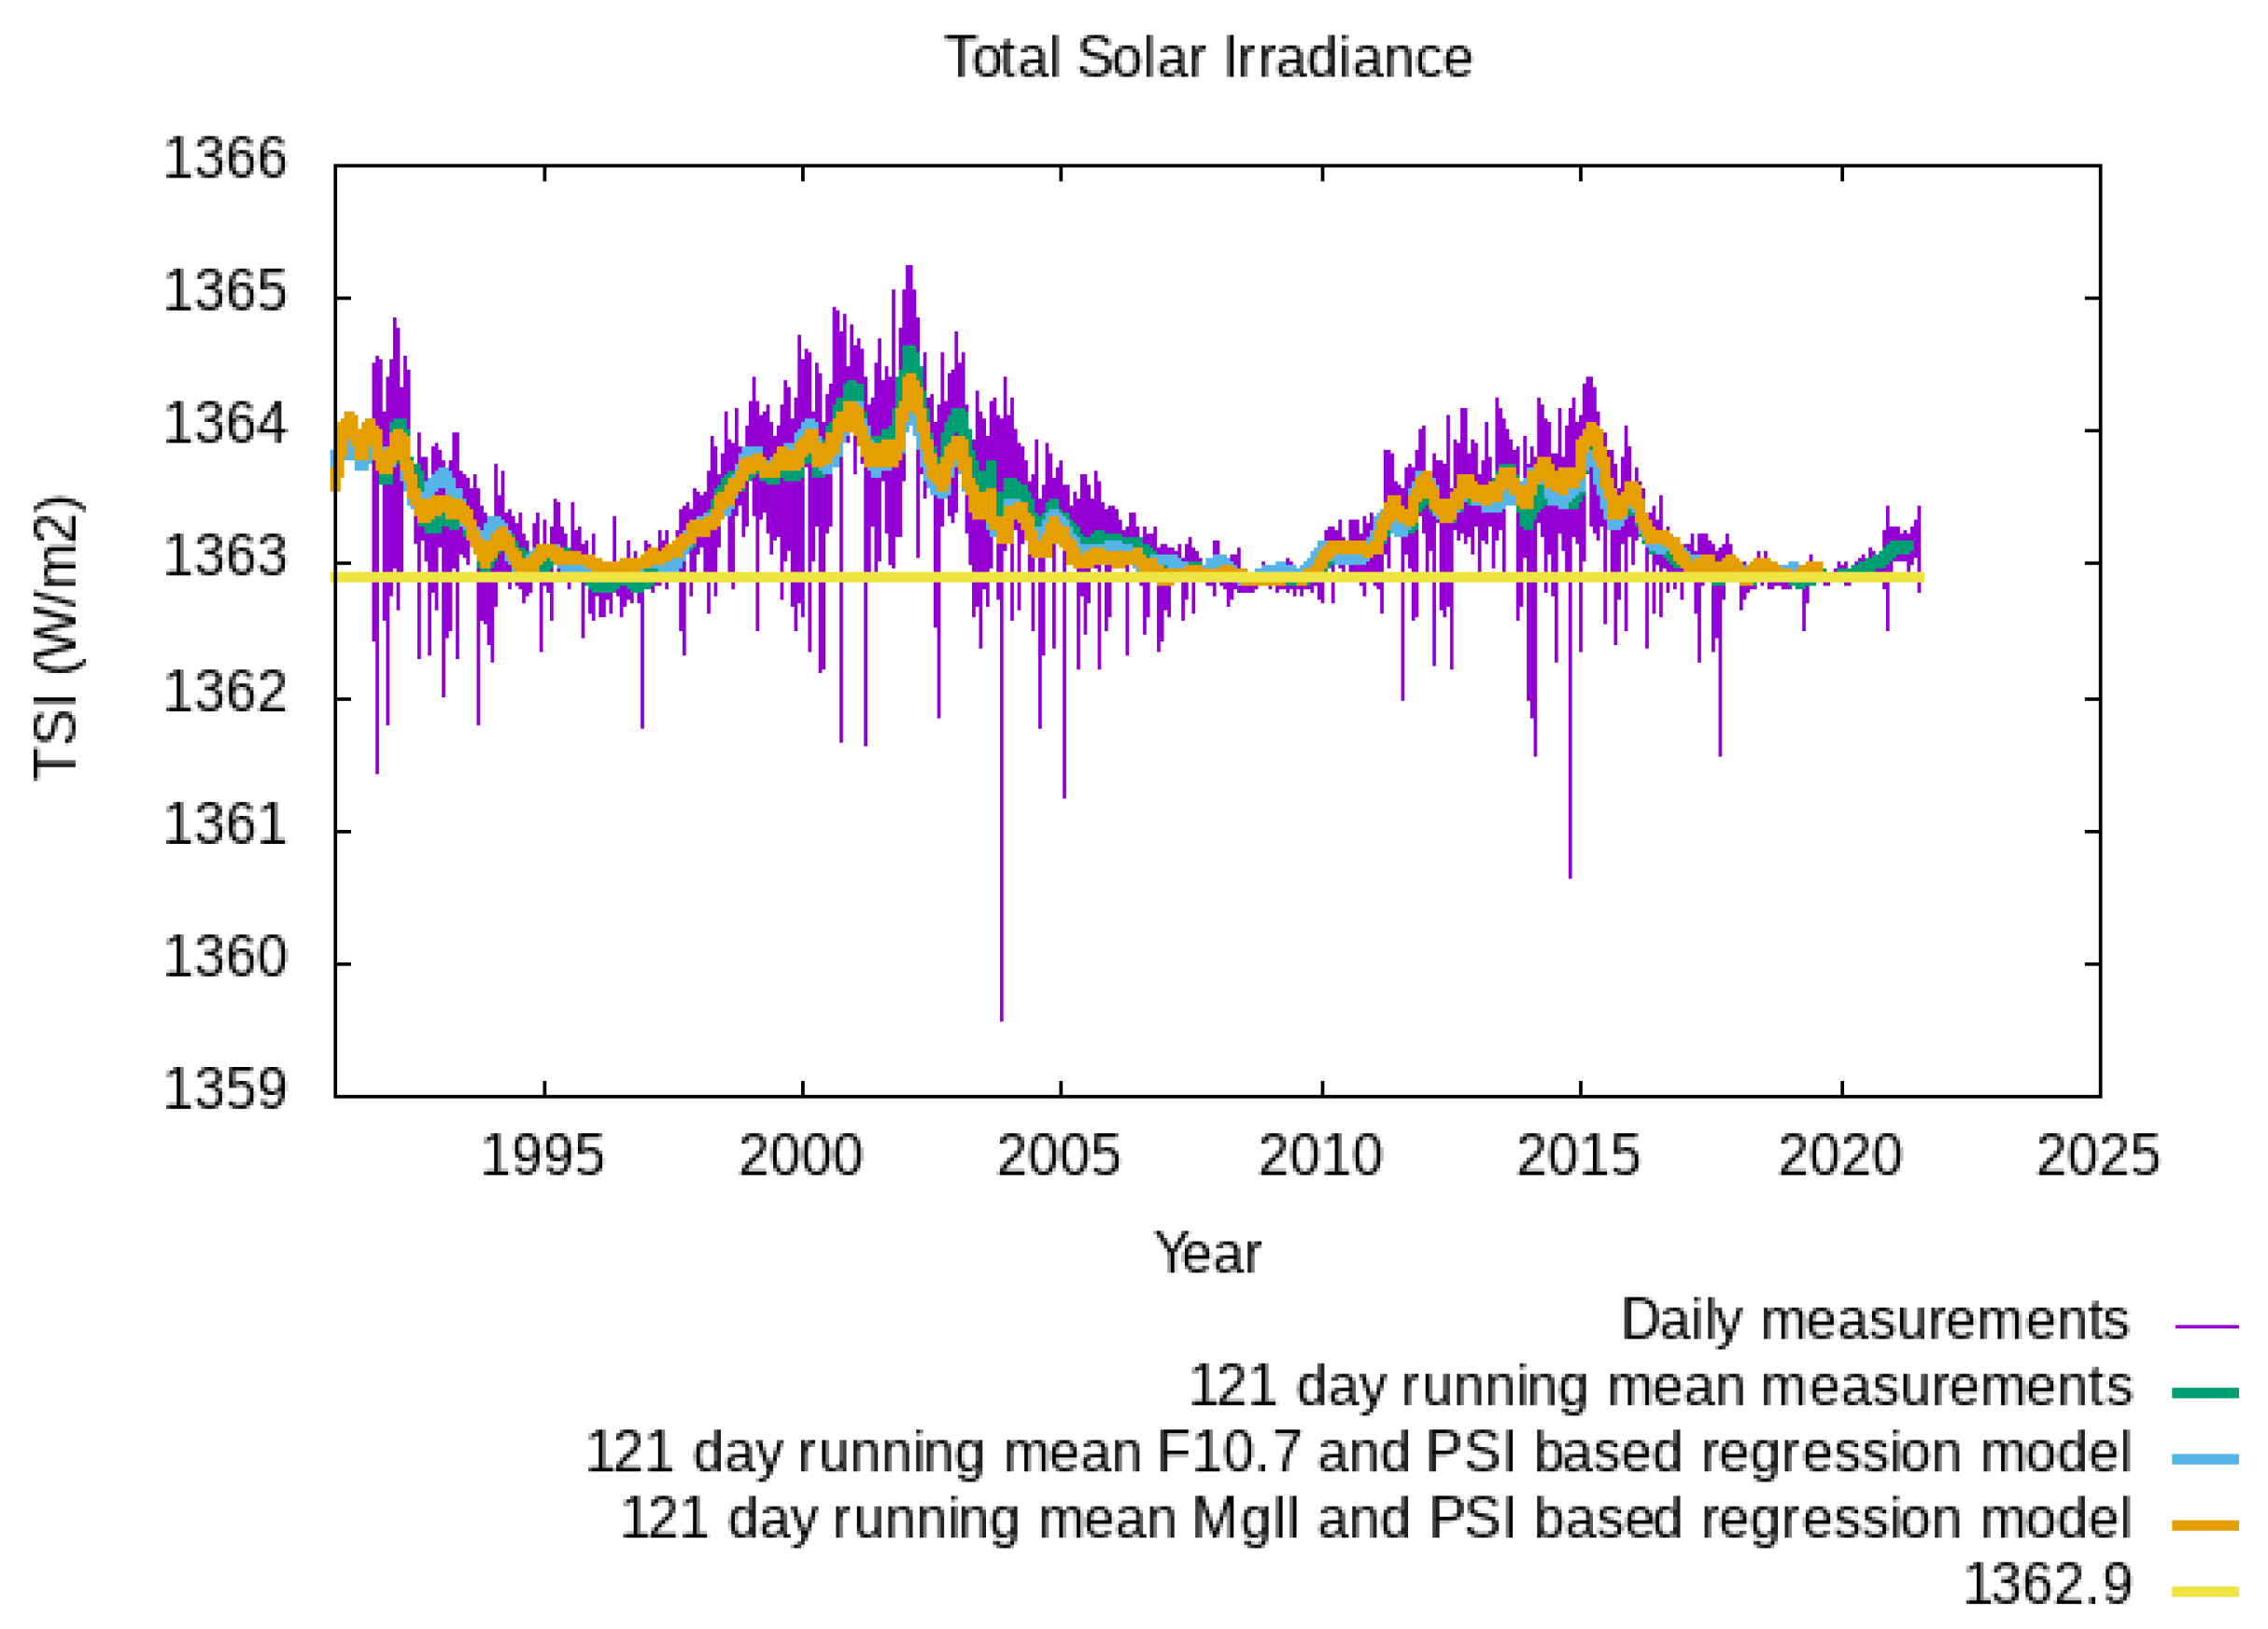
2.2. Daily TSI Regression Model
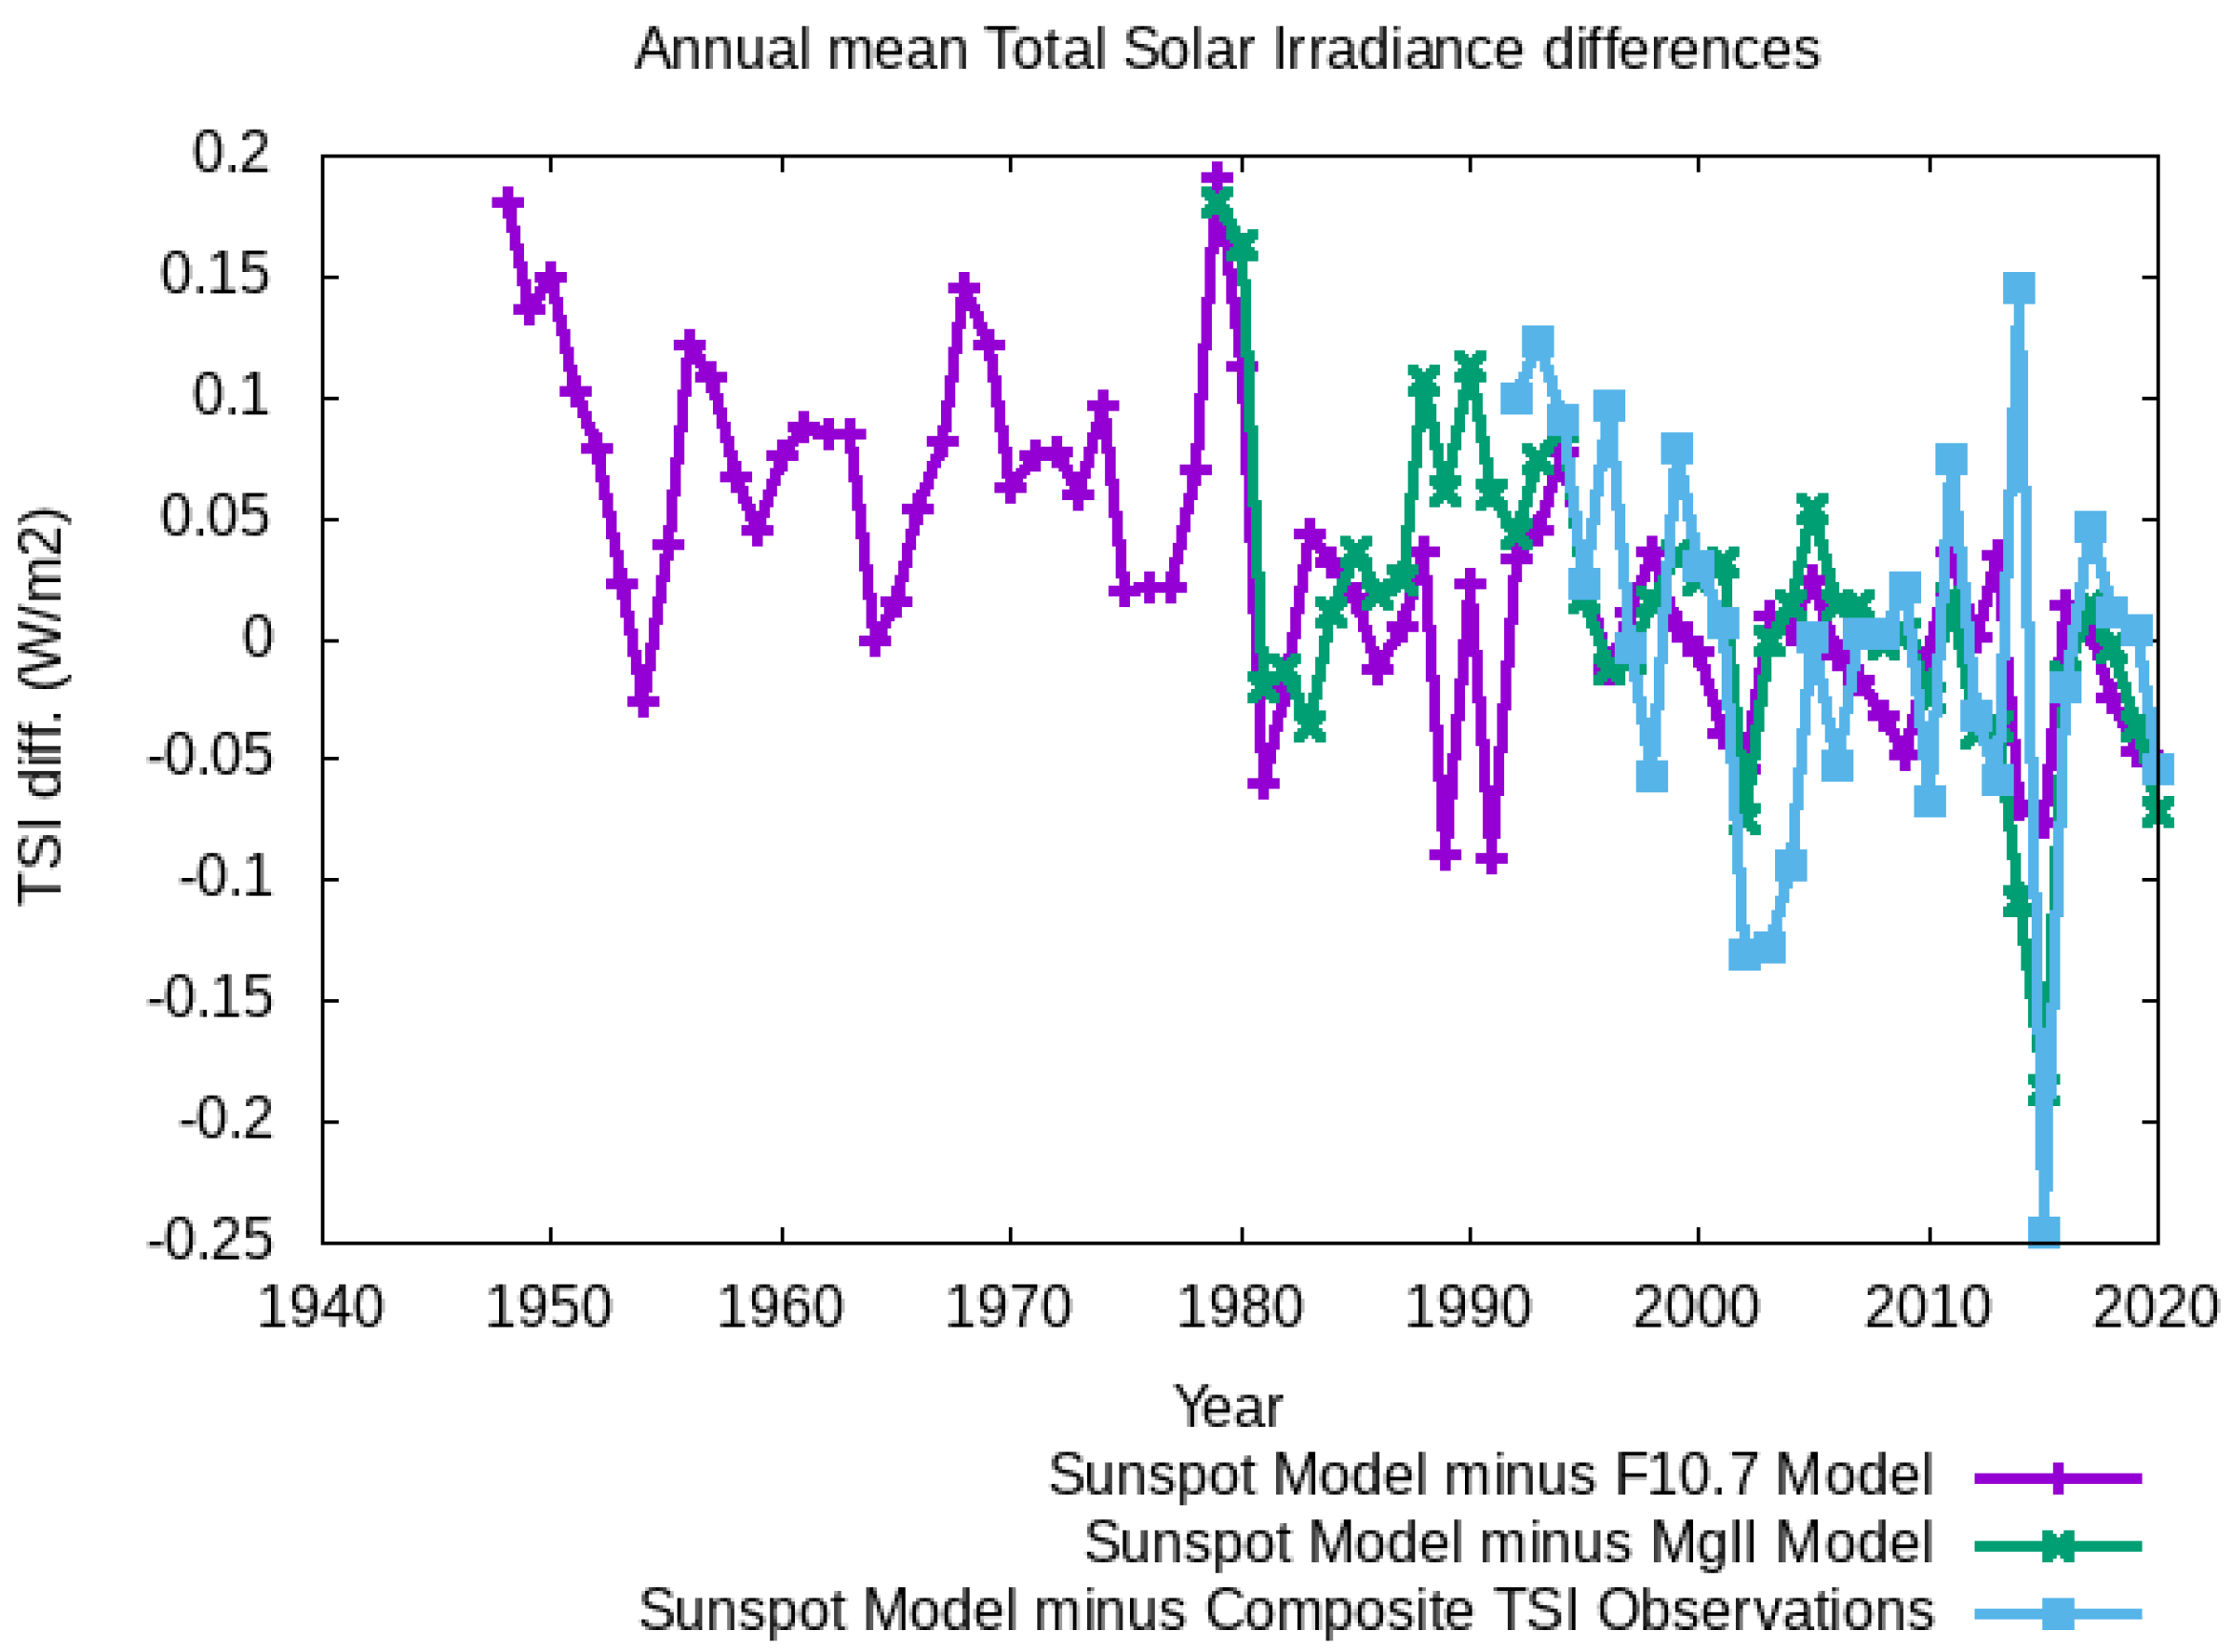
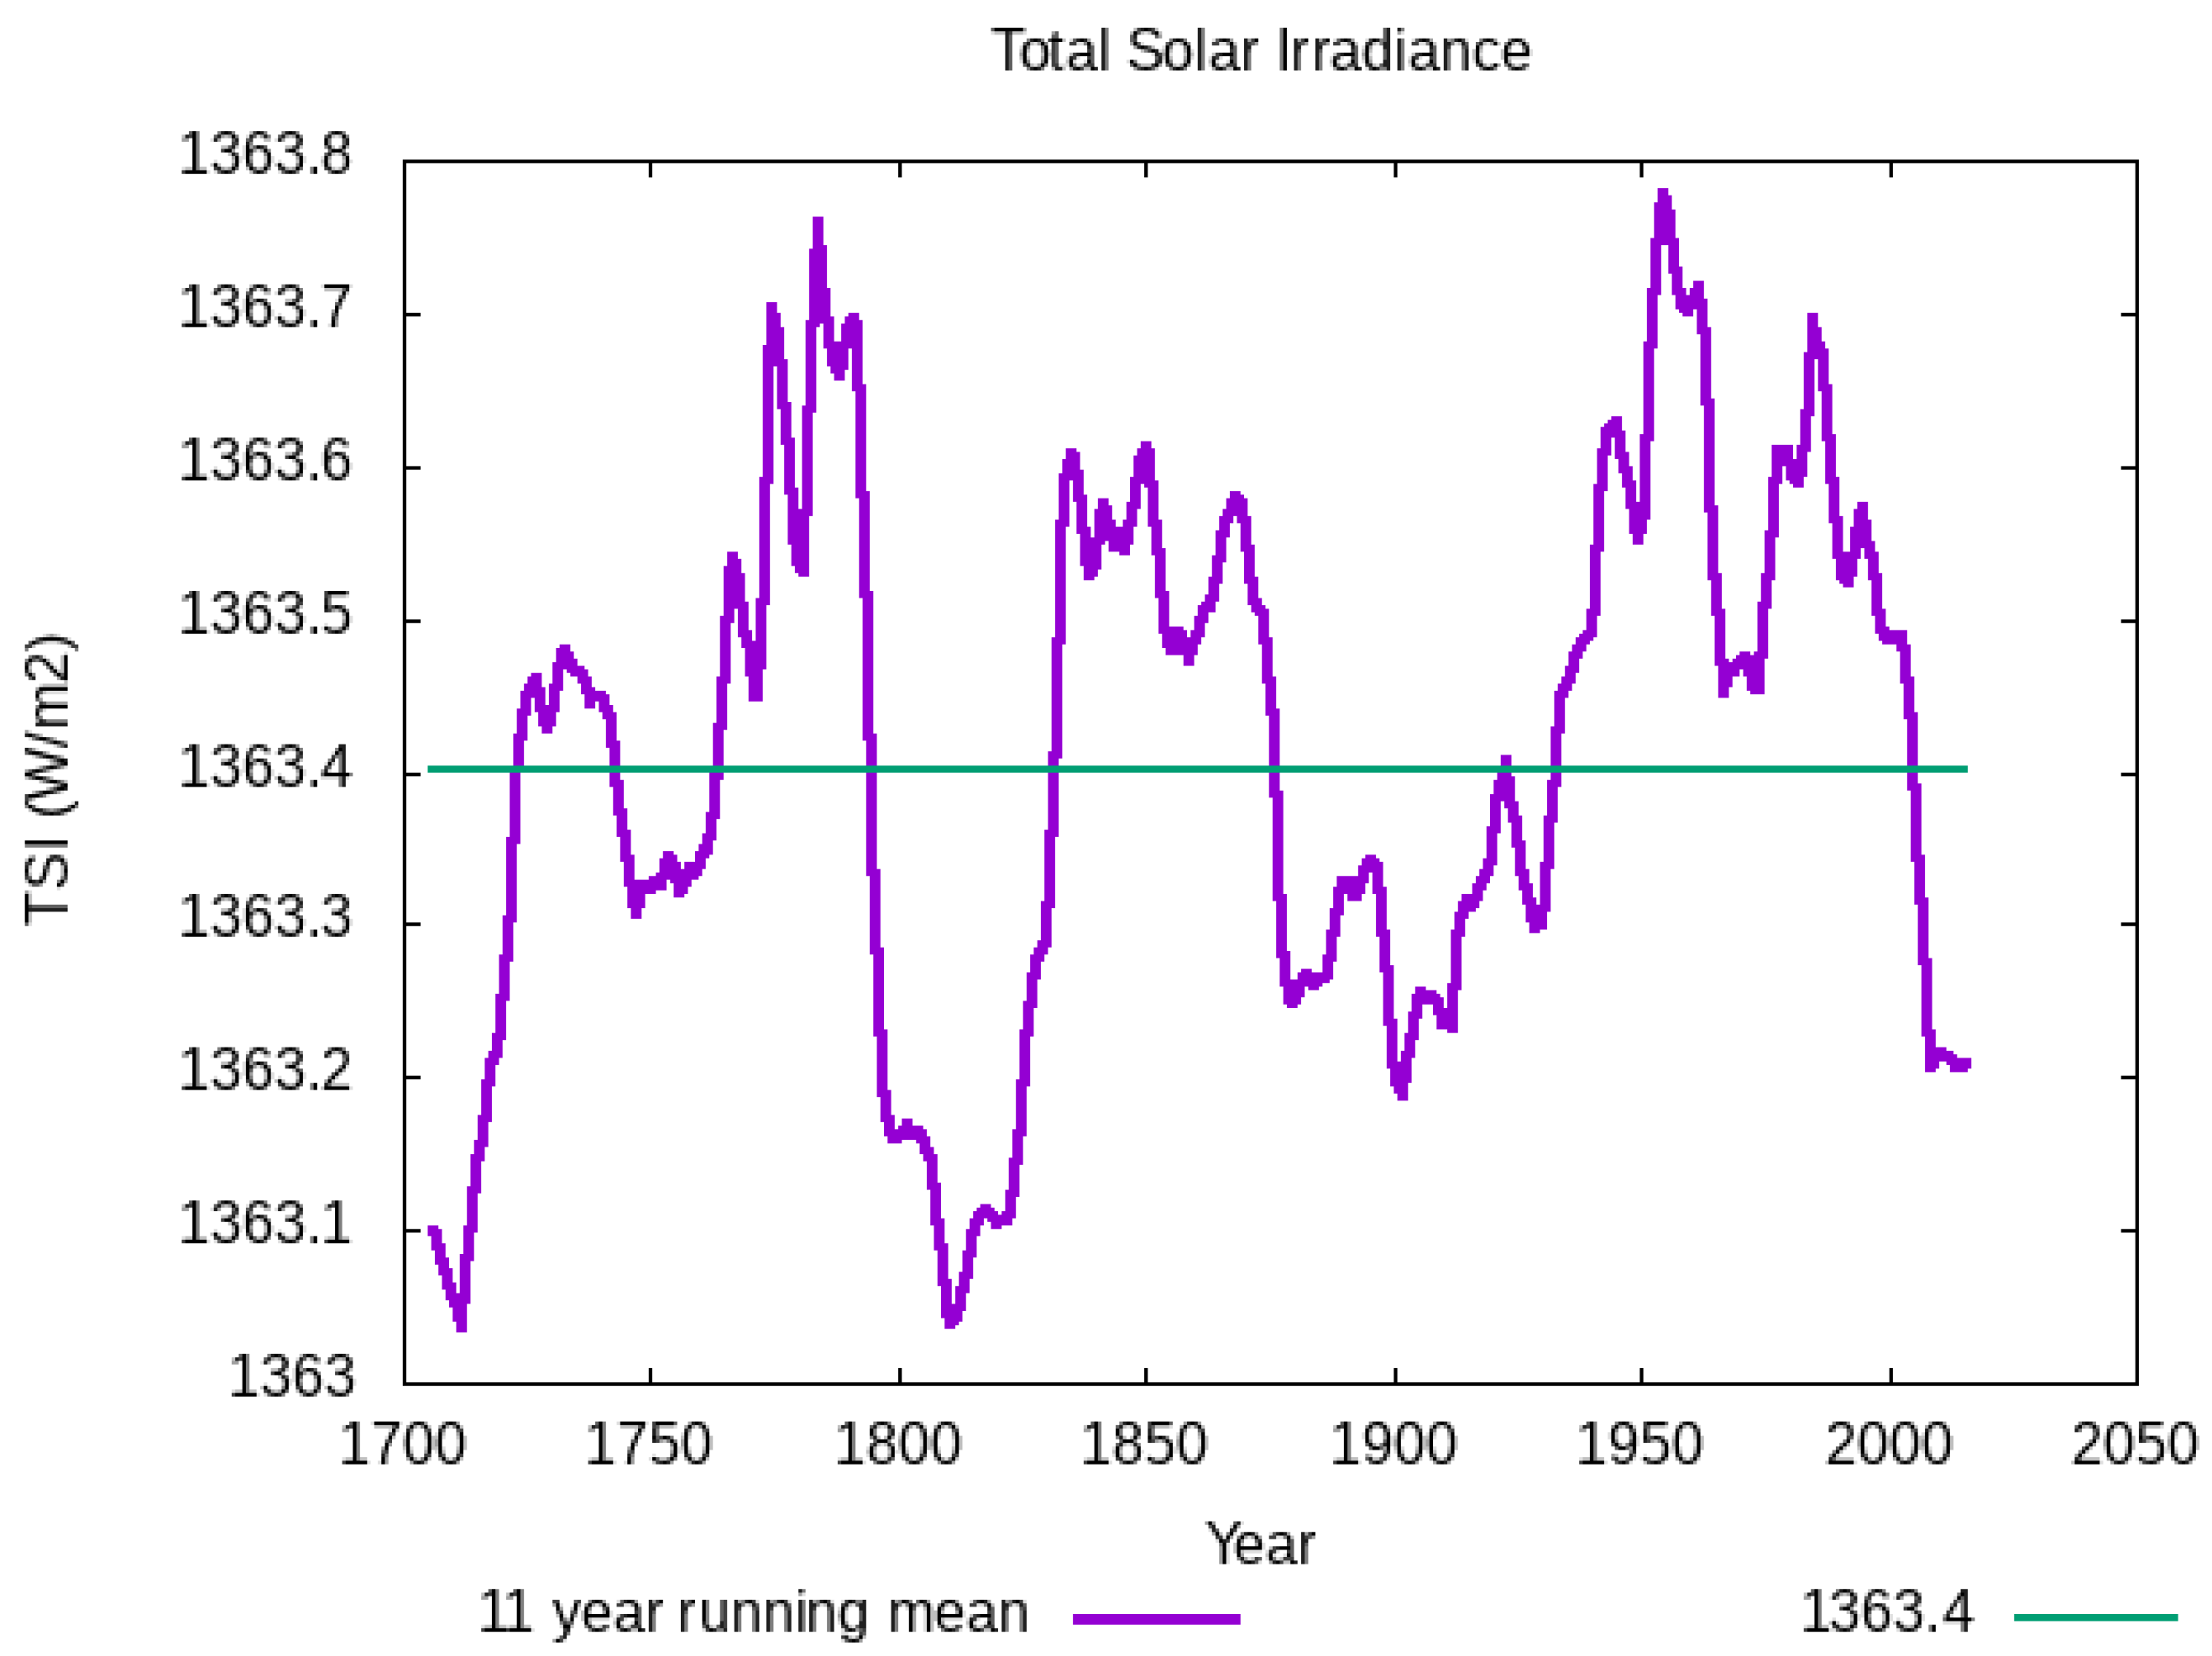
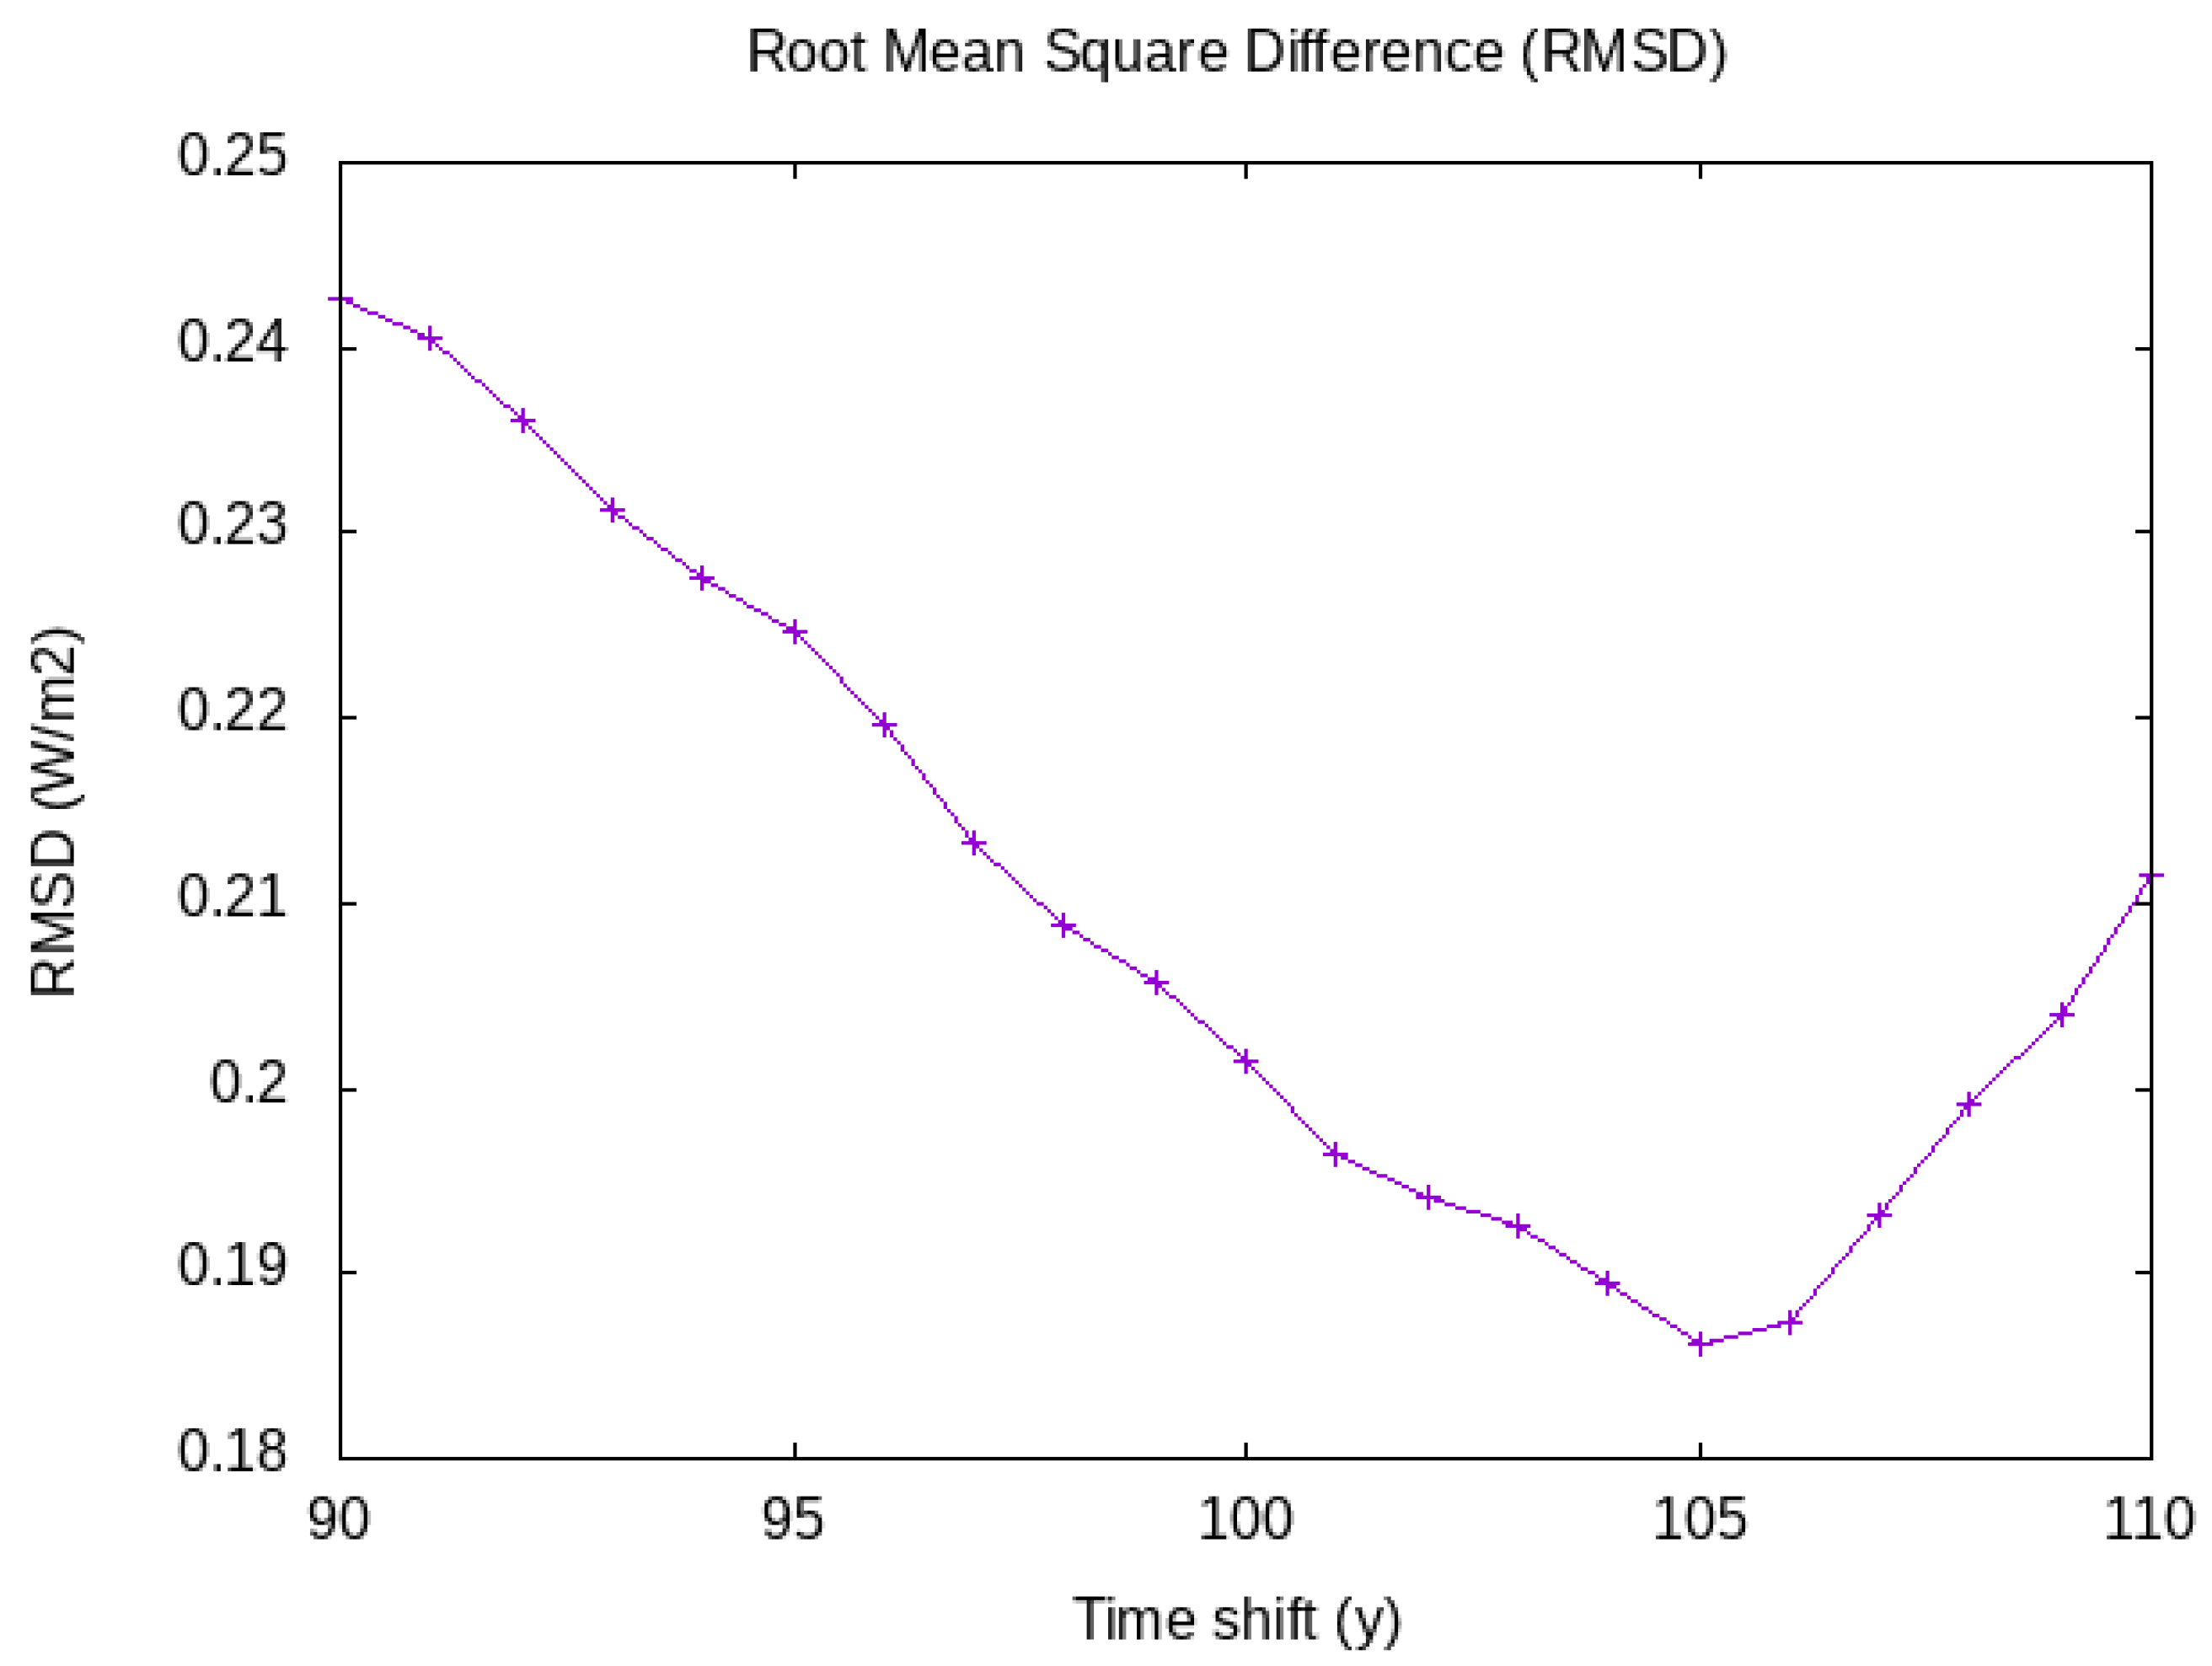
We validate our updated composite TSI series by two regression models using different proxies for the facular brightening and an estimate of sunspot darkening. The sunspot darkening estimate we use for both regression models is the Photometric Sunspot Index (PSI)—defined in [37]—obtained from [38].
For the first regression model, the facular brightening proxy we use is the F10.7 radio flux [39]. The F10.7 radio flux is a well-known, long-term solar activity indicator [40], and it has been successfully applied for TSI modelling [29]. The daily TSI T S I ( d ) is modelled as a function of the daily F10.7 radio flux F 10.7 ( d ) and the daily PSI P S I ( d ) as follows:
T S I ( d ) = 1360.92 + 0.0332 F 10.7 ( d ) 5.5 10 5 F 10.7 2 ( d ) 14.6 P S I ( d )
with an RMSE of 0.22 W/m2 and a correlation coefficient of 0.89.
The 121 day running mean of the F10.7-based daily TSI regression model is shown as the light blue curve in Figure 2.
For the second regression model, the facular brightening proxy we use is the MgII core-to-wing ratio index from [41]. The MgII core-to-wing ratio is an excellent indicator of facular brightening [42] and is commonly used for TSI modelling [43]. The daily TSI T S I ( d ) is modelled as a function of the daily MgII core-to-wing ratio M g I I ( d ) and the daily PSI P S I ( d ) as follows:
T S I ( d ) = 1362.68 + 5.09 M g I I ( d ) 1.09 M g I I 2 ( d ) 11.77 P S I ( d )
with an RMSE of 0.17 W/m2 and a correlation coefficient of 0.94.
The 121 day running mean of the daily MgII-based TSI regression model is shown as the orange curve in Figure 2.
The reference TSI minimum level of 1362.9 W/m2 is shown as the yellow line in Figure 2.

3. Results

The daily mean TSI values discussed in the previous section are of interest for a detailed analysis and validation of the measured TSI values in terms of facular brightening and sunspot darkening. For climate change studies, the annual mean TSI values are more relevant, and those annual mean values will be studied in the current section.
The orange curve in Figure 3 shows the annual mean TSI values T S I ( y ) —obtained by averaging the TSI composite from the previous section, shown in Figure 2—extending from 1992 to 2020.
We consider three annual mean TSI regression models based on solar activity indicators with different lengths:
  • The above-mentioned MgII index, extending from 1979 to 2020;
  • The above-mentioned F10.7 radio flux, extending from 1948 to 2020;
  • The SILSO SN, extending from 1700 to 2020.
For the first regression model, the yearly mean TSI T S I ( y ) is modelled as a linear function of the yearly mean MgII index M g I I ( y ) , as follows:
T S I ( y ) = 1362.79 + 2.52 M g I I ( y )
The RMSE of the annual mean MgII-based model is 0.071 W/m2.
The light blue curve in Figure 3 shows the annual mean MgII-based model.
For the second regression model, the yearly mean TSI T S I ( y ) is modelled as a linear function of the yearly mean F10.7 radio flux F 10.7 ( y ) , as follows:
T S I ( y ) = 1362.26 + 0.0099 F 10.7 ( y )
The RMSE of the annual mean F10.7-based model is 0.081 W/m2.
The green curve in Figure 3 shows the annual mean F10.7-based model.
For the third regression model, the yearly mean TSI T S I ( y ) is modelled as a linear function of the yearly mean SN S N ( y ) , as follows:
T S I ( y ) = 1362.88 + 0.0066 S N ( y )
The RMSE of the annual mean SI based model is 0.086 W/m2.
The purple curve in Figure 3 shows the annual mean SN-based model.
In order to assess the accuracy of the long-term TSI reconstruction from Figure 3, in Figure 4 we show the differences between the annual mean sunspot-based TSI model and the other TSI estimates:
  • The purple curve shows the difference between the SN-based model and the F10.7-based model.
  • The green curve shows the difference between the SN-based model and the MgII-based model.
  • The light blue curve shows the difference between the SN-based model and the composite TSI observations.
All differences are contained within ±0.25 W/m2, which we will adopt as an uncertainty estimate of the SN-based long-term TSI reconstruction.
Figure 5 shows the 11 year running mean of the annual mean TSI of Figure 3. The grand minima of this 11 year mean occur roughly in the beginning of each century, confirming the existence of the so-called Gleissberg cycle [44] with a period of around 100 years [45,46].
For a precise determination of the Gleissberg cycle period, we define the Root Mean Square Difference (RMSD) costfunction R M S D ( T ) :
R M S D ( T ) = y = 1916 2015 k = 1 , 2 ( T S I ( y ) T S I ( y k T ) ) 2 y = 1916 2015 k = 1 , 2
where R M S D ( T ) is the RMSD between the 11 year running mean TSI for the last 100 years and the time-shifted versions for the two earlier periods, as a function of the variable time shift T . The Gleissberg period T is obtained from a minimisation of this costfunction:
T = a r g m i n T R M S D ( T ) = 105 + / 1   year
Figure 6 shows the variation in the R M S D ( T ) for T’ between 90 and 110 years.
The Gleissberg period that minimises the cost function is 105 ± 1 year.
The peak-to-peak variation in the 11 year running mean TSI in Figure 5 is of the order of 0.7 W/m2. The corresponding variation of the solar forcing is 4 times smaller, so equal to 0.7/4 = 0.175 W/m2. Factor 4 is the ratio of the surface of a sphere to the surface of a circle with the same radius. The centennial solar variability is 5.6% of the estimated 3.1 W/m2 greenhouse gas radiative forcing in 2015 [47]. Over the last 50 years, the TSI varied by approximately −0.5 W/m2 (a drop from 1363.7 W/m2 to 1363.2 W/m2, see Figure 5). Using the same factor 4 as earlier, the sun has caused a modest radiative cooling of −0.5/4 = −0.125 W/m2 over the last 50 years, which was not sufficient to counteract the strong radiative warming from greenhouse gases.
Figure 7 shows the global temperature rise over the period of 1800–2020, as well as the greenhouse gas radiative forcing (green curve, left scale), the solar radiative forcing (blue curve, left scale) and the combined greenhouse gas and solar radiative forcing (ochre curve, left scale). For the combined greenhouse gas and solar forcing, the correlation with temperature change is 0.894, which is slightly higher than the correlation of 0.892 that is obtained when only the greenhouse gas radiative forcing is considered.
The long-term average of the TSI from 1700 to 2020 is 1363.4 W/m2, indicated by the green line in Figure 5.

4. Discussion

Since [12], solar-climate research has been dominated by the idea that during the Maunder Minimum, the TSI was significantly lower than the current conditions, characterised by a Grand Modern Maximum [13] of solar activity, and that this lower TSI could be at least partially responsible for the lower temperatures during the so-called Little Ice Age (LIA) [48] from the 15th to the 19th century, where the temperatures in the Northern Hemisphere dropped by about 0.6 °C. For example, in [15], it is estimated that the TSI during the Maunder Minimum could be 3.3 W/m2 lower then its mean value from 1980 to 1986. The theory of the Grand Modern Maximum had to be abandoned after the revision of the sunspot number [20] and after the occurrence of the low solar cycle 24 occurring between 2008 and 2019—see Figure 3. Therefore, the long-term TSI reconstruction needs to be revised.
A reconstruction of past TSI variations needs to be based on the analysis of existing TSI space measurements. We demonstrated in Section 2 that the daily composite TSI from 1991 to 2021 can be reconstructed with an RMSE as low as 0.17 W/m2 and a correlation coefficient as high as 0.94 from a regression model based only on a facular brightening proxy and a sunspot darkening estimate. There is no evidence that other physical effects other than facular brightening and sunspot darkening, both linked to the magnetic field on the solar surface, are needed to explain observed TSI variations.
We can then endeavour the extrapolation of the TSI variations prior to their reliable measurement from space. On annual mean timescales, facular brightening and sunspot darkening are strongly correlated since the faculae result from the decay of sunspots on timescales shorter then 1 year, so that a single proxy for both can be used. In Section 3, we have used two facular brightening proxies—the MgII core-to-wing ratio and the F10.7 radio flux—and one sunspot darkening estimate—the SN—to reconstruct the measured annual mean TSI variation from 1992 to 2020, with RMSEs of 0.071 W/m2, 0.081 W/m2 and 0.086 W/m2, respectively. Prior to the used TSI space observations, the annual TSI extrapolations using any of these proxies agree well during their period of overlap, giving confidence in the soundness of the extrapolation. From the comparison of the sunspot-based TSI model with the other TSI estimates during their period of overlap, the stability of the annual mean sunspot-based TSI reconstruction is estimated to be ±0.25 W/m2. A TSI reconstruction similar to ours was used in [49] for an adequate reconstruction of global temperature change from 1850 to 2019, increasing the confidence in the validity of our TSI reconstruction.
The occurrence of grand solar minima and maxima [50,51] can be studied from the 11 year running mean TSI reconstruction shown in Figure 5. An RMSD analysis as a function of timeshift confirms the existence of a 105 year Gleissberg cycle, similar to the one found in [45,46]. The TSI levels during the earlier grand minima in the beginning of the 18th and the 19th centuries are comparable, around 1363.05 W/m2, while the TSI levels during the later grand minima, in the beginning of the 20th and 21st centuries are also comparable, around 1363.2 W/m2, only 0.15 W/m2 higher than the earlier grand minima. Clearly, this small TSI level variation cannot explain the occurrence of the LIA.
The main contribution of our study is that, in opposition to earlier studies based on [12], we do not find a significant increase in TSI and hence solar influence on climate change between the Maunder Minimum and the present.

5. Conclusions

We have obtained a new TSI reconstruction from 1700 to 2020. It is based on a careful intercomparison and analysis of the TSI space measurements from 1991 to 2021 and an extrapolation back to 1700 based on the latest version of the annual mean SN. The daily mean TSI space measurements can be reconstructed with an RMSE of 0.71 W/m2 and a correlation coefficient of 0.94 by a regression model using the MgII core-to-wing ratio facular brightening proxy and the PSI sunspot darkening estimate. The annual mean TSI model agrees with the TSI space measurements with an RMSE of 0.086 W/m2 and has an estimated stability of ±0.25 W/m2. The analysis of the 11 year running mean TSI reconstruction confirms the existence of a 105 year Gleissberg cycle with grand minima occurring in the beginning of each century. The TSI level of the latest grand minimum is only 0.15 W/m2 higher than the TSI level of the earliest grand minimum.

Author Contributions

Initial idea and first draft: S.D.; review and editing, S.D., J.C. and M.M. All authors have read and agreed to the published version of the manuscript.

Funding

This research was funded by the Royal Observatory of Belgium.

Institutional Review Board Statement

Not applicable as this study did not involve humans or animals.

Informed Consent Statement

Not applicable as this study did not involve humans or animals.

Data Availability Statement

The input data for this study is publicly available. The output will be made publicly available through the Solar Influences Data Analysis Center (SIDC) web server at http://sidc.be.

Acknowledgments

We thank Frédéric Clette, for the production by the World Data Center SILSO of the re-calibrated sunspot number series V2.0, which is used in this study.

Conflicts of Interest

The authors declare no conflict of interest.

Abbreviations

The following abbreviations are used in this manuscript:
ACRIMActive Cavity Radiometer Irradiance Monitor
DIARADDifferential Absolute Radiometer
ECVEssential Climate Variable
ERBEarth Radiation Budget
ERBSEarth Radiation Budget Satellite
ISSInternational Space Station
LIALittle Ice Age
PMOPhysikalishes und Meteorologisches Observatorium
PREMOSPrecision Monitoring of Solar variability
PSIPhotometric Sunspot Index
RMSERoot Mean Square Error
SILSOSunspot Index and Long-term Solar Observations
SNSunspot Number
SORCESolar Radiation and Climate Explorer
SOVASolar Variability
SOVIMSolar Variability and Irradiance Monitor
TCTETotal Solar Irradiance Calibration Transfer Experiment
TIMTotal Irradiance Monitor
TSITotal Solar Irradiance
TSISTotal and spectral Solar Irradiance Sensor
VIRGOVariability of Irradiance and Gravity Oscillations

References

  1. Houghton, J.; Townshend, J.; Dawson, K.; Mason, P.; Zillman, J.; Simmons, A. The GCOS at 20 years: The origin, achievement and future development of the Global Climate Observing System. Weather 2012, 67, 227–235. [Google Scholar] [CrossRef]
  2. Plamondon, J.A. The Mariner Mars 1969 Temperature Control Flux Monitor. Jet Propuls. Lab. Space Program Summary 1969, 37–59, 162–168. [Google Scholar]
  3. Hickey, J.R.; Alton, B.M.; Kyle, H.L.; Hoyt, D. Total solar irradiance measurements by ERB/Nimbus-7. A review of nine years. Space Sci. Rev. 1988, 48, 321–334. [Google Scholar] [CrossRef]
  4. Crommelynck, D.; Fichot, A.; Lee, R.B., III; Romero, J. First realisation of the space absolute radiometric reference (SARR) during the ATLAS 2 flight period. Adv. Space Res. 1995, 16, 17–23. [Google Scholar] [CrossRef]
  5. Dewitte, S.; Crommelynck, D.; Mekaoui, S.; Joukoff, A. Measurement and uncertainty of the long-term total solar irradiance trend. Sol. Phys. 2004, 224, 209–216. [Google Scholar] [CrossRef]
  6. Willson, R.C.; Mordvinov, A.V. Secular total solar irradiance trend during solar cycles 21–23. Geophys. Res. Lett. 2003, 30, 1199. [Google Scholar] [CrossRef] [Green Version]
  7. Fröhlich, C. Evidence of a long-term trend in total solar irradiance. Astron. Astrophys. 2009, 501, L27–L30. [Google Scholar] [CrossRef]
  8. Dudok de Wit, T.; Kopp, G.; Fröhlich, C.; Schöll, M. Methodology to create a new total solar irradiance record: Making a composite out of multiple data records. Geophys. Res. Lett. 2003, 44, 1196–1203. [Google Scholar]
  9. Dewitte, S.; Nevens, S. The total solar irradiance climate data record. Astrophys. J. 2016, 830, 25. [Google Scholar] [CrossRef]
  10. Domingo, V.; Ermolli, I.; Fox, P.; Fröhlich, C.; Haberreiter, M.; Krivova, N.; Vögler, A. Solar surface magnetism and irradiance on time scales from days to the 11-year cycle. Space Sci. Rev. 2009, 145, 337–380. [Google Scholar] [CrossRef] [Green Version]
  11. Livingston, W.; Wallace, L. The Sun’s immutable basal quiet atmosphere. Sol. Phys. 2003, 212, 227–237. [Google Scholar] [CrossRef]
  12. Eddy, J.A. The maunder minimum. Sciences 1976, 192, 1189–1202. [Google Scholar] [CrossRef] [Green Version]
  13. Abreu, J.A.; Beer, J.; Steinhilber, F.; Tobias, S.M.; Weiss, N.O. For how long will the current grand maximum of solar activity persist ? Geophys. Res. Lett. 2008, 35, L20109. [Google Scholar] [CrossRef] [Green Version]
  14. Krivova, N.A.; Vieira, L.E.A.; Solanki, S.K. Reconstruction of solar spectral irradiance since the Maunder minimum. J. Geophys. Res. Space Phys. 2010, 115, A12112. [Google Scholar] [CrossRef] [Green Version]
  15. Lean, J.; Skumanich, A.; White, O. Estimating the Sun’s radiative output during the Maunder Minimum. Geophys. Res. Lett. 1992, 19, 1591–1594. [Google Scholar] [CrossRef] [Green Version]
  16. Balmaceda, L.; Krivova, N.A.; Solanki, S.K. Reconstruction of solar irradiance using the Group sunspot number. Adv. Space Res. 2007, 40, 986–989. [Google Scholar] [CrossRef] [Green Version]
  17. Shapiro, A.I.; Schmutz, W.; Rozanov, E.; Schoell, M.; Haberreiter, M.; Shapiro, A.V.; Nyeki, S. A new approach to the long-term reconstruction of the solar irradiance leads to large historical solar forcing. Astron. Astrophys. 2011, 529, A67. [Google Scholar] [CrossRef] [Green Version]
  18. Schrijver, C.J.; Livingston, W.C.; Woods, T.N.; Mewaldt, R.A. The minimal solar activity in 2008–2009 and its implications for long-term climate modeling. Geophys. Res. Lett. 2011, 38, L06701. [Google Scholar] [CrossRef] [Green Version]
  19. Lean, J.L. Estimating solar irradiance since 850 CE. Earth Space Sci. 2018, 5, 133–149. [Google Scholar] [CrossRef]
  20. Clette, F.; Cliver, E.W.; Lefèvre, L.; Svalgaard, L.; Vaquero, J.M.; Leibacher, J.W. Preface to topical issue: Recalibration of the sunspot number. Sol. Phys. 2016, 291, 2479–2486. [Google Scholar] [CrossRef] [Green Version]
  21. Clette, F.; Lefèvre, L. The new sunspot number: Assembling all corrections. Sol. Phys. 2016, 291, 2629–2651. [Google Scholar] [CrossRef] [Green Version]
  22. Kuhn, T.S. The Structure of Scientific Revolutions; Princeton University Press: Princeton, NJ, USA, 2021. [Google Scholar]
  23. Dewitte, S.; Clerbaux, N. Measurement of the Earth radiation budget at the top of the atmosphere—A review. Remote Sens. 2017, 9, 1143. [Google Scholar] [CrossRef] [Green Version]
  24. Mekaoui, S.; Dewitte, S.; Conscience, C.; Chevalier, A. Total solar irradiance absolute level from DIARAD/SOVIM on the International Space Station. Adv. Space Res. 2010, 45, 1393–1406. [Google Scholar] [CrossRef]
  25. Dewitte, S.; Janssen, E.; Mekaoui, S. Science results from the Sova-Picard total solar irradiance instrument. AIP Conf. Proc. 2013, 1531, 688–691. [Google Scholar]
  26. Kopp, G. Science Highlights and Final Updates from 17 Years of Total Solar Irradiance Measurements from the SOlar Radiation and Climate Experiment/Total Irradiance Monitor (SORCE/TIM). Sol. Phys. 2021, 296, 1–16. [Google Scholar] [CrossRef]
  27. Woods, T.; Cahalan, R.; Denig, W.; Kopp, G.; Pilewskie, P.; Sparn, T. Rapid Coordination Extends Space-Based Sun-Climate Record. Eos Trans. Am. Geophys. Union 2014, 95, 429–430. [Google Scholar] [CrossRef] [Green Version]
  28. Pilewskie, P.; Kopp, G.; Richard, E.; Coddington, O.; Sparn, T.; Woods, T. TSIS-1 and continuity of the total and spectral solar irradiance climate data record. In EGU General Assembly Conference Abstracts; European Geophyscial Union: Vienna, Austria, 2018; p. 5527. [Google Scholar]
  29. Lee, R.B., III; Gibson, M.A.; Wilson, R.S.; Thomas, S. Long-term total solar irradiance variability during sunspot cycle 22. J. Geophys. Res. Space Phys. 2014, 100, 1667–1675. [Google Scholar] [CrossRef]
  30. Willson, R.C. Irradiance observations of SMM, Spacelab 1, UARS, and ATLAS experiments. In International Astronomical Union Colloquiums; Cambridge University Press: Cambridge, MA, USA, 1994; Volume 143, pp. 54–62. [Google Scholar]
  31. Crommelynck, D.; Dewitte, S. Solar constant temporal and frequency characteristics. Sol. Phys. 1997, 173, 177–191. [Google Scholar] [CrossRef]
  32. Crommelynck, D.; Domingo, V.; Fichot, A.; Fröhlich, C.; Penelle, B.; Romero, J.; Wehrli, C. Preliminary results from the SOVA experiment on board the European Retrievable Carrier (EURECA). Metrologia 1993, 30, 375. [Google Scholar] [CrossRef]
  33. Dewitte, S.; Crommelynck, D.; Joukoff, A. Total solar irradiance observations from DIARAD/VIRGO. J. Geophys. Res. Space Phys. 2004, 109, A02102. [Google Scholar] [CrossRef]
  34. Greg, K.; Lawrence, G. The total irradiance monitor (TIM): Instrument design. Sol. Phys. 2005, 230, 91–109. [Google Scholar]
  35. Meftah, M.; Dewitte, S.; Irbah, A.; Chevalier, A.; Conscience, C.; Crommelynck, D.; Mekaoui, S. SOVAP/Picard, a spaceborne radiometer to measure the total solar irradiance. Sol. Phys. 2014, 289, 1885–1899. [Google Scholar] [CrossRef]
  36. Schmutz, W.; Fehlmann, A.; Finsterle, W.; Kopp, G.; Thuillier, G. Total solar irradiance measurements with PREMOS/PICARD. AIP Conf. Proc. 2013, 1531, 624–627. [Google Scholar]
  37. Hudson, H.S.; Silva, S.; Woodard, M.; Willson, R.C. The effects of sunspots on solar irradiance. Sol. Phys. 1982, 76, 211–219. [Google Scholar] [CrossRef]
  38. Mandal, S.; Krivova, N.A.; Solanki, S.K.; Sinha, N.; Banerjee, D. Sunspot area catalog revisited: Daily cross-calibrated areas since 1874. Astron. Astrophys. 2020, 640, A78. [Google Scholar] [CrossRef]
  39. Tapping, K.F. The 10.7 cm solar radio flux (F10. 7). Space Weather 2013, 11, 394–406. [Google Scholar] [CrossRef]
  40. Nicolet, M.; Bossy, L. Solar radio fluxes as indices of solar activity. Planet. Space Sci. 1985, 33, 507–555. [Google Scholar] [CrossRef]
  41. Snow, M.; Weber, M.; Machol, J.; Viereck, R.; Richard, E. Comparison of Magnesium II core-to-wing ratio observations during solar minimum 23/24. J. Space Weather Space Clim. 2014, 4, A04. [Google Scholar] [CrossRef]
  42. Lean, J.L.; Rottman, G.J.; Kyle, H.L.; Woods, T.N.; Hickey, J.R.; Puga, L.C. Detection and parameterization of variations in solar mid-and near-ultraviolet radiation (200–400 nm). J. Geophys. Res. Atmos. 1997, 102, 29939–29956. [Google Scholar] [CrossRef]
  43. de Toma, G.; White, O.R.; Chapman, G.A.; Walton, S.R.; Preminger, D.G.; Cookson, A.M. Solar cycle 23: An anomalous cycle? Astrophys. J. 2004, 609, 1140. [Google Scholar] [CrossRef] [Green Version]
  44. Gleissberg, W. Secularly smoothed data on the minima and maxima of sunspot frequency. Sol. Phys. 1967, 2, 231–233. [Google Scholar] [CrossRef]
  45. Feynman, J.; Ruzmaikin, A. The Centennial Gleissberg Cycle and its association with extended minima. J. Geophys. Res. Space Phys. 2014, 119, 6027–6041. [Google Scholar] [CrossRef]
  46. Wang, Y.M.; Lean, J.L. A New Reconstruction of the Sun’s Magnetic Field and Total Irradiance since 1700. Astrophys. J. 2021, 920, 100. [Google Scholar] [CrossRef]
  47. Myhre, G.; Myhre, C.L.; Forster, P.M.; Shine, K.P. Halfway to doubling of CO2 radiative forcing. Nat. Geosci. 2017, 10, 710–711. [Google Scholar] [CrossRef] [Green Version]
  48. Mann, M.E. Little ice age. Encycl. Glob. Environ. Chang. 2002, 1, 504–509. [Google Scholar]
  49. Haustein, K.; Otto, F.E.; Venema, V.; Jacobs, P.; Cowtan, K.; Hausfather, Z.; Schurer, A.P. A limited role for unforced internal variability in twentieth-century warming. J. Clim. 2019, 32, 4893–4917. [Google Scholar] [CrossRef]
  50. Usoskin, I.G.; Hulot, G.; Gallet, Y.; Roth, R.; Licht, A.; Joos, F.; Khokhlov, A. Evidence for distinct modes of solar activity. Astron. Astrophys. 2014, 562, L10. [Google Scholar] [CrossRef]
  51. Inceoglu, F.; Simoniello, R.; Knudsen, M.F.; Karoff, C.; Olsen, J.; Turck-Chiéze, S.; Jacobsen, B.H. Grand solar minima and maxima deduced from 10Be and 14C: Magnetic dynamo configuration and polarity reversal. Astron. Astrophys. 2015, 577, A20. [Google Scholar] [CrossRef] [Green Version]
Figure 1. The 121 day running means of individual TSI instrument measurements and resulting composite after adjustment/homogenisation of the absolute level and quality control by intercomparison.
Remotesensing 14 01072 g001
Figure 2. Purple curve: daily mean composite TSI values. Green curve: 121 day running mean composite TSI values. Light blue curve: 121 day running mean of TSI regression model based on F10.7 radio flux and Photometric Sunspot Index (PSI). Orange curve: 121 day running mean of TSI regression model based on MgII core to wing ratio and PSI.
Remotesensing 14 01072 g002
Figure 3. Orange curve: annual mean TSI observations from 1992 to 2020. Light blue curve: annual mean MgII-based TSI model from 1979 to 2020. Green curve: annual mean F10.7-based model from 1948 to 2020. Purple curve: annual mean SN-based model from 1700 to 2020.
Remotesensing 14 01072 g003
Figure 4. Difference between Sunspot-based annual mean TSI and other TSI estimates. Purple curve: difference with F10.7-based TSI Model. Green curve: difference with MgII-based TSI Model. Light blue curve: difference with Composite TSI Observations.
Remotesensing 14 01072 g004
Figure 5. Purple curve: 11 year running mean of annual TSI between 1700 and 2020. Green line: long-term average of the TSI from 1700 to 2020: 1363.4 W/m2.
Remotesensing 14 01072 g005
Figure 6. Root Mean Square Difference (RMSD) as a function of the time shift T between the last 100 years of the 11 year running mean TSI variation and the 2 earlier periods, see Equation (7).
Remotesensing 14 01072 g006
Figure 7. Purple curve, right scale: global temperature change. Green curve, left scale: greenhouse gas radiative forcing. Blue curve, left scale: solar radiative forcing. Ochre curve, left scale: combined greenhouse gas and solar radiative forcing.
Remotesensing 14 01072 g007
Table 1. List of various studies on the TSI increase since the Maunder Minimum.
ReferenceTSI Increase Since Maunder Minimum
[15]3.3 W/m2
[16]1.3 W/m2
[14]1.25 W/m2
[17]6 W/m2
[18]0.34 W/m2
[19]0.93 W/m2
Table 2. Characteristics of individual TSI instrument time series. The instrument acronyms are listed at the end of the paper.
InstrumentReferenceStartEndai
ACRIM 2[30]199120010.999220
SOVA 1[32]199219930.998723
SOVA 2[32]199219930.99744
DIARAD/VIRGO[33]199720170.997873
PMO-6/VIRGO[33]199720170.998241
ACRIM 3[6]200220131.001572
TIM/SORCE[26,34]200320171.0039663
SOVA-Picard[25,35]201020131.001152
PREMOS[36]201020131.001719
TIM/TCTE[27]201320191.001267
TIM/TSIS 1[28]201820211.001014
Table 3. RMSDs between longest individual TSI instrument time series and composite TSI time series.
InstrumentRMSD (W/m2)
ACRIM 20.16
DIARAD/VIRGO0.10
PMO-6/VIRGO0.12
TIM/SORCE0.15
Publisher’s Note: MDPI stays neutral with regard to jurisdictional claims in published maps and institutional affiliations.

