Article

Assessing the Performance of Irrigation Systems in Large Scale Urban Parks: Application to the Case of Valdebebas, Madrid (Spain)

by
Freddy Canales-Ide
*,
Sergio Zubelzu
,
Daniel Segovia-Cardozo
and
Leonor Rodríguez-Sinobas
HIDER Research Group, Escuela Técnica Superior de Ingeniería Agronómica, Alimentaria y de Biosistemas (ETSIAAB), Universidad Politécnica de Madrid, 28040 Madrid, Spain
*
Author to whom correspondence should be addressed.
Remote Sens. 2022, 14(5), 1060; https://doi.org/10.3390/rs14051060
Submission received: 15 December 2021 / Revised: 9 February 2022 / Accepted: 18 February 2022 / Published: 22 February 2022
(This article belongs to the Special Issue Remote Sensing for Agricultural Water Management (RSAWM))

Abstract

:
This paper presents a novel approach to assess spatial and temporal irrigation performance in urban parks and can assist park manager/operator decisions in irrigation management. First, irrigation needs are estimated by traditional irrigation scheduling and the irrigation zones with similar water needs that share the same electric valve (hydrozones) are identified. Then, irrigation performance is calculated using the relative water supply (RWS) indicator and mapped (GIS software). This approach can be adapted to various spatial and temporal scales. In this study, it was applied to the Valdebebas urban development VBB (Madrid) between the 2017 and 2019 irrigation seasons. The results for the VBB parks showed high spatio-temporal variation in irrigation performance among plant typologies within an irrigation season, which can be explained by the landscape coefficient KL variation across the parks. Likewise, this variation was also observed among the three evaluated seasons; explained among other factors by differences in irrigation management. For each hydrozone, the estimation of the NDVI index by Sentinel-2A satellite images in 2019 showed a threshold on irrigation performance. Thus, the remote sensing data together with the proposed approach can be a valuable tool for helping park managers/technicians adopt better decisions on irrigation practices.

1. Introduction

Currently, most of the world’s population lives in cities, and the trend of moving from rural to urban areas will continue in the near future. In developed countries, landscape irrigation in urban settings uses between 40% and 70% of the water supply [1,2,3]. In the XXI century, water conservation in arid and semi-arid climates faces issues such as limited water supply, cyclical droughts, population increases, and competence among water users. According to the IPCC’s Sixth Assessment report on the effects of climate change, water will be scarce, and the greenhouse emissions will also increase [4]. In big cities, these effects will ameliorate with the development of green areas (parks and gardens) that will increase relative humidity and buffer heat waves.
In arid and semi-arid regions, urban parks need irrigation during the hottest months, where evapotranspiration exceeds precipitation, thus water demand increases [2,5,6] and raises the challenge to improve and/or maintain water use performance in urban irrigation. Mostly, urban parks in these regions encompass plant species with high water requirements or ones that are adapted to humid climates.
Current trends in landscape design avoid large covers of cold season lawns and exotic plants and these species have been replaced by native species and/or adapted to the local climate with low water needs [7,8].
Most studies addressing green area irrigation focus on the estimation of landscape water requirements and the development of strategies for its management. Hence, early studies have focused on issues such as: the estimation of the plant coefficient, the development of methodologies for ornamental plants, and the adaptation of those for extensive crops [9,10], and their comparison [11]. Soil water content probes are usually used for irrigation scheduling [12,13]. Moreover, during the last years, decision tool systems, remotely sensed land data, low-cost sensors, and environmental variables have been applied (Cano et al., 2018). Likewise, for large green areas weather prediction models have also been used to estimate water needs, although with less resolution [14].
Irrigation mismanagement in green areas can result in irrigation inefficiency. Over irrigation causes a waste of water and energy and the development of multiple phytosanitary problems [15,16]. In addition, soils and aquifers may be contaminated by chemical leaching [17]. Moreover, under irrigation results in water stress, which decreases ornamental quality and in severe cases causes plant death [6,18,19]. Thus, proper irrigation management may monitor water use efficiency through different indicators such as the ones used in agricultural crops such as annual relative irrigation supply (ARIS,), annual relative water supply (ARWS), and relative rainfall supply (RRS) [20,21,22]. The RWS indicator has been adopted in landscape irrigation [23], although irrigation in green areas does not search for a measurable yield (agricultural crops) but for an optimum plant quality, which fulfills aesthetic standards. Unlike the other indicators, RRS includes the rainfall contribution to plant water requirements and is calculated as the ratio between the sum of irrigation water and rainfall over the landscape water demand [24].
The technological developments of the new generation of remote sensors have provided an operational tool to estimate among others the normalized difference vegetation index (NDVI). This measures the vegetation color and is used to estimate plant leaf density and evapotranspiration [25,26,27]. This index is widely used in horticultural and field crops, although it is seldom developed for ornamental species. Nevertheless, the launch of the Sentinel-2 satellites allows the observation of NDVI variations at a higher spatial resolution (10 m) and a smaller time scale (5–10 days) and are more suited for city parks [28,29]. Since urban green areas are aimed at providing greenery, ornamental quality, environmental services, and well-being to the citizens, recent studies show that the NDVI index is directly linked to citizens’ and surrounding neighbors’ happiness [30,31,32,33] and is a good indicator for the ornamental quality of parks and gardens.
Current irrigation management for urban parks is based on applying plant water requirements, yet irrigation performance is not considered. Plant water needs are estimated by the reference evapotranspiration (calculated by weather station data), multiplied by a garden coefficient, and sometimes soil water content is also considered. Although several reports address irrigation performance in urban green areas, there is a gap in large parks encompassing several hydro-zones with specific ornamental plants irrigated by automated valves, which are commanded by a central station. Moreover, no study on irrigation management in large parks has considered the assessment of both plant water requirements and irrigation performance, which would have some benefits. On the one hand, the development of irrigation performance maps will show how water resources are used across the parks. On the other hand, it can be a decision tool to guide irrigation managers/operators on how much water to apply (and thus to schedule irrigation) for each hydrozone. Thus, the manager could graphically visualize how irrigation is being applied and its performance, which will help on addressing issues caused by poor management (e.g., overwatering or water deficit). The innovation on mapping irrigation performance is even more challenging for the management of extensive green areas (large parks) composed of different species and plant arrangements. Large parks also develop various microclimates, which makes it difficult to manage irrigation.
This paper is based on the above framework and considers the results of previous studies carried out by the authors in the urban development of Valdebebas VBB in Madrid (Spain), which showed that the improvement in water management could save about 35.2% of water [34]. It is aimed at developing an approach for assessing the spatial–temporal irrigation performance in large automated parks. The approach will be applied to the VBB parks, and the results will guide the irrigation technician to make proper irrigation decisions. Likewise, this information is going to be completed with the evaluation of the NDVI variation across the parks by satellite images and the study of any relation between NDVI index and the water will be applied.
The main objective of this study is to develop an approach for assessing the spatial–temporal irrigation performance in large automated parks in order to guide/support irrigation technicians on proper irrigation management. It will take into account both plant water requirements in the hydrozones (areas with similar water requirements and sharing the same electric irrigation valve) and their RWS indicator; both will be visualized on maps. In addition, as a specific objective the relation between the NDVI index and the water applied across the parks will be analyzed. The approach will be validated in the VBB parks.

2. Materials and Methods

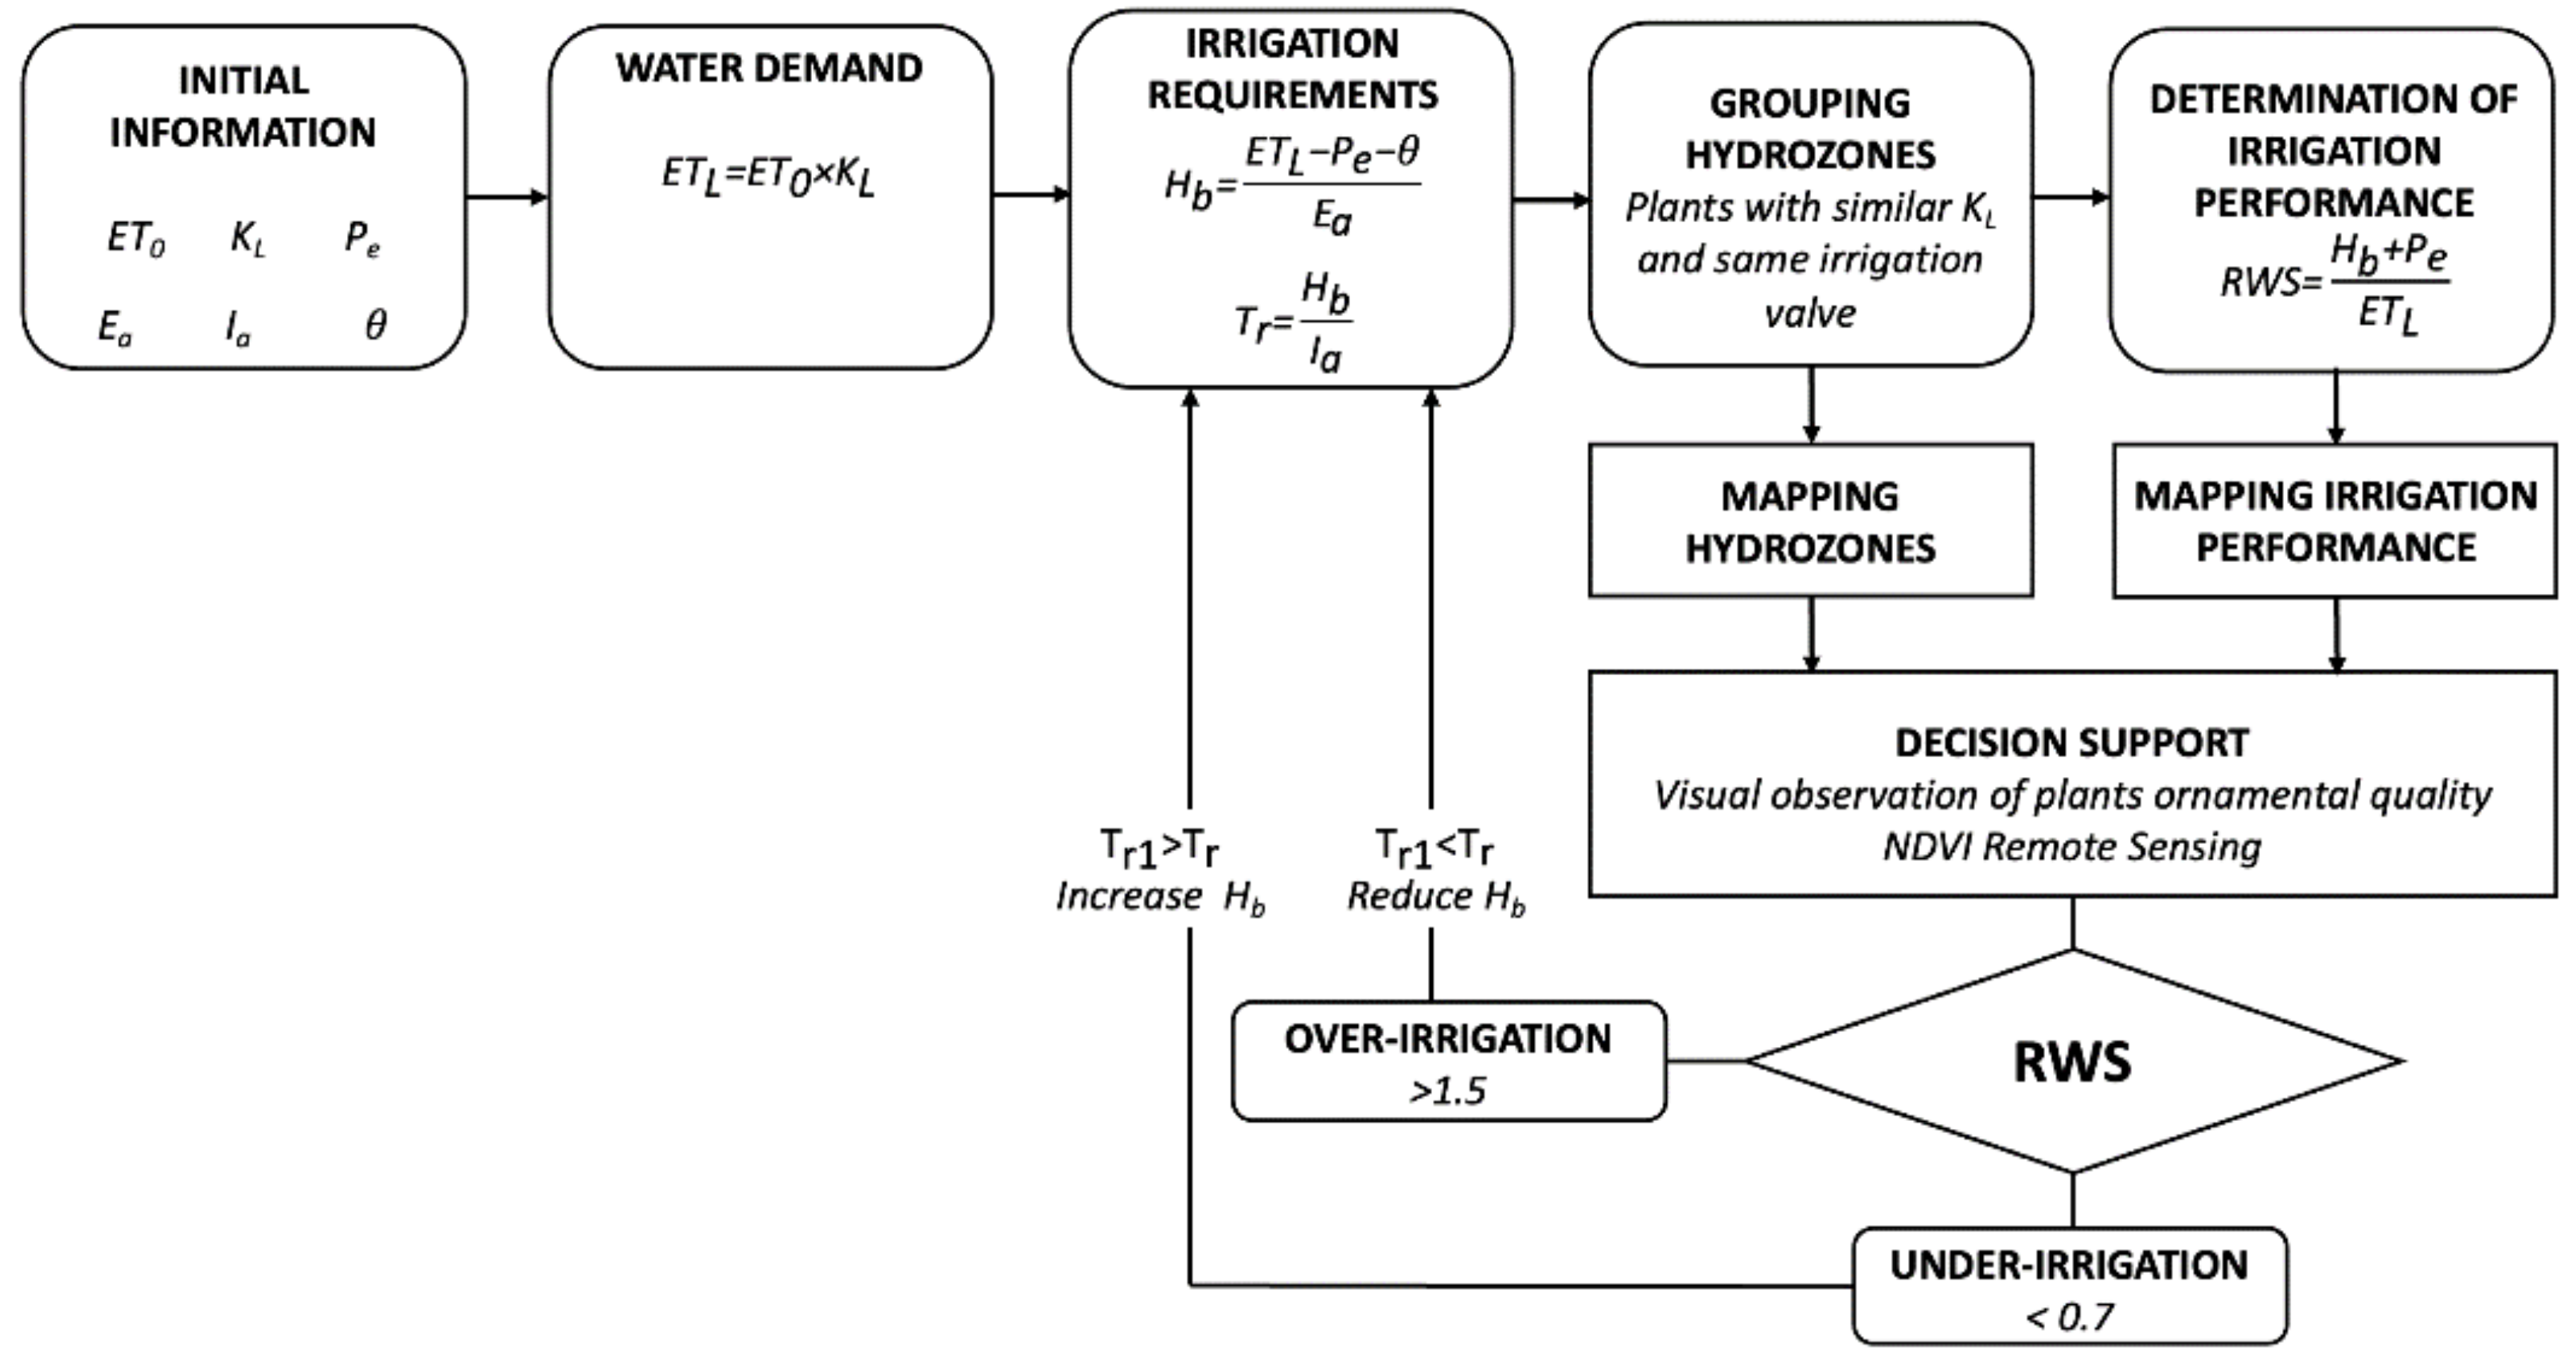
2.1. Approach for Assessing Irrigation Performance in Large Scale Urban Parks

The scheme in Figure 1 presents the steps describing the procedure for assessing the spatial and temporal irrigation performance in large urban parks by calculating and mapping irrigation performance indicators for each plant arrangement and time scale.
The first step of the approach determines the initial variables: reference evapotranspiration (ET0), plant coefficient for each (group) of specie(s) (KL), irrigation efficiency (Ea), effective rainfall (Pe), irrigation rate (Ia), and, if measured, soil water content (θ). Then, the following factors were determined: water requirements ETL, bulk irrigation depth (Hb), and irrigation time (Tr). All these steps are typical in irrigation scheduling.
Among the procedures for the ETL estimation, WUCOLS [10,35] is used worldwide, although other methods can also be applied according to local park conditions [11,36,37,38].
The water application efficiency of an irrigation system (Ea) will depend on variables such as hydraulic design, emitter clogging, and inlet pressure. Its variability over time is rarely considered in park irrigation management, although together with a precise ETL estimation it will play a key role in not only irrigation management but also the uniformity of water application by irrigation units.
Urban parks in large areas have automated irrigation systems; electric valves open and close following irrigation management variables (Tr and flow). These valves control the water applied to each plant group with similar ETL values (which are usually arranged together), and the plant groups are referred to as plant typology in this paper. Similarly, for every park the valve locations, their covered area, and their Ia must be determined.
The next step in the assessment process matches plant species; considering those with similar ETL values and those operated by the same valve. Each group is called a hydrozone, which can contain one or several plant species. A single electric valve is considered the basic unit for splitting a park into grids or pixels (one park may contain several valves). To standardize the process, the match “irrigated area—ETL—electric valve” generated a code (e.g., park number—plant typology—electro code), regardless of whether they are controlled by a central irrigation system or are operated by multiple irrigation programmers.
Then, a database is developed for every hydrozone containing ETL, Pe, Tr, and Ia for the selected time scale. Finally, the irrigation performance indicator is calculated for each hydrozone.
Among the agricultural water use efficiency indicators, two are used in urban irrigation [39]: one is related to uniformity coefficients and evaluates the water uniformity applied by the irrigation units and the second indicator evaluates irrigation system management over a designated period (monthly and over the irrigation season). The last indicator assesses the performance as a ratio between the amount of water applied to the amount that should have been used. Thus, the irrigation index Ii (ratio between the bulk irrigation water (Hb) over ETL) is typically used in urban areas, although in agricultural areas RWS (calculated as shown in Figure 1) is also used.
In this approach, the relative water supply (RWS) was chosen since it incorporates the contribution of Pe, which can be significant in some months over the irrigation season. The irrigation performance was classified as: water stressed (RWS < 0.7), optimal (0.7 < RWS < 1.5), or over irrigated (RWS > 1.5). Once the time interval Ti is selected, the RWS is calculated as:
RWS = i Ti H b + i Ti Pe i Ti ET L
Finally, two maps, one for the hydrozone water requirements and the other for irrigation performance, are drawn using professional drawing software or GIS platforms. Parks may contain several hydrozones irrigated with different irrigation units. Mapping these hydrozones will facilitate their identification across parks and will guide irrigation managers’ decisions based not only on the spatial hydrozone distribution but also on hydrozone irrigation performance and its spatial/temporal changes.
The mapping of water needs has been extensively applied in crops based on developing information at the microclimatic level [40,41], and this information has been used to delineate dynamic management zones for an “in situ” irrigation scheduling decision–support tool [42]. In urban landscapes, irrigation areas have been delineated based on area parameters (geometry and use), soil characteristics (type and slope), and landscape evapotranspiration coefficients (species, plant density, and microclimate) in a 5 ha university campus and a 0.2 ha public park in Greece, reducing water use by 36% [43]. However, mapping landscape water requirements and their water use efficiency levels is a novel approach.
Hydrozones depend on both plant physiology, which is conditioned among other variables by soil water content, and the operation of the irrigation system. Hydrozone locations across parks will not change in the irrigation season; however, their irrigation performances may change among hydrozones within or between irrigation seasons. Similarly, irrigation management can change over time.
Mapping park hydrozones and their irrigation performances will be a valuable tool for guiding irrigation technicians/managers in their decisions to improve irrigation performance; thus, proper Tr and Hb can be set. If the soil water content is measured in hydrozones, then Hb (and irrigation frequency) could be estimated more precisely.
The VBB parks (107, 108, 202, 203, 204, 301, and 302) were used to apply and validate the approach proposed during 2017, 2018, and 2019.

2.2. Estimation of NDVI Index

The NDVI indices were calculated with Equation (2) in the four typologies and for each of them four hydrozones were randomly selected (minimum size 10 × 10 m) with the same bulk irrigation depth regardless of plant species, microclimate, and leaf area index.
The NDVI value for each hydrozone was calculated by processing 27 cloud-free images from the Sentinel-2A satellite for the irrigation season between 1 May 2019 and 30 October 2019. Bands 4 (red spectral band) and 8 (near infrared spectral band) and pixel size 10 × 10 m were atmospherically corrected Level-2A (Sen2Cor Processor).
NDVI = Band   8     Band   4 Band   8   +   Band   4

3. Case of Study

The approach for assessing irrigation performance will be applied and validated to the urban parks of VBB in northeastern Madrid (Figure 2), which were developed in 2010 and were designed to meet smart city criteria [44]. It covers 1065 ha and comprises green spaces (380 ha) and urban parks (18 ha). These parks are irrigated by subsurface drip irrigation with municipal reclaimed wastewater, which is stored in two 5000 m3 tanks. The water is pumped to the distribution network (55 km of pipes) by three pumps (120 m3/h each). The irrigation infrastructure is fully automatized and controlled. It is operated by irrigation management software on the central station computer and is operated by the park technician.
The area has a Mediterranean climate, where rainfall is scarce or almost null during the summer months; the irrigation season begins in May and ends in October. As in most urban parks in smart irrigation systems, the VBB lacks studies addressing its operation criteria and this study is the first one.
Figure 3 shows the daily ET0 values for the study years, which averaged 6.5, 6.6, and 6.7-mm d−1 for 2017, 2018, and 2019, respectively. The driest period occurred from July to August, coinciding with the highest irrigation needs.
Figure 4 presents the Pe values. The mean Pe values were 159.1 mm (2017), 97.35 mm (2018), and 241.5 mm (2019), contributing 15%, 20%, and 12% to the park water demands, respectively. Rainfall events were rare and unevenly distributed during the irrigation season. Pe was almost nonexistent during the driest months (July and August), except in 2017, which had three important rains in July. Notably, the VBB area is prone to heavy storms during the summer and experiences severe droughts (one out of four or five years). Similarly, in the spring season rainfall events are more frequent in wet years, as occurred in 2018.

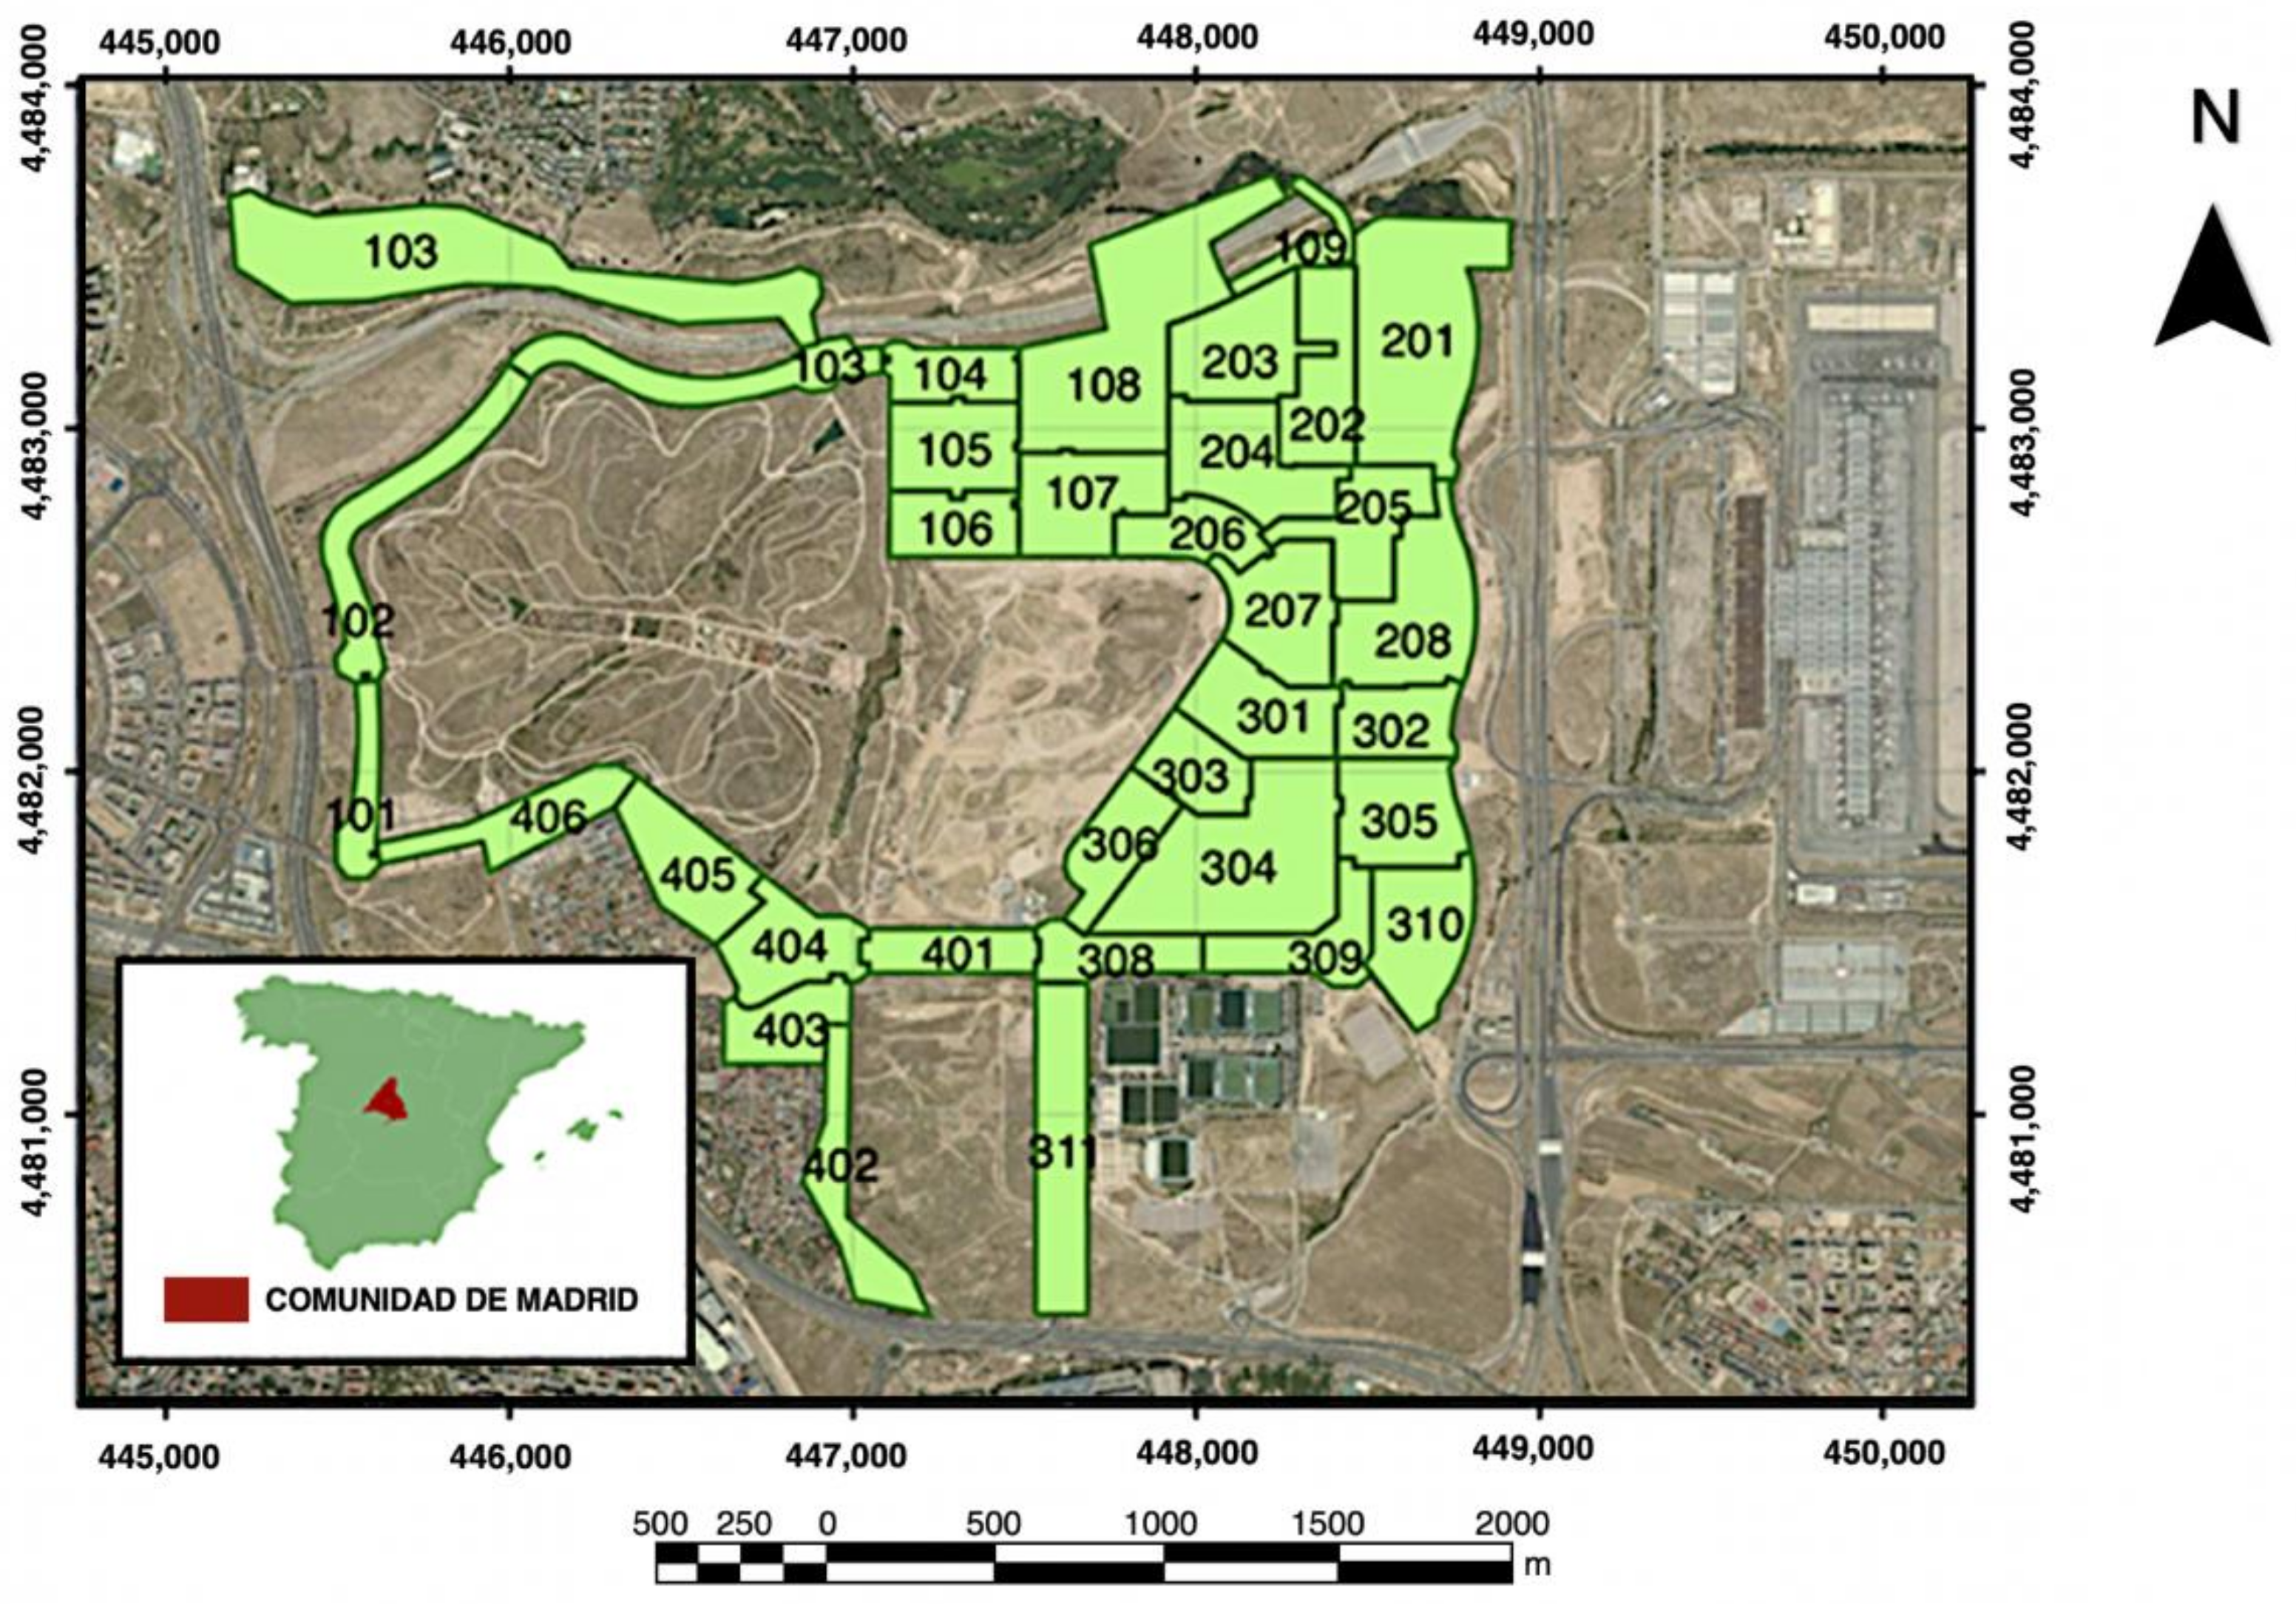
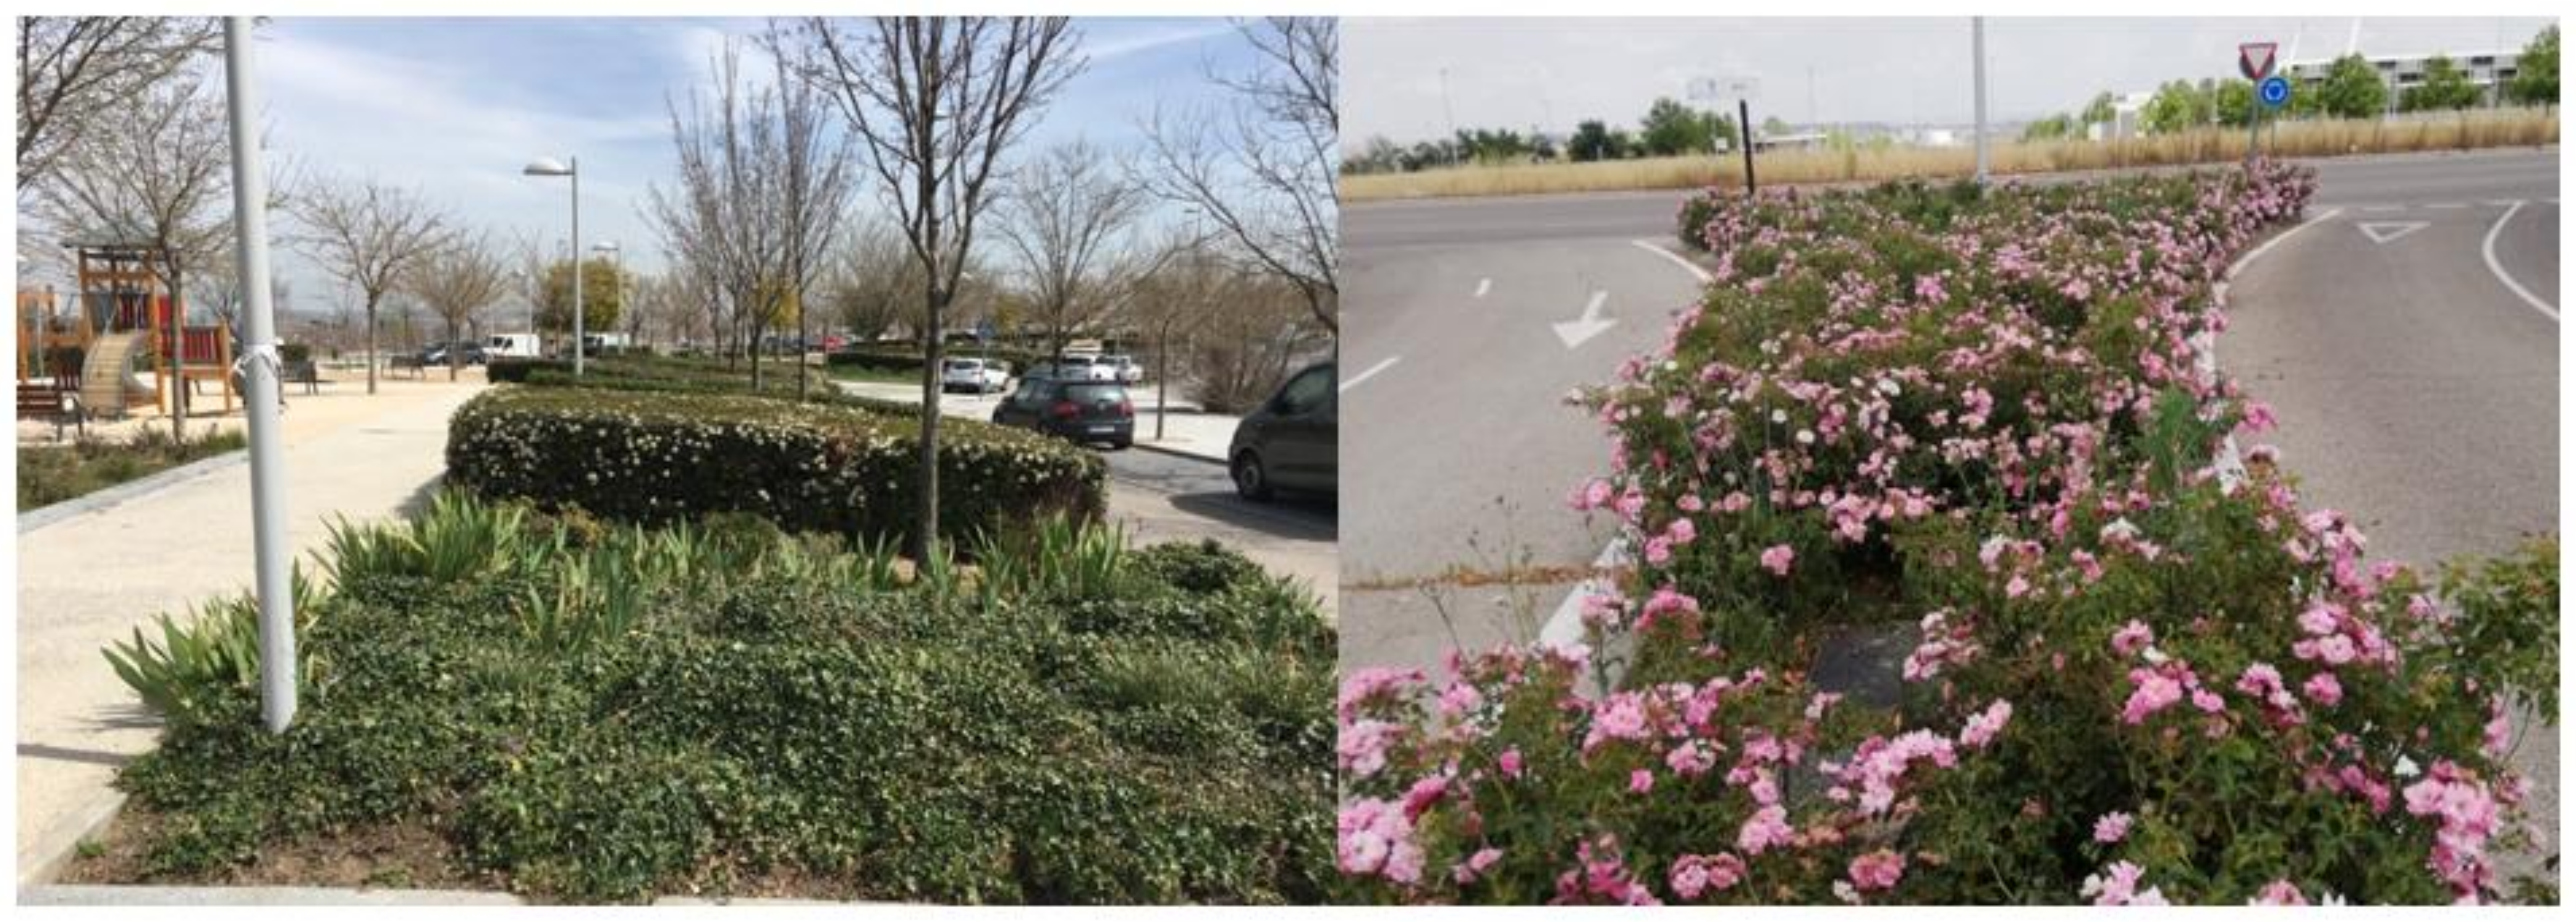
3.1. Description of Urban Parks and Irrigation Systems

VBB has 34 parks (see Figure 1) containing several plant species with low water requirements and tolerance to water stress conditions that are arranged to meet sustainability criteria and to optimize irrigation operations. Hence, the plants with similar water requirements are grouped into four major typologies: lawn (LAW), shrub and flower collection (FLO), tree (TREE), and mixed shrub and bush collection (SHR). The average park size is approximately 530 m2, varying from 8–10 m width and 80–100 m long; the smallest size corresponded to FLO (89 m2). A single park encompasses the four typologies, although in the largest parks these can coincide several times as shown in Figure 5.
The areas covered by the plant typologies are as follows: SHR, 80% (the predominant species is Pittosporum tobira); LAW, 9% (children’s playgrounds); FLO, 8% (perennial and nonperennial plants); and TREE, 4%, although the total tree number is high (a single tree can occupy 0.25 m2).
Each park is irrigated by an irrigation sector (a total of 34 sectors in the VBB) that conveys water to the irrigation units: one per plant typology (a total of 136 irrigation units). Each sector and irrigation unit is operated by an electric valve located inside the sector and irrigation unit manhole, respectively. All the valves are triggered from the central station; the irrigation rate for each plant typology is presented in Table 1.
The irrigation distribution network in Valdebebas is complex, and despite its modern design the actual hydraulic performance of the irrigation system has not been evaluated. Thus, there are doubts about the actual irrigation efficiency of the distribution network. The study performed by Canales-Ide [34] in 2017 highlighted that water applied with the current irrigation management exceeded (in some months and plant typologies) more than three times the plant water needs. Additionally, the uniformity of the water applied in some irrigation units was below the standards for drip irrigation.

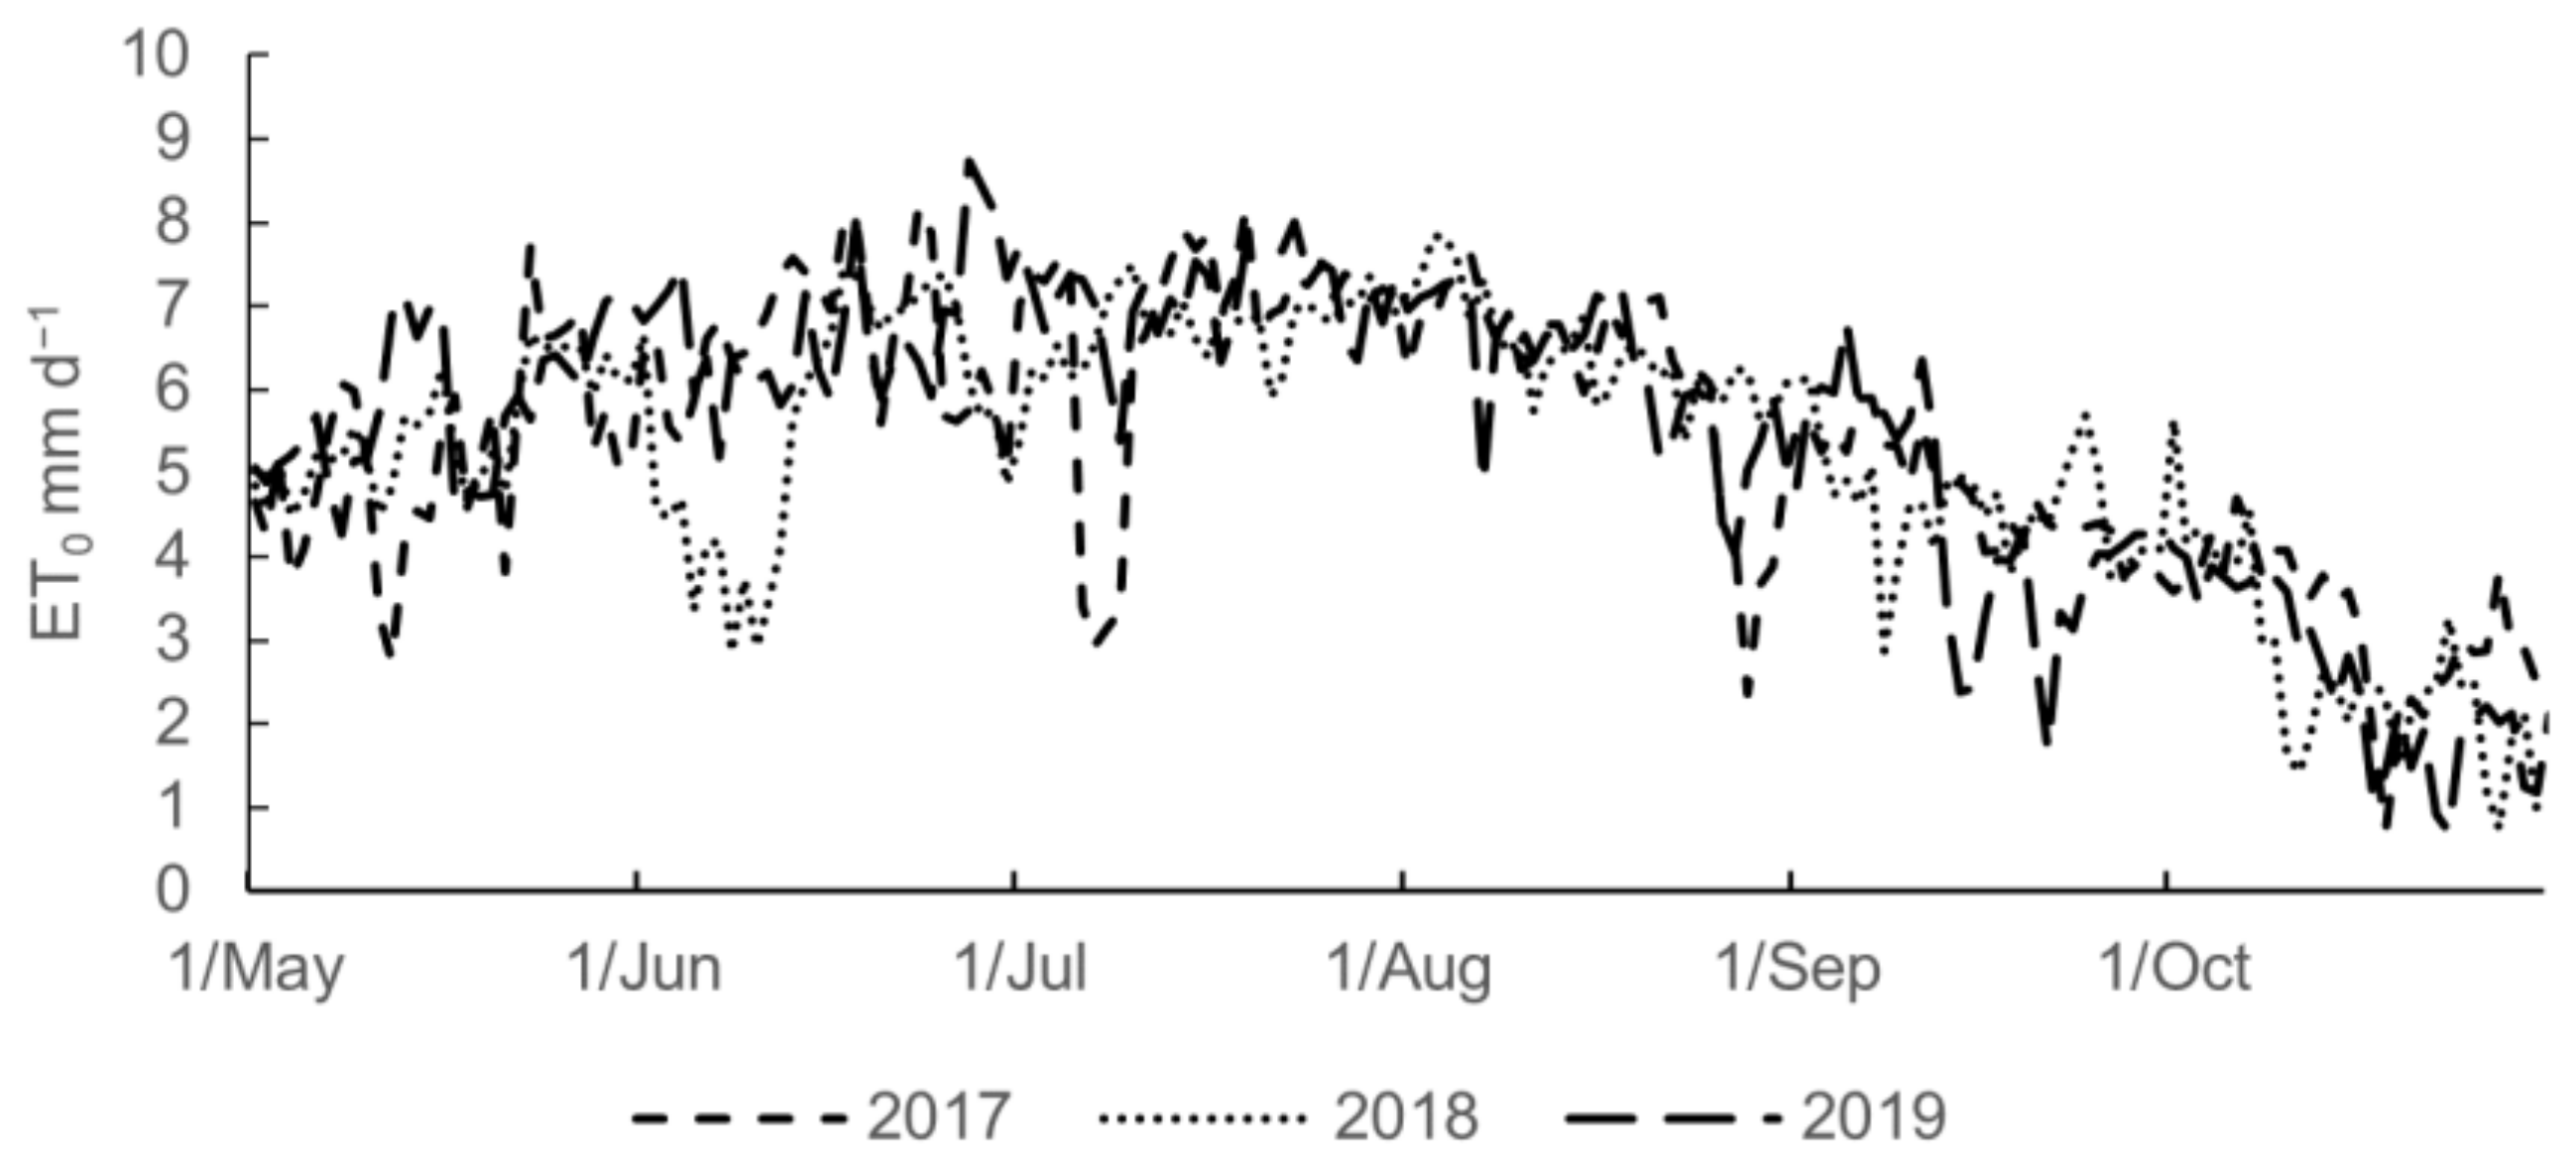
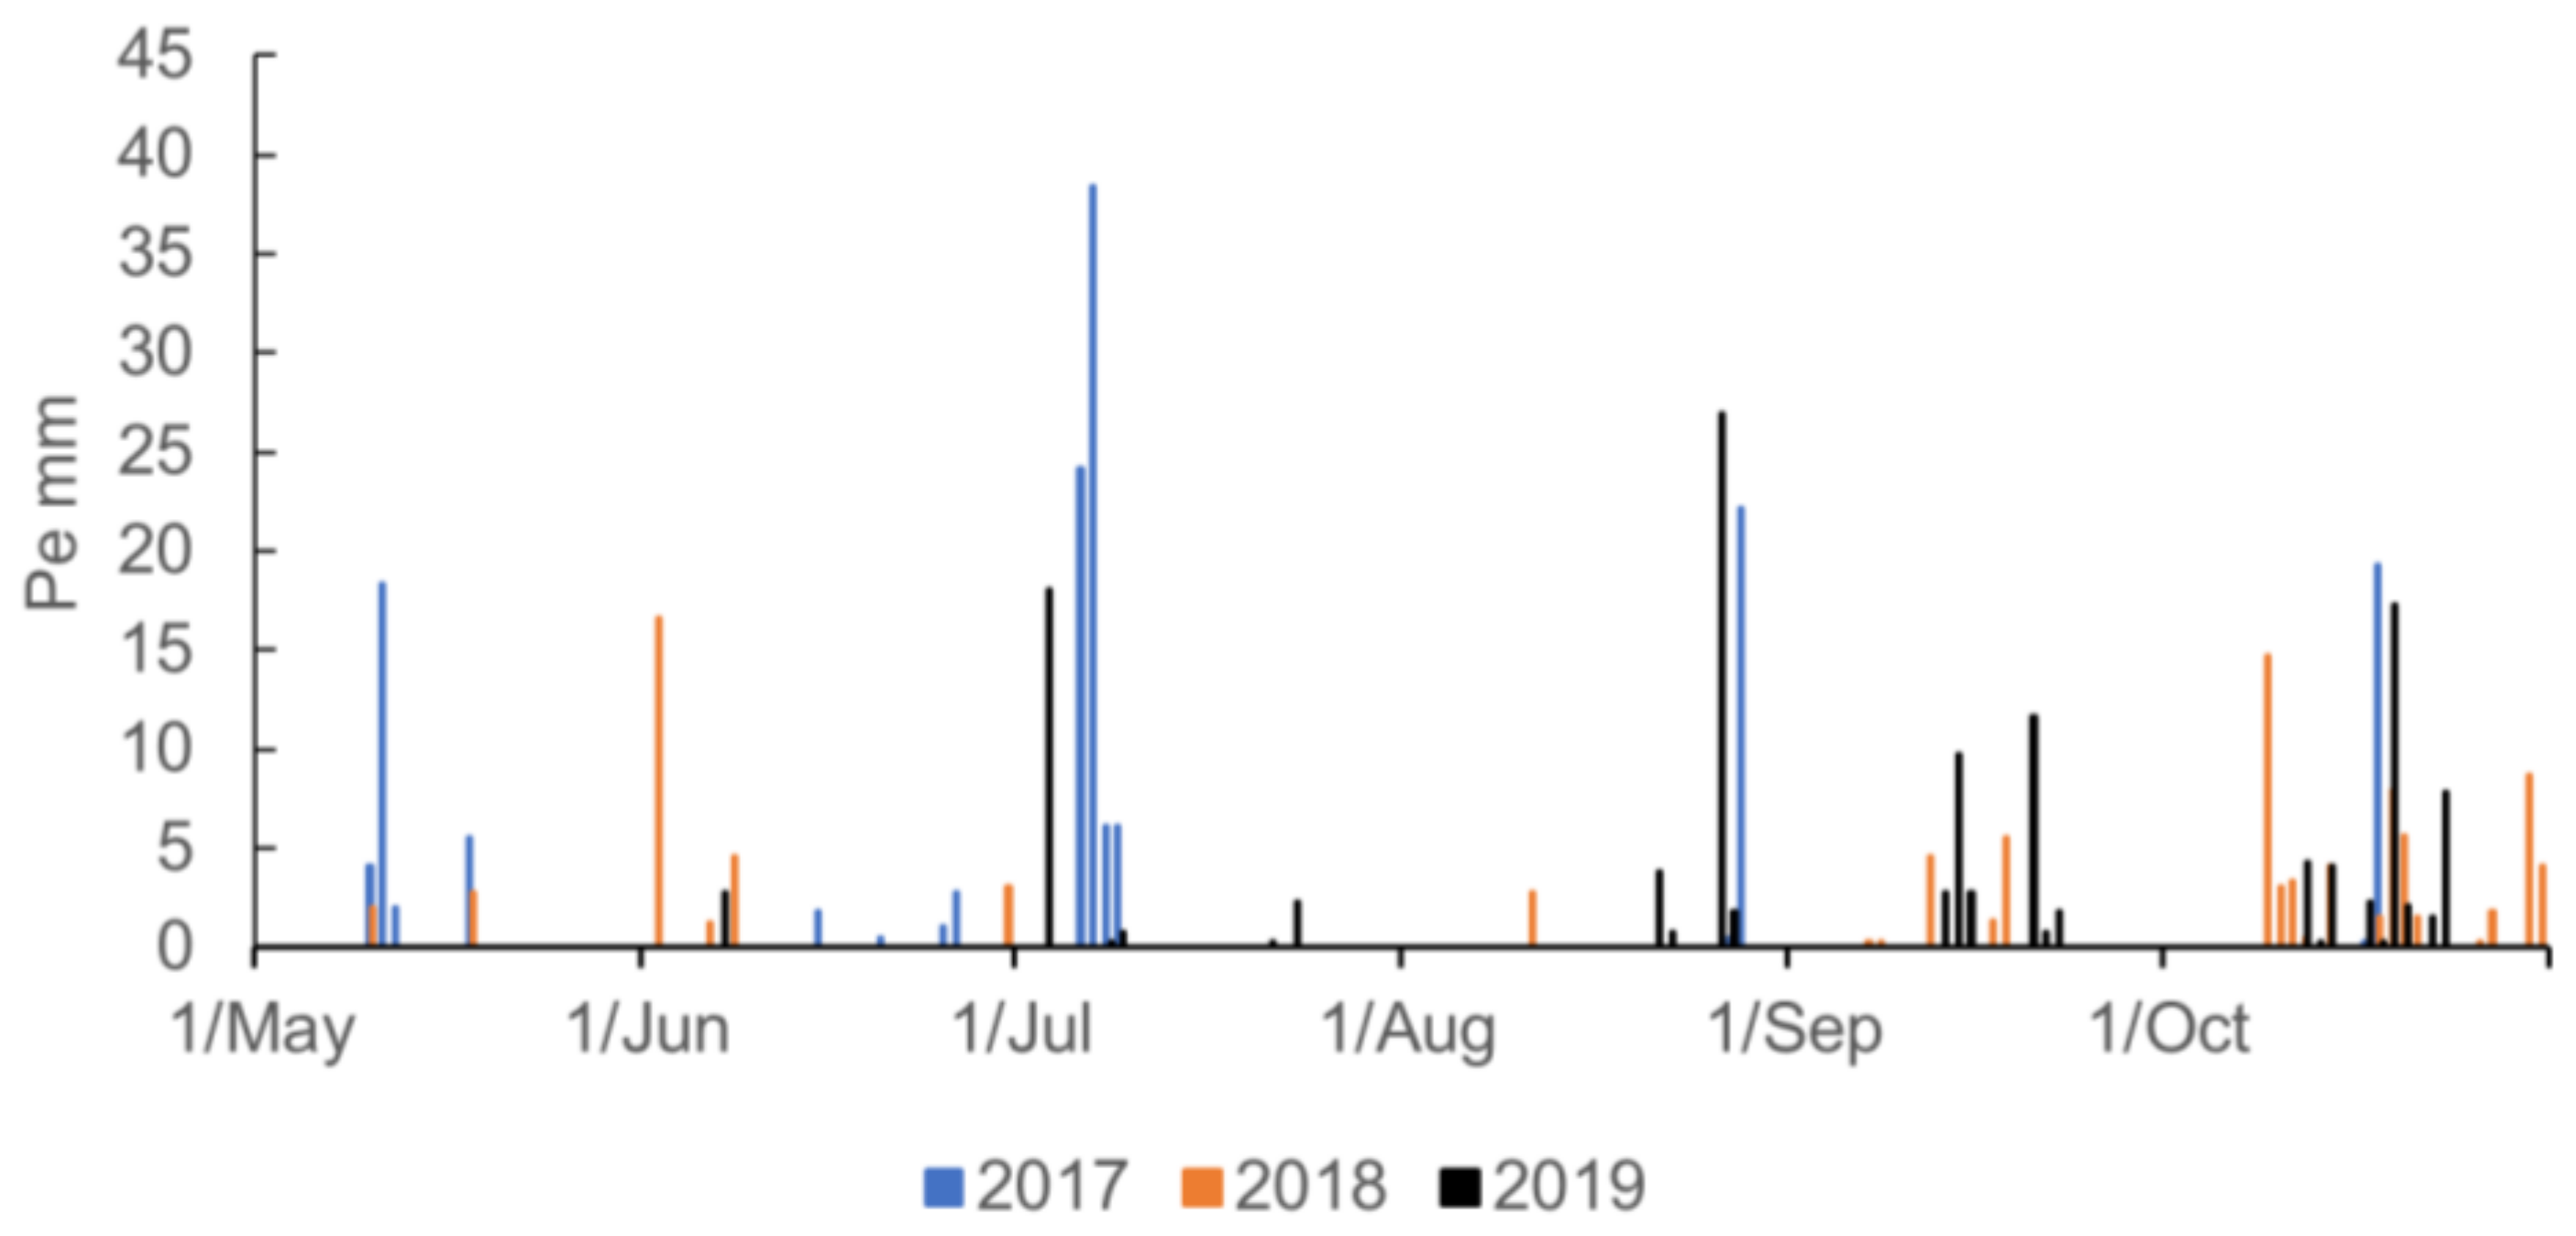
3.2. Application of the Procedure to the VBB Urban Parks

The irrigation management for the 34 parks was set up by the park operators. Table 1 shows the irrigation frequency for the three irrigation seasons. The soil water content was not measured.
The ETL was calculated (on a daily basis) by multiplying the reference evapotranspiration ET0, estimated by the Penman–Monteith equation (with information provided by the local weather station), and a fixed plant coefficient KC (manager decision). The ET0 values were constant across the parks; however, KC varied spatially depending on factors such as plantation density, location of ornamental species, and the phenology stage.
Since the parks were set up in 2010, most vegetation has already fully developed and managers have not differentiated KC among the phenological stages. Thus, among plant typologies KC remained constant within and between irrigation seasons; however, this approach is not advisable. Even though the vegetation was fully developed, not all typological conditions were the same (different conditions in park locations) and they varied spatially and temporally. Thus, for illustrative purposes the plant coefficient was estimated by the WUCOLS methodology, although others also could have been used.
WUCOLS estimates a landscape coefficient (KL) as a product of three coefficients: Kd, the plant density coefficient; Kmc, the microclimate coefficient; and Ks, the plant species coefficient. Kd depends on the leaf area exposed to transpiration. Kmc represents the surrounding conditions such as open areas, dark pavement, walls reflecting solar radiation, shadows, or open water bodies.
For the parks studied, Kd and Kmc were based on the observation of plant vegetative states and their location in the urban landscape and are shown in Table 2. Kmc is affected by the surrounding buildings (height and location materials), of which shadow and windbreaker effects will impact plant evapotranspiration. The Ks coefficient for each plant species was based on Costello [10] and is shown in Table 3. This value also represents the adopted coefficient for each plant typology (Ks Mix), which was calculated by averaging the Ks of the plant species within a park.
The software program determined irrigation needs (Hb) for each plant typology without considering Ea; hence, they correspond with ETL. Once Hb is known, Tr is determined taking into account the Ia of the corresponding electric valve. In 2017, Tr was the same for all irrigation events, because the central station computer burned and did not function appropriately. Thus, irrigation scheduling could not fit the ETL.
Each plant grouping with similar ETL values and the same electric valve (called a hydrozone) followed the code: park number hydrozone-electro-valve code. The database for each hydrozone and irrigation event must include: ET0 and Pe (from the weather station), KL coefficients, and Ir and Tr. Then, Hb and RWS are calculated as indicated in Figure 3 and finally the maps for the hydrozone with the RWS values were drawn using GIS software ArcMap 10.4 (ESRI, Redlands, CA, USA). Even though the maps could have been performed daily, they were achieved weekly considering the irrigation schedule presented in Table 1.

4. Results

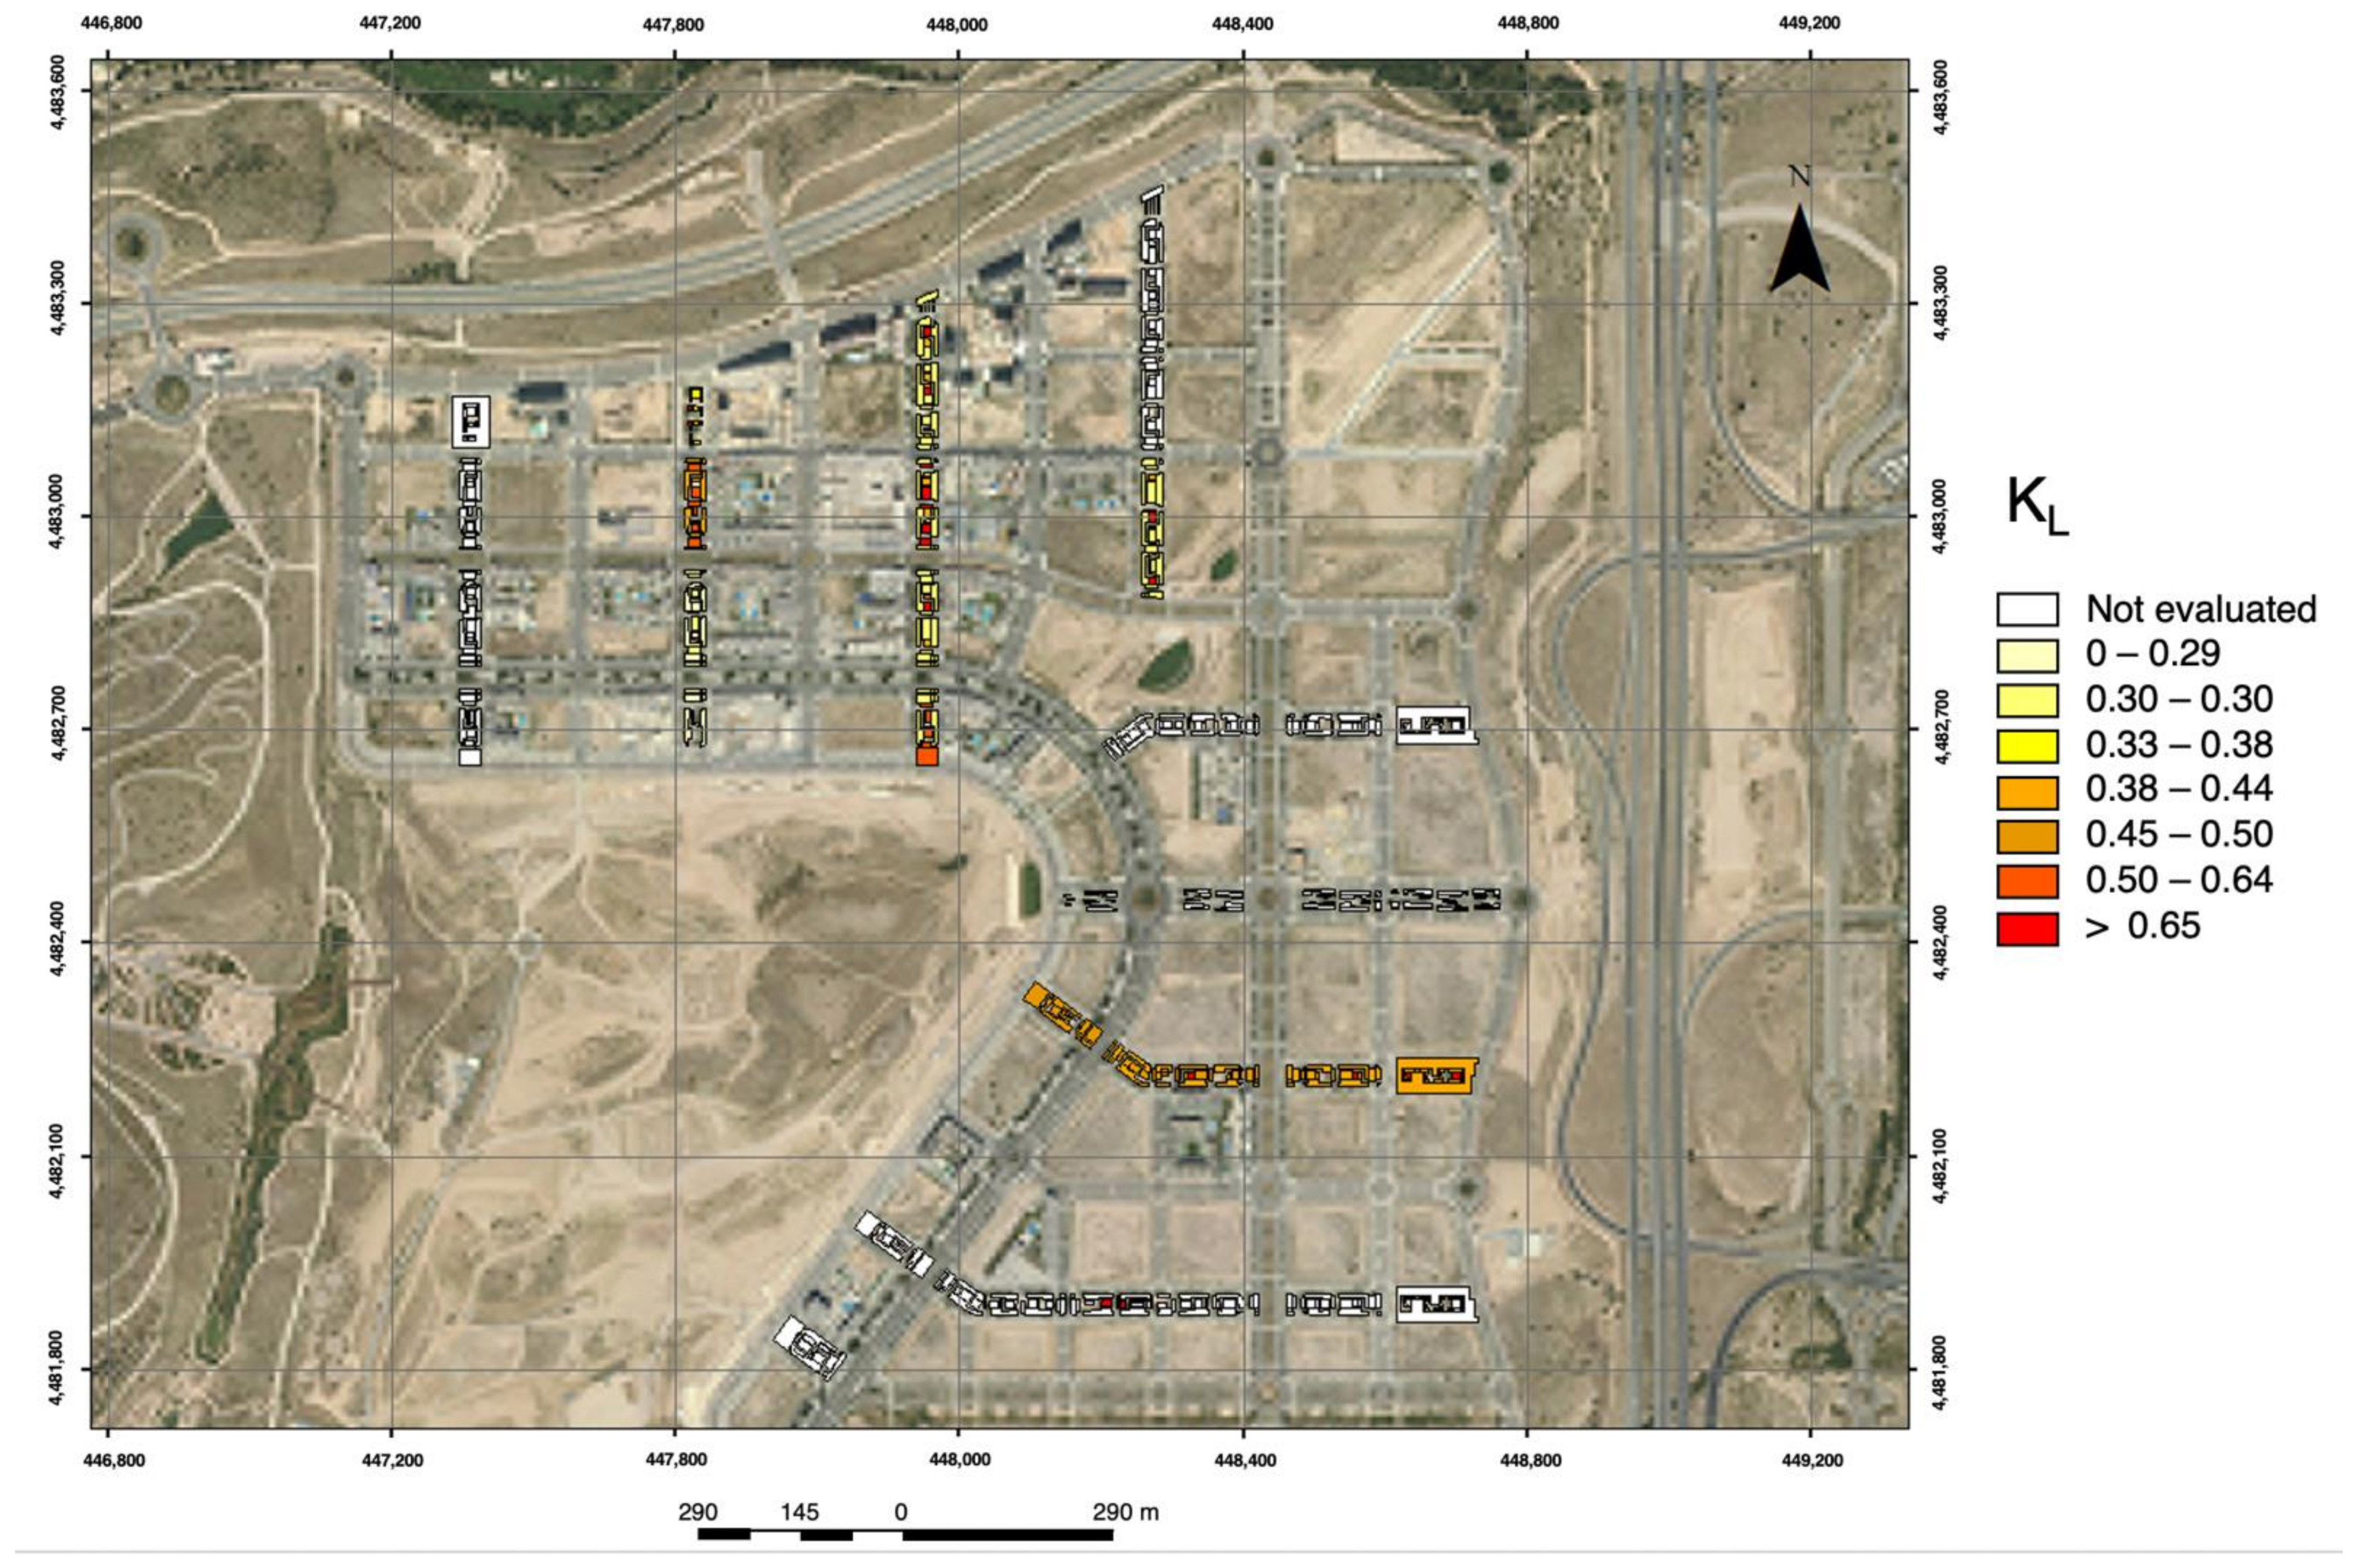
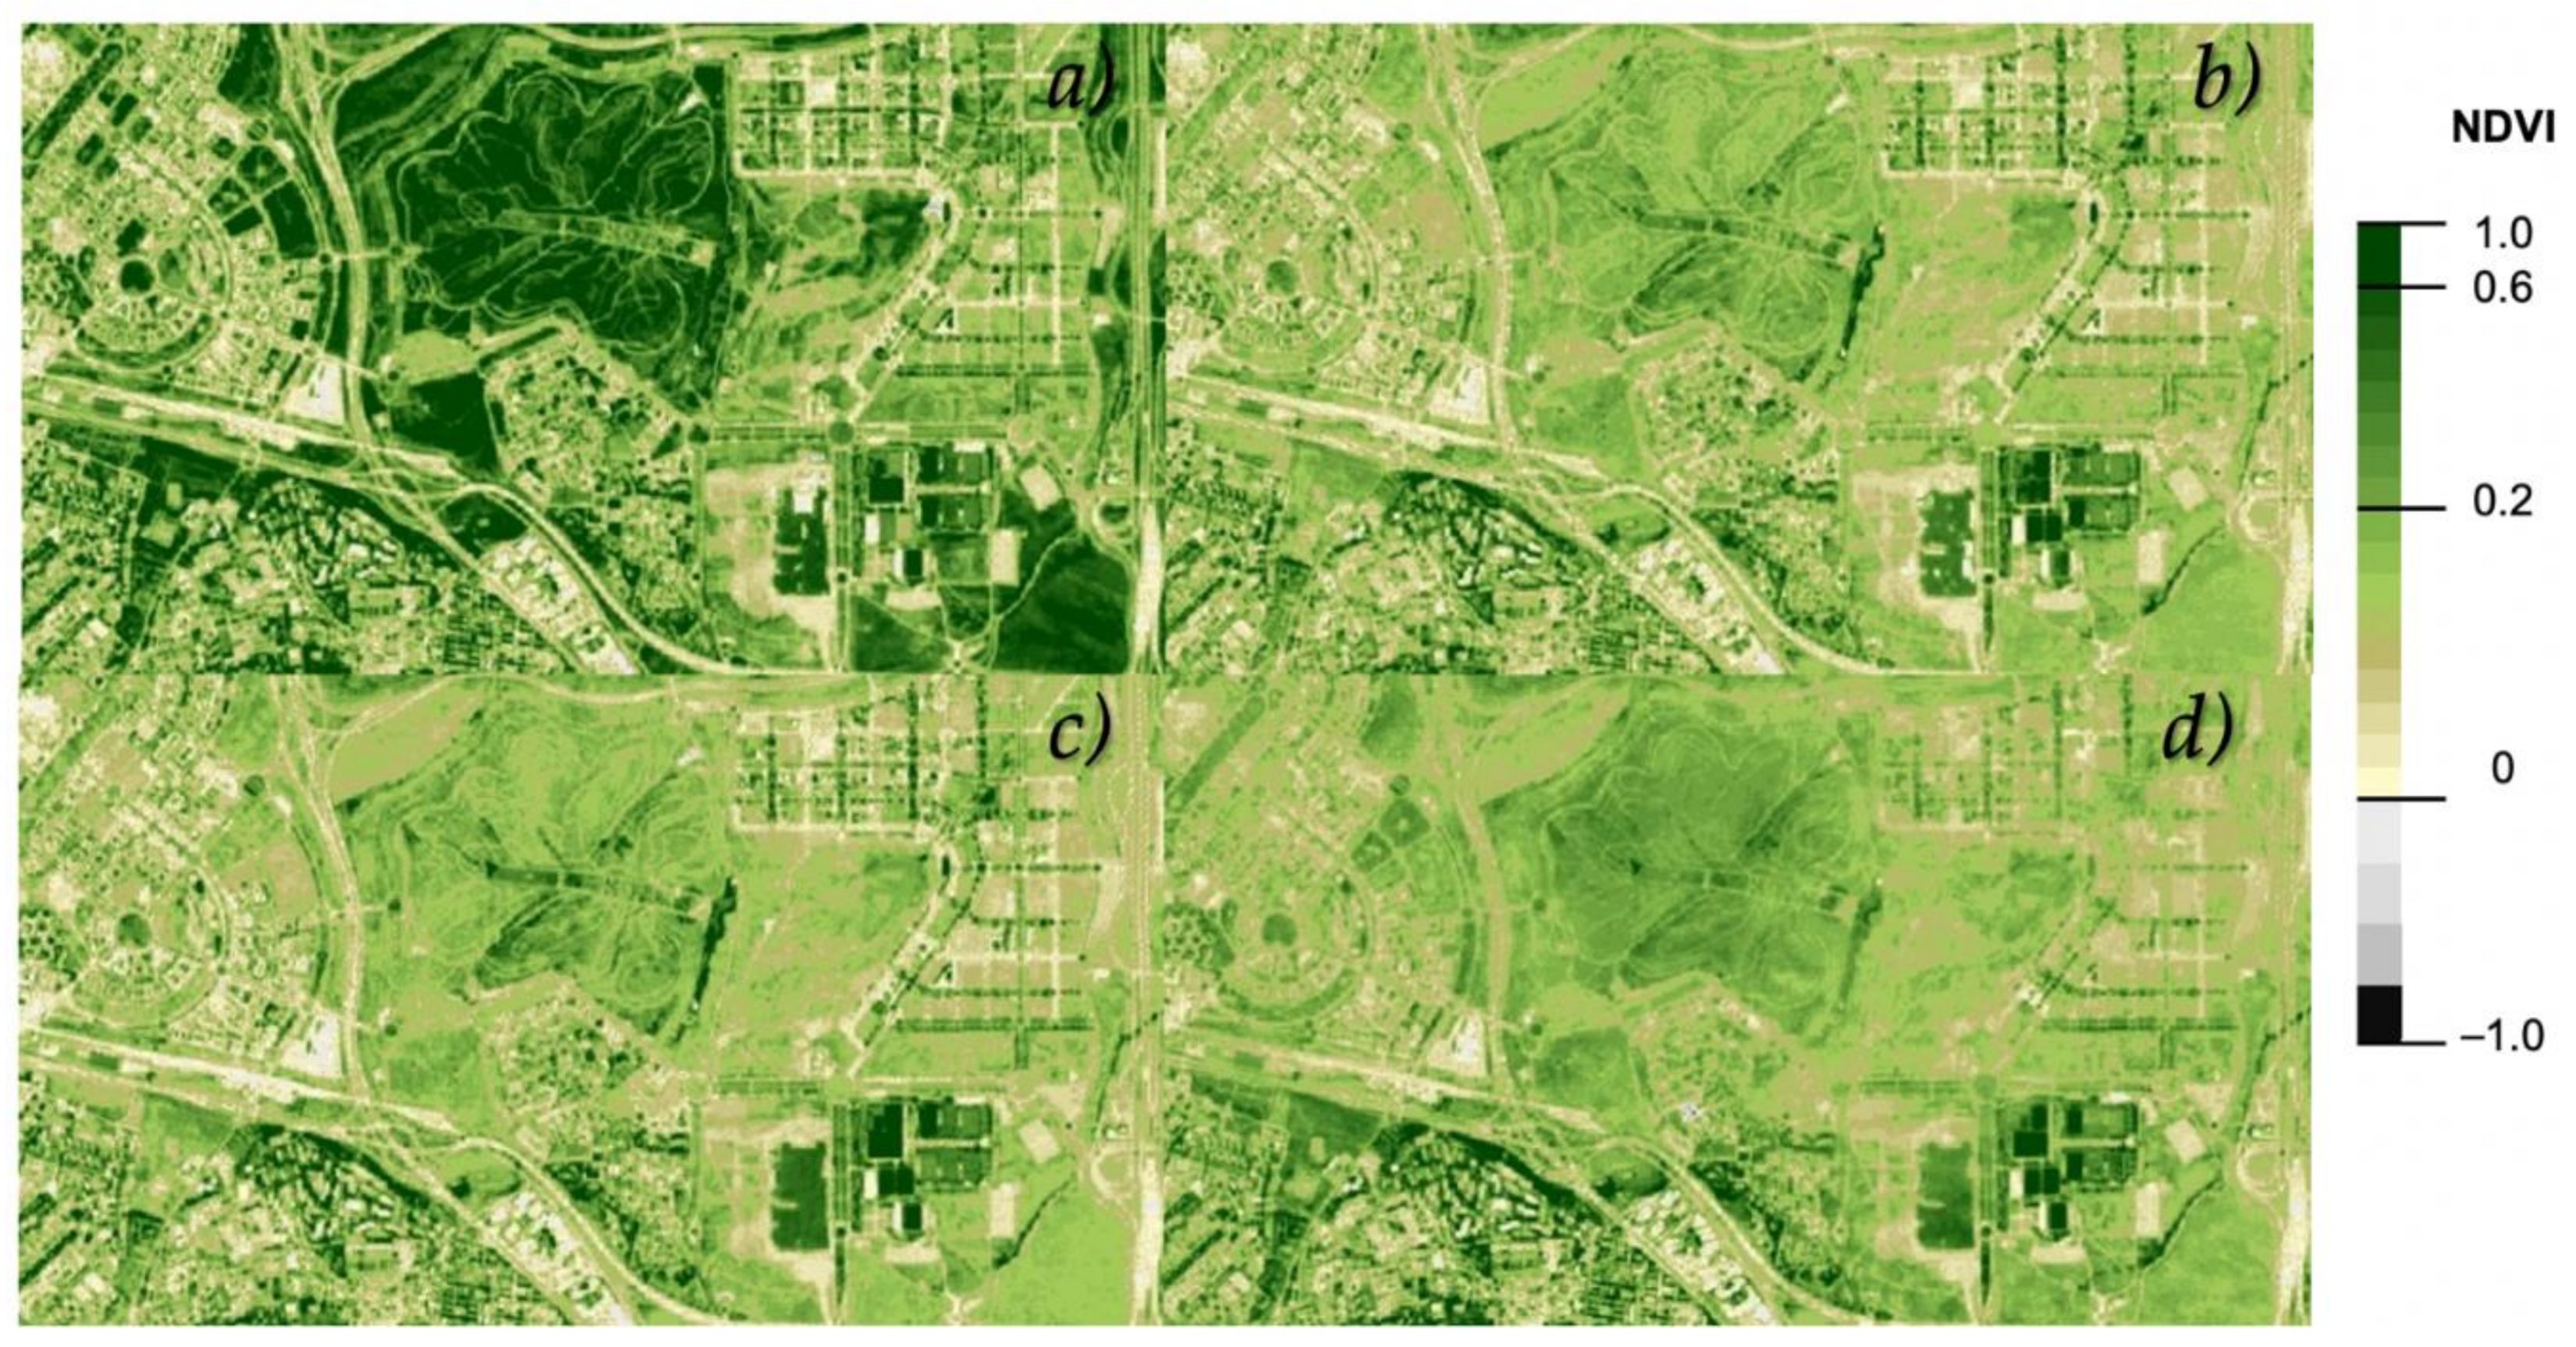
4.1. Maps of Hydrozones and Their Irrigation Performance in the VBB Urban Parks

As an example of hydrozone maps, Figure 6 shows the KL coefficients (WUCOLS) for the three evaluated parks (66 electric valves). This coefficient would be the same for the plant water requirements, since ETL = ET0 × KL. As mentioned above, KL varied across parks depending on the plant species in the hydrozone, plantation density, and microclimate; the minimum value was observed for TREE (0.28), and the maximum was observed for LAW (0.90). The average values for TREE and SHR were 0.37 and 0.42, respectively.
Figure 7 presents the RWS values calculated on a weekly basis for each hydrozone in the 34 parks for the three irrigation seasons. In all parks, KL was the same for similar plant typologies regardless of their location and Tr remained constant for each plant typology in 2017.
Figure 7a shows the weekly RWS values for 2018. The average annual values were TREE 2.80 ± 1.05, SHR 1.86 ± 0.79, and LAW and FLO 2.47 ± 1.01. Since RWS > 1.5, overirrigation was significant over the season, although its variation was high. In September and October an increase was clearly observed even though ETL decreased and Tr remained constant; thus, Hb and RWS also increased.
Figure 7b presents the weekly RWS values for 2018. The average annual values were TREE 0.86 ± 0.71, SHR 0.96 ± 0.76, LAWN 0.75 ± 0.75, and FLO 1.17 ± 0.86. In contrast to 2017, in 2018 their variability was smaller and no trend was observed. This result can be explained by the difference in irrigation management; Tr was set to fit ETL over the season. All typologies suffered under irrigation (RWS < 0.75) in May and the first week of September; additionally, FLO was over irrigated (RWS > 1.75) in July.
The values for 2019 are presented in Figure 7c and performed similarly to those in 2018, but with fewer irrigation events (one in May and one in September). The average irrigation performance was TREE 0.78 ± 0.38, SHR 1.00 ± 0.46, LAW 0.81 ± 0.43, and FLO 1.29 ± 0.53.
Among the irrigation seasons, 2017 applied irrigation for most of the season and had the highest RWS variability. The results highlight the effect of estimating a proper Tr for irrigation performance. This effect was more pronounced in the second part of the irrigation season, where the plant needs decreased. Similarly, in 2017 the effect of the three major storm events in July (>50 mm) increased θ at the time of irrigation and since the manager did not measure the soil water content and since Tr did not fit ETL over irrigation resulted. In both 2018 and 2019, the irrigation manager adjusted Tr to the plant irrigation requirements during the season; thus, only a few over-irrigation events were observed. However, this management resulted in some under-irrigation events.
The graphics also highlight some RWS values that abruptly deviated from the mean such as FLO and LAW (24 June 2017) and those in all hydrozones (25 June 2018 and 24 August 2018), which can alert a park manager and offer clues to the causes of the deviation.
Figure 8 is an example of the RWS maps that show both temporal variation (at the time scale chosen) and spatial variability among hydrozones. It presents the spatial and temporal variation for parks 301, 302, and 304 over four weeks (the last two weeks of July and the first two weeks of August) during 2017, 2018, and 2019. The parks contain 61 irrigation units controlled by 16 electric valves. In addition, Figure 9 shows a magnified image of park 302 to illustrate more clearly the temporal variation among the plant typologies.
Among the irrigation seasons, TREE was overwatered all weeks and LAW changed from over irrigated to under irrigated. Likewise, plant aesthetic quality in FLO and in TREE was severely affected by water stress and over irrigation, respectively, as shown in Figure 10. Thus, early identification of hydrozones with inadequate irrigation performance can help park managers address this issue. These maps guide the park managers to make proper irrigation management at the selected spatial and temporal scales.

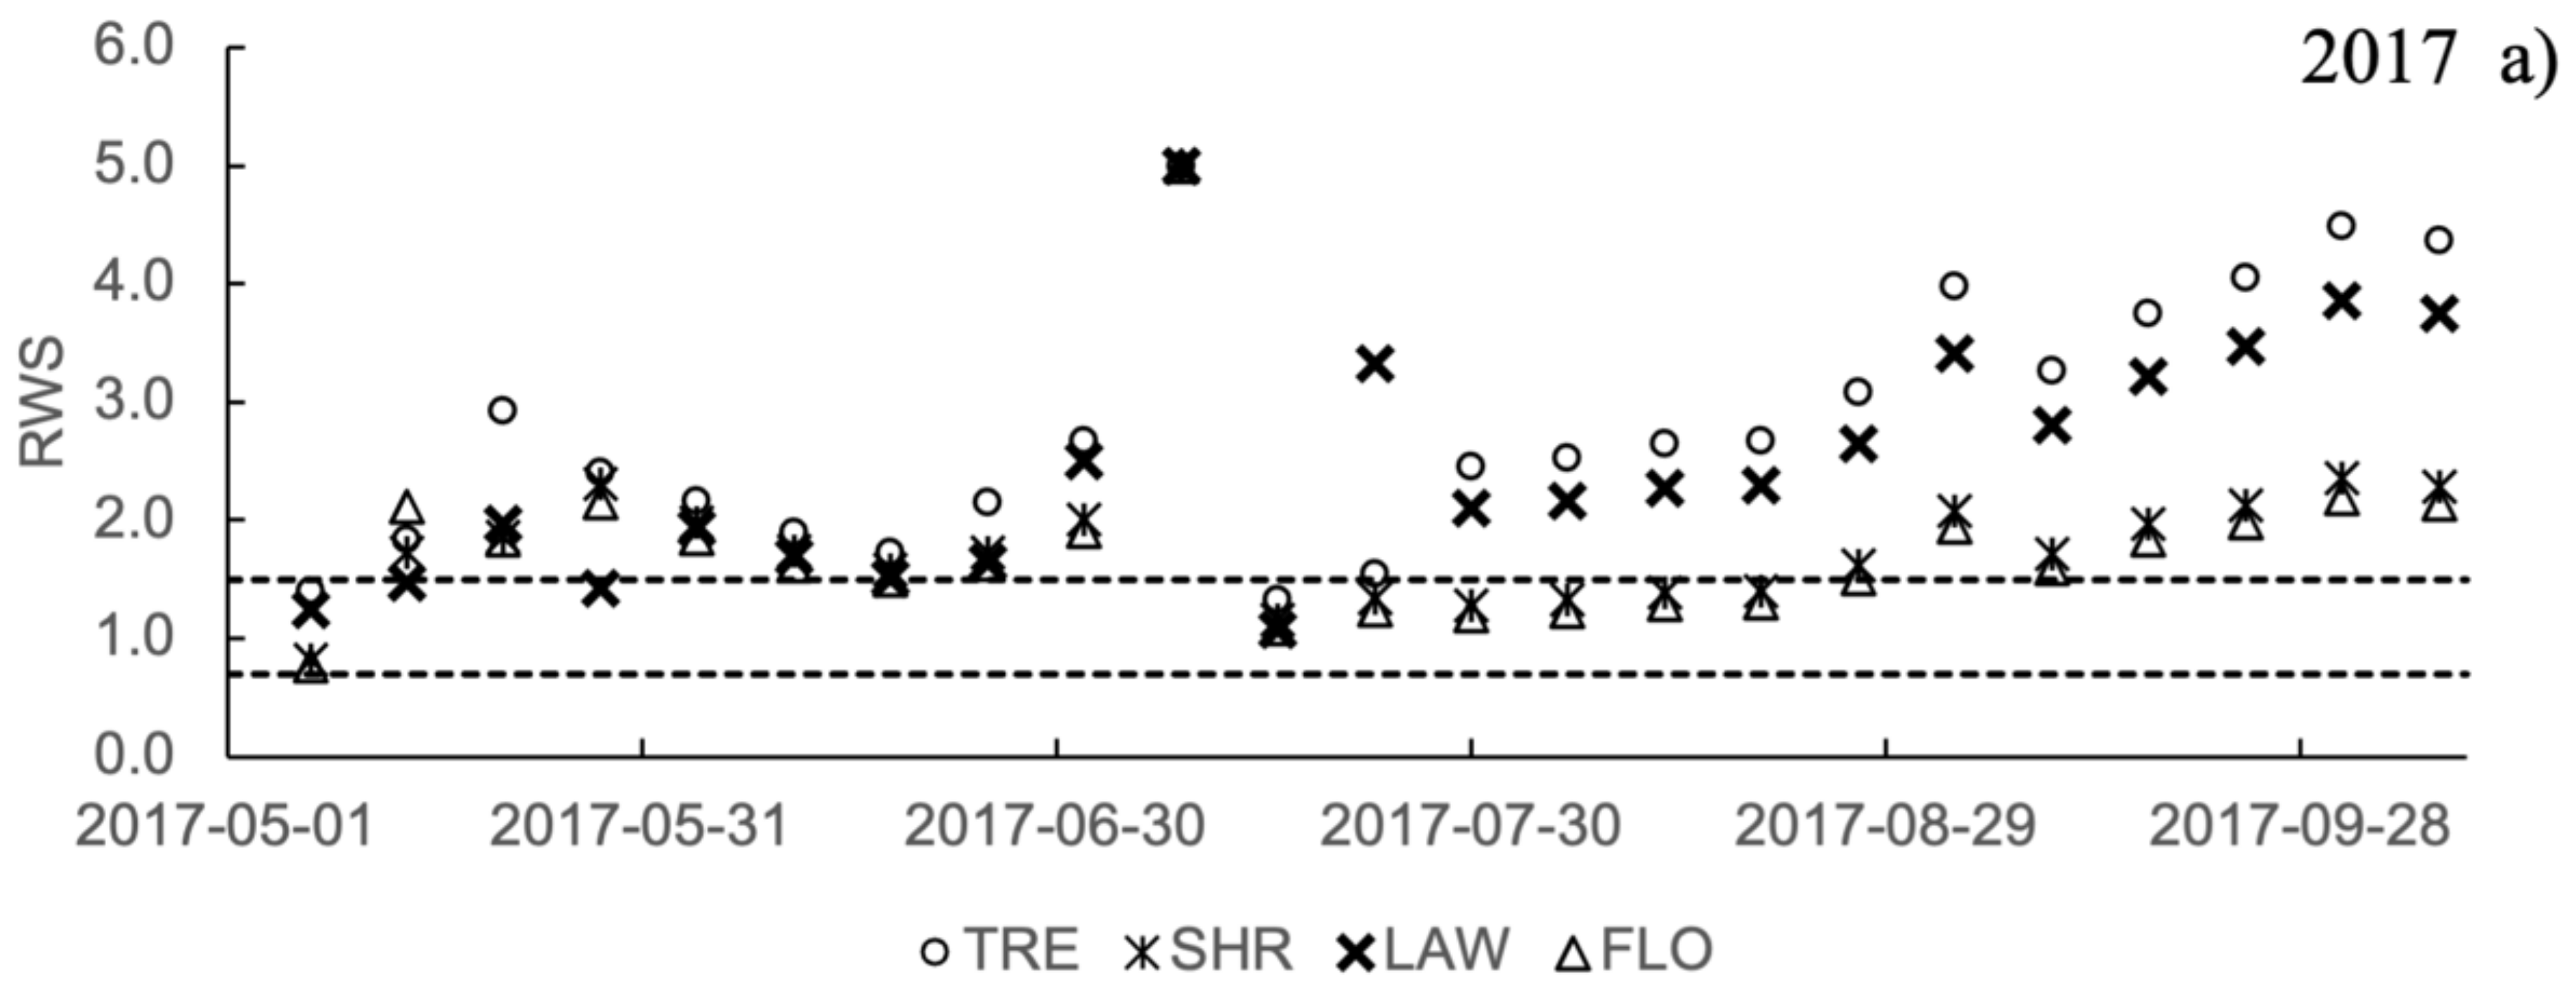
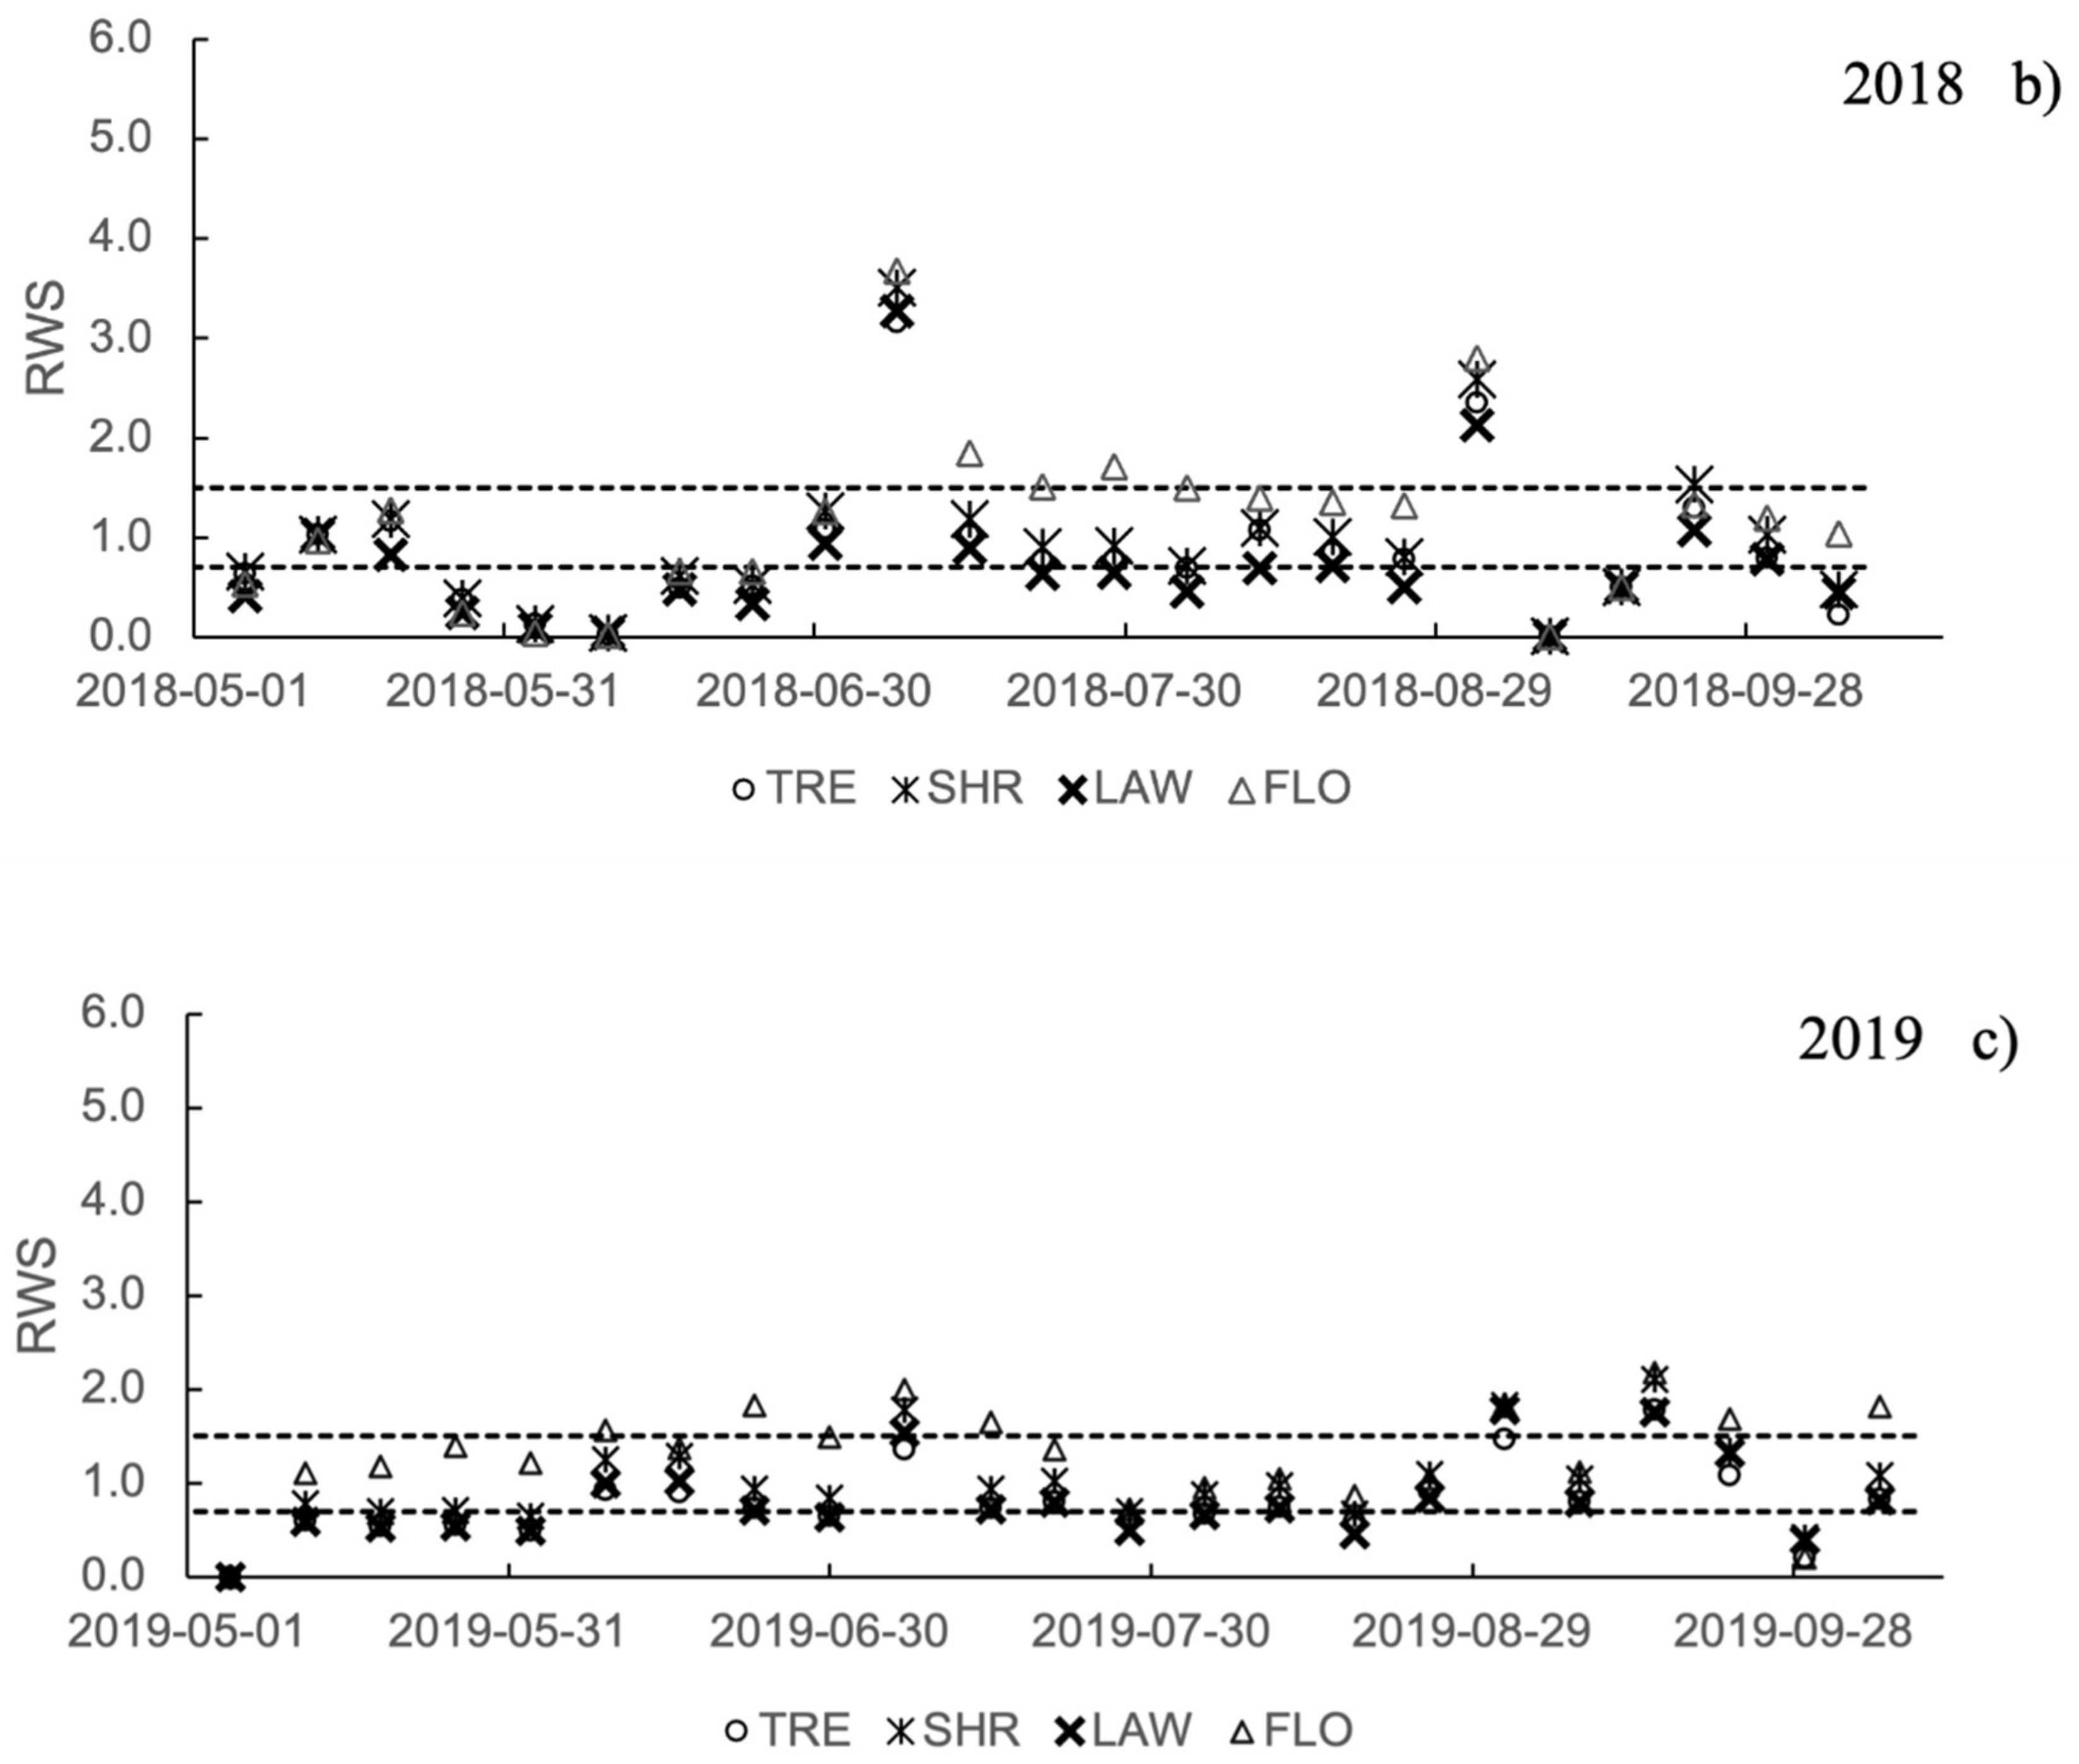
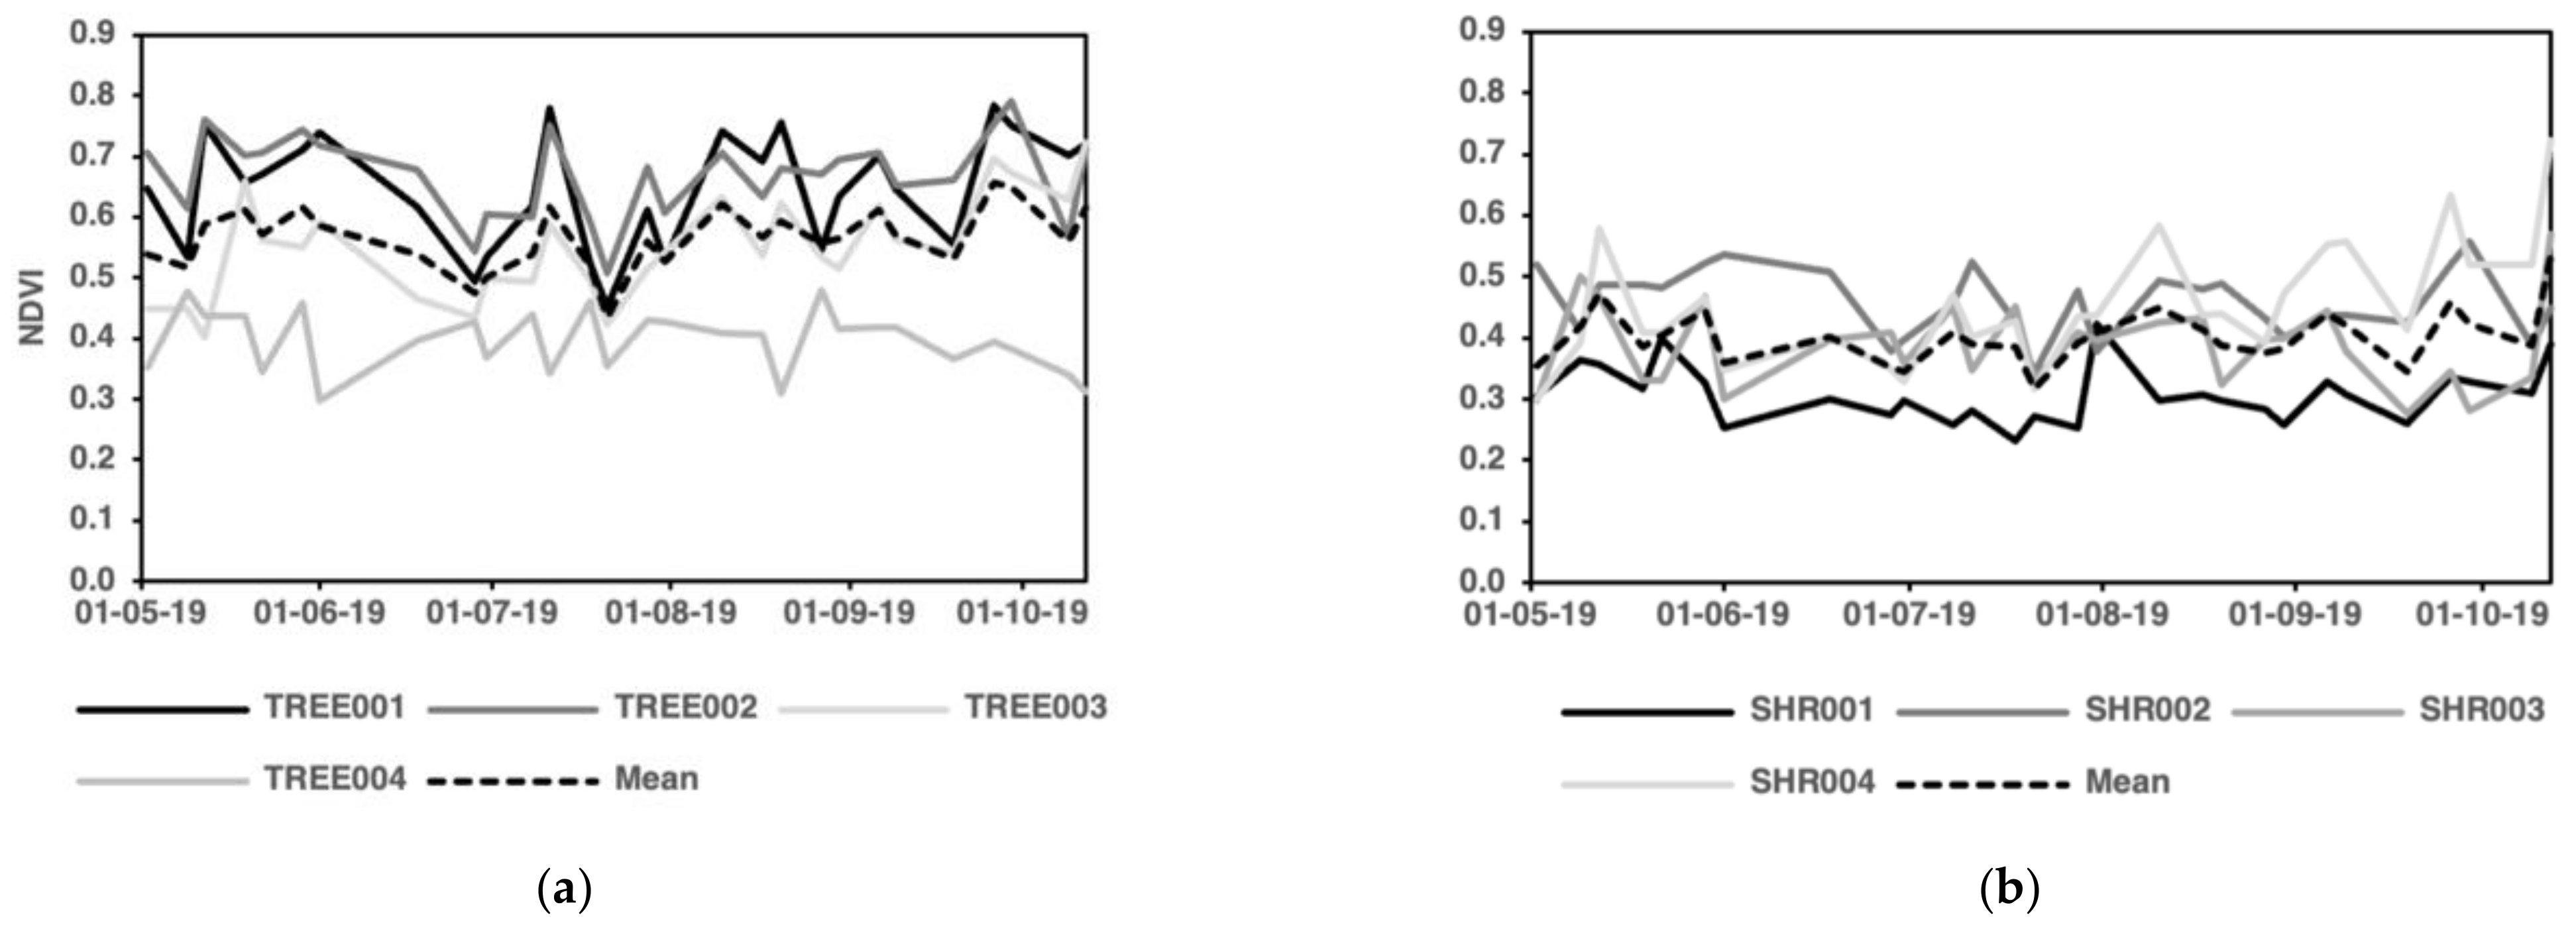
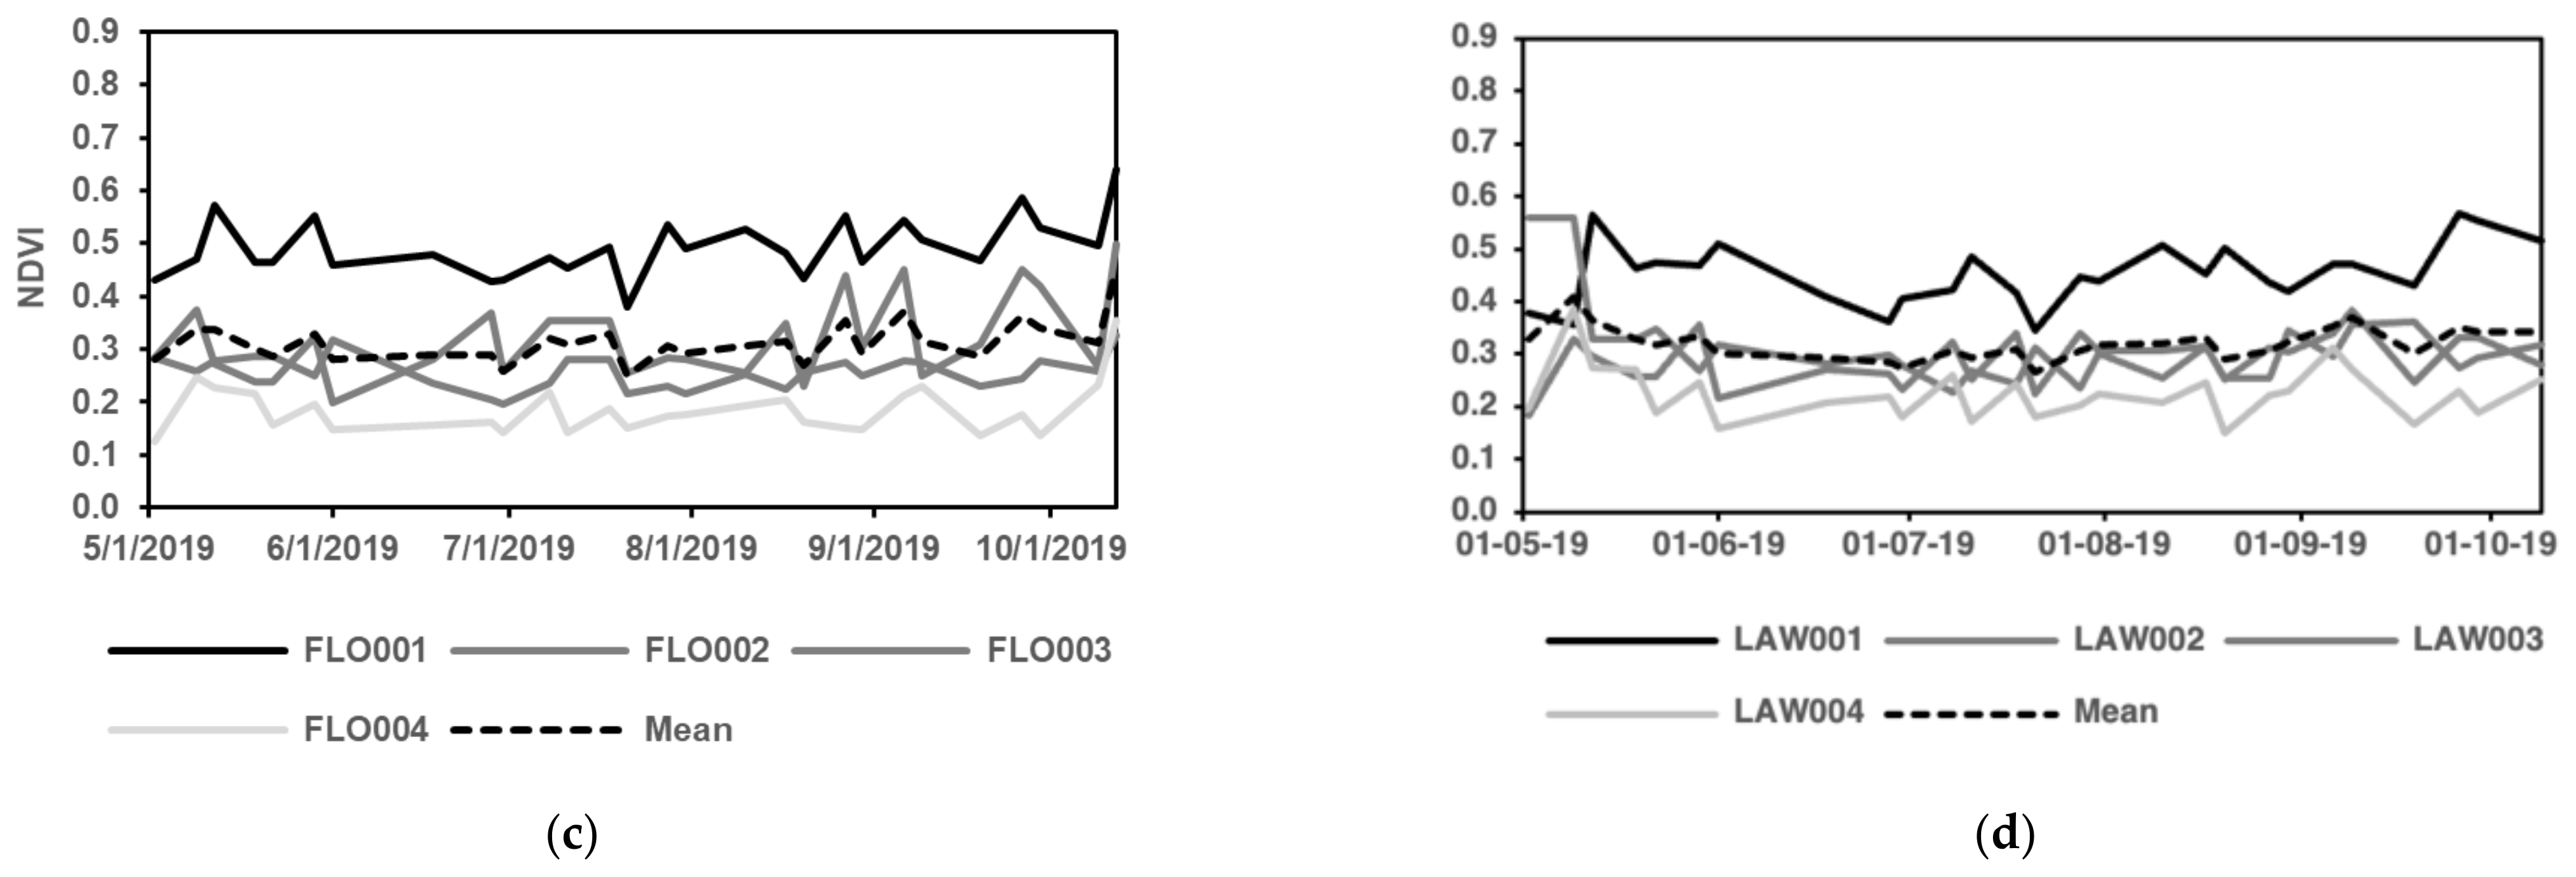
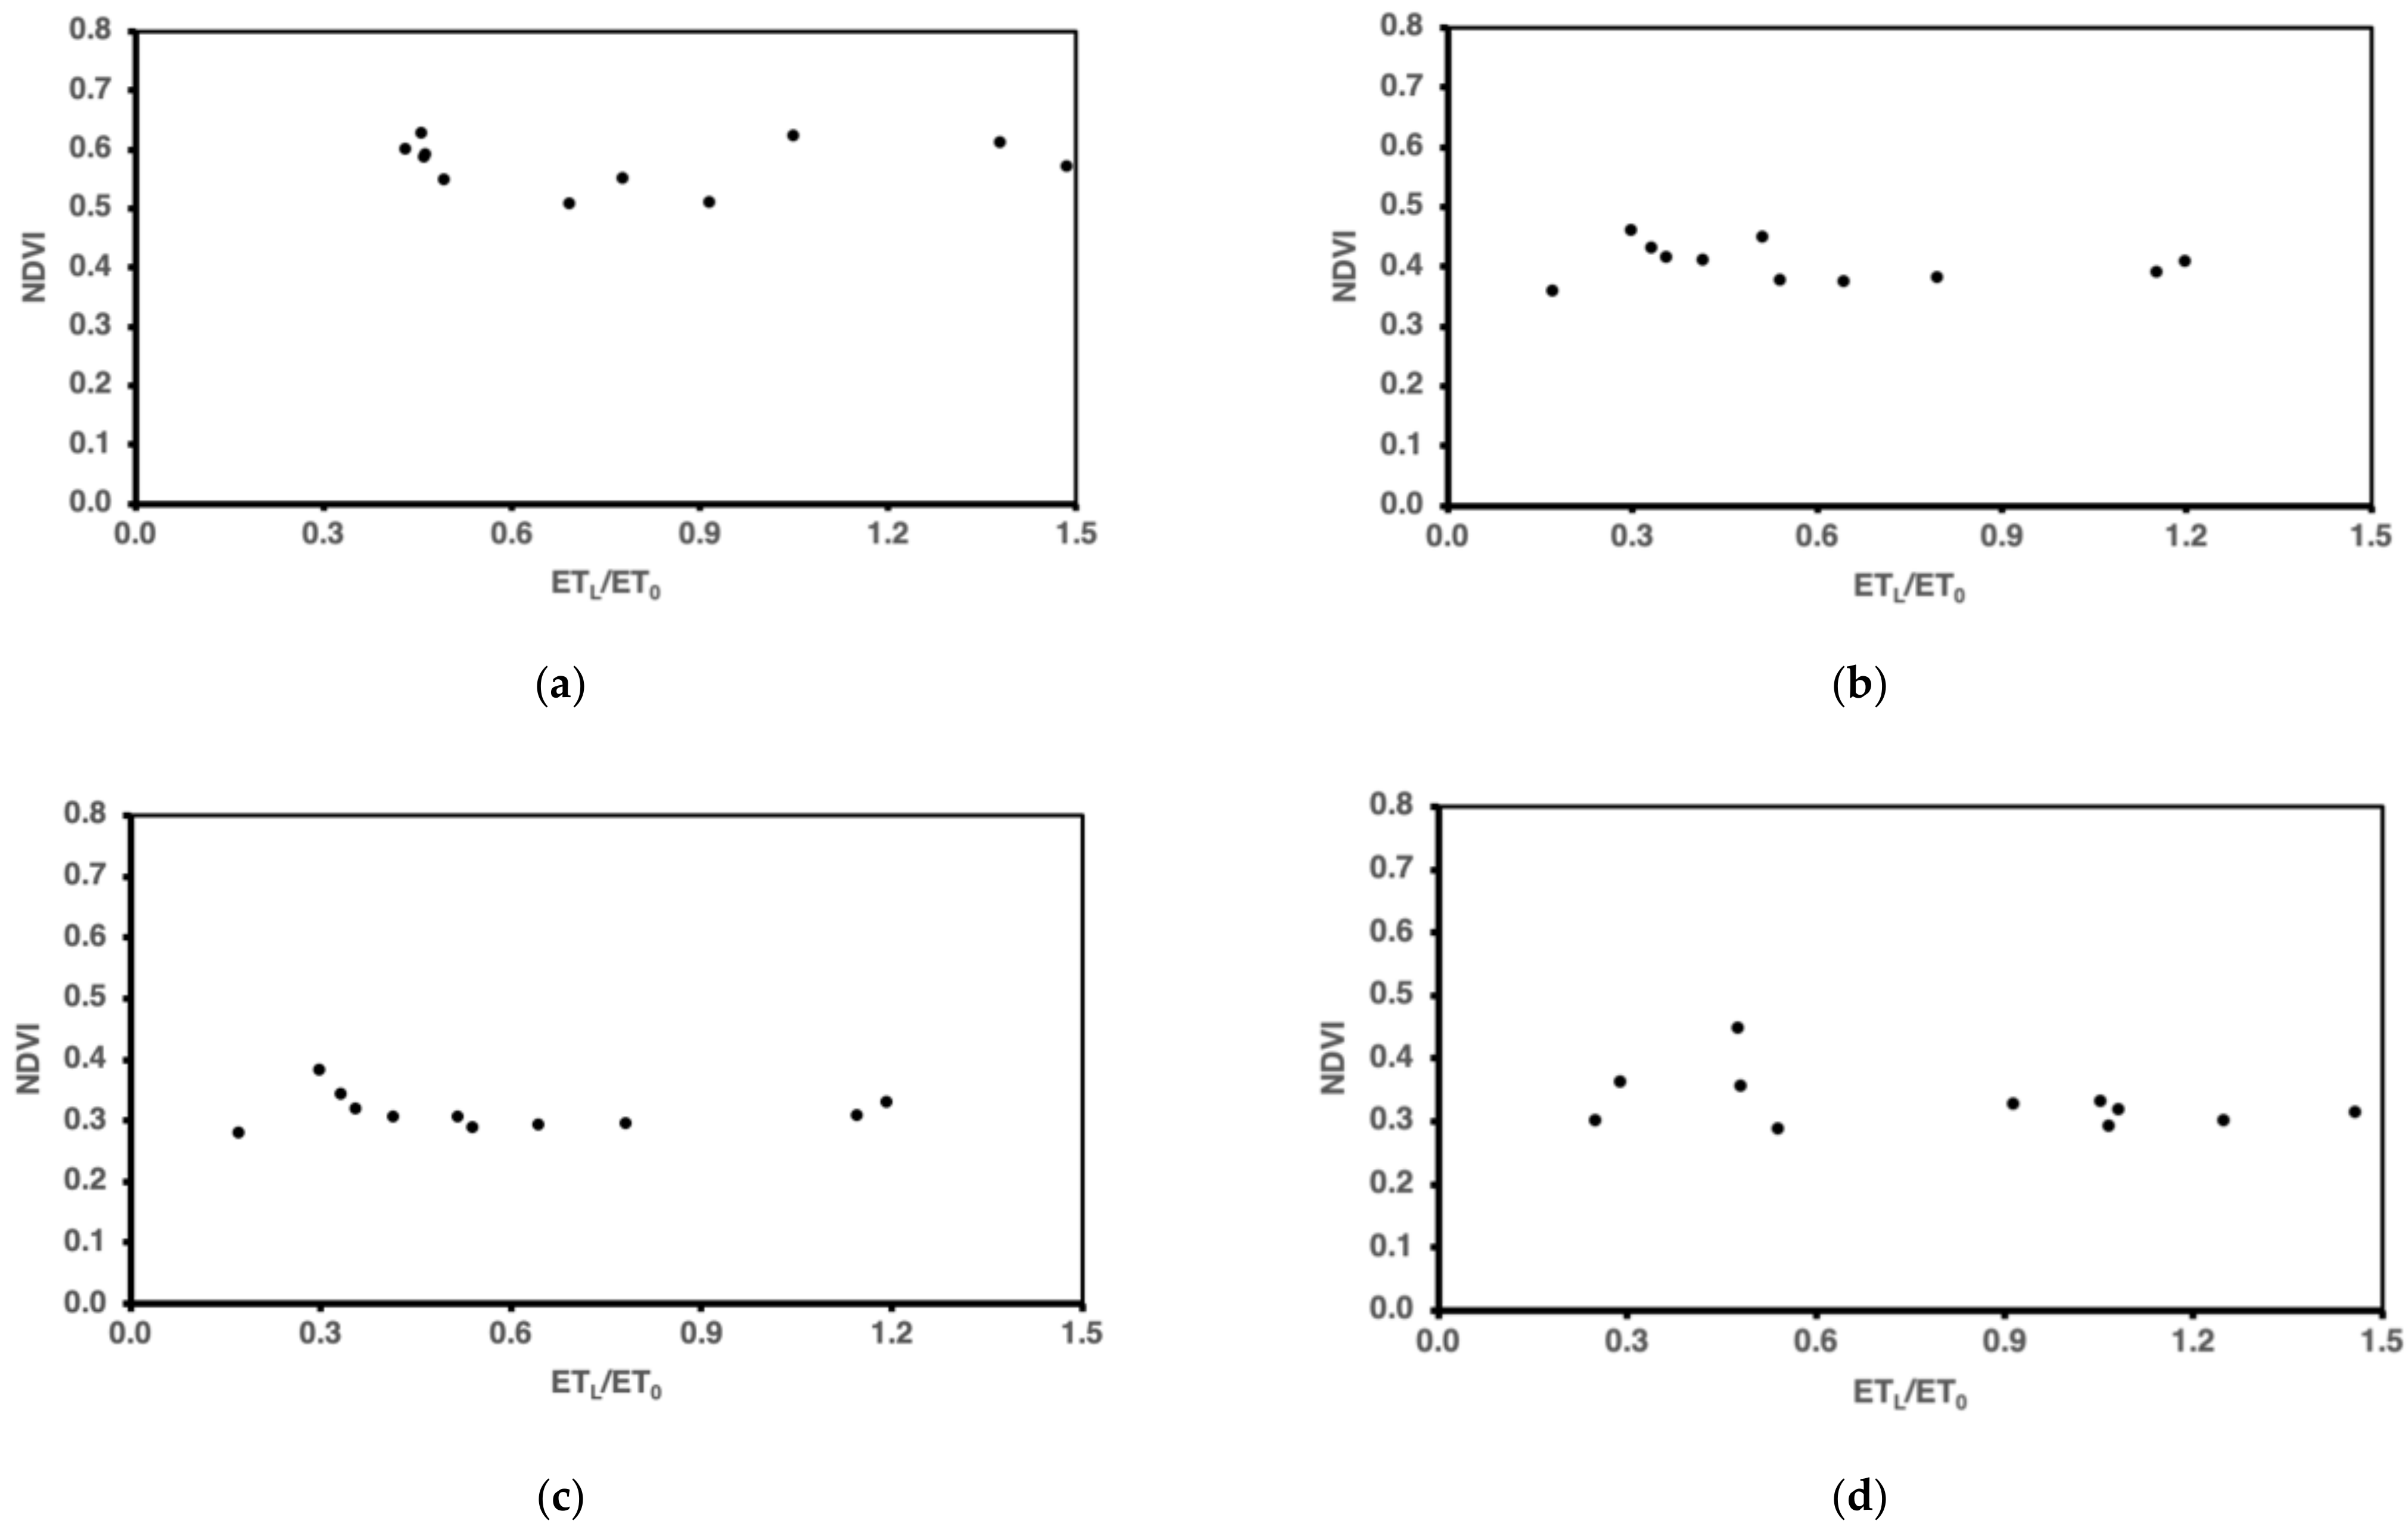
4.2. NDVI Index for the VBB Urban Parks

The parks in VBB encompass multiple plant species and arrangements across the green area and each hydrozone (containing the four typologies at least once) is irrigated by a single electro valve. The irrigation season starts in May every year. Figure 11 shows the differences in native vegetation (non-irrigated) and plants from the parks from satellite images dated: 2 June 2019, 8 July 2019, 20 August 2019, and 1 October 2019.
Figure 12 shows the NDVI indices for all plant typologies and the irrigation season 2019:
In the shrubs, the hedges are pruned to maintain their shape, likewise ornamental grass species are mown in winter and weeded throughout the season. The flower collections comprise different combinations of species having different water requirements, plant density, and plant heights. In the parks two or more of these combinations are selected for the hydrozones, which are pruned and weeded regularly to maintain their ornamental quality. In the lawn the values were smaller, since the dominant species is Bermudagrass, which is a warm climate lawn with higher resistance to water stress.
Although there are no preset optimal NDVI values for each plant species, the observed values highlight an interval of variation throughout the irrigation season [25,45] Likewise, even though an over irrigation is observed at the end of the season, there is not a clear relationship between irrigation bulk depth and the plant ornamental quality (greenness) measured as NDVI.
Figure 13 shows the average NDVI’s variation with the ETL/ET0 ratio as an irrigation indicator in the season 2019. For the four plant typologies, it is observed that as irrigation dose increases the NDVI does not change (plant quality), but it results in over irrigation.

5. Discussions

Irrigation management in urban parks is complex and at present no standard procedures on proper irrigation scheduling criteria are available [46]. Urban parks encompass multiple plant species, which are spatially arranged considering esthetical criteria and practical management of the irrigation system. The results of mapping hydrozones and their irrigation performance in the VBB parks provided detailed information on their spatial and temporal variation for the 2017 to 2019 irrigation seasons. This variation was high, even for short periods of time (weekly basis), for all plant typologies and for each year. Within each irrigation season, the maps identified hydrozones with good irrigation management; likewise, they highlighted irrigation mismanagement. Thus, the highest variability was observed in 2017 (September and October). Among other factors, this could be caused by the fact that Tr was constant throughout the season, yet was adjusted to hydrozone water requirements in the other two years. Since 2018, the irrigation management in VBB was modified and incorporated the conclusions from the results on water use efficiency of previous years, thus the variability lowered. Water use efficiency improves as water uniformity distribution within the root zone improves and can be achieved by a proper design/operation of the irrigation system and estimation of irrigation time and frequency [47,48] Thus, irrigation management will be affected by the robustness and flexibility of irrigation software and/or irrigation control elements as well as the expertise of park managers/operators.
Regarding plant typologies, LAW presented the lowest variation both within and between irrigation seasons. LAW was irrigated daily (the lowest frequency among typologies and smallest Hb), the same as ETL (KC was constant) and RWS. For this typology, a day was the minimum temporal scale, but it increased in the other typologies, which were less frequently irrigated (see Table 1). For these hydrozones, RWS was determined by Equation (1), hence the daily RWS values were averaged, resulting in higher variability. In addition, the averaging may also have been affected by the specific settings settled for adding daily ET0 values in the irrigation software program. Moreover, the electric valves closed during rain, thus effective precipitation Pe available for irrigation is not estimated and it may result in variability.
In modern large parks, the general belief is that irrigation performance is guaranteed since the irrigation system is fully automated and controlled and irrigation management (irrigation scheduling) is set up considering information on weather variables, irrigation rate, and plant coefficients. The term “smart irrigation” in such systems is linked more to the automation level than to high efficiency in water distribution and uniformity [18,49].
Similarly, it was expected that RWS variation within the park hydrozones would be small, but the results showed that they changed even on a weekly basis. For these cases, it may be necessary to verify whether Hb has been properly calculated. This will depend on the ETL estimation (multiple plant species in the park), water application uniformity in the irrigation system (emitter clogging, system leaks, and electric valve operation), and water movement within the soil (heterogeneous soils, root absorption, and preferential paths). In addition, in Mediterranean climates air temperature is the main factor regulating plant evapotranspiration and its daily variation is high (from 1 to 4 mm day−1), as observed in Figure 4; thus, also daily ETL variation (KL is constant). Likewise, the average ETL is used to calculate Tr, of which the variability may affect RWS.
In the VBB parks, the developed maps are a tool for the irrigation technician that can be used to identify the hydrozones with inadequate irrigation and then as an immediate response to change the irrigation operation variables (Tr, irrigation frequency) accordingly. In addition, an early identification will enable park managers to verify the plant quality and aesthetics of affected hydrozones and if needed they could search for support from an irrigation management expert to modify/improve the current irrigation operation. In VBB, we advise the manager that Tr be calculated to meet ETL and if possible that the soil water content be measured in all hydrozones (at least one park), and then it be used to fit Hb and irrigation frequency with more precision. Likewise, KL should be estimated considering not only the species coefficient KL but also plant topological conditions (location, plantation density, and microclimate) and if possible from satellite images.
The irrigation of green areas is often scheduled using inaccurate techniques and only based on the experience of the park manager. The application of methodologies such as WUCOLS, the identification of hydrozones, the use of soil moisture probes, or remote sensing can achieve an efficient irrigation management. This is a key issue in a scenario of water scarcity predicted by the IPCC VI report in arid and semi-arid zones.
Although several procedures and probes are available to measure and monitor soil water content, they are expensive and at least one sensor must be installed in each hydrozone for better accuracy. Likewise, sometimes they require qualified personnel for data analysis and extrapolation to irrigation scheduling. As an alternative nowadays, remote sensing techniques can provide information on vegetation cover on a small spatial scale (park area) and temporal scale (every five of seven days). The satellites send images on vegetation cover worldwide and most of them are free of cost. The images can be transformed into vegetation indexes such as NDVI or others, which provide valuable information to assist irrigation managers on monitoring irrigation needs across the parks through the season. It would be very interesting to observe any threshold of such as indices with the irrigation depth among hydrozones and across parks. Irrigation technicians can be trained in satellite image processing and/or in the use of digital platforms to download satellite images.
Multispectral satellite images from Sentinel-2A satellites estimate NDVI indices for specific hydrozones at high spatial resolution (10 × 10 m) that fit the average hydrozone size in large urban parks. The NDVI values are site-specific, the vegetation cover depends on the type of plantation, the plant physiology, and the soil water content [32,50] In this case study NDVI values do not respond positively to irrigation sheet applications above those estimated with the WUCOLS method. Additional work would be needed to validate and adjust NDVI between different RWS values [15,51].

6. Conclusions

The approach proposed to assess irrigation management in large urban parks is a novel tool for guiding the decisions of irrigation technicians and practitioners on the estimation of irrigation time and frequency. First the hydrozones (areas with similar water requirements that share the same electric irrigation valve) across the parks are identified. Then, their irrigation performance is estimated among the complex and automated irrigation network commanded by electro valves. Maps on water requirements and irrigation performance are thus drawn for each hydrozone; the irrigation manager will visualize their spatial and/or temporal variations across the parks. These maps will also help to identify the areas with irrigation mismanagement (under- or overwatering), and as a result, proper actions may be adopted to overcome either stress and/or waterlogging, which reduce the quality and aesthetics of ornamental species and may result in plant depth in severe conditions.
The application of this approach to the large urban parks in Valdebebas has shown high variation in irrigation performance among hydrozones, both across the parks and within the three irrigation seasons. As a temporal scale assessment, a short time scale was selected (a day) since irrigation variability can be otherwise hidden. However, variability will depend on the temporal scale of logged information as well as central station software.
Mapping irrigation performance is a novel approach that allows technicians/personnel to make proper decisions regarding the amount and frequency of water applications. In addition, the application of remote sensing is a valuable tool to observe any effects between irrigation management (and its efficiency) and ornamental plant quality (plant water status) at even higher scales. In the VBB parks, a threshold on irrigation performance has been observed that does not improve plant aesthetic and results in over irrigation. The imagery resolution makes it possible to distinguish between the canopies from the four plant typologies across the urbanization, both in the large parks and in the median streets. In this study, the ranges of NDVI values have allowed the monitoring of ornamental plant quality over time and they can be a tool to identify areas with irrigation mismanagement. However, future work should analyze in more detail the characteristic values for each typology and their response to different irrigation levels.
The assessment of irrigation performance provides quantitative information to the park manager/operator to verify water use efficiency, which results from irrigation management at any location and time over the irrigation season.

Author Contributions

Conceptualization, F.C.-I. and L.R.-S.; methodology, F.C.-I. and L.R.-S.; validation, F.C.-I. and L.R.-S.; formal analysis, F.C.-I. and D.S.-C.; investigation, F.C.-I., L.R.-S., and S.Z.; resources, L.R.-S.; data curation, F.C.-I. and D.S.-C.; writing—original draft preparation, F.C.-I. and L.R.-S.; writing—review and editing, L.R.-S.; visualization, F.C.-I. and S.Z.; supervision, L.R.-S.; project administration, L.R.-S. All authors have read and agreed to the published version of the manuscript.

Funding

This research received no external funding.

Institutional Review Board Statement

Not applicable.

Informed Consent Statement

Not applicable.

Data Availability Statement

The used Sentinel-2 data are available on the Copernicus Open Access Hub, other data that used in this study can be requested by contacting the first author.

Acknowledgments

The authors wish to thank the Valdebebas management board, Junta de Compensación de Valdebebas, and the irrigation manager for the information provided. We also wish to thank the ANID-Chile, who sponsored the PFCHA/BCH 72190480 scholarship for Freddy Canales-Ide.

Conflicts of Interest

The authors declare no conflict of interest.

References

  1. Cabrera, R.; Wagner, K.L.; Wherley, B. An Evaluation of Urban Landscape Water Use in Texas. Tex. Water J. 2013, 4, 14–27. [Google Scholar] [CrossRef]
  2. Shojaei, P.; Gheysari, M.; Nouri, H.; Myers, B.; Esmaeili, H. Water Requirements of Urban Landscape Plants in an Arid Environment: The Example of a Botanic Garden and a Forest Park. Ecol. Eng. 2018, 123, 43–53. [Google Scholar] [CrossRef]
  3. Halper, E.B.; Dall’erba, S.; Bark, R.H.; Scott, C.A.; Yool, S.R. Effects of Irrigated Parks on Outdoor Residential Water Use in a Semi-Arid City. Landsc. Urban Plan. 2015, 134, 210–220. [Google Scholar] [CrossRef]
  4. IPCC. Climate Change 2021: The Physical Science Basis. Contribution of Working Group I to the Sixth Assessment Report of the Intergovernmental Panel on Climate Change. In Proceedings of the 14th Session of Working Group I and 54th Session of the IPCC, online, 26 July–6 August 2021. [Google Scholar]
  5. Mini, C.; Hogue, T.S.; Pincetl, S. Estimation of Residential Outdoor Water Use in Los Angeles, California. Landsc. Urban Plan. 2014, 127, 124–135. [Google Scholar] [CrossRef]
  6. Reyes-Paecke, S.; Gironás, J.; Melo, O.; Vicuña, S.; Herrera, J. Irrigation of Green Spaces and Residential Gardens in a Mediterranean Metropolis: Gaps and Opportunities for Climate Change Adaptation. Landsc. Urban Plan. 2019, 182, 34–43. [Google Scholar] [CrossRef]
  7. Abioye, E.A.; Abidin, M.S.Z.; Mahmud, M.S.A.; Buyamin, S.; Ishak, M.H.I.; Rahman, M.K.I.A.; Otuoze, A.O.; Onotu, P.; Ramli, M.S.A. A Review on Monitoring and Advanced Control Strategies for Precision Irrigation. Comput. Electron. Agric. 2020, 173, 105441. [Google Scholar] [CrossRef]
  8. Xiao, H.; Kopecká, M.; Guo, S.; Guan, Y.; Cai, D.; Zhang, C.; Zhang, X.; Yao, W. Responses of Urban Land Surface Temperature on Land Cover: A Comparative Study of Vienna and Madrid. Sustainability 2018, 10, 260. [Google Scholar] [CrossRef] [Green Version]
  9. Water Management Committee of The Irrigation Association. Turf and Landscape Irrigation Best Management Practices; Irrigation Association: Fairfax, VA, USA, 2005. [Google Scholar]
  10. Costello, L.R.; Jones, K.S. WUCOLS IV, Water Use Classification of Landscape Species; California Center for Urban Horticulture, University of California: Davis, CA, USA, 2014. [Google Scholar]
  11. Nouri, H.; Beecham, S.; Hassanli, A.M.; Kazemi, F. Water Requirements of Urban Landscape Plants: A Comparison of Three Factor-Based Approaches. Ecol. Eng. 2013, 57, 276–284. [Google Scholar] [CrossRef]
  12. Dukes, M.D. Water Conservation Potential of Landscape Irrigation Smart Controllers. Trans. ASABE 2012, 55, 563–569. [Google Scholar] [CrossRef]
  13. Patil, P.; Desai, B.L. Intelligent Irrigation Control System by Employing Wireless Sensor Networks. Int. J. Comput. Appl. 2013, 79, 33–40. [Google Scholar] [CrossRef]
  14. Vahmani, P.; Hogue, T.S. Incorporating an Urban Irrigation Module into the Noah Land Surface Model Coupled with an Urban Canopy Model. J. Hydrometeorol. 2014, 15, 1440–1456. [Google Scholar] [CrossRef]
  15. Shurtz, K.M.; Dicataldo, E.; Sowby, R.B.; Williams, G.P. Insights into Efficient Irrigation of Urban Landscapes: Analysis Using Remote Sensing, Parcel Data, Water Use, and Tiered Rates. Sustainability 2022, 14, 1427. [Google Scholar] [CrossRef]
  16. Segovia-Cardozo, D.A.; Rodríguez-Sinobas, L.; Zubelzu, S. Living Green Walls: Estimation of Water Requirements and Assessment of Irrigation Management. Urban For. Urban Green. 2019, 46, 126458. [Google Scholar] [CrossRef]
  17. Zalacáin, D.; Bienes, R.; Sastre-Merlín, A.; Martínez-Pérez, S.; García-Díaz, A. Influence of Reclaimed Water Irrigation in Soil Physical Properties of Urban Parks: A Case Study in Madrid (Spain). Catena 2019, 180, 333–340. [Google Scholar] [CrossRef]
  18. Pérez-Urrestarazu, L.; Egea, G.; Ruiz-Alcalá, C.; Roldán-Olmo, F.; Fernández-Cañero, R. Water Management Assessment in a Historic Garden: The Case Study of the Real Alcazar (Seville, Spain). Urban For. Urban Green. 2018, 29, 192–199. [Google Scholar] [CrossRef]
  19. Salvador, R.; Bautista-Capetillo, C.; Playán, E. Irrigation Performance in Private Urban Landscapes: A Study Case in Zaragoza (Spain). Landsc. Urban Plan. 2011, 100, 302–311. [Google Scholar] [CrossRef] [Green Version]
  20. Droogers, P.; Kite, G.; Murray-Rust, H. Use of Simulation Models to Evaluate Irrigation Performance Including Water Productivity, Risk and System Analyses. Irrig. Sci. 2000, 19, 139–145. [Google Scholar] [CrossRef]
  21. Clemmens, A.J.; Molden, D.J. Water Uses and Productivity of Irrigation Systems. Irrig. Sci. 2007, 25, 247–261. [Google Scholar] [CrossRef]
  22. Lorite, I.J.; Mateos, L.; Fereres, E. Evaluating Irrigation Performance in a Mediterranean Environment. Irrig. Sci. 2004, 23, 77–84. [Google Scholar] [CrossRef]
  23. Malano, H.; Burton, M. Guidelines for Benchmarking Performance in the Irrigation and Drainage Sector. Knowledge Syntesis Report; Food & Agriculture Org.: Rome, Italy, 2001. [Google Scholar]
  24. Levine, G. Relative Water Supply, an Explanatory Variable for Irrigations Systems; Technical Report no 6; The determinations of Irrigation Projects in Developing Countries; Cornell University: Ithaca, NY, USA, 1982. [Google Scholar]
  25. Li, C.; Li, H.; Li, J.; Lei, Y.; Li, C.; Manevski, K.; Shen, Y. Using NDVI Percentiles to Monitor Real-Time Crop Growth. Comput. Electron. Agric. 2019, 162, 357–363. [Google Scholar] [CrossRef]
  26. Segovia-Cardozo, D.A.; Rodríguez-Sinobas, L.; Zubelzu, S. Water Use Efficiency of Corn among the Irrigation Districts across the Duero River Basin (Spain): Estimation of Local Crop Coefficients by Satellite Images. Agric. Water Manag. 2019, 212, 241–251. [Google Scholar] [CrossRef]
  27. Suárez López, J.J.; Puertas, J.; Anta, J.; Jácome, A.; Álvarez-Campana, J.M. Integrated Management of Water Resources in Urban Water System: Water Sensitive Urban Development as a Strategic Approach. Ing. Del Agua 2014. [Google Scholar] [CrossRef] [Green Version]
  28. Bousbih, S.; Zribi, M.; el Hajj, M.; Baghdadi, N.; Lili-Chabaane, Z.; Gao, Q.; Fanise, P. Soil Moisture and Irrigation Mapping in a Semi-Arid Region, Based on the Synergetic Use of Sentinel-1 and Sentinel-2 Data. Remote Sens. 2018, 10, 1953. [Google Scholar] [CrossRef] [Green Version]
  29. Recanatesi, F.; Giuliani, C.; Ripa, M.N. Monitoring Mediterranean Oak Decline in a Peri-Urban Protected Area Using the NDVI and Sentinel-2 Images: The Case Study of Castelporziano State Natural Reserve. Sustain. Switz. 2018, 10, 3308. [Google Scholar] [CrossRef] [Green Version]
  30. Cheng, Y.; Zhang, J.; Wei, W.; Zhao, B. Effects of Urban Parks on Residents’ Expressed Happiness before and during the COVID-19 Pandemic. Landsc. Urban Plan. 2021, 212, 104118. [Google Scholar] [CrossRef]
  31. Horváthová, E.; Badura, T.; Duchková, H. The Value of the Shading Function of Urban Trees: A Replacement Cost Approach. Urban For. Urban Green. 2021, 62, 127166. [Google Scholar] [CrossRef]
  32. Wang, J.; Zhou, W.; Wang, J.; Qian, Y. From Quantity to Quality: Enhanced Understanding of the Changes in Urban Greenspace. Landsc. Ecol. 2019, 34, 1145–1160. [Google Scholar] [CrossRef]
  33. Zhu, X.; Gao, M.; Zhang, R.; Zhang, B. Quantifying Emotional Differences in Urban Green Spaces Extracted from Photos on Social Networking Sites: A Study of 34 Parks in Three Cities in Northern China. Urban For. Urban Green. 2021, 62, 127133. [Google Scholar] [CrossRef]
  34. Canales-Ide, F.; Zubelzu, S.; Rodríguez-Sinobas, L. Irrigation Systems in Smart Cities Coping with Water Scarcity: The Case of Valdebebas, Madrid (Spain). J. Environ. Manag. 2019, 247. [Google Scholar] [CrossRef]
  35. Costello, L.R.; Jones, K.S. WUCOLS. A Guide to the Water Needs of Landscape Plants; University of California, Cooperative Extension: Oakland, CA, USA, 1994; Available online: http://ucanr.edu/sites/oc/files/132534.pdf (accessed on 12 December 2018).
  36. Pittenger, D.R.; Shaw, D.A. Estimating Water Needs of Urban Landscapes. In Proceedings of the Annual Conference of the American Society for Horticultural Science, Palm Desert, CA, USA, 2–5 August 2010; Supplement to HortScience; American Society for Horticultural Science: Alexandria, VA, USA, 2010; Volume 45. [Google Scholar]
  37. Kjelgren, R.; Beeson, R.C.; Pittenger, D.R.; Montague, D.T. Simplified Landscape Irrigation Demand Estimation: Slide Rules. Appl. Eng. Agric. 2016, 32, 363–378. [Google Scholar] [CrossRef]
  38. Connellan, G.J. Evaluating and Benchmarking the Performance of Urban Irrigation. In Proceedings of the New Zealand Water and Wastewater Association Conference, Christchurch, NZ, USA, 6 October 2004. [Google Scholar]
  39. Knox, J.W.; Weatherhead, E.K.; Bradley, R.I. Mapping the Total Volumetric Irrigation Water Requirements in England and Wales. Agric. Water Manag. 1997, 33, 1–18. [Google Scholar] [CrossRef]
  40. Gao, Q.; Zribi, M.; Escorihuela, M.J.; Baghdadi, N.; Segui, P.Q. Irrigation Mapping Using Sentinel-1 Time Series at Field Scale. Remote Sens. 2018, 10, 1495. [Google Scholar] [CrossRef] [Green Version]
  41. Fontanet, M.; Scudiero, E.; Skaggs, T.H.; Fernández-Garcia, D.; Ferrer, F.; Rodrigo, G.; Bellvert, J. Dynamic Management Zones for Irrigation Scheduling. Agric. Water Manag. 2020, 238, 106207. [Google Scholar] [CrossRef]
  42. Tsirogiannis, I.L. Optimizing Water Use Efficiency in Urban Landscapes Using GIS. Acta Hortic. 2010, 317–320. [Google Scholar] [CrossRef]
  43. Rodríguez-Sinobas, L.; Zubelzu, S.; Perales-Momparler, S.; Canogar, S. Techniques and Criteria for Sustainable Urban Stormwater Management. The Case Study of Valdebebas (Madrid, Spain). J. Clean. Prod. 2018, 172, 402–416. [Google Scholar] [CrossRef]
  44. Pu, R.; Landry, S. A Comparative Analysis of High Spatial Resolution IKONOS and WorldView-2 Imagery for Mapping Urban Tree Species. Remote Sens. Environ. 2012, 124, 516–533. [Google Scholar] [CrossRef]
  45. Quesnel, K.J.; Ajami, N.K. Large Landscape Urban Irrigation: A Data-Driven Approach to Evaluate Conservation Behavior. Water Resour. Res. 2019, 55, 771–786. [Google Scholar] [CrossRef] [Green Version]
  46. Arunadevi, K.; Singh, M.; Franco, D.; Prajapati, V.K.; Ramachandran, J.; Maruthi Sankar, G.R. Real Time Soil Moisture (RTSM) Based Irrigation Scheduling to Improve Yield and Water-Use Efficiency of Green Pea (Pisum sativum L.) Grown in North India. Agronomy 2022, 12, 278. [Google Scholar] [CrossRef]
  47. Mohammed, M.; Riad, K.; Alqahtani, N. Efficient IoT-Based Control for a Smart Subsurface Irrigation System to Enhance Irrigation Management of Date Palm. Sensors 2021, 21, 3942. [Google Scholar] [CrossRef]
  48. Fraga-Lamas, P.; Celaya-Echarri, M.; Azpilicueta, L.; Lopez-Iturri, P.; Falcone, F.; Fernández-Caramés, T.M. Design and Empirical Validation of a LoRaWAN IoT Smart Irrigation System. Proceedings 2020, 42, 62. [Google Scholar] [CrossRef] [Green Version]
  49. Nouri, H.; Beecham, S.; Anderson, S.; Nagler, P. High Spatial Resolution WorldView-2 Imagery for Mapping NDVI and Its Relationship to Temporal Urban Landscape Evapotranspiration Factors. Remote Sens. 2014, 6, 580–602. [Google Scholar] [CrossRef] [Green Version]
  50. Haghverdi, A.; Singh, A.; Sapkota, A.; Reiter, M.; Ghodsi, S. Developing Irrigation Water Conservation Strategies for Hybrid Bermudagrass Using an Evapotranspiration-Based Smart Irrigation Controller in Inland Southern California. Agric. Water Manag. 2021, 245, 106586. [Google Scholar] [CrossRef]
  51. Johnson, T.D.; Belitz, K. A Remote Sensing Approach for Estimating the Location and Rate of Urban Irrigation in Semi-Arid Climates. J. Hydrol. 2012, 414–415, 86–98. [Google Scholar] [CrossRef]
Figure 1. Diagram of the irrigation assessment and management approach for large urban parks.
Remotesensing 14 01060 g001
Figure 2. Codes and location of parks across the Valdebebas urban development. (Source: Valdebebas design project).
Remotesensing 14 01060 g002
Figure 3. ET0 daily values for the irrigation seasons 2017, 2018, 2019.
Remotesensing 14 01060 g003
Figure 4. Pe values for the irrigation season 2017, 2018, 2019.
Remotesensing 14 01060 g004
Figure 5. Distribution of plant typologies in parks.
Remotesensing 14 01060 g005
Figure 6. Maps for hydrozones in parks 301, 302, and 303 show the average KL coefficient for the irrigation seasons from 2017 to 2019.
Remotesensing 14 01060 g006
Figure 7. RWS indicator calculated weekly: (a) 2017, (b) 2018, and (c) 2019. (0.75 < RWS < 1.5, optimal irrigation).
Remotesensing 14 01060 g007aRemotesensing 14 01060 g007b
Figure 8. RWS maps for parks 301, 302, and 303 (0.75 < RWS < 1.5, optimal irrigation).
Remotesensing 14 01060 g008
Figure 9. RWS map for park 302 considering the same weeks as those in Figure 8 for 2017 (0.75 < RWS < 1.5, optimal irrigation).
Remotesensing 14 01060 g009
Figure 10. Severe effect of irrigation mismanagement: (a) under irrigation in FLO, (b) over irrigation in TREE.
Remotesensing 14 01060 g010
Figure 11. NDVI view of Valdebebas urbanization processed from Sentinel-2A cloud-free images: (a) 2 June 2019, (b) 8 July 2019, (c) 20 August 2019, (d) 1 October 2019.
Remotesensing 14 01060 g011
Figure 12. NDVI values for the four hydrozones selected among the four plant typologies during the 2019 irrigation season. (a) trees varying between 0.29 and 0.79 (average value 0.57), (b) for shrubs varying between 0.23 and 0.72 (average value 0.40), (c) for the flower collections varying between 0.13 and 0.64 (average value 0.31), and (d) for lawn varying between 0.15 and 0.65 (average value 0.31).
Remotesensing 14 01060 g012aRemotesensing 14 01060 g012b
Figure 13. Variation of average NDVI values with bulk irrigation depths in the 2019 irrigation season. (a) Trees, (b) shrubs, (c) flowers, (d) lawn.
Remotesensing 14 01060 g013
Table 1. Plantation characteristics.
Plant TypologyCover AreaIrrigation RateWeekly Irrigation Schedule
(%)(mm h1)
LAW920.7Daily (Mon to Fri)
SHR799.2Mon-Wed-Fri
TREE420.7Thurs
FLO89.0Mon-Wed-Fri
Table 2. Density Kd and microclimate Kmc coefficients adopted for the study parks.
ParkKdKmc
1070.80.8
1080.80.8
2020.81.0
2030.80.9
2040.80.9
3011.11.0
3021.11.0
Table 3. Plant typology, plant species, and coefficients for each irrigation sector.
Plant TypologySpecieVarietyKc ManagerKsKs Mix
Shu PLA AViburnumtinus 0.50.5
Viburnumtinus‘Eve Price’0.80.5
Viburnumtinus‘Purpureum’ 0.5
Shu PLA BEscalloniassp.‘Iveyi’0.80.50.45
Loniceranitida‘Elegant’0.4
Shu PLA CPittosporumtobira‘Nana’0.80.450.45
Flo PLA D1Festucaglauca 0.40.4
Tulbaghiaviolacea 0.80.4
Tulbaghiaviolacea‘Blanca’0.4
Lavandulaangustifolia‘Hidcote Pink’0.3
Gauralindheimeri 0.5
Gauralindheimeri‘Siskiyou Pink’0.5
Cistusx skanbergii 0.3
Cistusflorentinus 0.3
Flo PLA D2Liriopemuscari 0.80.50.4
Irisgermanica 0.3
Pennisetumalopecuroides 0.2
Tulbaghiaviolacea 0.4
Tulbaghiaviolacea‘Blanca’0.4
Hederahibernica‘Sagittifolia’0.5
Flo MChrysanthemumleucanthemum 0.80.50.5
Flo IIrisssp.Multiples0.80.60.6
Flo HHemerocallisssp.Multiples0.80.50.5
Flo RRosassp.Multiples0.80.40.4
Law PLA S1Cynodondactylon 0.90.90.9
Flo PLA ETrachelospermumjasminoides‘Tricolor’0.80.50.5
Tre ARB 01Acaciadealbata 0.80.20.2
Tre ARB 06Acerplatanoides 0.80.60.6
Tre ARB 14Cercissiliquastrum‘Multi-stem’0.80.20.2
Tre ARB 25Lagerstroemiaindica‘Rosea’0.80.40.4
Tre ARB 31Morusalba‘Fruitless’0.80.40.4
Tre ARB 50Sophorajaponica 0.80.40.4
Tre ARB 51Sorbusaria 0.80.50.5
Tre ARB 53X Chitalpatashkentensis‘Summer bells’0.80.40.4
Publisher’s Note: MDPI stays neutral with regard to jurisdictional claims in published maps and institutional affiliations.

