Article

A Landscape-Based Habitat Suitability Model (LHS Model) for Oriental Migratory Locust Area Extraction at Large Scales: A Case Study along the Middle and Lower Reaches of the Yellow River

1
State Key Laboratory of Remote Sensing Science, Aerospace Information Research Institute, Chinese Academy of Sciences, Beijing 100094, China
2
University of Chinese Academy of Sciences, Beijing 100049, China
3
Shenzhen Institutes of Advanced Technology, Chinese Academy of Sciences, Shenzhen 518055, China
4
College of Urban and Environmental Sciences, Peking University, Beijing 100871, China
5
China Aero Geophysical Survey and Remote Sensing Center for Natural Resources, Beijing 100083, China
6
National Engineering Research Center for Agro-Ecological Big Data Analysis & Application, Anhui University, Hefei 230601, China
*
Author to whom correspondence should be addressed.
Remote Sens. 2022, 14(5), 1058; https://doi.org/10.3390/rs14051058
Submission received: 15 December 2021 / Revised: 14 February 2022 / Accepted: 19 February 2022 / Published: 22 February 2022
(This article belongs to the Section Ecological Remote Sensing)

Abstract

:
The Oriental migratory locust is a destructive agricultural pest in China. Large-scale locust area (the area possessing suitable breeding habitat for locusts and has locust infestation) extraction and its evolution analysis are essential for locust ecological control. Existing methods seldom consider the spatial differences in the locust development and habitat landscape structures in large areas. To analyze these effects, our study proposed a landscape-based habitat suitability model (LHS model) for large-scale locust area extraction based on remote sensing data, taking the middle and lower reaches of the Yellow River (MLYR) as an example. Firstly, the DD model was used to simulate locust development and obtain habitat factors of the corresponding dates; secondly, the patch distribution of different land cover classes and their adjacent landscape characteristics were analyzed to determine the landscape-based factors memberships; finally, the habitat suitability index was calculated by combining the factors memberships and weights to extract the locust area. Compared with the patch-based model using moving windows (patch based-analytic hierarchy process model, R2 = 0.77), the LHS model accuracy improved significantly (R2 = 0.83). Our results showed that the LHS model has a better application prospect in large-scale locust area extraction. By analyzing the locust areas evolution along the MLYR extracted using the LHS model, we found human activities were the main factors affecting the locust areas evolution from 2016 to 2020, including: (1) planting the plants that locusts do not like and urbanization caused the decrease of the locust area; (2) the wetland protection policies may cause the increase of the locust area. The model and research results help locust control and prevention to realize the sustainable development of agriculture.

Graphical Abstract

1. Introduction

The Oriental migratory locust Locusta migratoria manilensis (Meyen) is the most common locust in China [1,2]. Locust infestation areas are mainly distributed in the middle and lower reaches of the Yellow River (MLYR), Bohai Bay, Huai River Basin, and Hainan Island of China, with an annual area of 1 million to 1.5 million hm2 [3]. The outbreak of the locust can pose a severe threat to agricultural production [3,4]. In recent years, locust management has achieved remarkable results in China. However, in locust areas (the area possessing suitable breeding habitat for locusts and has locust infestation) accurate extraction is not easy due to the migration of locusts and the influence of global warming and human activities [5,6]. Therefore, the aim of this study is to achieve the accurate extraction of large-scale locust areas, which is significant for locust ecological control and environmental protection.
The breeding and occurrence of locusts require specific landscape structures and habitat conditions [7,8]. In recent years, some scholars have determined the habitat factors affecting the breeding and occurrence of locusts (including vegetation, soil, climate, and others) based on remote sensing technology [9,10,11,12,13,14,15,16,17,18,19,20,21]. The period for obtaining these locust habitat factors is mainly based on the locust development period from April to September or an empirical unified time range. However, as factors such as temperature, humidity, and vegetation can affect the development of locusts, the locust development time varies from southern to northern regions of China [22]. Therefore, we need to determine the extraction time range of the factors sub-regionally to extract large-scale locust areas.
In addition, some scholars have also utilized remote sensing technology to quantify the impact of landscape structure on locusts to realize the extraction of locust areas [7,23]. These studies usually use moving windows to measure the characteristics of landscape patches within a certain range of each pixel. However, using regular spatial area units to quantify patches of various shapes in the actual landscape may bring errors [24,25,26]. At the same time, the change in land cover class (LCC) directly affects the development of locusts [8,23]. LCC is also one of the most common factors affecting landscape structure, functions, and dynamics, with obvious spatial scale attributes [27,28]. Therefore, we need to consider the distribution structure of LCC and the distribution information of patches in the actual landscape when analyzing the landscape structure of locust habitats at large scales.
Given the above issues, this study proposed a landscape-based habitat suitability model (LHS model). In this model, we introduced the degree-day model (DD model, a tool for pest phenology analysis) [29,30] to simulate the locust development of different regions and obtain the habitat factors based on the development time. Then, we extracted the patch distribution of different LCCs and landscape characteristics of neighboring areas using remote sensing data to simulate the needs of locust habitat at a suitable landscape level based on class and achieve accurate extraction of locust area. The locust area along the MLYR is the most frequent and relatively continuous locust infestation area, accounting for approximately 40% of the total locust area in China [31]. Moreover, due to the effective management of locust areas in recent years, locusts along the MLYR were not found to be migratory from 2016 to 2020. The breeding and infestation areas of locusts were consistent in their spatial distribution. Therefore, the LHS model combining the locust source and habitat suitability analysis can be used to extract the locust areas along the MLYR from 2016 to 2020. Therefore, this study used the locust area along the MLYR from 2016–2020 as an example to explore remote sensing extraction and analysis of the locust area at large scales.
The main tasks of this study include (1) quantifying the spatial differences of locust development time using the DD model and obtaining the habitat factors based on multi-source remote sensing and auxiliary data; (2) proposing the LHS model for locusts to extract locust areas at large scales; and (3) analyzing the influence of landscape structure on locust area extraction and the evolution trend in locust areas along the MLYR extracted using the LHS model. The model and results presented in our study could provide scientific research support for the accurate extraction of locust areas to improve locust pre-control ability and realize guaranteed national food security and enable sustainable agriculture.

2. Materials and Methods

2.1. Study Area

In this study, counties/cities/districts along the MLYR (34°06′51.47″N~38°10′36.76″N, 109°42′14.87″E~119°18′43.56″E) were selected as the study area (Figure 1), including the riverine locust area along the Yellow River and coastal locust area around Bohai Bay. The riverine locust areas were formed by the water level and river channel changes along the MLYR. These processes created a large area of wasteland or intercropping wasteland with extensive farming and reeds (Phragmites australis), sedges (Cyperus rotundus L.), barnyard grass (Echinochloa crusgalli), and other plants locusts like to eat, resulting in perennial habitats suitable for locust breeding. The coastal locust area is generally located 10−20 km away from the sea. Areas with less salt are infested with plants that locusts eat, such as reeds and elephant grass (Imperata cylindrical). The study area has a temperate monsoon climate and four distinct seasons. The primary terrain is the alluvial plain of the Yellow River.

2.2. Data

2.2.1. Remote Sensing Data

The remote sensing data used in this study included Landsat OLI with a 30 m spatial resolution from 2010 to 2020, Soil Moisture Active and Passive (SMAP) with 10 km spatial resolution [32], ERA5-Land dataset(Band: temperature_2m) with 10 km spatial resolution [33] from 2016 to 2020, Land cover/use class dataset in 2017 from FROM-GLC (Finer Resolution Observation and Monitoring of Global Land Cover) [34]. Among them, the ERA5-Land dataset (Band: temperature_2m) was used to determine the extraction time of each habitat factor. Multitemporal remote sensing images of Landsat and SMAP were used for habitat factors extraction and landscape structure analysis. The land cover/use class dataset was used to get samples for the classification of LCC from 2016 to 2020.

2.2.2. Ground Survey Data

National Agro-Tech Extension and Service Center (NATESC) and Plant Protection Station of Shandong, Henan, Shanxi, and Shaanxi Provinces provided detailed historical series data and documents of Oriental migratory locust infestation from 2016 to 2020, including the five-year average infestation area of each county/city/district, the dates of eggs hatching and third instar nymphs, infestation information, habitat condition, spring egg information and control measures.
We manually extracted the locust area regionalization along the MLYR from 2016 to 2020 in Arcgis 10.3 after a comprehensive analysis of these egg and infestation information. The five-year average infestation area was used to determine the weight of each habitat factor and verify the accuracy of locust area extraction. The dates of eggs hatching and third instar nymphs were used to obtain the extraction time range of locust habitat factors.

2.3. Methods

This study was performed in three steps (Figure 2). First, habitat factors were obtained based on locust development simulation of different regions using the DD model. Then, habitat factors were input into the LHS model to extract locust areas at the class level. Finally, the LHS model was compared with the patch based-analytic hierarchy process model (PB-AHP model) using moving windows to assess the advantages of the LHS model in large-scale locust area extraction and then analyzed the evolution of locust area along the MLYR. The key technologies and methods used in our study are described below.

2.3.1. Locust Development Simulation Using the DD Model

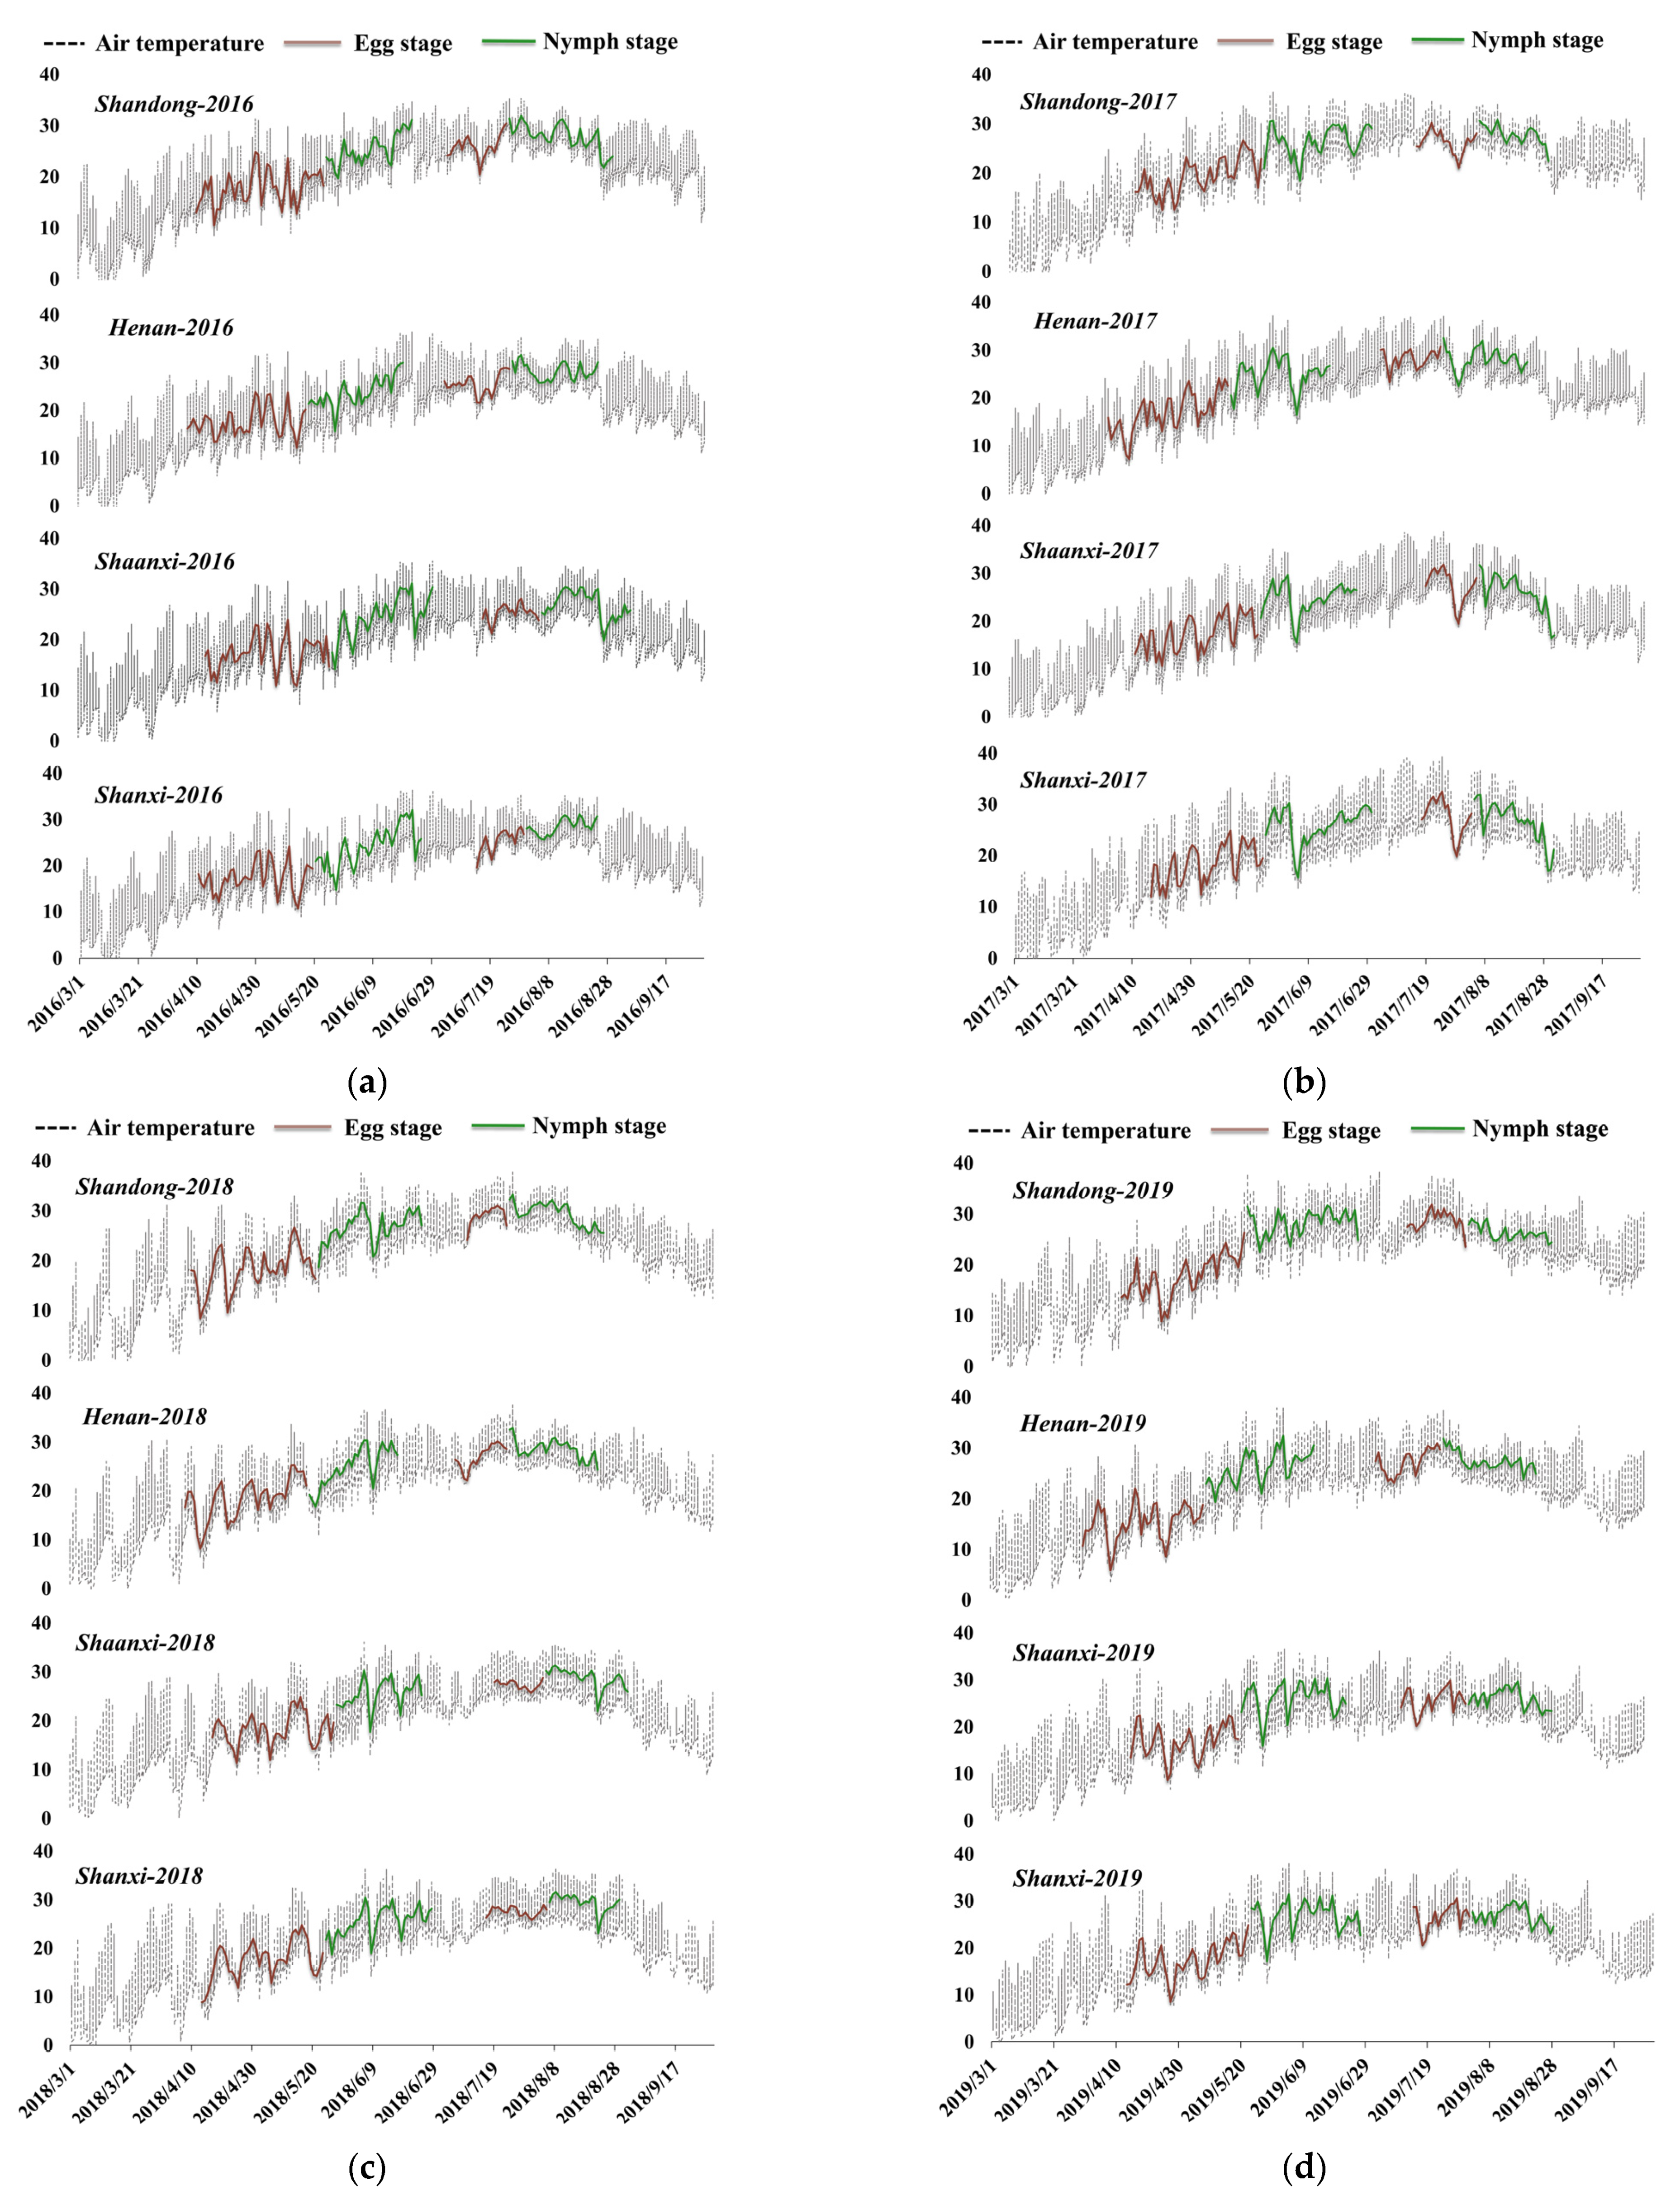
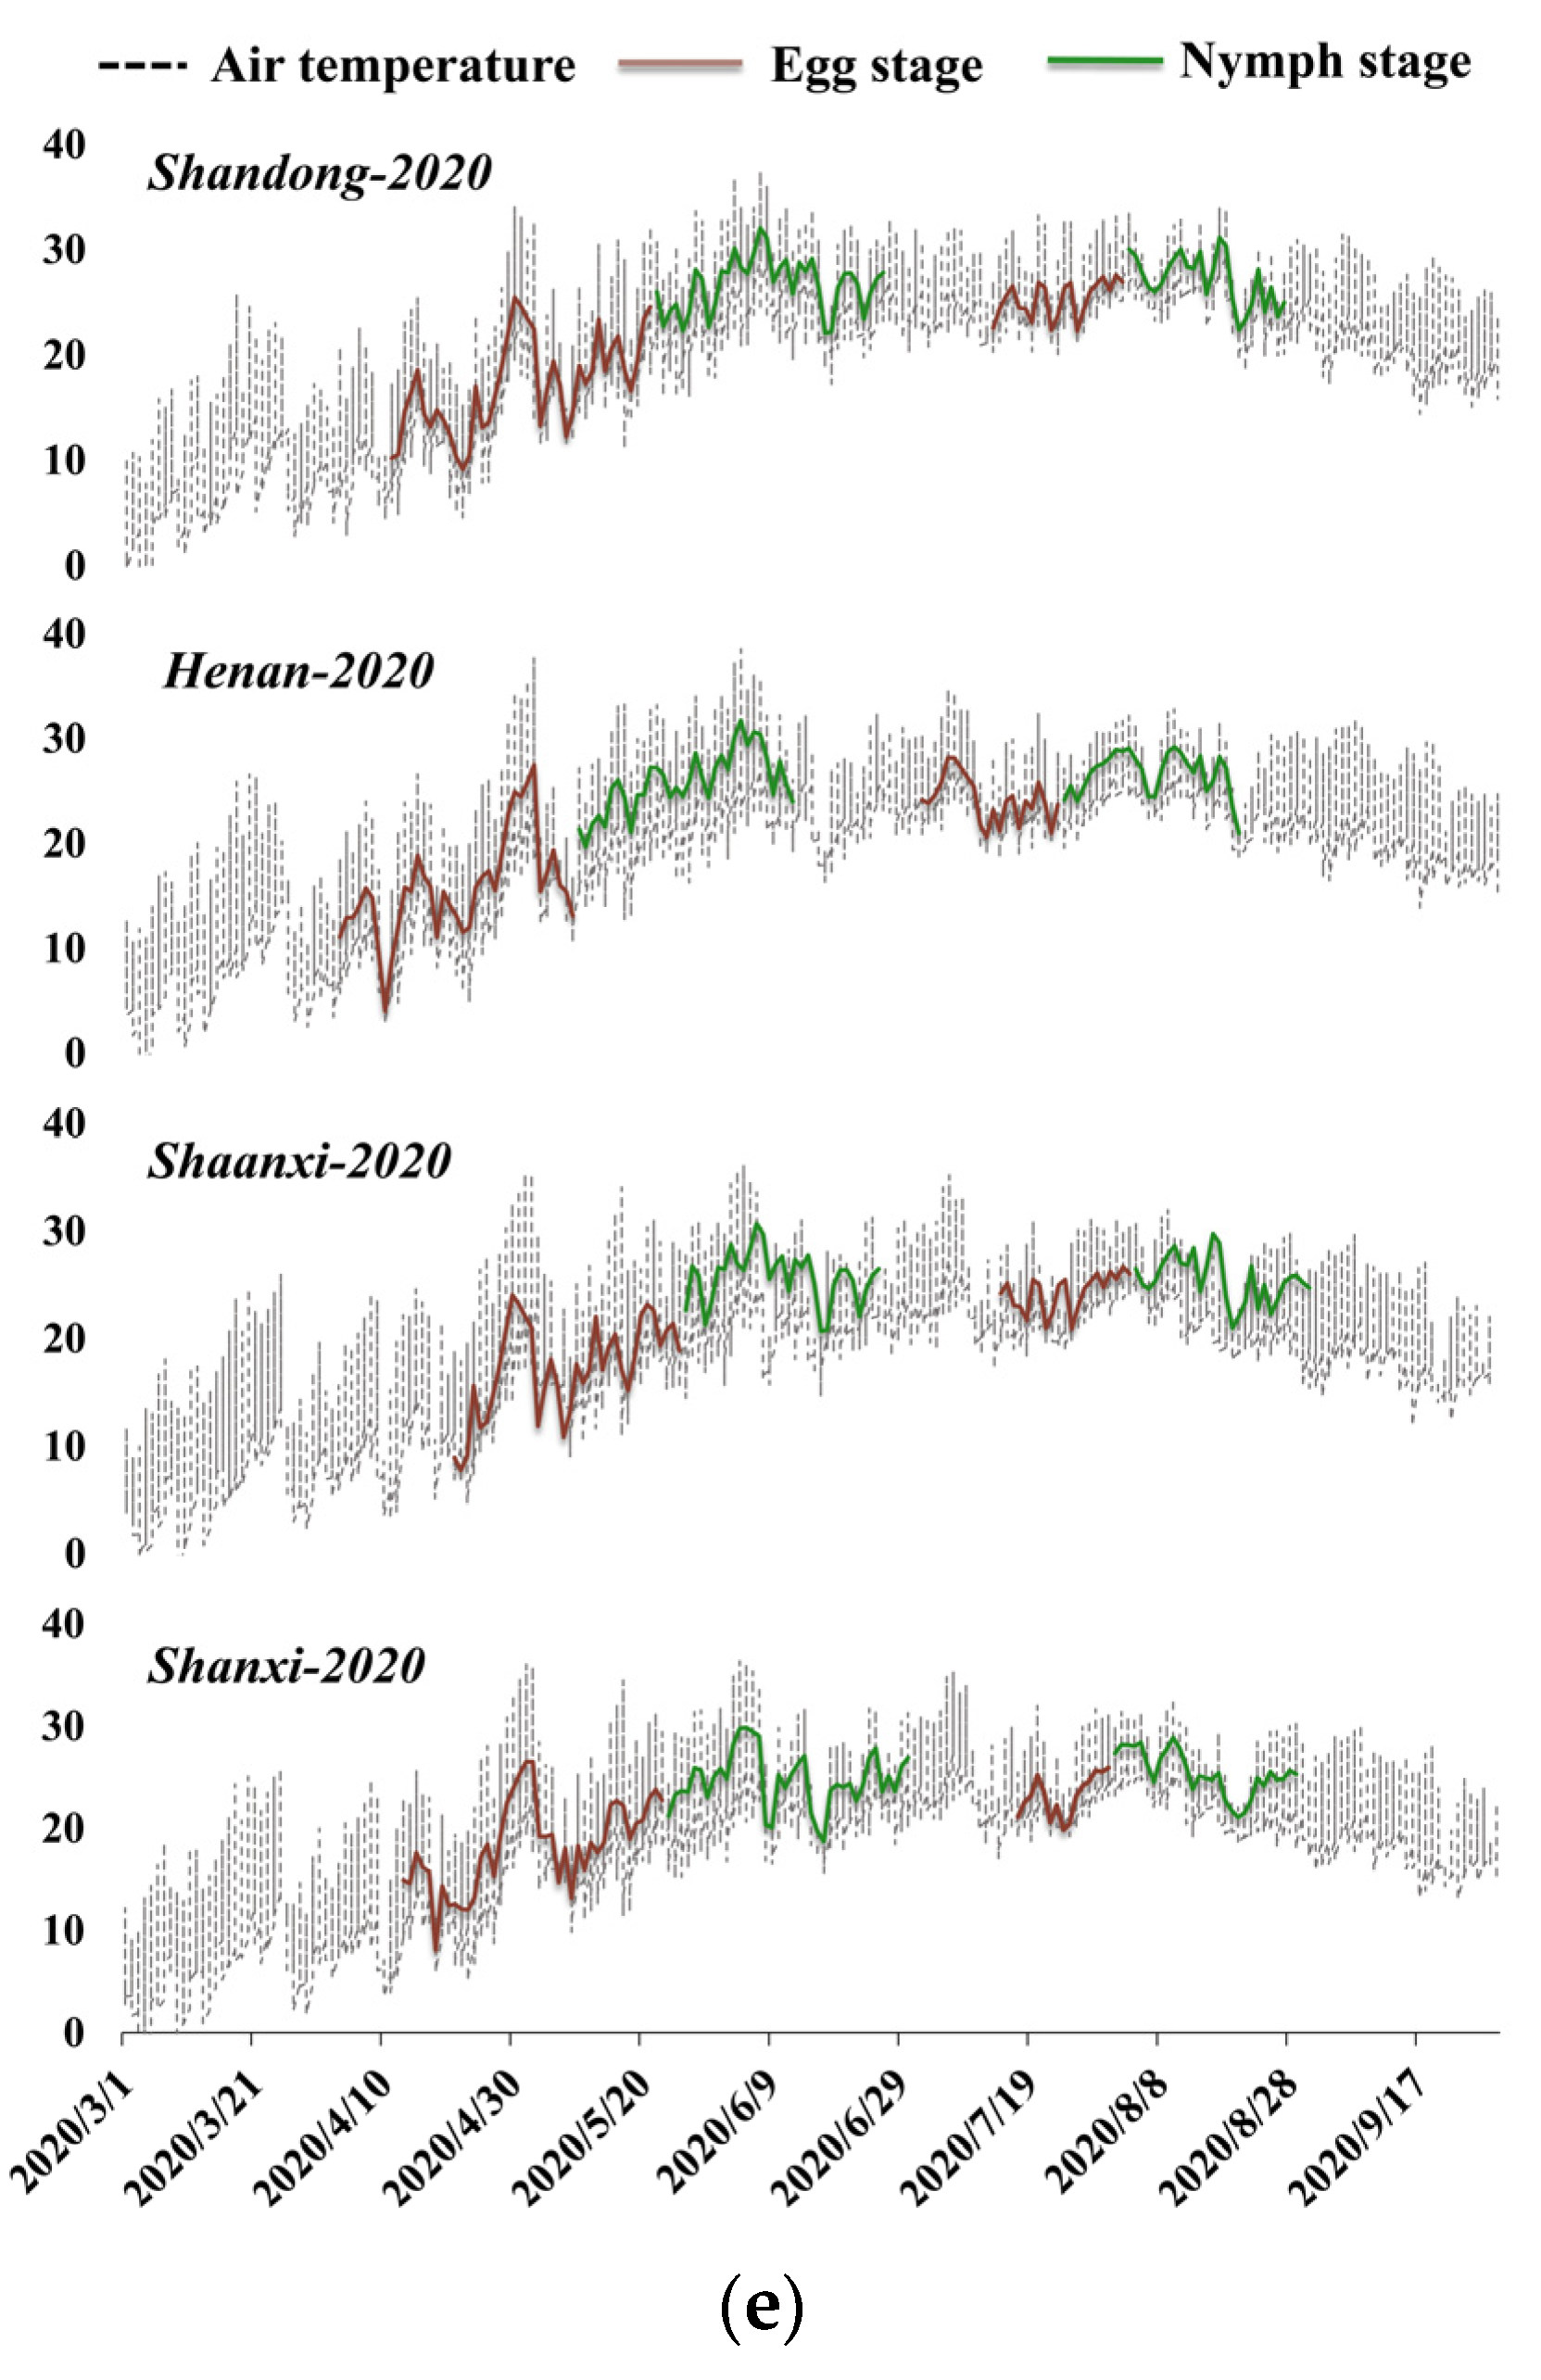
We used the DD model to simulate the locust development to get the dates required for obtaining habitat factors. The ERA5-Land(Band: temperature _2m) product, the dates of eggs hatching, and third instar nymphs of Shandong, Henan, Shanxi, and Shaanxi Provinces from NATESC were used as input data into the DD model to simulate locust development of the four provinces [4,29]. We have simplified the life cycle of the locust into egg stage, nymph stage, and adult stage [35]. Firstly, the dates of eggs hatching and temperature data of Shandong, Henan, Shanxi, and Shaanxi provinces were entered into the DD model of egg hatching (Equation (1), i = 1) to obtain the dates of egg stage. Secondly, the dates of nymph stage were calculated by combining the dates of eggs hatching and third instar nymphs and temperature data into the DD model of nymph development (Equation (1), i = 2).
n = 1 D i t = a n b n ( T n t C i ) / 24 = 617.7
i is the stage ‘i’ of the locust, i = 1, 2, referring to egg stage and nymph stage, respectively.   D i is the number of days required to complete locust development of stage ‘i’ in one generation, thus calculating the corresponding date. n is the nth day of a stage. T n t the temperature at hour t (1 ≤ t ≤ 24) of the nth day, a n is the time point when the temperature exceeds the development threshold temperature for migratory locusts on the nth day, and b n is the time point in one day when the temperature is below development threshold temperature on the nth day. C i   is the temperature exceeds the development threshold temperature for locusts at stage ‘i’ ( C 1 = C 2 = 14.2 °C). t = a n b n ( T n t C i ) / 24 is the DD of nth day. The DD required to complete one generation is 617.7. Required DD for egg hatching is 210, required DD for nymph development is 407.7 (during nymph stage, the DD required to complete the development to the third instar nymph from hatching is 130).

2.3.2. Habitat Factors Obtaining

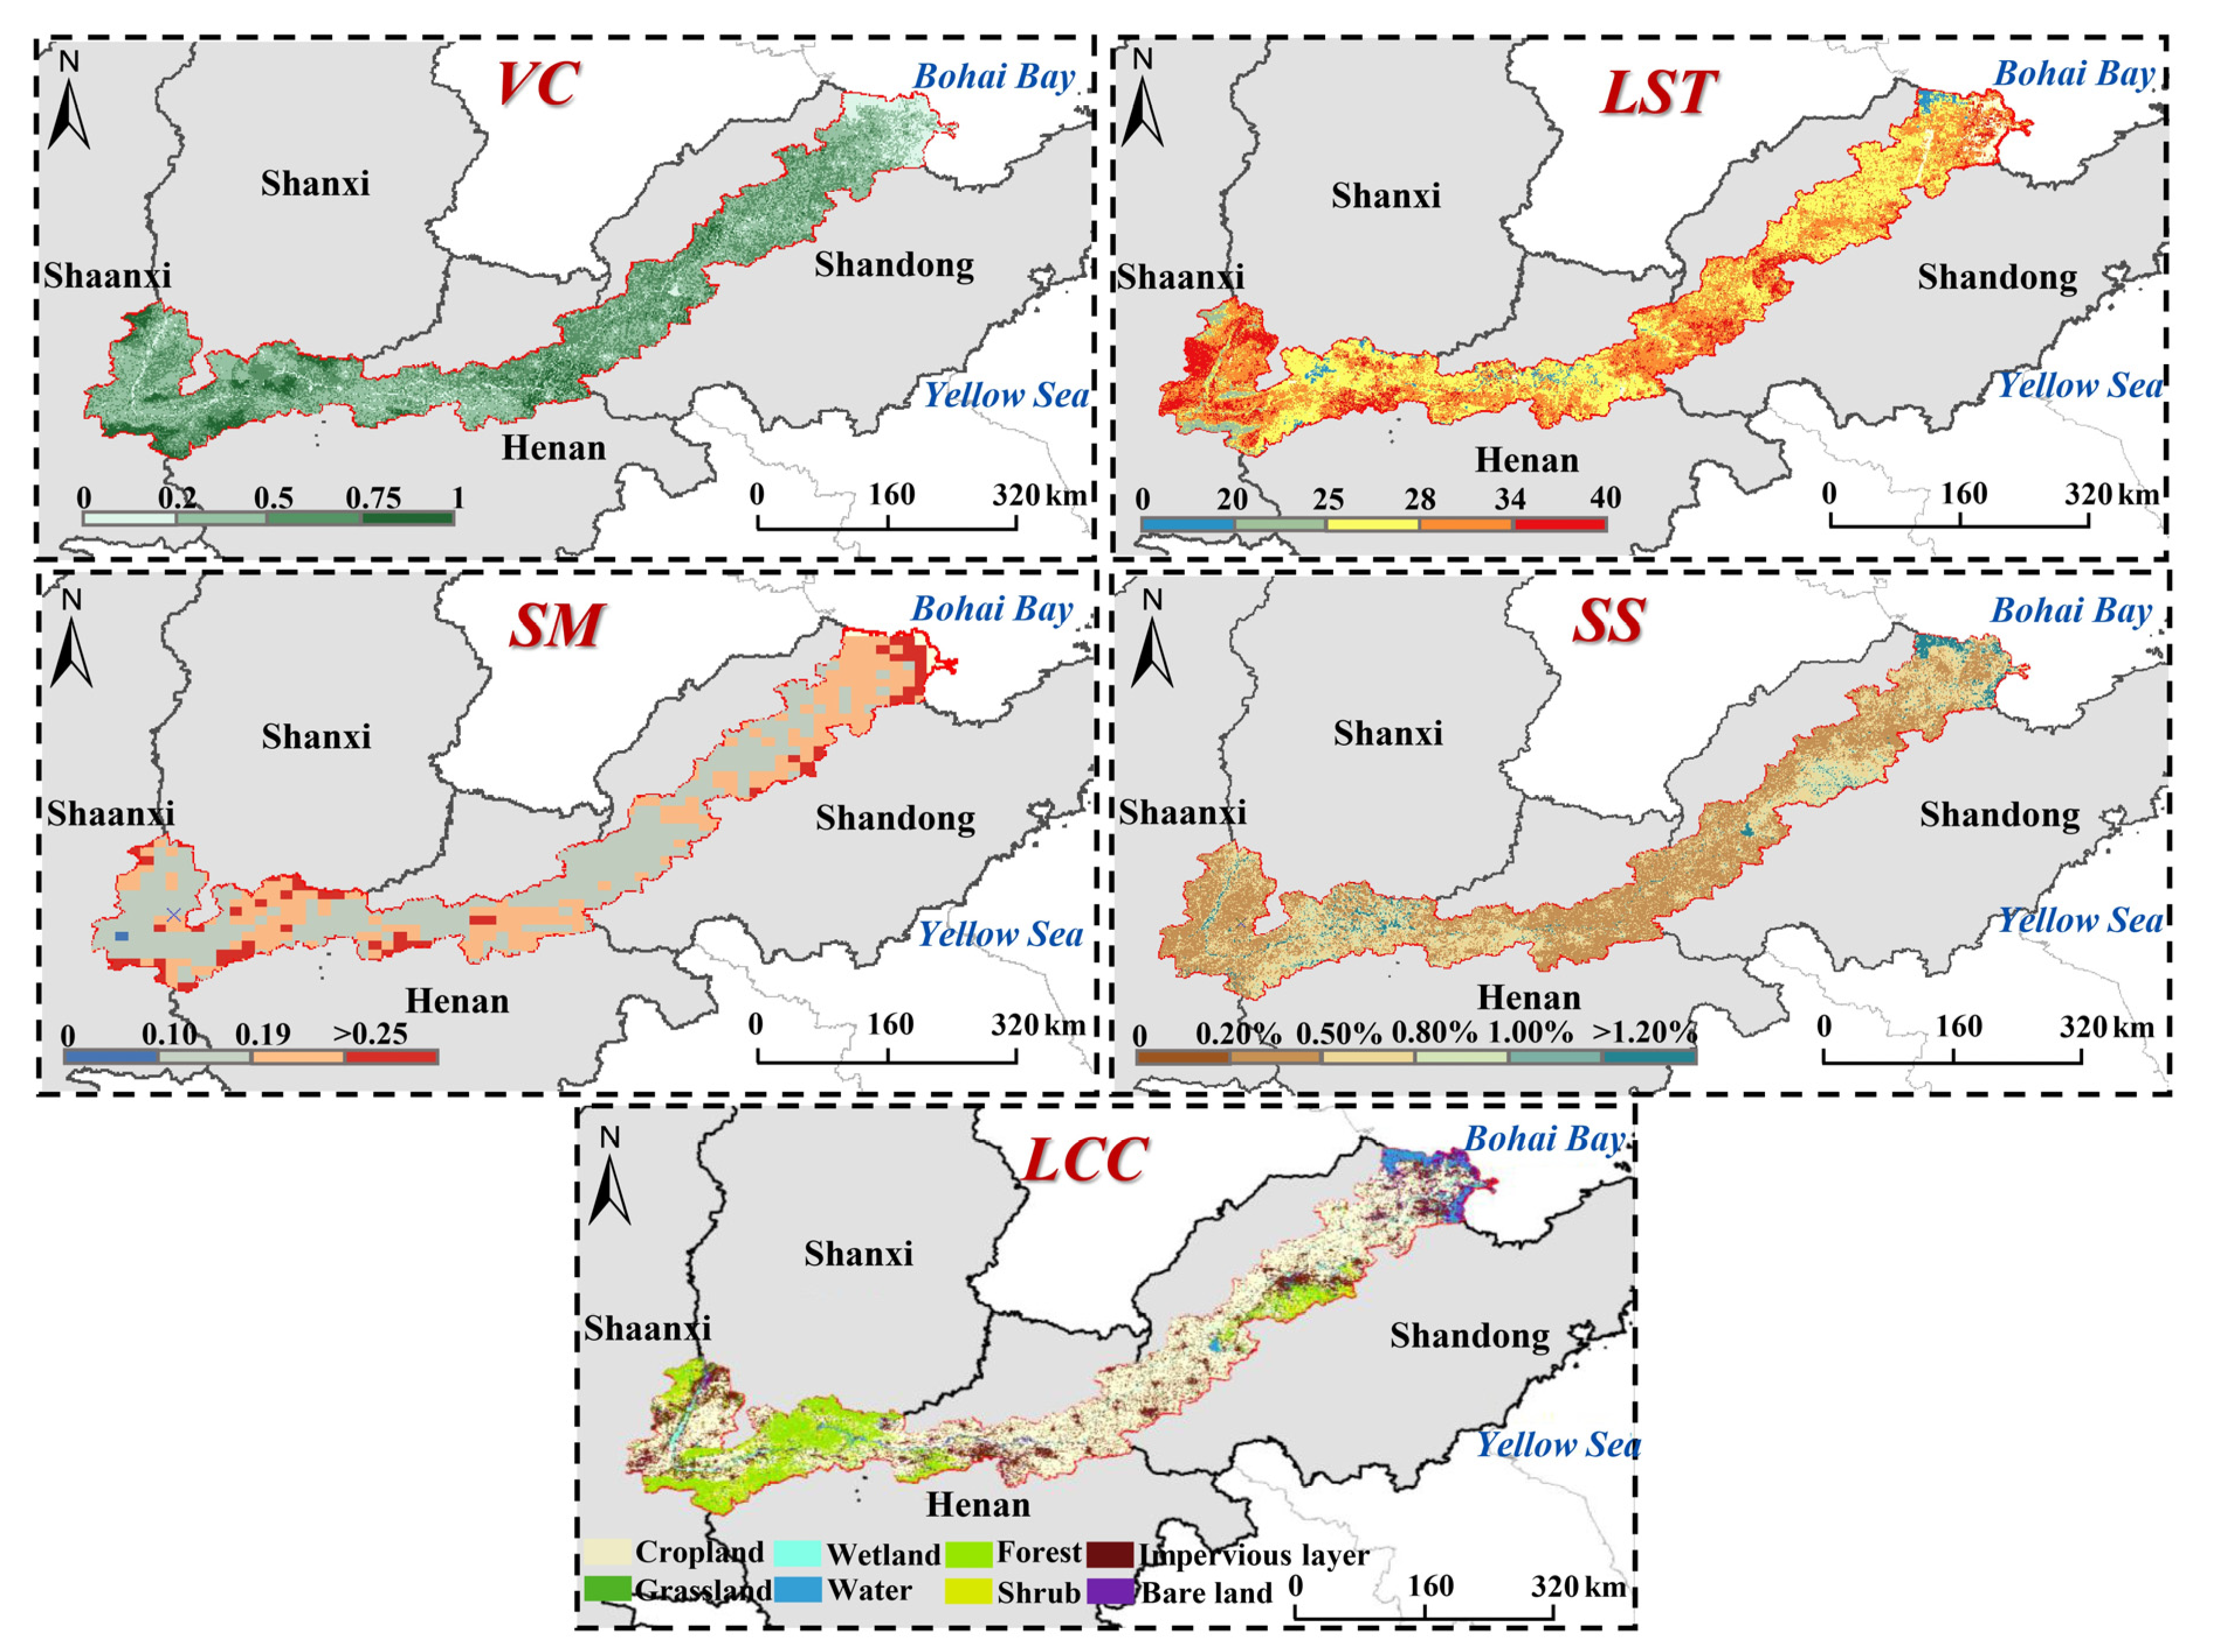
The breeding and occurrence of locusts are affected by climate, soil, vegetation, and human activities [5,18,36,37]. As a result, five habitat factors, including soil moisture (SM), soil salinity (SS), land surface temperature (LST), vegetation coverage (VC), land cover class (LCC) were selected to extract locust area based on the principle of dominant factors, relative stability, difference, and remote sensing operation. As locusts were not reported to have migratory behavior within this study area from 2016 to 2020, we focused on the impact of habitat on locust hatching and development during the locust egg and nymph stages. Among them, the obtaining time ranges of SS, SM, and LST were determined by the egg stage time range, the obtaining time range of VC was determined by the nymph stage time range, the obtaining time range of LCC was determined by the whole stage. The obtaining methods of each habitat factor are shown in Table 1. In addition, the source of locusts is also a critical factor. Locust area regionalization (LAR) represented the locust source information, which was a polygon shapefile data plot based on the ground survey information corresponding to the annual spring digging of eggs, combined with the a priori areas of locust perennial occurrence provided by NATESC and land cover/use data. LAR consisted of two values, 0 and 1, with 1 representing the presence of the locust source and 0 representing the absence of the locust source.
LCC classification was realized by a phenology-based random forest model [43], which could effectively increase the difference between LCCs with similar spectra [44,45]. First, Landsat data from 2010 to 2020 were collected. Then, pixels with clouds in each image were removed [46]. Next, we calculated the average, standard deviation, and median of NDVI, enhanced vegetation index (EVI) [47], and modified normalized difference water index (MNDWI) [48,49]. The amplitude and phase of each index were obtained using a harmonic model. The above parameters were used as features inputs to the phenology-based random forest model (100 trees) to generate LCCs from 2016 to 2020. The land cover classification method was verified by a confusion matrix. The samples used for land cover classification were randomly selected from a land cover dataset of 4000 sample sites (including 500 sites each of cropland, forest, grassland, shrub, water, wetland, impervious layer, and bare land) in 2017 [34]. The training and test samples were divided into a ratio of 7:3.

2.3.3. Locust Area Extraction Using LHS Model

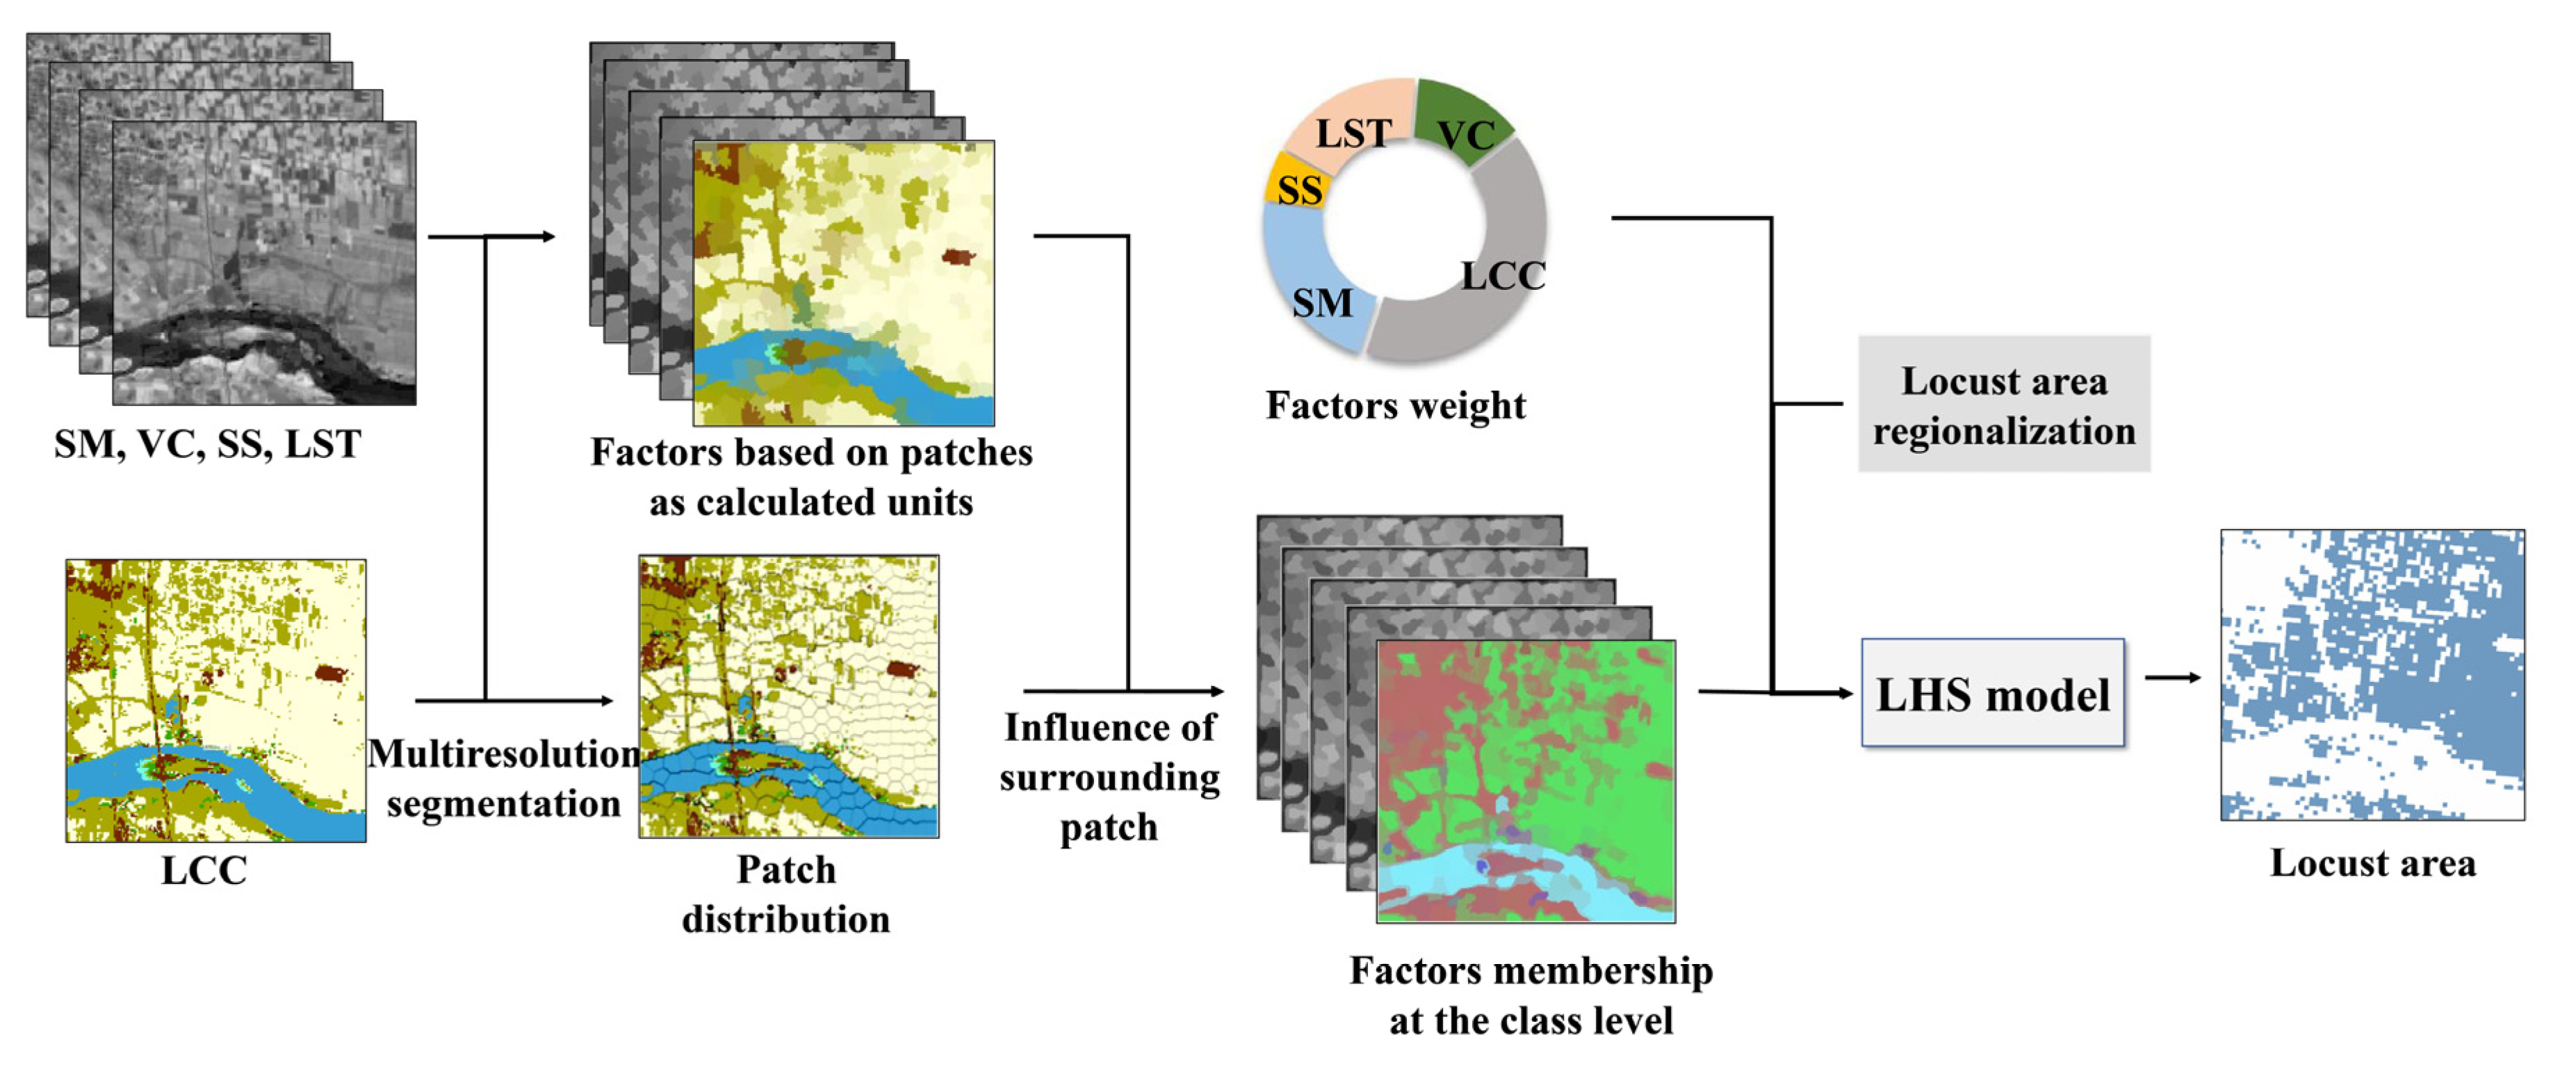
Since changes in the landscape structure of large locust habitats could affect the locusts breeding and occurrence, information on landscape hierarchy structure and the patch distribution of the actual landscape should be considered in locust area extraction. Therefore, we proposed the LHS model for the high-precision extraction of locust areas (Figure 3). The LHS model required the following processes: (1) analyzing the patch distribution of LCCs to determine the distribution of habitat factors based on patches as calculated units; (2) determining factor membership at the class level with the factors calculated in patches and the influence of surrounding patches; and (3) extracting locust area with factors membership at the class level and the weight of factors calculated based on the analytic hierarchy process (AHP).
(1)
Habitat factors obtained based on patches as calculated units
To extract factors based on patches as calculated units, we used multiresolution segmentation [50,51,52] to realize patch segments of different LCCs (including wetland, grassland, cropland, and water) that affect the breeding and occurrence of locusts. The scale parameters were input into multiresolution segmentation according to the minimum patch area of different LCCs. Then, scaling [53,54], a method that could derive the average characteristics of large-scale parameters by using the average values of small-scale parameters, was introduced to calculate the values of habitat factors based on patches as calculated units:
V q , p = j = 1 N p V q , j , p / N p
q is 1, 2, …, 5, and V 1 , p , … …, V 5 , p represent the values of LCC, VC, SS, SM, and LST, of patch p. V q , j , p is the qth habitat factor value of pixel j in patch p, and N p is the number of pixels contained in patch p.
(2)
Habitat factor membership at the class level
According to the relevant literature and data, five habitat factors based on patches as calculated units ( V q , p ) were divided into four memberships ( M q , p ), including optimal, good, general, and poor, and assigned 4, 3, 2 and 1, respectively (Table 2) [4,19,37,55,56,57].
The suitability of patches surrounding wetland is significantly higher than that of patches around the cropland in the case of the same habitat attributes of the patches. Meanwhile, the locust area has certain continuity. Therefore, the influence of surrounding patches should be considered when calculating the factor membership at the class level. Closer patches have a more decisive influence, so higher weights are assigned to closer patches. In this study, the reciprocal of the spatial distance between patch centroids was used to represent the weight of the surrounding patches’ influence on the central patches:
W i , p = 1 x i x p 2 + y i y p 2
where x p , y p is the centroid coordinate of the central patch p and x i , y i are the centroid coordinates of the adjacent patch i.
Based on the influence of the surrounding patches on the central patches and the values of habitat factors based on patches as calculated units, the membership of the five habitat factors at the class level was calculated by the following:
M q , p l o c u s t = i = 1 N c W i , p M q , i , p i = 1 N c W i , p
where M q , p l o c u s t is the qth locust habitat factor membership of patch p at the class level; q = 1, 2,…, 5 represent LCC, VC, SS, SM, and LST, respectively; N c is the number of patches surrounding the central patch; W i , p is the influence weight of the ith surrounding patches on the central patch p.   M q , i , p is the qth factor membership of the ith patch around the central patch p.
(3)
Locust area extraction
In this study, the habitat suitability index (HSI) (Equation (5)) of locusts was calculated based on the LHS model to realize locust area extraction. The habitat factor membership at the class level ( M q , p l o c u s t ) and the factor weights were required to calculate HSI. AHP [58,59], as a weighted decision analysis method, was used to calculate the factor weights( W q ) . We randomly selected 28 of the 45 counties/cities/districts with locust infestation to calculate the correlation between the 5-year (2016–2020) average infestation area and the 5-year average of each habitat factor in these 28 counties/cities/districts. Then, the absolute values of these correlation coefficients were input into the AHP to obtain the factor weights.
H S I p l o c u s t = q = 1 5 W q M q , p l o c u s t × L A R
where H S I p l o c u s t is the locust habitat suitability score of patch p, ranging from 0 to 4. In this study, areas with a value less than or equal to two were not considered locust areas, and areas with a value greater than two were considered locust areas. W q is the locust habitat factor weight obtained by AHP, L A R is the locust area regionalization.

2.3.4. Accuracy Assessment

To analyze the accuracy of the LHS model, we conducted a comparative analysis between the LHS model and the PB-AHP model [23]. The PB-AHP model used the moving window method to quantify the influence of surrounding pixels on central pixels and analyze the locust habitat suitability at the patch level and extract locust areas. We input the same habitat factors into the PB-AHP model to extract the locust area along the MLYR. We calculated the correlations (R2) between the 5-year average locust actual infestation area and 5-year average locust area extracted using the LHS and PB-AHP model in the remaining 17 counties/cities/districts. We evaluated the accuracy of this model in real independent datasets by cross-validation (six groups), which can reduce the chance introduced by a single random division through multiple divisions while improving the generalization ability of the model. The mean value of multiple groups validation result was used to verify and compare the results accuracy of the LHS model. We also compared and discussed the locust area spatial distributions of these two models in terms of LCC.
R 2 = c o r r x , y 2 = i = 1 n x i x ¯ y i y ¯ i = 1 n x i x ¯ 2 i = 1 n y i y ¯ 2 2
where c o r r x , y is the Pearson coefficient, which ranges between −1 and 1. x i is the area of locust area extracted from the i th county/city/district, y i is the actual area that occurred in the i th county/city/district, and y is the total number of counties/cities/districts used for verification, which is 17. x ¯   and y ¯ are the average values of x and y , respectively.

3. Results

3.1. Locust Development of Each Province

Based on climate reanalysis data, auxiliary data, and the DD model, we have simulated the locust development of each province (Figure 4). The results showed the egg stage in Shandong was from early-mid April to mid-late May and mid-July to early August, the nymph stage was from mid-late May to the end of June and early to late August. While the egg stage in Henan Province was from early April to mid-May and the beginning of July to late July, and the nymph stage was from mid-May to mid-late June and from late July to mid-late August. The egg stage of Shaanxi Province was between mid-April and late May, mid-July and early August, and the nymph stage was from late May to the end of June and early August to the beginning of September. The egg stage was between early-mid April and mid-late May, mid-July, and early August, and the nymph stage was from mid-late May to the end of June and early August to the end of August. The curves of the four provinces may indicate certain spatial differences in the development of locusts.

3.2. Habitat Factors

Landsat and SMAP data were used to generate distribution maps of locust habitat factors from 2016 to 2020, including VC, LST, SM, SS, and LCC (taking the Year 2020 as an example, Figure 5). For LCC, the land cover classification accuracy reached 73% (Table 3). The lower accuracy of the wetland classification in this study was because the samples were randomly selected based on global land cover products in 2017. The wetland in this product is a permanent wetland. The data source for land cover classification has a time range covering the locust development (mainly from April to September), with relatively high temperatures and low water levels. Therefore, part of the water in the product is classified as wetland.

3.3. Locust Area during 2016–2020 Based on the LHS and PB-AHP Models

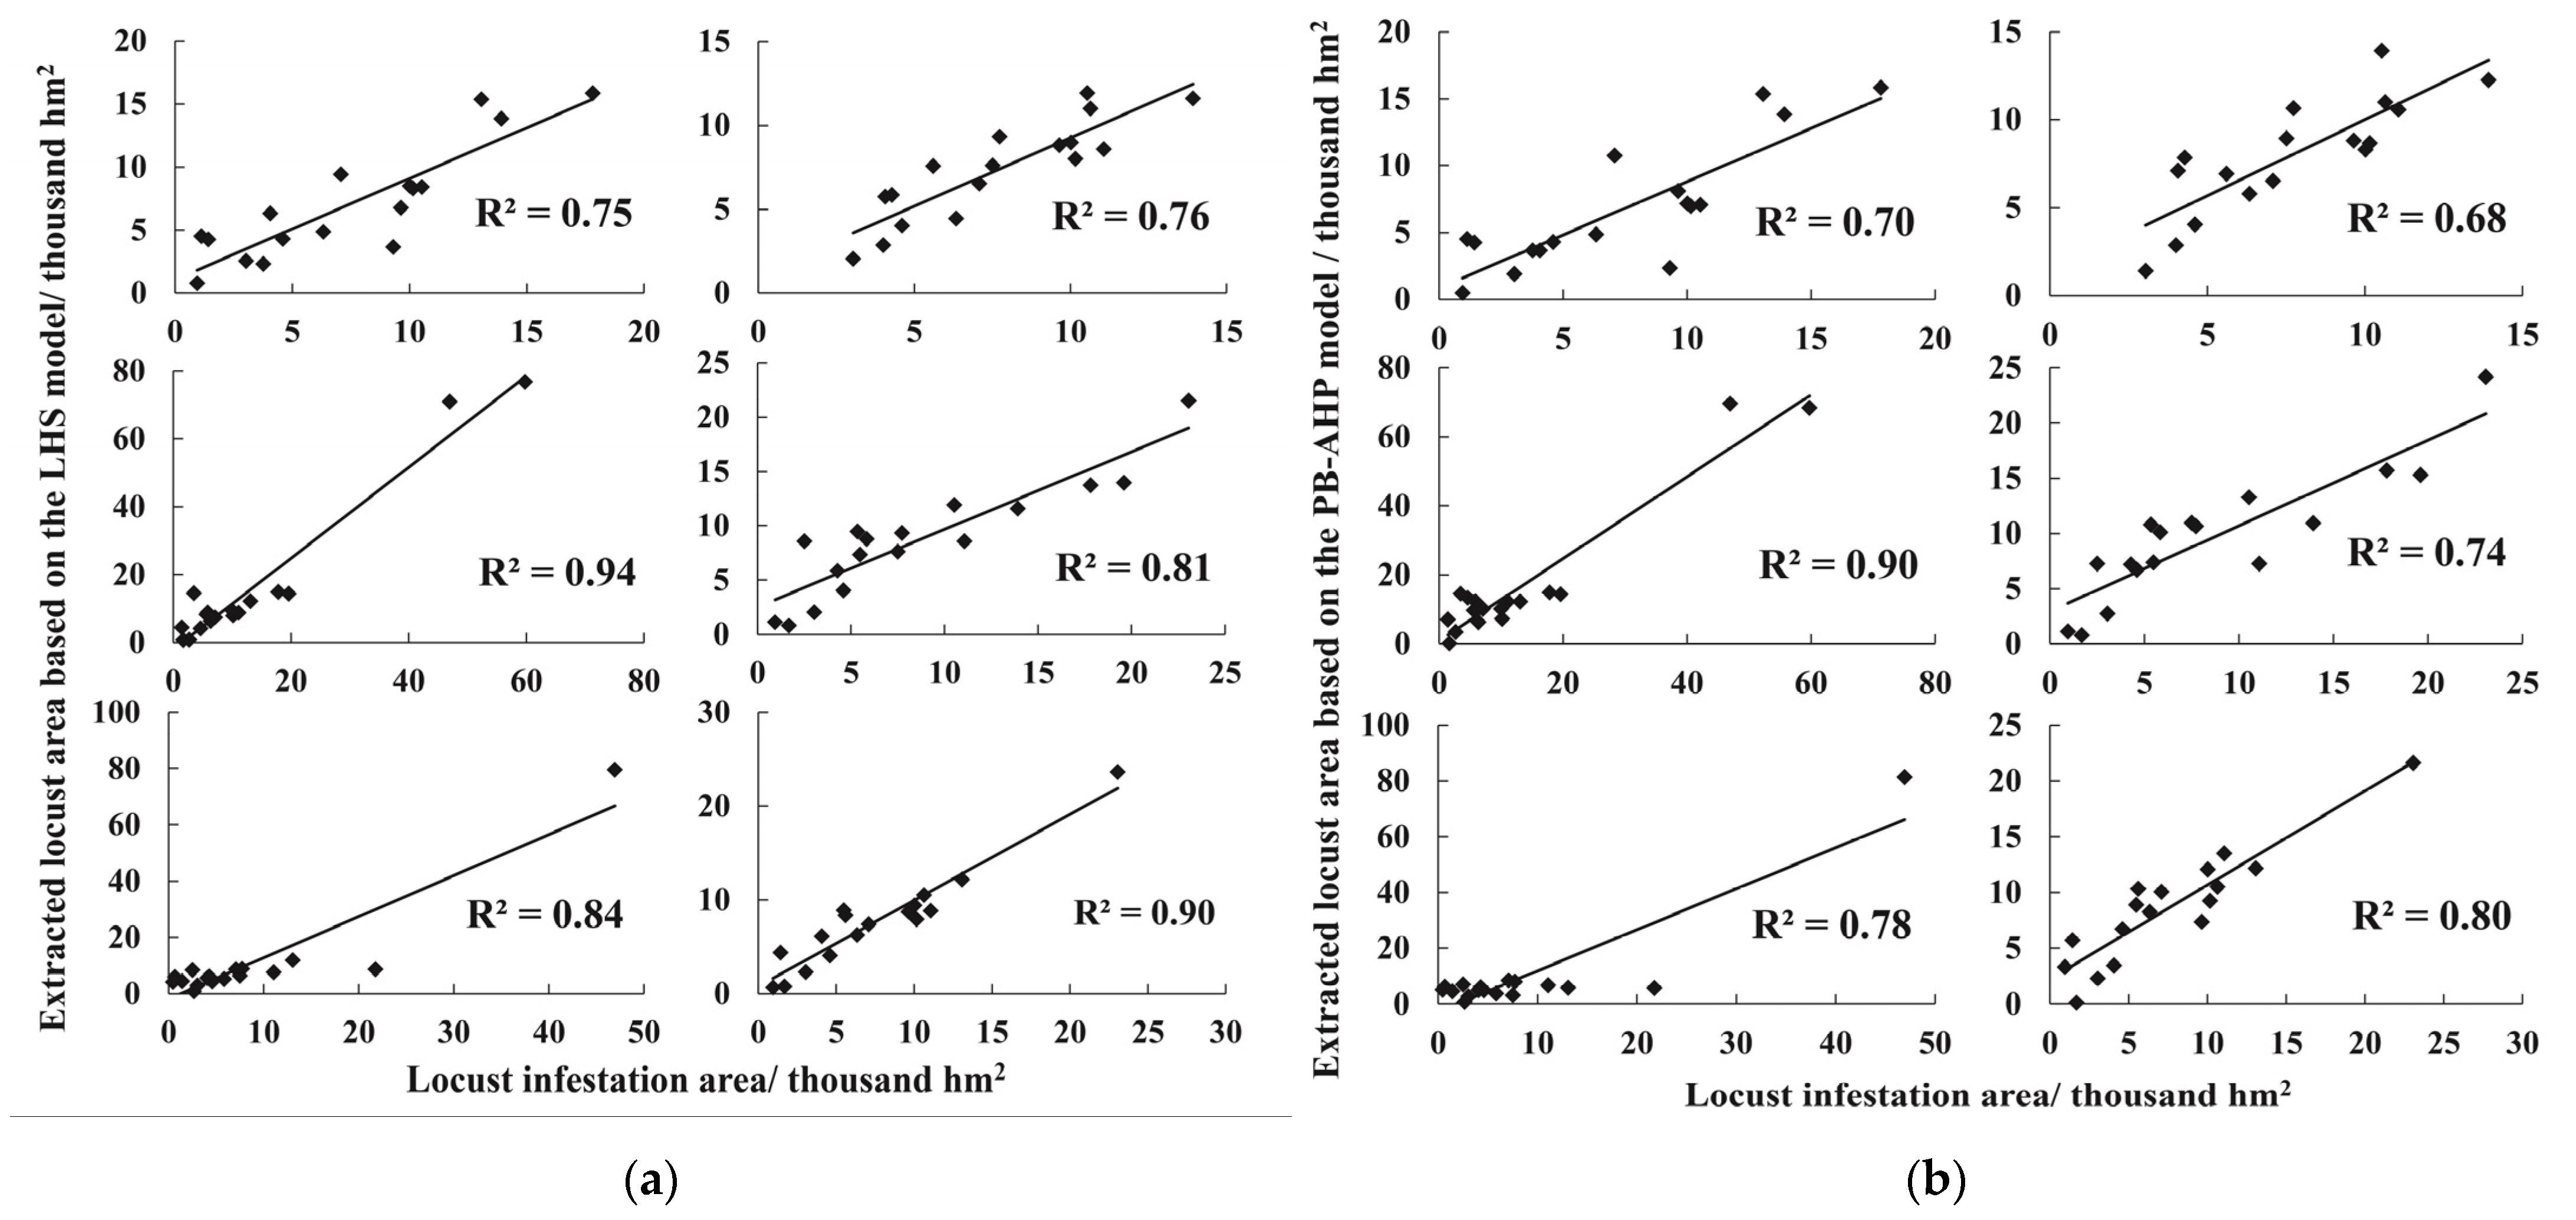
LCC, VC, SS, SM, and LST during 2016–2020 were input into the LHS model to obtain factor memberships at the class level and factor weights (Table 4). According to the weight analysis, LCC was the most important factor affecting locust breeding and occurrence along the MLYR, followed by SM and LST, VC, and SS. In this study, locust areas were extracted for five consecutive years, including 500.68 thousand hm2, 461.59 thousand hm2, 448.34 thousand hm2, 479.57 thousand hm2, and 482.78 thousand hm2 from 2016 to 2020, respectively. The locust areas in Henan, Shandong, Shaanxi, and Shanxi Provinces accounted for 47.04%, 33.08%, 9.84%, and 10.04% of the total area. In comparison, the PB-AHP model was used to extract the distribution of the locust areas from 2016 to 2020 in our study (Figure 6). The locust area extracted by the LHS model had a high correlation with the actual occurrence area, with an average R2 for six groups of 0.83. While the corresponding average R2 of the PB-AHP model is 0.77 (Figure 7). This result indicated that the LHS model is reliable.
We analyzed the locust area distributions extracted by the LHS model and the PB-AHP model using the transition matrix method. The areas that could be extracted by the LHS model but not be extracted by the PB-AHP model and the areas that could be extracted by the PB-AHP model but not be extracted by the LHS model were obtained. Typical areas were selected for a more detailed comparison to show the advantages of the LHS model in locust area extraction (Figure 8). The results of the LHS model in the area where the LCC was wetland (Figure 8a) and the areas adjacent to the two LCCs (Figure 8b) were more in line with the actual locust area.

3.4. Locust Area Evolution

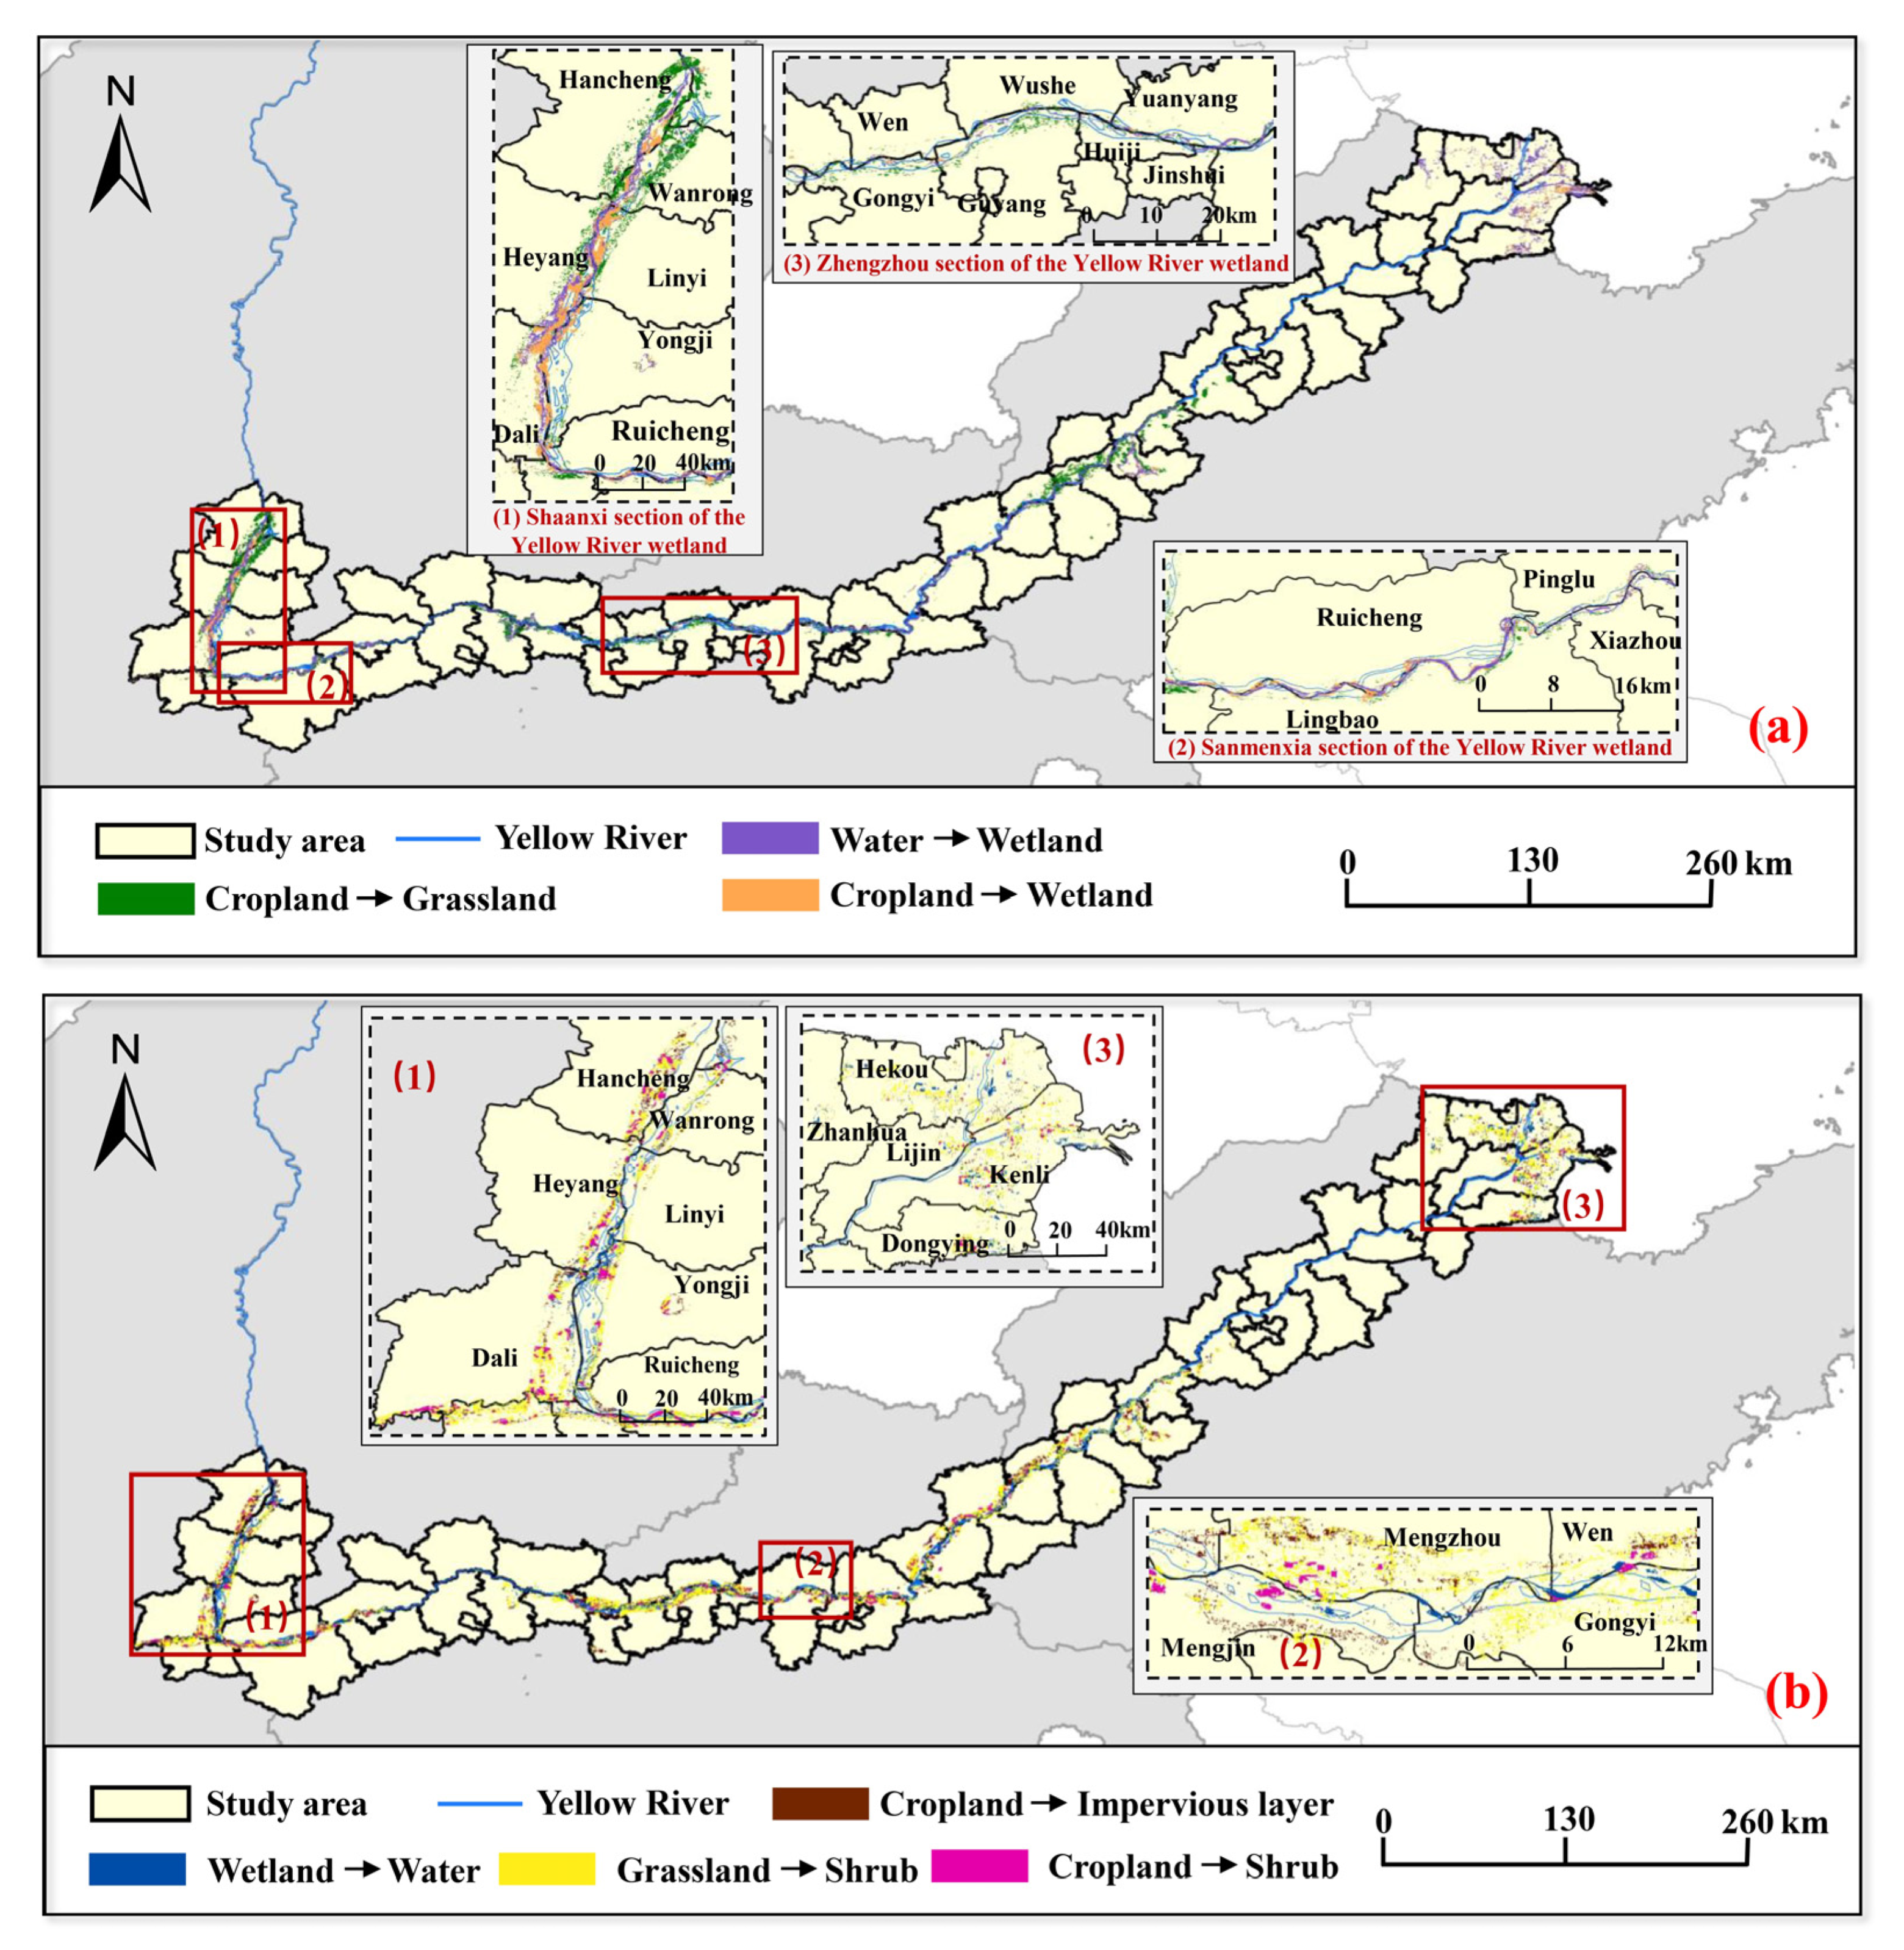
This study mapped LCC changes corresponding to the regions where the locust area increased and decreased from 2016 to 2020 (Table 5, Figure 9). The increase of the locust area was mainly due to the conversion of water into wetland, cropland into wetland and grassland. Among them, the areas where water was converted to wetland were distributed along the Yellow River, mainly in the border of Shaanxi Province and Shanxi Province and the coastal counties/cities/districts of Shandong Province. The areas where cropland was converted to wetland were mainly distributed in the border of Shaanxi Province and Shanxi Province and the area along the Yellow River in Zhengzhou City and Sanmenxia City of Henan Province. While the areas where cropland was converted to grassland were mainly distributed in counties/cities/districts of Shaanxi Province, Shanxi Province, and western Henan Province (Figure 9a). The decrease of the locust area was mainly due to the transformation of grassland and cropland into shrub, wetland into water and cropland into impervious layers. Among them, the areas where grassland and cropland transformed to shrub, cropland transformed to impervious layer, were more evenly distributed within the study area. The areas where wetland transformed into water were distributed along both sides of the Yellow River (Figure 9b).

4. Discussion

4.1. Assessment and Analysis of Locust Area Extraction

The breeding and occurrence of locusts are affected by many factors. Among them, climate factors, mainly including temperature and precipitation, have an essential impact on locust development [55,60]. LST and SM were used in this study to characterize the impacts of temperature and precipitation on locust development. For nymph and adult, relative moisture is also very important. However, this study has not yet considered this factor due to the lack of existing relevant expert knowledge. We will explore the relative moisture in subsequent studies. Soil has a more significant impact on eggs hatching [16,61], so SM and SS were chosen as habitat factors to analyze the locust area distribution. Vegetation is also an important factor affecting locust development [62]. Both vegetation coverage and vegetation type affect the foraging of locusts, so VC and LCC were selected as habitat factors in this study. The impact of human factors on locust breeding and occurrence is mainly reflected by the human use of land resources, so our study used LCC to represent human factors [63,64]. SM, SS, LST, VC, and LCC were selected in this study to extract locust areas through comprehensive analysis. The selection of these five habitat factors took into account the influence of all factors on the key development stages of locusts, allowing the locust area extraction model to be more reasonable from a biological point of view. To obtain the optimal factors in a large area, we used the DD model to simulate locust development in different regions and extract habitat factors based on these time ranges. If there is no distribution of locust sources, the areas suitable for locust would not always have locust infestation. Therefore, LAR was input into the LHS model to characterize the locust sources.
In addition, locust habitats are geographically continuous patches with specific hydrographical and landscape structures [7,8], so the landscape structure should be considered to realize large-scale locust area extraction. Landscape structure research is a scale-sensitive analysis [35]. We needed to choose an appropriate landscape scale for the study area at different spatial scales to extract locust areas. LCC represents important hydrological rules, vegetation requirements, and landscape distributions in locust areas, and the changes of LCC directly affects the evolution of locust area on large scales. Therefore, this study used class-level analysis in landscape ecology to quantify the impact of landscape structure on the extraction of locust areas. By analyzing the locust area distribution extracted by the PB-AHP model and the LHS model, it can be found that the PB-AHP model is not as effective as the LHS model for the extraction of wetland areas (Figure 8a). Among the LCCs, wetland provides suitable conditions for eggs hatching. However, the suitability of other factors (such as vegetation) would affect the extraction of locust areas in the wetland area. The LHS model considered the hierarchical information of the landscape structure by dividing the LCCs firstly and extracting the patches, which strengthened the influence of LCC and made the extraction of locust areas corresponding to wetland areas more reasonable. The PB-AHP model used the moving window method with regular space area units to quantify the impact of the landscape structure may bring certain errors due to the different patch shapes in the actual landscape [28]. The patches formed by adjacent homogeneous pixels should have the same attributes [7]. We used patches as the calculation unit to make the extraction of locust areas more continuous. We also considered the influence of surrounding patches to better the response of locusts to the landscape structure in the extraction of adjacent patches with different LCCs (Figure 8b). The five-year average area of extracted locust area from 2016 to 2020 using the LHS model was highly correlated with the actual 5-year average infestation area (LHS model: R2 = 0.83, PB-AHP model: R2 = 0.77). The higher accuracy indicated that it was more appropriate to use the class level instead of the patch level to extract the locust area at the larger spatial scale. It also suggested that the landscape scale used for analysis should be different for different spatial scales. Further numerical analysis and validation will be carried out if more detailed spatial distribution point data can be obtained subsequently.

4.2. Locust Area Evolution Trend with LCC Change

LCC directly affects the breeding and occurrence of locusts, and LCC also represents the joint influence of human and natural factors. Therefore, we plotted the transfer matrices of LCC corresponding to the increased and decreased locust areas from 2016 to 2020 (Table 4) to further analyze the driving factors of locust area evolution along the MLYR. The results showed that the conversion between wetland and water led to the change of locust area distribution. The area of water converted to wetland in the MLYR was larger than the area of wetland converted to water, which indicated that the Yellow River water discharge decreased in these five years. There might be two main reasons for the decrease in the water discharge of the Yellow River. One reason was the decrease in rainfall along the MLYR from 2016 to 2020. The other reason was the continuous reclamation of forests and swamps weakened the water storage capacity of the Yellow River, enhanced the continental climate, and reduced the flow of the Yellow River. The conversion of cropland to wetland would also lead to an increase in the regions of locust areas. Among them, the counties/cities/districts in Shaanxi and Henan Provinces where the areas of cropland converted into wetlands located were mostly the implemented areas for the wetland ecological protection policies and measures in the Yellow River Basin (Figure 9a). Wetlands are rich in animal and plant resources. However, human’ development and utilization of wetlands have greatly destroyed the wetland ecosystem, causing natural wetlands to face serious threats in China. Therefore, the wetland protection and restoration of the Yellow River basin has become an essential task. Since 2016, wetland reserves have been constructed, including the expansion of the Shaanxi section of the Yellow River wetland, the effective management of the Sanmenxia section of the Yellow River wetland, and the Zhengzhou Yellow River National Wetland Park constructed in the Zhengzhou section of the Yellow River wetland, resulting in the conversion of other LCCs into wetlands. In addition, the decreased locust areas due to the conversion of grassland and cropland to shrub (Figure 9b) might be caused by the changes of gramineous plants that locusts prefer to eat into planting peanuts, asparagus (Asparagus officinalis L.), and other plants that locusts do not like [8,65,66]. The areas where the cropland changes to the impervious layer were evenly distributed in this study area (Figure 9b), indicating that the urbanization process is accelerating in the provinces along the MLYR.
From 2016 to 2020, the locust area along the MLYR first decreased and then increased. The difference between the area of the locust area in 2016 and 2020 is 17.90 thousand hm2. We analyzed the driving factors based on LCC changes for the evolution of locust areas, which mainly included human and natural factors (Table 6). The results showed that human activities have affected the changes in the locust areas to a greater extent in the past five years. Among them, the main factor leading to the decrease in locust areas might be planting peanuts, asparagus, and other plants that locusts do not like instead of gramineous plants. The main factor leading to the increase in the distribution of locust areas might be the wetland restoration and protection policies.

5. Conclusions

In this study, a large-scale locust area extraction model (LHS model) that considers the biological characteristics and habitat landscape structures based on multi-source remote sensing and auxiliary data was proposed. Additionally, we compared the accuracies of the PB-AHP model and the LHS model in large-scale locust area extraction. The result demonstrated that the LHS model has a better extraction effect than the PB-AHP model in wetland areas and adjacent areas of two LCCs. Compared with the PB-AHP model, the accuracy of the LHS model has been significantly improved (R2 = 0.83), indicating that the locust habitat suitability analysis based on a suitable landscape level could effectively improve the accuracy of the locust area extraction. We analyzed the evolution of the locust area along the MLYR from 2016 to 2020 extracted using the LHS model. The results showed that the increase in the distribution of locust areas might be due to the increase in wetland areas caused by the wetland protection and restoration policies [67]. The locust areas disappearing might be mainly caused by planting peanuts, asparagus, and other plants that locusts do not like.
This study attempted to analyze locust habitat suitability and extract locust areas, and explore the application of these results. These findings provided accurate information on locust control implementation areas for NATESC. They can help prevent the omission of potential locust occurrence areas, and help control the use of pesticides to achieve green and sustainable agriculture.

Author Contributions

Conceptualization, Y.G. and W.H.; methodology, Y.G., Y.D. and L.Z.; software, L.Z. and N.X.; validation, Y.R. and Y.H.; investigation, A.G. and J.W.; writing—original draft preparation, Y.G.; writing—review and editing, Y.G., H.M. and R.S.; funding acquisition, Y.D., W.H. and L.Z. All authors have read and agreed to the published version of the manuscript.

Funding

This research was funded by the National Key R&D Program of China(2017YFE0122400), Beijing Nova Program of Science and Technology(Z191100001119089), National Natural Science Foundation of China (42071320, 42171323, 41801338), and External Cooperation Program of the Chinese Academy of Sciences (183611KYSB20200080).

Data Availability Statement

The data are not publicly available because the data need to be used in many future works.

Conflicts of Interest

The authors declare no conflict of interest.

References

  1. Li, G.; Wang, N.; Li, Z.L. Study on Social Influence, Environmental Significance and Ecological Explanation of the Dynamics of Locust Plagues in China During the Historical Period. Prog. Geogr. 2010, 29, 1375–1384. [Google Scholar] [CrossRef]
  2. Zheng, X.M. Monitoring Oriental Migratory Locust Damage Based on Multi-Platform Remote Sensing Techniques. Master’s Thesis, Zhejiang University, Hangzhou, China, 2019. (In Chinese). [Google Scholar]
  3. Feng, X.D. Analysis on occurrence characteristics and causes of Oriental migratory locust in China of recent years. Plant Prot. Cscd. 2007, 10, 34–35. (In Chinese) [Google Scholar]
  4. Zhu, E.L. Occurrence and Management of Oriental Migratory Locust in China; China Agricultural Press: Beijing, China, 1999. (In Chinese) [Google Scholar]
  5. Stige, L.C.; Chan, K.S.; Zhang, Z.; Frank, D.; Stenseth, N.C. Thousand-year-long Chinese time series reveals climatic forcing of decadal locust dynamics. Proc. Natl. Acad. Sci. USA 2007, 104, 16188–16193. [Google Scholar] [CrossRef] [PubMed] [Green Version]
  6. Calvão, T.; Pessoa, M. Remote sensing in food production—A review. Emir. J. Food Agric. 2015, 27, 138–151. [Google Scholar] [CrossRef] [Green Version]
  7. Shi, Y.; Huang, W.; Dong, Y.; Peng, D.; Zheng, Q.; Yang, P. The influence of landscape’s dynamics on the Oriental Migratory Locust habitat change based on the time-series satellite data. J. Environ. Manag. 2018, 218, 280–290. [Google Scholar] [CrossRef]
  8. Zhao, L.; Huang, W.; Chen, J.; Dong, Y.; Ren, B.; Geng, Y. Land use/cover changes in the Oriental migratory locust area of China: Implications for ecological control and monitoring of locust area. Agric. Ecosyst. Environ. 2020, 303, 107110. [Google Scholar] [CrossRef]
  9. Low, F.; Waldner, F.; Latchininsky, A.; Biradar, C.; Bolkart, M.; Colditz, R.R. Timely monitoring of Asian Migratory locust habitats in the Amudarya delta, Uzbekistan using time series of satellite remote sensing vegetation index. J. Environ. Manag. 2016, 183, 562–575. [Google Scholar] [CrossRef]
  10. Deveson, E.D. Satellite normalized difference vegetation index data used in managing Australian plague locusts. J. Appl. Remote Sens. 2013, 7, 075096. [Google Scholar] [CrossRef] [Green Version]
  11. Ma, J.; Han, X.; Hasibagan; Wang, C.; Zhang, Y.; Tang, J.; Xie, Z.; Deveson, T. Monitoring East Asian migratory locust plagues using remote sensing data and field investigations. Int. J. Remote Sens. 2007, 26, 629–634. [Google Scholar] [CrossRef]
  12. Latchininsky, A.V.; Sivanpillai, R. Locust Habitat Monitoring and Risk Assessment Using Remote Sensing and GIS Technologies; Springer: Dordrecht, The Netherlands, 2010; pp. 163–188. [Google Scholar] [CrossRef]
  13. Ji, R.; Xie, B.Y.; Li, D.M.; Li, Z.; Zeng, X.C. Relationships between spatial pattern of Locusta migratoria manilensis eggpods and soil property variability in coastal areas. Soil Biol. Biochem. 2007, 39, 1865–1869. [Google Scholar] [CrossRef]
  14. Gómez, D.; Salvador, P.; Sanz, J.; Casanova, J.L. Modelling desert locust presences using 32-year soil moisture data on a large-scale. Ecol. Indic. 2020, 117, 106655. [Google Scholar] [CrossRef]
  15. Tian, H.D.; Ji, R.; Xie, B.Y.; Li, X.H.; Li, D.M. Using multi–temporal Landsat ETM+ data to monitor the plague of oriental migratory locust. Int. J. Remote Sens. 2008, 29, 1685–1692. [Google Scholar] [CrossRef]
  16. Liu, Z.; Shi, X.; Warner, E.; Ge, Y.; Yu, D.; Ni, S.; Wang, H. Relationship between oriental migratory locust plague and soil moisture extracted from MODIS data. Int. J. Appl. Earth Obs. Geoinf. 2008, 10, 84–91. [Google Scholar] [CrossRef]
  17. Song, P.; Zheng, X.; Li, Y.; Zhang, K.; Huang, J.; Li, H.; Zhang, H.; Liu, L.; Wei, C.; Mansaray, L.R.; et al. Estimating reed loss caused by Locusta migratoria manilensis using UAV-based hyperspectral data. Sci Total Environ. 2020, 719, 137519. [Google Scholar] [CrossRef]
  18. Latchininsky, A.; Sword, G.; Sergeev, M.; Cigliano, M.M.; Lecoq, M. Locusts and Grasshoppers: Behavior, Ecology, and Biogeography. Psyche A J. Entomol. 2011, 2011, 1–4. [Google Scholar] [CrossRef] [Green Version]
  19. Scanlan, J.; Grant, W.; Hunter, D.M.; Milner, R. Habitat and environmental factors influencing the control of migratory locusts Locusta migratoria with a biopesticide Metarhizium anisopliae. Ecol. Model. Ecol. Model 2001, 136, 223–236. [Google Scholar] [CrossRef]
  20. Zhang, Z.; Li, D. A possible relationship between outbreaks of the oriental migratory locust (Locusta migratoria manilensis Meyen) in China and the El Niño episodes. Ecol. Res. 2002, 14, 267–270. [Google Scholar] [CrossRef]
  21. Word, M.L.; Hall, S.J.; Robinson, B.E.; Manneh, B.; Beye, A.; Cease, A.J. Soil-targeted interventions could alleviate locust and grasshopper pest pressure in West Africa. Sci. Total Environ. 2019, 663, 632–643. [Google Scholar] [CrossRef]
  22. Ma, J.W.; Han, X.Z. Oriental Migratory Locust Plague Remote Sensing Monitoring Mechanism and Method; The Science Press: Beijing, China, 2004. (In Chinese) [Google Scholar]
  23. Geng, Y.; Zhao, L.; Dong, Y.; Huang, W.; Shi, Y.; Ren, Y.; Ren, B. Migratory Locust Habitat Analysis With PB-AHP Model Using Time-Series Satellite Images. IEEE Access 2020, 8, 166813–166823. [Google Scholar] [CrossRef]
  24. Scott, J.M.; Heglund, P.; Morrison, M.L.; Wall, W.A.; Haufler, J. Predicting Species Occurrences: Issues of Accuracy and Scale; Island Press: Washington, DC, USA, 2002. [Google Scholar]
  25. Girvetz, E.H.; Greco, S.E. Multi-scale predictive habitat suitability modeling based on hierarchically delineated patches: An example for yellow-billed cuckoos nesting in riparian forests, California, USA. Landsc. Ecol. 2009, 24, 1315–1329. [Google Scholar] [CrossRef]
  26. Girvetz, E.H.; Greco, S.E. How to define a patch: A spatial model for hierarchically delineating organism-specific habitat patches. Landsc. Ecol. 2007, 22, 1131–1142. [Google Scholar] [CrossRef]
  27. Kebede, Y.; Bianchi, F.; Baudron, F.; Abraham, K.; de Valenca, A.; Tittonell, P. Implications of changes in land cover and landscape structure for the biocontrol potential of stemborers in Ethiopia. Biol. Control 2018, 122. [Google Scholar] [CrossRef]
  28. Wu, J. Landscape Ecology: Pattern, Process, Scale and Hierarchy; Higher Education Press: Beijing, China, 2007; p. 266. (In Chinese) [Google Scholar]
  29. Tu, X.; Li, Z.; Wang, J.; Huang, X.; Yang, J.; Fan, C.; Wu, H.; Wang, Q.; Zhang, Z. Improving the Degree-Day Model for Forecasting Locusta migratoria manilensis (Meyen) (Orthoptera: Acridoidea). PLoS ONE 2014, 9, e89523. [Google Scholar] [CrossRef]
  30. Healy, K.B.; Dugas, E.; Fonseca, D.M. Development of a Degree-Day Model to Predict Egg Hatch of Aedes albopictus. J. Am. Mosq. Control Assoc. 2019, 35, 249–257. [Google Scholar] [CrossRef] [Green Version]
  31. Fei, J.; Zhou, J. The drought and locust plague of 942–944 AD in the Yellow River Basin, China. Quat. Int. 2016, 394, 115–122. [Google Scholar] [CrossRef]
  32. Salih, A.A.M.; Baraibar, M.; Mwangi, K.K.; Artan, G. Climate change and locust outbreak in East Africa. Nat. Clim. Chang. 2020, 10, 584–585. [Google Scholar] [CrossRef]
  33. Tratalos, J.A.; Cheke, R.A. Corrigendum to “Can NDVI GAC imagery be used to monitor desert locust breeding areas?”. J. Arid Environ. 2006, 65, 512. [Google Scholar] [CrossRef]
  34. Gong, P.; Liu, H.; Zhang, M.; Li, C.; Wang, J.; Huang, H.; Clinton, N.; Ji, L.; Li, W.; Bai, Y. Stable classification with limited sample: Transferring a 30-m resolution sample set collected in 2015 to mapping 10-m resolution global land cover in 2017. Sci. Bull. 2019, 64, 370–373. [Google Scholar] [CrossRef] [Green Version]
  35. Cushman, S.A.; Macdonald, E.A.; Landguth, E.L.; Malhi, Y.; Macdonald, D.W. Multiple-scale prediction of forest loss risk across Borneo. Landsc. Ecol. 2017, 32, 1581–1598. [Google Scholar] [CrossRef] [Green Version]
  36. Sivanpillai, R.; Latchininsky, A.V. Can late summer Landsat data be used for locating Asian migratory locust, Locustamigratoriamigratoria, oviposition sites in the Amudarya River delta, Uzbekistan? Entomol. Exp. Et Appl. 2008, 128, 346–353. [Google Scholar] [CrossRef]
  37. Guo, F.; Chen, Y.L.; Lu, B.L. The Biology of the Migratory Locusts in China; Shandong Science and Technology Press: Jinan, China, 1991. (In Chinese) [Google Scholar]
  38. Wu, D.; Wu, H.; Zhao, X.; Zhou, T.; Tang, B.; Zhao, W.; Jia, K. Evaluation of Spatiotemporal Variations of Global Fractional Vegetation Cover Based on GIMMS NDVI Data from 1982 to 2011. Remote Sens. 2014, 6, 4217–4239. [Google Scholar] [CrossRef] [Green Version]
  39. Ermida, S.L.; Soares, P.; Mantas, V.; Göttsche, F.-M.; Trigo, I.F. Google Earth Engine Open-Source Code for Land Surface Temperature Estimation from the Landsat Series. Remote Sens. 2020, 12, 1471. [Google Scholar] [CrossRef]
  40. Douaoui, A.E.K.; Nicolas, H.; Walter, C. Detecting salinity hazards within a semiarid context by means of combining soil and remote-sensing data. Geoderma 2006, 134, 217–230. [Google Scholar] [CrossRef]
  41. Nguyen, K.-A.; Liou, Y.-A.; Tran, H.-P.; Hoang, P.-P.; Nguyen, T.-H. Soil salinity assessment by using near-infrared channel and Vegetation Soil Salinity Index derived from Landsat 8 OLI data: A case study in the Tra Vinh Province, Mekong Delta, Vietnam. Prog. Earth Planet. Sci. 2020, 7, 1. [Google Scholar] [CrossRef] [Green Version]
  42. Ismayilov, A.I.; Mamedov, A.I.; Fujimaki, H.; Tsunekawa, A.; Levy, G.J. Soil Salinity Type Effects on the Relationship between the Electrical Conductivity and Salt Content for 1:5 Soil-to-Water Extract. Sustainability 2021, 13, 3395. [Google Scholar] [CrossRef]
  43. Zhang, M.; Gong, P.; Qi, S.; Liu, C.; Xiong, T. Mapping bamboo with regional phenological characteristics derived from dense Landsat time series using Google Earth Engine. Int. J. Remote Sens. 2019, 40, 9541–9555. [Google Scholar] [CrossRef]
  44. Wang, J.; Xiao, X.; Qin, Y.; Dong, J.; Geissler, G.; Zhang, G.; Cejda, N.; Alikhani, B.; Doughty, R.B. Mapping the dynamics of eastern redcedar encroachment into grasslands during 1984–2010 through PALSAR and time series Landsat images. Remote Sens. Environ. 2017, 190, 233–246. [Google Scholar] [CrossRef] [Green Version]
  45. Chen, B.; Xiao, X.; Li, X.; Pan, L.; Doughty, R.; Ma, J.; Dong, J.; Qin, Y.; Zhao, B.; Wu, Z.; et al. A mangrove forest map of China in 2015: Analysis of time series Landsat 7/8 and Sentinel-1A imagery in Google Earth Engine cloud computing platform. ISPRS J. Photogramm. Remote Sens. 2017, 131, 104–120. [Google Scholar] [CrossRef]
  46. Zhu, Z.; Woodcock, C. Object-based cloud and cloud shadow detection in Landsat imagery. Remote Sens. Environ. 2012, 118, 83–94. [Google Scholar] [CrossRef]
  47. Huete, A.; Didan, K.; Miura, T.; Rodriguz, E.P.; Gao, X.; Ferreira, L.G. Overview of the radiometric and biophysical performance of the MODIS vegetation indices. Remote Sens. Environ. 2002, 83, 195–213. [Google Scholar] [CrossRef]
  48. Xu, H. A study on information extraction of water body with the modified normalized difference water index (MNDWI). J. Remote Sens. 2005, 9, 589–595. [Google Scholar]
  49. Du, Z.; Linghu, B.; Ling, F.; Li, W.; Tian, W.; Wang, H.; Gui, Y.; Sun, B.; Zhang, X. Estimating Surface Water Area Changes Using Time-Series Landsat Data in the Qingjiang River Basin, China. J. Appl. Remote Sens. 2012, 6, 3609. [Google Scholar] [CrossRef]
  50. Baatz, M.; Schäpe, A. An Optimization Approach for High Quality Multi-Scale Image Segmentation. In Angewandte Geographische Informationsverarbeitung XII; Strobl, J., Blaschke, T., Griesebner, G., Eds.; Wichmann-Verlag: Heidelberg, Germany, 2000; pp. 12–23. [Google Scholar]
  51. Rezaee, M.R.; Van der Zwet, P.M.; Lelieveldt, B.P.E.; Van der Geest, R.J.; Reiber, J.H. A multiresolution image segmentation technique based on pyramidal segmentation and fuzzy clustering. IEEE Trans. Image Processing 2000, 9, 1238–1248. [Google Scholar] [CrossRef]
  52. Wang, J.Z.; Jia, L.; Gray, R.M.; Wiederhold, G. Unsupervised multiresolution segmentation for images with low depth of field. IEEE Trans. Pattern Anal. Mach. Intell. 2001, 23, 85–90. [Google Scholar] [CrossRef]
  53. Wu, J. Effects of changing scale on landscape pattern analysis: Scaling relations. Landsc. Ecol. 2004, 19, 125–138. [Google Scholar] [CrossRef]
  54. Wu, J.; Li, H. Perspectives and methods of scaling. In Scaling and Uncertainty Analysis in Ecology; Wu, J., Jones, K.B., Li, H., Loucks, O.L., Eds.; Springer: Dordrecht, The Netherlands, 2006; pp. 17–44. [Google Scholar]
  55. Ren, C. Outbreak of Oriental migratory locust Locusta migratoria manilensis (Meyen) in Baiyandian Lake. Kun Chong Zhi Shi 2001, 38, 128–130. [Google Scholar]
  56. Qiu, Z.Y. Study on Oriental Migratory Locust Habitat Assessing Information System. Master’s Thesis, Nanjing Normal University, Nanjing, China, 2006. (In Chinese). [Google Scholar]
  57. Zhang, C.L. Retrieval of Land Surface Temperature Using Remotely Sensed Data and Its Application in Monitoring Oriental Migratory Locust. Master’s Thesis, Nanjing Normal University, Nanjing, China, 2006. (In Chinese). [Google Scholar]
  58. Basu, T.; Pal, S. A GIS-based factor clustering and landslide susceptibility analysis using AHP for Gish River Basin, India. Environ. Dev. Sustain. 2019, 22, 4787–4819. [Google Scholar] [CrossRef]
  59. Bajec, P.; Tuljak-Suban, D. An Integrated Analytic Hierarchy Process—Slack Based Measure-Data Envelopment Analysis Model for Evaluating the Efficiency of Logistics Service Providers Considering Undesirable Performance Criteria. Sustainability 2019, 11, 2330. [Google Scholar] [CrossRef] [Green Version]
  60. Yu, G.; Shen, H.; Liu, J. Impacts of climate change on historical locust outbreaks in China. J. Geophys. Res. 2009, 114. [Google Scholar] [CrossRef] [Green Version]
  61. Shi, R.; Liu, C.; Li, D.; Xie, B. Distribution of Locusta migatoria manilensis and soil in the locust plague are at Baiyangdian. Kun Chong Zhi Shi 2004, 41, 29–33. [Google Scholar]
  62. Propastin, P. Satellite-based monitoring system for assessment of vegetation vulnerability to locust hazard in the River Ili delta (Lake Balkhash, Kazakhstan). J. Appl. Remote Sens. 2013, 7, 075094. [Google Scholar] [CrossRef] [Green Version]
  63. Trebitz, A.S.; Brazner, J.C.; Tanner, D.K.; Meyer, R. Interacting watershed size and landcover influences on habitat and biota of Lake Superior coastal wetlands. Aquat. Ecosyst. Health Manag. 2011, 14, 443–455. [Google Scholar] [CrossRef]
  64. Matinfar, H.R.; Alavi Panah, S.K.; Zand, F.; Khodaei, K. Detection of soil salinity changes and mapping land cover types based upon remotely sensed data. Arab. J. Geosci. 2013, 6, 913–919. [Google Scholar] [CrossRef]
  65. Wang, J.R.; Lv, G.Q. The occurrence and control history of Oriental migratory locust and sustainable control measures in Henan Province. Mod. Agric. Sci. Technol. 2019, 2, 2. (In Chinese) [Google Scholar]
  66. Guo, H.P.; Feng, X.J.; Wei, J.F.; Liang, C.L.; Wei, H.X.; Shi, J.N. The occurrence and distribution status of locusts and ecological management countermeasures in Shaanxi Province. Shaanxi J. Agric. Sci. 2014, 60, 3. (In Chinese) [Google Scholar]
  67. Xia, H.; Liu, L.; Bai, J.; Kong, W.; Guo, F. Wetland Ecosystem Service Dynamics in the Yellow River Estuary under Natural and Anthropogenic Stress in the Past 35 Years. Wetlands 2020, 40, 2741–2754. [Google Scholar] [CrossRef]
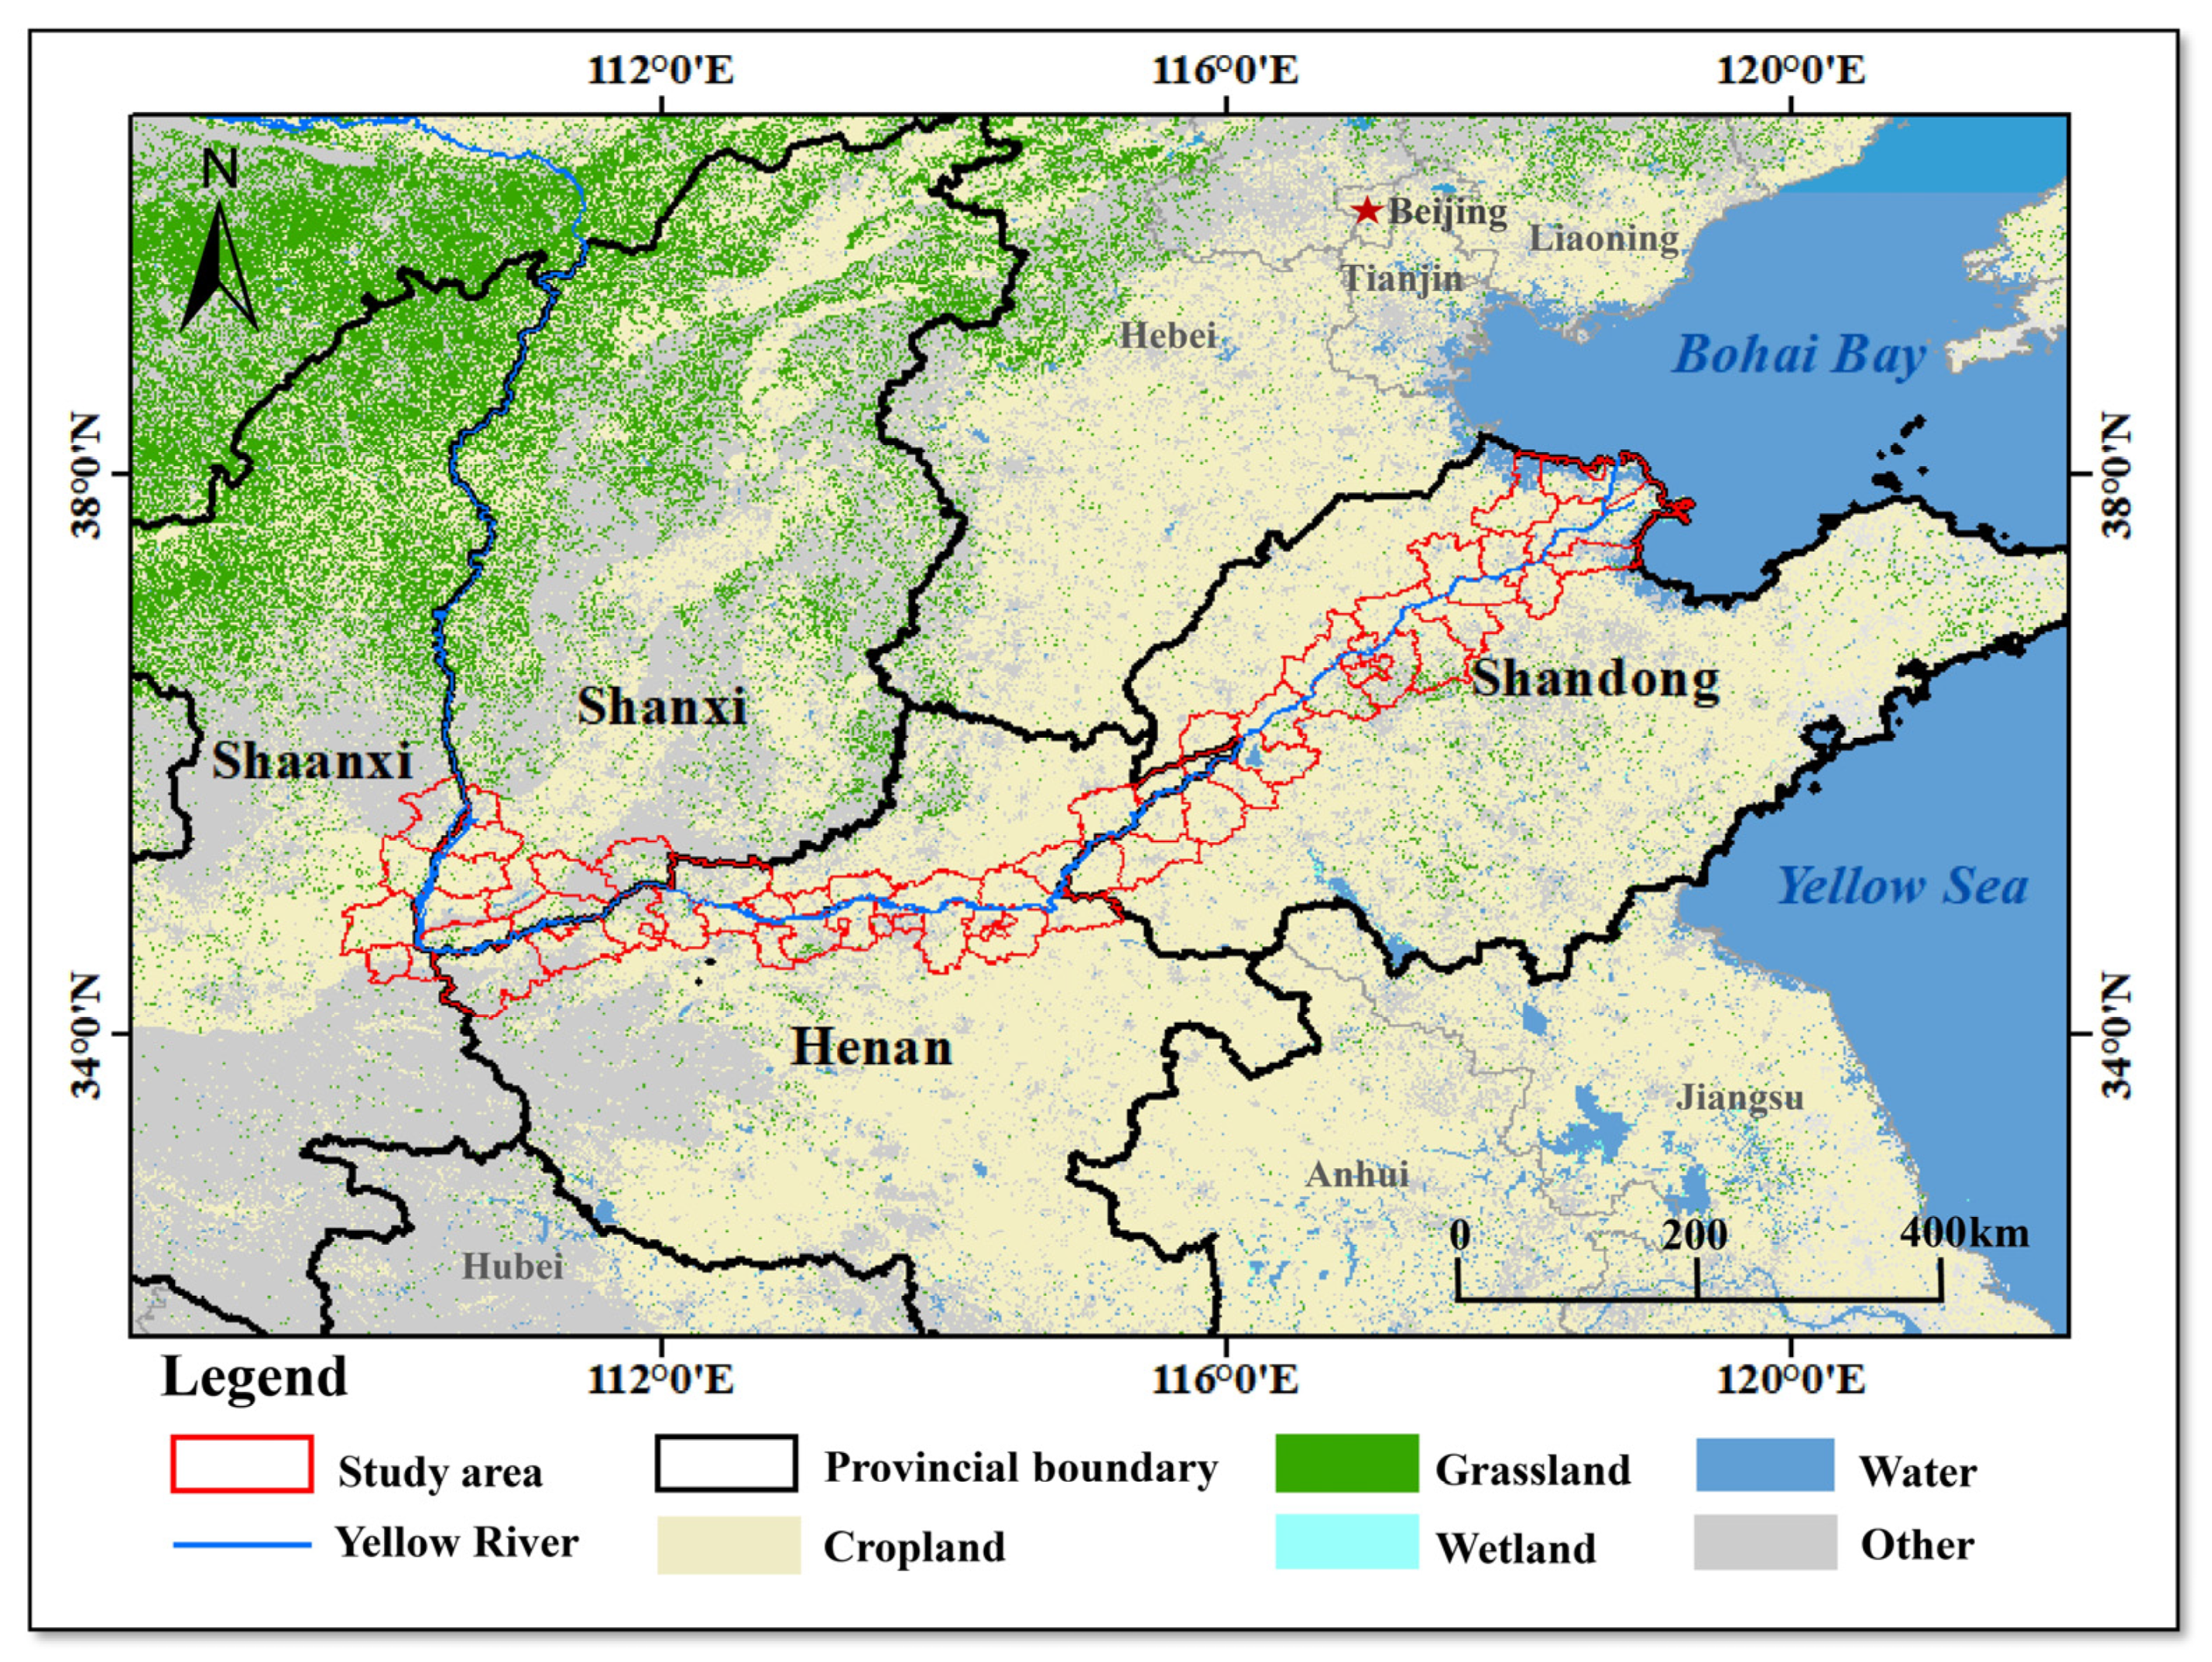
Figure 1. The middle and lower reaches of the Yellow River of this study.
Remotesensing 14 01058 g001
Figure 2. Flowchart of this study.
Remotesensing 14 01058 g002
Figure 3. Landscape-based habitat suitability(LHS) model.
Remotesensing 14 01058 g003
Figure 4. DD calculations for locusts generations in the four provinces (ae) from 2016 to 2020.
Remotesensing 14 01058 g004aRemotesensing 14 01058 g004b
Figure 5. VC, LST, SM, SS, and LCC distributions in 2020.
Remotesensing 14 01058 g005
Figure 6. Distribution of locust areas along the MLYR from 2016 to 2020 based on the LHS model (left) and PB-AHP model (right).
Remotesensing 14 01058 g006
Figure 7. Correlation analysis between the average area of locust area extraction and locust occurrence area in 2016–2020 using the (a) LHS model and (b) PB-AHP model.
Remotesensing 14 01058 g007
Figure 8. Comparison of locust area extraction results using the LHS model and PB-AHP model (taking 2020 as an example): (a) the difference mainly existed in wetlands; (b) the difference mainly existed in the adjacent areas of the two land cover classes.
Remotesensing 14 01058 g008
Figure 9. The changes of LCC corresponding to the increase (a) and decrease (b) of locust area from 2016 to 2020.
Remotesensing 14 01058 g009
Table 1. Habitat factors obtaining.
FactorsObtaining MethodData SourceReference
Vegetation coverage (VC) N D V I N D V I s o i l / N D V I v e g N D V I s o i l Landsat-OLI[38]
Land surface temperature (LST)Statistical mono window (SMW) algorithm[39]
Soil salinity (SS) G × R [40,41,42]
Land cover class (LCC)Phenology-based random forest model[43]
Soil moisture (SM)-SMAP-
NDVI is the normalized differential vegetation index, N D V I s o i l the NDVI value of pure bare soil pixel, and   N D V I v e g is the NDVI value of pure vegetation pixel. G is the green band, R is the red band.
Table 2. Suitability membership of each habitat factor.
Suitability (M)1 (Poor)2 (General)3 (Good)4 (Optimal)
Factor (V)
VC<20%>75%>50% and ≤75%≥20% and ≤50%
LCCothercroplandgrasslandwater, wetland
SM-<10% or >25%>19% and ≤25%≥10% and ≤19%
SS>0.80%>0.50% and ≤0.80%>0.20% and ≤0.50%≤0.20%
LST<20°C≥20 °C and <25 °C or >40 °C and ≤42 °C>34 °C and ≤40 °C or
≥25°C and <28 °C
≥28 °C and ≤34 °C
Table 3. Confusion matrix of the land cover classification in 2017.
CroplandForestGrasslandShrubWetlandWaterImpervious LayerBare LandUAOAKappa
Cropland1012101120910.740.730.73
Forest314601500000.89
Grassland709823131250.66
Shrub1452011200100.74
Wetland103080351860.56
Water000011146310.91
Impervious layer1701510111060.73
Bare land2080161811850.61
PA0.700.950.640.690.730.720.670.82
Table 4. LCC changes corresponding to the increases/decreases of locust areas.
FactorsInitial ImportanceFinal Weights
VC0.280.13
LCC0.870.41
SM0.470.22
SS0.130.06
LST0.390.18
Table 5. LCC changes corresponding to the increases/decreases of locust areas.
Locust Area Evolution20162020Area/Thousand hm2Total Area/Thousand hm2
IncreaseCroplandWetland37.5974.39
WaterWetland24.59
CroplandGrassland12.21
DecreaseGrasslandShrub39.9292.29
CroplandShrub26.01
CroplandImpervious layer13.47
WetlandWater12.89
Table 6. Driving factors of locust area evolution during 2016–2020.
Locust Area EvolutionFactorsLCC ChangeSpecific Reasons for Evolution
IncreaseNatural factorsWater–wetlandThe decrease in rainfall in the Yellow River basin from 2016 to 2020 and the flow of the Yellow River.
Human factorsWater–wetlandThe continuous cultivation of forests and swamps caused the weakening of the Yellow River’s capacity to store water and the decrease in the flow of the Yellow River.
Cropland–wetlandPolicies and measures for ecological restoration of the Yellow River wetlands implemented in recent years.
Cropland–grasslandThe relocation of residents along the MLYR resulted in the abandonment of cropland and the formation of new wasteland.
DecreaseNatural factorsWetland–waterThe flow of the Yellow River.
Human factorsGrassland–shrubThe changes of gramineous plants that locusts prefer to eat into planting peanuts, asparagus, and other plants that locusts do not like.
Cropland–shrub
Cropland–impervious layerThe continuous increase in urbanization.
Publisher’s Note: MDPI stays neutral with regard to jurisdictional claims in published maps and institutional affiliations.