Abstract
Focusing on the global integrity monitoring performance of the BDS-3, the integrity failure model and effect analysis (IFMEA) of the system space segment and the ground control segment were carried out, and the system integrity risk tree model was established according to the IFMEA results. To evaluate the system’s integrity risk probability more reasonably, this paper establishes an abnormal event prediction model with a Bayesian method, based on actual operation data, under a situation in which the BDS-3 just opened service. With statistical analysis results of system anomalies since 27 December 2018—which is the date the BDS-3 began providing basic service—according to the anomaly prediction model, the system’s integrity risk probability under the 95% confidence limit was calculated to be approximately 0.9e-7/h, meeting the design index requirements of 1e-7/h. The analysis results also show that the main risk factors affecting the integrity of BDS-3 are ‘pseudorange measurement anomaly’ and ‘miss-detection of satellite autonomous integrity monitoring’. The results are important references with practical engineering significance for improving the integrity performance of BDS-3.
1. Introduction
Accuracy, integrity, continuity and availability are the four main indicators of global navigation satellite system (GNSS) service performance [1,2,3,4]. Among them, integrity refers to the ability of the GNSS to provide timely alerts to users when GNSS fails or errors exceed the allowable tolerance and is not qualified for the specified navigation task, which is a critically important indicator for measuring GNSS reliability [5]. With the improvement in GNSS accuracy, many high real-time users, such as civil aviation users, have already proposed clear requirements for GNSS integrity. In GNSS upgrade plans, such as GPS III in the United States, Galileo in the European Union and the BeiDou in China, improving system integrity is one of the most concerning topics [6,7,8,9,10].
Integrity can be divided into user-side integrity and system-side integrity from an object-oriented perspective. User-side integrity is based on position accuracy, which is related to user usage scenarios and continuity judgment thresholds. Usually, different scenarios have different requirements, and it is difficult to exclude the user receiver performance influence. System-side integrity is built based on signal-in-space, which can exclude uncertainty factors such as user scenarios and receiver performance and is usually used to characterize GNSS integrity performance. The integrity studied in this paper is only the system-side integrity.
The GNSS integrity performance is usually reflected by the integrity risk probability, alarm time and alarm limit. Integrity risk probability refers to the integrity risk event probability that the instantaneous Signal-In-Space Ranging Error (SISRE) exceeds the alarm limit without sending effective alarm information within the alarm time caused by a spatial signal-in-space fault. Alarm time refers to the time from the emergence of dangerous misleading information to the arrival of warning information to the user receiver antenna. The alarm limit refers to the judgment threshold for users to assess whether the system is usable. This is related to the application field, and the alarm limits in different application fields are different.
The GNSS signal-in-space alarm limit is usually related to the system integrity parameters. According to the system’s commitment integrity risk probability, the GNSS signal-in-space alarm limit is usually set to the multiple SISRE, with a certain confidence level. For example, the GPS signal-in-space alarm limit is 4.42-times the URA, which is the integrity guarantee value.
At present, different GNSSs adopt different integrity parameter designs, such as GPS User Ranging Accuracy (URA) parameters, Galileo Signal In-Space Accuracy (SISA) and IF parameters, and the new BDS generation system SISA, Signal In-Space Monitor Accuracy (SISMA) and Availability Integrity Flag (AIF)/Data Integrity Flag (DIF)/Signal Integrity Flag (SIF) parameters [11,12,13]. A detailed description of BDS integrity parameters was given by [9].
The BDS satellite navigation system is composed of a Geostationary Earth Orbit (GEO), Inclined GeoSynchronous Orbit (IGSO) and Medium Earth Orbit (MEO) hybrid constellation. The arc coverage of the BDS regional monitoring network for mobile satellites, especially MEO satellites, is very small. With the development strategy of the BDS satellite navigation system from the regional system (BDS-2) to global system (BDS-3), enhancing the integrity of BDS for users around the world is one of the most important aims of the system. To meet the requirements of integrity monitoring, BDS-3 adopts a complex monitoring mode combining ground integrity monitoring and satellite autonomous integrity monitoring. At the same time, to establish the fault tree model and analyze the system, abnormal characteristics are significant in improving the integrity performance of BDS-3.
To reduce the system’s service risk, it is necessary to conduct a statistical analysis of all kinds of faults that occurred since the operation and service of the system, evaluate the service performance of the system’s integrity, and provide effective suggestions for identifying weak links, reducing system failure factors, and improving the service capability of the system integrity. The Integrity Failure Modes and Effects Analysis (IFMEA) method evaluate the possible faults in the process by examining the causes and effects of faults, which can take effective measures before faults occur and is an effective method for improving system integrity [14]. Karen Van Dyke et al. used the IFMEA method to count and sort out GPS faults, which not only improved GPS reliability but also provided suggestions for future GPS construction. It can also assist civil and military users in better understanding GPS integrity faults and the impact of various operations [15,16]. In 2019, Phillip Brieden and other scholars obtained the SISRE system characteristics and fault probability based on IFMEA and provided support for SBAS DFMC and H-ARAIM life safety services through the pseudorange drift and SISRE monitoring, using Galileo’s relevant data for approximately 3.5 years [17]. Cao et al. demonstrated the integrity monitoring design of BDS-3 and preliminarily analyzed the ability of BDS-3 system integrity monitoring mechanism [18,19,20]. At present, there is still a lack of research on integrity risk modeling and result evaluation of BDS-3, both at home and abroad.
In this paper, the IFMEA of BDS-3 is carried out, the abnormal factors and influence of BDS-3 are analyzed, and the statistical table of abnormal BDS-3 characteristics is designed and proposed. Based on the IFMEA results, the abnormal factors in the space section and the ground control section of the BDS-3 system are sorted, and the system integrity risk tree model is established. The historical occurrence times of abnormal events in each bottom event of the risk tree during the system’s operation are counted, and the occurrence times of each bottom event are reasonably predicted according to the 95% confidence level based on the Bayesian estimation theory. According to the risk tree analysis, the risk probability of BDS-3 integrity was obtained. The research results were included in the key updated content of the International Civil Aviation Organization (ICAO) Standard Additionally, Recommendation Practice (SARPs) and can lay a solid foundation for BDS-3 integrity improvement.
2. BDS-3 Integrity Monitoring Architecture
2.1. Integrity Concepts and Indicators
Due to the high requirements for the safety and reliability of position information services, the concept of integrity first appeared in the civil aviation field. To be applied in the civil aviation field, GNSS around the world needs to carry out and complete the research and formulation of relevant standards under the framework of ICAO and promise to meet the service performance indicators required by the corresponding standards.
For a more detailed and accurate analysis, the integrity risk probability is further divided into “Psat, which is the single-satellite integrity risk probability” and “Pconst, which is the constellation integrity risk probability”.
Psat refers to the probability that the SISRE of any single satellite exceeds the alarm limit and that the system fails to issue warning information within the promised alarm time. Pconst refers to the probability that the SISRE of more than two satellites exceeds the alarm limit, and the system fails to issue warning information within the promised alarm time. Anomalies that result in a single-satellite integrity risk usually affect only the satellite with no effect on the service performance of other satellites and systems. Abnormalities that lead to constellation integrity risks generally affect system service performance.
At present, the Big 4 GNSSs around the world are attempting to develop and formulate their own integrity-related technical indicators. From ICAO SARPs, the Big 4 GNSS integrity indicators are shown in Table 1.

Table 1.
GNSS integrity indicators in ICAO SARPs.
Table 1 shows that the Big 4 GNSS integrity indicators are quite different. GPS has global ground monitoring and injection abilities, so once the service is abnormal, the system can send alarms in real time. Specifically, there are many GPS warning methods, such as using health status identification in navigation messages and setting the satellite Pseudorandom Number (PRN) code to “No. 37” and broadcasting nonstandard PRN code. GLONASS passes the system’s running status to users through health status identification in navigation messages. Galileo provides users with integrity information through HS, DVS, SISA and other parameters in navigation messages. BDS-3 adopts two methods, namely, ground integrity monitoring, which is similar to other GNSS, and Satellite Autonomous Integrity Monitoring (SAIM), which is the first applied to the actual GNSS, effectively making up for the deficiency that the ground monitoring network can only achieve satellite coverage in China due to geopolitical influence. With the application of SAIM, BDS-3 updates the promised integrity alarm time from 300 s to 10 s in the upcoming ICAO SARPs to better meet the application requirements of the ICAO ARAIM. BDS-3 provides users the system’s alarm information with AIF, DIF and SIF parameters in navigation messages. If the status of the signal is healthy, these parameters are assigned values of “0”; otherwise, the parameters are assigned values of “1”.
2.2. BDS-3 Integrity Monitoring Method
The BDS-3 integrity monitoring method includes SAIM and ground integrity monitoring. Among them, SAIM can monitor the satellite clock performance deterioration and the signal anomaly at the satellite in orbit. Ground integrity monitoring can comprehensively monitor the prediction accuracy level, spatial signal error level, system integrity status, message integrity status and signal integrity status of the broadcast ephemeris with observation data from the monitoring network on the ground and the intersatellite link on the orbit. The BDS-3 integrity monitoring process is shown in Figure 1. This section provides a basis for the following integrity risk tree modeling, according to the BDS-3 integrity monitoring process.
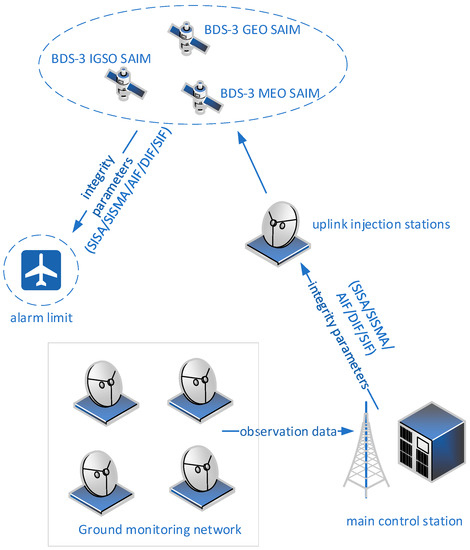
Figure 1.
BDS-3 integrity monitoring process.
2.2.1. Ground Integrity Monitoring
The ground integrity monitoring system consists of one main control station, some ground monitoring stations and uplink injection stations. Multiple ground monitoring stations form a ground monitoring network through transmission links. The ground monitoring network transmits the observation data sampled in one second to the main control station in real time. First, the main control station performs data cleaning, including gross error identification and elimination, pseudorange data phase smoothing, system error calculation and correction. Then, the satellite orbit calculation, satellite clock error calculation, ephemeris fitting parameter calculation, orbit and time synchronization processing are carried out by using the “clean” data. This work can realize SISRE monitoring, which can identify the satellite ephemeris and clock error or ionospheric anomalies. The SISREs of different satellites can be expressed in the form of grade values (SISMAIs). Users can weigh different satellites according to their service requirements. However, SISRE monitoring is limited by regional monitoring networks, which can monitor satellites with fourfold coverage in the service area.
SISMAI is updated and broadcast every 30 s. To compensate for the lack of real-time alarm ability, AIF is used. If SISMAI indicates the SISRE correctly, the corresponding AIF parameter is assigned a value of “0”, otherwise, AIF is assigned a value of “1” to send an alarm to the users.
SISREs, or message anomalies greater than the alarm limit, can be monitored in real time. If the anomaly is monitored, DIF can be switched from “0” to “1” to give a warning information and injected into satellites within 1 s. Then, the integrity monitoring information is arranged to the navigation message according to the navigation message broadcast period and broadcast by each satellite. The integrity messages broadcast period is 18 s and 3 s for B1C and B2a signal, respectively.
2.2.2. Satellite Autonomous Integrity Monitoring
The BDS-3 GEO/IGSO/MEO satellites all have the SAIM function. BD3-3 SAIM could transmit an alarm message through SIF parameter to users or change the signal modulation mode such that it is immediately unusable once a failure is detected in the satellite. There two independent onboard SAIM receivers and the measurements from different receivers are cross verified to monitor the possible failure modes such as the pseudorange step, carrier phase step, abnormal signal power, code/carrier divergence, distortion of pseudorandom code correlation peaks, the possible satellite clock phase jump and frequency jump. The detail monitoring methods for BDS-3 SAIM are described in [10].
BDS-3 satellites have multifrequency signals, as among them the new generation signals such as B1C and B2a signals are monitored by SAIM. If a certain frequency abnormal signal is detected by SAIM, the SIF parameter corresponding to the frequency signal is updated from 0 to 1. SAIM can provide high real-time integrity monitoring without considering the complex observation environment on the ground. Considering that the broadcast periods of different frequency signals are different, to achieve the shortest alarm time and meet the requirement of 10 s, BDS-3 is clear in ICAO SARPs that the SIF parameters broadcasted by B2a signal have the priority for B1C and B2a dual-frequency users, since that B2a signal can broadcast both B1C and B2a signal SIF parameters and has the shortest broadcast period of 3 s.
3. BDS-3 Integrity Failure Model and Effect Analysis Algorithm
FMEA is an inductive analysis method that analyzes all possible abnormal modes, and possible impacts of products or systems, and classifies them according to the severity and occurrence probability of each abnormal mode.
3.1. IFMEA Procedure
The purpose of BDS-3 IFMEA is to identify all kinds of abnormal factors that affect the system’s integrity and analyze the abnormal characteristics. Through continuous summary and accumulation, effective information is provided for system design, upgrading and maintenance, and reducing the system’s integrity risk probability.
The BDS-3 IFMEA process is shown in Figure 2. First, it is necessary to clarify the system’s integrity index requirements. According to the system’s design requirements and expert experience, the system anomaly modes can be systematically sorted. In the system operation process, all kinds of abnormal data from the space segment and ground control segment are collected comprehensively, and abnormal events affecting system integrity are identified according to the system integrity definition. The abnormal characteristic table is designed to record the root cause of abnormalities, magnitude and characteristics of the influence on signal-in-space accuracy, abnormal response time and occurrence frequency. The new abnormal events are recorded in the abnormal mode database. If it is the first occurrence, the database is updated; otherwise, only the number of occurrences increases. An abnormal mode database can be updated routinely and needs to be maintained continuously in the long term. According to the IFMEA results, possible system improvement recommendations are provided to reduce the system’s integrity risk probability.

Figure 2.
IFMEA Process.
Additionally, the statistical results of abnormal occurrence and response time contribute to upgrading the system’s integrity index, improving the system’s operation ability and guiding the subsequent upgrade design of the system.
3.2. Anomaly Characteristic Statistical Table Design
Referring to the GPS and GLONASS operation and maintenance experience, the independent abnormal events that affected the system’s integrity since the system was put into service can be recorded by the abnormal characteristic statistical table. According to the characteristics of BDS-3, an anomaly characteristic table suitable for BDS-3 is designed in this paper (as shown in Table 2), which was applied in the actual system’s operation and maintenance.

Table 2.
Anomaly characteristic statistical table.
3.3. BDS-3 Integrity Risk Factors Analysis
There are many abnormal factors that affect GNSS integrity, which can usually be divided into hard and soft failures of space segments and ground control segments.
In the early analysis of GPS integrity risk factors, considering different conditions of different users, the following factors are proposed: signal distortion (harmful waveform), excessively low signal power, separation of code and carrier, ephemeris error, step slope or acceleration error caused by signal anomalies, and response time of the ground control section to anomalies.
Based on the analysis experience of GPS integrity risk factors, combined with the design and test results of BDS-3, the BDS-3 integrity risk factors are summarized and analyzed.
3.3.1. System Anomaly
System anomaly factors can be divided into space segment anomalies and ground control segment anomalies from the system composition perspective.
According to the BDS-3 navigation satellite composition, the space segment anomalies can be divided into satellite payload anomalies and satellite platform anomalies. According to the integrity monitoring process in Section 2.2, the payload anomalies directly related to integrity monitoring can be further decomposed into satellite clock anomalies, signal measurement anomalies and signal power anomalies.
According to the ground integrity processing flow described in Section 2.2.1, the anomalies directly related to integrity monitoring in the ground control segment include ground monitoring network data anomalies, the uplink injection station injection anomalies, and the master station information processing anomalies (including satellite orbit calculation anomalies, satellite clock calculation anomalies, ephemeris fitting parameter calculation anomalies, and orbit and time synchronization processing equipment anomalies).
3.3.2. Anomaly Monitoring Missing Alarm
Anomaly monitoring missing alarms can also be divided into missing alarms in space segments and missing alarms in ground control segments.
According to Section 2.2, the system transmits integrity information to users by broadcasting integrity parameters. Therefore, if the relevant integrity parameter information was a broadcast error, it leads to the occurrence of missing alarms. In addition, considering the integrity monitoring ability completeness, especially SAIM ability, it is still relatively limited and unable to realize the slow change accumulation monitoring of satellite clock and navigation message anomalies. Therefore, once the above anomalies occur, the SAIM cannot be monitored temporarily.
3.3.3. Integrity Risk Factor Analysis
Based on the system design and IFMEA results, abnormal events are analyzed, including the anomaly mode, the influence mode of anomalies on the SISRE, spatial correlation, and receiver detectability. The BDS-3 integrity risk factor analysis table is obtained, as shown in Table 3.

Table 3.
GNSS anomaly models and their impacts.
3.4. BDS-3 Integrity Risk Tree Modeling
3.4.1. Integrity Risk Tree
The risk tree method is a graphical model that expresses the logical relationship between a specific abnormal condition and the cause or exception that causes the condition.
According to the integrity risk factors analysis results shown in Table 3, BDS-3 integrity risk factors include factors in the space segment and ground control segment.
Based on the above analysis, a BDS-3 integrity risk tree model is constructed, as shown in Figure 3.
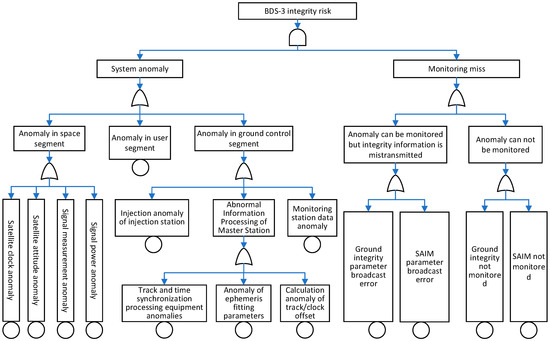
Figure 3.
Model of BDS-3 integrity risk tree.
3.4.2. Integrity Risk Probability Evaluation Method
The design value of the single-satellite integrity risk probability of the BDS-3 system is 1e-5/h, which means the simultaneous occurrence probability of an abnormal satellite event and an abnormal monitoring miss event. However, since both the system anomaly and the monitoring miss are small probability events and BDS-3 has a short service time, there are fewer historical samples for statistics. If only the ratio of the historical statistics number of small samples to the statistical time is used as the system anomaly occurrence probability or the monitoring miss, it easily leads to evaluation deviation, that is, the calculated event occurrence probability is greatly affected by the system’s state in the statistical historical period (for example, during the statistical historical period, the space segment is relatively stable, and the number of system anomalies is less, then the anomaly probability is low). Conversely, if, during the statistical historical time, the space segment is more active, the number of system anomalies is greater, and the probability of anomalies is higher.
To solve the problem of accurate and reasonable event probability estimation based on small sample historical events, this paper proposes an integrity risk probability assessment method based on the Bayesian estimation theory. The so-called integrity risk probability, as shown in Figure 3, refers to the system occurring at the same time as system anomalies and monitoring missing alarm events and can be expressed as:
where IR represents the integrity risk probability, Pfail is the system anomaly occurrence probability, and Pmd is the abnormal monitoring missing alarm rate.
The system anomaly probability can be shown as follows:
where m is the bottom event of the system abnormal branch in Figure 3, and P(m) represents the estimated probability of event m.
The monitoring miss probability can be expressed as:
where n is the bottom event of the anomaly monitoring miss branch in Figure 3, and P(n) represents the estimated probability of event n.
Therefore, the key to evaluating the system’s integrity risk probability is to objectively and reasonably estimate the risk tree bottom events occurrence probability (hereinafter referred to as abnormal events for the convenience of elaboration). The abnormal events probability can usually be counted according to the statistical number and evaluation time of the abnormal event, as follows:
In the formula, k is the number of historical occurrences of abnormal events, T is the statistical time (in hours), and MTTN indicates the Mean Time To Notify, which represents the average time used to identify abnormal events. At present, the average abnormal response time promised by BDS-3 in ICAO SARPs is 1 h.
However, due to the short service time of BDS-3 and the influence of factors such as the system’s ground state update and onboard key stand-alone equipment aging, the number of system abnormal events varies with time. If Equation (4) is directly adopted, the time-varying characteristics of abnormal event occurrence are considered, and the estimation redundancy of the number of abnormal event occurrences cannot be given. Therefore, it is next to impossible to give a reasonable evaluation result of the occurrence probability of abnormal events with Equation (4).
To more accurately evaluate the abnormal event occurrence probability, it is necessary to establish a prediction model for the number of abnormal event occurrences. The statistical data of historical abnormal events are used as input to establish the functional mapping relationship between the statistical number of historical abnormal events and the abnormal event occurrence probability and realize the reasonable prediction of the abnormal event occurrence probability in the risk tree.
Considering that the BDS-3 satellite has the function of software on-orbit reconstruction, in the actual operation and maintenance process, the relevant on-orbit reconstruction work is implemented on demand from time to time, according to the overall engineering requirements, technical status upgrades, software robustness upgrades and other inputs. Therefore, for BDS-3, when predicting the future abnormal probability based on historical abnormal data, the following assumptions should be considered:
- During the estimation period, satellites are not reconstructed on-orbit software, i.e., the hardware and software states that cause anomalies are considered relevant and consistent.
- In the next period of time, the hardware related to the space segment and the ground control segment does not run in a super-life state.
- Assume that the system is a stable system, that is, the fault occurrence probability is a constant within a certain time, and an abnormal occurrence is a rare event.
Based on the above assumptions, this paper uses the Bayesian estimation theory to calculate the abnormal events probability in the system, as follows:
In Equation (5), k is the number of abnormal events obtained by statistics at time T and belongs to posterior information. r is the expected occurrence number of abnormal events and belongs to prior information. The main function of the Bayesian estimation theory is to use posterior information to infer prior information.
P(k/r) is the probability that the number of abnormal events occurrences is k during time T, under the condition that the occurrence probability of abnormal events is r. According to the operation and maintenance experience and literature [10,12,13], the Poisson distribution can be used to describe:
f(r) is the continuous prior probability density function for r, which is the occurrence probability of an abnormal event, usually described by a gamma distribution:
In Equation (7), is the shape parameter, is the scale parameter, and () is the gamma distribution function. Substituting Equations (6) and (7) into Equation (5), we can obtain that:
Although the gamma distribution can be used to describe the prior probability density function, the values of and need to be determined according to the actual situation. Box and Tiao and Jeffireys et al. proposed three common reference values [21,22], as shown in Table 4.

Table 4.
Reference values of gamma distribution parameters.
In the above reference values, although there is no clear unified standard and selection suggestion, the paper selects the most widely used Jeffrey parameter to calculate the BDS-3 integrity risk probability. By substituting the Jeffrey parameter into Equation (8), the continuous posterior probability density function of the occurrence probability of abnormal events is:
Using Equation (9), according to different confidence requirements, a reasonable redundant prediction value can be given for the number of historical statistics of abnormal events that have occurred within time T. Taking the historical statistics number of abnormal events as an example, the cumulative distribution of the predicted number of abnormal events is shown in Figure 4, under the condition that the probability of abnormal events is r.
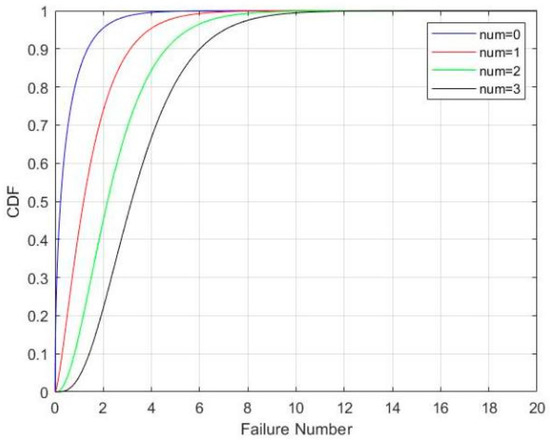
Figure 4.
Cumulative distribution of posteriori anomaly occurrences for k = 0, 1, 2, 3.
Table 5 shows the posterior occurrence number of anomaly events considering the conditions of historical statistics number of abnormal events under different confidence levels. These numbers will be used to compute the probability of integrity risk under certain confidence level according to the user or system required.

Table 5.
System design values of abnormal events under different confidence.
It should be noted that the focus of this paper is the system integrity risk. The object of integrity monitoring is the abnormal event that causes the signal-in-space error to exceed the alarm limit (such as the signal measurement anomaly). The paper uses Equation (9) to predict the system’s anomaly occurrence probability, aiming to focus on solving the problem of using the small sample prior knowledge to reasonably and objectively estimate the small probability events occurrence probability, rather than the multilevel causes and probability analysis of the anomalies.
4. Result and Discussion
4.1. Characterization of BDS-3 Signal-In-Space Ranging Errors
As shown in Table 1, the signal-in-space ranging error (SISRE) is ones of the most important parameters to be characterized for integrity monitoring. The SISRE refers to the ranging error in the user’s line of sight, caused by the satellite orbit error and the satellite clock error, usually related to the user’s location on earth. For the detailed BDS-3 SISRE calculation, please refer to the reference [23].
The characterization of SISRE depends on the clock and orbit data generated by the Ground Operation Control Center. To investigate the BDS-3 SISRE characteristics, over one and a half years of BDS-3 D1-type navigation data [24], from 1 January 2019 to 31 July 2020, has been collected and the nominal BDS-3 navigation message accuracy were further evaluated. During this period, only navigation ephemerides marked as healthy were assessed in this paper. The long-term orbit errors of the broadcast ephemerides are illustrated in Figure 5. It shows that MEO type of satellites has the smallest orbital errors, followed by IGSO satellites, and GEO type has the largest orbital errors due to their weak geometric strength relative to the ground-based static monitoring stations.
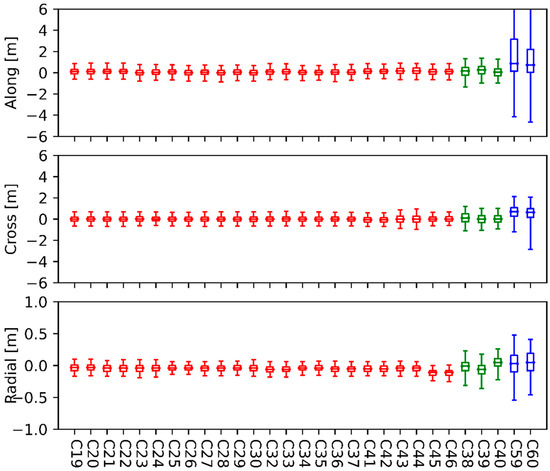
Figure 5.
Statistical results for BDS-3 orbit errors in the along, cross and radial directions. The boxes in red colors indicate the MEO satellites, those in green colors for the IGSO satellites and blue for the GEO satellites. The box plot is constructed from the 2.5th, 25th, 50th, 75th and 97.5th percentiles.
Figure 6 presents the statistical results of the BDS broadcast clock errors. Referring to the precise clock products released by IGS, 95% of clock accuracy in an average range of 1 m can be derived for all BDS-3 satellites. Additionally, we can see that there still exist satellite-dependent clock biases for BDS-3 satellites, which could be partially linked to the lower accuracy of time group delay (TGD) parameters extracted from the BDS downlink navigation message [23].
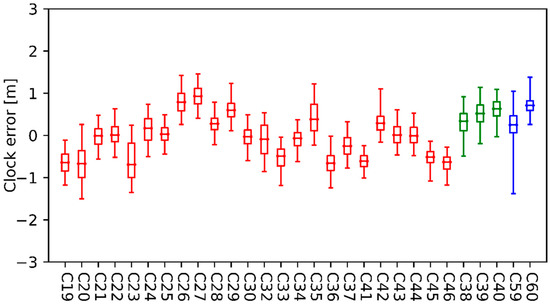
Figure 6.
Statistics of the BDS broadcast clock errors. The boxes in red colors indicate the MEO satellites, those in green colors for the IGSO and blue for the GEO satellites. The box plot is constructed from the 2.5th, 25th, 50th, 75th and 97.5th percentiles.
A monthly statistical analysis of SISRE metrics of SISRE (orbit only), SISRE, SISRE (at the worst user location, WUL) and SISRE (95%) was carried out during the assessment period. As can be seen from Figure 7, the accuracy of SISRE orbit only of MEO and IGSO satellites is better than 0.1 m, but the clock error affects the SISRE accuracy greatly, which is 0.2~0.3 m on average for SISRE. However, in general, SISRE accuracy of MEO satellites is 95% better than 0.5 m and IGSO satellites better than 1 m. The SISRE accuracy of GEO satellites is poorer during the initial evaluation period, but from April 2020 onwards, its SISRE index is significantly improved and stabilized.
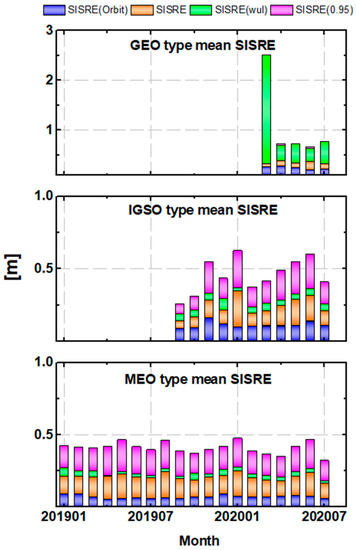
Figure 7.
Monthly type mean statistical results of SISRE for BDS-3 GEO satellites (top), IGSOs (middle) and MEOs (bottom). SISRE denotes the rms global average SISE of the orbit and clock, SISRE (orb) denotes the orbit-only SISRE, SISRE (wul) stands for the SISRE at the worst user location, and SISRE (95%) stands for the 95th percentile of the UREs.
Figure 8 provides the SISRE results as a function of cumulative density function. The SISRE is plotted on a per satellite basis aggregating all data available in the analysis period. As can be seen from Figure 7, the MEO and IGSO satellites have the best SISRE performance with 95% up to 1 m, which are much better than the claimed SISRE Accuracy Standard (≤2 m, 95%). In contrast, GEO satellites have the worst SISRE accuracy, among which, PRN60 satellite has SISRE accuracy of 5.5 m (95%), obviously worse than the standard accuracy in the analyzed period.
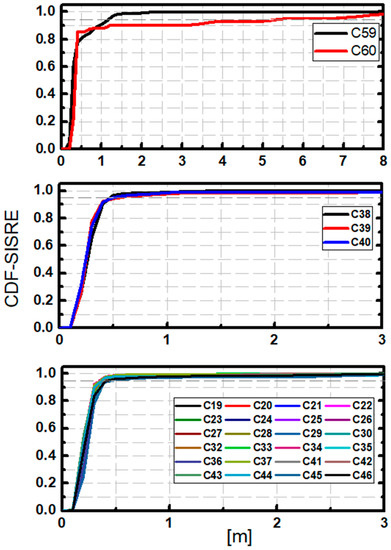
Figure 8.
Cumulative distribution function (CDF) of SISRE for BDS-3 GEO satellites (top), IGSOs (middle) and MEOs (bottom).
4.2. Probabilistic Assessment and Result Analysis of Integrity Risk Based on Actual Data
BDS-3 provides basic positioning navigation and timing services on 27 December 2018. Based on the actual operation data of the system, 11 abnormal events of the signal-in-space integrity risk tree in Figure 2 are counted (the statistical period is from 27 December 2018 to 27 December 2020), and the actual number of failures of each abnormal event are calculated. There were eighteen abnormal events of BDS-3 during the statistical two years, and six of the eighteen anomalies occurred in the satellite arc without ground monitoring and missed detected by SAIM. The missed alarm events include one satellite clock anomaly and five signal measurement anomalies. The other anomaly events were all detected by SAIM or the ground integrity monitoring function. The integrity risk probability calculation is related to the predictive number of failures, the number of satellites in the constellation, and the evaluation confidence. In the integrity risk algorithm adopted by the joint ARAIM working group of the European Union and the United States, 60% is usually used as the confidence level, but the confidence level under conservative estimation is generally 95%. This paper predicts the number of abnormal events according to the 95% confidence requirement and evaluates the integrity risk probability of two years. Considering that the number of satellites in the BDS-3 constellation is 30, the results are shown in Table 6.

Table 6.
Statistics and prediction of abnormal events in integrity risk trees.
According to the above analysis and assumptions about the integrity risk tree, without considering the receiver abnormal influence, based on the preliminary calculation, the probability of BDS-3 anomalies is approximately 9.06e-5/h, and the abnormal monitoring missing detection rate is 3.22e-5, whose conservative value is 1e-3 according to the system design. The probability of BDS-3 integrity risk under 95% confidence could be calculated to be approximately 0.9 e-7/h according to the system design value of missing detection rate.
Figure 9 shows the probability assessment results of integrity risk with different anomaly occurrence times and different time spans under the 95% confidence level. The black line is the BDS-3 external commitment integrity risk indicator 1e-5/h. It can be seen in Figure 5 that for 0 anomaly occurrence times, more than one year is required to evaluate the integrity risk index lower than 1e-5/h; for one anomaly occurrence, more than two years are required to evaluate the integrity risk index lower than 1e-5/h; for two and three anomaly occurrences, more than three years are required to assess integrity risk indicators lower than 1e-5/h; for seven anomaly occurrence times, more than six years are required to assess integrity risk indicators lower than 1e-5/h.
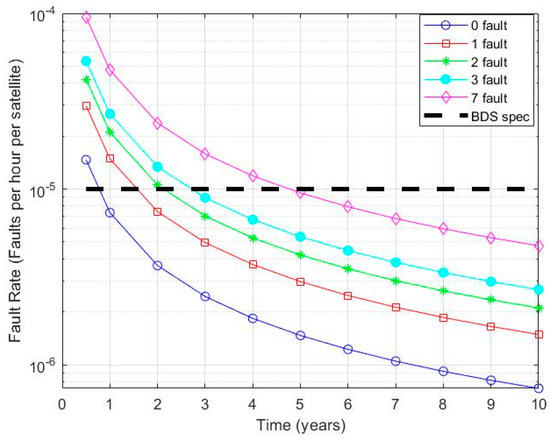
Figure 9.
Probability of integrity risk with different numbers of exceptions at the 95% confidence level.
It can be seen from the results in Table 6 that the probabilities of “pseudorange measurement anomaly” and “satellite autonomous integrity nondetection” are relatively large.
Further analysis shows that pseudorange measurement anomalies are mainly due to the influence of the space environment (such as the single event upset effect), which leads to satellite payload anomalies and affects pseudorange measurements. Therefore, improving the anti-space environment effect of satellite payload and reducing the abnormal probability of satellite payload are key factors to reduce the probability of integrity risk.
Satellite autonomous integrity non-detection is because satellite autonomous integrity monitoring can only cover the detection of satellite clock frequency/phase hopping, signal power anomalies and correlation peak distortions, and does not have the detection function of ephemeris anomalies. Therefore, improving the satellite autonomous integrity monitoring ability and realizing autonomous integrity monitoring and ephemeris anomaly warning is another key factor to improve integrity performance.
5. Summary and Conclusions
In this paper, the IFMEA identification analysis method was used to establish the integrity risk tree of BDS-3. The BDS-3 signal-in-space ranging errors, which are considered as one of the most important parameters for integrity monitoring, were characterized based on the real downlink navigation message. Then, the integrity performance of BDS-3 was quantitatively verified by the abnormal characteristic table statistics of the actual system anomalies. The statistical period is from 27 December 2018, to 27 December 2020. Among the BDS-3 anomalies shown in Table 6, there are 10 anomalies related to payload anomalies in the space segment which are affected by the space environment, as three satellite clock anomalies, one signal power anomaly and six signal measurement anomalies. Six anomalies were not detected by satellite autonomous integrity monitoring due to satellite autonomous integrity monitoring limitation. There are seven anomalies in the ground control segment, including two inaccurate ephemeris/clock calculation anomalies, one orbit and time synchronization processing equipment anomaly, three ephemeris fitting parameter anomalies and one monitoring station data anomaly. According to the statistical calculation, the occurrence times of each bottom event of the integrity risk tree are obtained, and the anomaly probability is predicted according to the Bayesian model. Based on the integrity risk tree analysis, the integrity risk probability of BDS-3 is calculated as approximately 0.9e-7/h at a 95% confidence level, which meets the design index requirements of 1e-7/h.
The analysis results show that “pseudorange measurement anomaly” and “satellite autonomous integrity nondetection” are the key factors restricting system integrity. Therefore, this paper proposed solutions to improve integrity performance: the first is to improve the satellite payload against the space environment effect, reducing the probability of satellite payload anomalies to reduce the probability of pseudorange measurement anomalies; the second is to improve the ability of satellite autonomous integrity monitoring, realizing autonomous integrity monitoring and alarms of ephemeris anomalies to reduce the satellite autonomous integrity non-detection probability. The relevant specific contents will be introduced in detail in a follow-up study.
It is very important to continuously carry out IFMEA processing for BDS-3. This paper introduces the monitoring methods of IFMEA, and preliminarily evaluates the integrity performance of the BDS-3 with initial service observation data. Subsequently, according to the analysis results of IFMEA, we will focus on the updates of the system fault tree model and the system control segment and will continuously evaluate the system integrity service capability of BDS-3, using the measured data according to the system update status.
Author Contributions
Writing—original draft preparation, L.C. (Lei Chen); conceptualization, writing—review and editing, W.G.; conceptualization, Formal analysis, Z.H.; writing—review & editing, Y.C.; methodology, L.P. and C.L.; resources, W.Z.; validation, X.L.; data curation, L.C. (Liang Chen); software, R.Y. All authors have read and agreed to the published version of the manuscript.
Funding
This paper is supported by the National Natural Science Foundation of China (No. 41674041, 11203059), Young Elite Scientists Sponsorship Program by CAST (YESS20200308), China Postdoctoral Science Foundation (2021M690192), Beijing Postdoctoral Research Foundation (2021-ZZ-088) and Beijing Nova Program (Z211100002121068).
Institutional Review Board Statement
Not applicable.
Informed Consent Statement
Not applicable.
Data Availability Statement
Not applicable.
Conflicts of Interest
The authors declare no conflict of interest.
References
- Yang, Y.X.; Mao, Y.; Sun, B.J. Basic performance and future developments of BeiDou global navigation satellite system. Satell. Navig. 2020, 1, 1. [Google Scholar] [CrossRef] [Green Version]
- Hu, X.; Dong, X.; Tao, Y. Analysis on service performance index of Beidou navigation system. Mod. Electron. Tech. 2013, 36, 16–18. [Google Scholar]
- China Satellite Navigation Office. BeiDou Navigation Satellite System Open Service Performance Standard (Version 2.0); China Satellite Navigation Office: Montréal, QC, Canada, 2018.
- Hein, G.W. Status, perspectives and trends of satellite navigation. Satell. Navig. 2020, 1, 22. [Google Scholar] [CrossRef] [PubMed]
- International Civil Aviation Organization (ICAO). Annex 10, Volume I (Radio Navigation Aids), “Aeronautical Telecommunications”, 7th ed.; ICAO: Montréal, QC, Canada, 2018. [Google Scholar]
- Ochieng, W.Y.; Sauer, K.; Walsh, D.; Brodin, G.; Griffin, S.; Denney, M. GPS Integrity and Potential Impact on Aviation Safety. J. Navig. 2003, 56, 51–65. [Google Scholar] [CrossRef]
- Kovach, K.; Dobyne, J.; Crews, M.; Miles, C. GPS III Integrity Concept. In Proceedings of the International Technical Meeting of the Satellite Division of the Institute of Navigation, Savannah, GA, USA, 16–19 September 2008. [Google Scholar]
- Medel, C.H.; Catalán, C.C.; Vidou, M.A.F.; Sardon, E. The Galileo Ground Segment Integrity Algorithms: Design and Performance. Int. J. Navig. Obs. 2008, 2008, 178927. [Google Scholar] [CrossRef] [Green Version]
- Cao, Y.; Chen, J.; Hu, X.; He, F.; Bian, L.; Wang, W.; Wu, B.; Yu, Y.; Wang, J.; Tian, Q. Design of BDS-3 integrity monitoring and preliminary analysis of its performance. Adv. Space Res. 2020, 65, 1125–1138. [Google Scholar] [CrossRef]
- Cao, Y.; Hu, X.; Chen, J.; Bian, L.; Wang, W.; Li, R.; Wang, X.; Rao, Y.; Meng, X.; Wu, B. Initial analysis of the BDS satellite autonomous integrity monitoring capability. GPS Solut. 2019, 23, 35. [Google Scholar] [CrossRef]
- U.S. National Coordination Office for Space-Based Positioning Navigation and Timing. Global Positioning Systems Directorate Systems Engineering & Integration Interface Specification; U.S. National Coordination Office: Washington, DC, USA, 2013.
- European GNSS (GALILEO) Open Service. Signal-In-Space Interface Control Document. 2016. Available online: https://www.gsc-europa.eu/sites/default/files/sites/all/files/Galileo-OS-SIS-ICD.pdf (accessed on 2 January 2022).
- Chen, J.; Cao, Y.; Guo, R.; Li, X.; Meng, X. The Calculation Method and Performance Evaluation on SISA of New Generation BDS. Acta Geod. Cartogr. Sin. 2018, 47, 1–8. [Google Scholar]
- Tayntor, C. The Failure Modes and Effects Analysis (FMEA). In Project Management Tools and Techniques for Success; CRC Press: Boca Raton, FL, USA, 2010; pp. 249–252. [Google Scholar]
- Van Dyke, K.; Kovach, K.; Kraemer, J.; Lavrakas, J.; Fernow, J.P.; Reese, J.; Attallah, N.; Baevitz, B. GPS Integrity Failure Modes and Effects Analysis. In Proceedings of the National Technical Meeting of the Institute of Navigation, Anaheim, CA, USA, 22–24 January 2003. [Google Scholar]
- Van Dyke, K.; Kovach, K.; Lavrakas, J.; Carroll, B. Status Update on GPS Integrity Failure Modes and Effects Analysis. In Proceedings of the National Technical Meeting of the Institute of Navigation, San Diego, CA, USA, 26–28 January 2004; pp. 92–102. [Google Scholar]
- Brieden, P.; Wallner, S.; Canestri, E.; Joly, D.; Subirana, J.S.; Martini, I.; Nuckelt, A.; Battista, G.; Lauria, D.; Luongo, F.; et al. Galileo Characterization as Input to H-ARAIM and SBAS DFMC. In Proceedings of the 32nd International Technical Meeting of the Satellite Division of The Institute of Navigation (ION GNSS+ 2019), Miami, FL, USA, 16–20 September 2019. [Google Scholar]
- Du, Y.J.; Wang, J.L.; Rizos, C.; El-Mowafy, A. Vulnerabilities and integrity of PPP for intelligent transport system: Overview and analysis. Satell. Navig. 2021, 2, 3. [Google Scholar] [CrossRef]
- Milner, C.; Macabiau, C.; Thevenon, P. Bayesian Inference of GNSS Failures. J. Navig. 2016, 69, 277–294. [Google Scholar] [CrossRef] [Green Version]
- Walter, T.; Blanch, J.; Joerger, M.; Pervan, B. Determination of Fault Probabilities for ARAIM. In Proceedings of the 2016 IEEE/ION Position, Location and Navigation Symposium (PLANS), Savannah, GA, USA, 11–14 April 2016. [Google Scholar]
- Jeffireys, H. An Invariant Form for the Prior Probability in Estimation Problems. Proc. R. Soc. Lon. Ser. A Math. Phys. Sci. 1946, 186, 453–461. [Google Scholar]
- Box, G.E.P.; Tiao, G.C. Bayesian Inference in Statistical Analysis; Wiley: Hoboken, NJ, USA, 1973; ISBN 0-471-57428-7. [Google Scholar]
- Chen, G.; Zhou, R.; Hu, Z.; Lv, Y.; Wei, N.; Zhao, Q. Statistical characterization of the signal-in-space errors of the BDS: A comparison between BDS-2 and BDS-3. GPS Solut. 2021, 25, 112. [Google Scholar] [CrossRef]
- CSNO. BeiDou Navigation Satellite System Signal in Space Interface Control Document Open Service Signal B1I (Version 3.0); CSNO: Beijing, China, 2019.
Publisher’s Note: MDPI stays neutral with regard to jurisdictional claims in published maps and institutional affiliations. |
© 2022 by the authors. Licensee MDPI, Basel, Switzerland. This article is an open access article distributed under the terms and conditions of the Creative Commons Attribution (CC BY) license (https://creativecommons.org/licenses/by/4.0/).