
Specific Effects of the 1988 Earthquake on Topography and Glaciation of the Tsambagarav Ridge (Mongolian Altai) Based on Remote Sensing and Field Data


 ,
,
Abstract
:1. Introduction
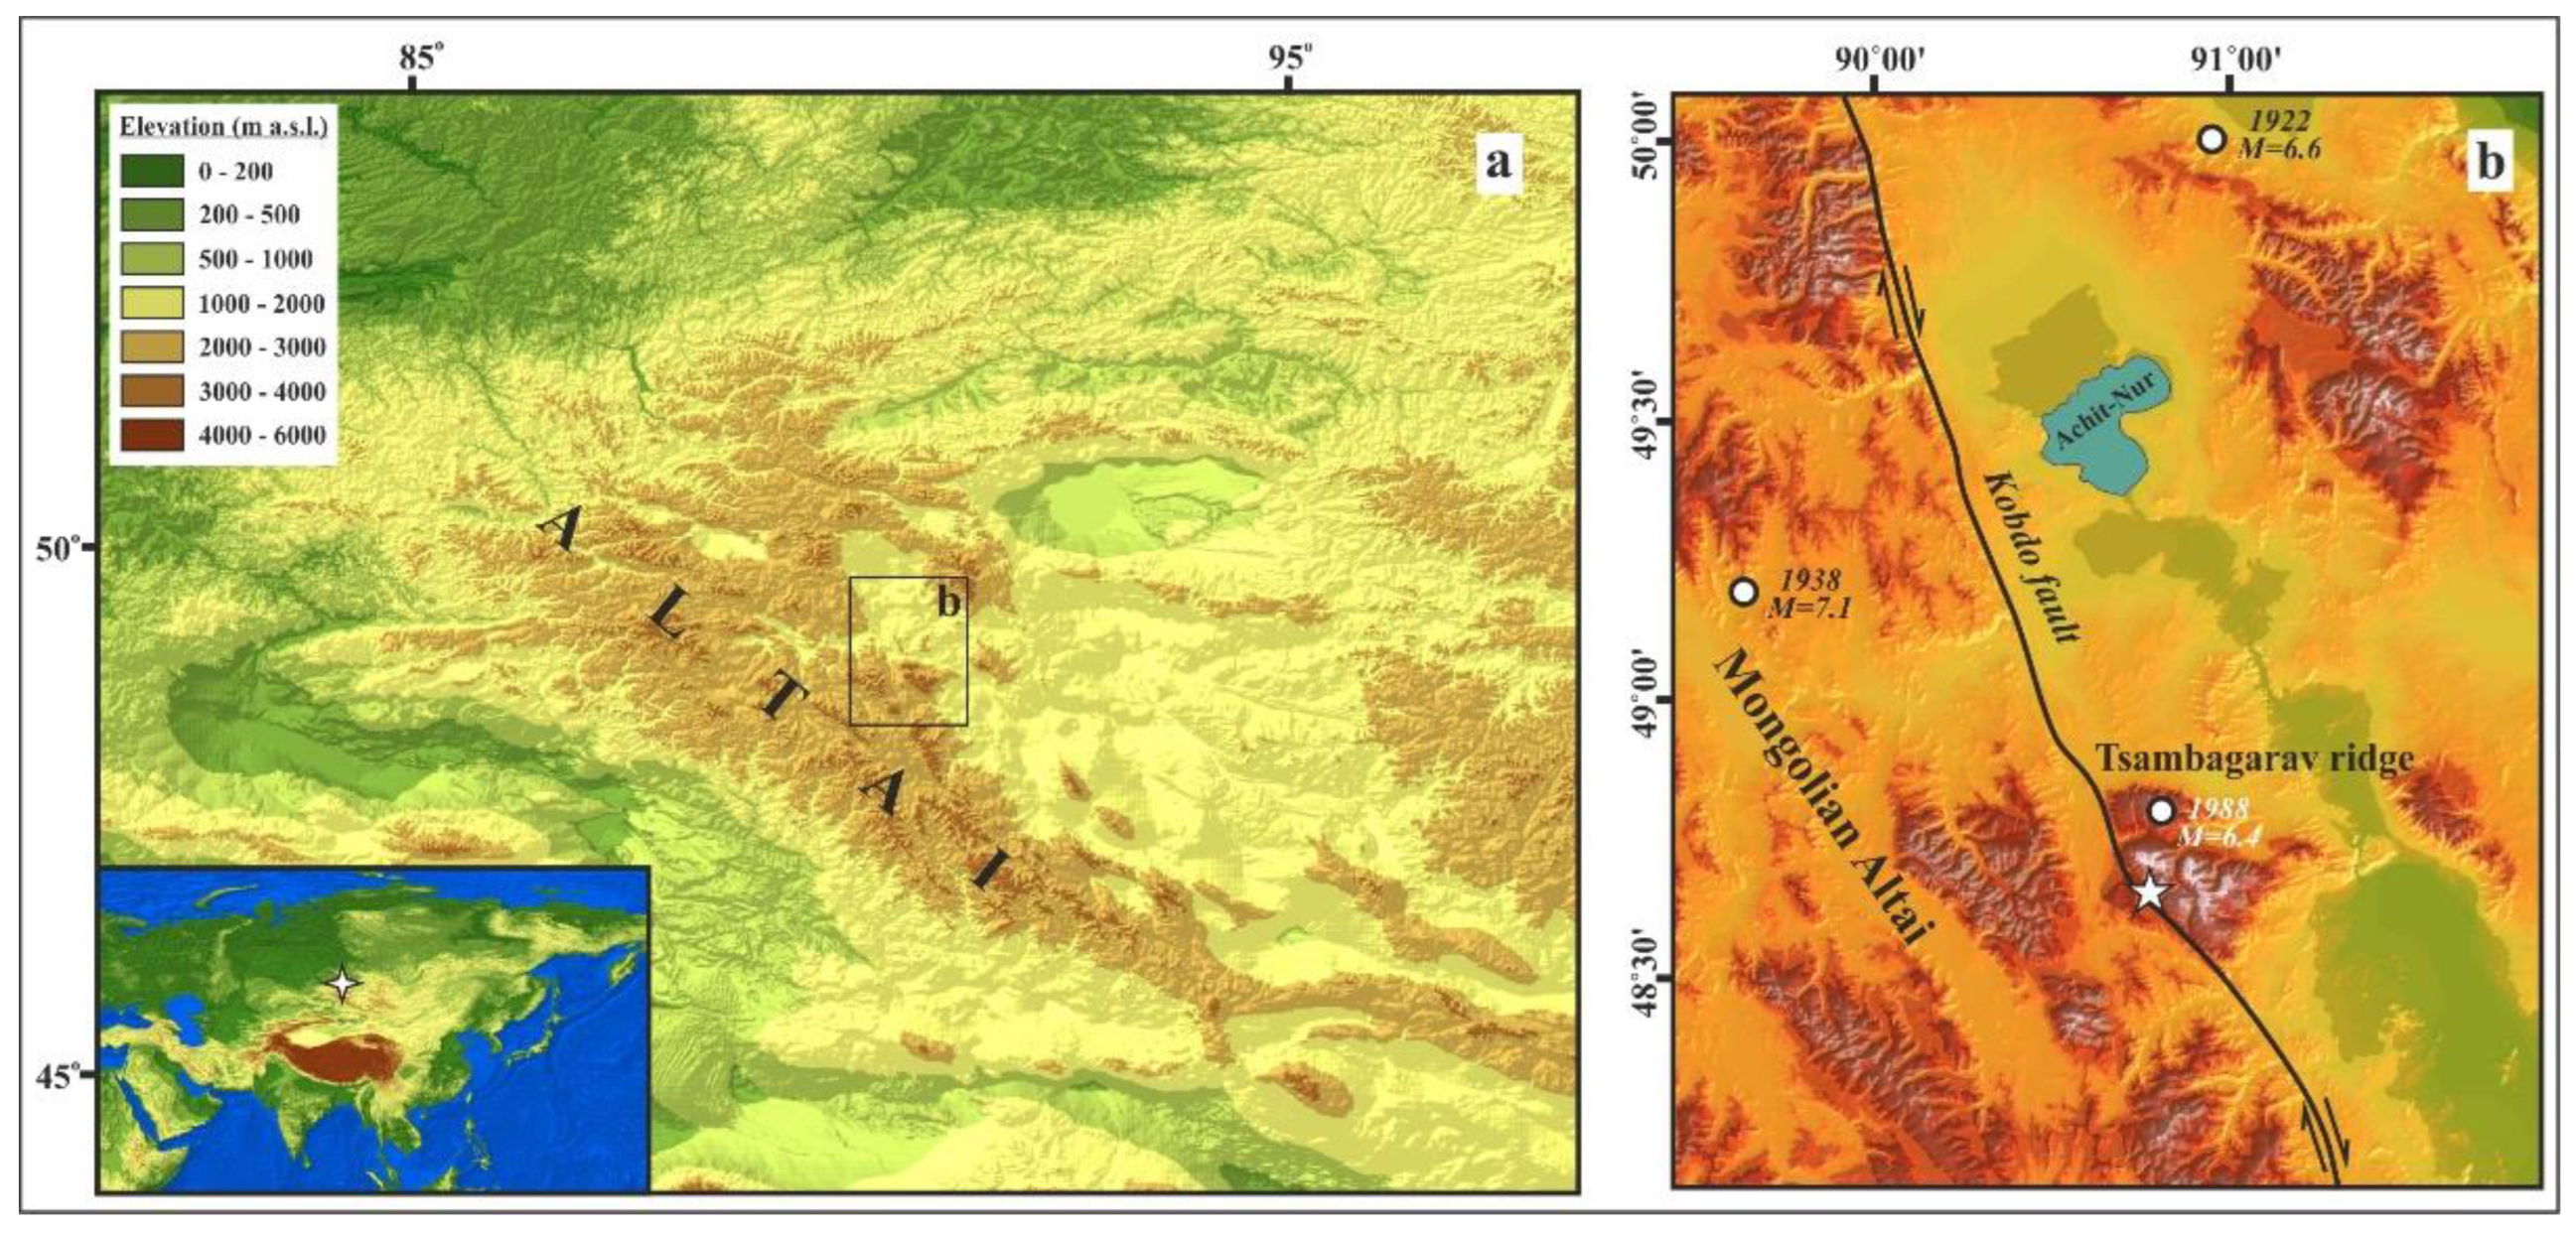
2. Study Area
3. Methods
4. Results
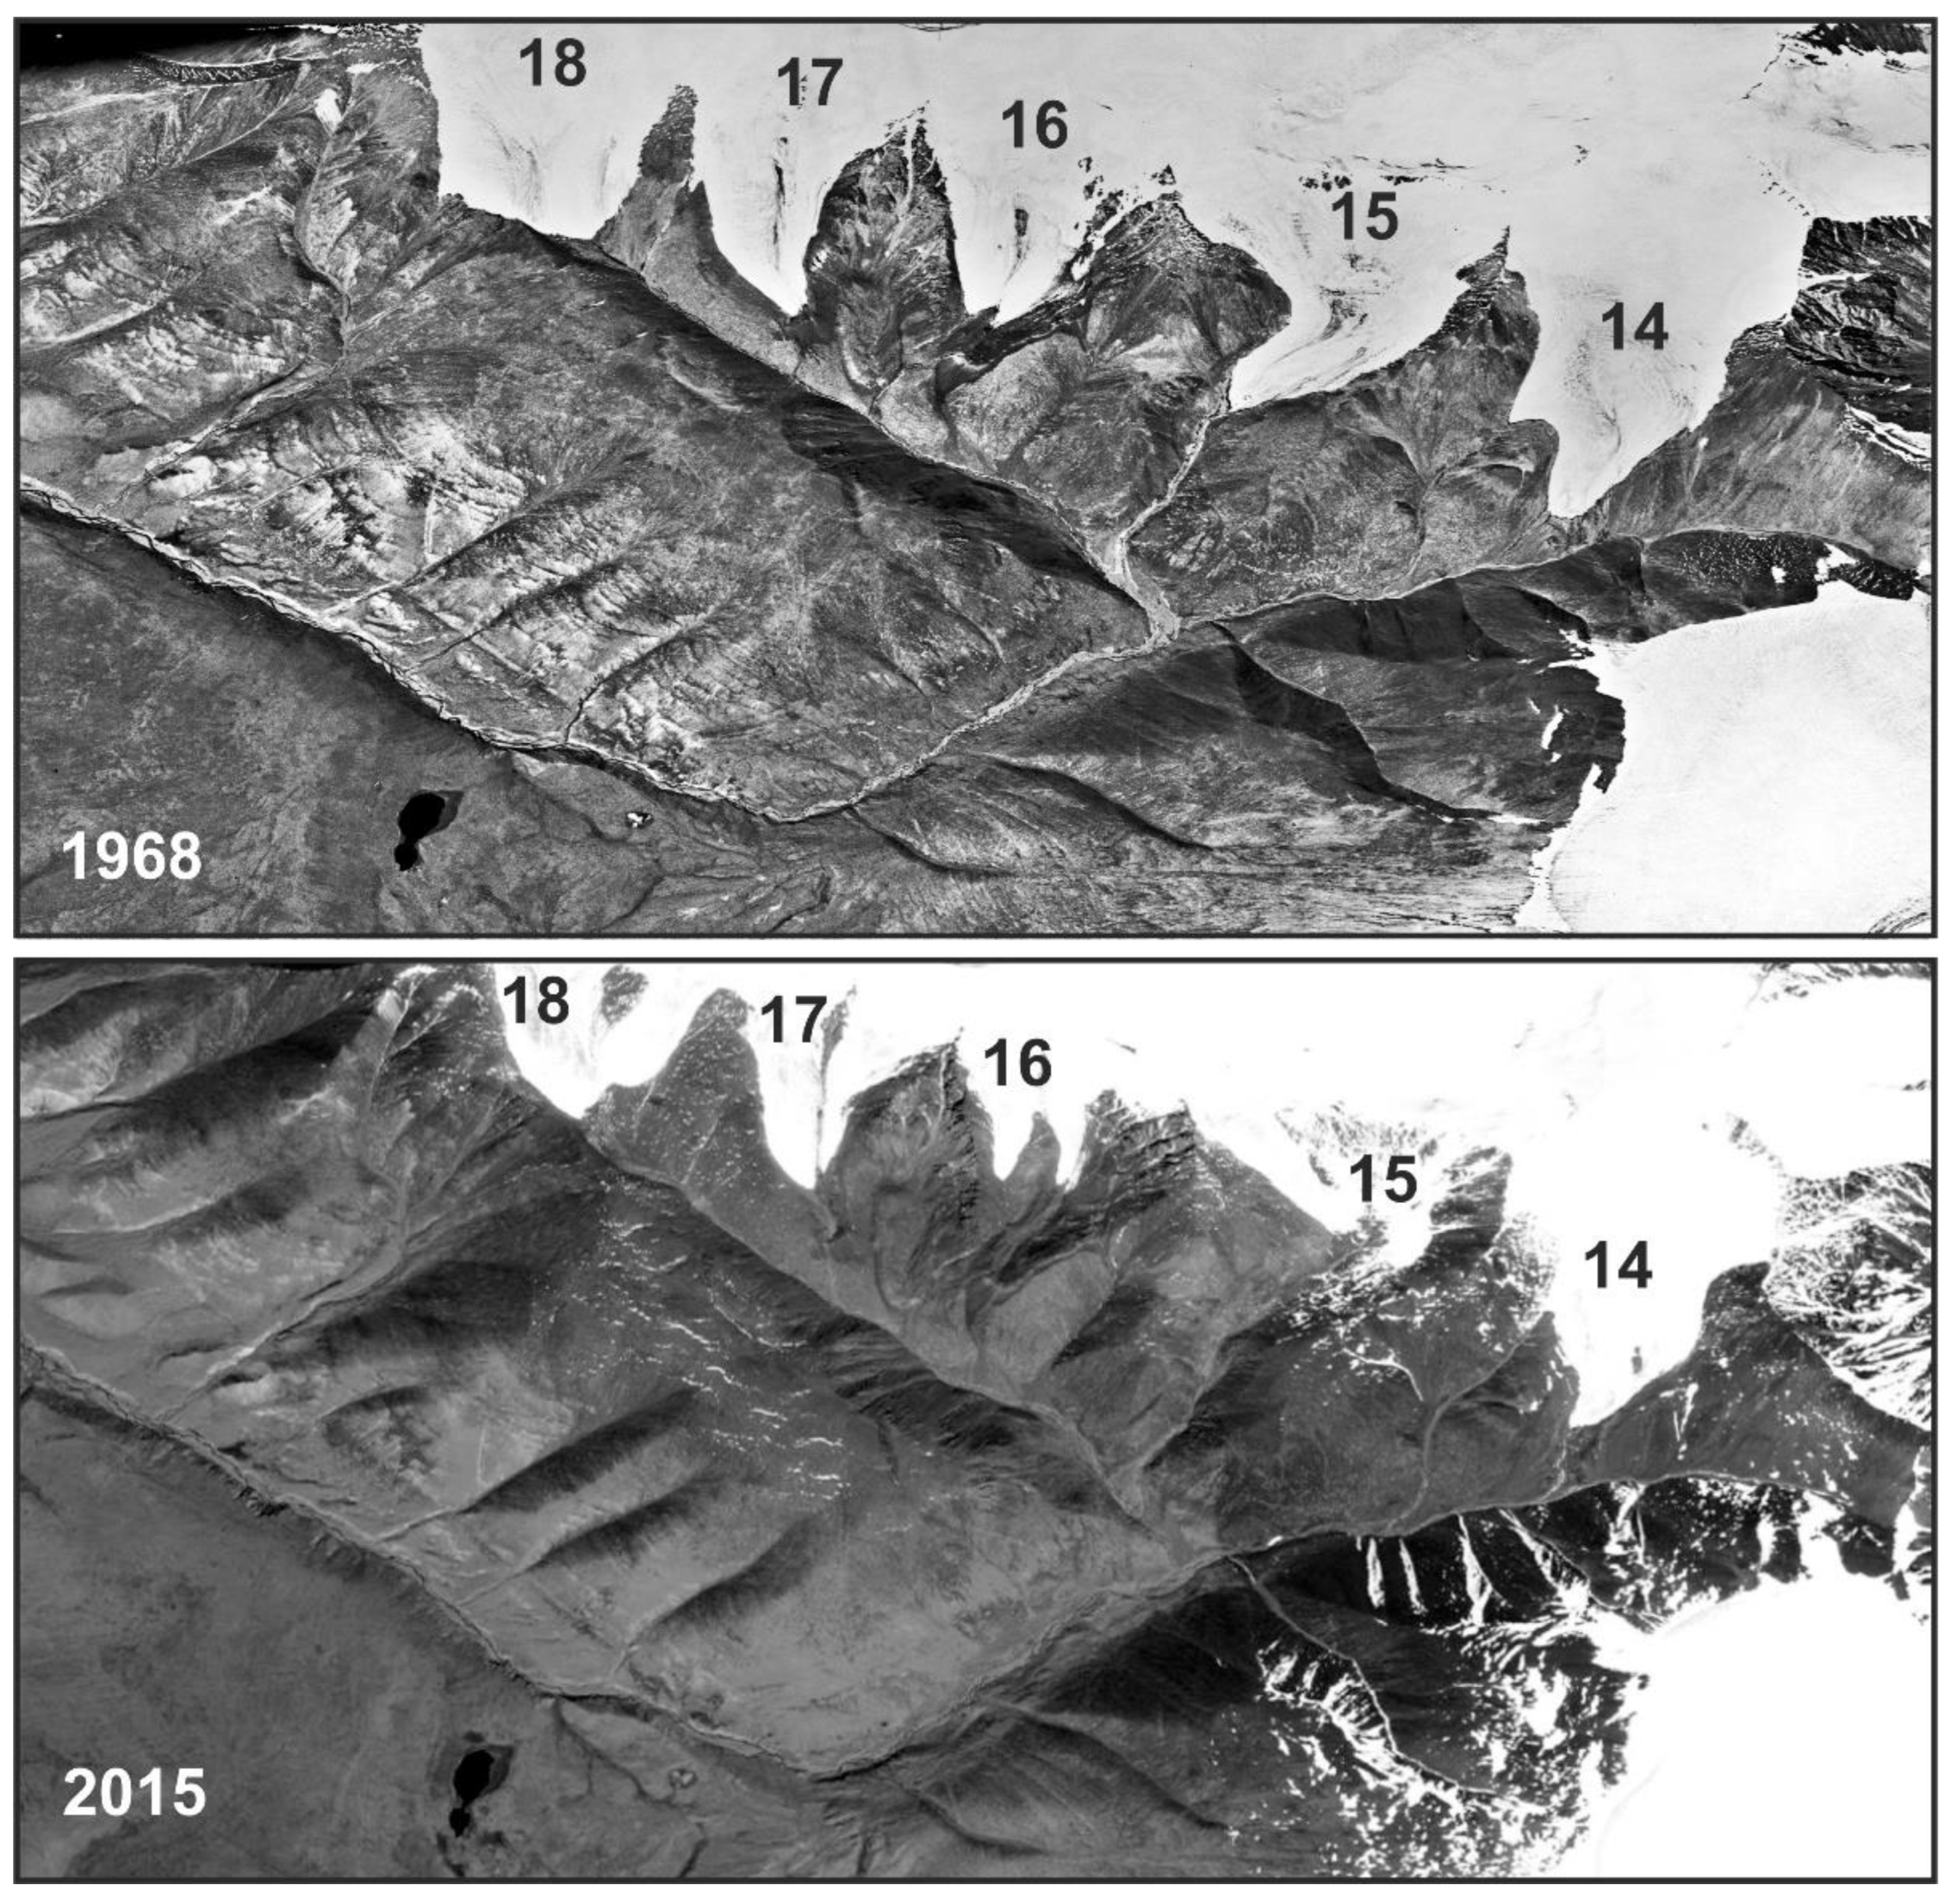
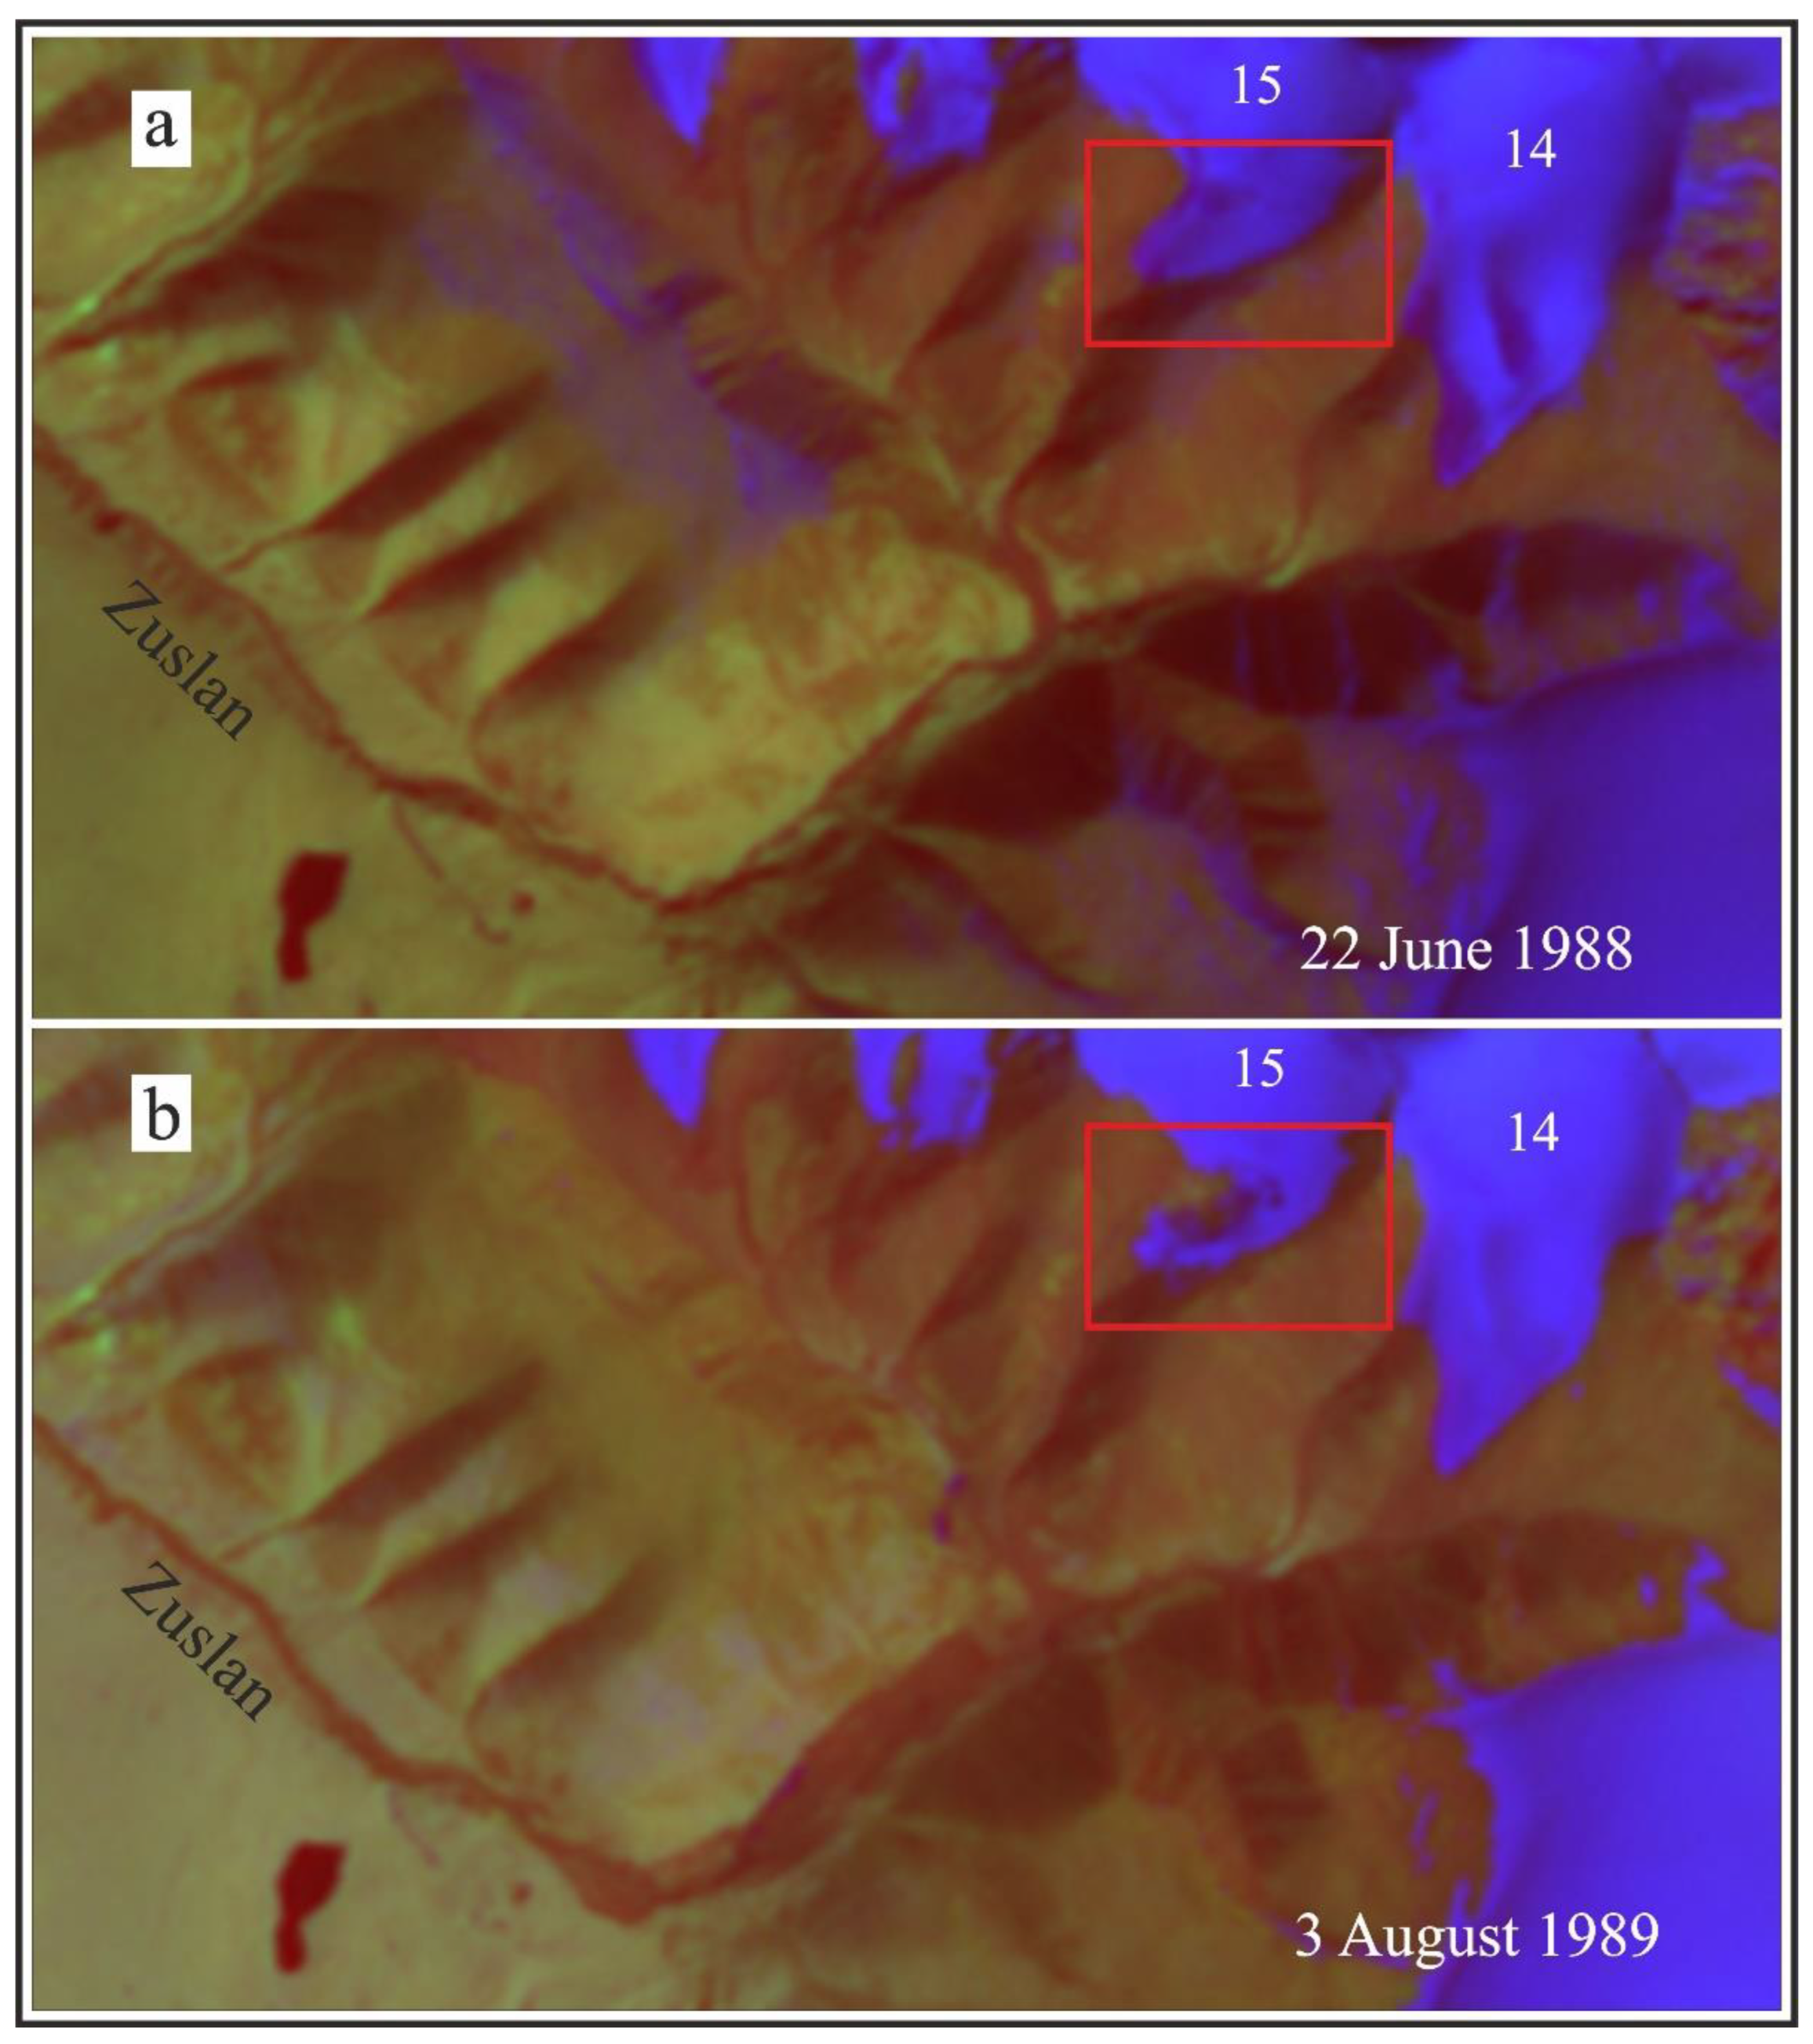
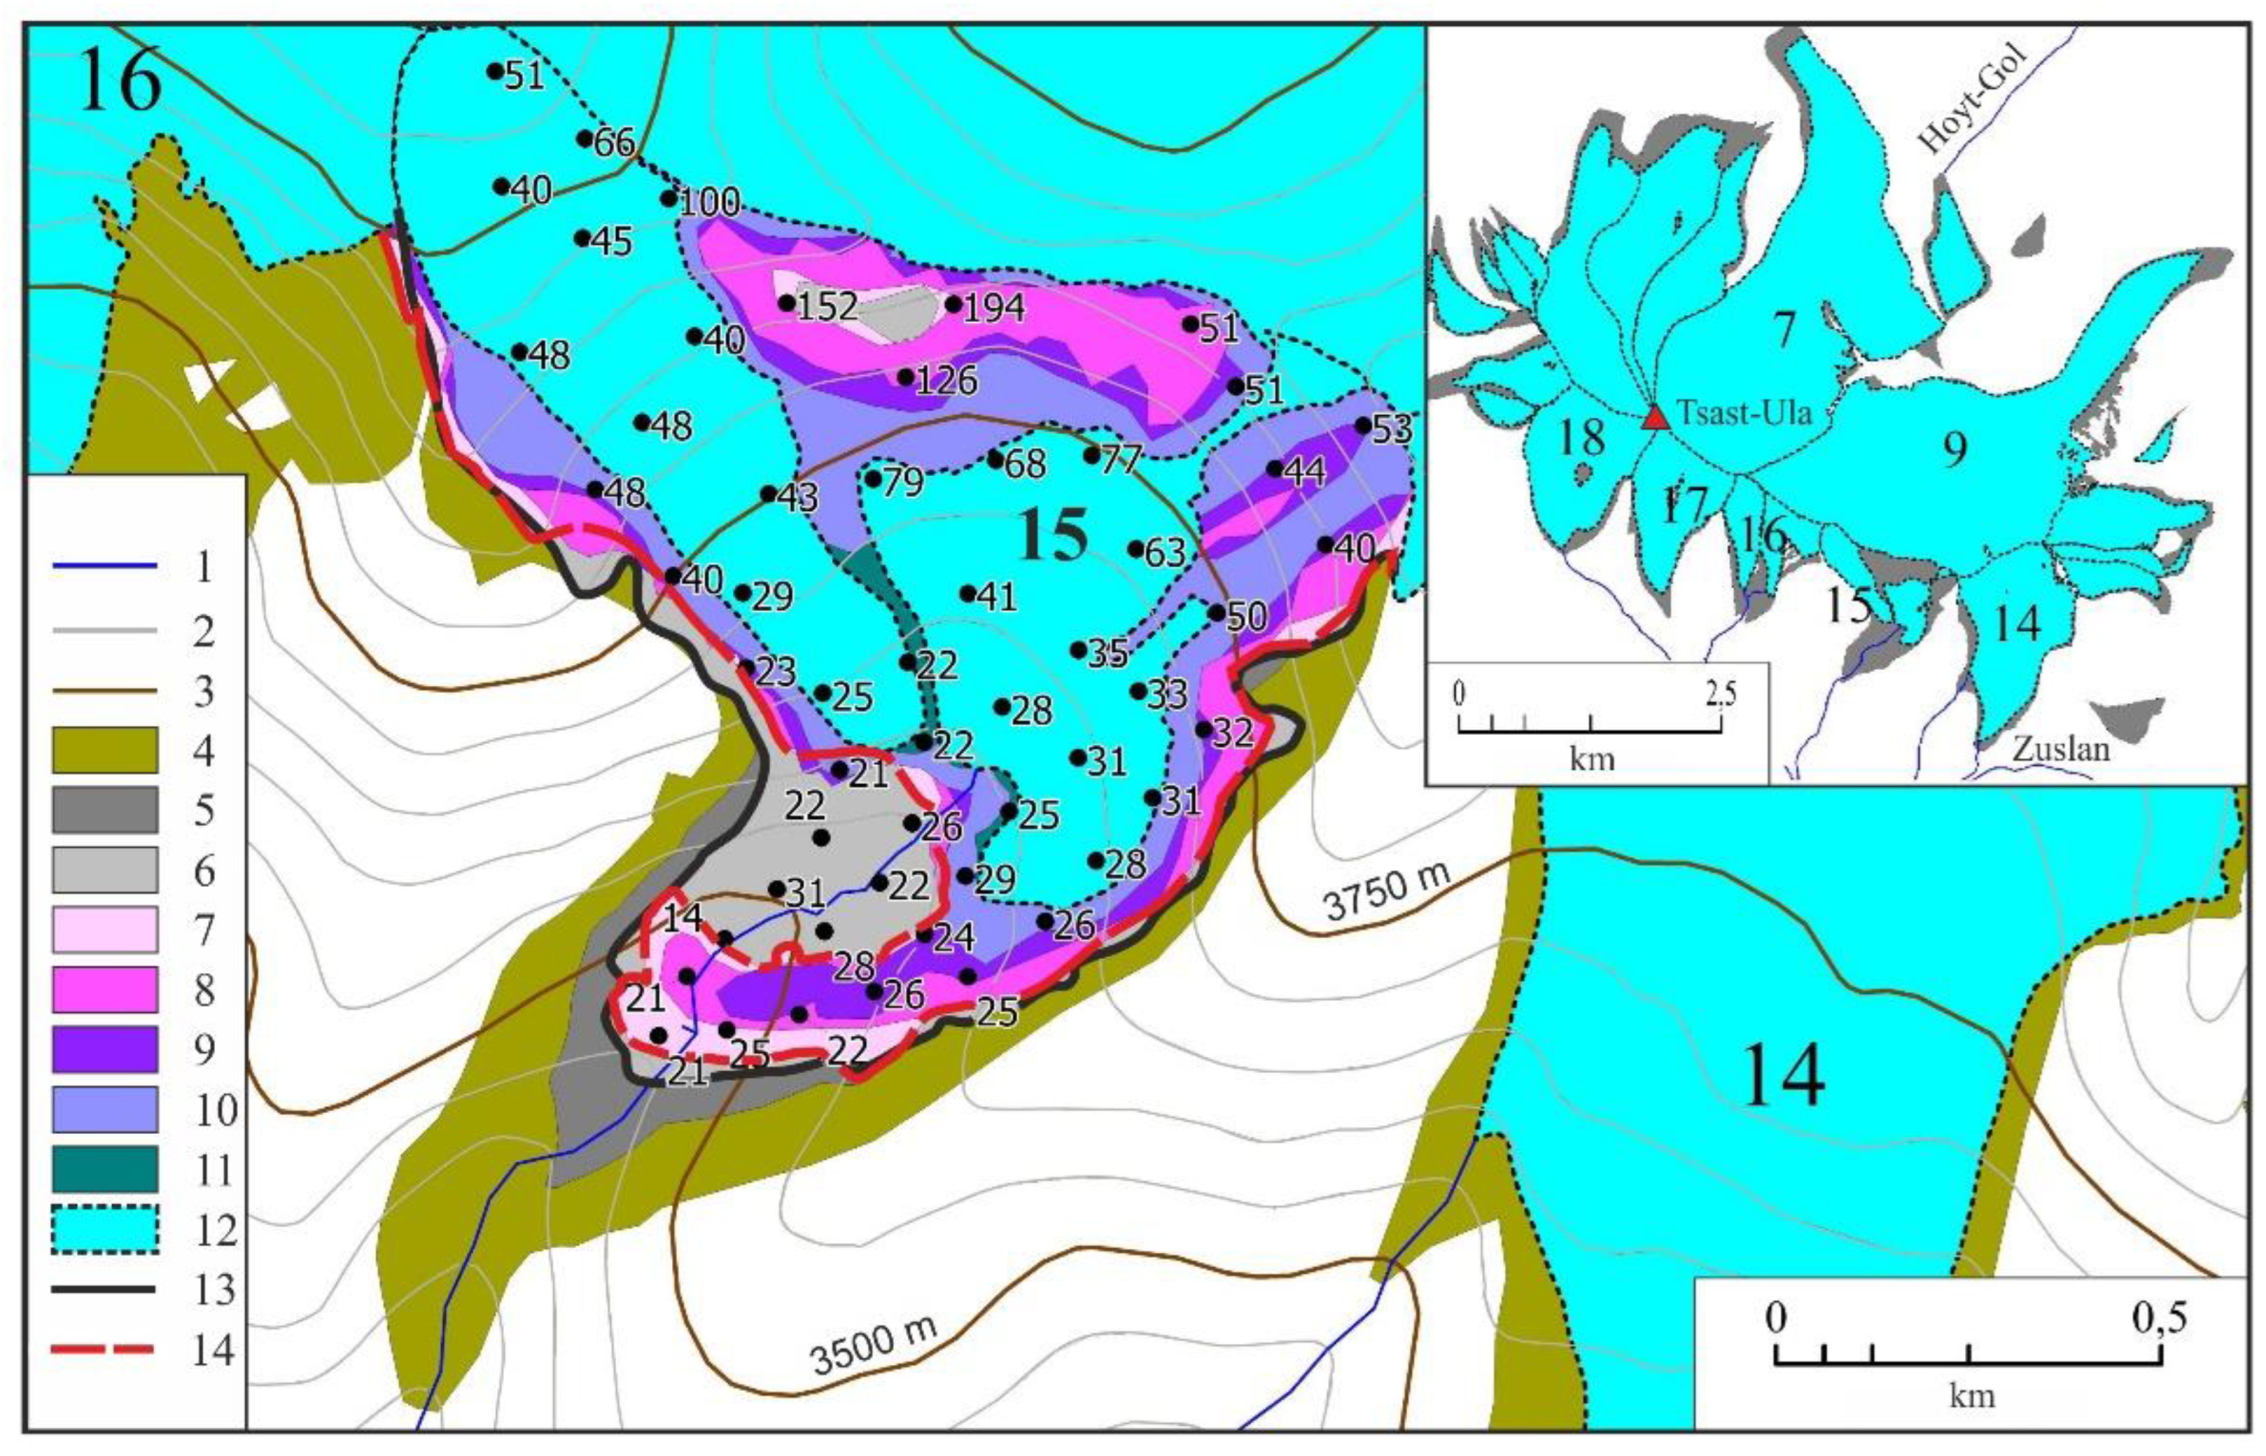
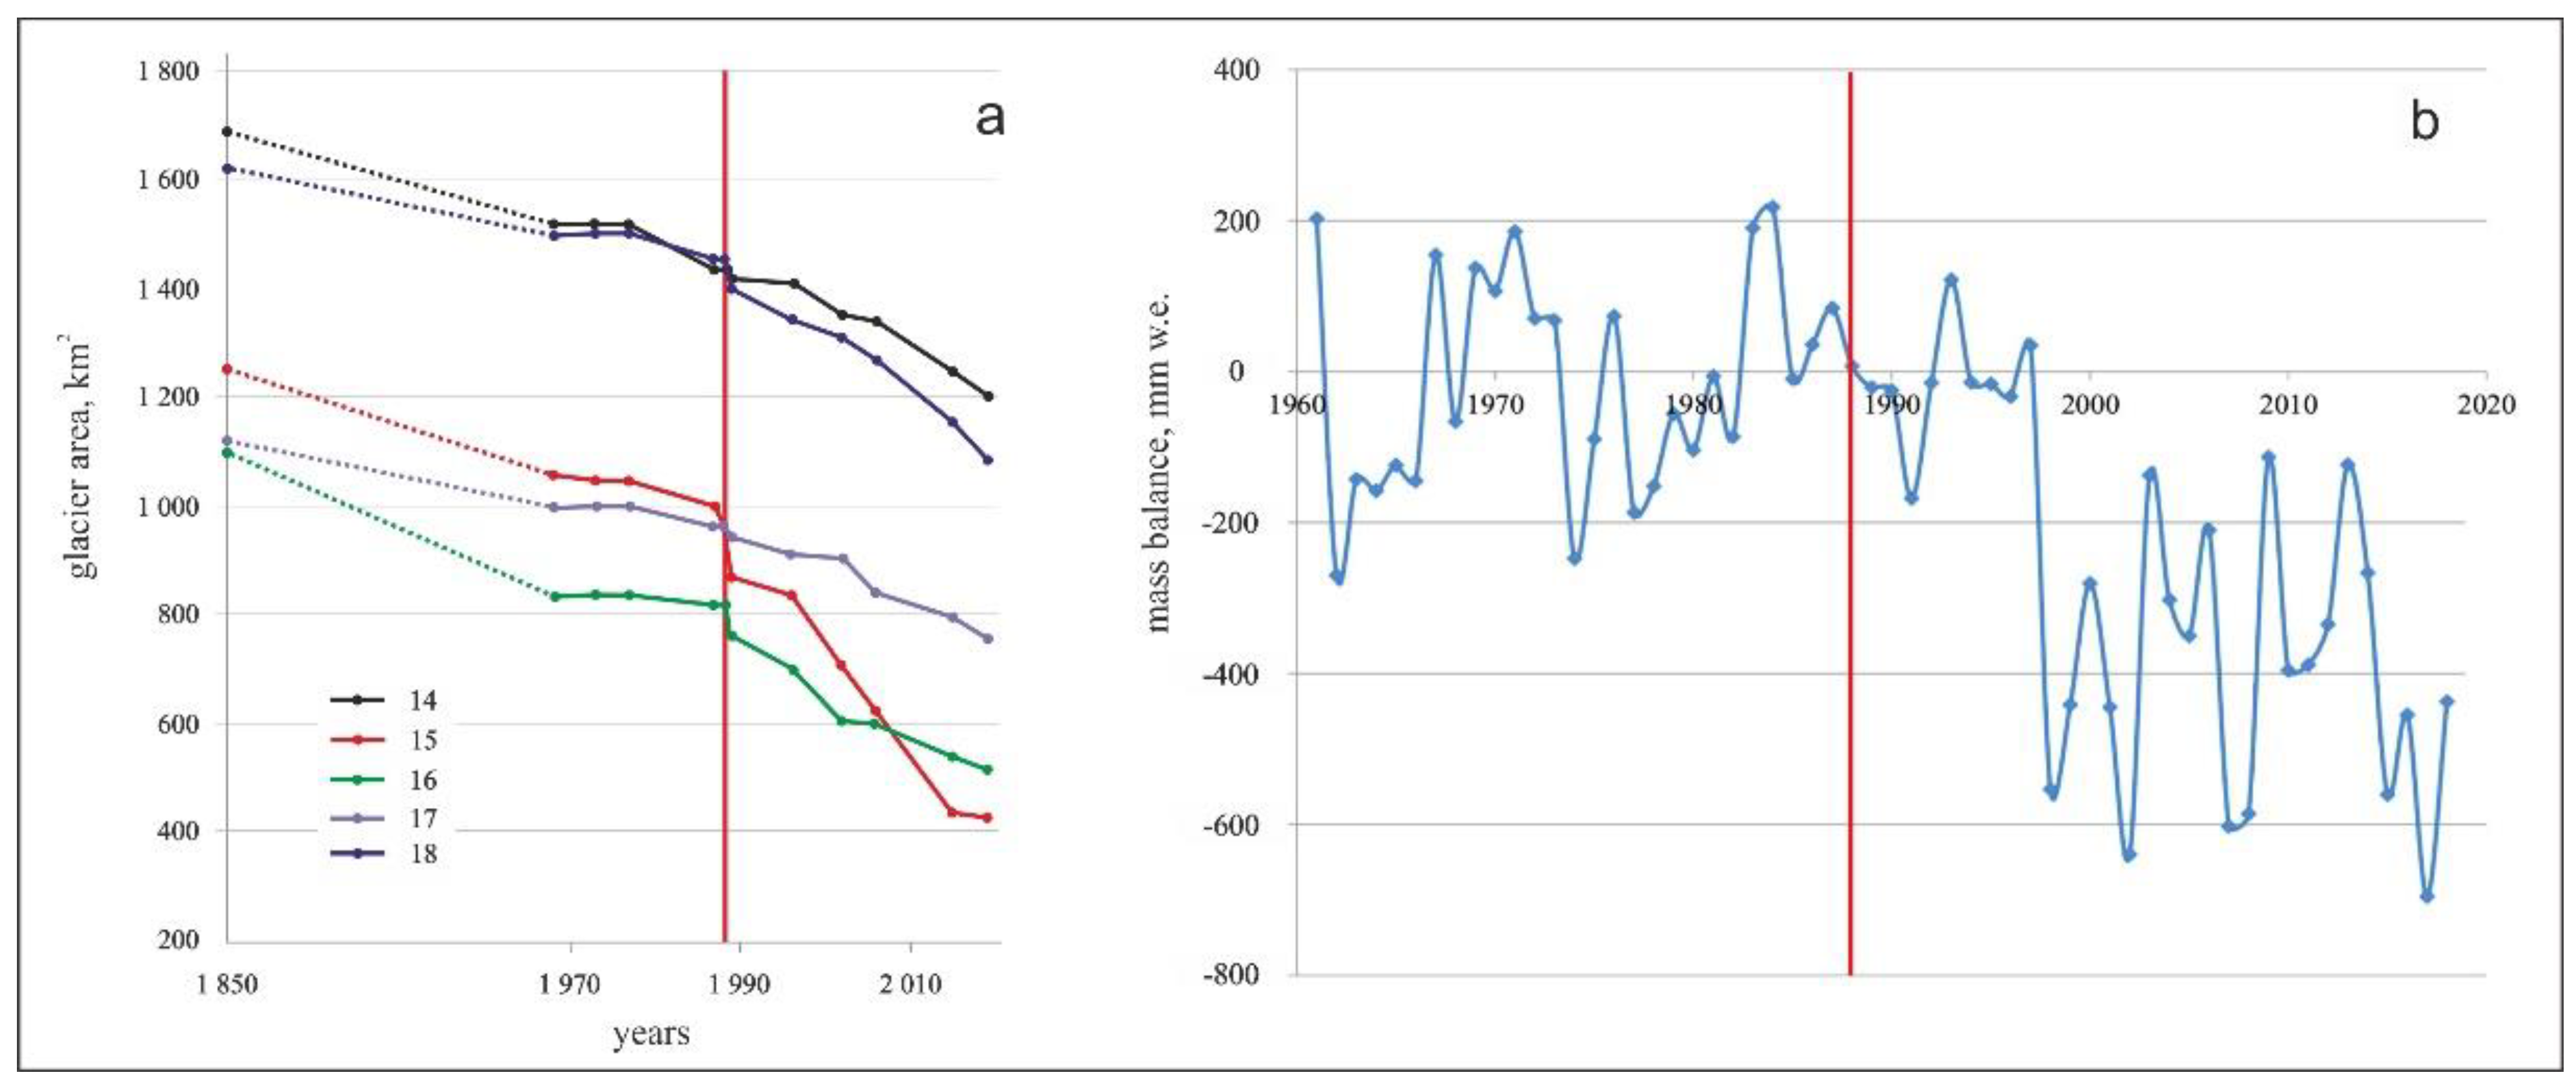
4.1. Shrinkage of Glacier No. 15
4.2. Mass Balance of Glacier No. 15 before and after the 1988 Tsambagarav Earthquake
4.3. Estimation of the Glacier No. 15 Thickness
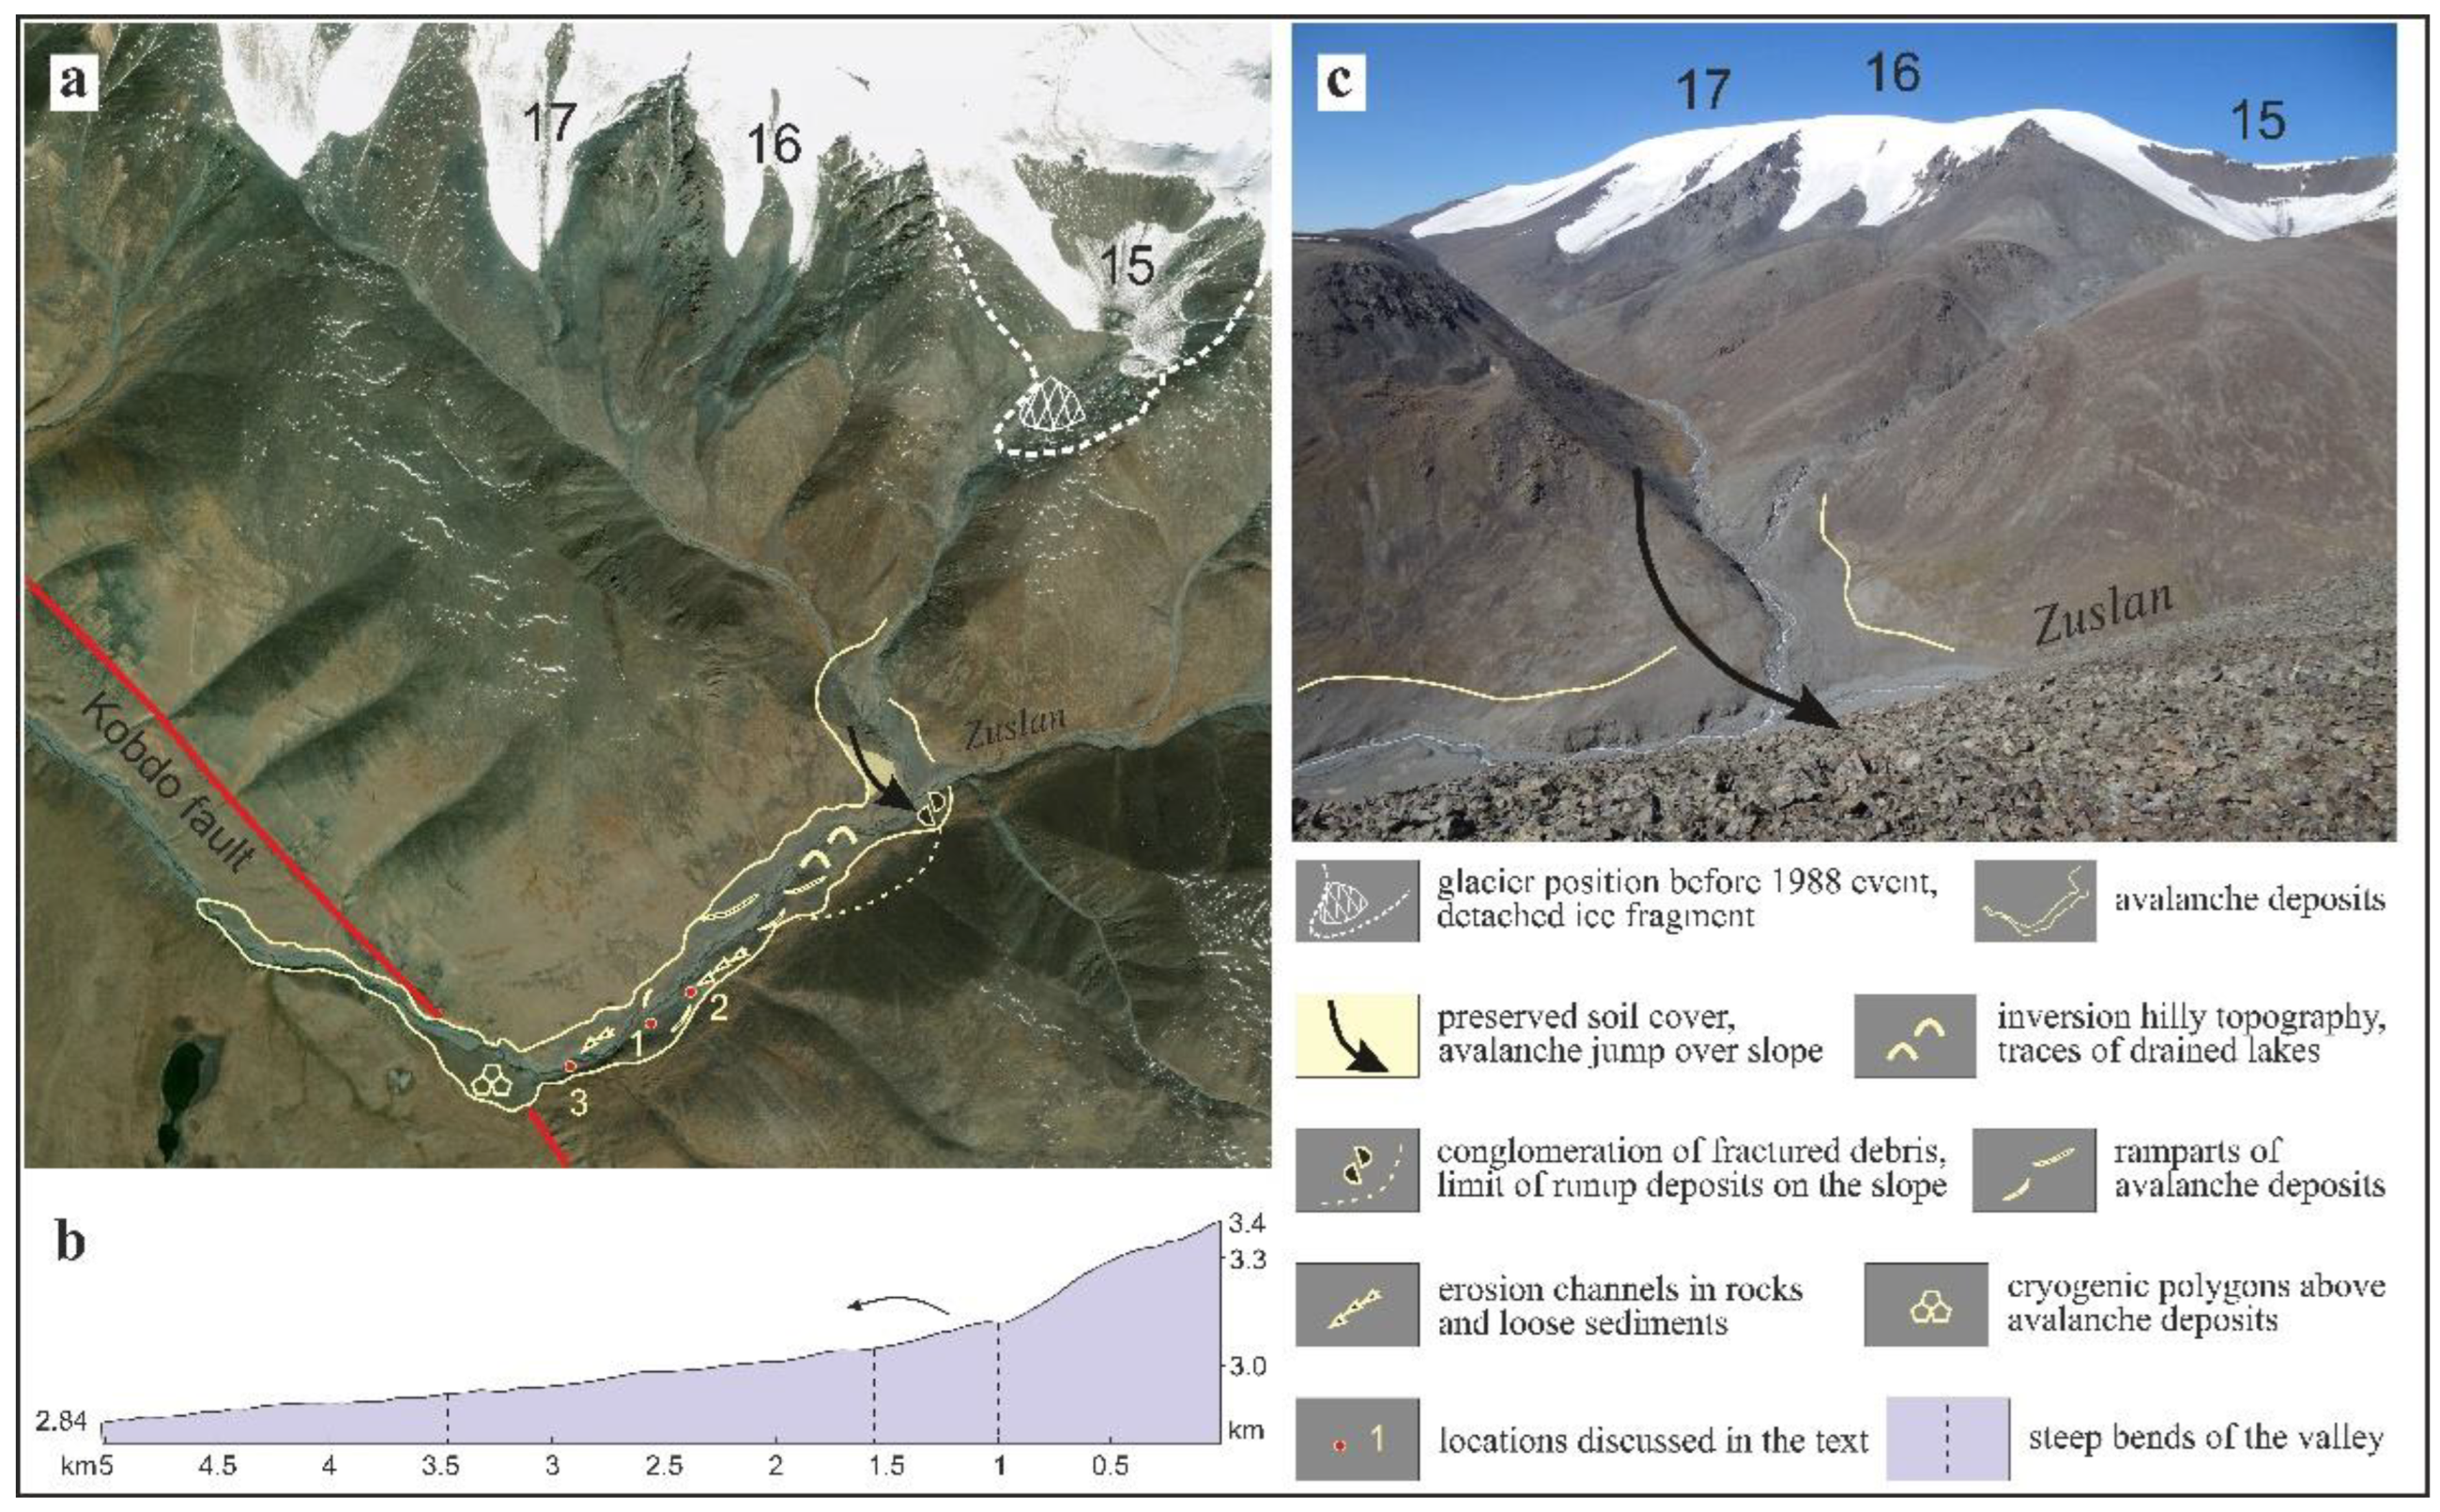
4.4. Parameters of the Ice–Rock Avalanche
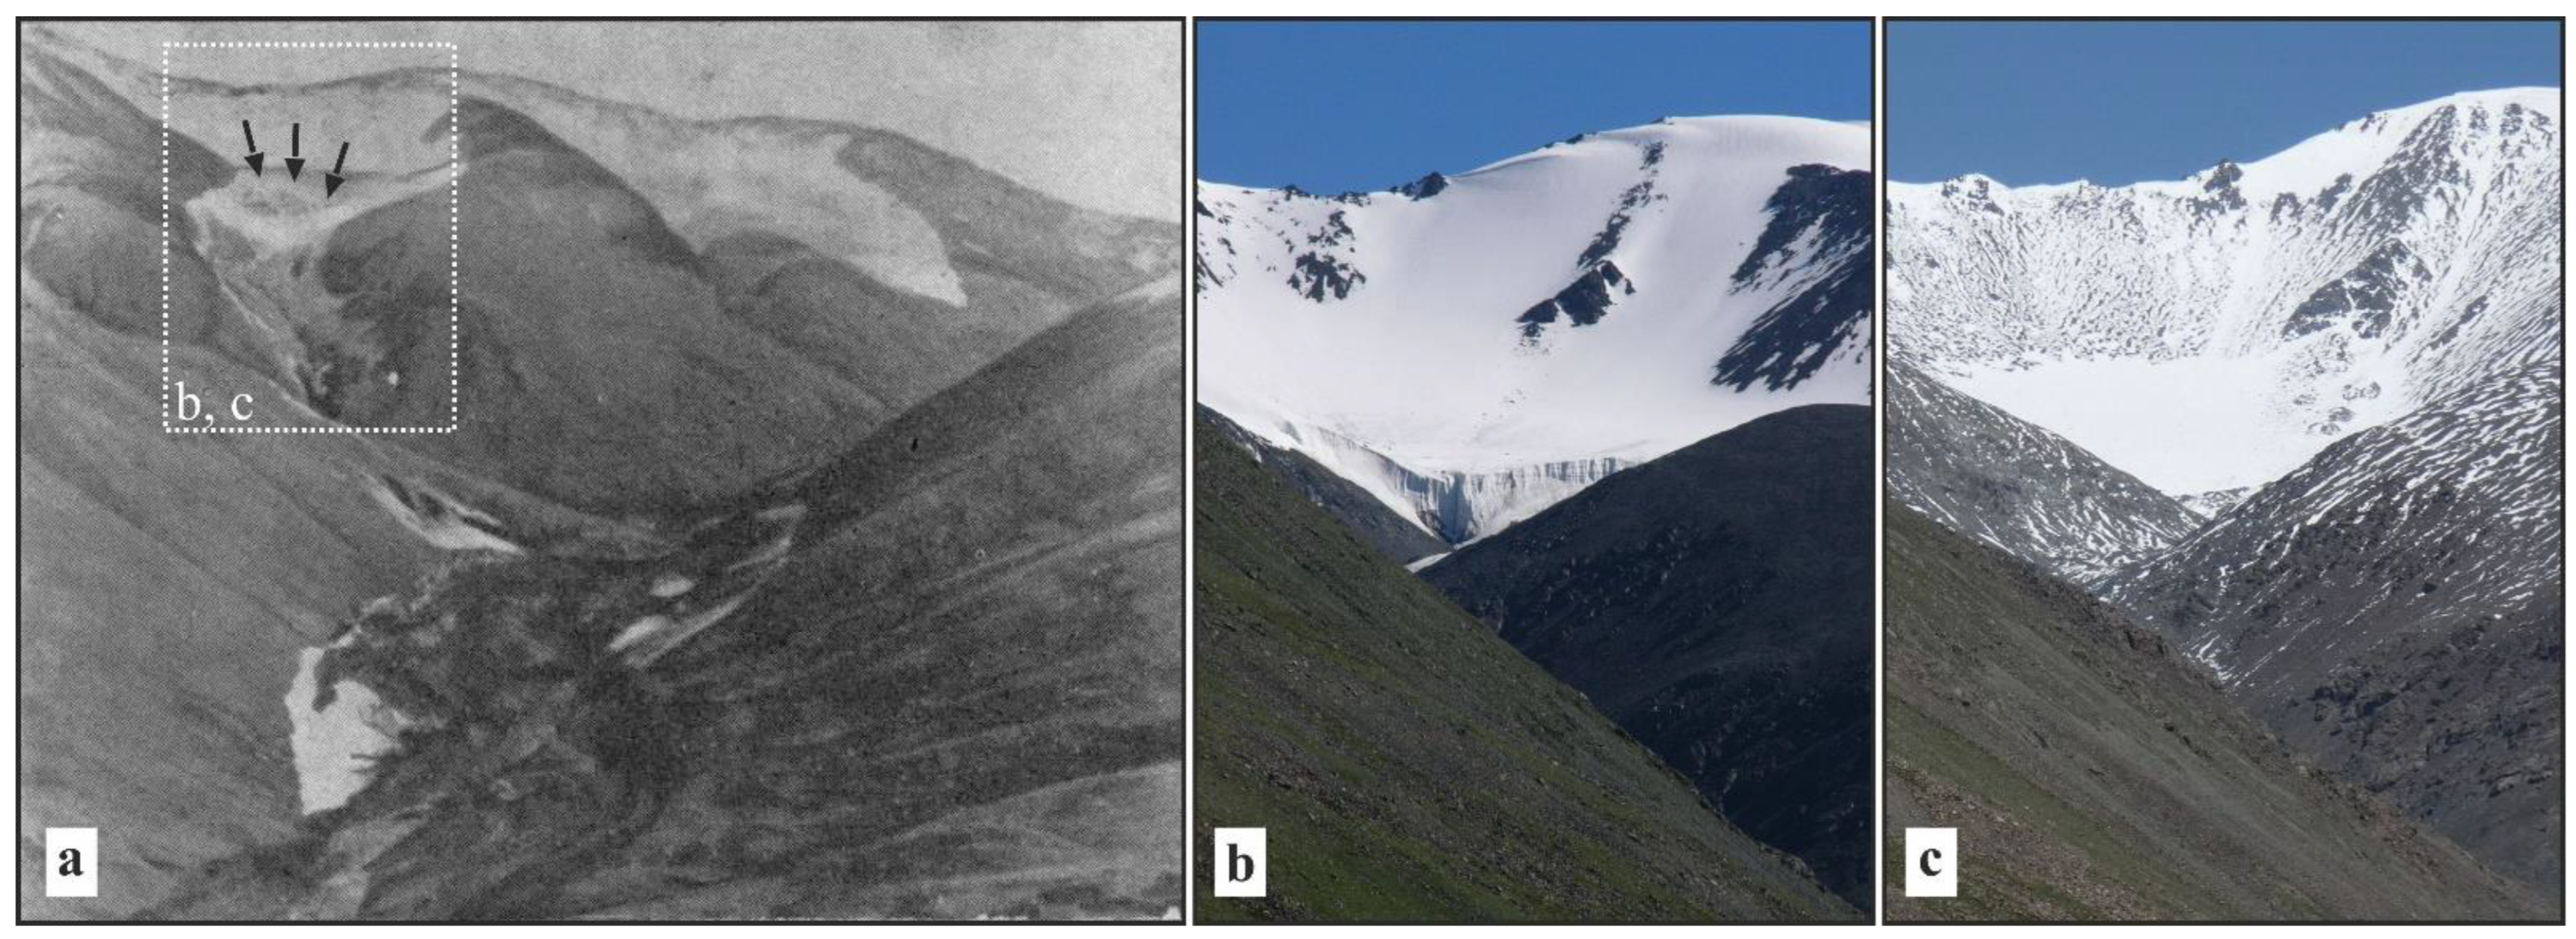
4.5. Changes in the Accumulation Zone of Ice–Rock Avalanches since 1988
5. Discussion
5.1. Retreating Rate of Glacier No. 15 in Comparison with Neighboring Glaciers in the Upper Part of the Zuslan River Basin
5.2. The Probable Mechanism of Ice–Rock Avalanche on an “Air Cushion”
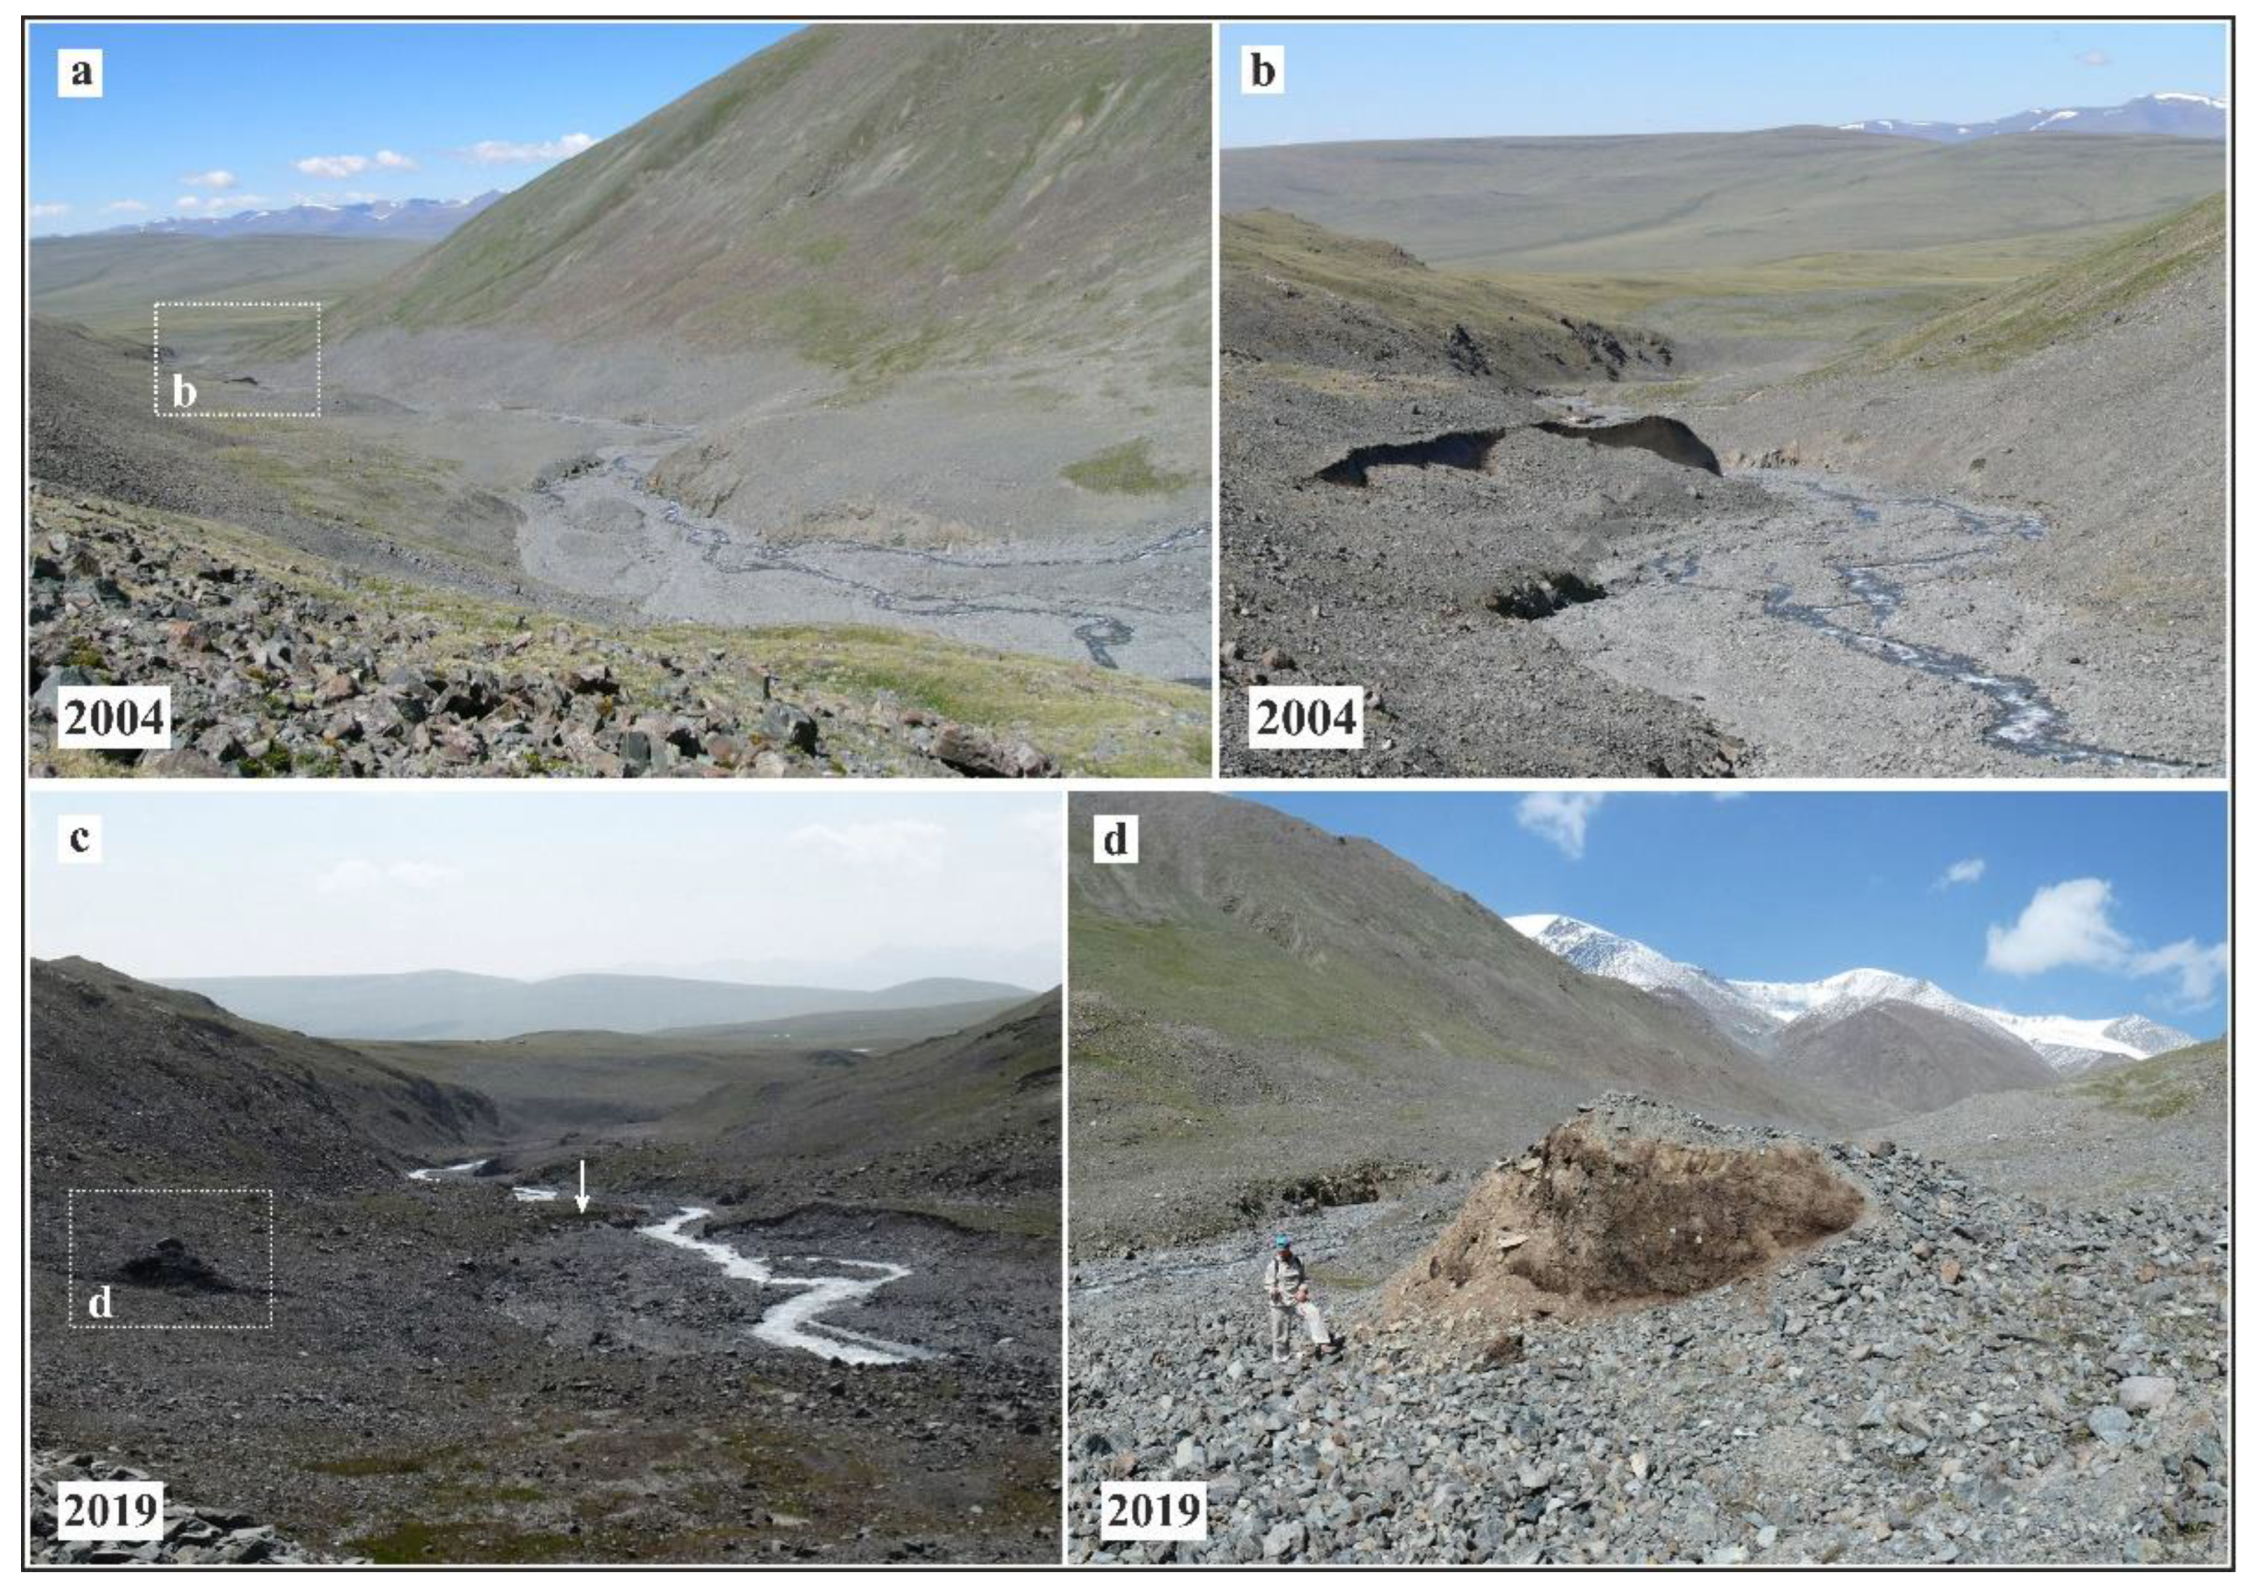
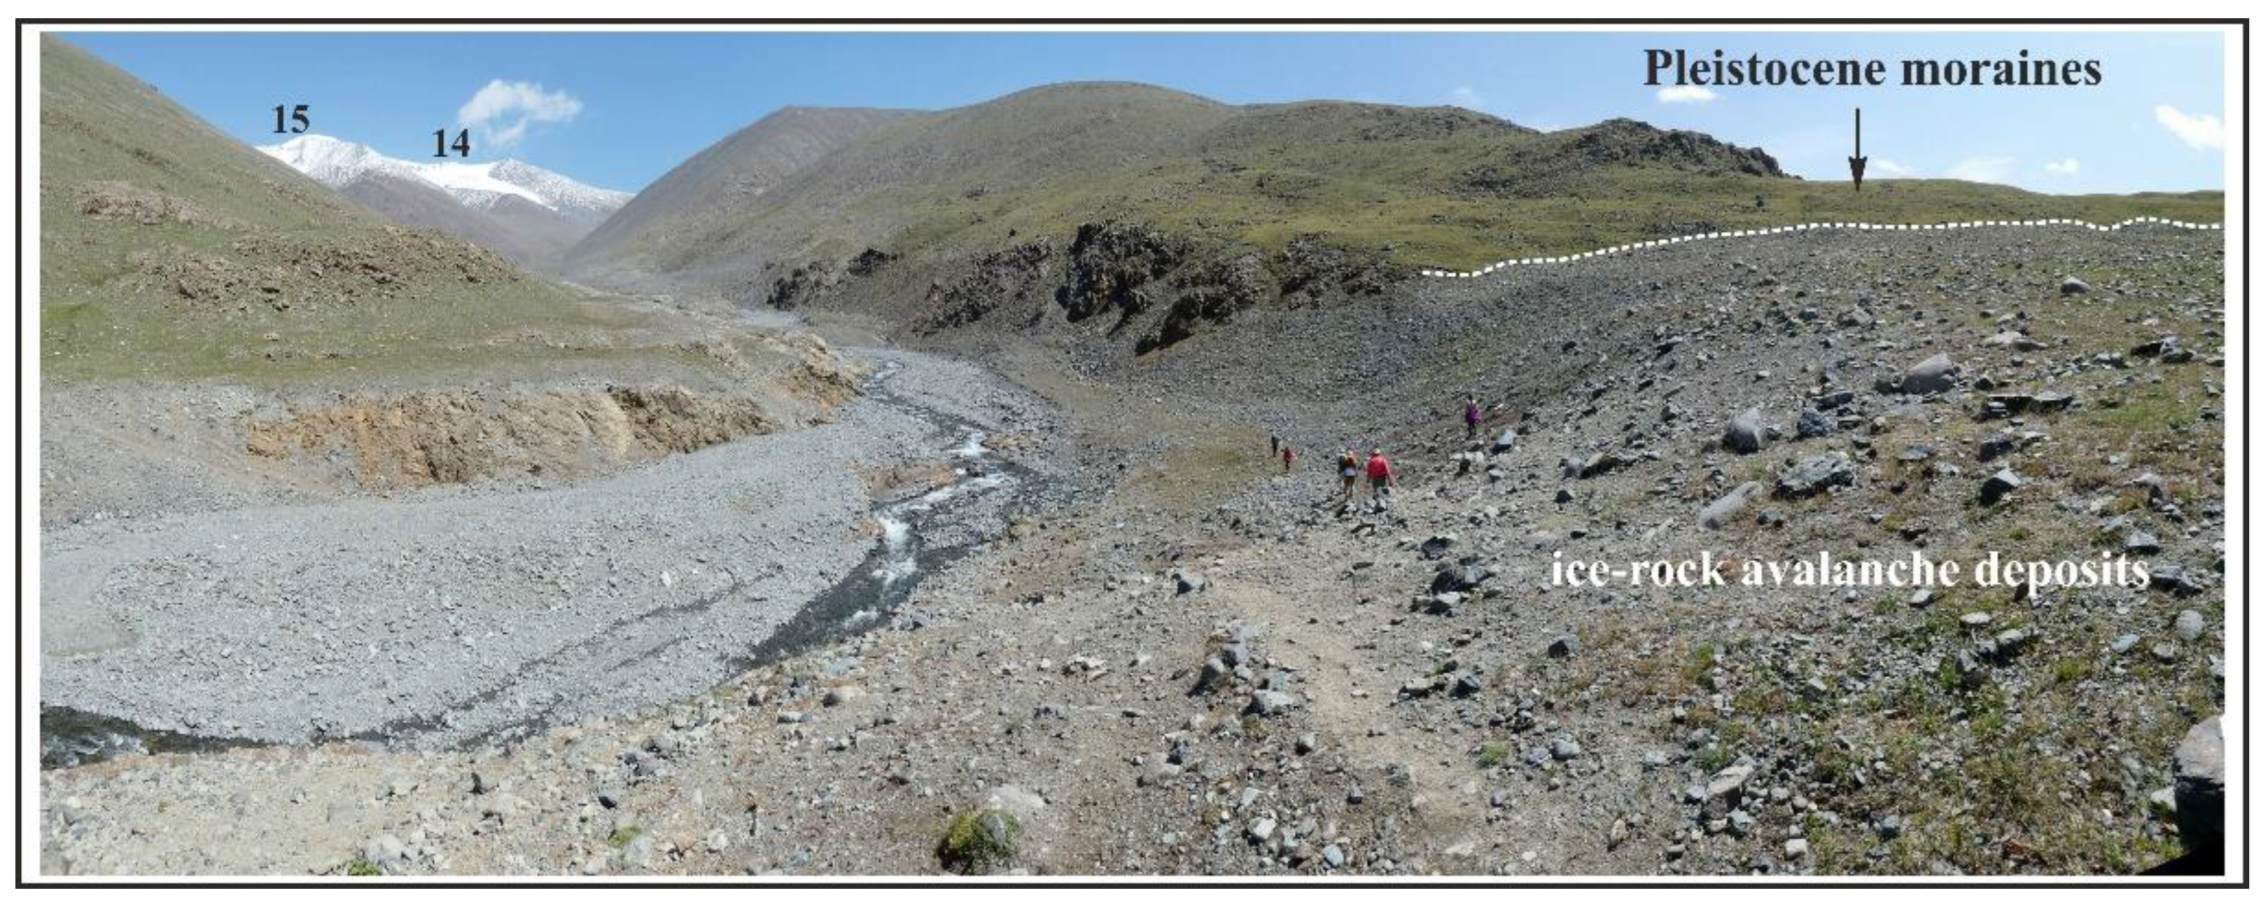
5.3. The Rate of Ice Melting and New Landforms Formation in the Avalanche Accumulation Zone over the Past 30 Years
6. Conclusions
- A glacier that lost a significant volume of ice and 10% of area as a result of the 1988 Tsambagarav earthquake and associated ice–rock avalanche, degraded much faster than neighboring glaciers of similar size on the slope of the same exposition. From 1988 to 2015, its area decreased by 56%. It became the only kar glacier among all neighboring hanging glaciers, and by 2019 it had already split into two separate glaciers inside the kar.
- A key role in the rapid acceleration of the detached ice block could be played by the influx of additional mass as a result of the collapse of the snow–ice cornice in the accumulation zone. This scenario is confirmed by the anomalous length of the avalanche path, the rapid degradation of ice in the accumulation zone and the established ice deficit in the detached part of the glacier tongue in comparison with the initial estimates [16].
- Under climatic conditions of the Mongolian Altai, the ice melting in the body of an ice–rock avalanche outside the nival–glacial zone occurred mainly in the first 10–15 years after the event (by 2004). Ice completely melted 30 years later (by 2019 or a bit earlier). Such long duration is explained by the high content of debris material—about half of the volume.
- Deposits and landforms resulting from the ice melting in avalanche deposits resemble glacial deposits and landforms. Debris cover in the lower part of the valley completely repeats the topography of underlying moraines, which, if ignorant with their avalanche origin, can lead to an incorrect interpretation of the age of glacial events in the Tsambagarav ridge.
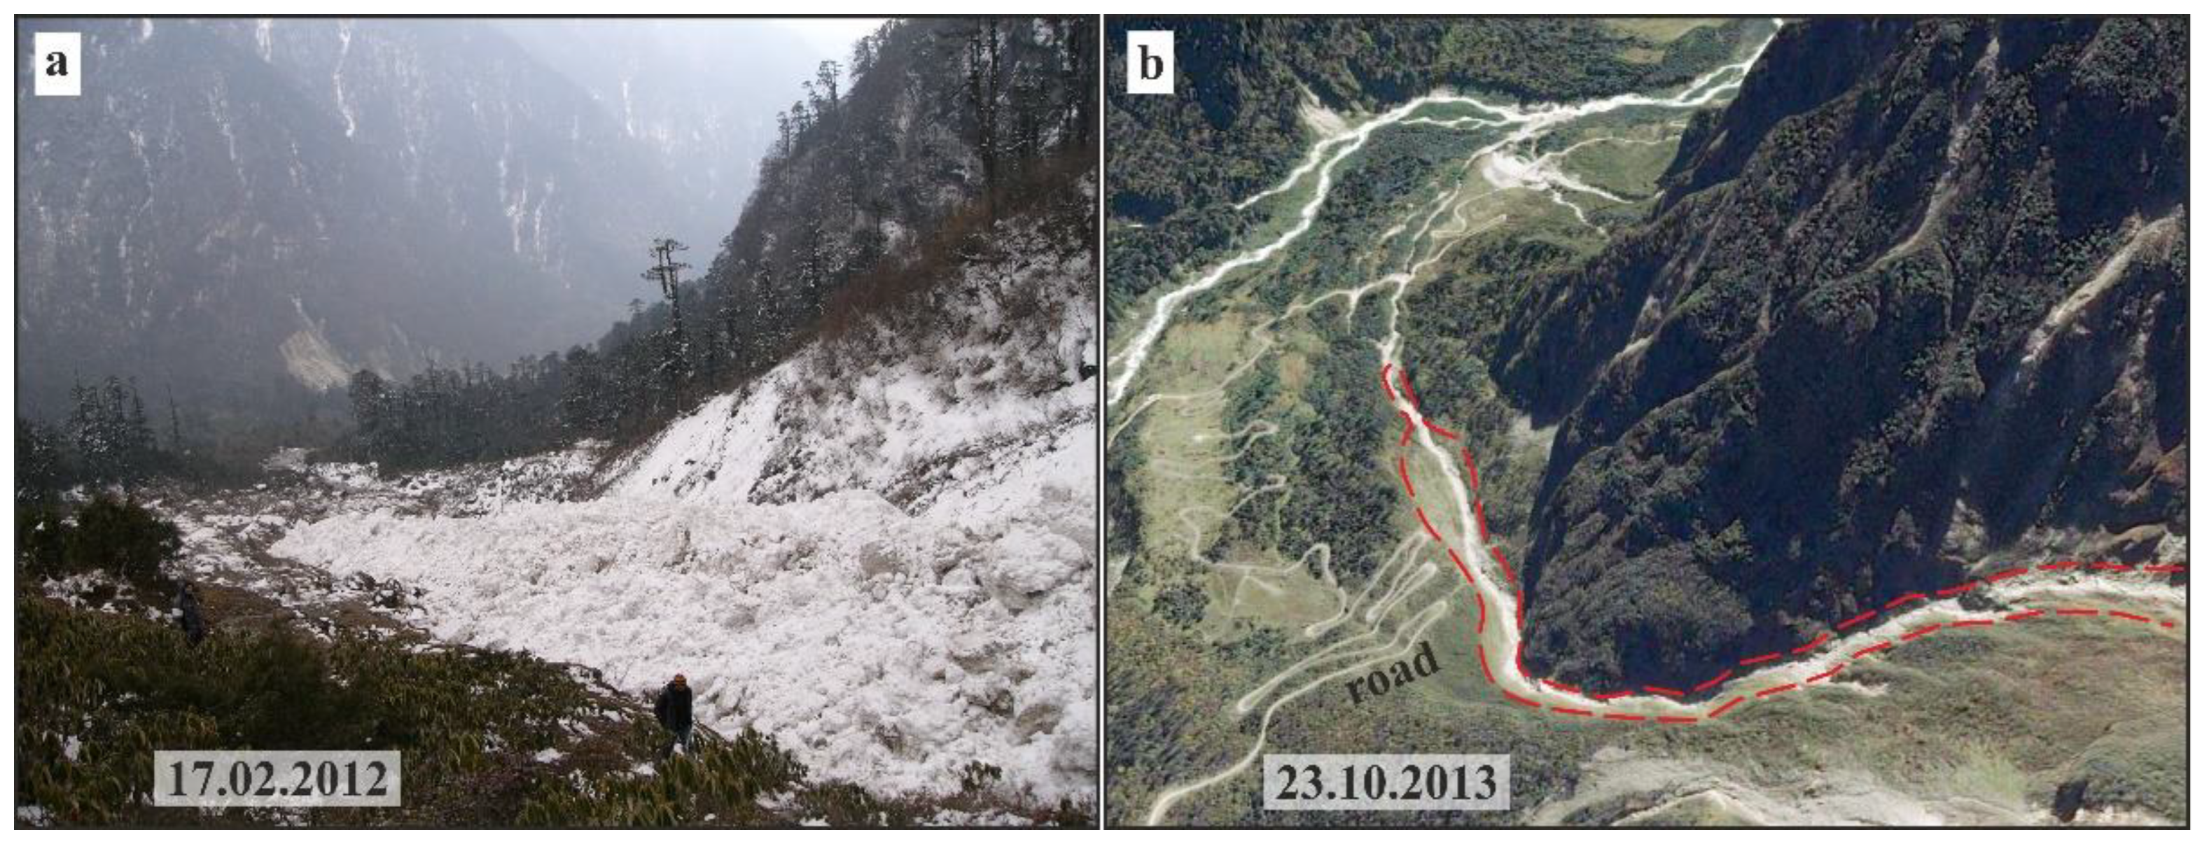
- The 1988 Tsambagarav earthquake demonstrated the real possibility of a cataclysmic input of a large volume of ice–rock material from the upper nival–glacial zone to the foot of the Altai high-mountain ranges. It should be taken into account in planning of current economic activities. The rapid erasing of avalanche surface effects by subsequent geomorphological processes suggests that large avalanches, including those of a seismic origin, took place in the Altai more often than it can now be established in the topography.
Author Contributions
Funding
Informed Consent Statement
Acknowledgments
Conflicts of Interest
References
- Shahgedanova, M.; Nosenko, G.; Khromova, T.; Muraveyev, A. Glacier shrinkage and climatic change in the Russian Altai from the mid-20th century: An assessment using remote sensing and PRECIS regional climate model. J. Geophys. Res. Atmos. 2010, 115, D16107. [Google Scholar] [CrossRef] [Green Version]
- Narozhniy, Y.; Zemtsov, V. Current state of the Altai glaciers (Russia) and trends over the period of instrumental observations 1952–2008. Ambio 2011, 40, 575–588. [Google Scholar] [CrossRef] [PubMed] [Green Version]
- Kotlyakov, V.M.; Chernova, L.P.; Zverkova, N.M.; Khromova, T.E. The one-and-a-half-century reduction of Altai glaciers in Russia and Kazakhstan. Earth Sci. 2014, 458, 1307. [Google Scholar] [CrossRef]
- Wei, J.F.; Liu, S.Y.; Xu, J.L.; Guo, W.Q.; Bao, W.J.; Shangguan, D.H.; Jiang, Z.L. Mass loss from glaciers in the Chinese Altai Mountains between 1959 and 2008 revealed based on historical maps, SRTM, and ASTER images. J. Mt. Sci. 2015, 12, 330–343. [Google Scholar] [CrossRef]
- Pan, C.G.; Pope, A.; Kamp, U.; Dashtseren, A.; Walther, M.; Syromyatina, M.V. Glacier recession in the Altai Mountains of Mongolia in 1990–2016. Geogr. Ann. Ser. A Phys. Geogr. 2018, 100, 185–203. [Google Scholar] [CrossRef]
- Vandandorj, S.; Munkhjargal, E.; Boldgiv, B.; Gantsetseg, B. Changes in event number and duration of rain types over Mongolia from 1981 to 2014. Environ. Earth Sci. 2017, 76, 70. [Google Scholar] [CrossRef] [Green Version]
- Kadota, T.; Gombo, D. Recent glacier variations in Mongolia. Ann. Glaciol. 2007, 46, 185–188. [Google Scholar]
- Otgonbayar, D. Modern Glaciation of the Mongolian Altai (by the Example of the Munhkhairkhan and Sutai Ranges, the Tsambagarav Mountain Knot); Business Connect: Barnaul, Russia, 2013; 156p. (In Russian) [Google Scholar]
- Ganyushkin, D.A.; Otgonbayar, D.; Chistyakovm, K.V.; Kunaeva, E.P.; Volkov, I.V. Recent glacierization of the Tsambagarav ridge (North-Western Mongolia) and its changes since the Little Ice Age maximum. Ice Snow. 2016, 4, 437–452. (In Russian) [Google Scholar] [CrossRef]
- Schneider, D.; Huggel, C.; Haeberli, W.; Kaitna, R. Unraveling driving factors for large rock–ice avalanche mobility. Earth Surf. Process. Landf. 2011, 36, 1948–1966. [Google Scholar] [CrossRef]
- Kääb, A.; Jacquemart, M.; Gilbert, A.; Leinss, S.; Girod, L.; Huggel, C.; Falaschi, D.; Ugalde, F.; Petrakov, D.; Chernomorets, S.; et al. Sudden large-volume detachments of low-angle mountain glaciers–more frequent than thought. Cryosphere 2021, 15, 1751–1785. [Google Scholar] [CrossRef]
- Shugar, D.H.; Jacquemart, M.; Shean, D.; Bhushan, S.; Upadhyay, K.; Sattar, A.; Westoby, M.J. A massive rock and ice avalanche caused the 2021 disaster at Chamoli, Indian Himalaya. Science 2021, 373, 300–306. [Google Scholar] [CrossRef] [PubMed]
- Petrakov, D.A.; Chernomorets, S.S.; Evans, S.G.; Tutubalina, O.V. Catastrophic glacial multi-phase mass movements: A special type of glacial hazard. Adv. Geosci. 2008, 14, 211–218. [Google Scholar] [CrossRef] [Green Version]
- Huggel, C.; Zgraggen-Oswald, S.; Haeberli, W.; Kääb, A.; Polkvoj, A.; Galushkin, I.; Evans, S.G. The 2002 rock/ice avalanche at Kolka/Karmadon, Russian Caucasus: Assessment of extraordinary avalanche formation and mobility, and application of Quick-Bird satellite imagery. Nat. Hazards Earth Syst. Sci. 2005, 5, 173–187. [Google Scholar] [CrossRef] [Green Version]
- Evans, S.G.; Delaney, K.B. Catastrophic mass flows in the mountain glacial environment. In Snow and Ice-related Hazards, Risks, and Disasters; Hazards and Disasters Series; Haeberli, W., Whitemann, C., Eds.; Elsevier: Amsterdam, The Netherlands, 2015; pp. 563–606. [Google Scholar]
- Avdeev, V.A.; Nartov, S.V.; Balzhinnyam, I.; Monhoo, D.; Erdenbileg, B. Tsambagarav earthquake July 23, 1988 (Western Mongolia). Russ. Geol. Geophys. 1989, 11, 118–124. (In Russian) [Google Scholar]
- Scheidegger, A.E. Physical Aspects of Natural Catastrophes; Elsevier: New York, NY, USA, 1975; 289p. [Google Scholar]
- Khilko, S.D.; Kurushin, R.A.; Kochetkov, V.M.; Misharina, L.A.; Melnikova, V.I.; Gileva, N.A.; Lastochkin, S.V.; Balzhinnyam, I.; Monhoo, D. Earthquakes and the Fundamentals of Seismic Zoning of Mongolia. In Joint Soviet-Mongolian Research Geological Expedition; Is. 41; Nauka: Moscow, Russia, 1985; 224p. (In Russian) [Google Scholar]
- Tapponnier, P.; Molnar, P. Active faulting and Cenozoic tectonics of the Tien Shan, Mongolia, and Baykal regions. J. Geophys. Res. Solid Earth 1979, 84, 3425–3459. [Google Scholar] [CrossRef]
- Baljinnyam, I.; Bayasgalan, A.; Borisov, B.A.; Cisternas, A.; Dem’yanovich, M.G.; Ganbaatar, L.; Kochetkov, V.M.; Kurushin, R.A.; Molnar, P.; Philip, H.; et al. Ruptures of major earthquakes and active deformation in Mongolia and its surroundings. Gcol. Soc. Am. Mem. 1993, 181, 62. [Google Scholar]
- Demianovich, M.G.; Kljuchevskiy, A.V.; Demianovich, V.M. The main faults of Mongolia and their role in the seismic zoning of the territory. Lithosphere 2008, 3, 3–13. (In Russian) [Google Scholar]
- Molnar, P.; Tapponnier, P. Cenozoic tectonics of Asia: Effects of a continental collision. Science 1975, 189, 419–426. [Google Scholar] [CrossRef]
- Dobretsov, N.L.; Buslov, M.M.; Delvaux, D.; Berzin, N.A.; Ermikov, V.D. Meso- and Cenozoic tectonics of the Central Asian mountain belt: Effects of lithospheric plate interaction and mantle plumes. Int. Geol. Rev. 1996, 38, 430–466. [Google Scholar] [CrossRef]
- Devyatkin, E.V. Cenozoic of Inner Asia; Nauka: Moscow, Russia, 1981; 196p. (In Russian) [Google Scholar]
- Herren, P.A.; Eichler, A.; Machguth, H.; Papina, T.; Tobler, L.; Zapf, A.; Schwikowski, M. The onset of Neoglaciation 6000 years ago in western Mongolia revealed by an ice core from the Tsambagarav mountain range. Quat. Sci. Rev. 2013, 69, 59–68. [Google Scholar] [CrossRef]
- Bantcev, D.V.; Ganyushkin, D.A.; Chistyakov, K.V.; Volkov, I.V.; Ekaykin, A.A.; Veres, A.N.; Tokarev, I.V.; Shtykova, N.B.; Andreeva, T.A. The Components of the Glacial Runoff of the Tsambagarav Massif from Stable Water Isotope Data. Geosciences 2019, 9, 297. [Google Scholar] [CrossRef] [Green Version]
- Nikitin, S.A. Regularities in the distribution of glacial ice in the Russian Altai, assessment of reserves and dynamics. Mater. Glaciol. Investig. 2009, 107, 87–96. (In Russian) [Google Scholar]
- Paul, F.; Linsbauer, A. Modeling of glacier bed topography from glacier outlines, central branch lines and a DEM. Int. J. Geogr. Inf. Sci. 2012, 26, 1173–1190. [Google Scholar] [CrossRef]
- Haeberli, W.; Hölzle, M. Application of inventory data for estimating characteristics of and regional climate-change effects on mountain glaciers: A pilot study with the European Alps. Ann. Glaciol. 1995, 21, 206–212. [Google Scholar] [CrossRef] [Green Version]
- Koreisha, M.M. Glaciation of the Verkhoyansk-Kolyma Region; Russian Academy of Sciences: Moscow, Russia, 1991; 144p. (In Russian) [Google Scholar]
- Glazyrin, G.E. Distribution and Regime of Mountain Glaciers; Gidrometeoizdat: Leningrad, Russia, 1985; 181p. (In Russian) [Google Scholar]
- Ganyushkin, D.A. Wurm and Holocene Evolution of Climate and Glaciation of the Mongun-Taiga Massif (Southwestern Tuva). Ph.D. Thesis, Sant-Petersburg State University, Sant-Petersburg, Russia, 2001; 195p. (In Russian). [Google Scholar]
- Reimer, P.J.; Bard, E.; Bayliss, A.; Beck, J.W.; Blackwell, P.G.; Bronk Ramsey, C.; Buck, C.E.; Cheng, H.; Edwards, R.L.; Friedrich, M.; et al. IntCal13 and MARINE13 radiocarbon age calibration curves 0–50000 years cal BP. Radiocarbon 2013, 55, 1869–1887. [Google Scholar] [CrossRef] [Green Version]
- Tian, L.D.; Yao, T.D.; Gao, Y.; Thompson, L.; Mosley-Thompson, E.; Muhammad, S.; Zong, J.B.; Wang, C.; Jin, S.Q.; Li, Z.G. Two glaciers collapse in western Tibet. J. Glaciol. 2017, 63, 194–197. [Google Scholar] [CrossRef] [Green Version]
- Gilbert, A.; Leinss, S.; Kargel, J.; Kääb, A.; Gascoin, S.; Leonard, G.; Berthier, E.; Karki, A.; Yao, T. Mechanisms leading to the 2016 giant twin glacier collapses, Aru Range, Tibet. Cryosphere 2018, 12, 2883–2900. [Google Scholar] [CrossRef] [Green Version]
- Kääb, A.; Leinss, S.; Gilbert, A.; Buhler, Y.; Gascoin, S.; Evans, S.G.; Bartelt, P.; Berthier, E.; Brun, F.; Chao, W.A.; et al. Massive collapse of two glaciers in western Tibet in 2016 after surge-like instability. Nat. Geosci. 2018, 11, 114–120. [Google Scholar] [CrossRef] [Green Version]
- Khromovskih, V.S. Stone Dragon; Idea: Moscow, Russia, 1984; 156p. (In Russian) [Google Scholar]
- Butvilovsky, V.V. Paleogeography of the Last Glaciation and the Holocene of Altai: A Catastrophic Events Model; Tomsk University Press: Tomsk, Russia, 1993; 253p. (In Russian) [Google Scholar]
- Rogozhin, E.A.; Platonova, S.G. Strong Earthquake Source Zones of Gorny Altai in the Holocene; UIPE RAS: Moscow, Russia, 2002; 130p. (In Russian) [Google Scholar]


| Glacier Number after [9] | Length, km | Lower Point, m a.s.l. | Upper Point, m a.s.l. | Average Altitude, m a.s.l. | Mode, m a.s.l. | Average Inclination, Degree | Slope Exposition (South), Degree |
|---|---|---|---|---|---|---|---|
| 14 | 1.693 | 3412 | 4068 | 3768 | 3846 | 22 | 191 |
| 15 | 0.974 | 3445 | 4090 | 3750 | 3649 | 26 | 192 |
| 16 | 0.855 | 3514 | 4158 | 3850 | 4073 | 28 | 190 |
| 17 | 1.019 | 3464 | 4191 | 3870 | 4105 | 26 | 190 |
Publisher’s Note: MDPI stays neutral with regard to jurisdictional claims in published maps and institutional affiliations. |
© 2022 by the authors. Licensee MDPI, Basel, Switzerland. This article is an open access article distributed under the terms and conditions of the Creative Commons Attribution (CC BY) license (https://creativecommons.org/licenses/by/4.0/).
Share and Cite
Agatova, A.; Nepop, R.; Ganyushkin, D.; Otgonbayar, D.; Griga, S.; Ovchinnikov, I. Specific Effects of the 1988 Earthquake on Topography and Glaciation of the Tsambagarav Ridge (Mongolian Altai) Based on Remote Sensing and Field Data. Remote Sens. 2022, 14, 917. https://doi.org/10.3390/rs14040917
Agatova A, Nepop R, Ganyushkin D, Otgonbayar D, Griga S, Ovchinnikov I. Specific Effects of the 1988 Earthquake on Topography and Glaciation of the Tsambagarav Ridge (Mongolian Altai) Based on Remote Sensing and Field Data. Remote Sensing. 2022; 14(4):917. https://doi.org/10.3390/rs14040917
Chicago/Turabian StyleAgatova, Anna, Roman Nepop, Dmitry Ganyushkin, Demberel Otgonbayar, Semen Griga, and Ivan Ovchinnikov. 2022. "Specific Effects of the 1988 Earthquake on Topography and Glaciation of the Tsambagarav Ridge (Mongolian Altai) Based on Remote Sensing and Field Data" Remote Sensing 14, no. 4: 917. https://doi.org/10.3390/rs14040917
APA StyleAgatova, A., Nepop, R., Ganyushkin, D., Otgonbayar, D., Griga, S., & Ovchinnikov, I. (2022). Specific Effects of the 1988 Earthquake on Topography and Glaciation of the Tsambagarav Ridge (Mongolian Altai) Based on Remote Sensing and Field Data. Remote Sensing, 14(4), 917. https://doi.org/10.3390/rs14040917