Article

Glacier Recession in the Altai Mountains after the LIA Maximum

1
Institute of Earth Science, Saint-Petersburg State University, Universitetskaya nab. 7/9, 199034 Saint-Petersburg, Russia
2
State Hydrological Institute, Vasilyevsky Island, 2nd Line, 23, 199004 Saint-Petersburg, Russia
*
Author to whom correspondence should be addressed.
Remote Sens. 2022, 14(6), 1508; https://doi.org/10.3390/rs14061508
Submission received: 29 December 2021 / Revised: 12 March 2022 / Accepted: 17 March 2022 / Published: 20 March 2022
(This article belongs to the Special Issue The Cryosphere Observations Based on Using Remote Sensing Techniques)

Abstract

:
The study aims to reconstruct the Altai glaciers at the maximum of the LIA, to estimate the reduction of the Altai glaciers from the LIA maximum to the present, and to analyze glacier reduction rates on the example of the Tavan Bogd mountain range. Research was based on remote sensing and field data. The recent glaciation in the southern part of the Altai is estimated (1256 glaciers with the total area of 559.15 ± 31.13 km2), the area of the glaciers of the whole Altai mountains is estimated at 1096.55 km2. In the southern part of Altai, 2276 glaciers with a total area of 1348.43 ± 56.16 km2 were reconstructed, and the first estimate of the LIA glacial area for the entire Altai mountain system was given (2288.04 km2). Since the LIA, the glaciers decrease by 59% in the southern part of Altai and by 47.9% for the whole Altai. The average increase in ELA in the southern part of Altai was 106 m. The larger increase of ELA in the relatively humid areas was probably caused by a decrease in precipitation. Glaciers in the Tavan Bogd glacial center degraded with higher rates after 1968 relative to the interval between 1850–1968. One of the intervals of fast glacier shrinkage in 2000–2010 was caused by a dry and warm interval between 1989 and 2004. However, the fast decrease in glaciers in 2000–2010 was mainly caused by the shrinkage or disappearance of the smaller glaciers, and large valley glaciers started a fast retreat after 2010. The study results present the first evaluation of the glacier recession of the entire Altai after the LIA maximum.

Graphical Abstract

1. Introduction

Glaciers are natural indicators of climate, sensitive to its changes [1]. This is especially true for the mountain glaciers, which respond more quickly to climate fluctuations due to their smaller size. Mountain glaciers are the main contributors of glacier melt water that causes rises in sea level [2]. Changes in mountain glaciers also have an impact on runoff [3], which is important for water supply of arid territories [3,4,5,6]. Changes in glacial runoff in the mountain areas in some cases cause outbursts of the glacial lakes, sometimes disastrous, activate dangerous exogenous processes [7,8,9]. Consequently, the study of the dynamics of mountain glaciers is of great scientific and economic importance [10].
Altai Mountains is a mountain system in Asia, in the south of Siberia and in Central Asia, consisting of high-mountain (the highest point is mount Belukha, 4506 m a.s.l.) and mid-mountain ranges, separated by deep river valleys and vast intramountain and intermountain basins. It covers an area of over 300,000 km2 and extends approximately 2000 km in a northwest-southeast direction. It is located on the territory of four countries: the Russian Federation, China, Mongolia, and Kazakhstan (Figure 1).
The Altai mountainous country has the shape of a triangle in terms of the sharpest peak directed to the southeast. In the central and southeastern parts, many mountain ranges exceed 4000 m in maximum elevation, and intermontane depressions are at elevation of 1800–2300 m. In the northwestern part, medium-altitude ridges prevail with maximum altitude of less than 3000 m. The climate also changes from northwest to southeast: in the northern and northwest parts of Altai, on the territory of Russia, the amount of precipitation reaches 1000–2500 mm per year. To the southeast, aridity is increasing: in the territory of the Mongolian Altai, the amount of precipitation in the highlands decreases to 200–400 mm, and in the basins does not exceed 200 mm. About 80–85% of the annual precipitation falls in the warm half of the year, most of them come from the cyclones from the west. Winter precipitation is low due to the dominance of the Asian anticyclone from November. The mean annual temperatures are negative, excluding the low (less than 1000 m a.s.l.) north-western periphery. Summer temperatures in conditions of a rugged relief are controlled by cloudiness and the values of the altitude thermal gradient, which increase from 0.5 to 0.7 degrees per 100 m from northwest to southeast [11]. Generally, within the glaciated part of Altai the temperature at level 2500 m a.s.l. ranges from 5–6 °C in the northwest to 9–10 °C in the southeast [12]. The general trend of warming and aridization in the direction from northwest to southeast is reflected in an increase of equilibrium line altitude (ELA) from 2600–2700 m a.s.l. in the north-west [11] to 3800 m and more in the south-east [13].
Although the first scientific data on the existence of glaciers in Altai were obtained by Gebler in 1835 [14], until now, almost all estimates of the area and number of modern glaciers in Altai and their recession are limited to its individual parts [15,16,17,18,19,20,21,22,23,24,25]. This is due to the fact that this mountain system is located on the territory of different countries, and since the collapse of the USSR, the problem has only worsened, since the glaciers of the Soviet part of Altai were partly in Kazakhstan and partly in Russia.
Present worldwide trends of glacier recession [26,27,28,29] started after the last global glacial advance, caused by cooling known as the Little Ice Age (LIA) [30]. The maximal extent of LIA glaciers was reached at different time points in different areas: this was during the 17th to 19th century (mostly around 1820 or 1850) in the Alps, in the mid-18th century in Scandinavia, and in the early 18th century in New Zealand or parts of Alaska [31].
The systematic glacier observations first started in the 19th century in the Alps [32] (regular glacier front variation surveys began around 1880); in addition, the region has a large number of historical records, historical maps, repeated photographs, and paintings. Consequently, the time and extent of the maximal glacial advances of the LIA are well known in that region [33,34]. Large valley glaciers in the Alps have retreated since the Little Ice Age maximum around 1850 [34].
Nevertheless, for most glacial regions, including the Altai mountains, there are no direct observation data on the time of the peak of the LIA glacial advances, which makes it difficult to estimate the scale of the subsequent reduction of glaciers. For such regions it is generally possible to reconstruct the glacierized area of the LIA on a geomorphological basis [35,36] by mapping glacial landforms of former maximal glacier stands and lateral or terminal moraines.
After the LIA, the worldwide glacial retreat was uneven. In the Alps this process is also better known: short oscillations or episodes of glacier standstill took place around 1890, 1920, and 1980 with acceleration in the recent decades [27,34,37,38,39]. In the Caucasus the readvances took place in the 1910s, 1920s, and 1970s–1980s [40]. There is less information about some remote areas with a rare population, where most of the data is based on remote sensing and glacier reconstructions [14,23,24,25,26,27]. For example, in the Altai mountains after the discovery of the glaciers in 1835, it was only in 1897 that the systematic measurements of the change in the positions of glacial termini began, even though only a few glaciers in the Russian part of the mountains were affected. This was largely caused by the remoteness of glaciers from roads and populated areas, as well as the location of some glaciers (for example, the second largest glacial center of the Tavan Bogd massif) on the territory of several states at once, which made it difficult to conduct research. With the availability of free access space images covering the period from the 1960s, it became possible to study in relative detail the last phases of glacier reduction after the LIA maximum.
Thus, the main objectives of this study are the following:
  • To reconstruct the Altai glaciers at the maximum of the LIA;
  • To estimate the reduction of the Altai glaciers from the LIA maximum to the present;
  • To analyze glacier reduction rates using the example of the second largest glaciation center in Altai, the Tavan Bogd mountain range at seven time points: LIA maximum, 1968, 1977, 1989, 2000, 2010, 2021.
Taking into account the magnitude of work of reconstructing the glaciers of the LIA maximum for such a large territory, the primary task was to cover the areas previously unexplored in this respect. Therefore, we received results for the territory of the Mongolian, Chinese, east and south of the Russian Altai. For the northwestern regions of Altai, we used the results of reconstructions by other authors [41,42]. However, within the framework of our study, for the first time, an estimate was given of the area, number, and spatial distribution of glaciers in the entire Altai in the LIA maximum and their subsequent reduction. Such a study is important for assessing the rate of transformation of high mountain landscapes and their future changes.

2. Materials and Methods

Our research is based on 3 groups of methods.

2.1. Field Observations

Observations of the dynamics of glaciers relate mainly to the period of their reduction after the LIA maximum. The time of the LIA maximum in Altai was not recorded by direct observations. The first observations of the position of the edge of the glacier were made by Gebler in 1835 on the Katunsky glacier [14]. In 1835, the glacier may still have been advancing, as indicated on the basis of geomorphological data by Okishev [41]. According to his opinion, this advance ended in the second half of the 1830s. In 1880 when Yadrintsev visited the glacier, it had already retreated from its position in 1835 by 350–380 m, and by 1895 the edge of the glacier was 384 m away from it [41]. Thus, at least for the Katunsky glacier, it is known that its last advance during the LIA ended in the interval 1835–1880, and most likely several years after 1835. From 1897 to 1937, the glacier retreated with an average speed of 15 m per year, with the highest rates of reduction occurring in 1935–1937 (20.7 m per year). In subsequent years, the periods of rapid shortening of the glacier length, with rates reaching 45 m per year, were separated by episodes of slower retreat of the glacier in 1937–1952, 1961–1965, 1970–1972, 1986–1989, and 1993 [43]. In the North Chuya Range, halting of the glacier retreat occurred place in 1936, 1940, 1969, and 1993 (Right Aktru) and in 1911, 1936, 1960, 1966, 1979, and 1993 (Malyi Aktru) [44]. There are several larger glaciers in Altai, the dynamics of which is more or less known for at least the first half of the 20th century.
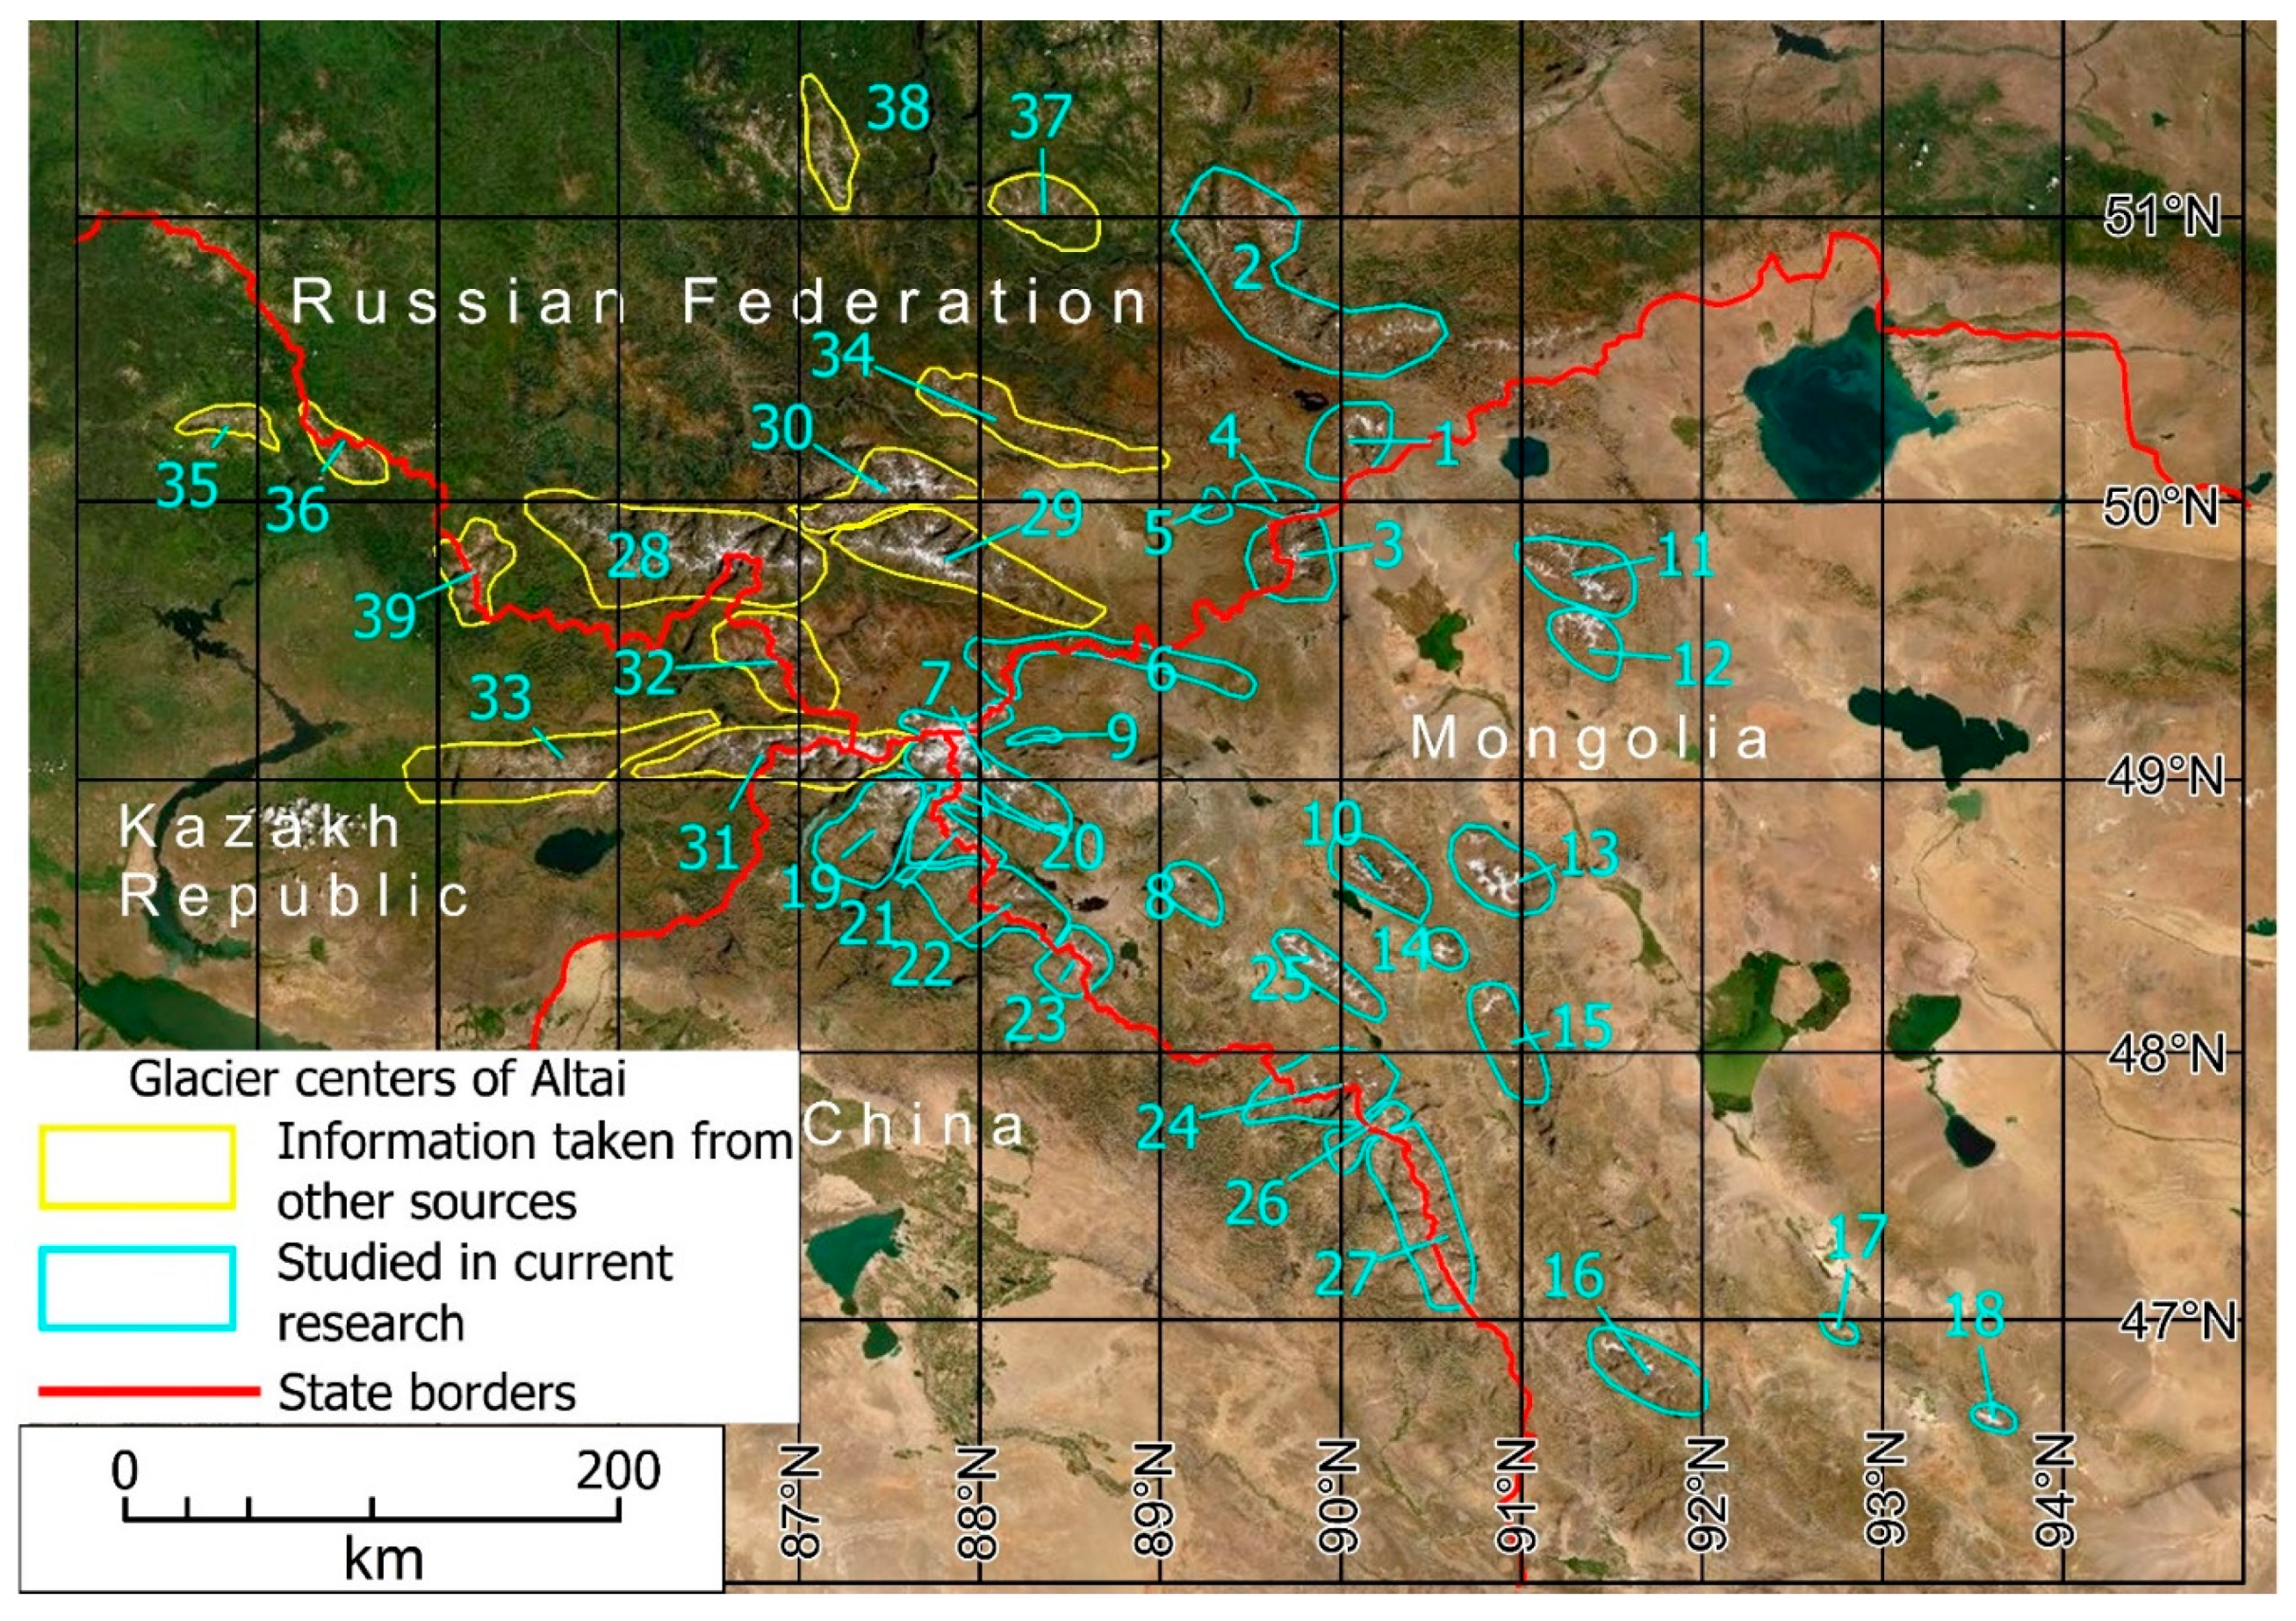
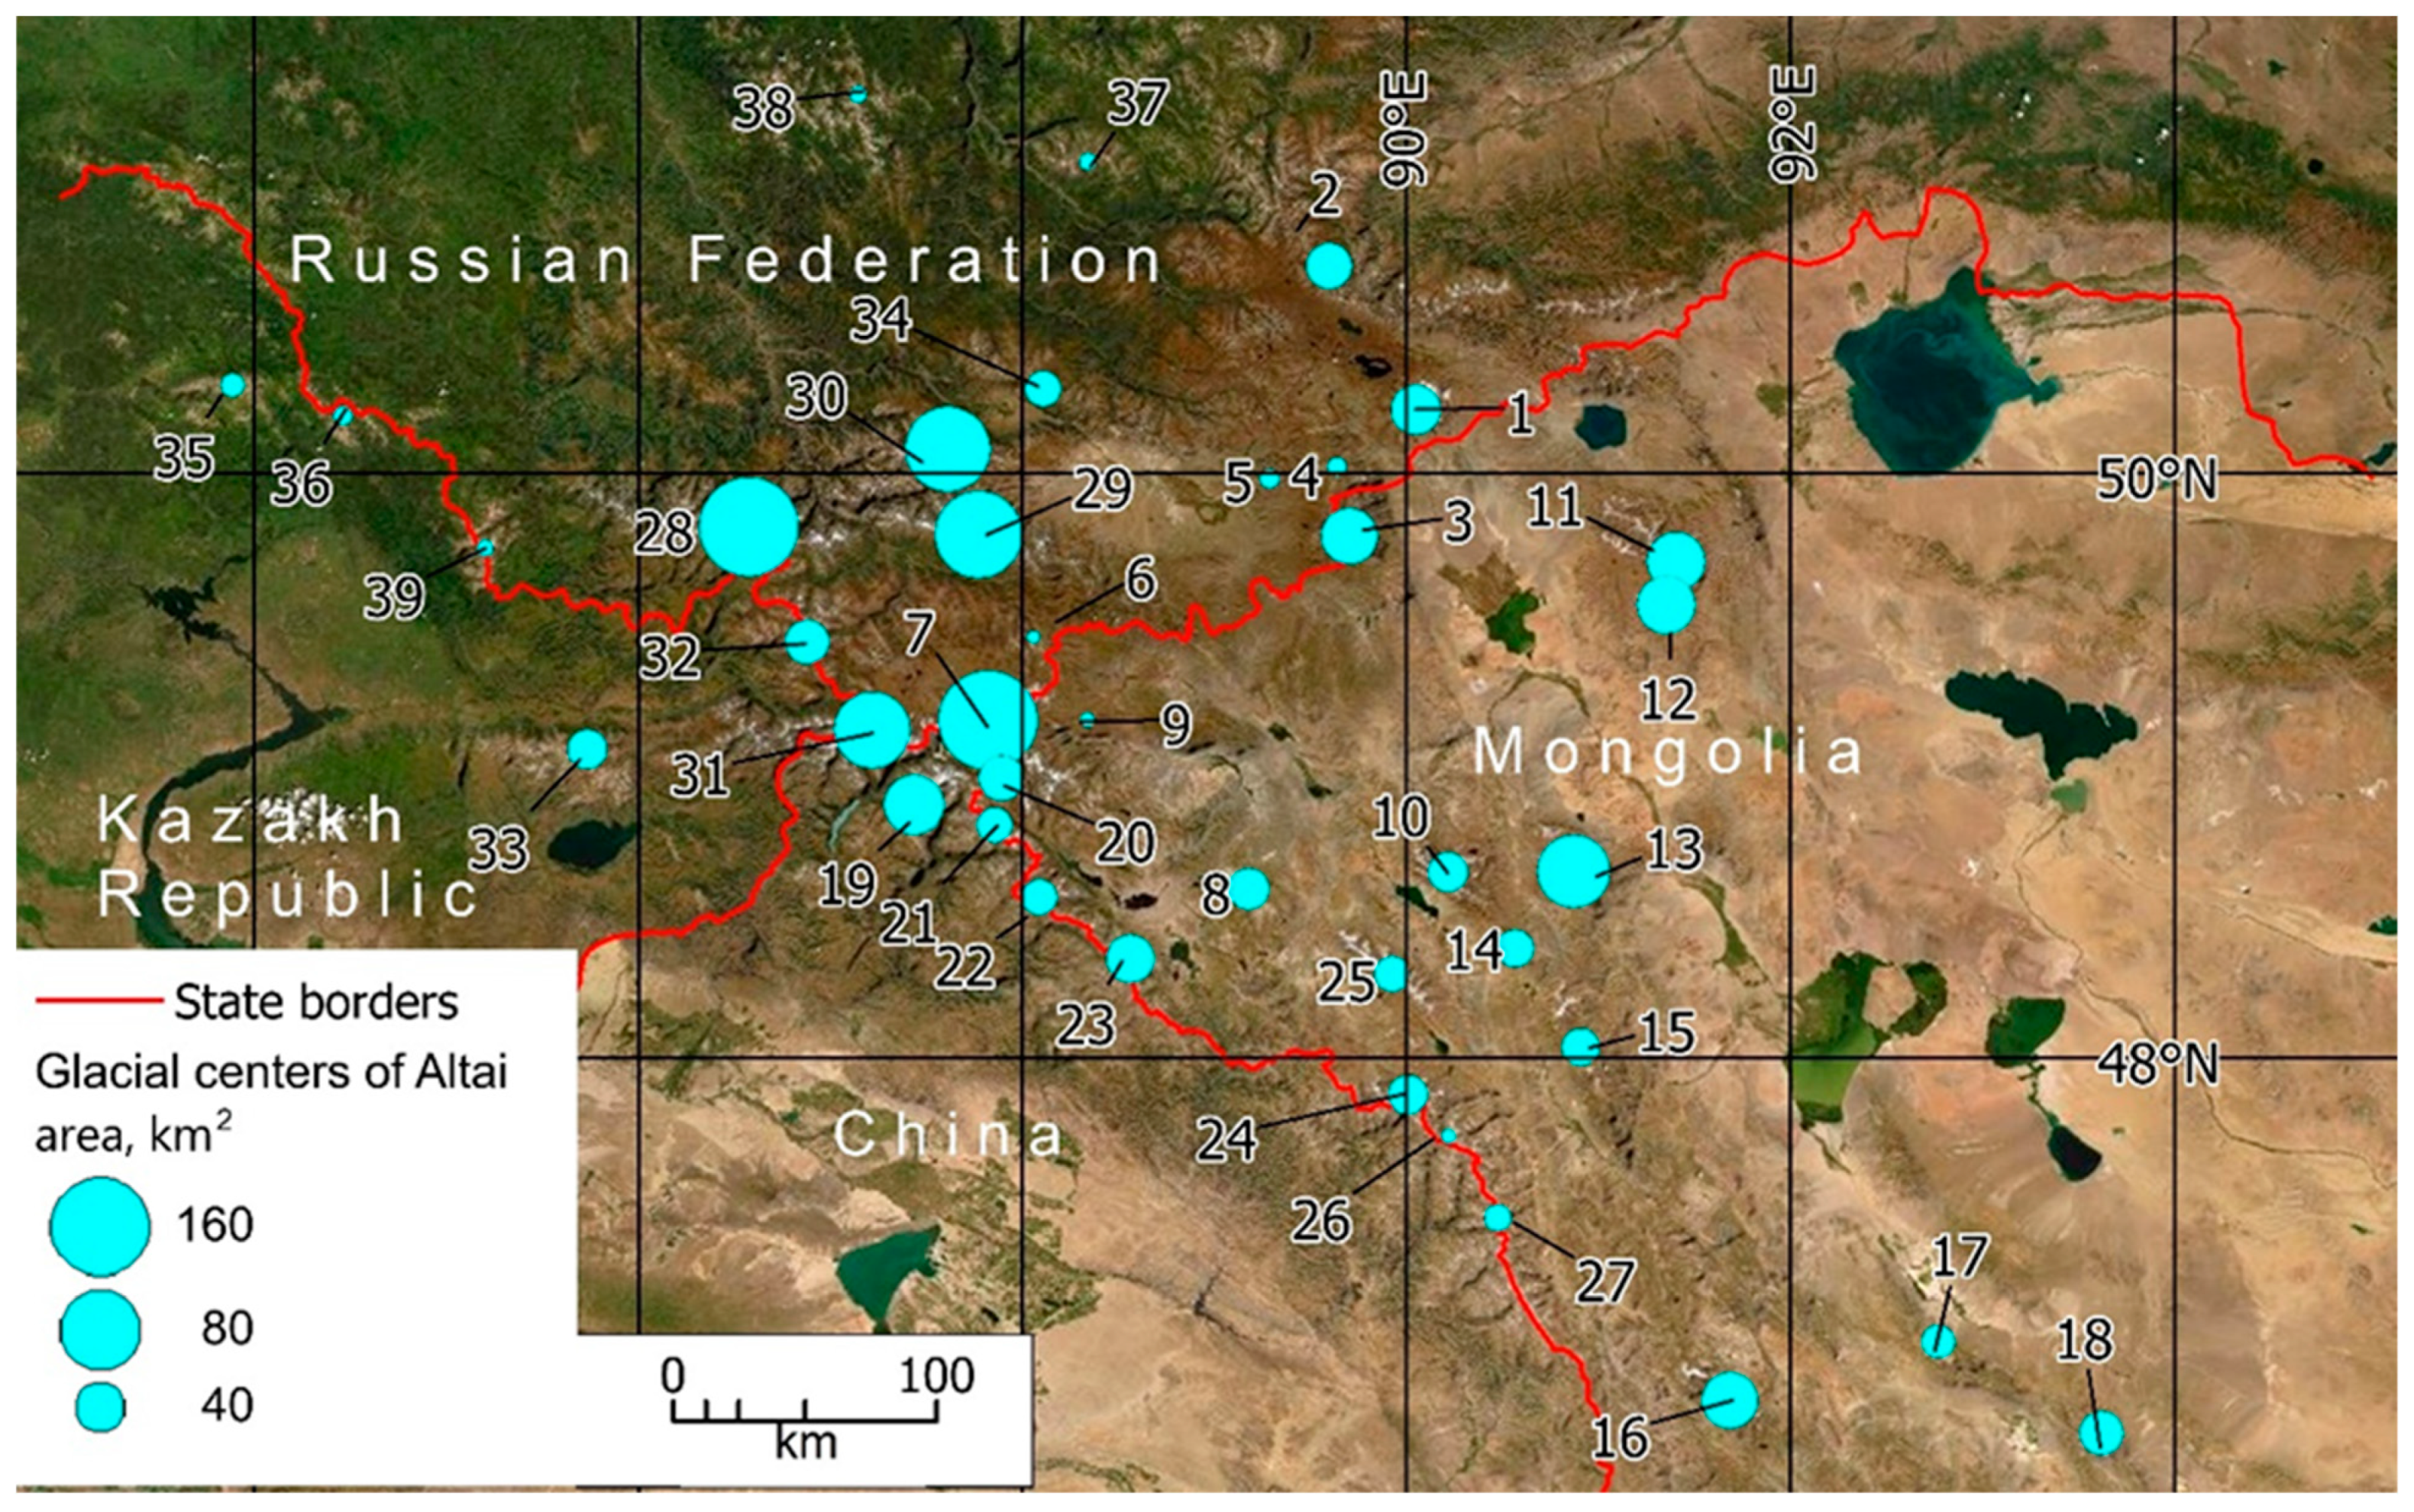
The first observations of the glaciers of Altai by the geographers of Saint Petersburg State University (our research group) started in 1965 (Mongun-Taiga mountain massif) [45]. Since late 1980s the continuous monitoring of the glaciers of Altai mountains has been established in a regime of part-time observation stations (hydrological, glaciological, meteorological, geomorphological, and dendrochronological in situ observations were made in the ablation periods). The observations were focused on the glaciers of the Mongun-Taiga massif and of the northern slope of the Tavan Bogd massif. In the last 10 years, we started observations in other glaciated areas: Ikh Turgen, Tsambagarav, Tsengel-Khairkhan, Shapshalsky ridge, South Altai ridge [46].
Glaciological observations included monitoring of the positions of the glacial edges, locating the ELA, mass balance observations, and mass balance index calculations. Monitoring of the positions of the glacial edges is based on survey activities, such as geodetic surveying, GPS tracking of the glacial edges, measurements of the changes of the glacial length (repeated measurements of the distance between the benchmarks and the glacial edges), the usage of repeated photographs, and remote sensing. The results of this monitoring provide the opportunity to estimate the rates of advance and retreat of the glaciers. The monitoring of the positions of the glacial edges was done for different types of glaciers, but preference was given to the larger valley glaciers, which are the most representative glaciers (due to less dependence on geomorphic factors) with the longest observation periods (being at the same time easier to reach due to the lower positions of the snouts).

2.2. Remote Sensing

The remote sensing study gives the opportunity to get the information on the present state of the glaciers, to reconstruct the positions of the glaciers in the maximum of the LIA, and to fill the gaps between the time points of the field observations. Accordingly, there were 2 groups of satellite imagery: images used for the delineation of the glaciers of the Tavan Bogd massif for the different time points in the past (Table 1) and images, used for recent glacier identification for different glaciated areas (Table 2). The choice of time points for the imagery was, in many respects, due to the availability of the required satellite images. In addition, the images had several requirements: They should correspond to the end of the ablation season, when the elevation of the snow line is maximal, and the snow cover does not interfere with delineation of the boundaries of glaciers; it is desirable that images have low cloud cover; and images should not be taken after snowfalls. If in an individual image clouds covered parts of the glacierized area, another image from the nearest available date was collected.
The imagery of the first group (Table 1) is represented mainly by the Landsat images provided by the USGS [47] and CORONA images. Spot 5 images were provided by RDC ScanEx [48] and processed by the Space and Geoinformation Technologies Resource Center of Saint Petersburg State University. For Landsat, one common false-color composite (FCC) image combination is provided by TM bands 5, 4, 3, which help delineate clean glacier ice/snow and vegetation (Paul et al. 2004, Bolch and Kamp 2006). For Landsat 7 images we used false-color composites (FCCs) that show the differences in reflectance of landscape features. In particular, we used a Landsat ETM+ and TM 5, 4, 3 RGB composite (red: channel 5; green: channel 4; blue: channel 3), the resulting effect is that snow and ice are clearly differentiated from clouds, debris, rock, or vegetation due to FCC image color differences [49]. Furthermore, Landsat 7 images taken by the ETM+ sensor included a panchromatic band 8, which was used for pan-sharpening to improve image resolution from 30 × 30 to 15 × 15 m employing ESRI ArcGIS 10.4. We also used Landsat 2 MSS 765 and 654 RGB composite.
The second group (Table 2) is represented mostly by Sentinel-2 imagery with 10 m maximal spatial resolution. We used a natural color band combination (B04-B03-B02). This combination allows us to not only determine the spatial position of glacier and seasonal snow, but to also delineate rock glaciers, moraines, to determine the degree of their overgrowth with vegetation. In some cases, the LIA and recent glaciers area determination had been done before the Sentinel 2 imagery became available. This is why we used Spot 4 imagery for Hunguyn-Nuru, Turgen, Kharkhiraa, and Sair (10 m resolution). In addition, for some areas we managed to get imagery of resolution, higher than Sentinel 2: Spot 5 imagery (2.5 m resolution) for Ikh Turgen, Mongun-Taiga Minor, Tsengel Khairkhan; Spot 6 for Shapshalsky ridge (1.5 m resolution); Geoeye-1 imagery for Talduair massif, Saylugem and Tsambagarav ridges (spatial resolution: 0.5 m panchromatic and 1.8 multispectral), and WorldView-2 for Mogun-Taiga massif (spatial resolution: 0.5 m panchromatic and 1.8 multispectral).
The delineation of the recent glaciers and of the geomorphological forms marking their positions in the maximum of the LIA has been done manually. The minimum size of the glaciers to be mapped was 0.01 km2.
The systematic error was defined as ±1 pixel (0.5 m for Geoeye-1 and WorldView-2, 1.8 m for Corona, 2.5 m for SPOT 5, 10 m for Sentinel 2, 15 m for Landsat 7, 30 m for Landsat 4 and 60 m for Landsat 2). Thus, the error of area determination is calculated by a simple formula:
A e r = n · m
where n is the number of pixels defining the perimeter of the glacier area, and m is the spatial resolution of the sensor bands applied expressed as an area of the pixel.
The percentage error of area determinations, Arer, is given by:
A r e r ( % ) = A e r A g l · 100
where Agl—the area of the glacier.
The total systematic error was 5.6%.
To assess the subjective “cartographer’s error”, we took a sample of 100 glaciers. Within the sample, the distribution of glaciers by area corresponded to the distribution by area of glaciers within the entire data set. Sample glaciers were remapped. The error was determined by comparison of remapping results with the glacier areas obtained in the course of cataloging. The average error for the entire sample was 6.0%.
The main mistakes in determining the glacier limits of the glacier are associated with several factors:
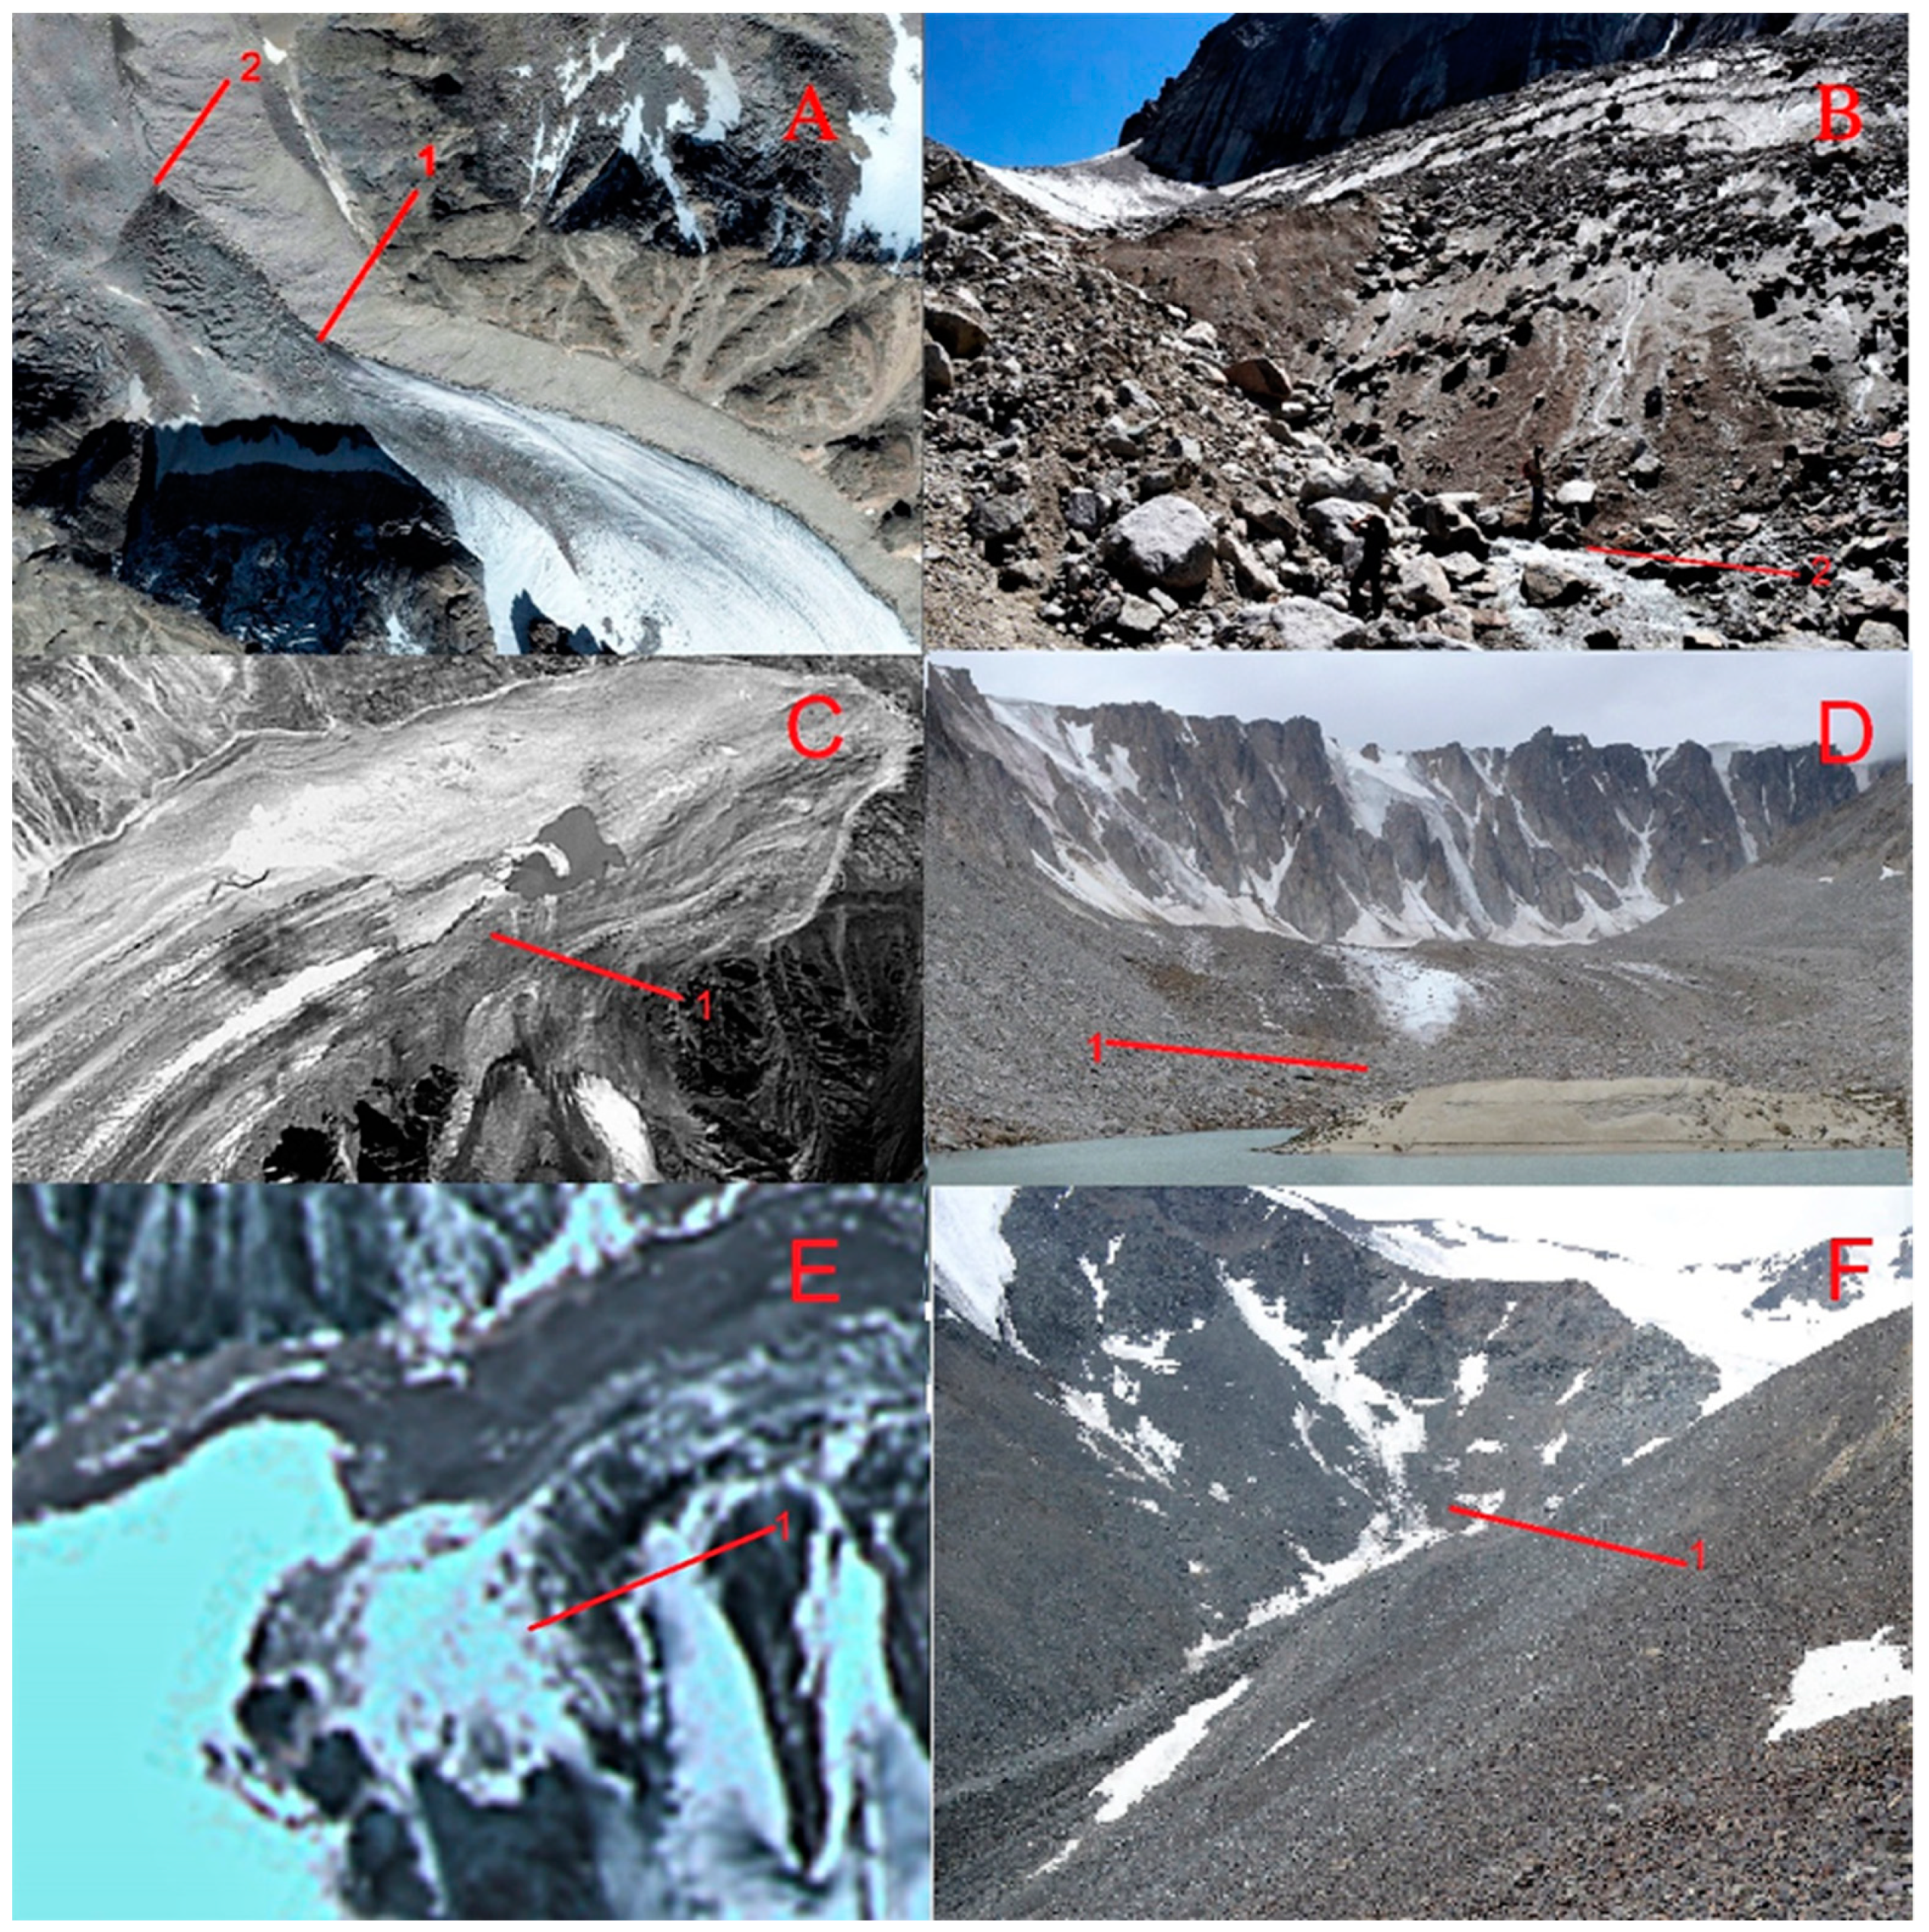
  • Debris-covered glacier edges or the areas of dead ice under the moraine cover adjacent to the glaciers that merge in color with the end moraines of the LIA complex, which is typical for the region. Thus, both underestimation and overestimation of the size of the glacier is possible. For such cases, we use indicators defined by Loibl et al. [36]: active ice indicators are the “smooth” debris surface, linear flow structures, and constrained tributaries; dead ice indicators are the rugged debris surface, melting ponds, unconstrained tributaries, and pioneer plants. We added two more diagnostic signs: for the massifs of dead ice it is typical when the water flows into tunnels and its exits from other tunnels down the slope; the active glacial edge is marked by marginal flows that join at the lowest point of the glacier [50]. All these indicators work well, with the exception of pioneer plants, which, due to the dry climate of the central and eastern parts of Altai, are absent near the glaciers in those areas and appear only on the surface of inactive rock glaciers. We also tried to use the results of in situ observations whenever possible, which helped to solve this problem in some complicated cases (Figure 2);
  • Another typical problem is the overestimation of the glacial area after snowfalls or when the seasonal snow cover has not melted. This problem is solved by the selection of satellite images at the end of the season. In some cases, for example, when the snow cover persists for a long time in the areas of dead ice, to control the interpretation, it is necessary to use images of other months or even years, or, if possible, the results of ground observations (Figure 2E,F and Figure 3);
  • Perennial snow patches and small glaciers are very similar; mistaking snow patches for glaciers can lead to an overestimation of the glacier area. We were guided by the following distinctive features: glaciers have an integral configuration, while snowfields often have openwork outlines in plan; for glaciers, the images show ablation and accumulation zones; as a rule, crevasses or bergschrunds are visible on the surface of glaciers, which are indicators of glacier movement;
  • The shading of some parts of the glacier and the adjacent non-glacial areas, that usually leads to underestimation of the glacier area. This problem can be solved if the images of the same area with different acquisition times and different angles of sunlight are compared;
  • Medial moraines on the surface of glaciers can often be mistaken for rocky outcrops that separate glacial streams. As a rule, in addition to the characteristic position at the contact of the adjacent glacial streams, the medial moraines acquire a convex shape as the surfaces of open ice decrease during the degradation of glaciers. As a result, in some areas the moraine cover crumbles and the ice core of the moraine is exposed, which helps to correctly diagnose it. Such formations should not be excluded from the total area of glaciers, since they move with them, until they lose contact with open areas of the glacier and become independent formations;
  • Frozen glacial lakes can be mistaken for parts of a glacial tongue, leading to an overestimation of the glacier area. In this case, if it is not possible to find images for the period when the ice on the lake has already molten, it is possible to use digital elevation models, in which this area will look such as an absolutely flat territory, contrasting with the sloped areas of the glacial tongue.
We used a 30-m SRTM 1 Arc-Second Global DEM [51] to characterize our glacier outlines with parameters including mean, minimum, and maximum elevation ranges, and mean slope and aspect.
Those parameters were determined automatically based on the DEM in the Global Mapper v.18.0 software (digitizer tool). Field data were used to verify the data obtained from remote sensing sources.
Since ELA cannot always be detected on satellite images, especially for small glaciers, for the consistency of the obtained data on ELA, we used the Kurowski method [52,53] for its identification. In this method, the firn line altitude or ELA is calculated as the average altitude of the glacier:
z ¯ f = i f i z i F
where z ¯ f is the firn line altitude or ELA, f i are the areas of the different altitudinal zones of the glacier, z i are the average altitudes of these zones, and F = i f i .
The Kurowski method is based on the assumptions that ablation and accumulation on a glacier change linearly with altitude and that the glacier is stationary. The assumption of linearity of changes in ablation with changes in altitude introduces a systematic error associated with the concave nature of the real curve of ablation versus altitude, due to which the ELA lies below the weighted average glacier elevation. At the same time, errors due to the assumption of linearity of changes in ablation with altitude and due to the assumption of glacier stationarity have the same signal during the period of glacier advance and opposite during the period of its retreat, that is, in the second case, they compensate each other, increasing the accuracy of the results. This exactly corresponds to the situation of our study, when glaciers are considered to be in the phase of intense retreat.
Thereby, the Kurowski method has high accuracy in relation to the recent glaciers of Altai was also used to verify the values of ELA, found by remote sensing.
According to recent studies by Braithwaite [54], who tested the method for the 103 glaciers of different morphology and from different regions of the world, there is a high correlation between balanced-budget ELA and Kurowski mean altitude, with a small mean difference of −36 m between the two altitudes with standard deviation ±56 m. Balanced-budget ELA is significantly lower (at 95 confidence level) than Kurowski mean altitude for outlet and valley glaciers, and not significantly lower for mountain glaciers [54].
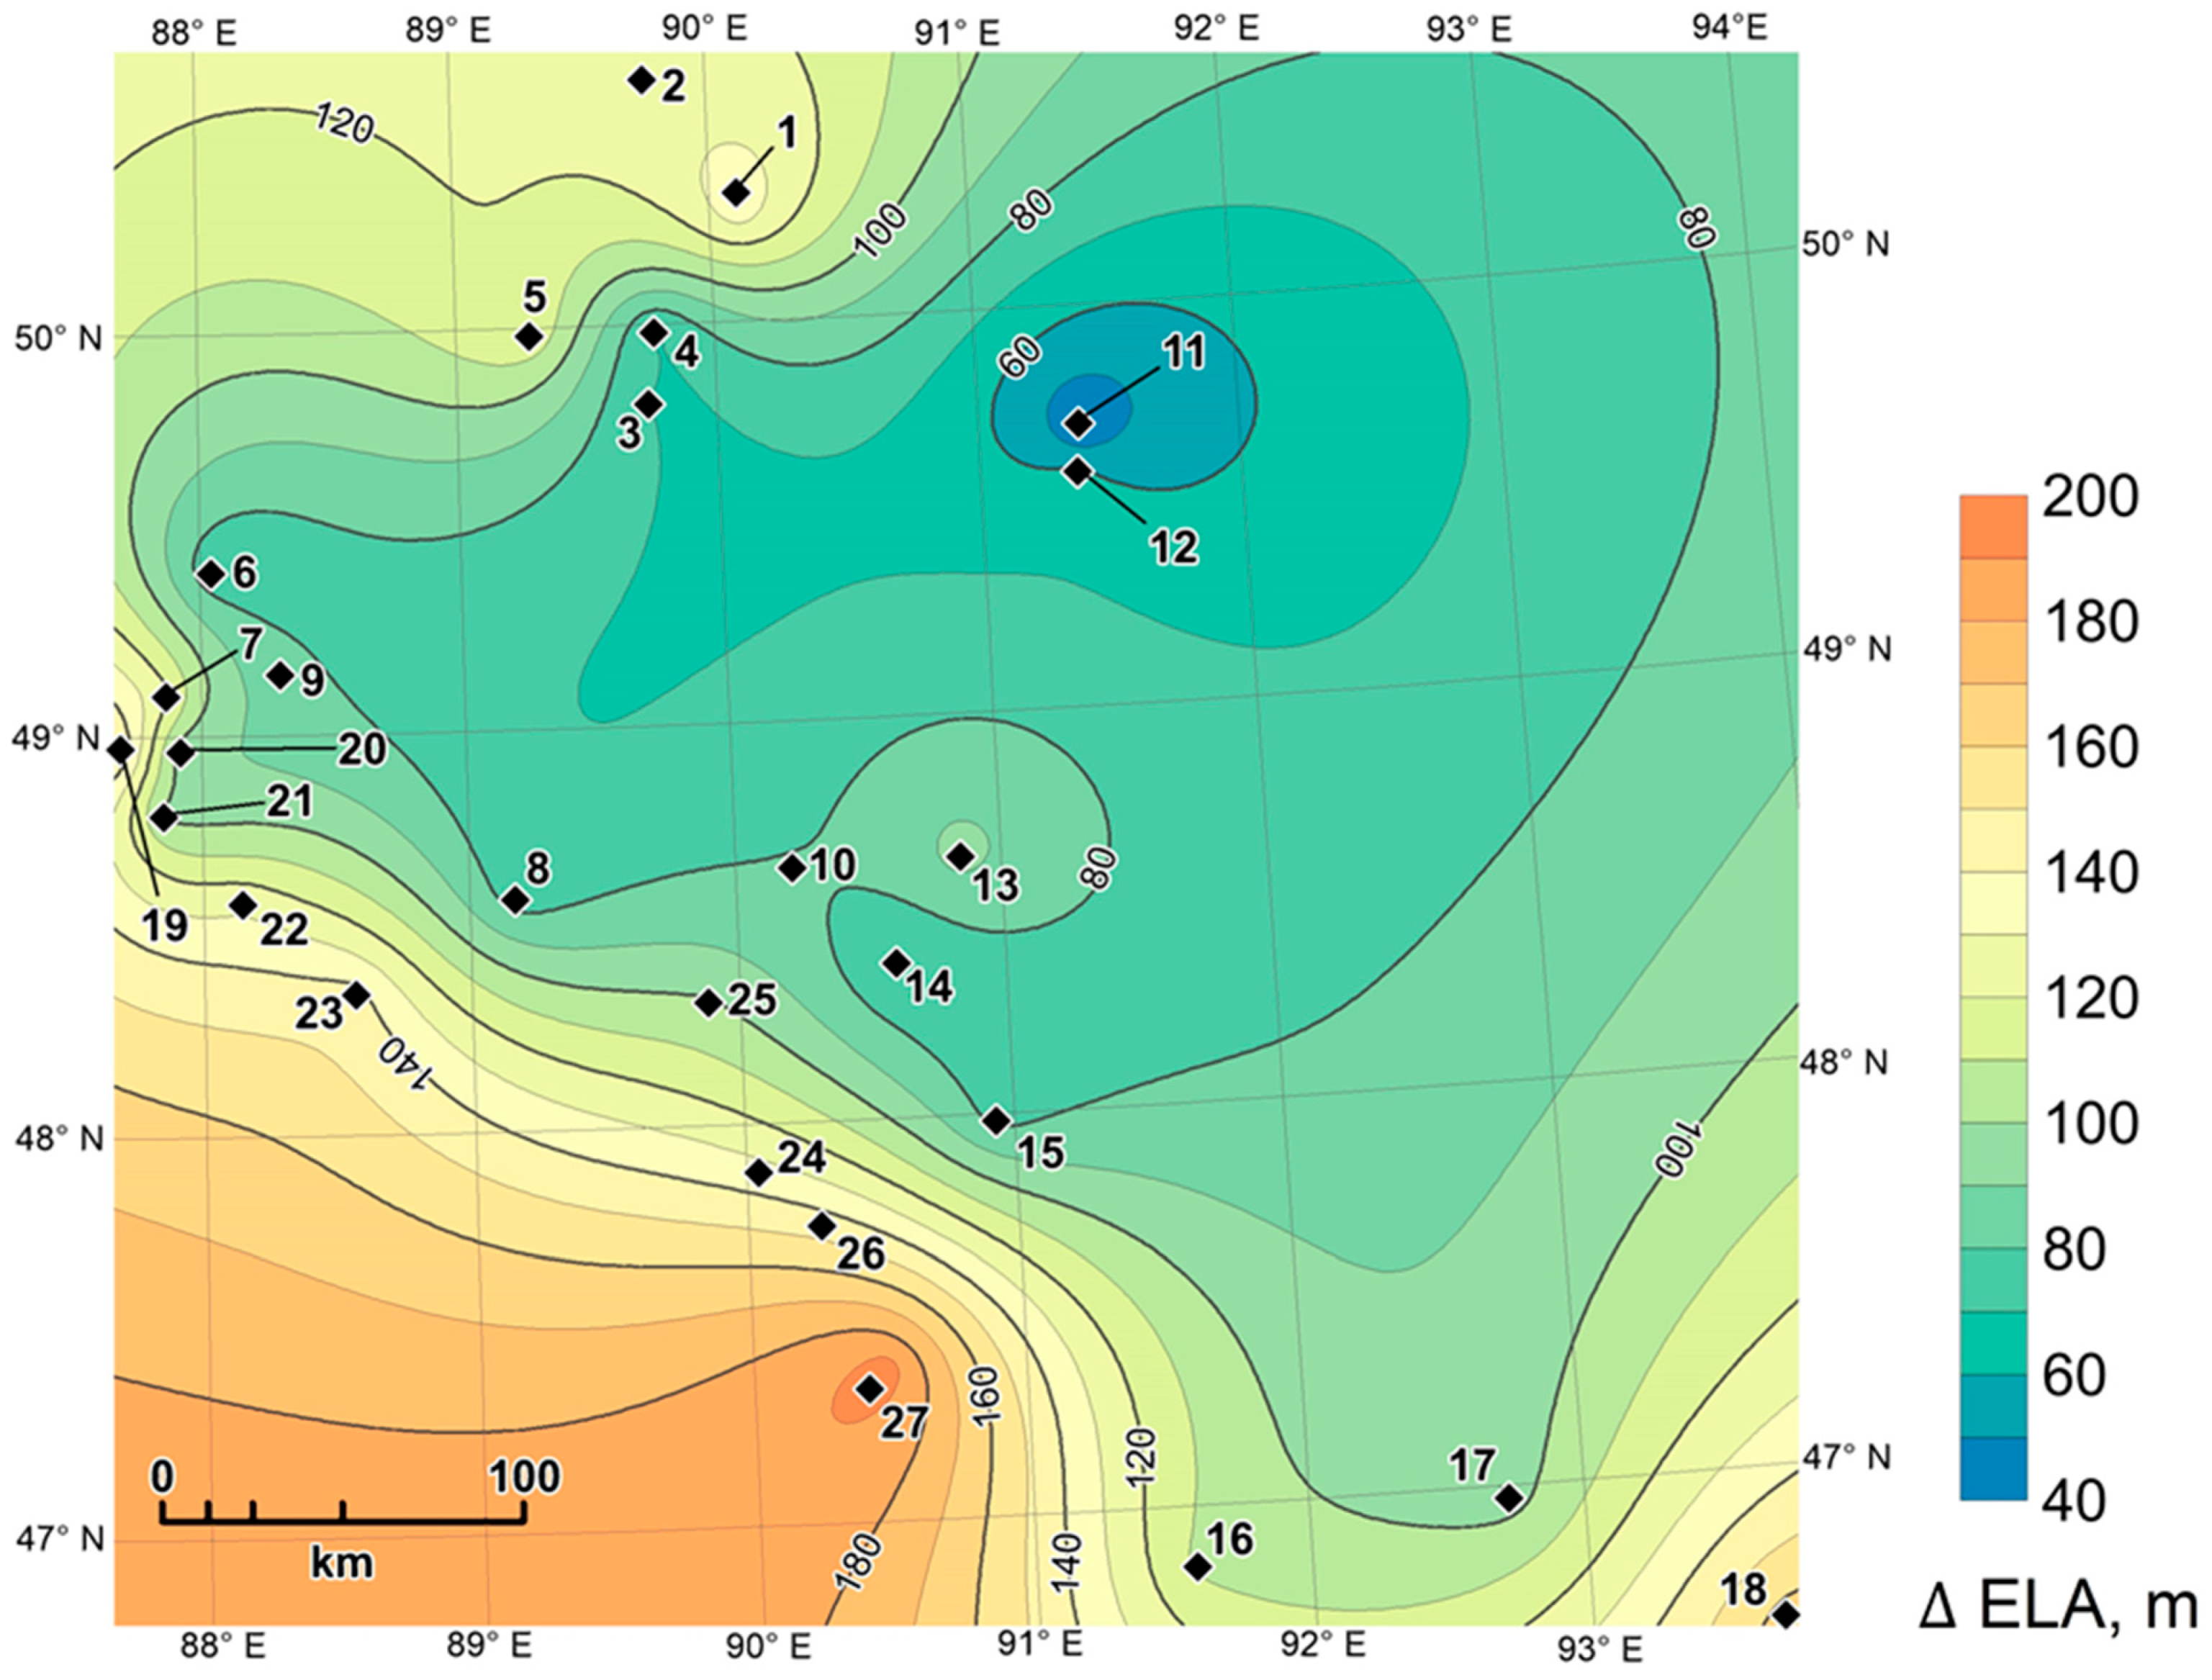
In our work on the current state of the glaciers of the Shapshalsky Center [55], calculations using this method for 26 glaciers (cirque and hanging glaciers with areas less than 0.6 km2) gave results close to the ELA position obtained by remote sensing (the average value of the difference was −8 m) (Table 2). We also considered the results of determining the position of the ELA by the Kurowski method from the standpoint of the possible application of the AAR method, which is currently widely used. The AAR assumes the accumulation area occupies a fixed proportion of the total glacier area. The average AAR, obtained from a global dataset of 99 glaciers is 49.2% or 0.492 Durgerov [56]. For the high Asia region the AAR is 0.51 (which is partly due to the area of the Karakoram anomaly-—the area of mass gain of the glaciers and high AAR, caused by it) [57]. For Tien Shan mountains, which are the closest to Altai range both geographically and climatically the average AAR is 0.43. Unfortunately, no regional average AAR value for Altai is available yet, but results our studies, shown in Table 2 and Table 3, allow us to assume values of about 0.44, which differs little from the average values obtained by the Kurowski method (0.48). This confirms the validity of the latter.
The Kurowski method was also tested by us for the glaciers of the Tavan Bogd massif in the area range of 3.3–23.1 km2 (Table 3). In this case, the calculated values of the ELA by the Kurowski method as of 4 points in time and the data obtained from the corresponding satellite images were considered. It should be taken into account that the comparison was made not with the balanced-budget ELA, but with its values obtained from the images (the latter gives only some approximation to its actual position, corresponding to the moment of the greatest rise in the seasonal snow line, images fixing this moment are not always available). Therefore, the difference between the calculated values and balanced-budget ELA could be less than our average value of 77 m. Taking into account the vertical span of the studied glaciers, which reached about 1.5 km, such an error can be considered acceptable.
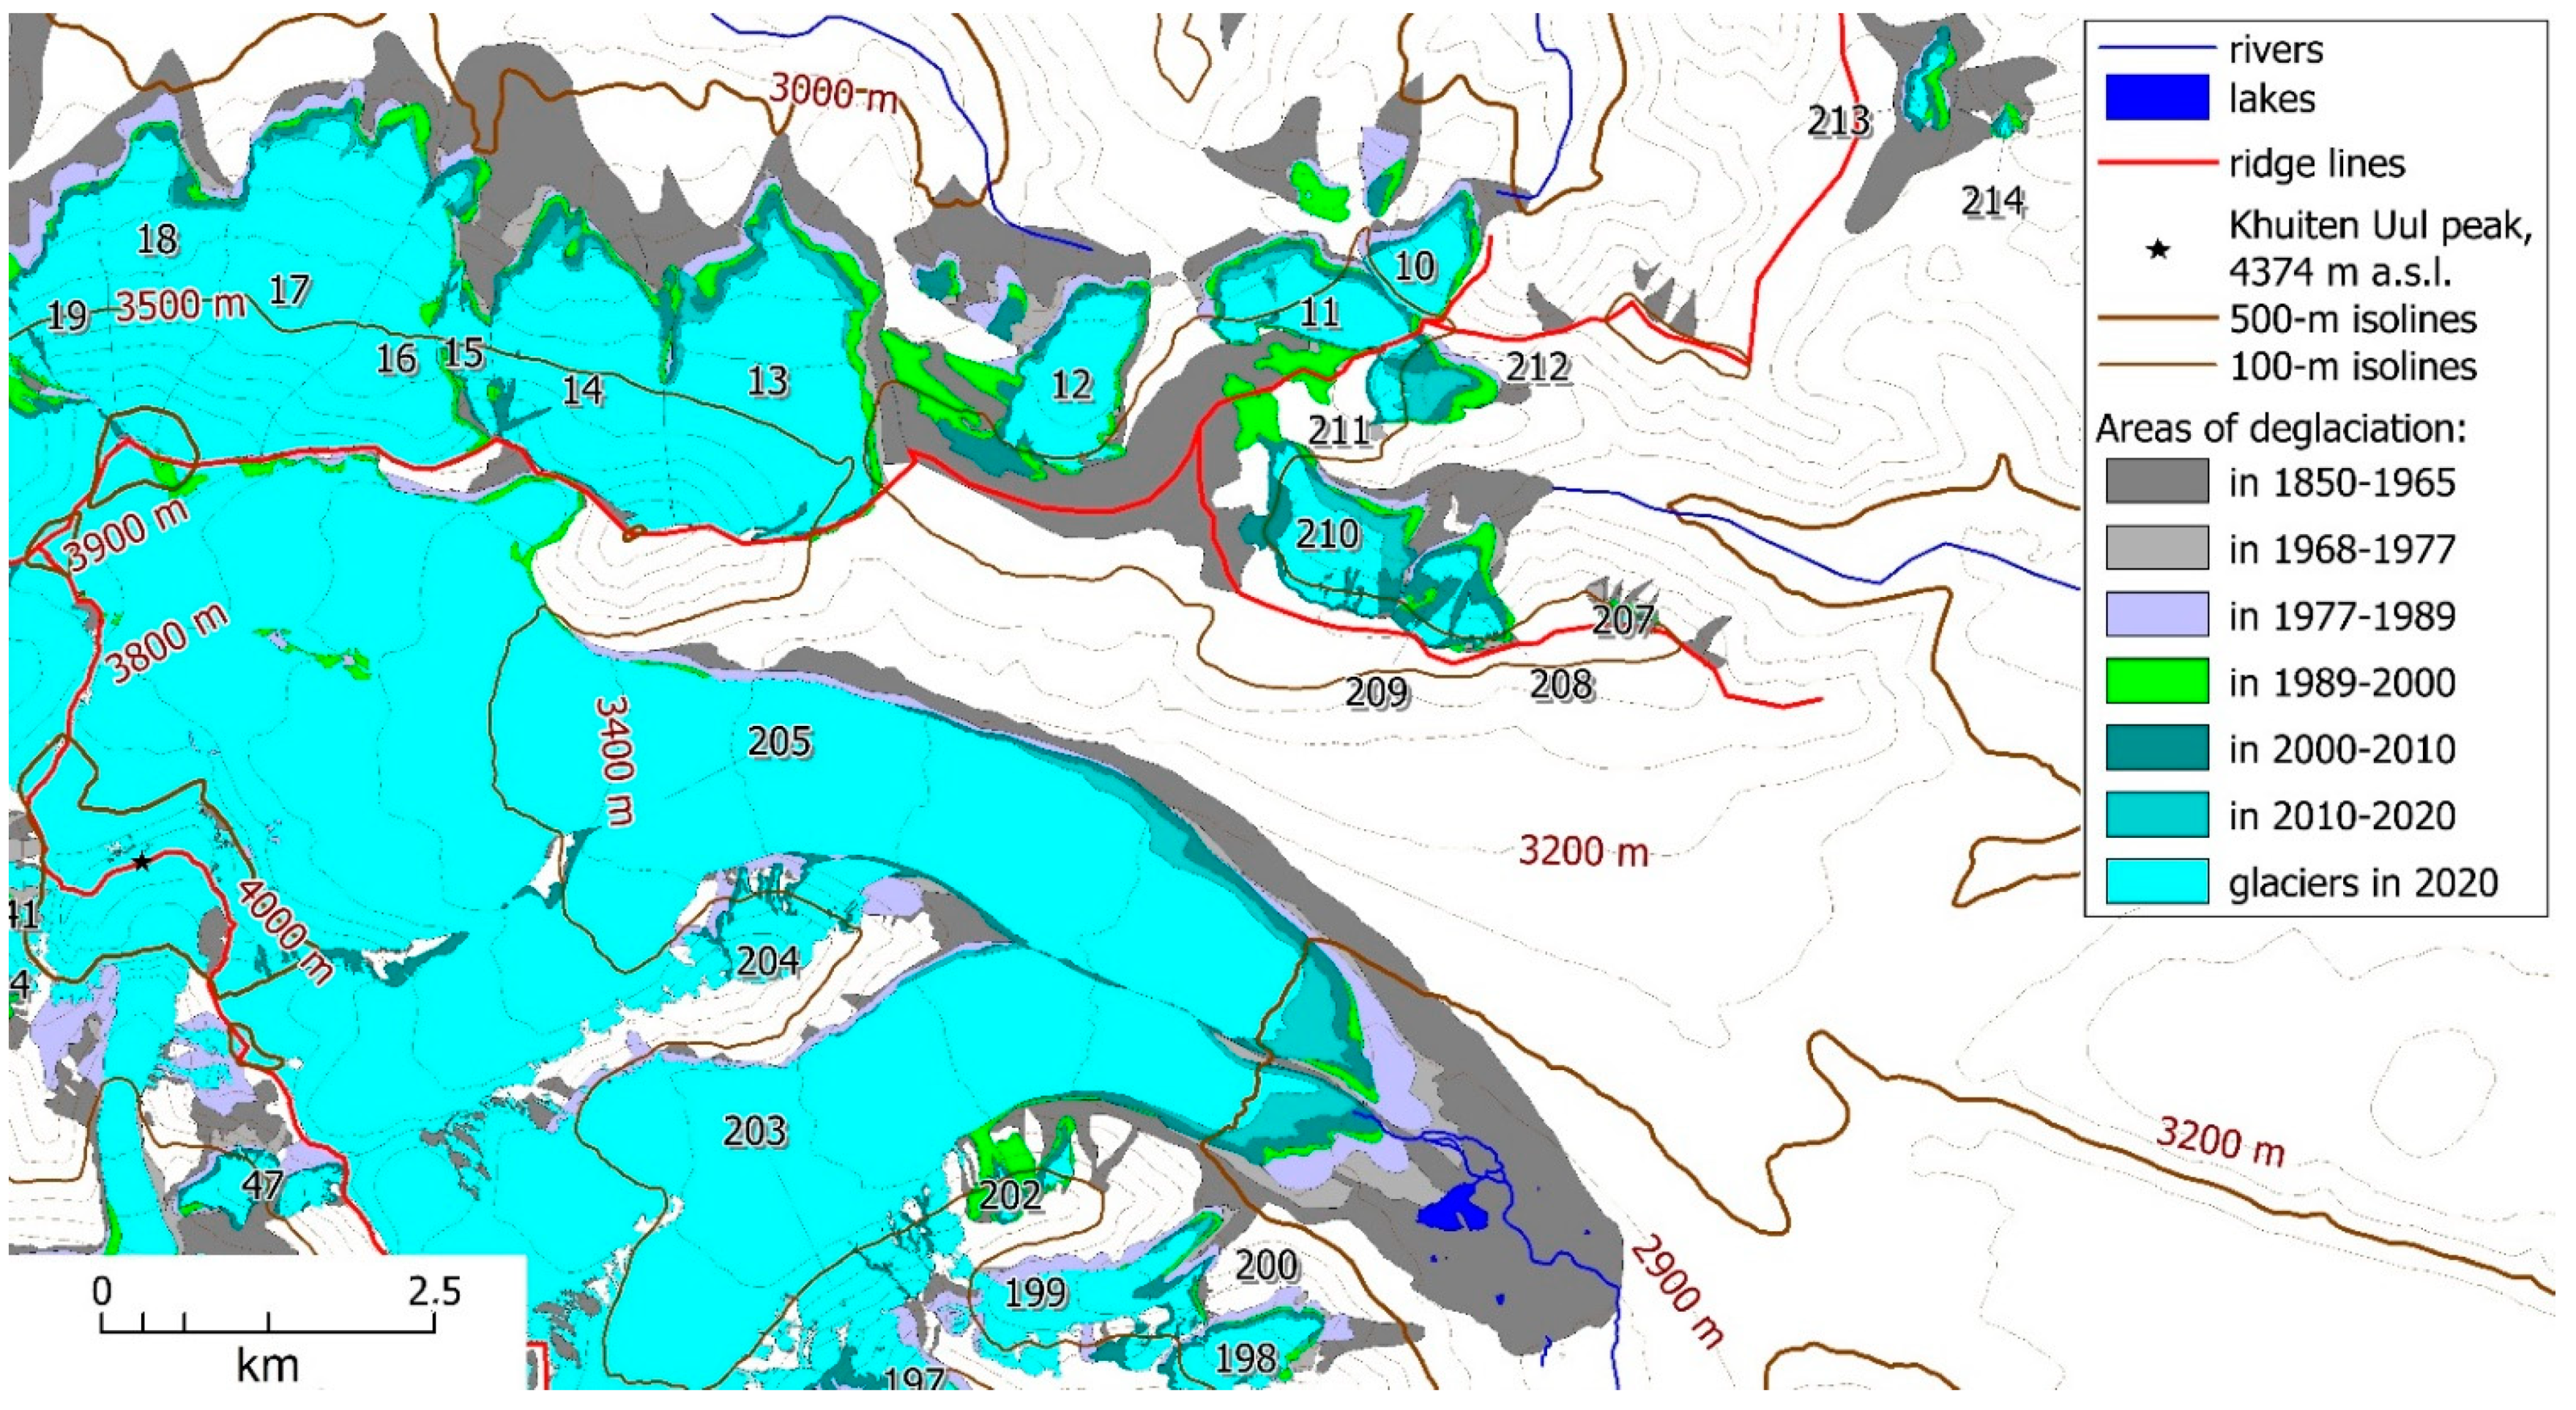
Designations are given in Table 2. Numbers of the glaciers correspond to the catalogue from [50].
There is an idea that the ELA concept is not applicable to all glaciers. This idea was stated by Braithwaite: “… For example, on glaciers with a small altitude range, local variations in specific balance may mask the altitudinal variations so there is no simple line separating the ablation area from the accumulation area. In an extreme case, where the specific balance values are more or less randomly distributed over the glacier surface, the ELA concept is meaningless, and the balanced-budget AAR will be about 0.5” (p. 128) [58]. A similar situation occurs for a significant number of small glaciers in the study area, especially in arid regions, where the redistribution of snow by wind at low altitude mass balance gradients plays a decisive role in the configuration of the feeding zone, significantly obscuring the effect of height. Nevertheless, the very fact of the existence of glaciers at these heights indicates sufficient climatic conditions for this; accordingly, it makes sense to determine the climatically determined lower boundary of the zone of glacier development. From this point of view, the definition of ELA makes sense, and the use of the Kurowski method makes it possible to smooth out random fluctuations in the position of this boundary caused by orographic conditions.
An important advantage of the Kurowski method is its ease of use, which is especially beneficial when working with a large number of glaciers.

2.3. Paleo Reconstructions

Reconstruction of the LIA extent of glaciers was done on the basis of geomorphological methods. LIA moraines were mapped using satellite imagery, aerial photos, tachometry, GPS tracking of the lateral and terminal moraines, and visual in situ observations. We used the method of ground-based route interpretation that included descriptions, measurements and photography in reference areas. For object recognition, we used the visual interpretation method according to reference standards [59,60]. The reference standards were compiled from ground-based observations, indicating the following characteristics: characteristic images of objects on the terrain, in the aerial photograph, in the satellite image and in the topographic map; distinctive characteristics of objects; and methods of transferring objects to the map. The criteria which we used to identify moraines using the satellite imagery and DEM are largely similar to those suggested in [61]: “identification criteria include shadowing due to changes in topography (relative relief) and changes in color due to changes in soil, soil moisture, and vegetation cover. Associated landforms such as deflected abandoned meltwater channels are also useful in delineating the break-of-slope of these features”.
Furthermore, we used high-resolution images and compared interpretation results with in situ field observations. For Mongun-Taiga mountain range, we created interpretation standards [62], which we used first for Tavan Bogd massif [50] and subsequently in all other areas studied. A characteristic property of the study area favorable for visual interpretation includes the persistence of glacial topographic characteristics associated with climate aridity, low erosion rates, low rates of biological processes, and poor development of periglacial vegetation cover. Low temperatures, high intensity of frost weathering and small precipitation amounts promote a long-lasting preservation of buried glacier ice. All of this causes sharpness of most glacial landforms in aerial photographs and satellite images whose interpretation is made easier by the almost total absence of forest vegetation. Diagnostic features of LIA moraines are their bareness, steep fronts and relatively large thickness, glacial ice cores that are sometimes exposed by thermokarst processes, and position adjacent to modern glaciers. The low degree of vegetation cover of LIA moraines in multispectral images is expressed by a gray or brown color of moraines in sharp contrast with greenish color of the surrounding subalpine meadows and tundra and the moraines of earlier glacier advances (Figure 3), so they are easily identified. This is particularly characteristic for the LIA moraines which usually merge or overlap the more ancient late Holocene moraines of the stage that is called “historical stage” in Altai [63]. The third characteristic feature is the presence of the ice core of glacial origin. Beginning in the late 1990s, an intensification of thermokarst processes in the LIA moraines has given rise to numerous thermokarst depressions, thermoerosional forms, and landslides [9], which stand out in steep areas of dumped moraines in the form of sharp and contrasting dark bands visible in images with a resolution better than 15 m.
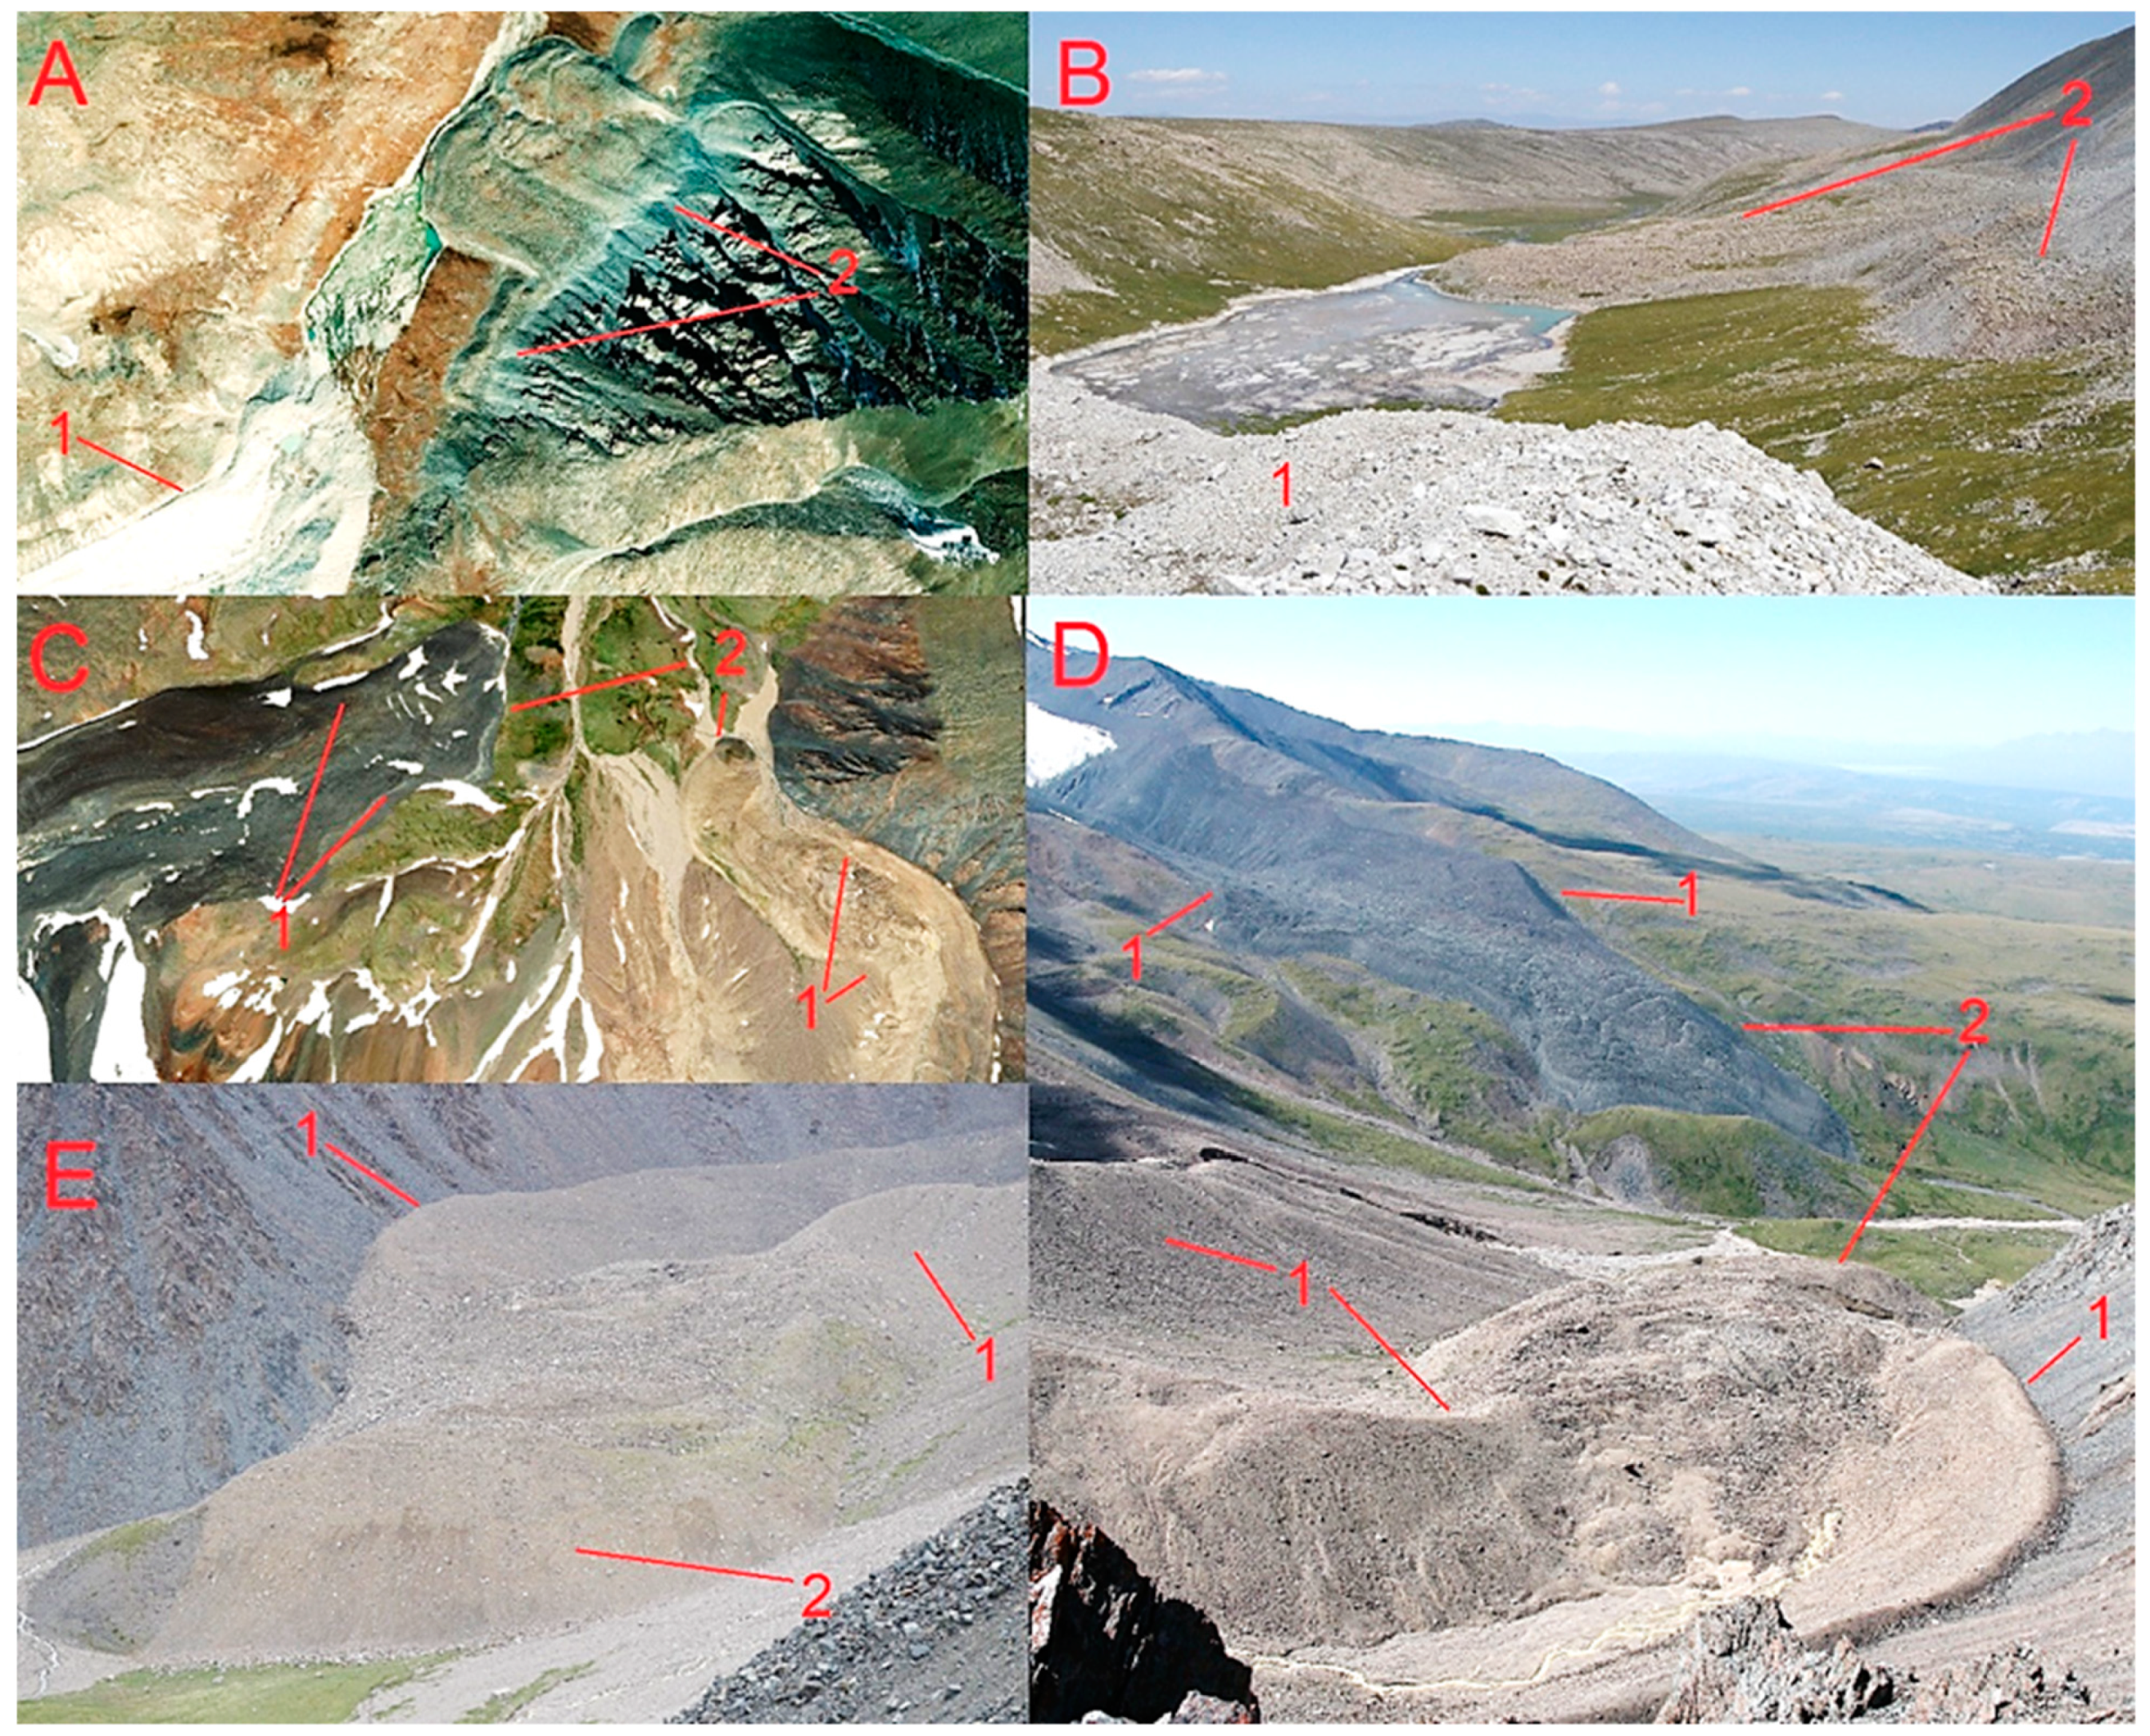
When delineating LIA moraines, a serious problem is their similarity to rock glaciers, which often leads to an overestimation of the glacier area. In the case of talus rock glaciers [64], the problem of their differentiation from moraines is solved quite simply: they are located below talus slopes devoid of the glacial exaration forms such as cirques or corries (Figure 4A,B: 2). On the contrary, debris rock glaciers develop below the LIA moraines or overlap them and move further down the valley (Figure 4C–E: 2). In such cases the reconstructed LIA glacier fronts we placed between the lowest points along the valleys, where the lateral moraines are diagnosed (Figure 4C–E: 1).
Reconstruction of the glaciers of the LIA maximum was carried out not only on the basis of moraine mapping. We used the clear boundaries between unweathered freshly glacially eroded areas and weathered, vegetated areas, in particular fresh glacial erosion marks on the walls of the cirques and troughs in the upper parts of the valleys, corresponding to the LIA moraines located further below the valley.
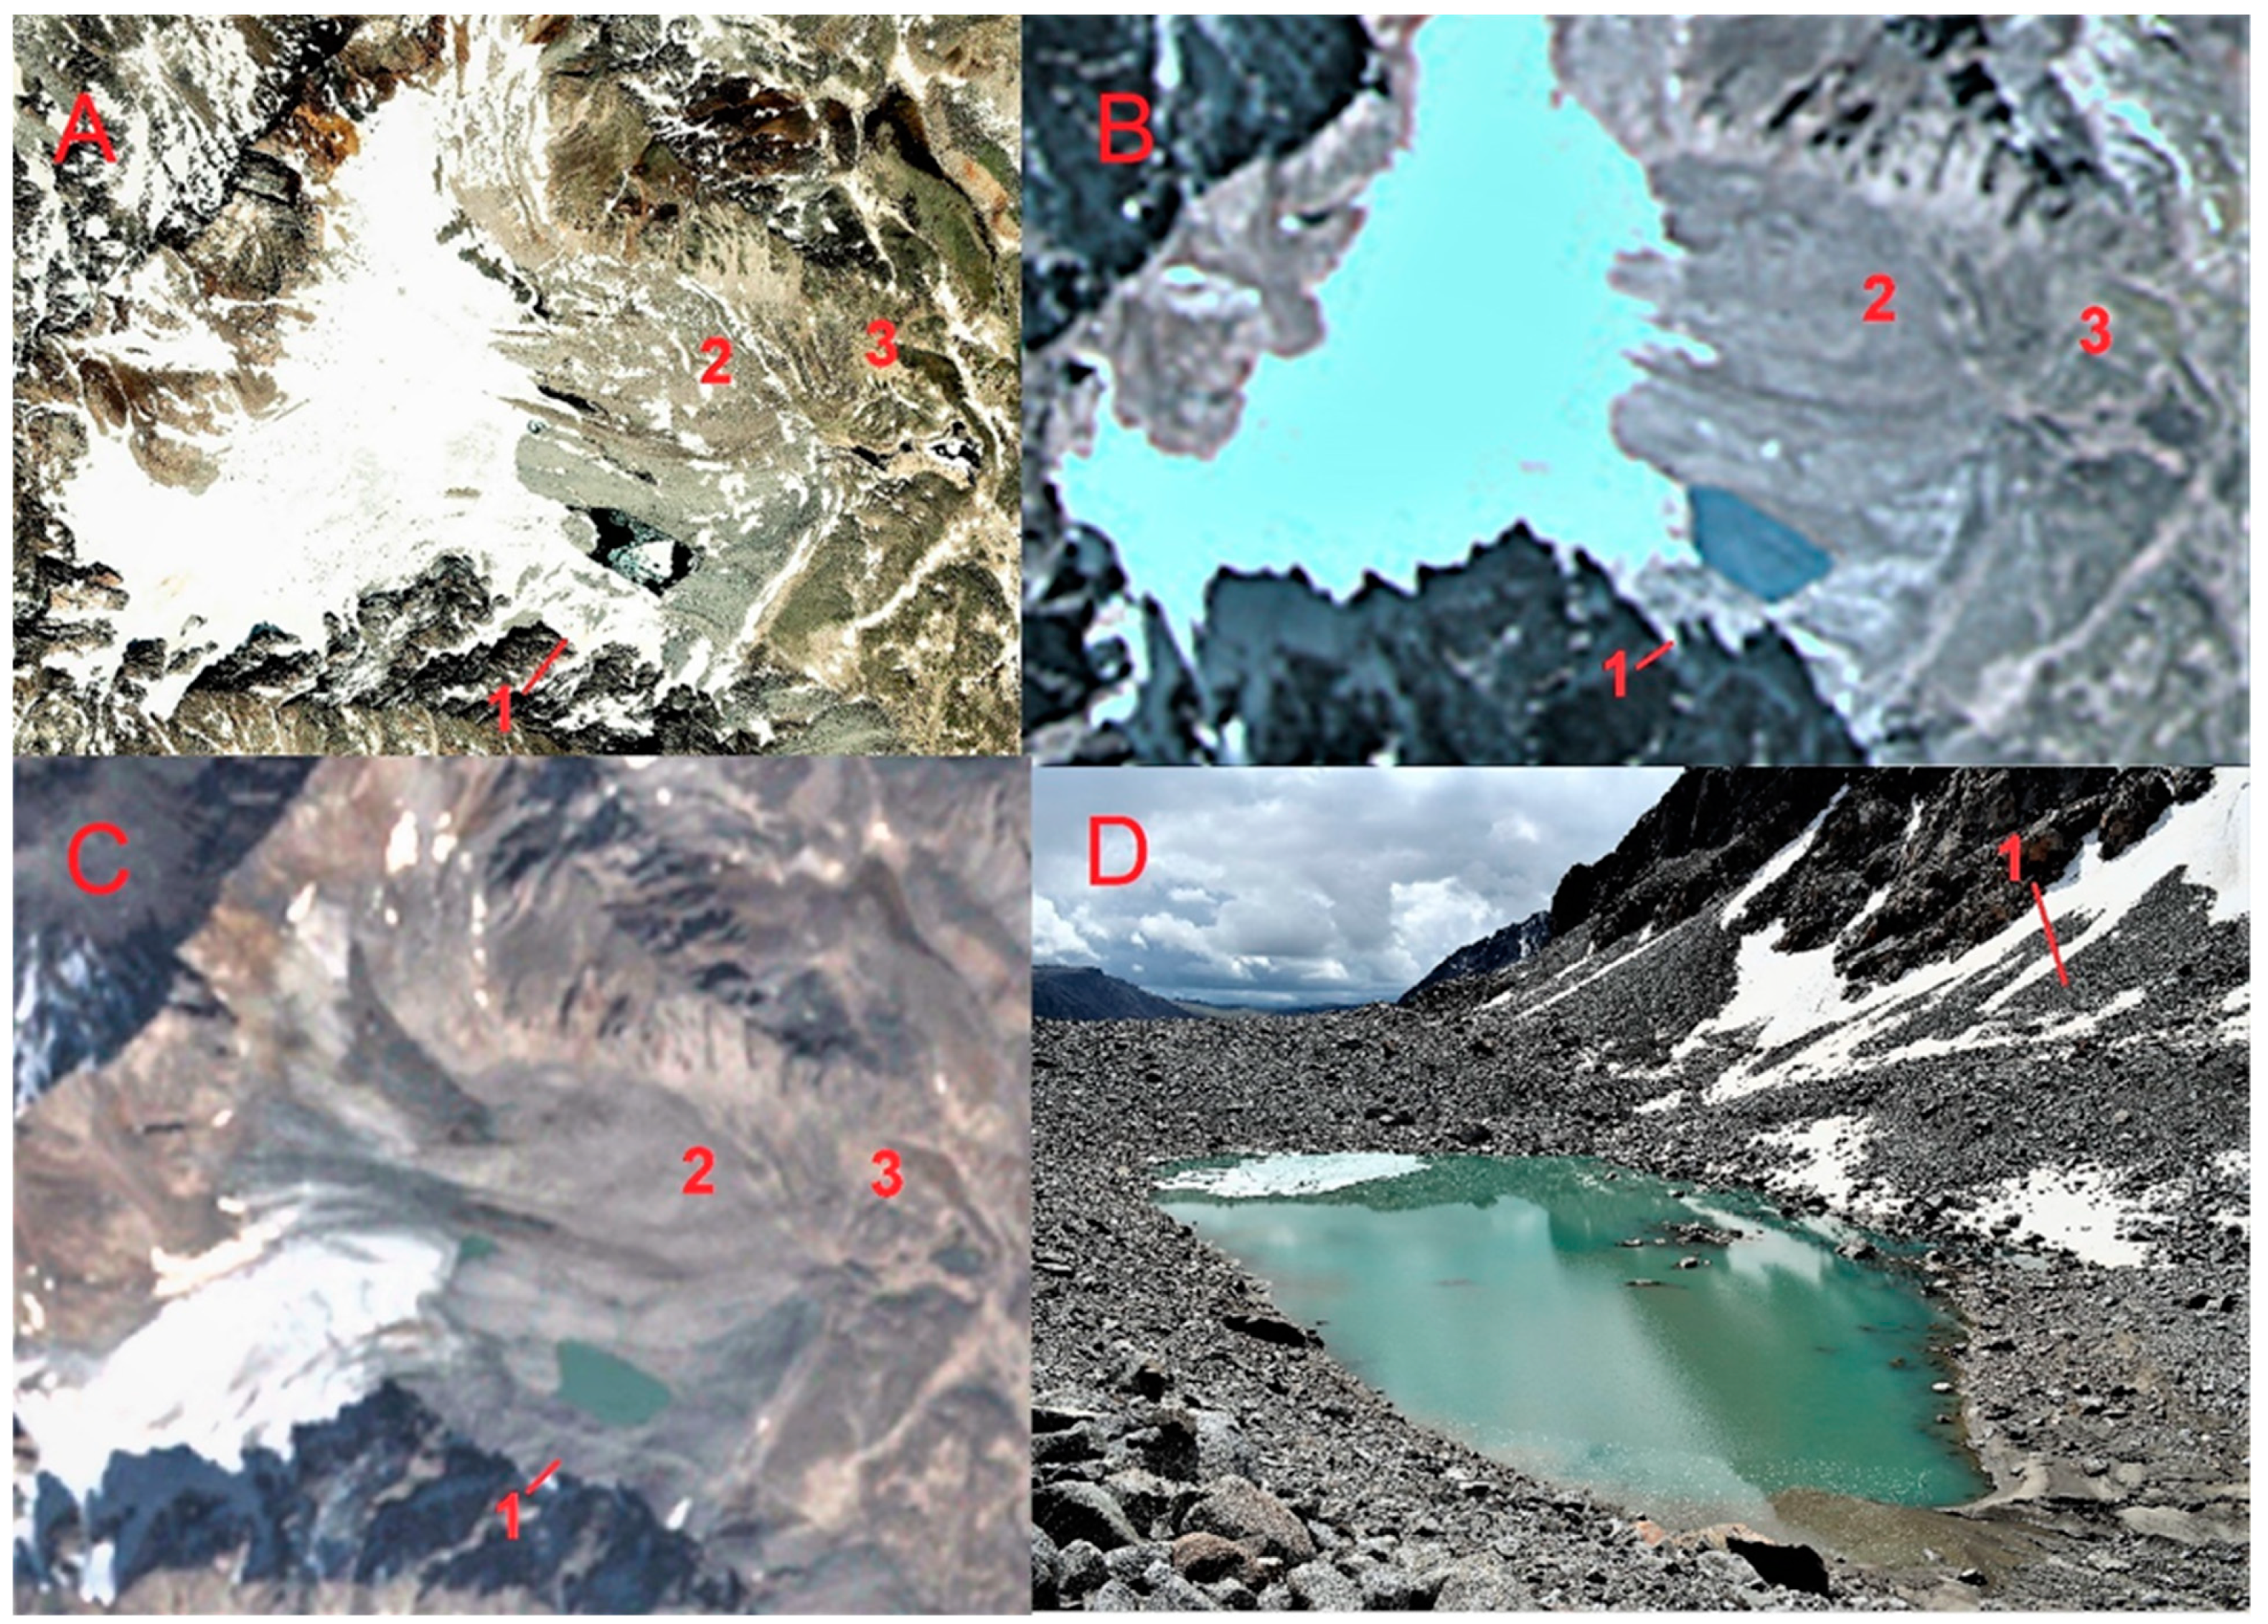
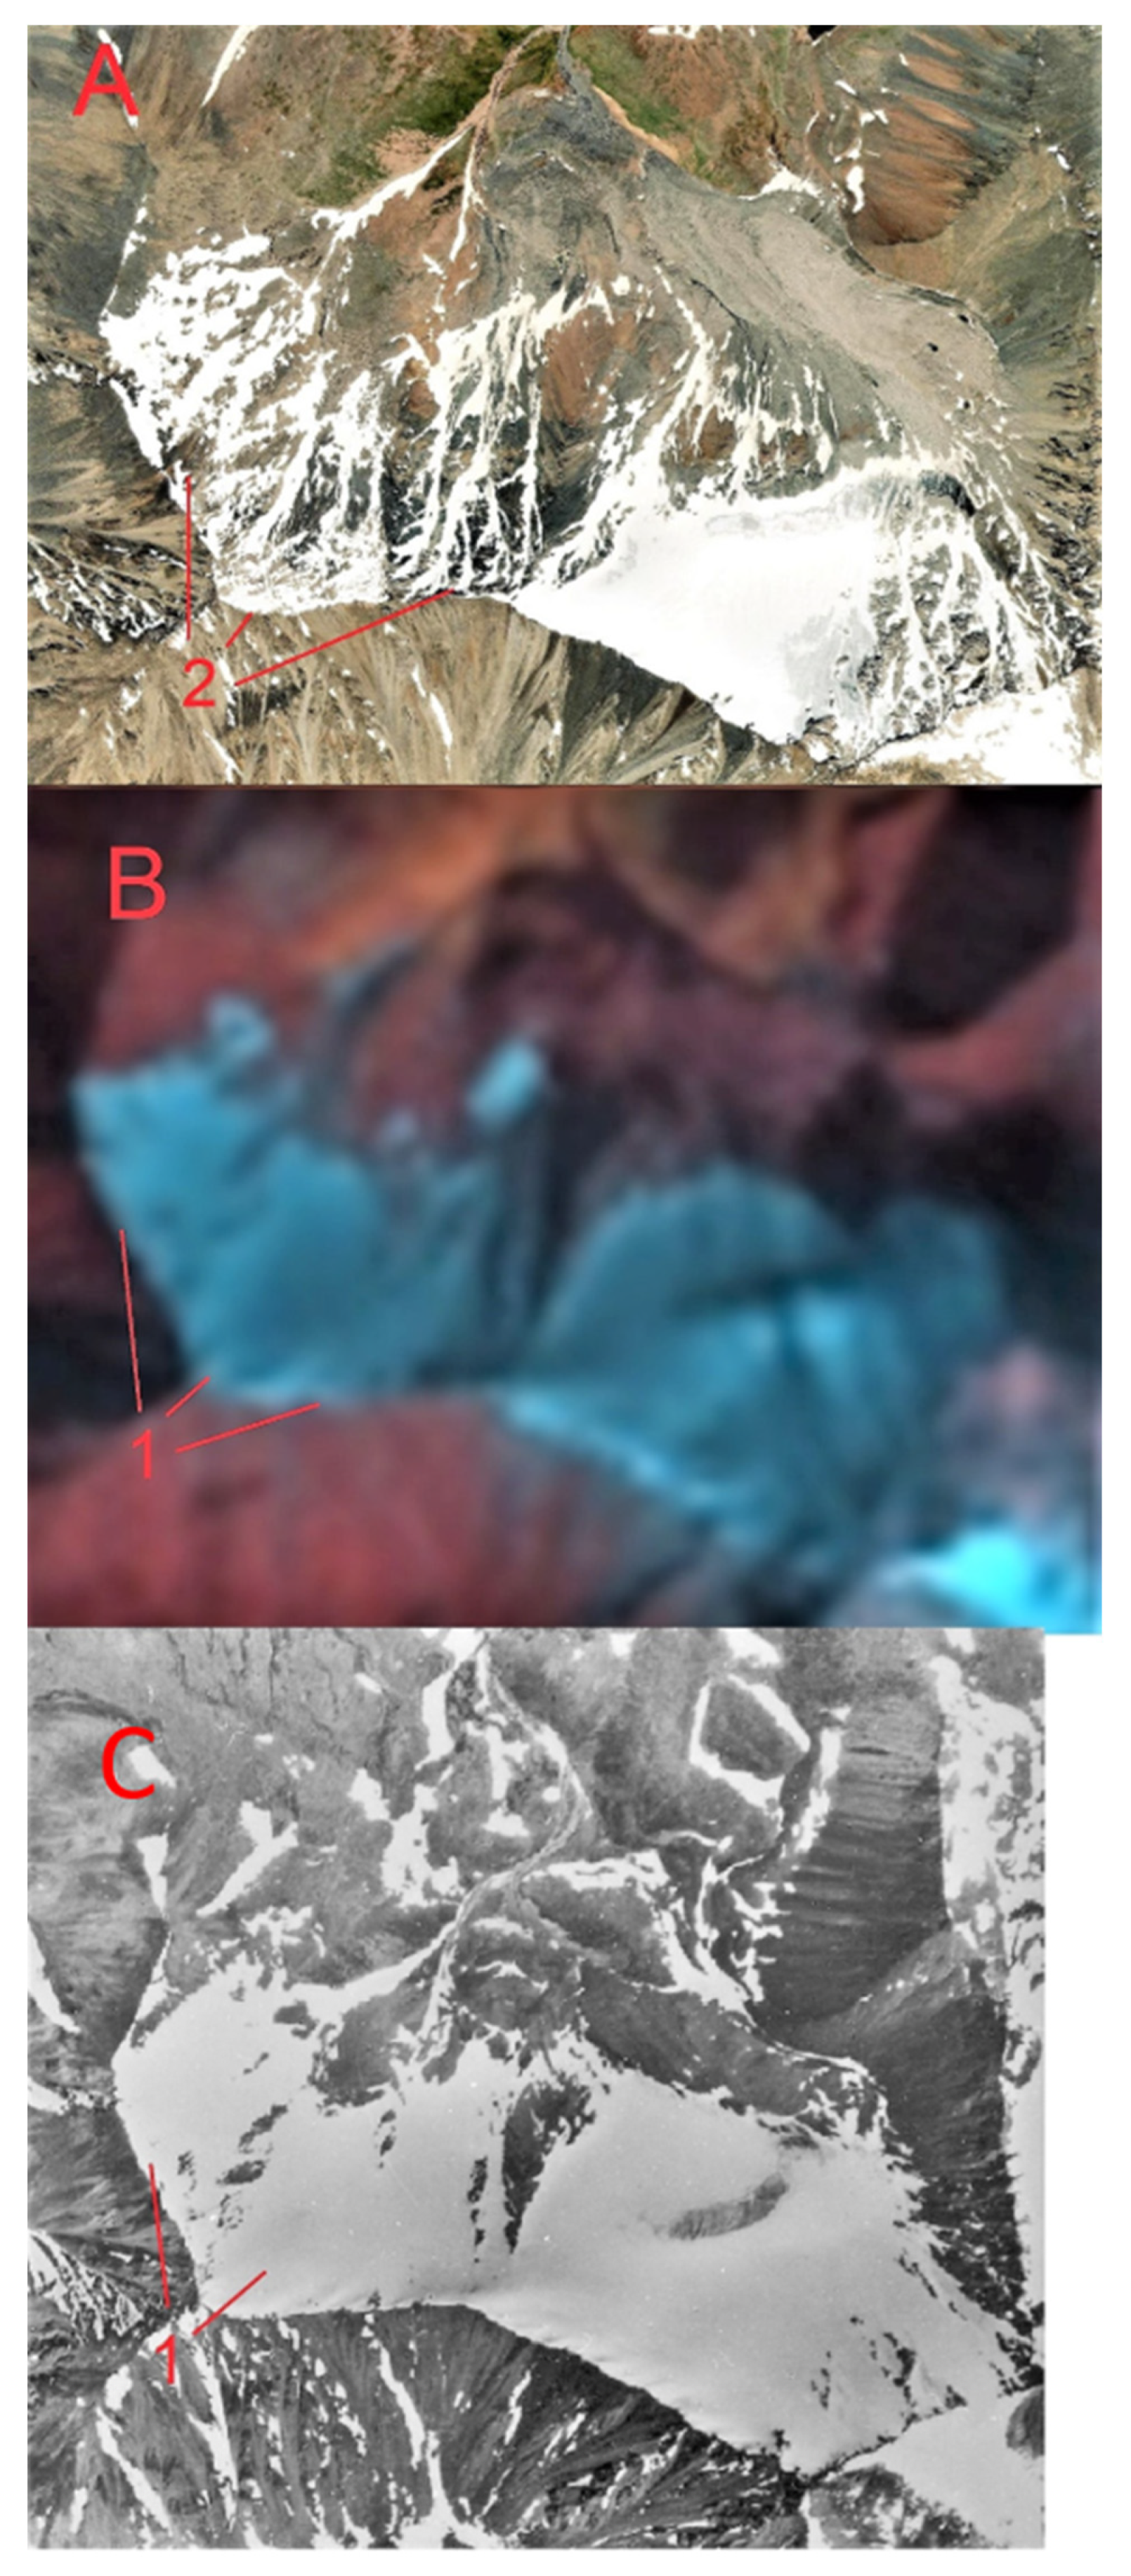
Much attention was paid to hanging glaciers, traditionally underestimated in paleo reconstructions, which do not form moraines. Diagnostics of such glaciers were carried out on nival niches with sharp outlines, indicating the recent degradation of the glaciers that formed them. As a rule, such niches are marked with modern snow patches. For some of these glaciers, the degradation process has occurred recently and was detected by our field observations and satellite and aerial photographs (Figure 5), making it possible to use the nival niches that remained in their place as interpretation standards.
There is no unambiguity in the estimates of the time of the culmination of the LIA glaciers and the formation of the corresponding moraine in Altai. According to some authors [65], the time of the greatest advance of glaciers corresponded to the 17th century, but most researchers believe that the greatest advance of glaciers belongs to the beginning [66] or to the middle of the 19th century [25,59,67]. The time of the LIA maximum in Altai was not recorded by direct observations. Okishev [41], on the basis of a study of many glaciers of the Russian Altai, came to the conclusion that the last stadial glacial cycle for each of the glaciers developed with some differences from others, i.e., there was no complete similarity in the details of the process. Another important conclusion: the universality of the stage of the 17th–19th centuries. and a two-fold glacial advance of equal scale. The latter means, on average, approximately the same size of glaciers during periods of movement in the early 17th and mid-19th centuries.
We do not have direct dating of the glacial advances of the LIA, but there are several results of 14C dating from Mongun-Taiga massif, characterizing the preceding warm period in the area of research: peat buried by debris cone (East Mugur valley) at altitude 2535 m (1190 ± 60 14C, 1130 ± 80 cal BP, (LU-6817)), soil buried by LIA moraine at altitude 2630 m (Right Mugur valley) (1280 ± 80 14C, 1200 ± 90 cal BP), (LU-6818) [25]. In our previous work, to reveal the time of the maximal glacial advance of the LIA we used the summer temperature and annual precipitation data obtained by dendrology to calculate mass balance changes for the level 3300 m (the firn line of the reconstructed LIA glaciers of Mongun-Taiga massif) [25]. According to the calculated mass balance curve, the period of climate, favorable to glaciers finished about 1790–1800, which was taken as the end of the “climatic” LIA, the intervals of subsequent strongly negative mass balance occurred around 1815, 1850, 1890 [25], Figure 5, the start of the glacial retreat was estimated by 1810–1820. However, this assumption was not supported by the estimations of the time of reaction of the termini positions to a climate change. Later we did such estimation for the fronts of four valley glaciers of Mongun-Taiga and the northern slope of Tavan Bogd on climatic fluctuations is estimated between 11 and 20 years, however, taking into account larger areas and higher thickness of the LIA glaciers that lag between the start of the period of negative mass balance and the start of the retreat of the glacier fronts could be longer. Moreover, the glaciers of Mongun-Taiga and north slope of Tavan Bogd massifs are relatively small, for larger glaciers exceeding the area of 5 km2 that period could be additionally longer. This is partly confirmed by the only known mid-19th century observation of the Altai glaciers, according to which the Katunsky glacier was still advancing in 1835 and started its retreat between 1835 and 1880 [14]. In 1835 the glacier may still be advancing, as indicated on the basis of geomorphological data by Okishev [41]. Thus, we cannot take the years before 1835 as the starting point for the general retreat of the Altai glaciers. In this case, the next minimum of the mass balance of glaciers around 1850 could become the starting point for the general retreat of the Altai glaciers, which we tentatively accepted in this article.

3. Results

To determine the scale of the reduction of glaciers from the LIA maximum, in the first stage of the work, information was obtained on 27 glacial centers in the southern part of Altai (Figure 1, Table 4), together with the information about the other glacial centers of Altai, taken from other sources. This made it possible to obtain a modern estimate of the glaciated area of the entire Altai mountain region—1096.55 km2.
It should be noted that the information on the northern part of Altai taken from literature data is less detailed compared to our data on the southern half of Altai. In addition, the data for a significant part of the glaciation centers in the northern part of Altai date back to 2003, and are therefore very outdated. In addition, in the literature sources that provide data for 2003, it is not indicated on what materials they were obtained. This does not allow us to estimate the measurement error, and the number of glaciers is not indicated either. The information on Katunsky, South-Chuya, and North-Chuya ridges are up to date, but the information about the systematic errors and the number of the glaciers is absent.
Based on this, our estimate of the modern glacier area throughout Altai should be considered preliminary, probably somewhat overestimated; only the evaluation of the number and area of glaciers in the southern half of Altai can be considered fully reliable: 1256 glaciers with total area 559.15 ± 31.13 km2.
The most developed are the glaciers in the central part of Altai, where the combination of elevation and amount of precipitation is optimal for them (Figure 6). To the north, the amount of precipitation increases, but this cannot compensate for the decrease in the altitude of the mountains. To the east and south, the maximum elevation of the mountains does not change significantly, but the amount of precipitation decreases, which is reflected in the reduction in the area of glaciers.
According to our reconstruction, in the southern half of the Altai mountainous country, at the maximum of the LIA, there were 2276 glaciers with total area 1348.43 km2, the subsequent decrease of the total glacier area makes 59% with average ELA rise of 106 m (Table 5). An example of glacial shrinkage after the LIA maximum is given in Figure 7. For the northern part of Altai, we used the only currently available estimate of the glacier area for the maximum of the LIA, taken from [41,69]. This estimate is very rough and the glacier area in it is underestimated, since the authors reconstructed mainly large glaciers, excluding completely disappeared glaciers and empty cirques. Taking into account these data, we estimate the total area of LIA glaciers of Altai by 2288.04 km2, and the subsequent glacier shrinkage by 47.9%. This is the first estimate of the glacier area of the entire Altai mountainous country and its reduction.
The analysis of the data obtained did not reveal a clear relationship between the glacier areas and their relative reduction (Figure 8). At the same time, there is some regularity: for glaciation centers with a small area of glaciers, the reduction could be both very high and very small, and for large glacial centers, the reduction of glaciers ranged from 44 to 55%. This is explained by the fact that large valley glaciers predominated in large glacial centers, which are least dependent on orographic factors and whose variability will be the most climate-dependent. In glacier centers with a small glacier area, high rates of decline are characteristic of shallow angled slope glaciers, while hanging glaciers located at high altitudes are more resistant to climate change.
Analysis of the ELA rise since the LIA maximum in the southern part of Altai (Figure 9) suggests that there are spatial differences in the conditions of glacier existence. On the more humid western and northern periphery of this territory, the rise of the firn boundary was 2 times higher than the rise of the firn boundary in the central and eastern arid part. Since, with a relatively small area of the considered territory, it is difficult to assume significant differences in temperature changes. A more realistic reason for such a difference is a different change in precipitation. Our assumption: after the LIA maximum in the relatively humid part of Altai, the amount of precipitation decreased significantly, while in the more arid part it changed little.
The reduction of the Altai glaciers has been and continues to be uneven in speed, but the early stages of this reduction have been little studied. For the largest of the glaciation centers studied, the Tavan Bogd massif, we considered the reduction of glaciers from the maximum of the LIA, and we obtained data on the reduction of glaciers from 1968 to 2020 with an average 10-year interval (Table 6).
The average glacier area decrease in the period 1850–1968 was relatively slow (0.66 km2/year). Within the interval of 1850–1968, it is very difficult to determine the internal heterogeneity of the reduction, but there is information about the retreat of some of the largest glaciers (Figure 10). Kanas glacier after 1909 started to retreat more rapidly, increasing the rate from 7.4 to 15.1 m/year, the retreat once again accelerated in the interval 1916–1959 to 34.2 m/year. However, in 1959–1968 the retreat decreased abruptly (10 m/year). Following the pattern of the retreat of the Kanas glacier, we suggest slow reduction of the glaciers in 1850–1909 with probable periods of glacial stabilization. There are no long-row meteorological stations on the territory of the Altai Mountains; most of the meteorological stations have been operating since the 1960s. Using indirect data, such as dendrochronological reconstructions of temperature and precipitation in the Altai region, we can assume similar periods of stabilization after a series of cold summer seasons, such as, for example, around 1883–1884 [70] or 1880 [25]. Another period of glacier stabilization around 1959–1968 is known by direct observations of the Malyi Aktru glacier (North-Chuya ridge) [71,72] and is marked by series of oscillation moraines within the complexes of the LIA.
After 1968 the decrease of the glaciers accelerated to average 1.66 km2/year. The periods of fast decrease in glacier area took place in 1977–1989 and 2000–2010 (Figure 10). However, the fastest retreat of the valley glaciers was later-between 2010 and 2018. To understand this behavior of glaciers, let us consider the data on changes in temperature and precipitation from the Kosh–Agach long-row meteorological station closest to the Tavan Bogd massif (Figure 11). The periods with high summer temperature and low precipitation, unfavorable for the glaciers took place in mid-60s, late 70s, and in 1989–2004, the second part of the last period mentioned was extremely negative for the glaciers. After 2004, the rise in temperatures slowed down, and the amount of precipitation increased significantly, making it possible to speak of some stabilization of the climatic conditions of the existence of glaciers at that time.
Extreme warm and dry period from mid 1990s till mid 2000s is well pronounced at many weather stations in Altai region. That “heatstroke” according to our earlier investigations caused a dramatic decrease in mass balance of the valley glaciers of the northern slope of Tavan Bogd [50]. As a result, many small glaciers disappeared or retreated very quickly in the following years. 30 small glaciers completely disappeared in Tavan Bogd in this interval, including 11 hanging, 7 cirque-hanging, 3 slope, 8 cirque, 1 niche glacier, with the total area of 2.25 km2. This was partly compensated or even overcompensated in case of the hanging glaciers by the appearance of new glaciers due to the disintegration of larger glaciers. Thus, the acceleration of the decrease in the area of glaciers in the Tavan Bogd massif in 2000–2010 was caused primarily by the degradation of small glaciers, especially cirque type (Table 7). In 2010–2020, the stabilization of temperatures and increase in precipitation, which we noted, caused a decrease in the rate of reduction of the area of glaciers of all types, except for the hanging and cirque-hanging glaciers. Such a slowdown in the reduction was most noticeable in cirque glaciers and less noticeable for the valley glaciers because the tongues of several largest valley glaciers retreated at a high speed, due to which the share of valley glaciers in the total reduction in glaciation slightly increased.
High rates of retreat of the snouts of the valley glaciers in 2010–2018 could be their delayed reaction on the rapid warming around 1995–2004. For example, we estimated reaction time of the valley glaciers of Argamgi-2 and Argamgi-3 by about 20 years [50]. Thus, the tongues of large glaciers began to shrink rapidly only after 2010. In the 2018–2021 interval, for four of the five examined valley glaciers, a slowdown in retreat was revealed, including the data obtained by in situ observations. Perhaps this is a sign that the glaciers are adjusting to the new climatic conditions and will not be rapidly shrinking in the near future, but it is too early to speak about this with certainty without additional observations.

4. Discussion

Estimates of the area and number of modern glaciers in Altai refer to territories bounded by the borders of states, respectively, they were obtained as of different time periods, using various materials and methods. The first catalogue of the Altai glaciers, which included 408 glaciers with a total area of 590 km2, was made by Tronov in 1925 [15]. The next catalogue, created by Tronov, contained 724 glaciers with an area of 600 km2 [73]. In 1960s–1970s the glaciers of Altai were included in the Catalogue of glaciers of the USSR, due to the usage of aerial imagery it was fuller: about 1030 glaciers with a total area of 805 km2. From that period for a long time no catalogization of Russian Altai has been done and the information from the catalogue became outdated. Recently a group of scientists created a new catalogue of the recent glaciers of Russia, based on 2016–2019 Sentinel imagery, according to this research the glaciation of Russian Altai is currently represented by 988 glaciers with a total area of 523.1 ± 38.3 km2. Information on three largest glacial centers of the Russian Altai on basis of this research is given in [74] and was used in our estimate of the total glacier area of all Altai mountainous system. Unfortunately, there are no statistics on other glacial centers of the Russian Altai, which prevents the use of this information for the northern part of Altai in our work.
In Kazakhstan by 2015 there were 116 glaciers with a total area of 37.212 km2 [23]. In Mongolia according to Kamp and Pan in 2010 672 glaciers covered an area of 372.3 km2 [75] (Landsat imagery had been used). In the Chinese Altai 403 glaciers are known with the total area of 280 km2 [18]. We did not aim to evaluate the glaciation of the parts of Altai, belonging to different states, on the contrary we assessed the glaciation of the ridges as a whole, ignoring the administrative boundaries. Therefore, it is hard to compare these estimates with our results.
The most modern assessment of the modern glaciation of the entire Altai currently exists within the framework of Randolf Glacier Inventory: 2446 glaciers 1163 ± 102 km2, glacier outlines were obtained from Landsat images with acquisition dates between 1999 and 2013 [76]. This is higher than our estimate (1096.55 km2), which is probably due to later dates of the imagery that we have used in the current research (from 2006 to 2020) and that was used for the largest glacial centers of the Russian Altai (2017 [74]), and further degradation of the glaciers between those periods.
Most of the reconstructions of the LIA glaciers of Altai have been done for the Russian Altai [41,77] and they were used in our work to estimate the total area of the glaciers of the whole mountainous system. Also, there was a reconstruction of LIA glaciers for Turgen-Kharkhiraa mountains [35], based on field work, topographic maps and aerial photographs, the reconstructed LIA glaciers were compared to their state in 1991. For Turgen Lehmkuhl reconstructed a 56% reduction of the total glacial area from the LIA to 1991 (from 76.7 to 33.8 km2) with ∆ELA 81 m. This is different from our estimate: 48% reduction from the LIA to 2006, ∆ELA 35 m. For Kharkhiraa Lehmkuhl estimated 31% reduction, 76 m ∆ELA; we reconstructed 58% reduction, with ∆ELA of 60 m. The discrepancy is mainly caused by the difference in the LIA area reconstructions: though near the snouts of the valley glaciers both reconstructions are very similar, in the upper parts of the glaciers Lehmkuhl gives continuous glacial cover, especially in the eastern parts of both massifs. In our reconstructions, there are more bare ice-divides between the glacial flows that reduce the total area of glaciation in the LIA.
In our previous publications, we reconstructed in detail the LIA glaciers of different glacial centers of Altai and their gradual reduction [50,78,79,80,81]. The first generalization of our data on LIA reconstructions and subsequent reduction of glaciers was made by us for the arid regions of Altai (533 contemporary glaciers with the total area 313.4 km2, 450 LIA glaciers with the total area 635.6 km2). Since then, we obtained the data on over 1800 LIA glaciers, including the areas of the south and western slope of Tavan Bogd, the rest of the Mongolian Altai, the whole Chinese Altai and Shapshalsky glacial center in the Russian Altai and updated the information about the recent glaciation of some areas (for example, Tsambagarav). As a result, we obtained a higher percentage of glacier shrinkage from the LIA maximum (59% instead of 51% in the earlier publication). Since we included areas with a relatively more humid climate in this study, our results may serve as evidence of a more intensive reduction of glaciers in the humid part of Altai and indirect confirmation of our assumption about a decrease in precipitation there after the LIA maximum. However, it will be possible to discuss this with greater awareness after the complete reconstruction of the glaciation of the northern part of Altai in the LIA.
The uneven nature of glacier recession after the LIA maximum is confirmed by studies on the glaciers of the Russian Altai. The periods of slowdown of glacial retreat or stabilization of the glaciers (North-Chuya and Katunsky ridges) are marked by oscillation moraines, their age was determined mainly from direct observations and date back to 1909–1914, to the end of the 1920s, to the beginning of the 1930s, to the 1940s, with general tendencies of slowdown of glacial retreat in the interval 1952–1995 [79]. The newest investigations of the same area show the double increase of the area shrinkage rates between 2008–2017 compared to the one in the period 1968–2008 [74]. This partly matches with our data on the increased rates of the glacial shrinkage of Tavan Bogd glaciers in 2000–2010; of course, the behavior of the glaciers of those different glacier centers could be not quite synchronous due to different climatic conditions, morphology, and size of the glaciers.
Currently, in different mountain regions of the world, studies are being carried out on the reconstruction of the glaciers of the LIA maximum and its subsequent reduction. Most of them are local, due to which the results are greatly influenced by the morphological features of glaciers and orographic factors. However, there are regional studies that reveal similarities and differences in glacier behavior in different parts of the world.
For example, in the European Alps according to Zemp et al. [34] the total area of the glaciers decreased from 4400 km2 in 1850 to 2900 km2 in 1970 and 2200 km2 by 2020. This means 54.5% shrinkage of the glaciers by 2000 already, which is more than what we estimated for the Altai region by 2003–2020 (47.9%). Moreover, there is no doubt that since 2000 the percentage of glacial decrease in the Alps has grown. On the other hand, the data that we have obtained for the southern part of the Altai are more reliable than the estimates for the whole Altai region (due to more up-to date information, higher resolution of reconstruction and coherent methodological approach, providing more homogeneous results). For the southern part of Altai we estimated a 59% glacial decrease by 2006–2020, which is closer to the results for the Alps. In order to reasonably compare our data with the data for the Alpine region, let us take the reconstruction of the glaciation of the Tavan Bogd massif, for which we can choose a similar period of 1850–2000. Our results for Tavan Bogd (37.6%) show, that glacial shrinkage in Altai has been slower for that period. Paul and Bolch [82] analyzed the information of different authors on the changes of the glaciers of the Alps after the LIA and revealed an area loss of about 30 to 40% (or 0.3%/a) from 1850 to the 1970s, a further 15–20% (or 0.6%/a) from 1973 until 2000 (that mostly occurred after 1985), a further 10–15% from 2000 to 2010 (or 1.2%/a), and a total of 50–60% for the entire period. The most up-to-date estimate is 60% decrease by 2015 (Table 8) [83].
Unfortunately, no general estimates of ELA rise for the entire European Alps are known. Regional estimates of ELA changes in the Alps between the mid-19th century and ~1970, based on AAR calculations, suggests an ELA rise of ~69 m for the Swiss Alps [84] and ~94 m for the Austrian Alps [85]. A further rise of the ELA between 1984 and 2010 by about 170 m was estimated for the Western Alps [86]. Thereby very roughly the total ELA rise for the European Alps could be estimated with values over 200 m. For Tavan Bogd we found 21.1% area loss for 1850–1968, 16.5% between 1968 and 2000, and 19.3% between 2000 and 2010. The ELA increase reached 120 m only by 2020. Therefore, Tavan Bogd glaciers generally retreated slower, with the exception of the period of 2000–2010.
Other known reconstructions of the glacier reduction after the LIA are less comparable to our results either because of the different time intervals of glacial shrinkage, local scale of investigations or lack of area shrinkage estimations.
In Northern Norway, there was a steady reduction in area (~0.3% per year) between the LIA peak (~1915) and 1988, which paused between 1988 and 2001, then the rate of recession accelerated to ~1% per year between 2001 and 2014 [87].
The glacier retreat in the tropical Andes over the last three decades is unprecedented since the peak extent of the LIA (mid-17th–early 18th century). In terms of changes in mass balance, the trend has been quite negative over the past 50 years, with a shift to more negative mass balance in the late 1970s. The mean annual mass balance per year decreased from −0.2 m water equivalent. in the period 1964–1975 to −0.76 m water equivalent in the period 1976–2010. The retreat was much more pronounced on small glaciers at low altitudes [88].
In the Northern Caucasus since the LIA maximum in the middle of 19th century CE, glacier lengths have decreased by more than 1000 m, and front elevations have increased by more than 200 m [40].
In the Central and Western Himalaya, the total length and total area of 220 glaciers had decreased respectively by 35% and 31% since the LIA, the mean increase of ELAs from the LIA to the first decade of the 21st century, as reconstructed using the toe-to-ridge altitude method (TRAM), based on the assumption that the ELA lies at a fixed proportion of the altitudinal difference between the highest and lowest points of a glacier, was 123 m [89].
In Southeast Tibet an average retreat of ~27% (length change) has been revealed and a trend toward stronger retreat for smaller glaciers, with an average rise in ELA of ~136 m since the LIA [36].
Evaluation of the recession of Akshiirak and Ala Archa glacial centers, Tien Shan, Central Asia, showed that the area shrinkage of Akshiirak and Ala Archa was 4.2% and 5.1%, respectively, from 1943 to 1977, and 8.7% and 10.6%, respectively, from 1977 to 2003 [90]. In the eastern Terskey–Alatoo Range of the Tien Shan Mountains, mapping of 109 glaciers using the 1965 1:25,000 maps revealed that glacier surface area decreased by 12.6% of the 1965 value between 1965 and 2003 [91].
In general, all the data on the reduction of glaciers from the LIA maximum are in good agreement with our results for the Altai, and the close values of the reconstructed rise of ELA are a possible argument in favor of a similar scale of temperature changes in different mountainous regions of the planet.

5. Conclusions

This article is one of the stages of work on the reconstruction of the LIA maximum glaciation for the entire Altai mountainous country. Accordingly, further prospects for this work are the reconstruction of the LIA glaciers for the northern part of Altai, bringing coherent information on the present-day glaciation of the entire range into uniformity (for example, updating outdated catalogs in accordance with the state of glaciers for 2016–2020). Another objective is to obtain information on the state of glaciers of the entire Altai for several time sections starting in the mid-20th century to establish spatial and temporal differences in glacier shrinkage. Such work will provide a statistical basis for differences in the behavior of glaciers of different types, climatic conditions of existence, orographic conditions and their different responses to climatic changes. This, in turn, is necessary for a competent forecast of the behavior of glaciers in the future.

Author Contributions

Conceptualization, D.G. and K.C.; methodology, D.G., E.D., A.T. and E.K.; software, A.T.; formal analysis, K.C.; investigation, D.G., E.D., D.B. and V.R.; writing—original draft preparation, D.G.; writing—review and editing, D.G.; supervision, D.G. and K.C.; project administration, D.G. funding acquisition, D.G. All authors have read and agreed to the published version of the manuscript.

Funding

This research was funded by the Russian Foundation for Basic Research (RFBR), grant number No.19-05-00535.

Data Availability Statement

The current article.

Acknowledgments

RFBR 19-05-00535 Natural catastrophes and transformation of the landscapes of the southeastern Altai and northwestern Mongolia in the period from the maximum of the last glaciation.

Conflicts of Interest

The authors declare no conflict of interest.

References

  1. Haeberli, W. Glacier Fluctuations and Climate Change Detection. Geogr. Fis. Dinam. Quat. 1995, 1, 191–199. [Google Scholar]
  2. Bahr, D.B.; Dyurgerov, M.; Meier, M.F. Sea-Level Rise from Glaciers and Ice Caps: A Lower Bound. Geophys. Res. Lett. 2009, 36, 4. [Google Scholar] [CrossRef]
  3. Meier, M.F.; Roots, E.F. Glaciers as a Water Resource. Nat. Resour. 1982, 18, 7–14. [Google Scholar]
  4. Barnett, T.P.; Adam, J.C.; Lettenmaier, D.P. Potential Impacts of a Warming Climate on Water Availability in Snow-Dominated Regions. Nature 2005, 438, 303–309. [Google Scholar] [CrossRef]
  5. Francou, B.; Coudrain, A. Glacier Shrinkage and Water Resources in the Andes. Eos Trans. Am. Geophys. Union 2005, 86, 415. [Google Scholar] [CrossRef] [Green Version]
  6. Bradley, R.S.; Vuille, M.; Diaz, H.F.; Vergara, W. Threats to Water Supplies in the Tropical Andes. Science 2006, 312, 1755–1756. [Google Scholar] [CrossRef] [PubMed]
  7. Carey, M. Living and Dying with Glaciers: People’s Historical Vulnerability to Avalanches and Outburst Floods in Peru. Glob. Planet. Change 2005, 47, 122–134. [Google Scholar] [CrossRef]
  8. Rudoy, A.N. Glacier-Dammed Lakes and Geological Work of Glacial Superfloods in the Late Pleistocene, Southern Siberia, Altai Mountains. Quat. Int. 2002, 87, 119–140. [Google Scholar] [CrossRef]
  9. Chistyakov, K.V.; Ganiushkin, D.A. Glaciation and Thermokarst Phenomena and Natural Disasters in the Mountains of North-West Inner Asia. In Environmental Security of the European Cross-Border Energy Supply Infrastructure; Culshaw, M.G., Osipov, V.I., Booth, S.J., Victorov, A.S., Eds.; Springer: Dordrecht, The Netherlands, 2015; pp. 207–218. [Google Scholar]
  10. Vergara, W.; Deeb, A.M.; Valencia, A.M.; Bradley, R.S.; Francou, B.; Zarzar, A.; Grünwaldt, A.; Haeussling, S.M. Economic Impacts of Rapid Glacier Retreat in the Andes. Eos Trans. Am. Geophys. Union 2007, 88, 261–264. [Google Scholar] [CrossRef]
  11. Ganyushkin, D.A.; Chistyakov, K.V.; Bueva, M.V. Variability of the Altitude Position of the Firn Line on the Glaciers of the Altai-Sayan Mountainous Country and Its Relation to Climatic Parameters. Proc. Russ. Geogr. Soc. 2013, 145, 45–53. (In Russian) [Google Scholar]
  12. Galakhov, V.P.; Red’kin, A.G. Present and Past Glaciation of Tabyn-Bogdo-Ola Mountain Knot. Geogr. Nat. Manag. Sib. 2001, 4, 153–175. (In Russian) [Google Scholar]
  13. Klinge, M.; Böhner, J.; Lehmkuhl, F. Climate Pattern, Snow- and Timberlines in the Altai Mountains, Central Asia. Erdkunde 2003, 57, 296–308. [Google Scholar] [CrossRef]
  14. Tronov, M.V. Essays of the Altai Glacierization; Geografgiz: Moscow, Russia, 1949. [Google Scholar]
  15. Tronov, B.V. Catalog of Altai Glaciers. Bull. Russ. Geogr. Soc. 1925, 57, 107–159. [Google Scholar]
  16. Petrov, N.B.; Schetinnikov, A.S. Katalog Lednikov SSSR. The USSR Glacier Inventory; Gidrometeoizdat: Leningrad, Russia, 1974; Volume 15. [Google Scholar]
  17. Khromova, T.Y.; Nosenko, G.A.; Glazovsky, A.F.; Muraviev, A.Y.; Nikitin, S.A.; Lavrentiev, I.I. New Inventory of the Russian Glaciers Based on Satellite Data (2016–2019). Ice Snow 2021, 61, 341–358. [Google Scholar] [CrossRef]
  18. Shi, Y.; Huang, M.; Yao, T.; He, Y. Glaciers and Related Environments in China; Sience Press: Beijing, China, 2008. [Google Scholar]
  19. Shi, Y.; Liu, C.; Kang, E. The 2nd Glacier Inventory of China. Ann. Glaciol. 2009, 50, 1–4. [Google Scholar] [CrossRef] [Green Version]
  20. Liu, C.; You, G.; Pu, J. (Eds.) Glacier Inventory of China II. Altai Mountains. In Chinese with English Summary; Lanzhou Institute of Glaciology and Cryopedology: Beijing, China, 1982. [Google Scholar]
  21. Kamp, U.; Krumwiede, B.; Mcmanigal, K.; Pan, C.; Walther, M.; Dashtseren, A. The Glaciers of Mongolia; University of Colorado: Denver, CO, USA, 2013. [Google Scholar]
  22. Krumwiede, B.S.; Kamp, U.; Leonard, G.J.; Kargel, J.S.; Dashtseren, A.; Walther, M. Recent Glacier Changes in the Mongolian Altai Mountains: Case Studies from Munkh Khairkhan and Tavan Bogd. In Global Land Ice Measurements from Space; Kargel, J.S., Leonard, G.J., Bishop, M.P., Kääb, A., Raup, B.H., Eds.; Springer: Berlin/Heidelberg, Germany, 2014; pp. 481–508. ISBN 978-3-540-79818-7. [Google Scholar]
  23. Vilesov, N. Changes in the Size and Condition of the Glaciers in Kazakhstan for the Last 60 Years (1955–2015). Ice Snow 2018, 58, 159–170. [Google Scholar] [CrossRef]
  24. Kotlyakov, V.M.; Chernova, L.P.; Zverkova, N.M.; Khromova, T.E. The One-and-a-Half-Century Reduction of Altai Glaciers in Russia and Kazakhstan. Dokl. Earth Sci. 2014, 458, 1307–1311. [Google Scholar] [CrossRef]
  25. Ganiushkin, D.; Chistyakov, K.; Kunaeva, E. Fluctuation of Glaciers in the Southeast Russian Altai and Northwest Mongolia Mountains since the Little Ice Age Maximum. Environ. Earth Sci. 2015, 74, 1883–1904. [Google Scholar] [CrossRef]
  26. Oerlemans, J. Extracting a Climate Signal from 169 Glacier Records. Science 2005, 308, 675–677. [Google Scholar] [CrossRef] [Green Version]
  27. Zemp, M.; Frey, H.; Gärtner-Roer, I.; Nussbaumer, S.U.; Hoelzle, M.; Paul, F.; Haeberli, W.; Denzinger, F.; Ahlstrøm, A.P.; Anderson, B.; et al. Historically Unprecedented Global Glacier Decline in the Early 21st Century. J. Glaciol. 2015, 61, 745–762. [Google Scholar] [CrossRef] [Green Version]
  28. Solomina, O.N. Retreat of Mountain Glaciers of Northern Eurasia since the Little Ice Age Maximum. Ann. Glaciol. 2000, 31, 26–30. [Google Scholar] [CrossRef] [Green Version]
  29. Solomina, O.N.; Bradley, R.S.; Jomelli, V.; Geirsdottir, A.; Kaufman, D.S.; Koch, J.; McKay, N.P.; Masiokas, M.; Miller, G.; Nesje, A.; et al. Glacier Fluctuations during the Past 2000 Years. Quat. Sci. Rev. 2016, 149, 61–90. [Google Scholar] [CrossRef] [Green Version]
  30. Grove, J.M. The Little Ice Age; Methuen: London, UK, 1988. [Google Scholar]
  31. Rabatel, A.; Francou, B.; Jomelli, V.; Naveau, P.; Grancher, D. A Chronology of the Little Ice Age in the Tropical Andes of Bolivia (16° S) and Its Implications for Climate Reconstruction. Quat. Res. 2008, 70, 198–212. [Google Scholar] [CrossRef]
  32. Forel, F.-A. Les Variations Périodiques Des Glaciers. Discours Préliminaire. Arch. Sci. Phys. Nat. 1895, 34, 209–229. [Google Scholar]
  33. Holzhauser, H.; Zumbühl, H.J. To the History of the Lower Grindelwald Glacier during the Last 2800 Years—Paleosols, Fossil Wood and Pictorical Records—New Results. Z. Geomorphol. Suppl. 1996, 104, 95–127. [Google Scholar]
  34. Zemp, M.; Paul, F.; Hoelzle, M.; Haeberli, W. Glacier Fluctuations in the European Alps, 1850–2000: An Overview and Spatio-Temporal Analysis of Available Data. In Darkening Peaks: Glacier Retreat, Science, and Society; University of California press: Berkeley, CA, USA, 2008; pp. 152–167. [Google Scholar]
  35. Lehmkuhl, F. Holocene Glaciers in the Mongolian Altai: An Example from the Turgen-Kharkhiraa Mountains. J. Asian Earth Sci. 2012, 52, 12–20. [Google Scholar] [CrossRef]
  36. Loibl, D.; Lehmkuhl, F.; Grießinger, J. Reconstructing Glacier Retreat since the Little Ice Age in SE Tibet by Glacier Mapping and Equilibrium Line Altitude Calculation. Geomorphology 2014, 214, 22–39. [Google Scholar] [CrossRef]
  37. Patzelt, G. The Period of Glacier Advances in the Alps, 1965 to 1980. Z. Gletsch. Glazialgeol. 1985, 21, 403–407. [Google Scholar]
  38. Zasadni, J. The Little Ice Age in the Alps: Its Record in Glacial Deposits and Rock Glacier Formation. Landf. Evol. Mt. Areas 2007, XLI, 117–137. [Google Scholar]
  39. Colucci, R.R.; Žebre, M. Late Holocene Evolution of Glaciers in the Southeastern Alps. J. Maps 2016, 12, 289–299. [Google Scholar] [CrossRef]
  40. Solomina, O.; Bushueva, I.; Dolgova, E.; Jomelli, V.; Alexandrin, M.; Mikhalenko, V.; Matskovsky, V. Glacier Variations in the Northern Caucasus Compared to Climatic Reconstructions over the Past Millennium. Glob. Planet. Change 2016, 140, 28–58. [Google Scholar] [CrossRef]
  41. Okishev, P.A. Rel’ef i Oledenenie Russkogo Altaja; Izd. Tom. un-ta: Tomsk, Russia, 2011. [Google Scholar]
  42. Narozhnyj, J.K.; Nikitin, S.A. The Modern Glaciation of Altai at the Turn of the 21st Century. Data Glaciol. Stud. 2003, 95, 11–93. (In Russian) [Google Scholar]
  43. Narozhny, J.K.; Nikitin, S.A.; Borodavko, P.S. Glaciers of the Belukha Mountain Knot (Altai): Mass Exchange, Dynamics and Ice Resourses Distribution. Data Glaciol. Stud. 2006, 101, 117–128. [Google Scholar]
  44. Narozhnyj, J.K. Resursnaja Ocenka i Tendencii Izmenenija Lednikov v Bassejne Aktru (Altaj) Za Poslednie Poltora Stoletija. Resource Assessment and Trends in Glacier Change in the Aktru Basin (Altai) over the Past Century and a Half. Data Glaciol. Stud. 2001, 90, 117–125. (In Russian) [Google Scholar]
  45. Seliverstov, Y.P. Modern Glaciation of Mungun-Taiga (South-West of Tuva). Bull. All-Union Geogr. Soc. 1972, 104, 40–44. (In Russian) [Google Scholar]
  46. Ganyushkin, D.A.; Chistyakov, K.V.; Volkov, I.V.; Bantcev, D.V.; Kunaeva, E.P.; Terekhov, A.V. Present Glaciers and Their Dynamics in the Arid Parts of the Altai Mountains. Geosciences 2017, 7, 117. [Google Scholar] [CrossRef] [Green Version]
  47. USGS. Available online: https://earthexplorer.usgs.gov/ (accessed on 4 March 2021).
  48. Scanex. Available online: www.scanex.ru (accessed on 1 May 2017).
  49. Kääb, A.; Bolch, T.; Casey, K.; Heid, T.; Kargel, J.S.; Leonard, G.J.; Paul, F.; Raup, B.H. Glacier Mapping and Monitoring Using Multispectral Data. In Global Land Ice Measurements from Space; Kargel, J.S., Leonard, G.J., Bishop, M.P., Kääb, A., Raup, B.H., Eds.; Springer: Berlin/Heidelberg, Germany, 2014; pp. 75–112. ISBN 978-3-540-79818-7. [Google Scholar]
  50. Ganyushkin, D.; Chistyakov, K.; Volkov, I.; Bantcev, D.; Kunaeva, E.; Andreeva, T.; Terekhov, A.; Otgonbayar, D. Present Glaciers of Tavan Bogd Massif in the Altai Mountains, Central Asia, and Their Changes since the Little Ice Age. Geosciences 2018, 8, 414. [Google Scholar] [CrossRef] [Green Version]
  51. Earth Resources Observation and Science (EROS) Center. Available online: https://eros.usgs.gov/ (accessed on 3 April 2018).
  52. Kurowski, L. Die Hohe Der Schneegrenze Mit Besonderer Berucksichtigung Der Finsteraargorngruppe. Pencks Geogr. Abh. 1891, 5, 115–160. (In German) [Google Scholar]
  53. Glazyrin, G.E. Distribution and Regime of Mountain Glaciers; Hydrometeoizdat: Leningrad, Russia, 1985. [Google Scholar]
  54. Braithwaite, R. From Doktor Kurowski’s Schneegrenze to Our Modern Glacier Equilibrium Line Altitude (ELA). Cryosphere 2015, 9, 2135–2148. [Google Scholar] [CrossRef] [Green Version]
  55. Ganyushkin, D.A.; Konkova, O.S.; Chistyakov, K.V.; Ekaykin, A.A.; Volkov, I.V.; Bantcev, D.V.; Terekhov, A.V.; Kunaeva, E.P.; Kurochkin, Y.N. The State of the Shapshalsky Glacierization Center (Eastern Altai) in 2015. Ice Snow 2021, 61, 38–57. [Google Scholar] [CrossRef]
  56. Dyurgerov, M.; Meier, M.F.; Bahr, D.B. A New Index of Glacier Area Change: A Tool for Glacier Monitoring. J. Glaciol. 2009, 55, 710–716. [Google Scholar] [CrossRef] [Green Version]
  57. Miles, E.; McCarthy, M.; Dehecq, A.; Kneib, M.; Fugger, S.; Pellicciotti, F. Health and Sustainability of Glaciers in High Mountain Asia. Nat. Commun. 2021, 12, 2868. [Google Scholar] [CrossRef] [PubMed]
  58. Braithwaite, R.J.; Raper, S.C.B. Estimating Equilibrium-Line Altitude (ELA) from Glacier Inventory Data. Ann. Glaciol. 2009, 50, 127–132. [Google Scholar] [CrossRef] [Green Version]
  59. Akovetskii, V.I. Image Interpretation; Nedra: Moscow, Russia, 1983. [Google Scholar]
  60. Labutina, L.A. Nterpretation of Aerospace Images; Aspekt-Press: Moscow, Russia, 2004. [Google Scholar]
  61. Blomdin, R.; Heyman, J.; Stroeven, A.P.; Haettestrand, C.; Harbor, J.M.; Gribenski, N.; Jansson, K.N.; Petrakov, D.A.; Ivanov, M.N.; Alexander, O.; et al. Glacial Geomorphology of the Altai and Western Sayan Mountains, Central Asia. J. Maps 2016, 12, 123–136. [Google Scholar] [CrossRef]
  62. Ganyushkin, D.A.; Kunaeva, E.P.; Chistyakov, K.V.; Volkov, I.V. Interpretation of Glaciogenic Complexes From Satellite Images of the Mongun-Taiga Mountain Range. Geogr. Nat. Resour. 2018, 39, 63–72. [Google Scholar] [CrossRef]
  63. Agatova, A.R.; Nazarov, A.N.; Nepop, R.K.; Rodnight, H. Holocene Glacier Fluctuations and Climate Changes in the Southeastern Part of the Russian Altai (South Siberia) Based on a Radiocarbon Chronology. Quat. Sci. Rev. 2012, 43, 74–93. [Google Scholar] [CrossRef]
  64. Barsch, D. Rockglaciers: Indicators for the Present and Former Geoecology in High Mountain Environments; Springer: Berlin/Heidelberg, Germany, 1996. [Google Scholar]
  65. Ivanovskiy, L.N.; Panychev, V.A. Razvitie i Vozrast Konechnyh Moren XVII–XIX vv. Lednikov Ak-Turu Na Altae. In Processy Sovremennogo Rel’efoobrazovanija v Sibiri; Nauka: Irkutsk, Russia, 1978; pp. 127–138. [Google Scholar]
  66. Nazarov, A.N.; Myglan, V.S.; Orlova, L.A.; Ovchinnikov, I.Y. Activity of Maly Aktru Glacier (Central Altai) and Changes Tree Line Fluctuations in Its Basin for a Historical Period. Ice Snow 2016, 56, 103–118. [Google Scholar] [CrossRef]
  67. Adamenko, M.F.; Syubaev, A.A. Dinamika Klimata Na Territorii Gornogo Altaja v XV–XX Vekah Po Dannym Dendrohronologii. In Voprosy Gornoj Gljaciologii; Izd. Tom. un-ta: Tomsk, Russia, 1977; pp. 196–202. [Google Scholar]
  68. Galakhov, V.P.; Nazarov, A.N.; Kharlamova, N.F. Fluctuations of Glaciers and Climate Change in the Late Holocene, Based on Studies of Glaciers and Glacial Deposits of the Aktru Basin; Altai State University: Barnaul, Russia, 2005. [Google Scholar]
  69. Nosenko, G.A.; Nikitin, S.A.; Khromova, T.E. Glacier Area and Volume Changes in the Mountain Altai (Russia) since the Mid-Twentieth Century from Space Imagery Data. Ice Snow 2015, 126, 5. [Google Scholar] [CrossRef]
  70. Myglan, V.S.; Oidupaa, O.C.; Vaganov, E.A. A 2367-Year Tree-Ring Chronology for the Altay-Sayan Region (Mongun-Taiga Mountain Massif). Archaeol. Ethnol. Anthropol. Eurasia 2012, 40, 76–83. [Google Scholar] [CrossRef]
  71. Galakhov, V.P.; Samoilova, S.Y.; Shevchenko, A.A.; Sheremetov, R.T. Fluctuation of Maly Aktru Glacier (Russian Altai) for the Period of Instrumental Observations from 1952 to 2013. Earth’s Cryosphere 2015, 19, 81–86. [Google Scholar]
  72. Galakhov, V.P.; Muhametov, R.M. The Glaciers of Altai; Nauka: Novosibirsk, Russia, 1999. [Google Scholar]
  73. Tronov, M.V. Ocherki Oledeneniya Altaya. In Essays of the Altai Glacierization; Geografgiz: Moscow, Russia, 1949. [Google Scholar]
  74. Toropov, P.A.; Aleshina, M.A.; Nosenko, G.A.; Khromova, T.E.; Nikitin, S.A. Modern Deglaciation of the Altai Mountains: Effects and Possible Causes. Russ. Meteorol. Hydrol. 2020, 45, 368–376. [Google Scholar] [CrossRef]
  75. Kamp, U.; Pan, C.G. Inventory of Glaciers in Mongolia, Derived from Lanfsat Imagery from 1989 to 2011. Geogr. Ann. Ser. A Phys. Geogr. 2015, 97, 653–669. [Google Scholar] [CrossRef]
  76. Earl, L.; Gardner, A. A Satellite-Derived Glacier Inventory for North Asia. Ann. Glaciol. 2016, 57, 50–60. [Google Scholar] [CrossRef] [Green Version]
  77. Narozhny, Y.K.; Okishev, P.A. Dynamics of Altay glaciers in regression phase of Little Ice Age. Data Glaciol. Stud. 1999, 87, 119–123. [Google Scholar]
  78. Ganjushkin, D.A.; Moskalenko, I.G.; Seliverstov Yu, P. The Glaciation of Mongun-Taiga Massif OJIE (Inner Asia) in Maximum of Little Glacial Epoch and Its Evolution. Vestn. St.-Peterbg. Univ. Seriya Geol. Geogr. 1998, 7, 27–37. [Google Scholar]
  79. Ganyushkin, D.A.; Chistyakov, K.V.; Kunaeva, E.P.; Volkov, I.V.; Bantsev, D.V. Current Glaciation of the Chikhachev Ridge (South-Eastern Altai) and Its Dynamics after Maximum of the Little Ice Age. Ice Snow 2016, 56, 29–42. (In Russian) [Google Scholar] [CrossRef] [Green Version]
  80. Ganyushkin, D.A.; Otgonbayar, D.; Chistyakov, K.V.; Kunaeva, E.P.; Volkov, I.V. Recent Glacierization of the Tsambagarav Ridge (North-Western Mongolia) and Its Changes since the Little Ice Age Maximum. Ice Snow 2016, 56, 437–452. [Google Scholar] [CrossRef]
  81. Ganyushkin, D.A.; Konkova, O.S.; Chistyakov, K.V.; Bantcev, D.V.; Terekhov, A.V.; Kunaeva, E.P.; Kurochkin, Y.N.; Andreeva, T.A.; Volkova, D.D. Shrinking of the Glaciers of East Altai (Shapshal Center) after the Maximum of the Little Ice Age. Ice Snow 2021, 61, 500–520. [Google Scholar]
  82. Paul, F.; Bolch, T. Glacier Changes Since the Little Ice Age. In Geomorphology of Proglacial Systems: Landform and Sediment Dynamics in Recently Deglaciated Alpine Landscapes; Heckmann, T., Morche, D., Eds.; Springer International Publishing: Cham, Switzerland, 2019; pp. 23–42. ISBN 978-3-319-94184-4. [Google Scholar]
  83. Haeberli, W.; Oerlemans, J.; Zemp, M. The Future of Alpine Glaciers and Beyond 2019. In Oxford Research Encyclopedia of Climate Science; Oxford University Press: New York, NY, USA, 2019. [Google Scholar] [CrossRef]
  84. Maisch, M.; Wipf, A.; Denneler, B.; Battaglia, J.; Benz, C. Die Gletscher Der Schweizer Alpen: Gletscherhochstand 1850. Aktuelle Vergletscherung, Gletscherschwundszenarien. Schlussbericht NFP 31, 2nd ed.; Vdf Hochschulverlag ETH Zurich: Zurich, Switzerland, 2000. [Google Scholar]
  85. Patzelt, G.; Aellen, M. Gletscher. In Schnee, Eis und Wasser der Alpen in Einer Warmeren Atmosphare; Vischer, D., Ed.; ETH-Zürich: Zürich, Switzerland, 1990; Volume 108, pp. 49–69. [Google Scholar]
  86. Rabatel, A.; Letréguilly, A.; Dedieu, J.-P.; Eckert, N. Changes in Glacier Equilibrium-Line Altitude in the Western Alps from 1984 to 2010: Evaluation by Remote Sensing and Modeling of the Morpho-Topographic and Climate Controls. Cryosphere 2013, 7, 1455–1471. [Google Scholar] [CrossRef] [Green Version]
  87. Stokes, C.R.; Andreassen, L.M.; Champion, M.R.; Corner, G.D. Widespread and Accelerating Glacier Retreat on the Lyngen Peninsula, Northern Norway, since Their “Little Ice Age” Maximum. J. Glaciol. 2018, 64, 100–118. [Google Scholar] [CrossRef] [Green Version]
  88. Rabatel, A.; Francou, B.; Soruco, A.; Gomez, J.; Cáceres, B.; Ceballos, J.L.; Basantes, R.; Vuille, M.; Sicart, J.E.; Huggel, C.; et al. Current State of Glaciers in the Tropical Andes: A Multi-Century Perspective on Glacier Evolution and Climate Change. Cryosphere 2013, 7, 81–102. [Google Scholar] [CrossRef] [Green Version]
  89. Qiao, B.; Yi, C. Reconstruction of Little Ice Age Glacier Area and Equilibrium Line Attitudes in the Central and Western Himalaya. Quat. Int. 2017, 444, 65–75. [Google Scholar] [CrossRef]
  90. Aizen, V.B.; Kuzmichenok, V.; Surazakov, A.B. Glacier Changes in Central and Northern Tien Shan during the Last 140 Years Based on Surface and Remote Sensing Data. Ann. Glaciol. 2006, 43, 202–213. [Google Scholar] [CrossRef] [Green Version]
  91. Kutuzov, S.; Shahgedanova, M. Glacier Retreat and Climatic Variability in the Eastern Terskey-Alatoo, Inner Tien Shan between the Middle of the 19th Century and Beginning of the 21st Century. Glob. Planet. Change 2009, 69, 59–70. [Google Scholar] [CrossRef]
Figure 1. Glacial centers of Altai. 1—Mongun-Taiga, 2—Shapsalsky ridge, 3—Ikh Turgen, 4—Mongun-Taiga Minor, 5—Talduayr, 6—Saylugem, 7—Tavan Bogd, 8—Tsengel Khairkhan, 9—Sogostyn, 10—Hunguyn-Nuru, 11—Turgen, 12—Kharkhiraa, 13-Tsambagarav, 14—Sair, 15—Huh Serh, 16—Munkh Khairkhan, 17—Baatar Khairkhan, 18—Sutai, 19—Sargamyr-Nuru, 20—Alag-Deliyn, 21-North Mongolian Altai, 22—Hoton, 23—Under-Khaikhan, 24—Harit-Nuru, 25—Bayantyn-Ula, 26—Eule-Tau, 27—Dushin-Ula, 28—Katunsky, 29—South-Chuya, 30—North-Chuya, 31—South Altai, 32—Kara-Alakha, 33—Sarymsakty, 34—Kurai, 35—Ivanovskiy, 36—Holzun, 37—Kurkurebazy, 38—Sumulta, 39—Listvyaga.
Remotesensing 14 01508 g001
Figure 2. Areas of satellite images that are problematic for glacier delineation and their photographs obtained in situ. (A,B) Grigorieva glacier, Ikh Turgen: 1—False glacier edge based on the interpretation of the satellite image (World View-2, 22 August 2013), 2—The real edge of the glacier, based on the results of in situ observations (photo 24 July 2015). (C,D) Tsengel-Khairkhan, Holtsutiyn-Gol valley: C, 1—The area that looks like a debris-covered glacial snout in the Spot-5 image (7 August 2008), (D) 1—The real edge of the glacier, based on the results of field observations (photo 24 July 2016). (E,F) Mongun-Taiga, Levyi Mugur valley: (E) 1—The area, that looks like a small cirque glacier in the satellite image (Spot-5 19 September 2011), (F) 1—The same area in the photo (15 July 2011)-debris-covered dead ice.
Remotesensing 14 01508 g002
Figure 3. Identification of the LIA moraines and of the present edge of a glacier, Tolayty valley, Mongun-Taiga massif. (A) WorldView-2 image, 26 June 2015, (B) Spot-5 image, 19 September 2011, (C) Sentinel-2 image, 6 September 2016, (D) photo, 6 October 2019: 1—snow-covered talus and dead ice (false glacier edge), 2—LIA moraine, 3—pre-LIA late Holocene moraine, so-called “historic” stage.
Remotesensing 14 01508 g003
Figure 4. LIA moraines and rock glaciers. Tsengel Khairkhan ridge: (A) World View 2 image, 18 September 2011, (B) Photo, 31 July 2016: 1—LIA moraine, 2—Talus rock glacier. Mongun Taiga massif: (C) WorldView-2 image, 26 June 2015, (D,E) Photos 28 July 2008: 1—LIA moraines, 2—Debris rock glaciers.
Remotesensing 14 01508 g004
Figure 5. Degradation of hanging glaciers, Mongun Taiga massif. (A) WorldView-2 image, 26 June 2015, (B) Landsat 5 image, 5,4,3-bands combination, 15 September 1987, (C) aerial image, 10 July 1966: 1—Degrading small hanging glaciers, 2—Nival niches in place of degraded glaciers.
Remotesensing 14 01508 g005
Figure 6. Recent glaciation of Altay mountains. The numbers correspond to the ones in Table 4.
Remotesensing 14 01508 g006
Figure 7. Glacier recession in the Tavan Bogd massif after the LIA maximum, a fragment from the north-east part.
Remotesensing 14 01508 g007
Figure 8. Relationship between the areas of glacial centers at the LIA maximum and the decrease in their area after the LIA maximum, %.
Remotesensing 14 01508 g008
Figure 9. The increase of the ELA after the maximum of the LIA in the southern part of Altai. The numbers of the glacial centers correspond to the ones in Figure 1, Table 2 and Table 3.
Remotesensing 14 01508 g009
Figure 10. Changes of the total area of the glaciers of Tavan Bogd and the retreat of the termini of 5 valley glaciers of the same glacial center after the LIA maximum.
Remotesensing 14 01508 g010
Figure 11. Annual precipitation (mm) and average summer temperature (°C), Kosh-Agach meteorological station (1758 m a.s.l.). The periods, unfavorable for the glaciers are marked with yellow bars and orange bar (extremely unfavorable).
Remotesensing 14 01508 g011
Table 1. Satellite imagery used in the study of Tavan Bogd glaciers in the past.
DateSpacecraftSpatial Resolution, mImage ID
31 August 2010SPOT 52.5SP5_214251_100831
7 August 2000Landsat 715LE71440262000220SGS00
16 August 2000Landsat 715LE71430262000229SGS00
3 September 1989Landsat 430LT41430261989246XXX02
1 September 1977Landsat_260LM21540261977244AAA02
14 August 1977Landsat_260LM21540261977226AAA03
28 July 1977Landsat_260LM21550261977209AAA03
10 August 1968CORONA1.8DS1104-1039DA010-013
Table 2. Comparison of the results of ELA and AAR estimation by Kurowski method and obtained from satellite imagery for the glaciers of Shapshalsky ridge.
NELAkAARkELAsAARsELAk-ELAs
2630730.533055 10.59+28
2930200.463010 10.46+10
3129990.463030 20.22−31
4329950.583010 20.46−15
3229920.433007 20.39−15
4429960.482983 20.49+13
4531230.553133 20.49−10
4630170.492945 20.60+72
4930870.503100 20.43−13
5329320.54295820.24−26
5429760.172978 20.15−2
5529280.582939 20.48−11
6231770.473200 20.40−23
7329870.282960 20.46+27
7430460.493099 20.32−53
7530790.603100 20.46−21
7630750.503110 20.27−35
9731880.443134 40.66+54
9832150.393257 40.70−42
10131360.463180 40.28−44
10331650.473160 40.59+5
10433940.483394 30.500
10732920.553330 30.48−8
10834040.513436 30.36−32
11032380.583266 30.51−28
11532570.573268 40.52−11
average0.48 0.44−8
AARk—accumulation area ratio, obtained by the Kurowski method; ELAk—ELA values, obtained by the Kurowski method, AARs—accumulation area ratio, obtained from the satellite images; ELAs—ELA values, obtained from the satellite images. Satellite imagery: 1 World View 2, acquisition date 28 July 2015, 2 Quick Bird 2 acquisition date 18 July 2012, 3 World View 2, acquisition date 26 June 2015, 4 SPOT 5, acquisition date 21 July 2014. Numbers of the glaciers correspond to the catalogue from [55].
Table 3. Comparison of the results of ELA and AAR estimation by Kurowski method and obtained from satellite imagery, valley.
NoELAk-ELAsAAR k-AARs
1989200020102020Average1989200020102020Average
239281113139106−0.22−0.16−0.33−0.20−0.23
3855118101138103−0.09−0.19−0.21−0.28−0.19
56−115457333−0.010.00−0.06−0.14−0.05
87−4−58290410.030.04−0.21−0.17−0.08
98267255228−0.10−0.04−0.09−0.08−0.08
1008369108142101−0.09−0.07−0.16−0.19−0.13
1937490759082−0.13−0.13−0.14−0.17−0.14
19573734512479−0.060.00−0.06−0.17−0.07
203961025810791−0.11−0.14−0.11−0.15−0.13
2057412360163105−0.05−0.12−0.07−0.15−0.10
57677111277−0.09−0.08−0.14−0.17−0.12
Table 4. Recent glaciation of Altai mountains. Zmax—maximal altitude of the mountain ridge, N—the number of the glaciers, S—The area of the glaciers (km2), Sa—the average area of glaciers, A (%)—prevailing aspect of the glaciers and the its percentage of the total area of a glacial center.
NoNameZmax, mNS km2Sa. km2A (%)ELA mSpacecraft, YearRecent Field Observations, YearThe Source of Information
The southern part of Altai
1Mongun-Taiga39703817.78 ± 0.060.48NE (40)3390WorldView-2, 20152019, 2021this study
2Shapsalsky3613.512314.07 ± 0.330.12NE (42)3110Spot 6, 20152016this study
3Ikh Turgen40298529.0 ± 0.650.34N (38)3425Spot 5, 20112015this study
4Mongun-Taiga Minor371850.75 ± 0.0060.15N (46)3356Spot 5, 2011-this study
5Talduayr3506110.83 ± 0.0090.08NE (46)3303Geoeye 1, 2011-this study
6Saylugem353970.19 ± 0.0010.03NE (71)3218Geoeye 1, 20142021this study
7Tavan Bogd4374221192.39 ± 12.010.87N (22)3358Sentinel 2, 20202021this study
8Tsengel Khairkhan39434610.14 ± 0.280.22NE (65)3420Spot 5, 20082016this study
9Sogostyn3521100.25 ± 0.060.03N (76)3375Sentinel 2, 2020-this study
10Hunguyn-Nuru3820318.51 ± 0.790.27N (67)3390Spot 4, 2006-this study
11Turgen39786932.45 ± 2.640.47N (46)3475Spot 4, 20061992this study
12Kharkhiraa40375732.35 ± 2.630.57NE (61)3530Spot 4, 20061992this study
13Tsambagarav42086868.10 ± 0.111.00NE (38)3748Geoeye-1, 20152019this study
14Sair3981246.72 ± 0.410.28NE (59)3575Spot 4, 2006-this study
15Huh Serh4019257.00 ± 0.610.28N (57)3642Sentinel 2, 2016 this study
16Munkh Khairkhan43626326.86 ± 1.380.43NE (60)3790Sentinel 2, 2016 this study
17Baatar Khairkhan398444.74 ± 0.091.18N (70)3807Sentinel 2, 2016 this study
18Sutai42201512.50 ± 0.120.84N (55)3940Sentinel 2, 2016 this study
19Sargamyr-Nuru38427133.81 ± 2.860.48N (49)3095Sentinel-2, 2019 this study
20Alag-Deliyn36244813.84 ± 1.210.29N (59)3111Sentinel-2, 2019 this study
21North Mongolian Altai3459305.97 ± 0.600.20N (53)3014Sentinel-2, 2019 this study
22Hoton3507395.75 ± 0.750.15N(74)3104Sentinel-2, 2021 this study
23Under-Khaikhan39145617.66 ± 1.510.32N(45)3348Sentinel-2, 2019 this study
24Harit-Nuru3868519.00 ± 1.000.18N(75)3468Sentinel-2, 2019 this study
25Bayantyn-Ula3720305.48 ± 0.570.18N (64)3385Sentinel-2, 2019 this study
26Eule-Tau366080.34 ± 0.070.04N (94)3449Sentinel-2, 2019 this study
27Dushin-Ula3876212.67 ± 0.370.12N (56)3462Sentinel-2, 2019 this study
Total or average1256559.15 ± 31.130.45
The northern part of Altai
28Katunsky4506-198.0- Sentinel-2, 2017 [68]
29South-Chuya3967-118.0- Sentinel-2, 2017 [68]
30North-Chuya4173-112.9- Sentinel-2, 2017 [68]
31South Altai387111577.10.67 ?, 2003 [41,69]
32Kara-Alakha31502712.20.45 ?, 2003 [41,69]
33Sarymsakty3373499.30.19 ?, 2003 [41,69]
34Kurai3446176.40.38 ?, 2003 [41,69]
35Ivanovskiy2775111.50.14 ?, 2003 [41,69]
36Holzun259960.80.13 ?, 2003 [41,69]
37Kurkurebazy314840.40.10 ?, 2003 [41,69]
38Sumulta275630.40.13 ?, 2003 [41,69]
39Listvyaga257730.40.13 ?, 2003 [41,69]
Total or average 1096.55
Table 5. Glaciers of Altai in the maximum of the LIA and subsequent glacial recession. Abbreviations in the header are shown in Table 4.
NoNameNS. km2Sa. km2∆S. %ELA. m∆ELA. mThe Source of Information
1Mongun-Taiga8648.04 ± 0.120.5663.03255135this study
2Shapsalsky35884.43 ± 1.180.2483.42993117this study
3Ikh Turgen12859.1 ± 1.010.4651.0336065this study
4Mongun-Taiga Minor82.91 ± 0.010.2664.3329264this study
5Talduayr73.1 ± 0.010.4473.23186117this study
6Saylugem71.54 ± 0.010.2287.7315068this study
7Tavan Bogd247353.4 ± 15.331.4345.63238120this study
8Tsengel Khairkhan6933.18 ± 0.540.4869.4335070this study
9Sogostyn222.02 ± 0.290.0987.6329580this study
10Hunguyn-Nuru4020.51 ± 1.240.5158.5331476this study
11Turgen9362.1 ± 3.600.6747.7344035this study
12Kharkhiraa8578.8 ± 4.260.9358.9347060this study
13Tsambagarav74128.4 ± 0.201.7447.0365890this study
14Sair2313.34 ± 0.630.5850.4351065this study
15Huh Serh7939.58 ± 1.970.5082.3357072this study
16Munkh Khairkhan9978.67 ± 2.820.7965.93685105this study
17Baatar Khairkhan212.94 ± 0.226.4773.4371592this study
18Sutai5420.58 ± 0.750.3839.33773167this study
19Sargamyr-Nuru11780.39 ± 5.210.6958.02942153this study
20Alag-Deliyn6240.09 ± 2.450.6565.0302091this study
21North Mongolian Altai10931.43 ± 2.500.2981.0291995this study
22Hoton10729.57 ± 2.440.2881.02979125this study
23Under-Khaikhan9046.56 ± 2.760.5262.03207141this study
24Harit-Nuru11134.84 ± 2.700.3174.03337131this study
25Bayantyn-Ula6619.38 ± 1.510.2972.0328897this study
26Eule-Tau262.49 ± 0.330.1086.03306143this study
27Dushin-Ula10721.65 ± 2.070.2088.03267195this study
Total or average22761348.43 ± 56.16 59.0 106
28Katunsky-328.7-39.8--[41,69]
29South-Chuya-262.3-55.0--[41,69]
30North-Chuya-208.2-45.8--[41,69]
31South Altai-96.7-20.3--[41,69]
32Kara-Alakha-16.8-27.4--[41,69]
33Sarymsakty-12.9-27.9--[41,69]
34Kurau-9.2-30.4--[41,69]
35Ivanovskiy-2.2-31.8--[41,69]
36Holzun-1.2-66.6--[41,69]
37Kurkurebazy-0.7-42.9--[41,69]
38Sumulta-0.5-20.0--[41,69]
39Listvyaga-0.5-20.0--[41,69]
Total 2288.04 47.9
Table 6. The general information about the glaciers of Tavan Bogd at different time points beginning from the LIA maximum.
YearS. km2NELA. m
1850353.4 ± 15.332473238
1968278.96 ± 2.292363305
1977265.62 ± 73.742343312
1989235.61 ± 37.742463326
2000220.47 ± 18.422443335
2010200.98 ± 3.12253346
2020192.39 ± 12.012213358
Abbreviations in the header are shown in Table 4.
Table 7. Decrease of the glaciers of Tavan Bogd of different morphological type, km (%).
Morphological Type1989–20002000–20102010–2020
Hanging−0.69 (14.5)+0.06 (1.5)−0.12 (2.9)
Cirque-hanging−0.09 (4.2)−0.30 (14.7)−0.51 (29.3)
Cirque−3.17 (15.6)−4.11 (24.0)−1.20 (9.2)
Cirque-valley−0.73 (4.2)−3.03 (18.0)−0.91 (6.6)
Valley−7.75 (4.7)−8.49 (5.4)−4.34 (2.9)
Niche+0.20 (9.5)−0.32 (13.9)−0.21 (10.6)
Slope−1.74 (8.5)−2.71 (14.4)−0.99 (6.1)
Flat-summit−1.12 (23.9)−0.59 (16.6)−0.32 (10.8)
Total15.0919.498.60
Table 8. Regional comparison of glacier shrinkage.
RegionSubregionPeriod∆S (%)∆ELA (m)Source
Altai-1850–2003(–2020)47.9 The current research
Southern part1850–2006 (–2020)59106
European Alps-1850–197054.5 [34]
-1850–201560-[83]
Swiss Alps1850–1970-69[84]
Austrian Alps1850–1970 94[85]
Western Alps1984–2010 170[86]
Scandinavian mtsNorthern Norway~1915–1988~0.3/year-[87]
2001–2014~1/year-
HimalayaCentral HimalayaLIA maximum-2004~201535123[89]
Western HimalayaLIA maximum-2004~201531
TibetSoutheast TibetLIA maximum-1999-136[36]
Tien ShanAkshiirak1943–19774.2 [90]
Akshiirak1977–20038.7
Ala Archa1943–19775.1
Ala Archa1977–200310.6
Eastern Terskey–Alatoo1965–200312.6 [91]
Publisher’s Note: MDPI stays neutral with regard to jurisdictional claims in published maps and institutional affiliations.

