Article

Construction of “Space-Sky-Ground” Integrated Collaborative Monitoring Framework for Surface Deformation in Mining Area

1
College of Geoscience and Surveying Engineering, China University of Mining & Technology (Beijing), Beijing 100083, China
2
School of Management, China University of Mining & Technology (Beijing), Beijing 100083, China
3
State Key Laboratory of Water Resource Protection and Utilization in Coal Mining, Beijing 102209, China
*
Author to whom correspondence should be addressed.
Remote Sens. 2022, 14(4), 840; https://doi.org/10.3390/rs14040840
Submission received: 25 December 2021 / Revised: 3 February 2022 / Accepted: 7 February 2022 / Published: 10 February 2022
(This article belongs to the Special Issue Geodetic Monitoring for Land Deformation)

Abstract

:
Ground deformation measurements in mining areas play a key role in revealing the surface subsidence law, retrieving the subsidence parameters, warning of geological disasters and restoring the surface ecology. With the development of science and technology, there have emerged a great number of monitoring techniques and buildings of diverse protection levels. The diversity of monitoring techniques and the multiplicity of monitoring objects have brought challenges for surface deformation monitoring in the coal industry. Based on the existing deformation monitoring techniques, this paper established a framework of “space-sky-ground” collaborative monitoring system in mining area. We also constructed an AHP-TOPSIS (Analytic Hierarchy Process method- Technique for Order Preference by Similarity to an Ideal Solution) preference model of “space-sky-ground” collaborative monitoring of surface deformation in mining area, and carried out engineering application. Our study shows that the framework of the “space-sky-ground” collaborative monitoring system for surface subsidence in mining areas established in this paper, combined with the AHP-TOPSIS monitoring preference model, which can fully combine the advantages of each monitoring technique, overcome the limitations of a single monitoring technique, comprehensively obtain the surface subsidence data and work out the surface deformation subsidence pattern. This information provides a data and technical support for surface environment management.

Graphical Abstract

1. Introduction

Despite the development of science and technology, coal-oil-gas still plays a key role in government development strategies, which cannot be replaced within a short-time period. What is more, due to its abundant reserves and relatively low cost, coal occupies a crucial position in energy consumption. Large-scale exploitation of coal resources, however, has resulted in a series of negative consequences, including land subsidence and collapse, damage of ground infrastructure and geological hazards—which pose a threat to the sustainable development of local environment and ecology. Government departments and relevant industry associations have established a great number of laws and regulations to ensure the sustainability of coal mining [1]. However, coal mining still affects the normal operation of local buildings and damages ecological balance. Therefore, it is necessary to set up a framework of “space-sky-ground” collaborative monitoring system to obtain accurate surface subsidence to fully understand the surface subsidence pattern in mining areas, which is important for ecological restoration and mining subsidence management.
Vertical land subsidence and horizontal movement are the two basic movement quantities of surface deformation in mining areas [2,3]. Conventional measurement includes two conventional instruments, levelling and total station, which have been developed from traditional optical instruments to current electronic automatic measurement instruments, thanks to the development of production and continuous progress of science and technology. In the monitoring of surface subsidence in mining area, the arrangement of surface observation station is divided into profile line and mesh. The profile line observation station can obtain the surface movement pattern of the main section, but the surface deformation pattern of the whole basin cannot be recognized; the mesh observation station can obtain the surface deformation information of the whole mining subsidence pattern, but the arrangement process is limited by the topographic factors. The workload is large, time-consuming and labor-intensive, and the deformation law of the discrete points obtained cannot completely present the surface of the mining area. Moreover, the traditional measurement cannot collect data under all-time conditions [4]. Therefore, the application of new technologies to surface deformation monitoring in mining areas has become a new development trend.
Emerging technologies have great potential for monitoring surface deformation and can significantly optimize data-collecting abilities, making it possible to obtain a full range of multi-temporal subsidence patterns in subsidence areas. The Global Navigation Satellite System (GNSS) can rendezvous the location of unknown points on the ground (user receivers) using known spatial positions of more than three satellites [5], and with the availability and selectivity of a sufficient number of satellites, GNSS can be applied to the monitoring of ground subsidence. Parul R. Patel analyzed the correlation between ground subsidence, oil and gas production and pressure depletion [6]. Researchers also have applied GNSS technology to aquifer compaction ground subsidence due to groundwater pumping, and settlement monitoring in metal mining [7,8,9]; Interferometric Synthetic Aperture Radar (InSAR) is a new technique for ground deformation monitoring with accuracy at the centimeter or even millimeter level [7].Three-dimensional laser scanning technology (TLS) is a convenient and accurate way to obtain the distance of all targets by acquiring the real three-dimensional coordinates of the targets, and it shows advantages such as fast speed, short cycle time and no need for contact in the monitoring of surface subsidence areas in mining areas. It can also obtain the three-dimensional point cloud data of the whole area, which is able to reflect more comprehensive deformation information of the subsidence area [10], which has been applied to smart grid 3D model reconstruction, geological disaster mapping, monitoring and modeling [11,12,13]; Unmanned Aerial Vehicle (UAV) photogrammetry system, which generates various data sets containing point clouds, 4D products, etc. [14,15,16], has been widely used as a fast and flexible data acquisition system for remote sensing of mine sites, aerial physical prospecting and topographic surveys [17,18,19,20]. The mentioned modern observation techniques have been widely used in surface deformation monitoring. Many scholars have contributed to the comprehensive understanding of surface deformation by improving observation accuracy through data acquisition and data processing methods [21,22,23,24,25,26,27,28]. Meanwhile, many studies simultaneously use one or two traditional measurement techniques and modern techniques to study and analyze surface subsidence, but few studies combine the advantages of various techniques for analysis [29,30,31,32]. Since different techniques have different advantages, it is often difficult to obtain the comprehensive surface subsidence pattern in mining areas by using a single deformation monitoring techniques.
The diversity of emerging monitoring technologies and the diversity of monitoring targets bring challenges for surface subsidence monitoring. How can different monitoring technologies be combined with the factors affecting them to better serve surface subsidence monitoring in mining areas? The AHP (analytic hierarchy process method) has important advantages in terms of weighting procedures for pairwise comparisons and has been widely used in areas such as decision analysis of supply chain networks and mining methods [33,34,35]. TOPSIS (Technique for Order Preference by Similarity to an Ideal Solution) selects the optimal solution by ranking it with the similarity to the ideal solution [36,37]. AHP-TOPSIS is a widely accepted multi-attribute decision making technique that considers the ideal and anti-ideal solutions, and the calculation process is easy to program [38,39]. The TOPSIS method is able to combine multiple indicator factors of a solution, but for multi-factor analysis and weight calculation it is difficult and complex, the AHP method overcomes this disadvantage and ensures the global optimality of the algorithm. AHP-TOPSIS has been widely used in other fields [40,41,42,43]. Therefore, this paper introduces the AHP-TOPSIS model into the preferred model of surface subsidence monitoring techniques in mining areas.
Based on the characteristics of surface deformation in the mine area and the advantages of existing monitoring techniques, this paper established the framework of the “space-sky-ground” collaborative monitoring system for surface subsidence, and con-structed an AHP-TOPSIS surface monitoring method preferential model under three constraints: natural factors, target constraints and site needs. The established “space-sky-ground” collaborative monitoring framework and the preferred model were applied to the surface subsidence monitoring of the 401 working face of Shendong coal mine, and we obtained the results of a single technology, and the surface subsidence basin and surface discontinuous deformation information of the mine area under the “space-sky-ground” collaborative monitoring framework. We also discussed the advantages of integrating multiple monitoring technologies under the “space-sky-ground” collaborative monitoring framework.

2. Methodology

2.1. Surface Deformation in Mining Area

Surface deformation process: Before the mining of coal resources, the underground rock was in a relatively balanced state. Underground mining of ore bodies destroys the original stress balance state of surrounding rock, causes stress redistribution, and results in a new balance. In this process, rock movement and destruction are also called strata movement. Underground mining is the driving force of rock movement, which is the internal cause of surface subsidence, and surface subsidence is the external performance of rock movement. Mining subsidence from mined-out area to the surface of surrounding rock, in general, is the process of attenuation of the degree of damage and expansion of the range of movement, which has a great impact on the local environment, resources, land and human activities. After the coal was mined out, the overlying strata collapsed and filled the goaf, as shown in Figure 1.
Surface deformation is an external form if damage caused by coal mining, and it can be categorized into continuous and discontinuous deformation:
(1)
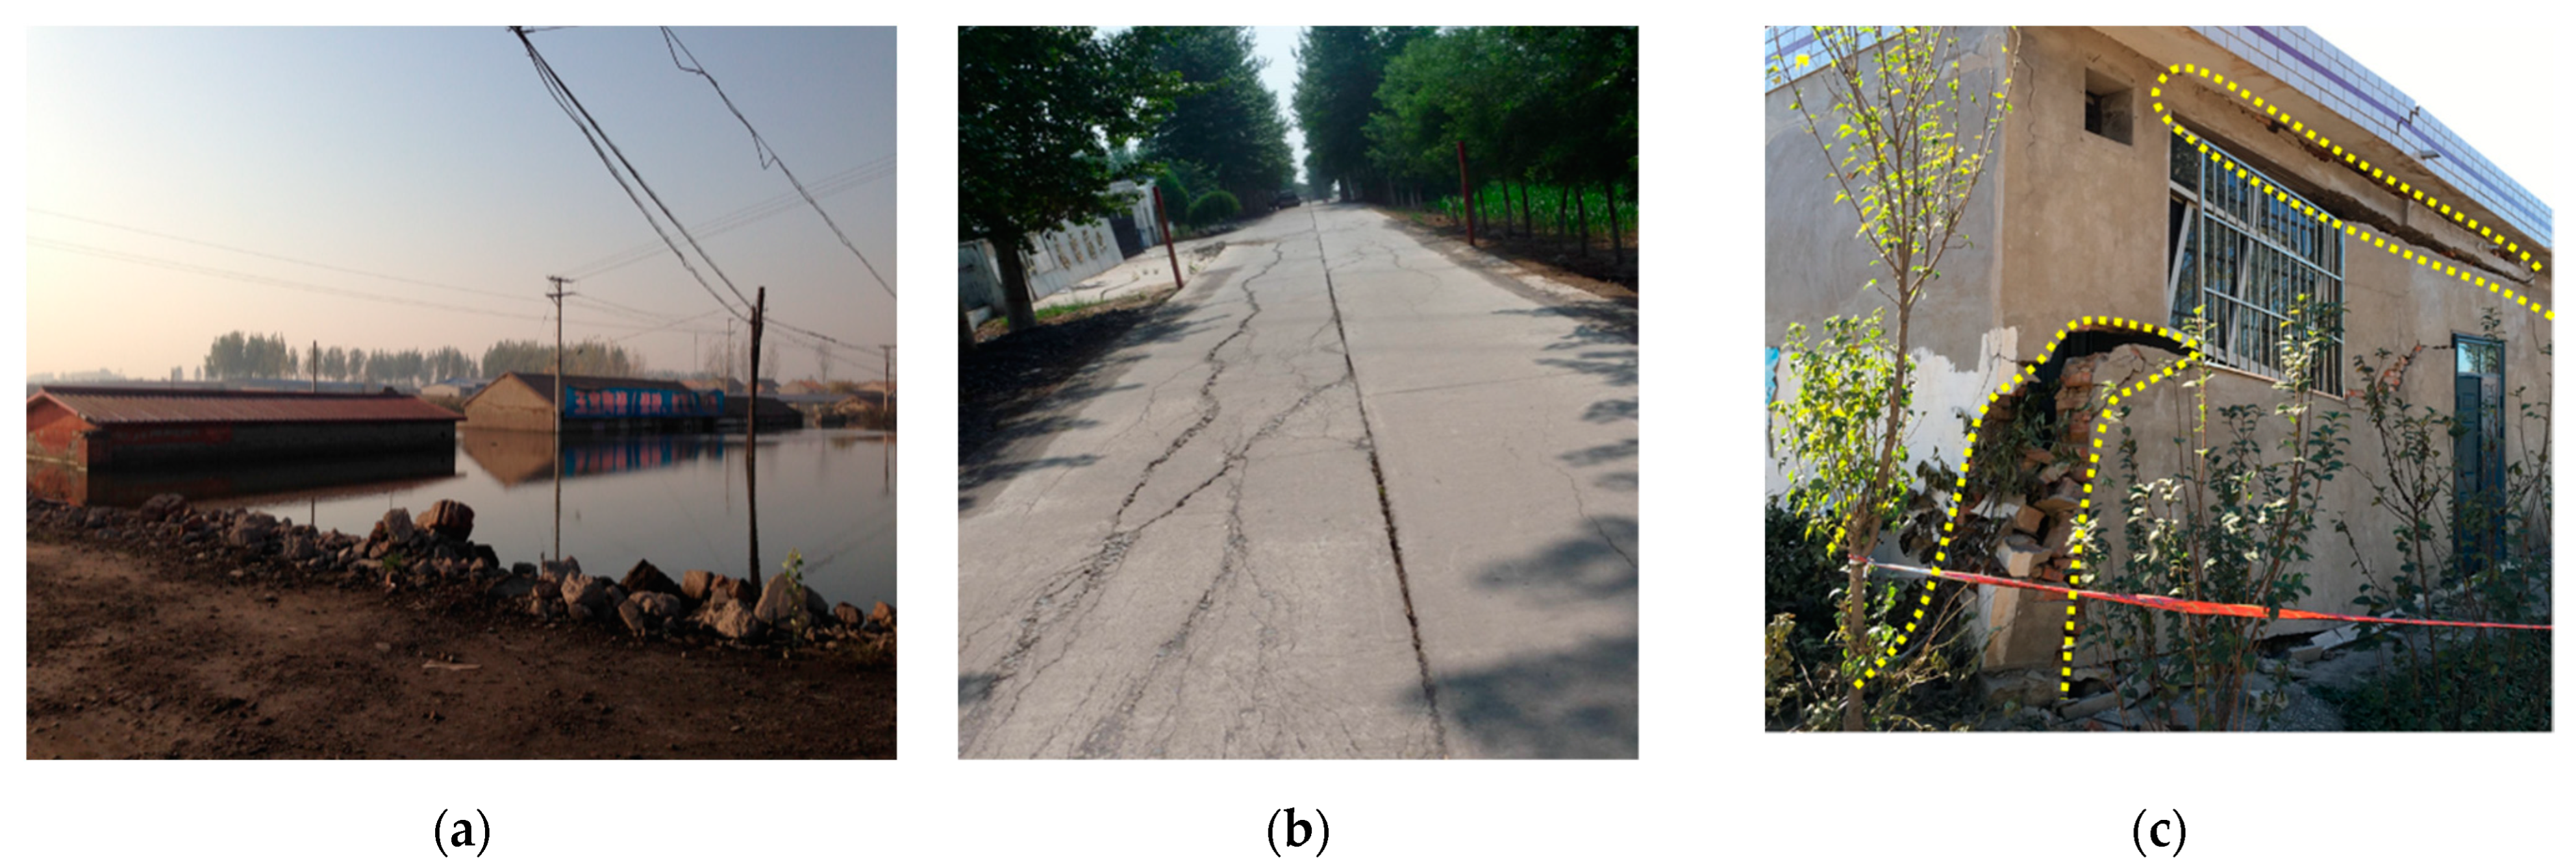
Continuous deformation: Subsidence is a general description of movement and deformation. According to the different ways, directions and properties of movement and deformation, the subsidence conditions of rock strata and surface are described as subsidence, inclination, curvature, horizontal movement and horizontal deformation. The above-mentioned five basic movement and deformation variables are usually used. Damage of continuous deformation to the surface is shown in Figure 2a–c. The trajectory of the surface point depends on the relationship between the surface point and the relative position of the working face in time-space. In general, the moving vector of each point on the surface above the bending zone points to the center of the moving basin from both its starting and ending relative positions.
(2)
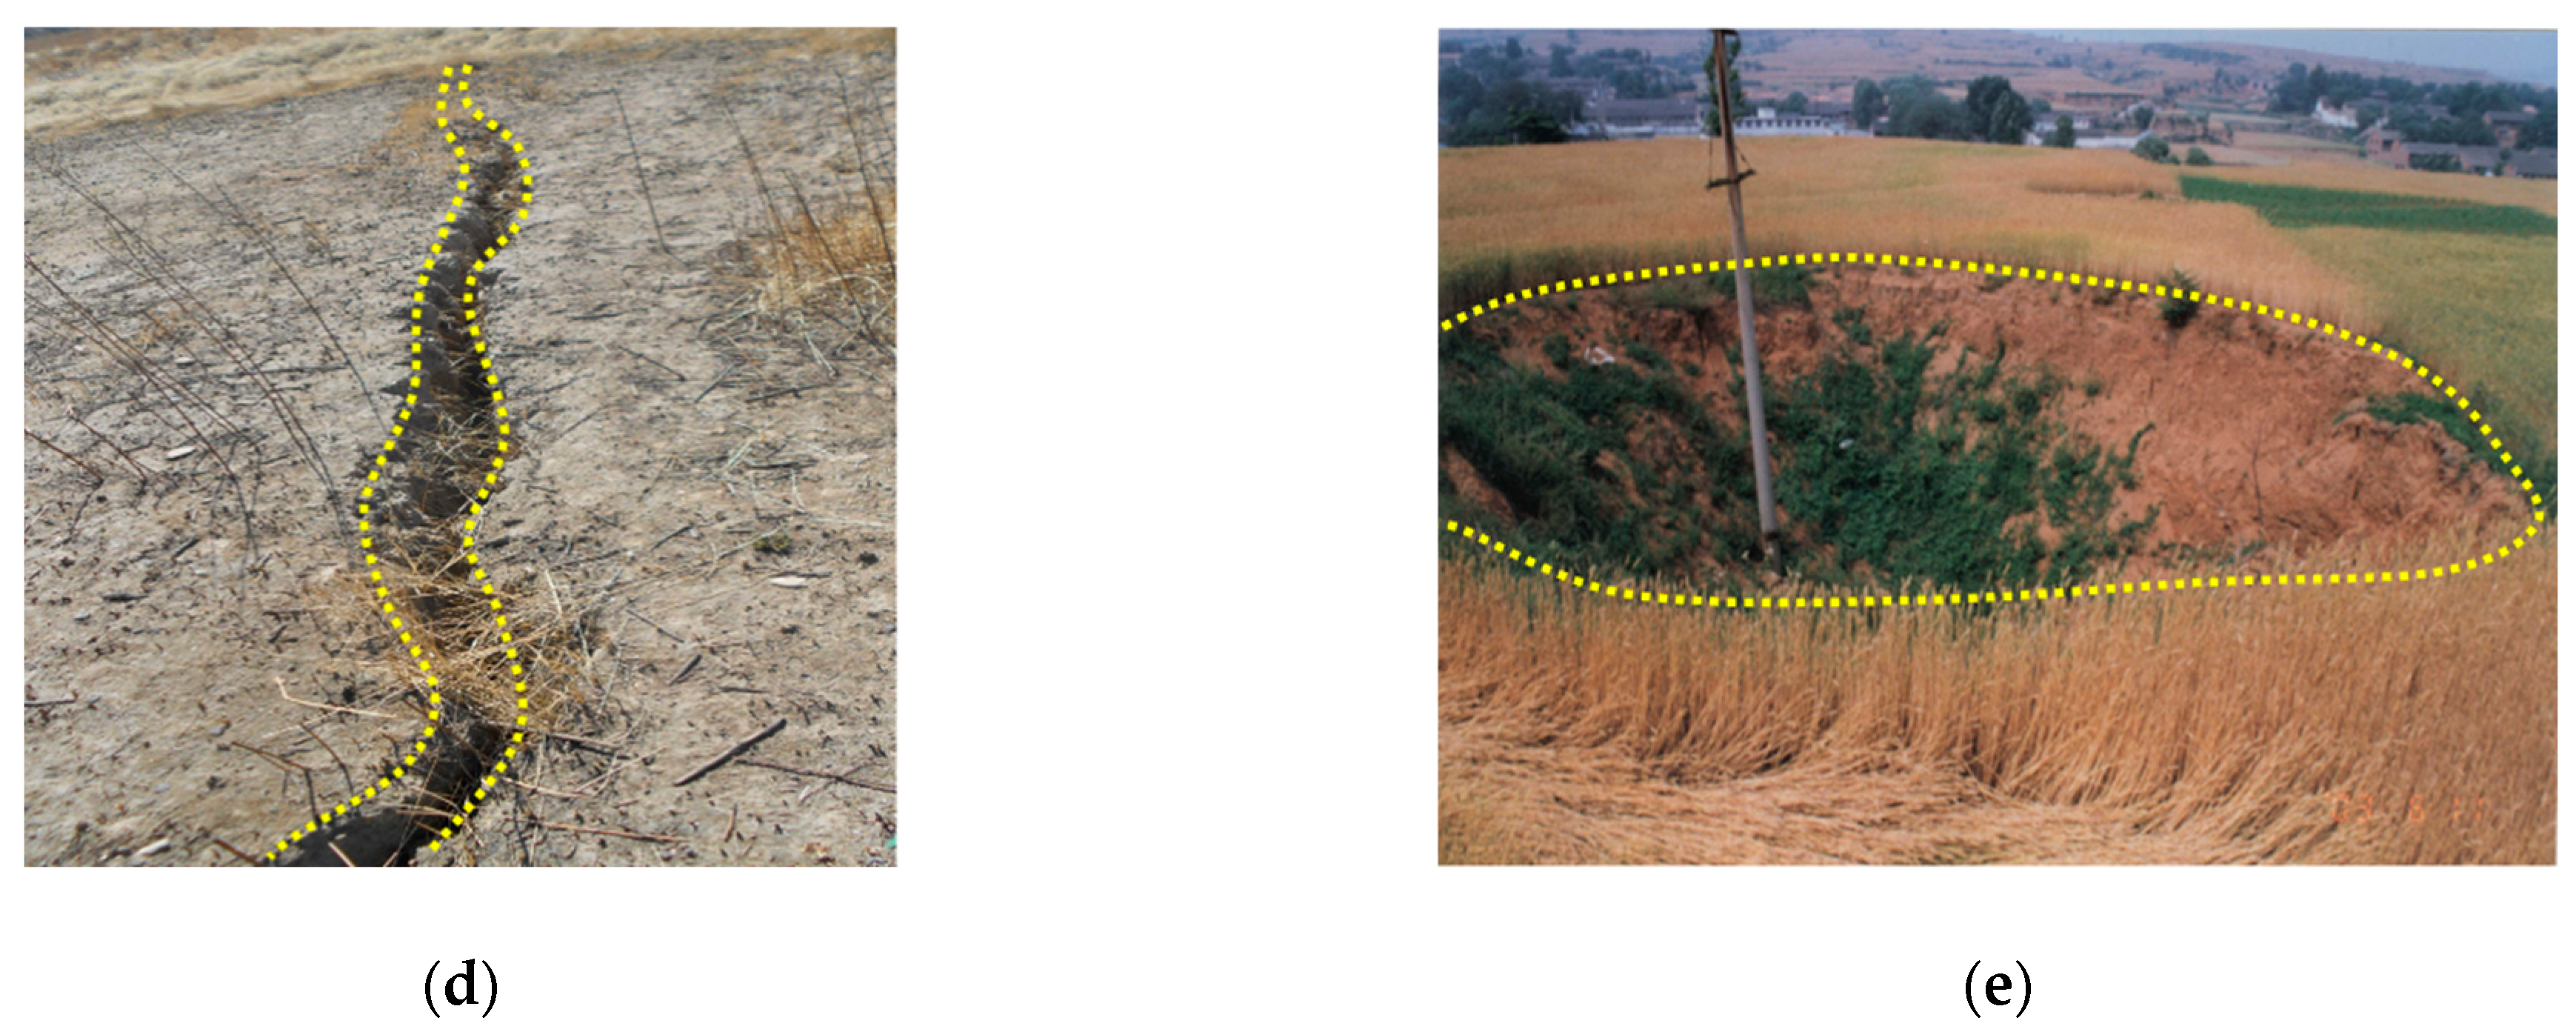
Discontinuous deformation: Discontinuous deformation refers to the large surface displacement over limited surface area with steps or discontinuities in the surface profile, discontinuous deformation within underground coal mining rock formations contains: (a) crown hole; (b) chimney caving; (c) plug subsidence; (d) solution cavities; (e) block caving; (f) progressive hanging wall caving [44]. In China, it is generally considered that the main manifestations of surface discontinuous deformation are mining cracks, step cracks and collapse pits [45,46]. As a typical manifestation of discontinuous deformation, surface mining cracks are prevalent and worthy of study. The discussion in this paper focuses on surface mining cracks in discontinuous deformation. Discontinuous deformation is generated with certain conditions; the surface mining fracture characteristics are closely related to the location of generation; the fracture zone is generated periodically with the surface advance in the direction of working face advance; the mining cracks are developed in the form of fracture zones; the topsoil properties have a significant influence on the discontinuous development characteristics. The damage of discontinuous deformation on the surface is shown in Figure 2d,e.

2.2. “Space-Sky-Ground” Collaborative Monitoring Framework of Mining Subsidence

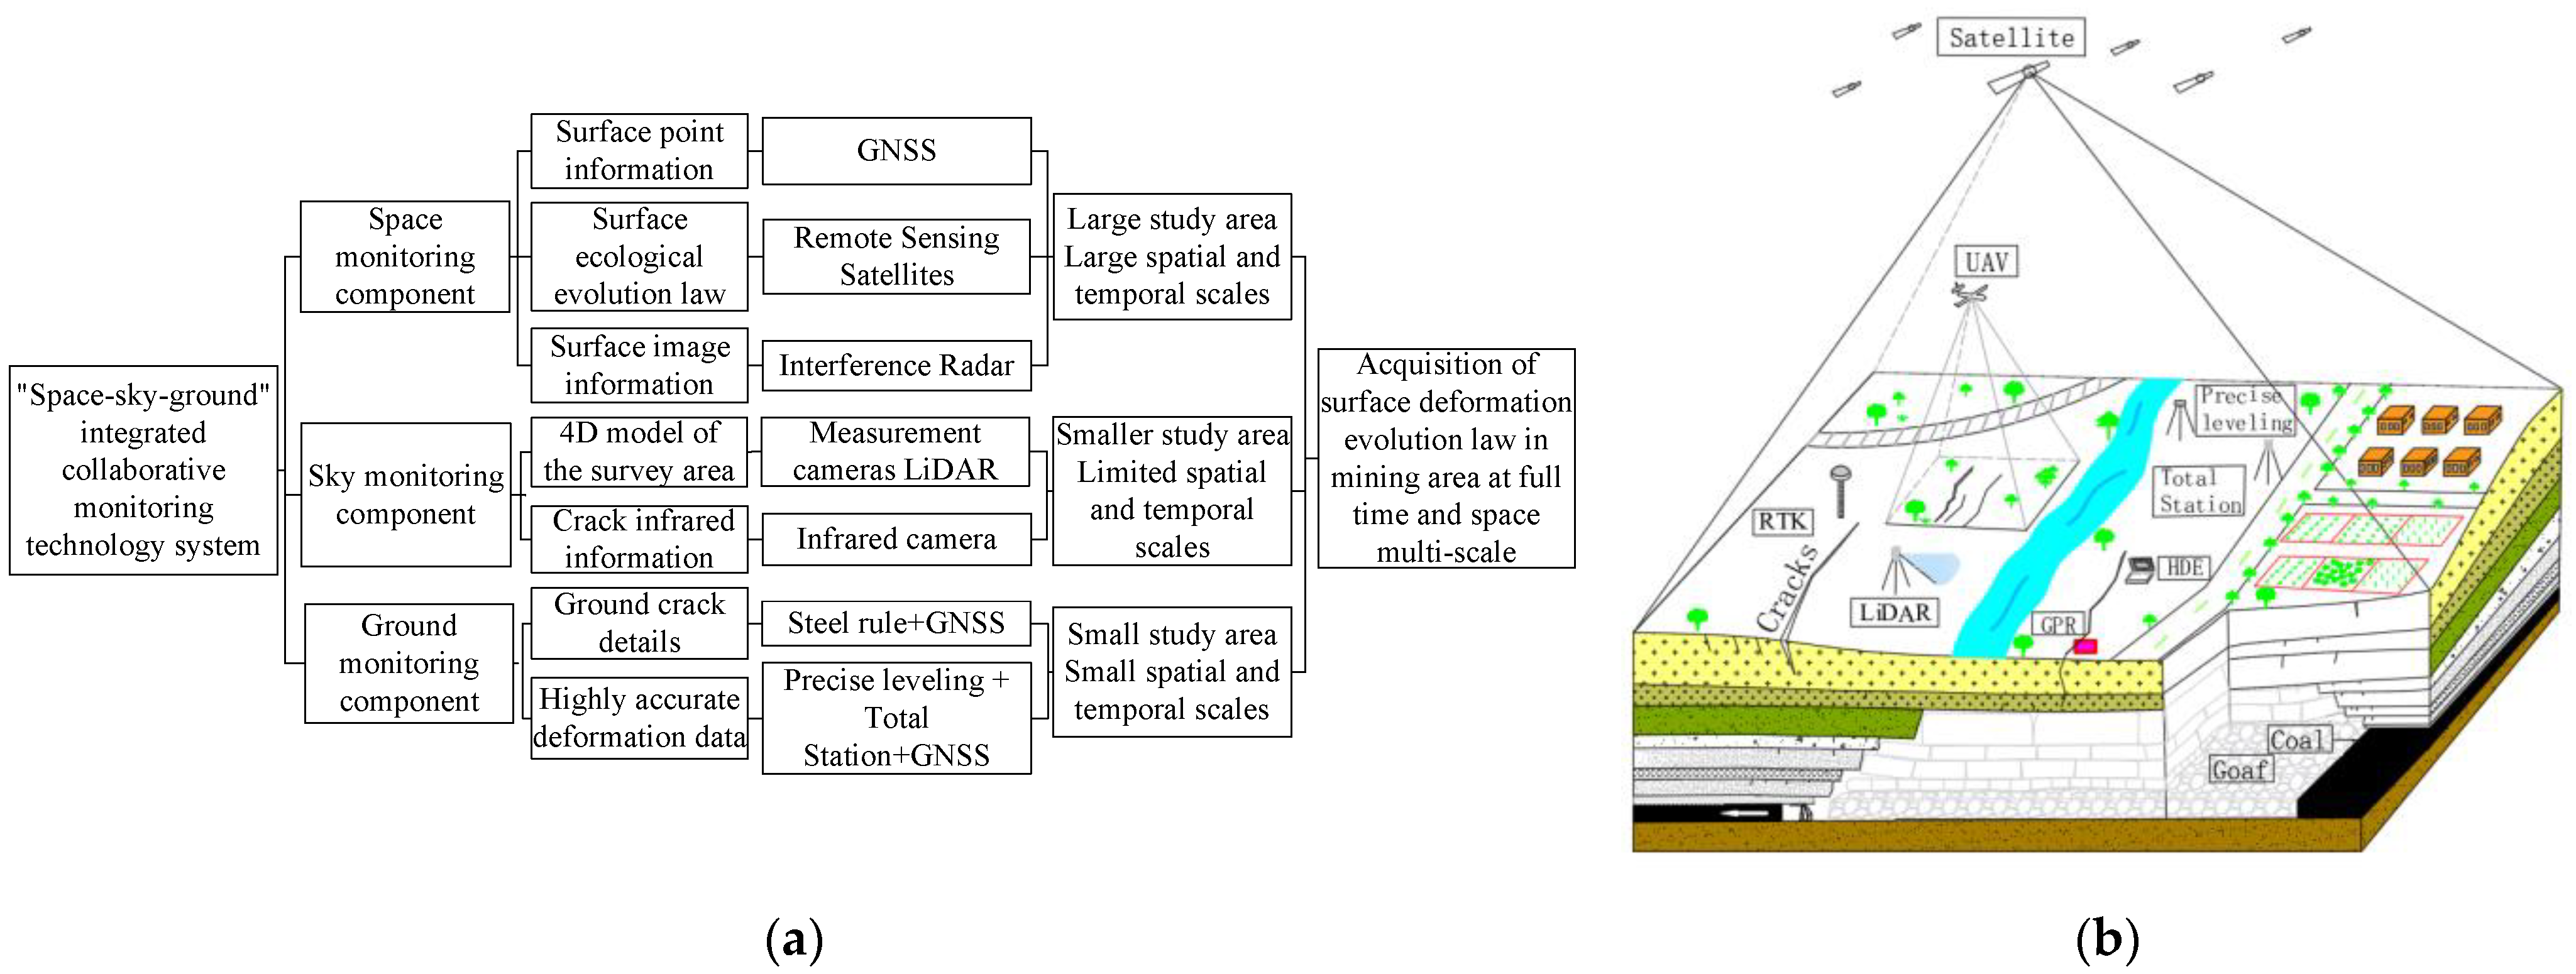
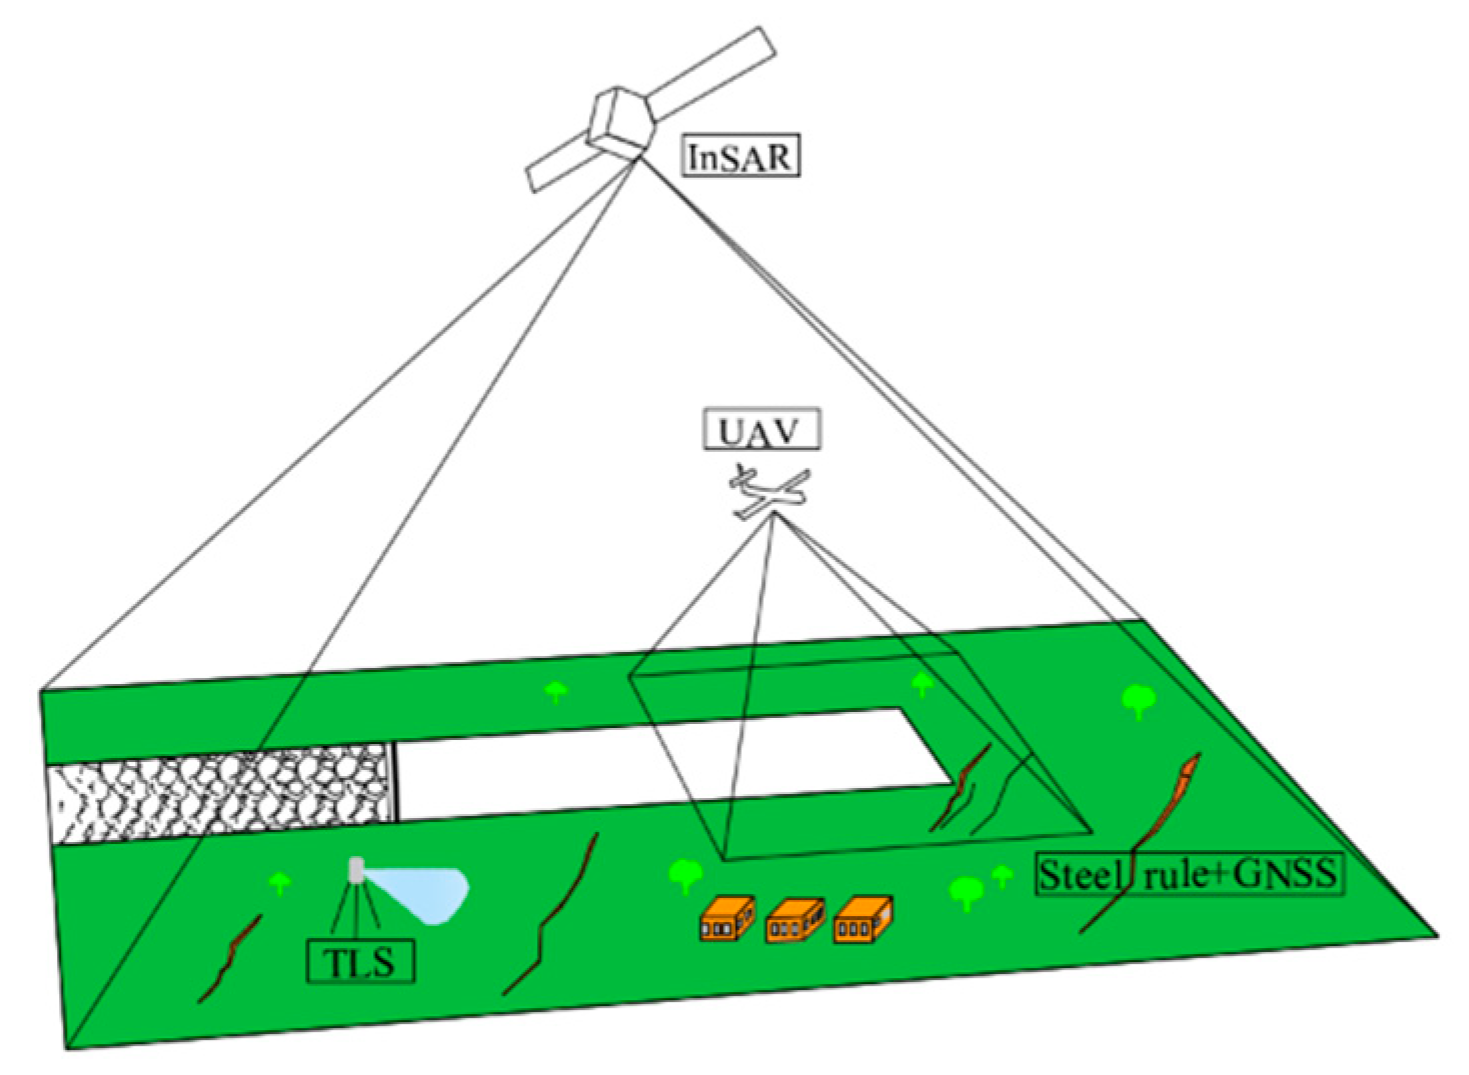
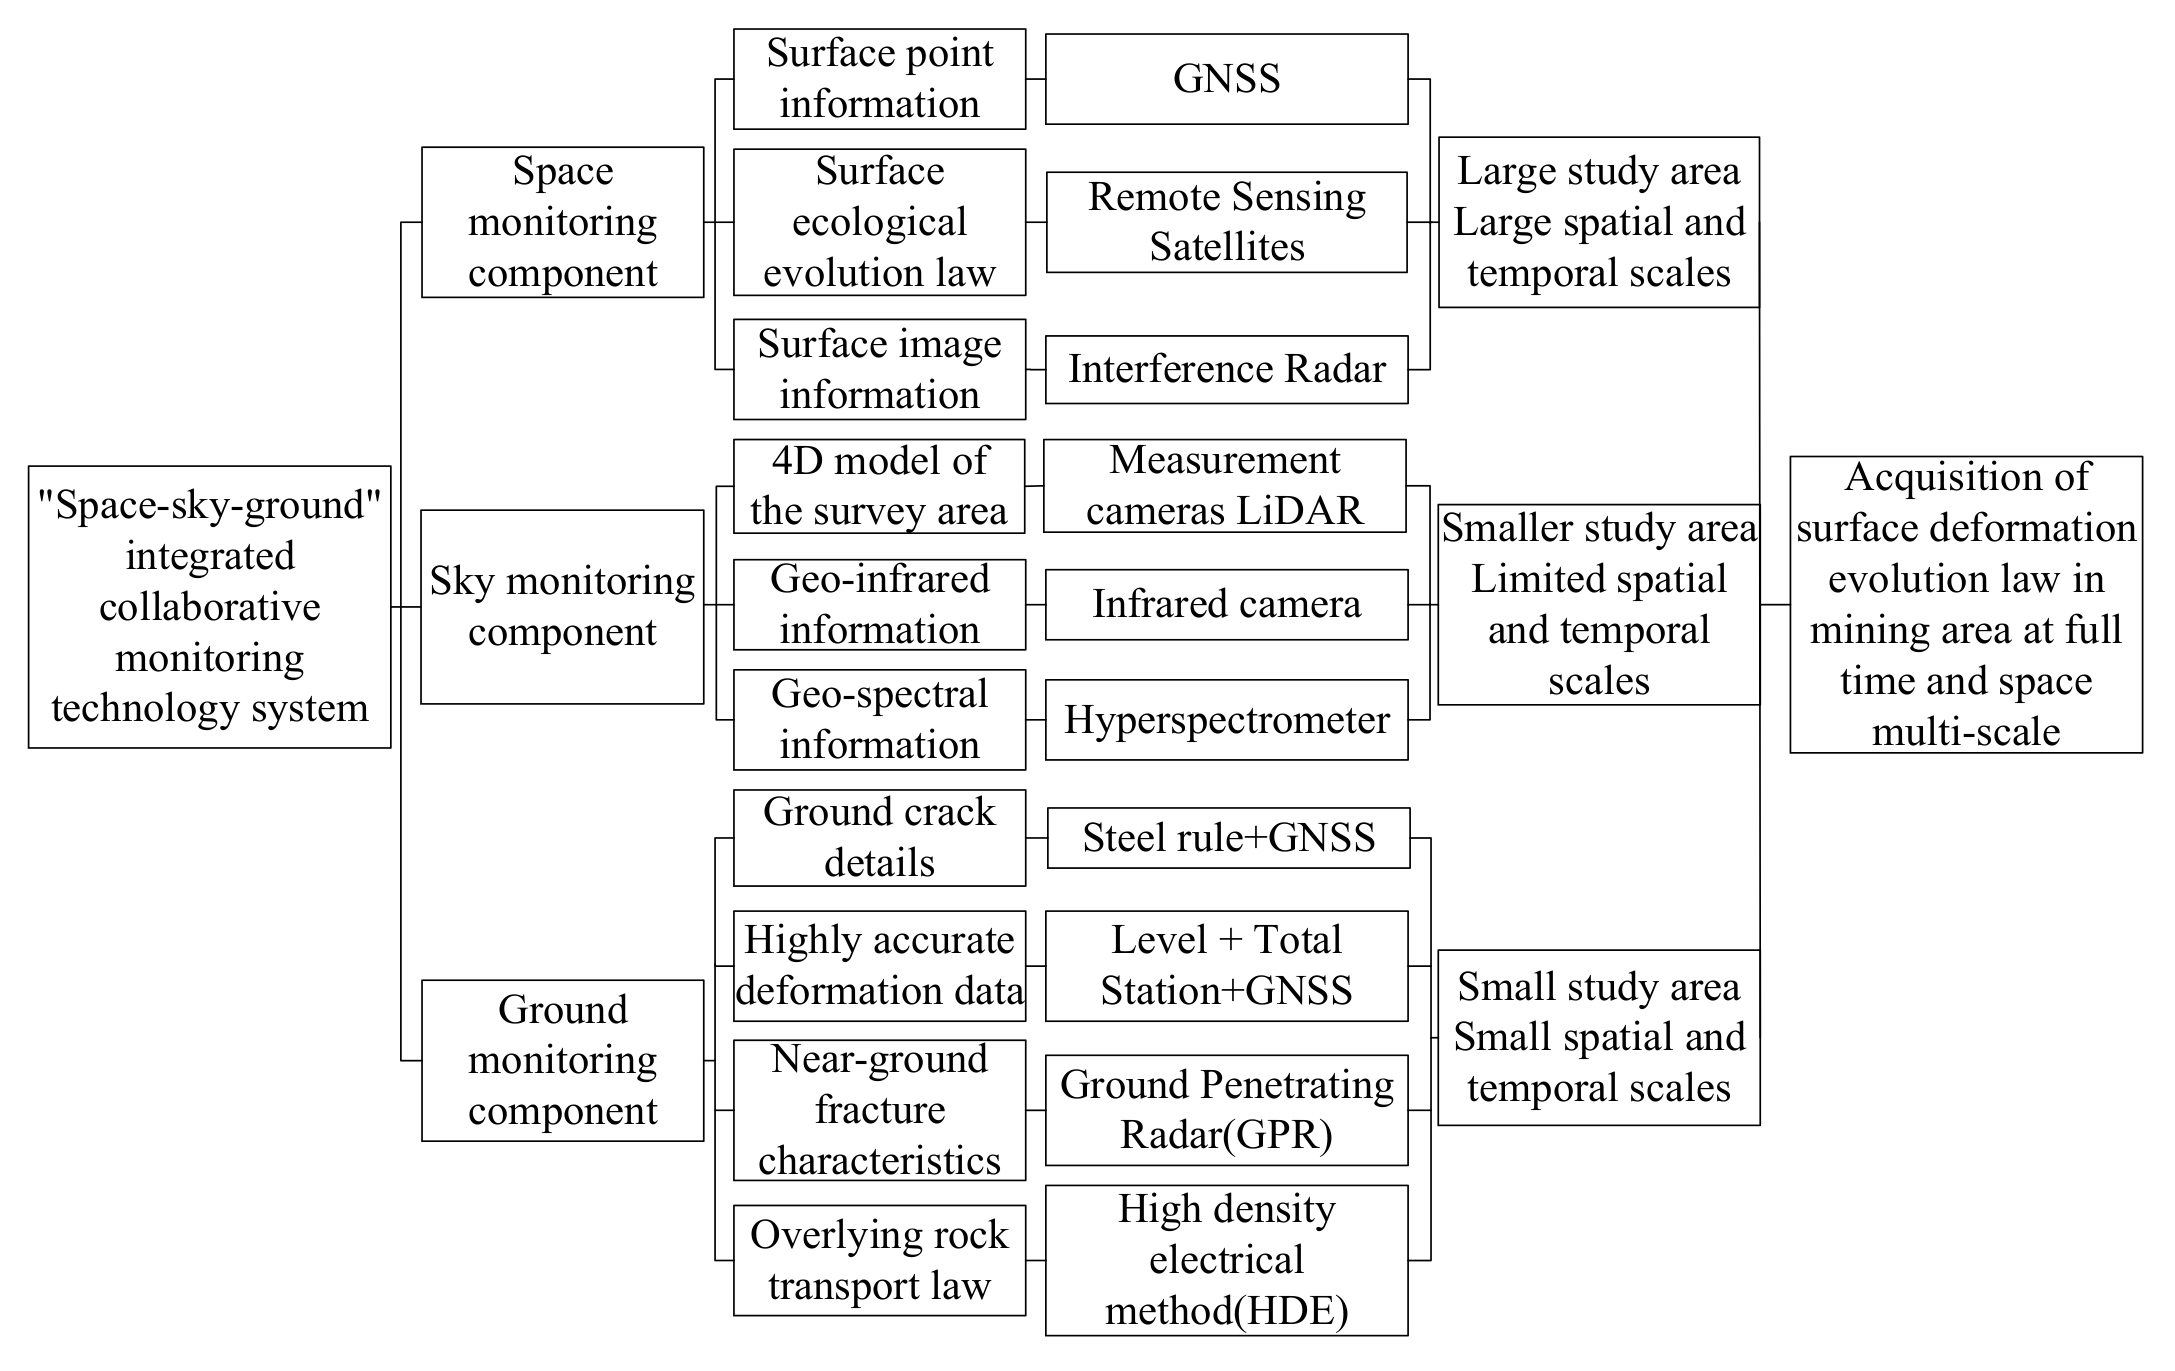
Based on the characteristics of surface deformation in the mine area and existing monitoring techniques (as shown in Table 1), the “space-sky-ground” collaborative monitoring framework was established. The “space-sky-ground” collaborative monitoring framework of surface subsidence in mining area is composed of three parts: space monitoring components, sky monitoring components and ground monitoring components. It combines, coordinates and complements various technologies such as observation network control, traditional point line observation, regional interference measurement, UAV measurement of surface, TLS measurement of surface shallow mining cracks, and realizes the function of comprehensive and three-dimensional monitoring of surface movement, deformation and shallow cracks. Through the efficient cooperation of space monitoring components, sky monitoring components and ground monitoring components, the spatial-temporal dynamic evolution process of surface deformation and ground cracks development in the mining process is effectively monitored, and the deformation and failure law of surface subsidence in mining area is obtained, as is shown in Figure 3. The space monitoring component, the sky monitoring component and the ground monitoring component are described in detail as follows:
Space monitoring components can obtain large-scale, high-precision and high-spatial-resolution surface deformation. Compared with traditional observation technology, InSAR has incomparable advantages for mine subsidence monitoring in a large area and complex terrain conditions. The basic principle of InSAR is to obtain two radar images of the same area by using two pairs of antennas for simultaneous observation or two near-parallel observations, and to obtain high-precision and high-resolution ground elevation or surface deformation information by obtaining the phase difference between two echo signals corresponding to the same target and combining with orbital data. InSAR technology is not only used in topographic mapping, but also widely used in land subsidence, change detection, seismic activity, digital elevation modeling and many other fields. Surface deformation monitoring is important for the safety of mine sites, since the maintenance of the stability of mine topography is the basis for conducting normal production and life. With the development of radar remote sensing technology, InSAR technology is widely used in the subsidence deformation monitoring of mines, especially the time series InSAR analysis methods (PS-InSAR, SBAS, etc.) can invert the historical evolution of ground subsidence based on time series SAR data with the accuracy of millimeter level. GNSS provides a unified datum for multi-source monitoring data and performs geolocation information alignment up and down the well.
Sky monitoring components use UAVs with measurement cameras to navigate and photograph within a specified range to record the extent of surface crack development and spatial spreading characteristics of the subsidence area. According to the different needs of the observer, the measurement cameras are classified into the generally visible camera, 3D camera, infrared camera and multispectral camera. Compared with the traditional manual measurement, the UAV with a measurement camera can quickly and efficiently obtain the information of ground crack and accurately save the GPS information, which has its unique advantages in places where humans cannot reach.
Ground monitoring components are based on the precise levelling and total station, steel ruler and GNSS precision measurement, and use the ground conventional measurement technology (levelling + wire), steel ruler and vernier caliper to measure the surface subsidence area and crack distribution with high precision.
Duration of surface deformation monitoring: the duration of surface subsidence monitoring is closely related to the geological mining conditions, the duration of the working face mining and the quality of the monitoring technology. In addition, the following steps are assisted: (1) after determining the monitoring object (mining workings), the characteristics of surface deformation under similar conditions should be determined by consulting the relevant literature, and the probability integral method should be used to make dynamic forecast of surface deformation when available; (2) at the early stage of mining, precision leveling measurement should be selected to monitor the location of the opencut to determine the time when the surface displacement caused by underground coal mining is reflected to the surface; (3) Integrate the results of (1) and (2) analysis, consider the advantages and disadvantages of each monitoring method, and determine the time of surface monitoring using different monitoring techniques.

2.3. Preference Model

2.3.1. Infactors Determination and Analysis

We determined the indicators analysis by AHP. AHP is a flexible quantitative method, which has become one of the commonly used methods in risk assessment [60,61,62,63,64]. Based on the relevant literature and engineering requirements to determine the influencing factors affecting the surface subsidence monitoring program [14,65,66,67], a total of three primary indicators and 16 secondary indicators are included, as shown in Figure 4 (natural factors and target constraints are determined in advance):
Based on the criterion and judgment principle of two-by-two comparison, fuzzy mathematical theory was applied to derive the criteria for comparing the importance of indicators. The factors of the previous level are used as the benchmark for the factors of the next level, and the judgment matrix is D after the two-by-two comparison.
D = X 11 X 12 X 21 X 22 X 1 n X 2 n X m 1 X m 2 X m n = X 1 X 1 X 1 X 2 X 2 X 1 X 2 X 2 X 1 X n X 2 X n X n X 1 X n X 2 X n X n
In Equation (1), D is the analytic hierarchy process judgment matrix, X i j i = j = 1 , 2 , , n is the significance of the comparison between two adjacent indicators.
Normalization and consistency testing are performed:
W ¯ i = j = 1 n X i j n , W i = W ¯ i / j = 1 n W ¯ j
λ m a x = i = 1 n D W i n W i
R C = I C I R = λ m a x n n 1 I R
where n is the order of the judgment matrix, n = 1 , 2 , , n   , W i is the normalized judgment matrix, λ m a x is the maximum eigenvalue of the judgment matrix, I C is the consistency test index, I R is the random consistency indicator, R C is the consistency ratio of the judgment matrix.
The maximum eigenvalues and eigenvector are derived by normalizing the indicators affecting the surface monitoring program, as shown in Table 2. The results are tested for consistency, and the results are shown in Table 3.
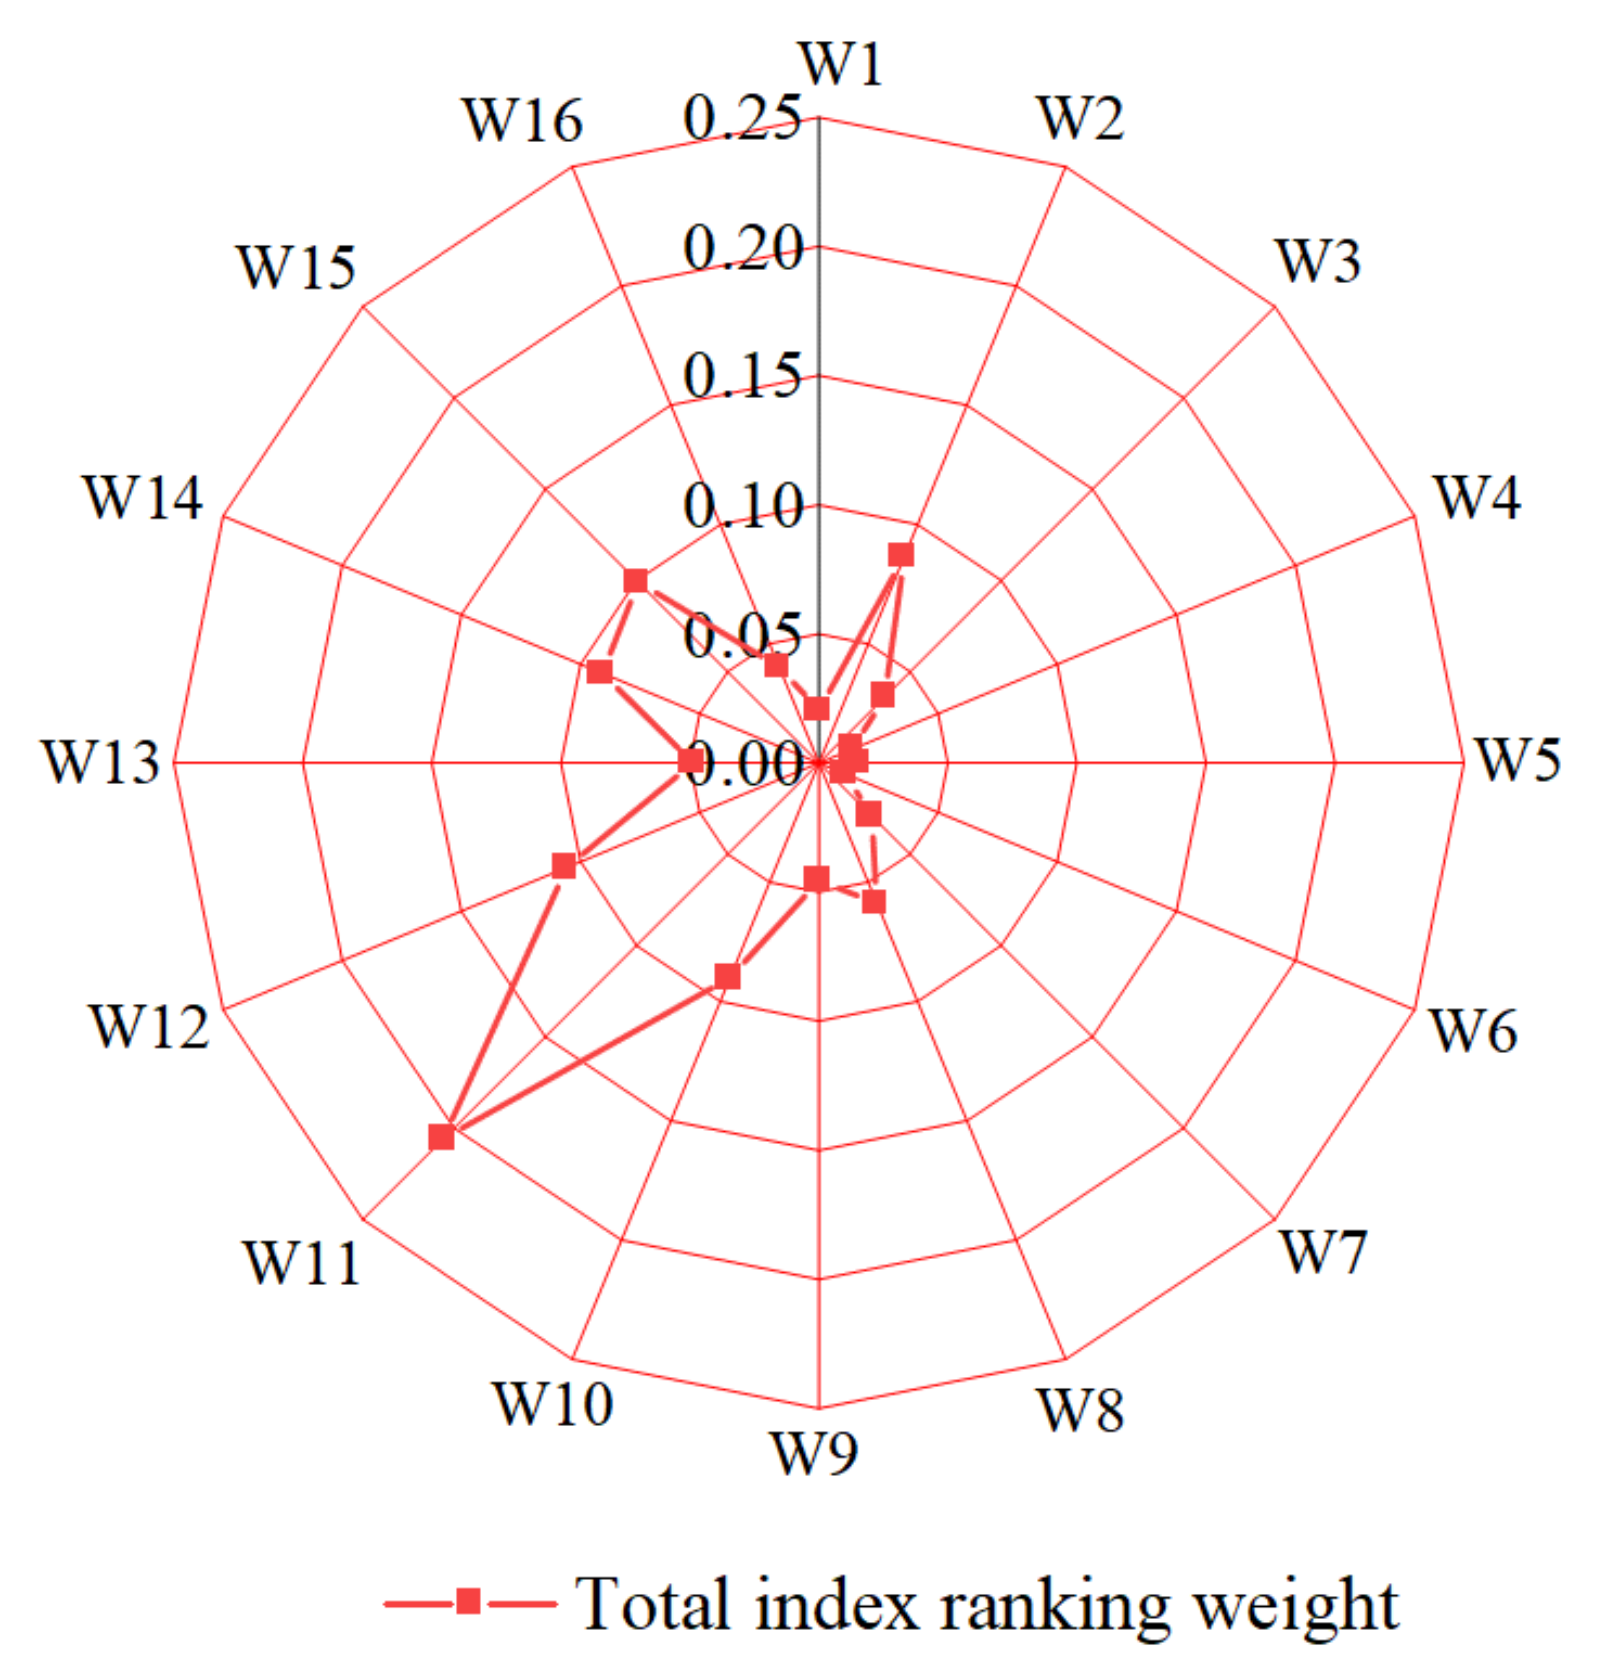
Based on the calculation results of AHP, the optimal weight of each preferred index is analyzed, and the results are shown in Figure 5. Figure 5 shows that among the natural factors, vegetation coverage has the greatest weight on the indexes. Among the target constraints, the project cost inputs have a great influence on the selection of monitoring methods. Among the site needs, the surface monitoring accuracy is the most important factor, and the accuracy factor is essential for understanding the mining displacement mechanism and mining-related geohazard prevention and control. The results of the analysis in Figure 5 are generally consistent with reality and prove the feasibility of using AHP to determine the weights of the surface monitoring program.

2.3.2. Comprehensive Preferred Model Based on AHP-TOPSIS

The TOPSIS method can comprehensively consider a variety of index factors of the combined monitoring program, but it is difficult and complicated for multi-factor analysis and weight calculation, while the AHP method overcomes this drawback and ensures the global optimality of the algorithm. The model is applied to the surface monitoring program selection in mining areas, which can make the selection system more scientific, comprehensive and accurate, and the evaluation results are more in line with the reality. The steps of the combined surface subsidence monitoring program optimization using AHP-TOPSIS are as follows:
Step 1: Calculate the weighted normalized decision matrix.
Setting different monitoring programs sets A = A 1 , A 2 , , A m and influencing factors sets is X = X 1 , X 2 , , X n . Based on the “space-sky-ground” collaborative monitoring framework to determine different monitoring programs and impact factors index matching degree, the matching degree is 1–5 levels. We have established the matching matrix between monitoring programs and impact factors, and calculated the weighted standardized decision matrix:
A = X 11 X 12 X 21 X 22 X 1 n X 2 n X m 1 X m 2 X m m
C = c i j m × n = w 1 b 11 w 2 b 12 w 1 b 21 w 2 b 22 w n b 1 n w n b 2 n w 1 b m 1 w 2 b m 2 w n b m n
where C is the weighted standardized decision matrix, W i is the total ranking weight of indicators, b i j is the standardized decision matrix.
Step 2: Determine the closeness of different monitoring programs.
Calculating the distance of different monitoring programs from the positive and negative ideal solutions and determining the closeness of the monitoring program to the positive ideal solution:
d i + = i = 1 n c i j c j + 2 , d i = i = 1 n c i j c j 2
E i + = d i d i + + d i , 0 E i + 1
In Equations (7) and (8), c j + and c j are the corresponding elements of C + and C respectively, The closer E i + is to 1, the nearer the monitoring program is to the ideal monitoring program.
Step 3: Establishing a preference evaluation matrix.
Combined with TOPSIS method, we determine the closeness of each monitoring program and AHP method to determine the eigenvector, the integrated monitoring method evaluation result vector F is derived, and the expression is as follows. The integrated preference evaluation matrix is established.
F = W E
where E is the evaluation matrix formed by proximity analysis, W is the weight of rule layer calculated by AHP method.
Step 4: Preferred monitoring program.
The optimal monitoring program is selected by combining the result vector F calculated in Step 3.

3. Case Study

3.1. Study Area

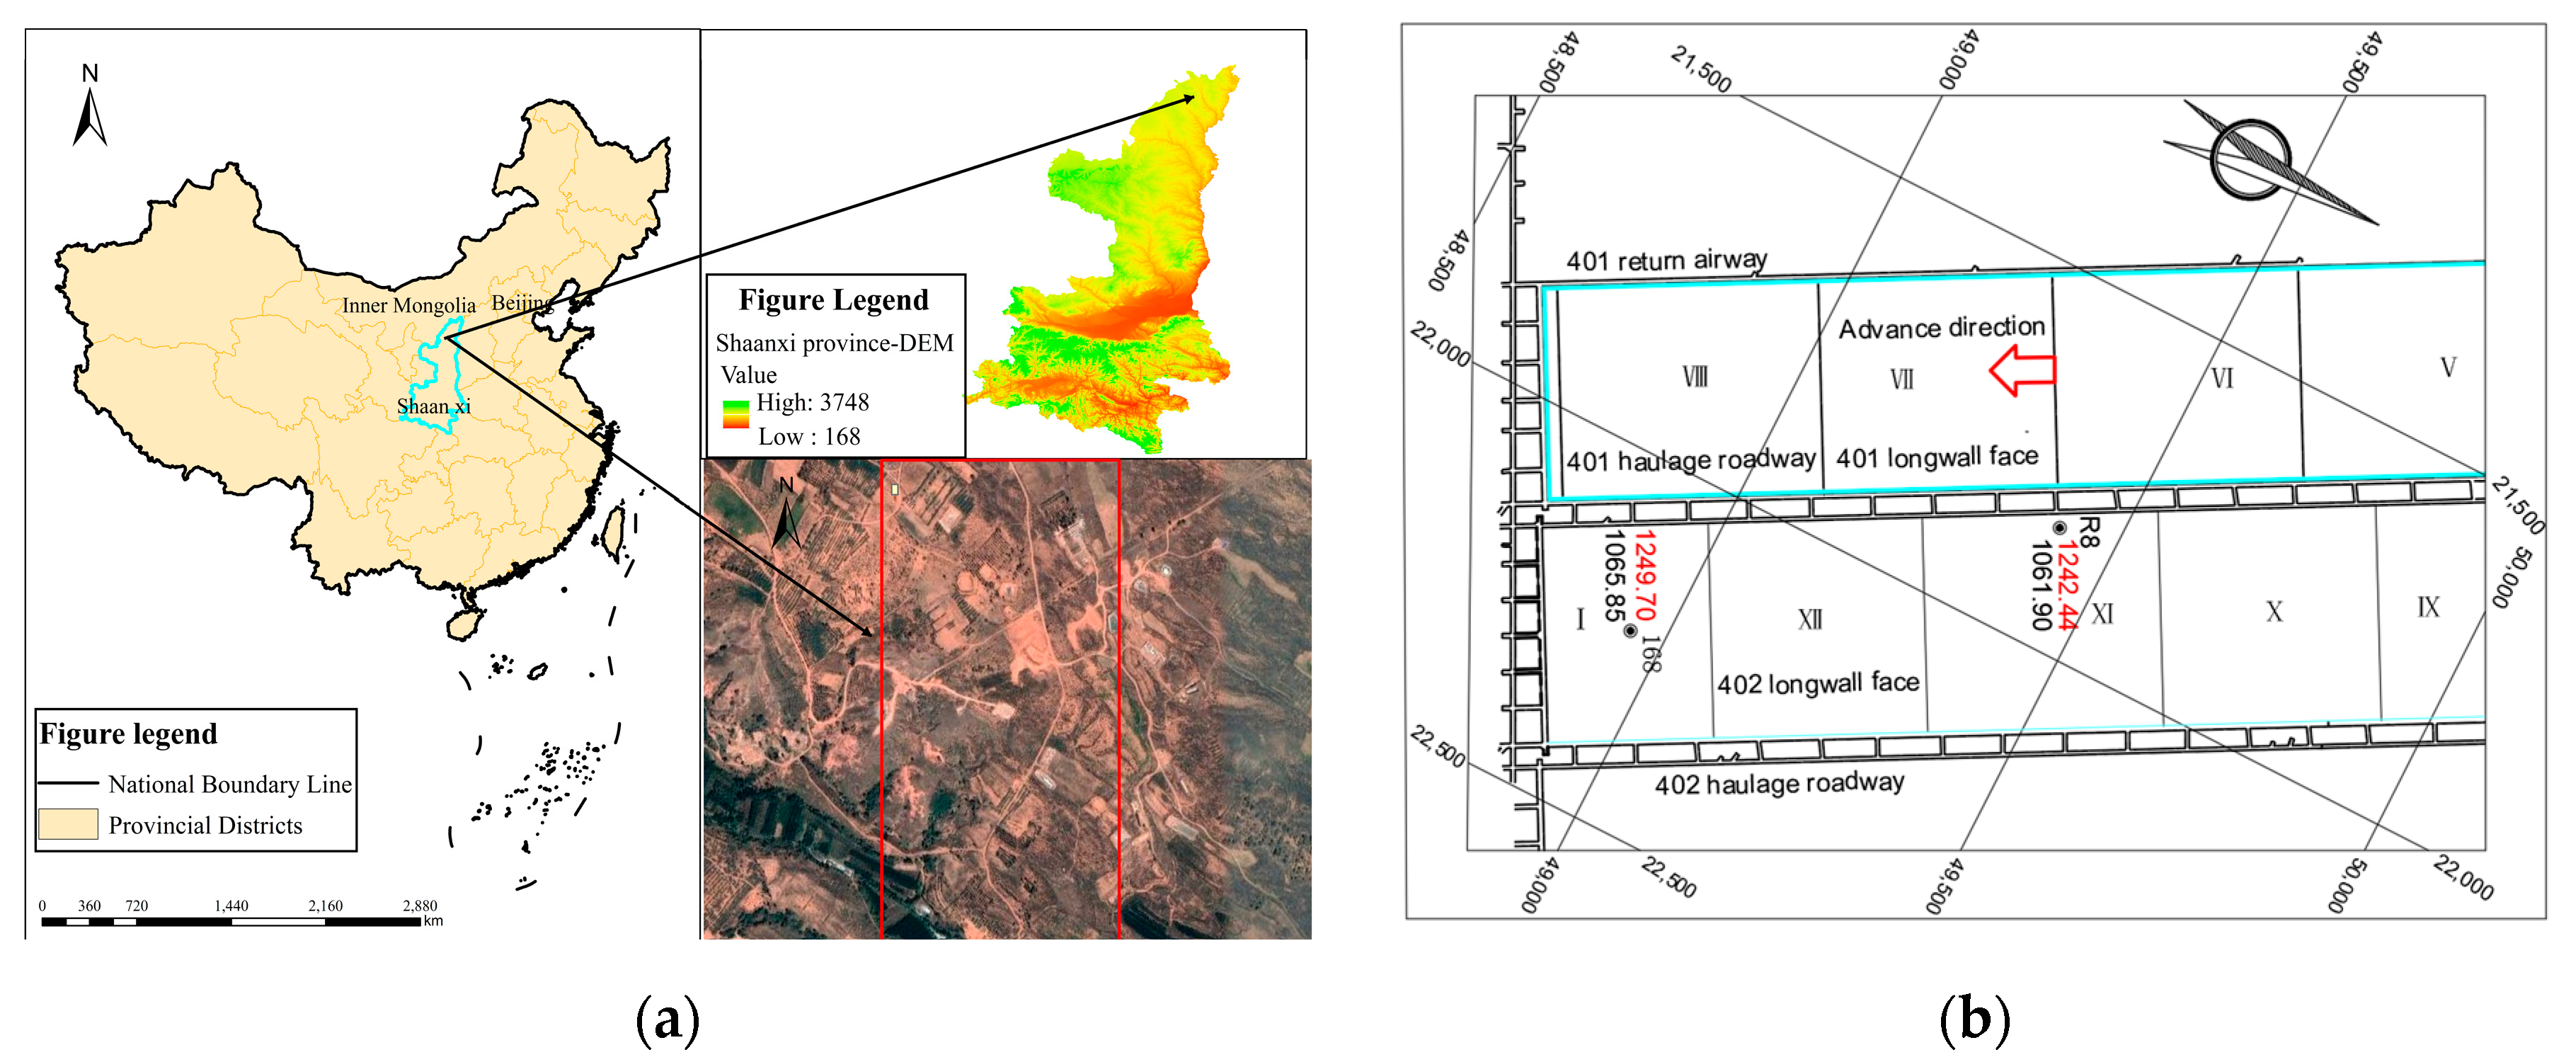
Shangwan minefield is located in the southeast of Dongsheng minefield, eastern part of Ordos Plateau, and most of its administrative jurisdiction belongs to Ulanmulun town of Igingholo Banner. The elevation is high in the northwest part and low in the southeast part which shows the shape of a slope. On the east side of 401, the fully mechanized mining face of Shangwan minefield is 402, the fully mechanized mining face which has not been circled yet; on the south side is minefield boundary, adjacent to Wenjiata minefield of Ulan Group; on the west side is 412, the fully mechanized mining face of planning and design, in which the digging has not started yet; on the north side is the minefield boundary, adjacent to QIlianta minefield. The fully mechanized mining face is arranged along with the inclination, with a strike length of 299.2 m, an advance length of 5254.8 m, and a design mining height of 8.8 m. The ground elevation of the fully mechanized face is 1188–1300 m, and the floor of the coal seam floor is 1043–1066 m. The 401 working face layout is shown in Figure 6:

3.2. Preference of Surface Subsidence Monitoring Program

Based on the “space-sky-ground” collaborative monitoring framework established in Section 2.2, five monitoring techniques were initially identified based on the objective factors of the project: GNSS and CORS, InSAR, TLS, UAV, Steel ruler and GNSS, and now according to the actual project we need to select four combination monitoring techniques to monitor the surface subsidence of 401 working face in Shendong mine area. There are five combination programs in Table 4.
In the framework of “space-sky-ground” collaborative monitoring, based on the information on the study area, probability integral method and the prediction parameters of the adjacent working face, the reference values of the first 10 of the 16 evaluation indicators are determined. Then, the initial evaluation matrix is constructed for natural factor indicators, target constraints indicators and site needs indicators respectively, and the matrix is weighed and standardized to calculate the closeness of each scheme. According to TOPSIS, the optimal evaluation matrix for the monitoring scheme of 401 working face in Shendong mine is determined.
E = 0.1835 0.3542 0.2751 0.0000 0.1835 0.2043 0.1498 0.1548 0.2375 0.2536 0.0863 0.2357 0.1501 0.2432 0.2848
The weight of the preferred model criterion layer (layer B) for the selection of surface monitoring program in mining areas determined using the AHP method is shown in the following equation.
W = 0.1571 0.2493 0.5936
So:
F = W E = 0.1302 0.2329 0.1709 0.2036 0.2614
In summary, the comprehensive superiority of each program can be obtained, and the order of superiority of the surface subsidence monitoring program at the 401 working face of Shendong mine is: Program V > Program II > Program IV > Program III > Program I. The monitoring scheme is shown in Figure 7.
Meanwhile, based on the “space-sky-ground” collaborative monitoring framework, the surface deformation monitoring period of 401 working face was determined. The 401 working face mining is a shallow buried thick coal seam mining type, this type of surface subsidence has the characteristics of early initiation of subsidence, fast subsidence speed and short time to reach the maximum subsidence value; combined with the results of precision levelling at the location of the opencut, the advantages and disadvantages of monitoring technology and the actual project needs, the 401 working face surface subsidence monitoring time was determined. The period studied in this experiment is the position of the working face from the opencut advance to near 1000 meters.

3.3. Surface Subsidence Monitoring

3.3.1. InSAR Subsidence Monitoring

In this experiment, we used 30 SAR images from the Sentinel-1 satellite for the time interval 14 October 2017 to 21 October 2018, with images covering the entire Shendong mining area. The Sentinel-1 satellite orbits in a near-polar sun-synchronous orbit at an altitude of approximately 700 km, with a revisit period of 12 days. The Sentinel-1 satellite employs stringent orbit control techniques to provide very high-quality interferometric SAR image data. The satellite has multiple imaging modes, allowing for different polarizations such as monitorization and dual polarization. Details of the SAR images from the experiment are shown in Table 5. The DEM used in the experiment is the 30m resolution SRTM DEM data provided by NASA, which is used to remove the reference terrain phase, and the precision orbital POD data, which is released 21 days after the SAR imaging, to attenuate the orbital phase error.

3.3.2. TLS Subsidence Monitoring

The TLS was implemented three times, the first period was from 28 May 2018 to 1 June 2018, the second period was from 3 July 2018 to 6 July 2018, and the third period was from 11 September 2018 to 15 September 2018. Based on the actual terrain conditions, a suitable racking station location and scanning resolution will be selected. After the scanning station location were determined, the actual scanning was prioritized according to the distance from the workings, with the areas closer to the workings being significantly affected by mining and prioritized for scanning. As the terrain varies from one period to another, the scanning stations will be adjusted according to changes in the terrain. The station layout is shown in Figure 8a, and the point cloud data were classified, denoised, resampled, spliced and treated with other internal processing. To study the impact of mining on the deformation of the area close to the working face, the scanning stations and the location of the strike and tendency observation lines were combined to conduct comparative analysis of settlement changes along the strike and tendency observation lines respectively, and the relationship between the strike observation line K, tendency observation line L and the location of the point cloud model is shown in Figure 8b.

3.3.3. UAV Subsidence Monitoring

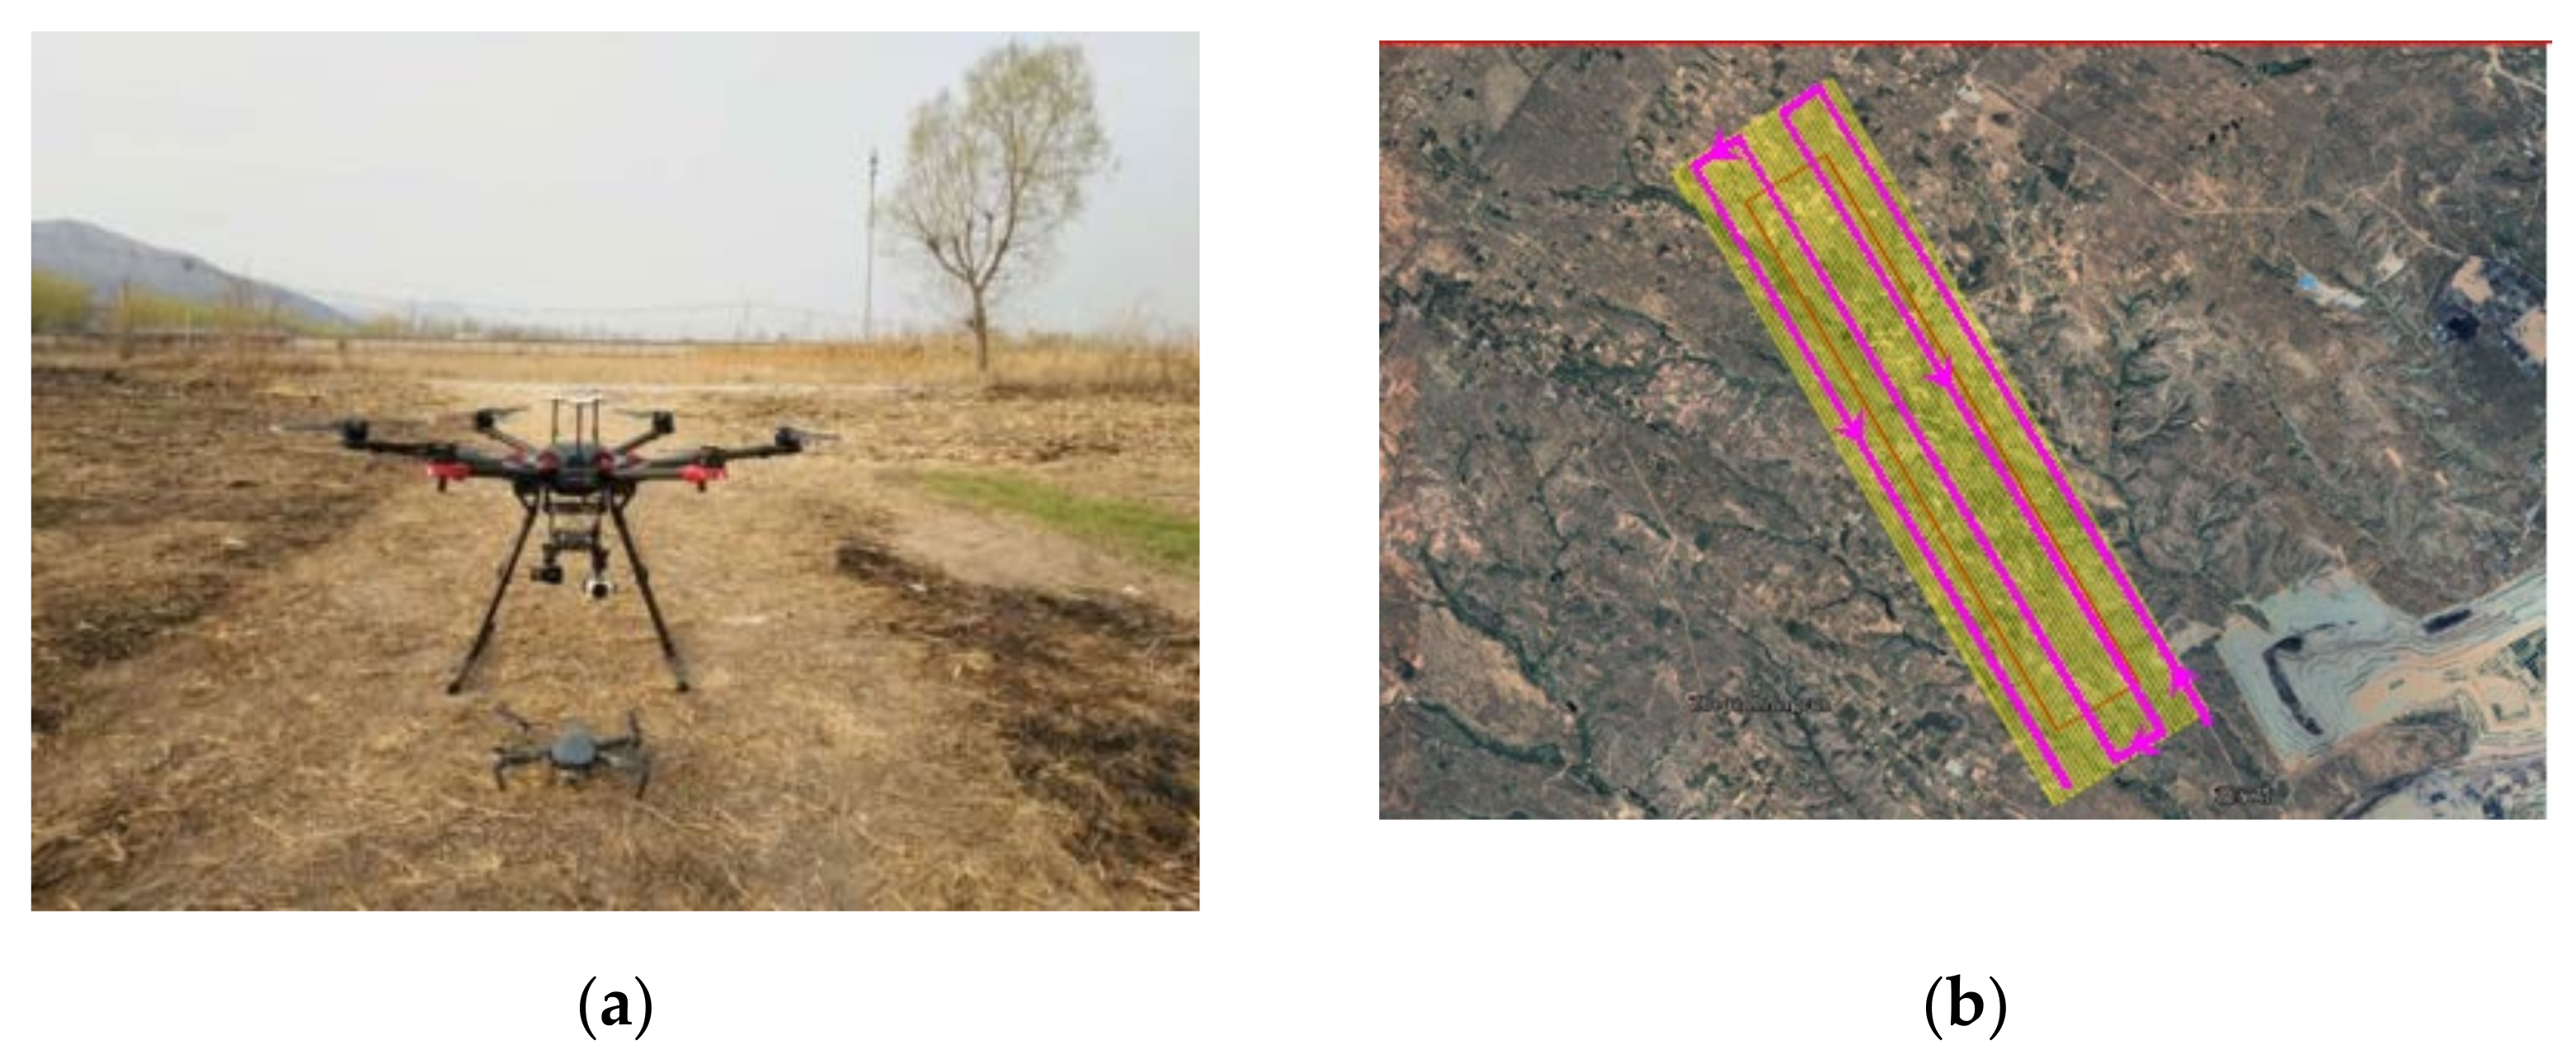
The M600Pro professional DJI UAV with Tau2-640R HD infrared camera, Z3 visible camera and tilt 3S 3D camera were used to achieve infrared observation of surface cracks and modeling of surface 3D morphology. The UAV and field flight path are shown in Figure 9.
The crack observation of visible and infrared imaging of the whole study area was carried out according to the designed flight path. Based on the observation using the aerial photography of the UAV, the Trimble® Geo 7x handheld was used for the uninterrupted measurement and positioning of the surface cracks in combination with the manual measurement data of the surface cracks.

3.3.4. Steel Ruler and GNSS Subsidence Monitoring

The steel ruler and GNSS were used to measure the surface cracks dynamically and record the changes in crack opening and drop, the crack width measurement method is shown in Figure 10. The cracks are divided into central dynamic cracks and boundary cracks for zoned measurements to track the dynamic change of “creation-expansion- closure” of the cracks in different areas of the ground. Daily records are kept of the opening and step-off of the same crack at the same location, while information on the mining advance rate and mine pressure is collected to analyze the relationship between the coupling of high-intensity mining overburden transport and cracks.

4. Results

4.1. Surface Subsidence Monitoring from Single Technique

4.1.1. Surface Deformation Monitoring Results of Mining Area Based on InSAR Technology

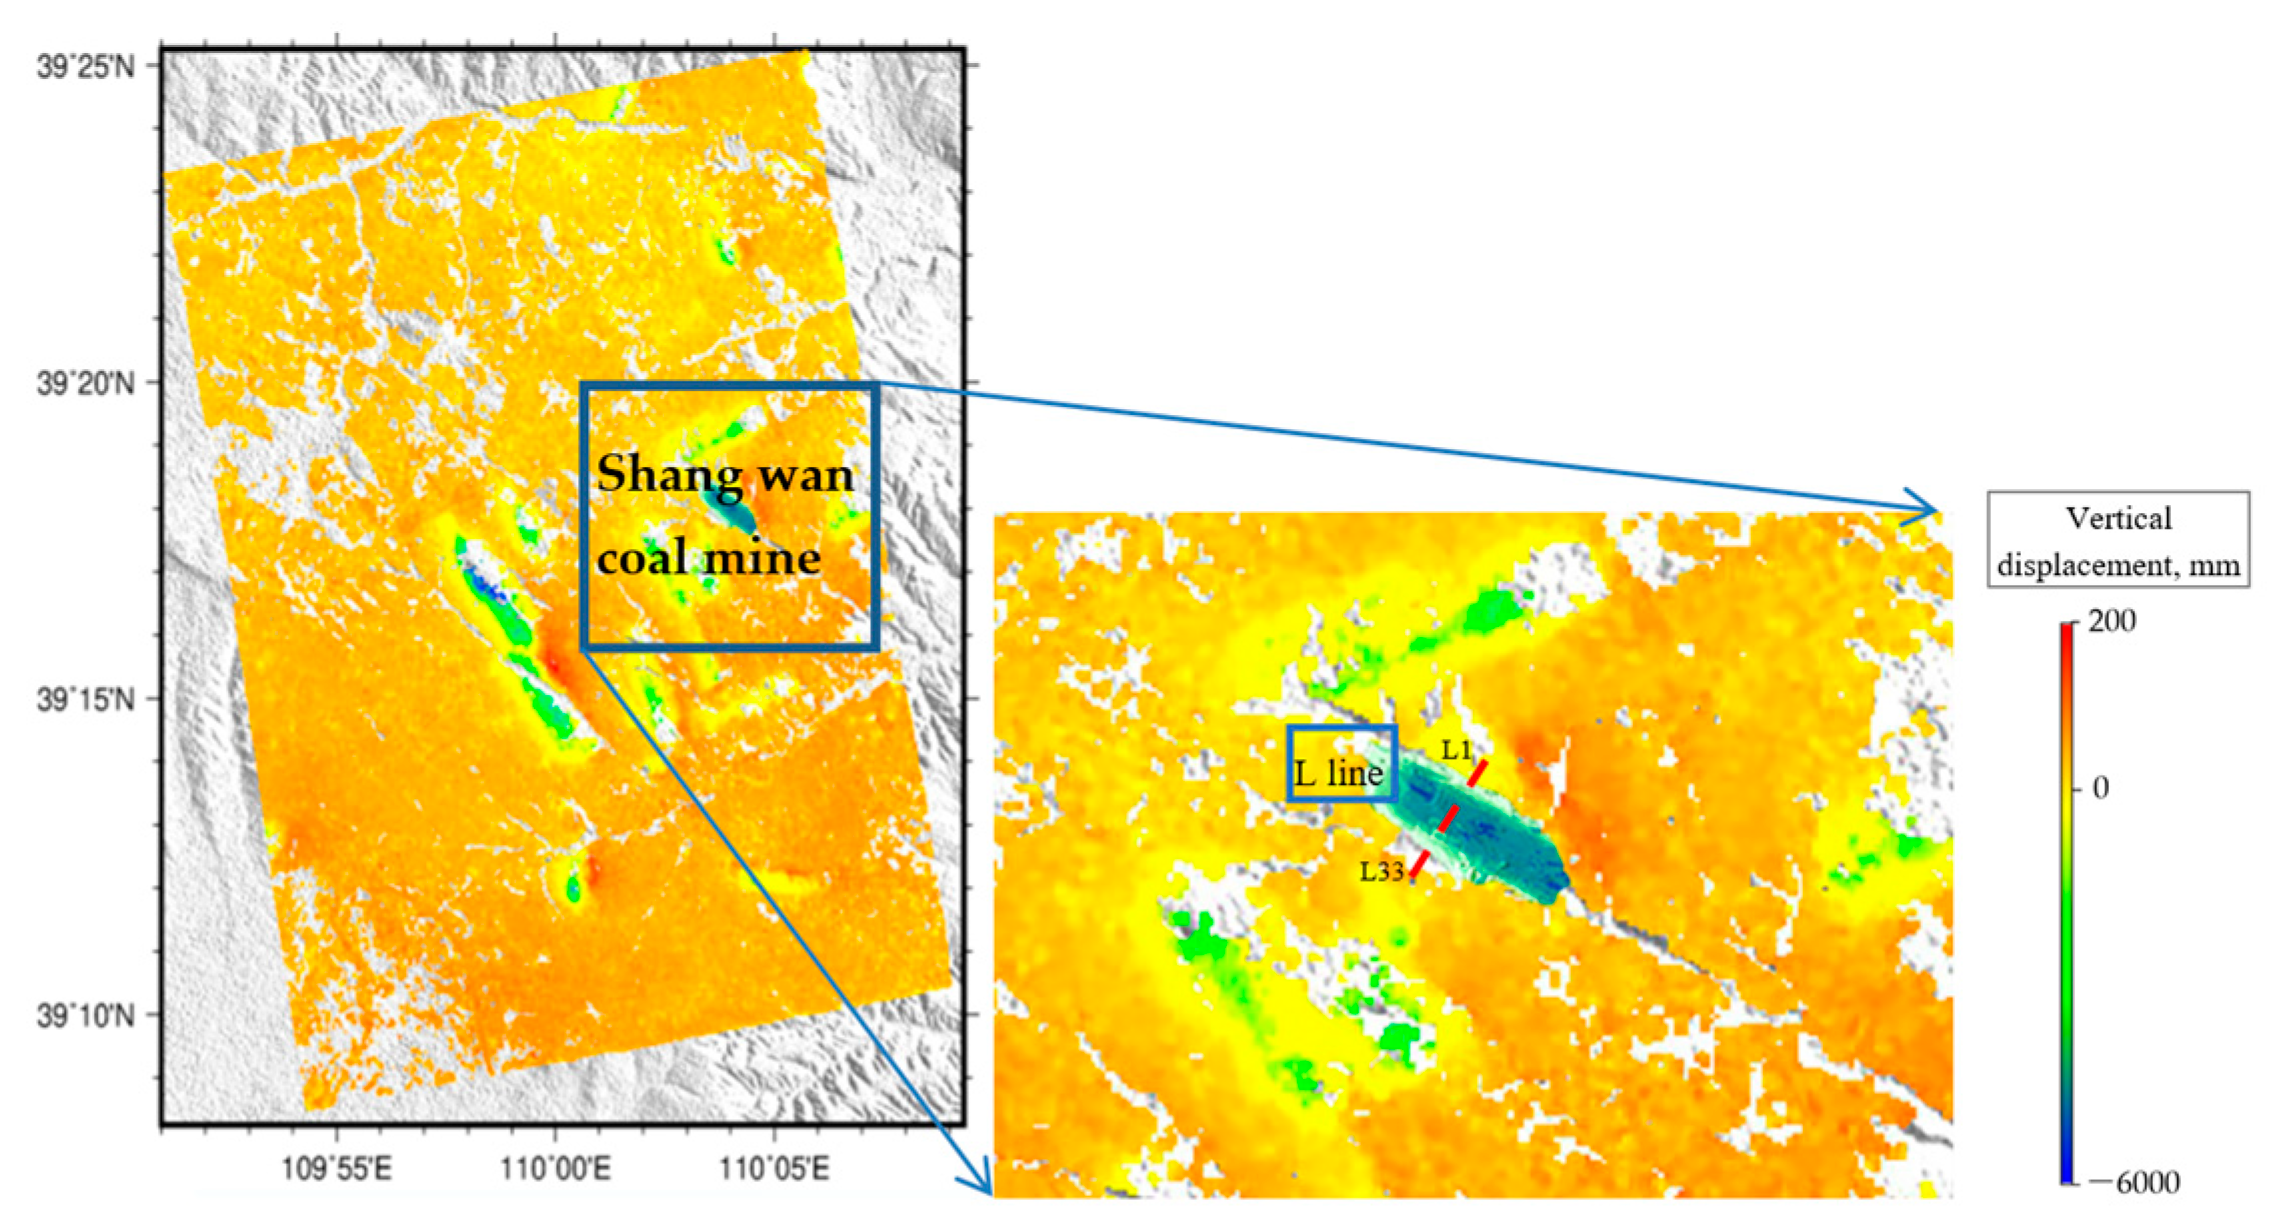
The SAR images were analyzed to obtain deformation rates and cumulative deformation maps, as shown in Figure 11. In Figure 11a, there are 15 areas of ground subsidence due to coal mining in the area (black dashed ovals in the figure), with a maximum ground subsidence rate of −326 mm/yr. At the same time, there is surface uplift in five areas (red dashed ovals in the figure), with a maximum uplift rate of 125 mm/yr. In Figure 11b, the maximum cumulative subsidence detected from InSAR reached 365 mm and the maximum cumulative surface uplift reached 137 mm. As can also be seen in Figure 11, the large gradient of deformation in the middle of the mine area resulted in interferometric decoherence and gaps in some areas where deformation information was not available.

4.1.2. TLS Deformation Results

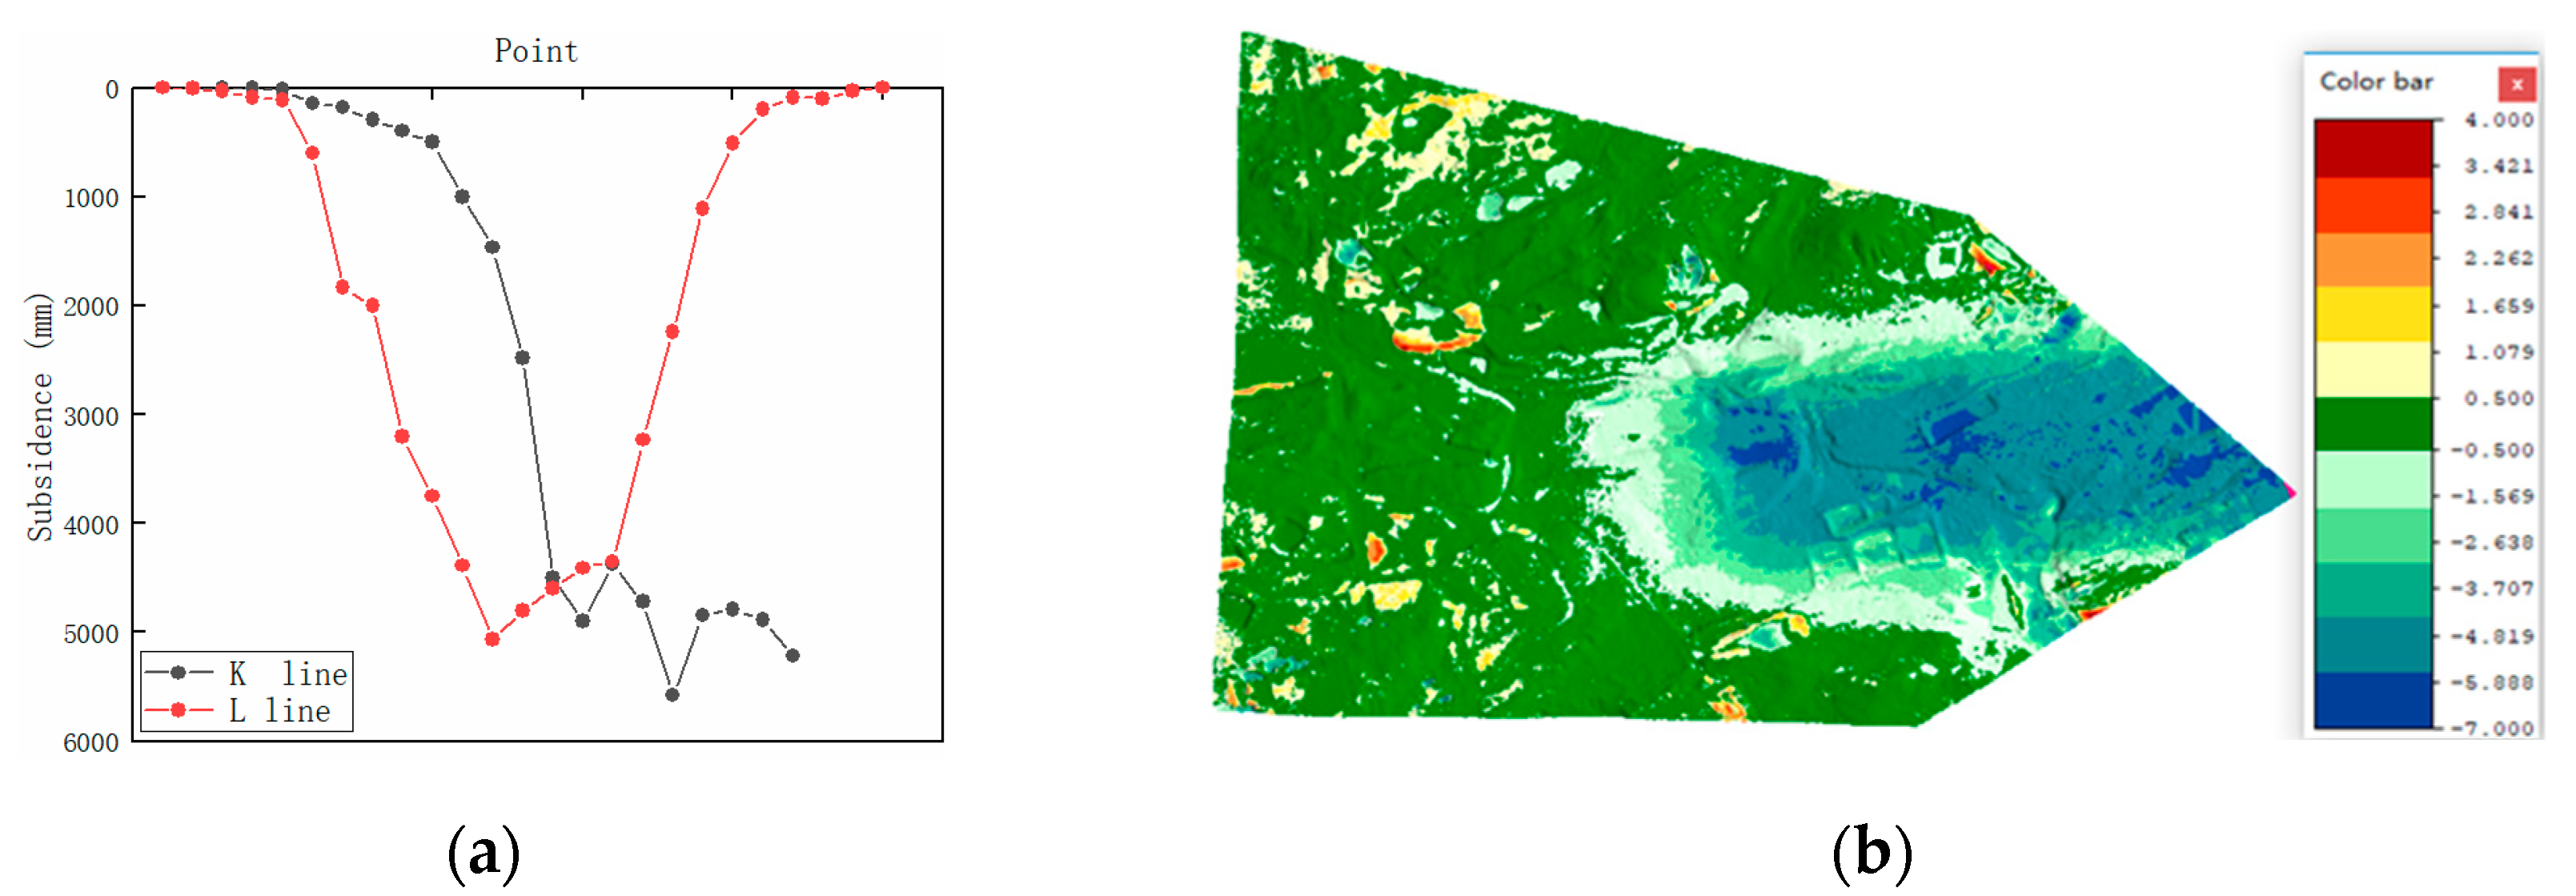
The point cloud data of Phase I and Phase III of the K and L lines were collated, and the amount of subsidence at each point on the two profile lines was calculated, as shown in Figure 12a. The point cloud data settlement comparison analysis is based on Riscan PRO software and color separation display is gained according to different settlement amounts, the results are shown in Figure 12b.
Figure 12 shows that the subsidence in most areas of the region is between 2–4 m, with a small amount of subsidence greater than 5 m, and there are also a small number of elevation anomalies—the area with an elevation rise of 3–4 m in the figure. The reasons for this phenomenon are: (1) Because this area is at the edge of the scanning, error of triangulation network construction is caused by point cloud voids. As this area is at the edge of the scanning range, the point cloud data is less, and the modeling of the triangulation network will lift the surface of the feature and produce errors. (2) The error of feature change is caused by human activities, such as the demolition of houses and the accumulation of construction debris in the vicinity. Meanwhile, we can find that TLS monitors surface subsidence in small areas with high accuracy, and the monitoring area is relatively small compared with InSAR. If large surface deformation needs to be acquired, TLS technology will be limited.

4.1.3. UAV Deformation Results

(1)
Surface cracks
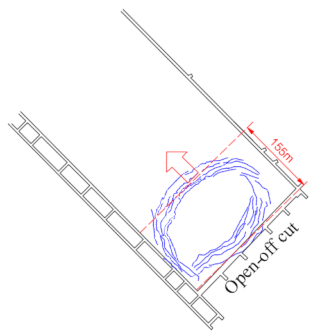
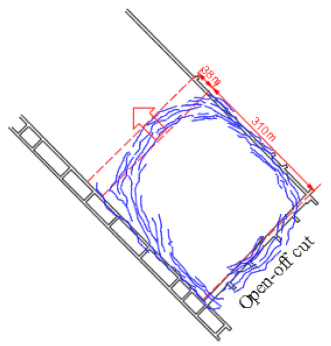
Monitoring data was selected for 9 May and 2 June 2018, when the workings were advanced to 155 m and 310 m from the opencut. The specific surface development was plotted on the corresponding location of the working face to study the correlation law between mining on the working face and surface crack development [68], as shown in Table 6.
(2)
Construction of 3d surface model
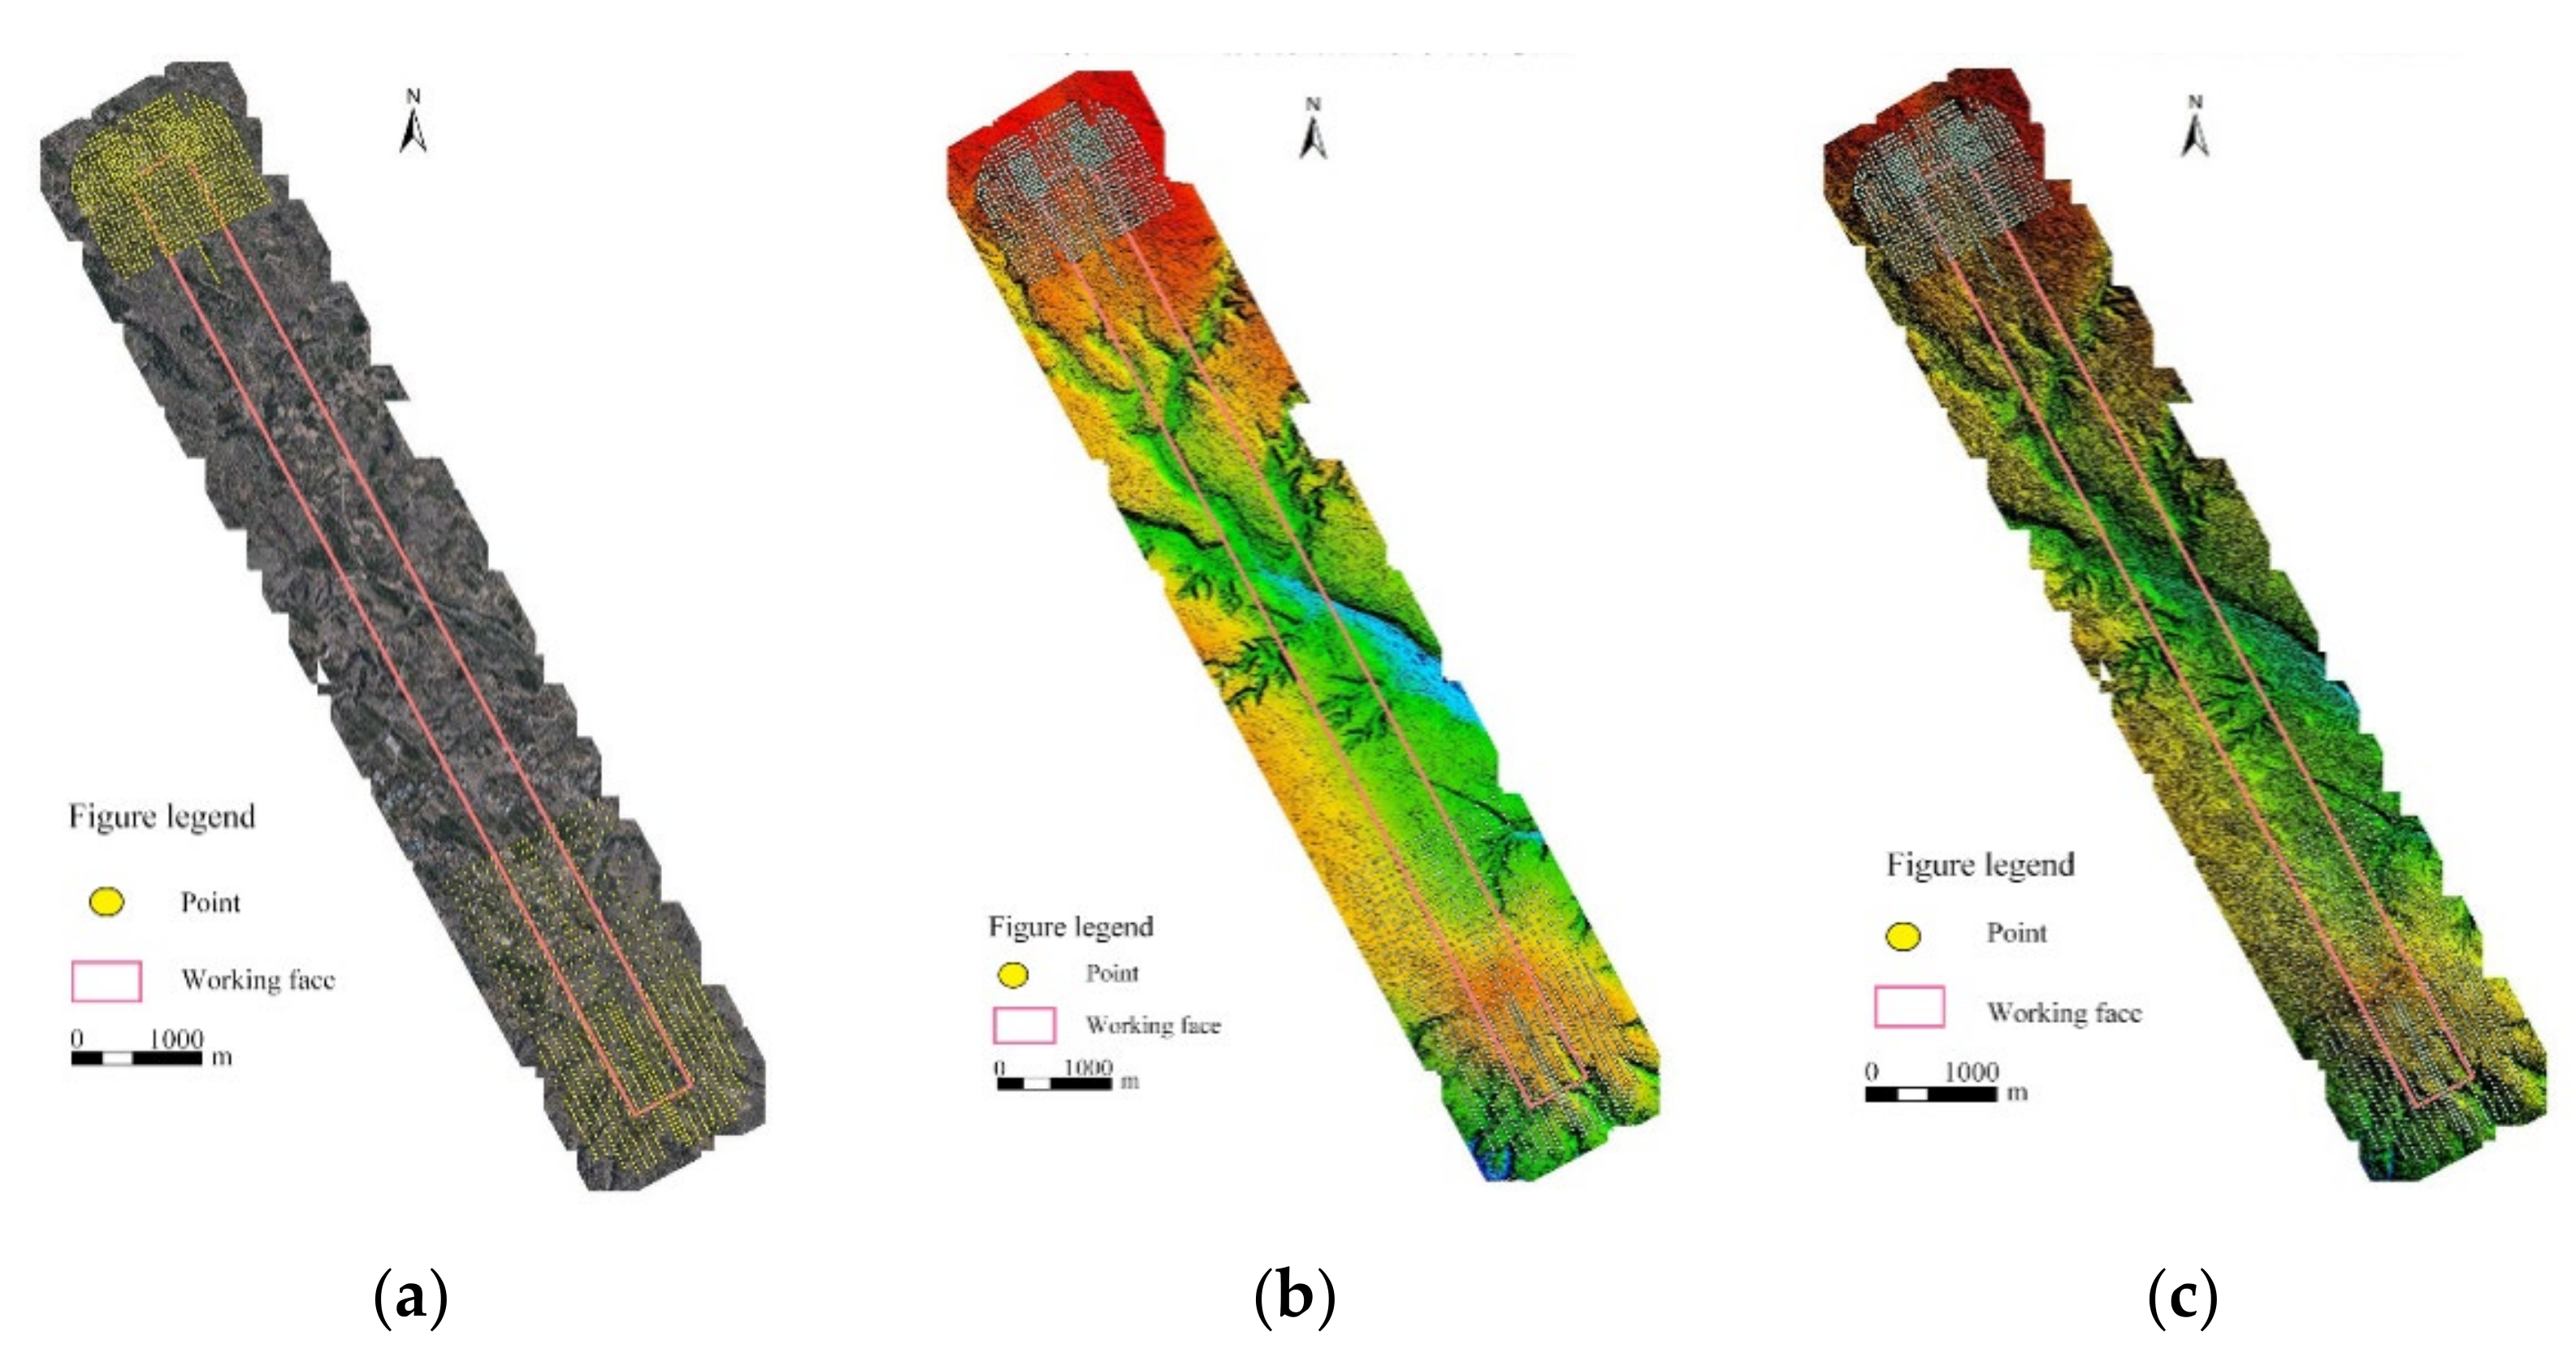
Based on the visible photos taken by the on-site UAV and the 3D model results produced by ContextCapture Center software, the survey area 0.05 m resolution DOM (Digital Orthophoto Map), 1m resolution DSM (Digital Surface Model) and 1m resolution DEM (Digital Elevation Model) are generated, as shown in Figure 13.

4.1.4. Deformation from Steel Ruler and GNSS

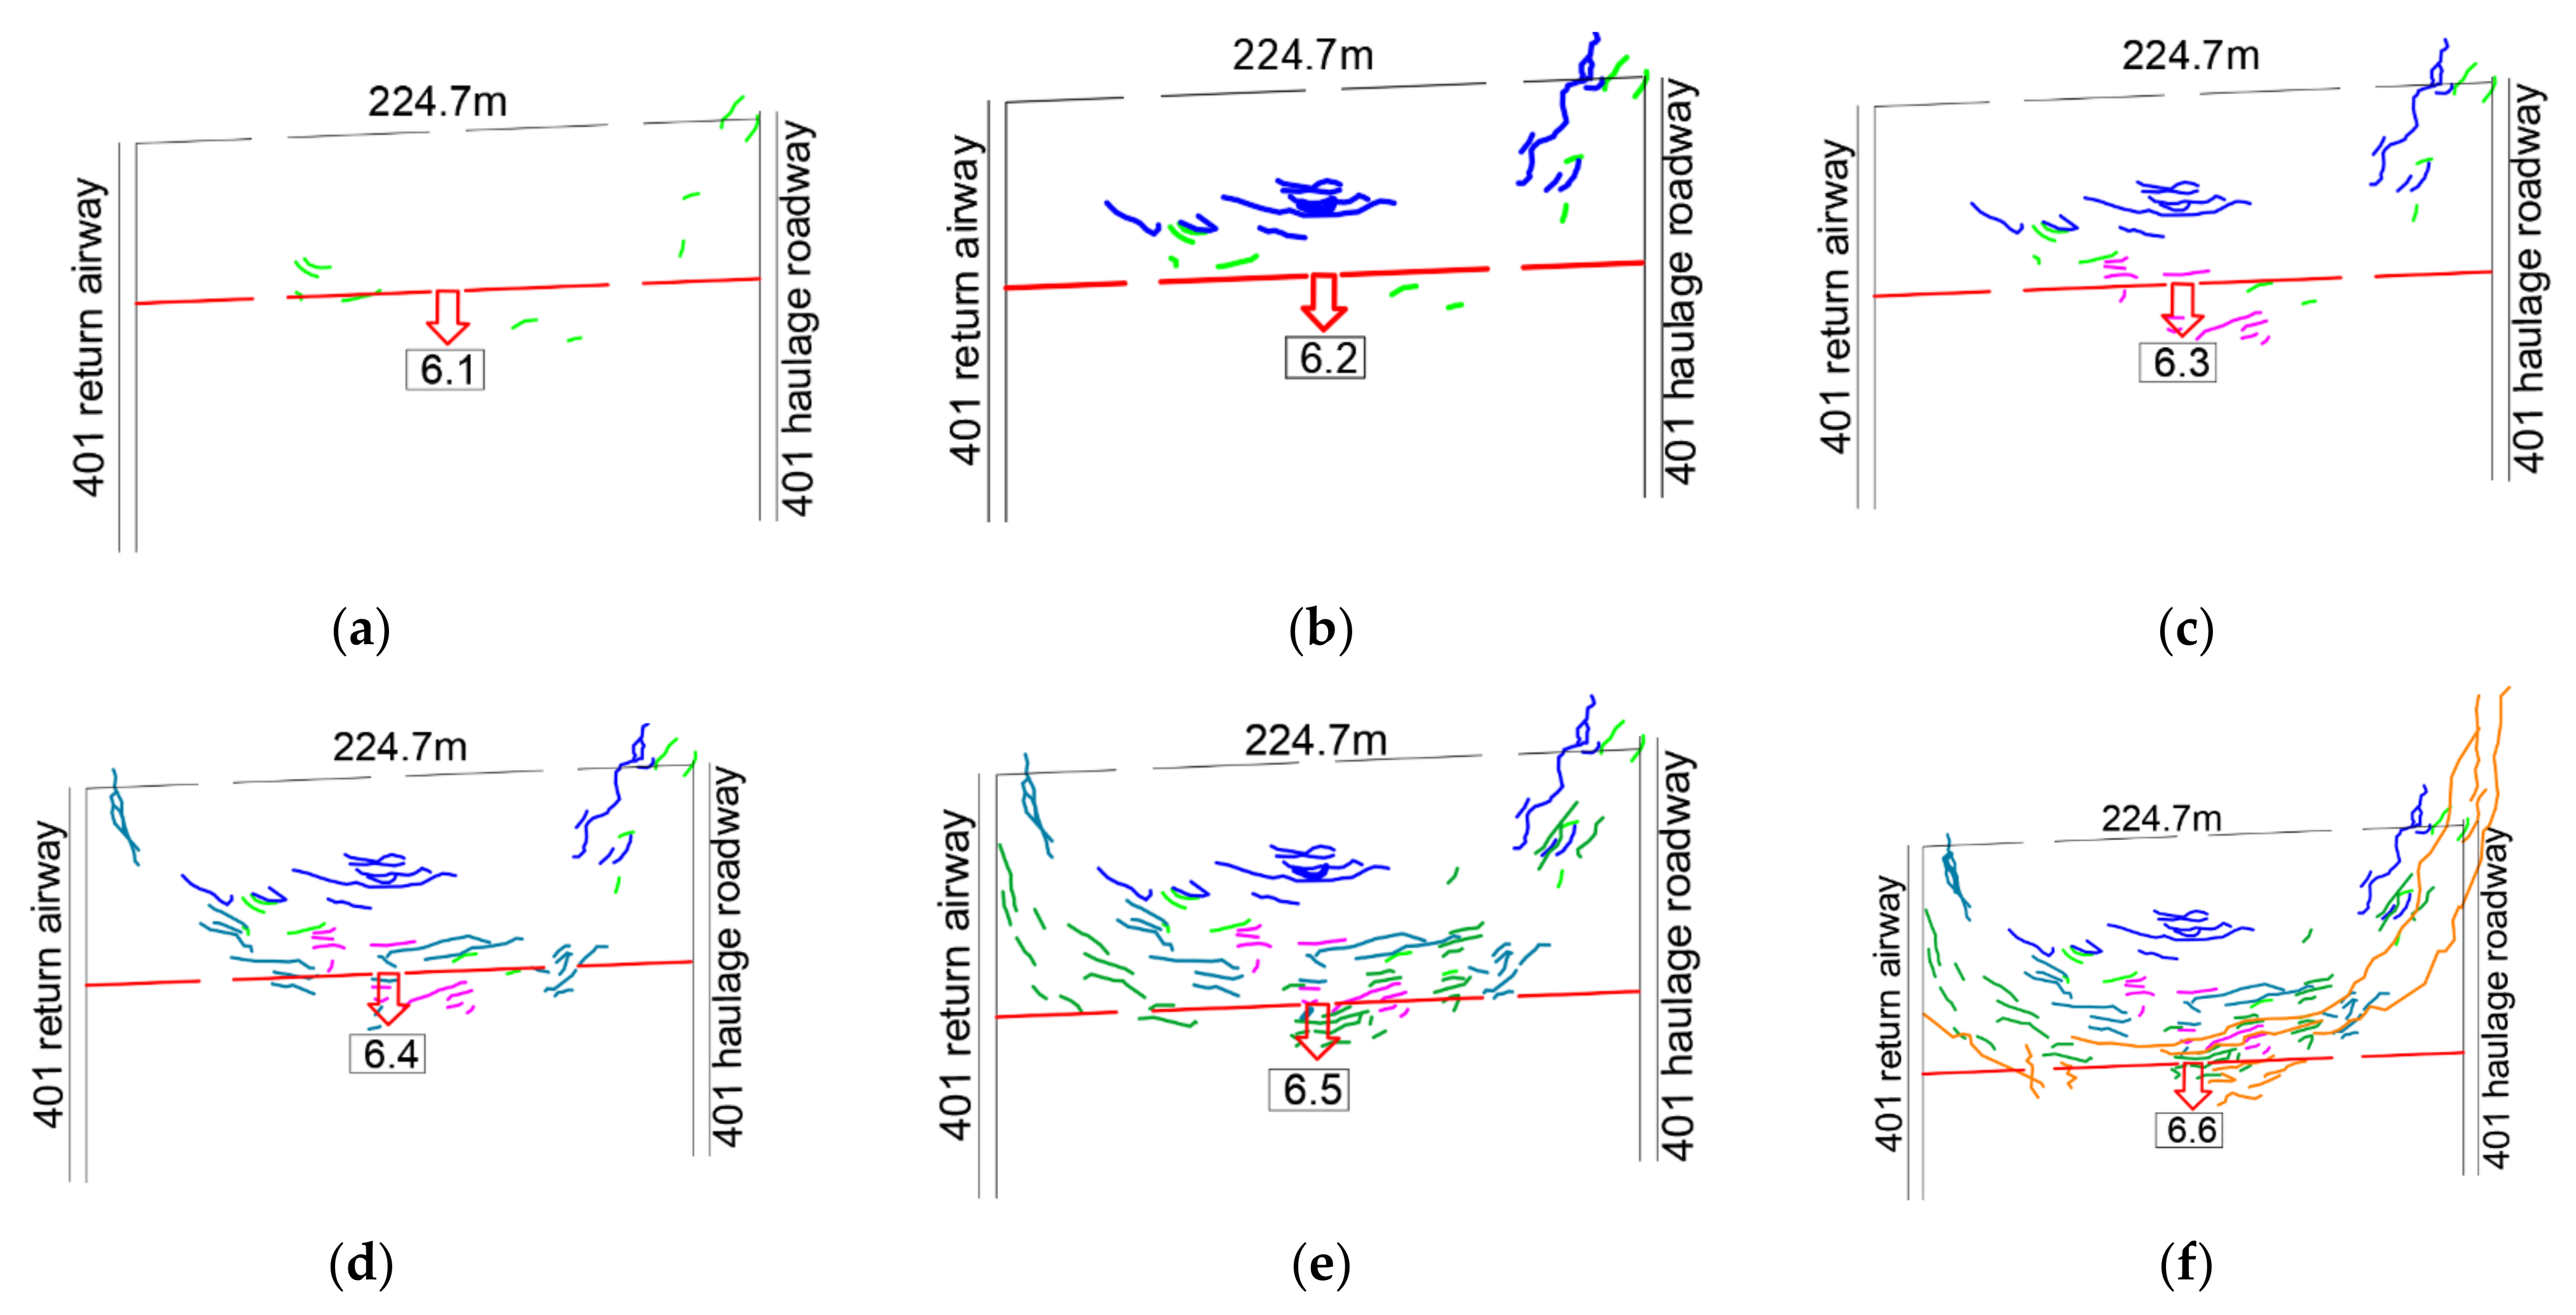
Based on the site situation of 401 working face of Shangwan mine in Shendong mining area, field data collection, collation and analysis of surface cracks caused by mining influence were carried out from 19 April 2018 to 3 August 2018, a total of 106 days. A total of 1878 (groups) cracks were collected. The crack development from 1 June 2018 to 7 June 2018 was selected to analyze the expansion pattern of surface cracks, as shown in Figure 14.
Figure 14 shows that with the advancement of the working face, the expansion pattern of surface cracks in the middle of the mining area is as follows: firstly, they protrude a distance in front of the working face and produce multiple tensile cracks. After that, with the advancement of the working face, the surface cracks develop in the direction of the mining area and the haulage roadway, then the surface deformation increases, and the original cracks will be connected to form large cracks. With the advancement of the working face, the expansion of surface cracks repeats the previous pattern, and the overall form of surface cracks in the mining area shows the arc-shaped distribution. We can find that the steel ruler and GNSS crack observation has significant advantages for the study of short-term and marginal fracture development patterns at the surface.

4.2. Deformation Results from the “Space-Sky-Ground” Collaborative Monitoring Framework

There are some limitations in relying on a single monitoring technique to obtain surface subsidence information, such as: (1) the limitation of InSAR loss of coherence cannot obtain the deformation information of the large deformation; (2) the difficulty of TLS moving stations to obtain the full range of surface subsidence basins; (3) the UAV equipped with thermal infrared camera cannot obtain the moving basin edge cracks, etc. Therefore, this section fused InSAR and TLS monitor data of surface subsidence basin. The feasibility of combining InSAR technology to identify large cracks of surface deformation is discussed by combining the cracks of easy access to InSAR data. The final shape of surface cracks near 1000 m of the location of opencut is obtained by combining the advantages of UAV, steel ruler and GNSS technology crack monitoring techniques.

4.2.1. Results of Continuous Surface Deformation

Based on the “space-sky-ground” monitoring framework, the input TLS and InSAR data are fused into a whole according to the correlation, forming an integrated dataset containing “space-sky-ground” multi-source measurement information; the coarse fused dataset is used as a benchmark, starting from the low-resolution and wide-range InSAR remote sensing image data. The coarse fused dataset is used as the benchmark, starting from the low-resolution and wide-range InSAR remote sensing data, and gradually correcting the accuracy with the higher resolution TLS data. The corrected data contains the characteristic information of each data and makes good use of the correlation between different data to achieve the effect of “space-sky-ground” integration and multisource data linkage, and finally obtains the surface subsidence cloud map of the whole mine area, as shown in Figure 15. The acquisition of the overall overview of the surface subsidence within the mine area provides basic data for the protection of the ecological restoration of the mine area.
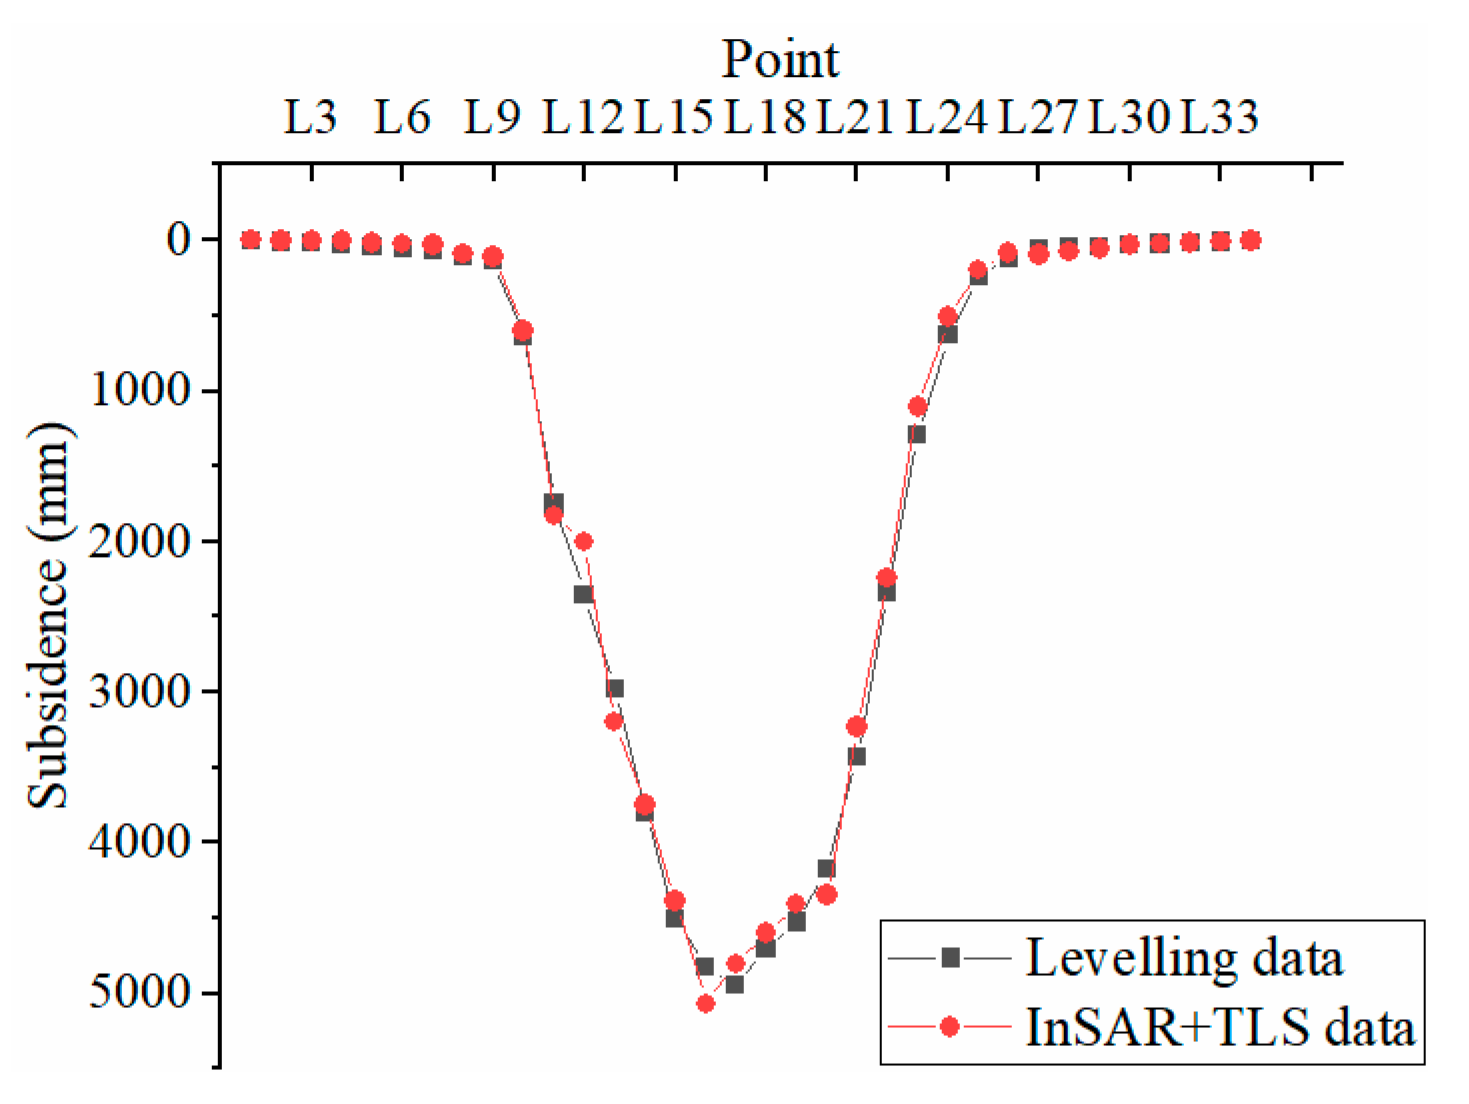
Figure 15 shows that: the average subsidence rate in the mining area of 401 working face is about 300 mm/a, which is higher than the subsidence in other locations in the mine area, and it is known from the regional measurement results that the surface subsidence of 401 working face is 2–4 m, and the subsidence in a small amount of area is more than 5 m. To further analyze the data accuracy of the fusion monitoring results, the maximum subsidence of the strike line and the strike line are compared with the tendency and the control points obtained from the level measurement in the same period, respectively. The results are shown in Table 7, and the L line of the profile was taken to compare the fused subsidence data with the levelling data, and the graphs are plotted in Figure 16.
Figure 16 and Table 7 compare the monitoring results of the two profiles of the fused data with the levelling data. The subsidence trends of the two fused profiles are consistent with the levelling subsidence trends, and the relative error of the difference between the maximum subsidence values is 2.5%. Therefore, it is feasible to obtain the surface subsidence basin in a large surface area through data fusion using two monitoring techniques, InSAR and TLS, in the framework of “space-sky-ground” cooperative monitoring.

4.2.2. Discontinuous Deformation Identification and Distribution

(1)
Surface discontinuous deformation identification
To investigate the characteristic relationship between surface mining cracks and InSAR deformation rate at the working face, the deformation gradient and surface mining cracks are analyzed. Among them, the surface deformation gradient is elaborated from three time periods, namely, early recovery period, active period and downhole stoppage. The surface deformation gradient can be expressed as Equation (13).
i = tan 1 Δ W Δ U
In Equation (13), Δ W is the vertical settlement of radar pixel points, Δ U is the horizontal movement of the corresponding point, The value range of i is 0–180.
Because SBAS-InSAR obtained the results with 20 m × 20 m resolution after multi-view processing, the deformation results were considered only from the distribution location of cracks, and the characteristics such as width of cracks and depth of subsurface development were ignored. In addition, to clarify the correlation between surface cracks and InSAR analysis results, only the InSAR deformation monitoring results of surface cracks with a width of 50 mm or more are considered.
Figure 17 shows that the surface cracks were damaged due to highly intensive underground mining activities, the overall shape of the cracks is approximately “circular” in distribution, and the “diameter” of the circle is larger than the width of the working face, but smaller than the influence range of the mining area. In other words, the fracture range is generally larger than the width of the working face, but it occurs within the surface deformation range, which indicates that the surface deformation affects the distribution of cracks.
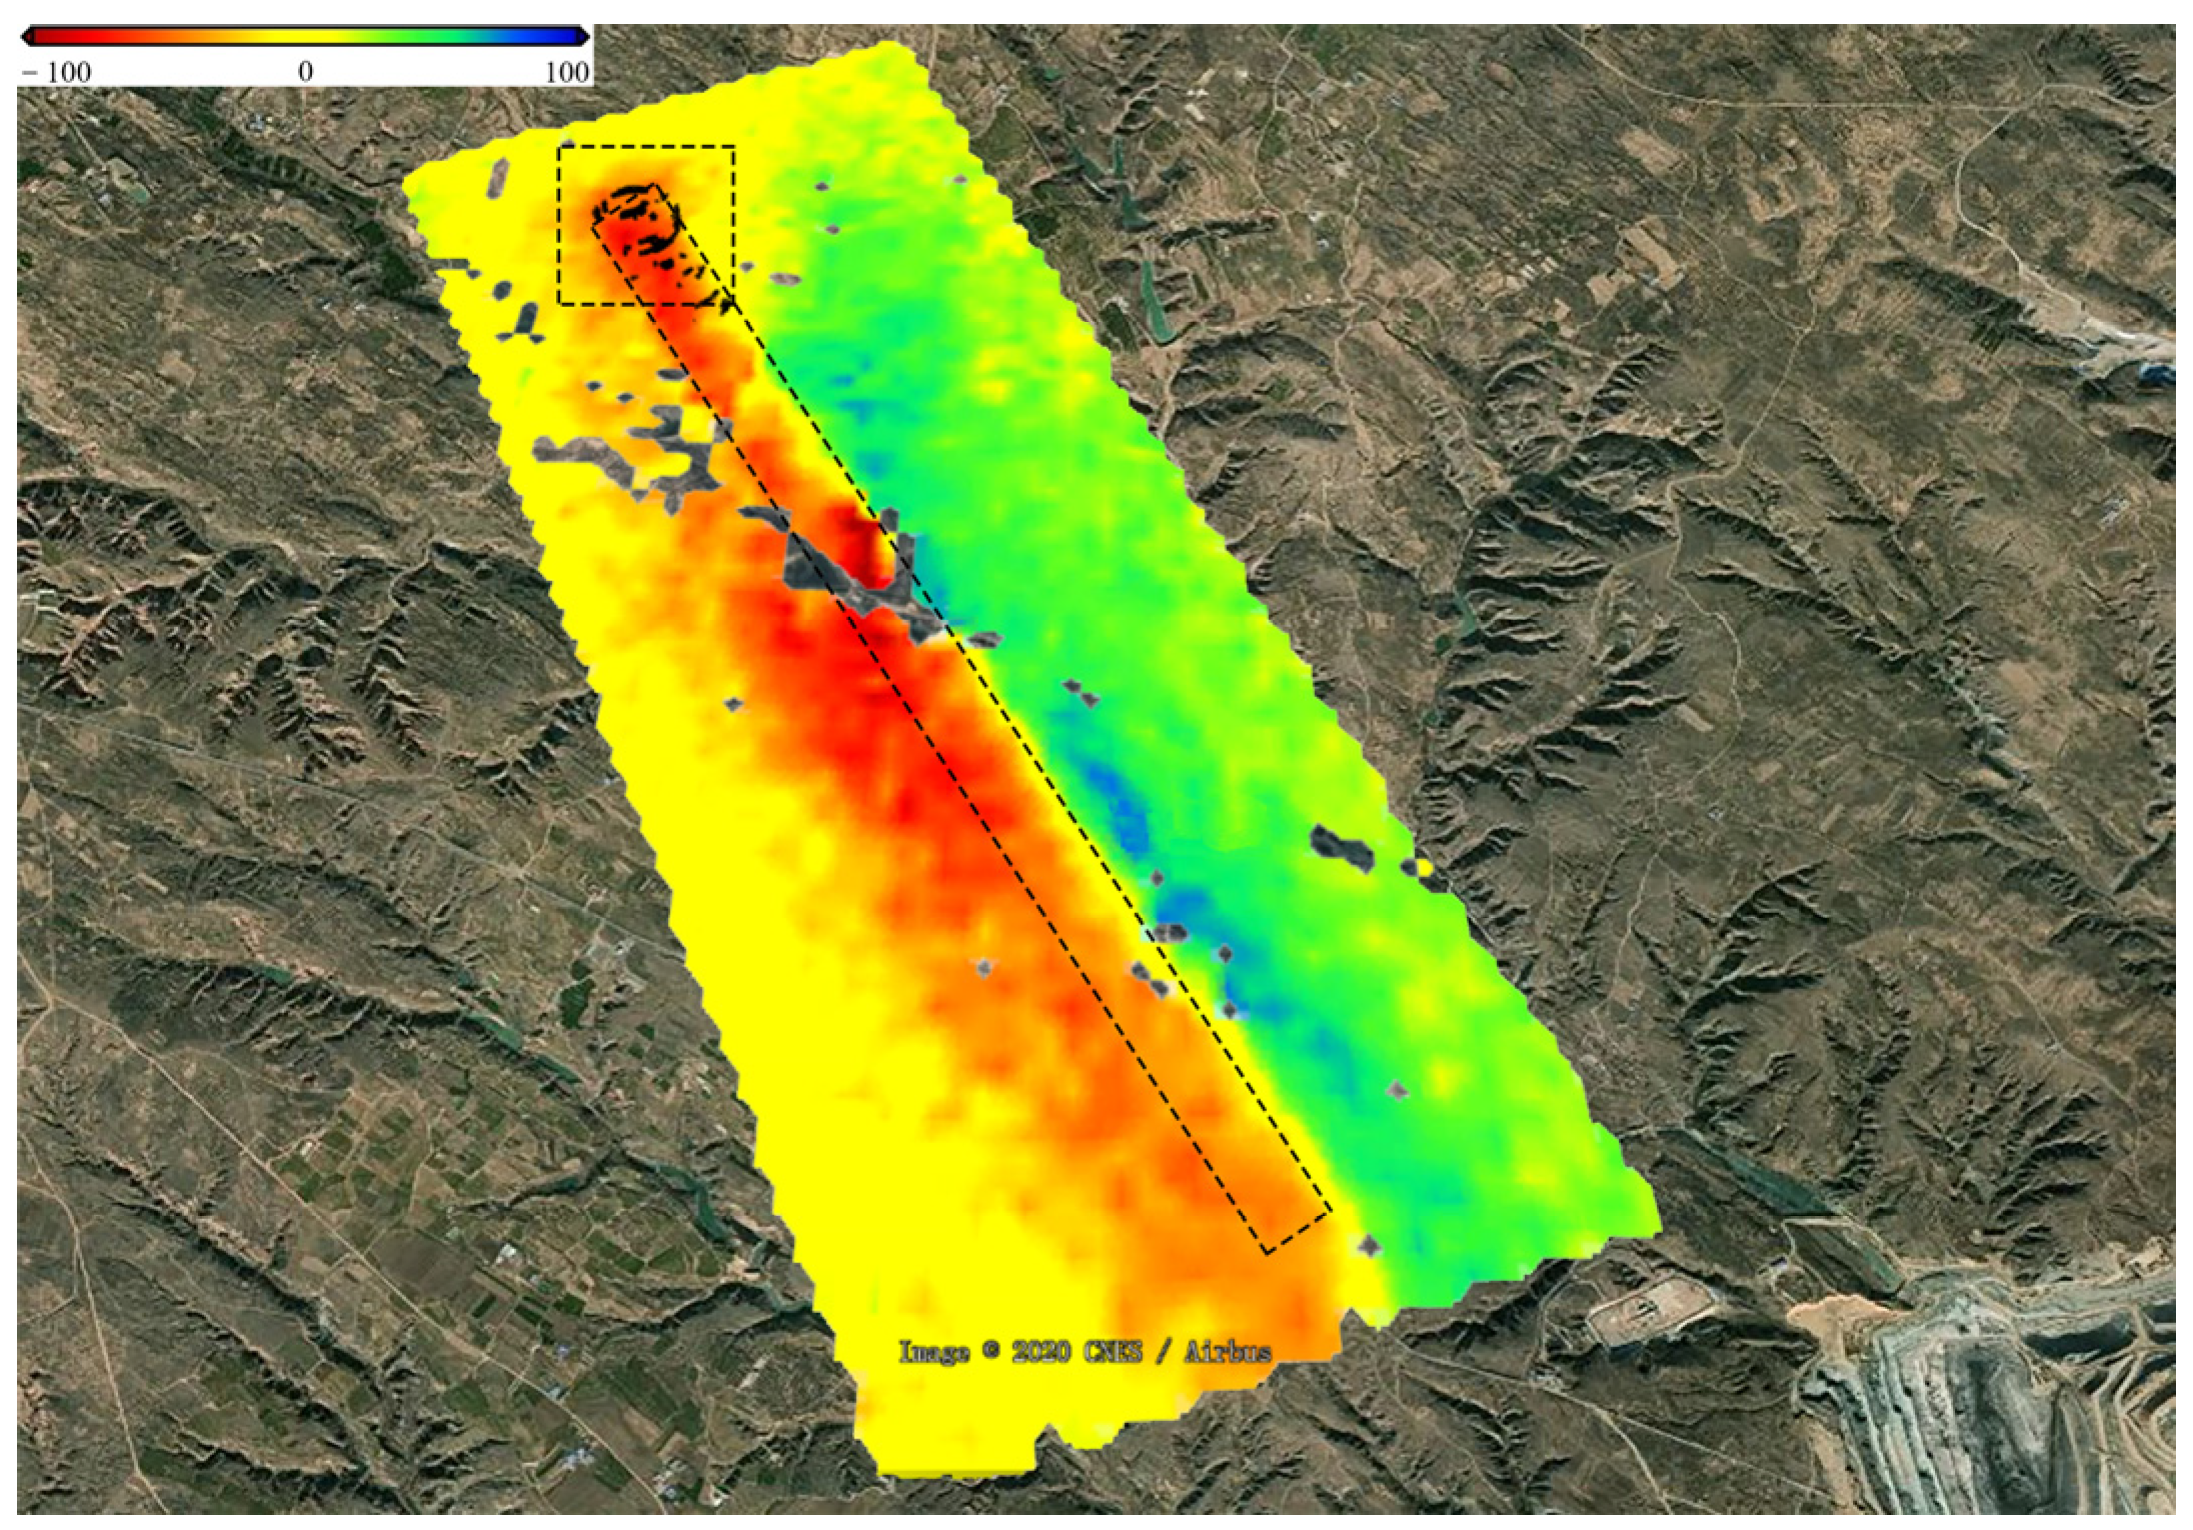
To further analyze the influence relationship between surface deformation rate and cracks, the schematic surface deformation gradient diagrams of different mining stages were selected in conjunction with the working face advancement time (from March 2018 to September 2019): among them, the schematic distribution of surface deformation gradient at the early stage of recovery (10 August 2018), the active period of recovery (18 February 2019), and the stopping stage (10 September 2019) are shown in Figure 18a–c respectively. Figure 18 shows that the area with larger surface deformation gradient gradually expands with the advancement of the mining face, and the gradient development direction is more consistent with the mining direction. The shape of the surface deformation gradient as a whole is “long”, and the surface cracks in the area of the open cut are mainly distributed in and around the location of the larger vertical deformation gradient and are ahead of the range of the large surface deformation gradient.
In general, detailed information on cracks is measured using steel rulers, and GNSS measures information on the location of cracks. All information on cracks being recorded in detail requires a lot of resources, and the repair of large cracks deserves more attention. The use of gradients to identify cracks proposed in this section provides a new way of thinking about the identification of large surface cracks and provides reference for the next step of surface crack filling.
(2)
Surface discontinuous deformation distribution
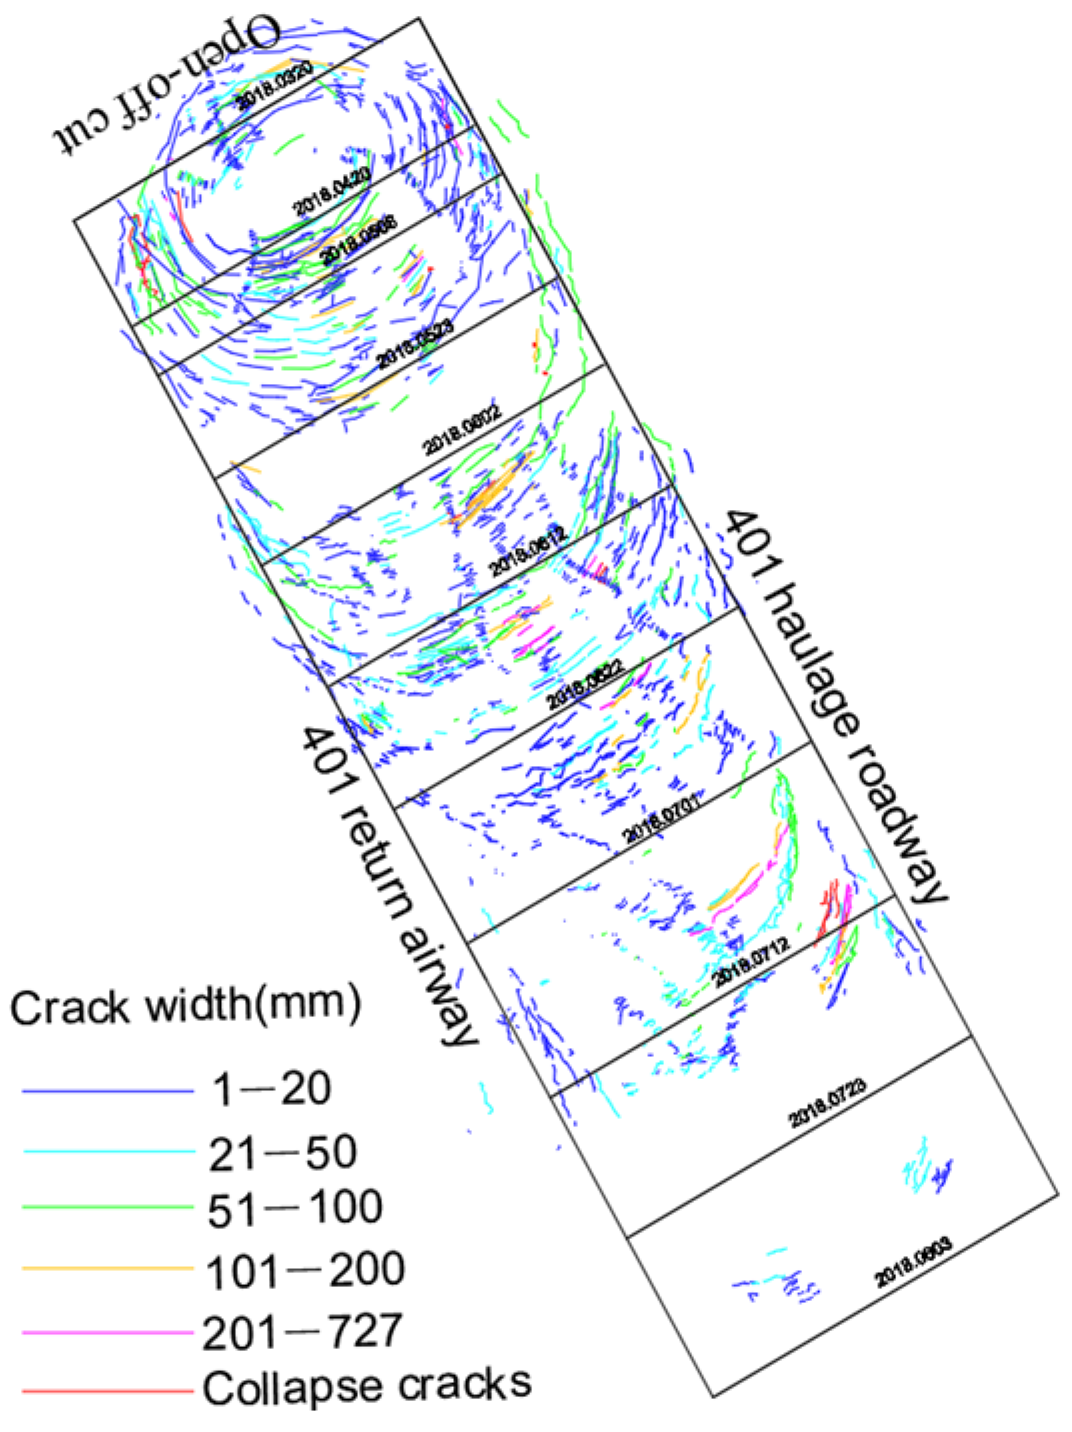
With the combination of the surface UAV thermal infrared crack measurement data and the measurement of key area with the assistance of GNSS and Steel ruler, the distribution of surface cracks in the working face was mapped and the width of the cracks was categorized by grade and indicated by different colors. The final mapping result is shown in Figure 19, which provides a reference for fully understanding the distribution of surface cracks with the mining situation of the working face.
The mining of shallow buried thick coal seams in western mines (working face 401 in this paper) is characterized by rapid advancement and large surface deformation. The development of surface fractures is a dynamic process, and it is important to obtain the true shape of surface cracks distribution in a timely and accurate manner. There are shortcomings in the monitoring results of single crack monitoring technology: the traditional field survey method of ground cracks has a high accuracy but is slow, long and costly, and it is a great challenge to comprehensively understand the development laws of cracks with the advancement of the working surface in a short period of time by using the traditional ground crack survey method; the use of UAV equipped with thermal infrared and visible light cameras to monitor cracks is limited by the edge recognition algorithm, small cracks and shallow buried cracks are not identified at the edge of the ground. Therefore, by combining traditional ground crack survey methods and UAV fracture monitoring technology, the final distribution law of surface cracks can be accurately obtained by applying UAV technology to monitor fractures in the center of the subsidence basin and at the inflection point, and applying traditional ground fracture survey methods to cracks at the edge of the subsidence basin, in response to the characteristics of shallow buried thick coal seam mining in western mining areas.

5. Discussion

Currently, surface subsidence monitoring in mining areas is based on only one or two technical techniques, and it is difficult to obtain the surface area deformation law in the subsidence affected area. In this paper, based on the characteristics of many kinds of surface subsidence monitoring objects and various monitoring techniques, we have proposed the “space-sky-ground” collaborative monitoring framework for surface subsidence monitoring in mining areas. And we constructed an AHP-TOPSIS preference model of “space-sky-ground” integrated collaborative monitoring of surface deformation in mining area and carried out engineering applications. The following are the issues that deserve further discussion in this paper.
(1)
Based on the characteristics of surface deformation in mining areas and existing surface deformation monitoring technologies, this paper established the “space-sky-ground” collaborative monitoring framework. This framework is an important guideline for the preference model of “space-sky-ground” collaborative monitoring and the integration of various technologies. The determination of the weighting of different programs in the monitoring program selection model needs to be combined with the “space-sky-ground” collaborative monitoring framework, so as to better utilize the advantages of each monitoring technology, for example, in Section 3.2 of this paper, the weighting process of the “spatial scale evolution law” is based on the “space-sky-ground” collaborative monitoring framework, and program 1 (GNSS and CORS, InSAR, TLS, UAV) is less weighted than the other schemes because of the lack of small-scale measurement techniques; the integration of multiple technologies needs to fully consider the time scale and spatial scale of each monitoring method in the “space-sky-ground” cooperative monitoring framework, so as to obtain the best data fusion results and comprehensively obtain the surface subsidence pattern.
The “space-sky-ground” collaborative monitoring framework includes space monitoring components, sky monitoring components and ground monitoring components, and the monitoring tools include existing monitoring technologies for surface movement and deformation. In addition, the monitoring framework is not limited to surface deformation monitoring in the mine area, but can be expanded to cover the entire mine area, which requires additional monitoring tools such as underground mineral pressure and underground overburden, as shown in Figure 20.
(2)
The AHP-TOPSIS model has many applications in other areas of program selection. In this paper, the AHP-TOPSIS model is chosen as the preferred model for the “space-sky-ground” collaborative monitoring framework. The purpose of this paper is to apply the AHP-TOPSIS model in the “space-sky-ground” collaborative monitoring framework to prefer a monitoring program. The preferred model directly determines the results of “space-sky-ground” collaborative monitoring framework and should be taken seriously. As the field of artificial intelligence continues to receive attention, artificial intelligence algorithms such as neural networks and support vector machines will significantly improve the rationality and accuracy of monitoring method selection.
(3)
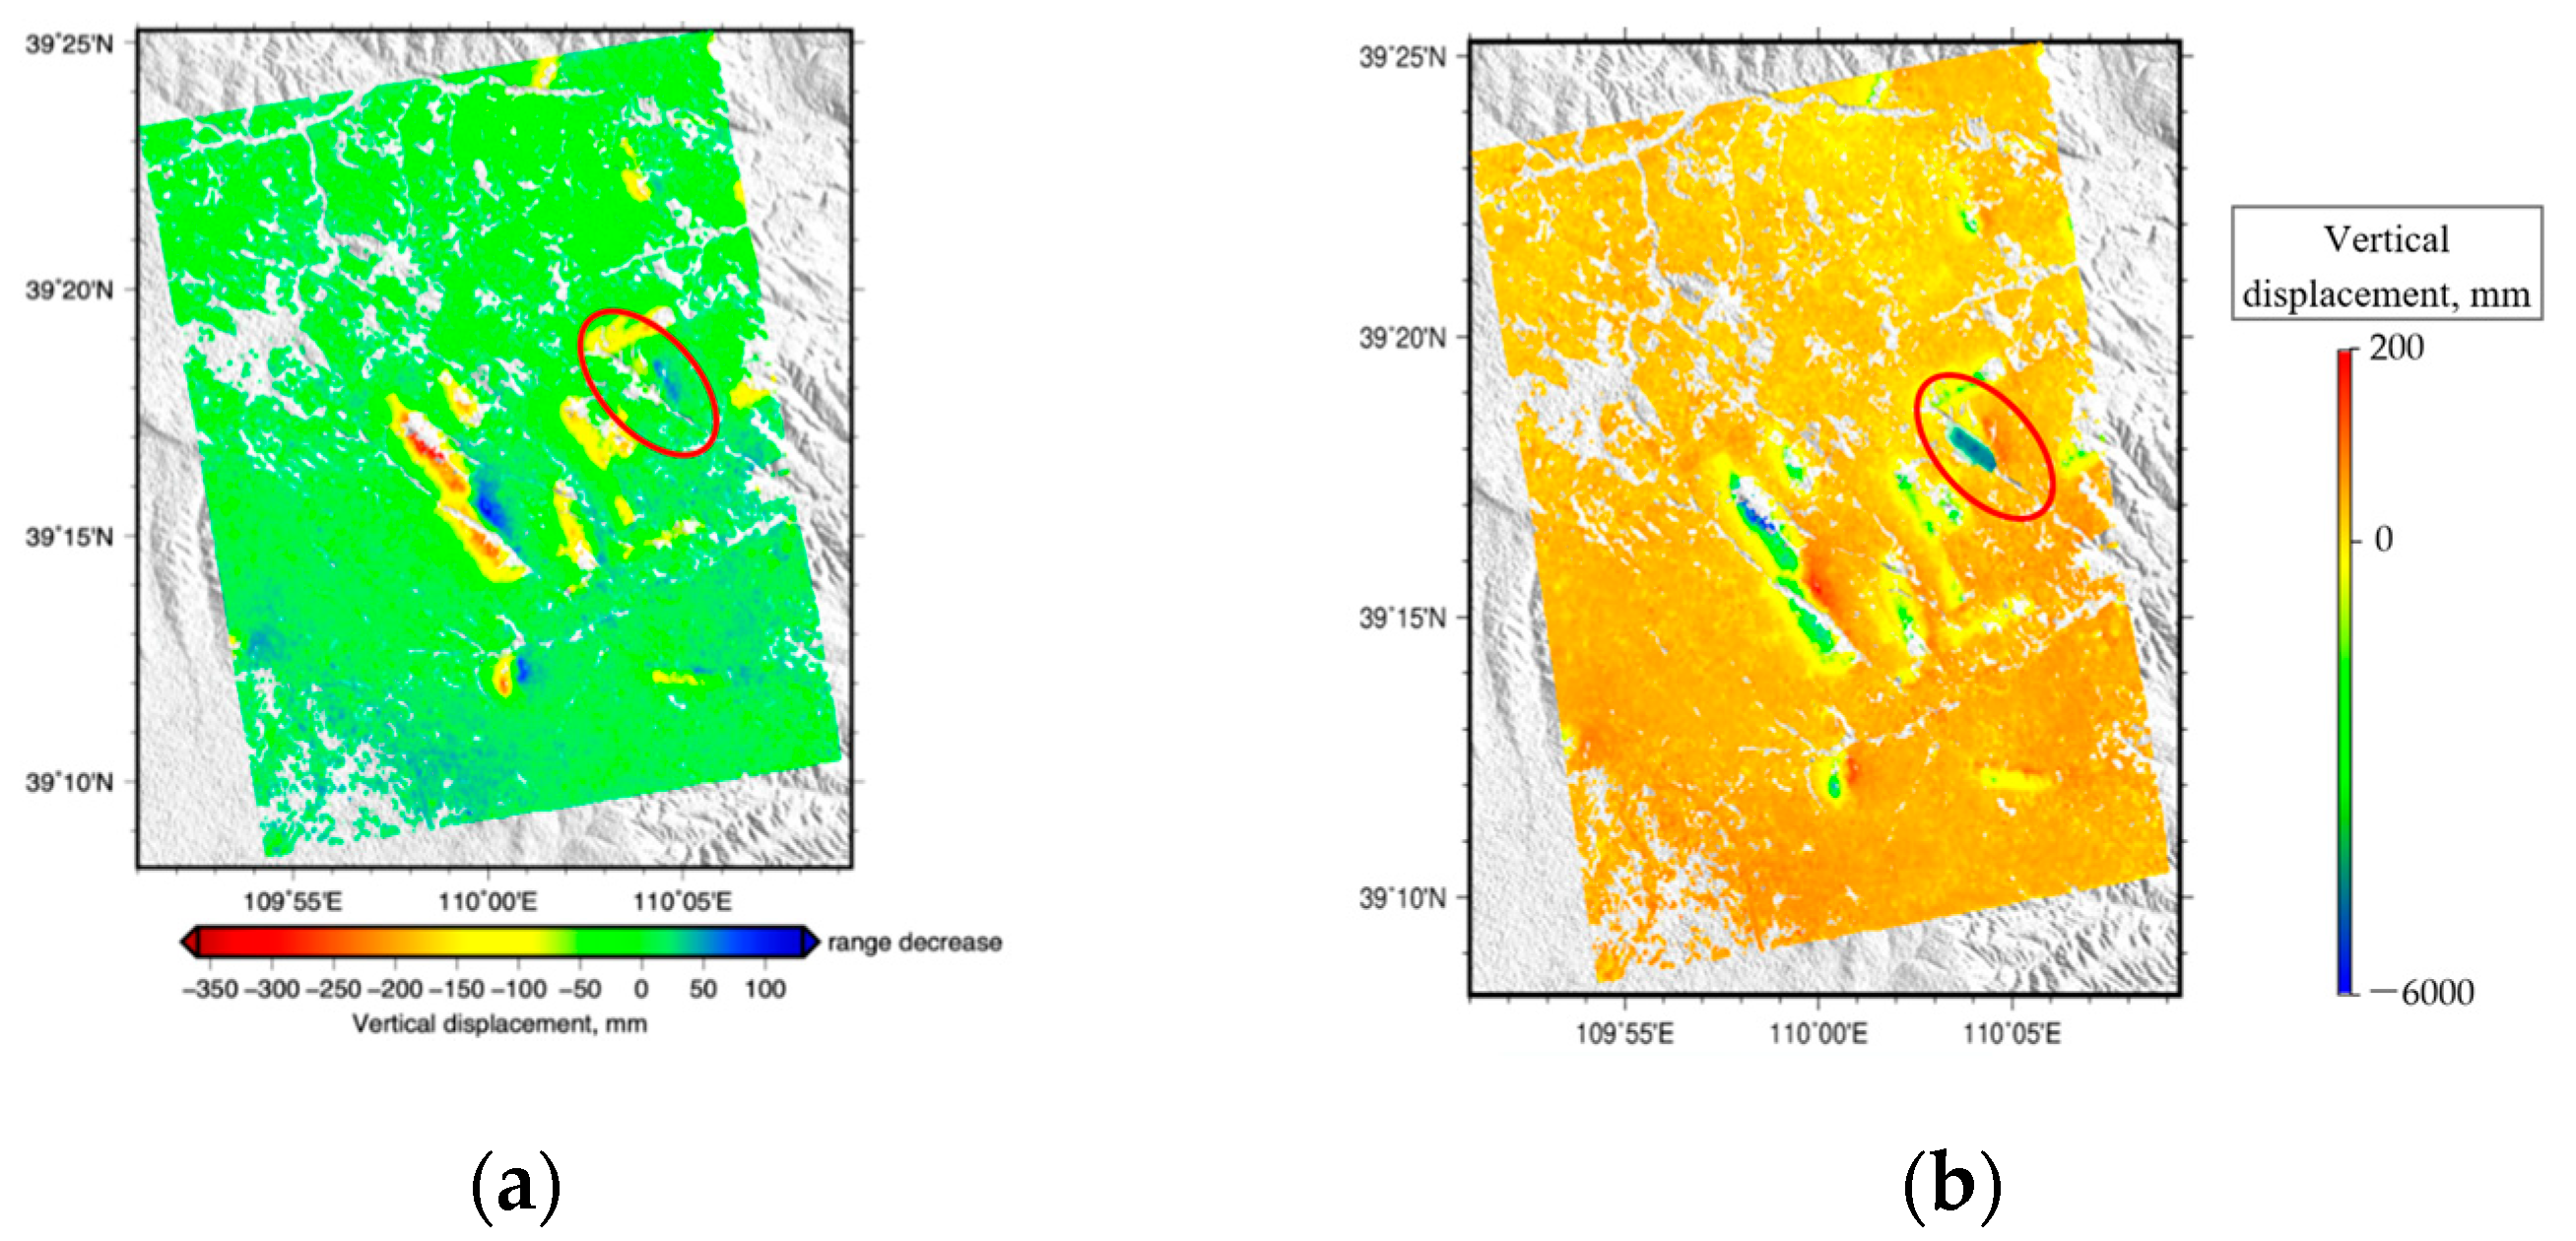
InSAR technology has the advantages of easy data acquisition and large monitoring period span, which can monitor long-period surface subsidence and be used to compare the difference of deformation patterns with the adjacent unmined areas, but InSAR is limited by decoherence and cannot monitor continuous large surface deformation in a short period of time (Figure 21a). TLS monitoring has the advantage of acquiring surface subsidence information with high accuracy, and the fusion of the two surface subsidence monitoring results can accurately obtain the large-scale surface subsidence laws (Figure 21b). Combining the fused monitoring results of InSAR and TLS provides a new way of thinking for the later analysis of the surface subsidence laws over a large area of the working face. The results provide a foundation for global planning to protect the ecological environment of the mining area and provide data for overburden damage control and ecological restoration in the area, which cannot be achieved by using a single TLS or InSAR monitoring technique.
(4)
Combining InSAR monitoring technology with the advantages of easy data acquisition and large observation time range, InSAR is used to calculate the surface deformation gradient, analyzing the location of surface cracks generated in the mine area. This technique provides a new idea for other working faces to use InSAR technology to identify the location of surface cracks in subsidence areas and provides a reference for the filling of surface cracks and the restoration of surface ecology. Figure 22 shows the process of manual treatment of the cracks identified by InSAR.
(5)
By combining traditional ground crack survey methods and UAV crack monitoring technology, the final distribution law of surface cracks can be accurately obtained by applying UAV technology to monitor cracks in the center of the subsidence basin and at the inflection point and applying traditional ground fracture survey methods to cracks at the edge of the subsidence basin, in response to the characteristics of shallow buried thick coal seam mining in western mining areas. The “space-sky-ground” collaborative monitoring framework gives full play to the advantages of the emerging technology, making it possible to comprehensively understand the development law of cracks and laying the foundation for the analysis and management of cracks in large areas of coal mine subsidence areas.

6. Conclusions

This paper establishes the “space-sky-ground” collaborative monitoring framework for surface subsidence in mining area and sets up a surface monitoring method preference model based on AHP-TOPSIS. The engineering application results show that based on the “space-sky-ground” collaborative monitoring framework proposed in this paper, the preferred monitoring program suitable for this mine area can be selected by using the surface monitoring program preference model. The practical application was carried out at 401 working face of Shendong mine area, and the distribution pattern of discontinuous deformation and large-scale surface deformation results in this mine area were obtained, the discontinuous large deformation was identified. The obtained results provide data to support the crack management in this mine area. The research work of this paper can provide reference for the acquisition of basic data of surface ecological restoration in similar mines. The results of this paper are only an experiment of the “space-sky-ground” collaborative monitoring framework, the framework can be appropriately adjusted according to the needs of the actual application and analysis. The “space-sky-ground” collaborative monitoring framework established increases the possibility of a comprehensive understanding of surface subsidence laws in mining areas. With the accumulation of field experience and the continuous efforts of researchers, the performance of “space-sky-ground” collaborative monitoring framework will be better and this method will be used more frequently in the monitoring of surface subsidence in mining area. The significant innovations and conclusions of this paper are as follows.
(1)
Based on the characteristics of surface deformation in mining areas and existing monitoring technologies, this paper established the “space-sky-ground” collaboration monitoring framework in mining areas. The monitoring framework consists of three parts: space monitoring component, sky monitoring component and ground monitoring component, moreover, it basically includes the existing surface monitoring technologies, and new monitoring technologies can be added to the framework in the future according to their own characteristics. The framework of this paper is an important guide to the analysis of the influencing factors of the “space-sky-ground” collaborative monitoring preference program, the establishment of the preference model and the implementation steps of the preference model. At the same time, the proposed framework presents new thinking to recognize the multi-temporal and multi-scale surface subsidence patterns in mining areas.
(2)
Determine the influencing factors affecting the surface preference monitoring program, a total of 3 primary indicators and 16 secondary indicators, the primary indicators include: natural factors, target constraints and site needs. The importance of the 16 secondary indicators was analyzed using AHP. Meanwhile, combining the advantages of AHP-TOPSIS preference model, the AHP-TOPSIS preference model was constructed based the “space-sky-ground” collaborative monitoring framework, and four steps of monitoring scheme preference based on AHP-TOPSIS model were proposed. The practical application was carried out in the surface monitoring program preference of 401 working face in Shendong mine.
(3)
Based on the preferred monitoring program under the “space-sky-ground” collaborative monitoring framework at the 401 working face of the Shendong mine, the information on the distribution of discontinuous deformation and the results of continuous deformation of large surface area in the whole area of the mine were obtained, and the discontinuous large deformation was identified. The results obtained provide a data support for the crack management in the mine area, and provide an example for the further extension of the “space-sky-ground” collaborative monitoring results proposed in this paper. The “space-sky-ground” collaborative monitoring framework established in this paper helps scholars to understand the surface subsidence pattern in mining areas at multiple scales and provide a technical and data support for surface ecological restoration.

Author Contributions

Conceptualization, Y.Y. and H.D.; methodology, Y.Y.; software, W.T.; validation, Y.Y.; formal analysis L.D.; investigation, J.G.; resources, Y.Y. and W.T.; writing—original draft preparation, M.L.; writing—review and editing, L.D. and H.D.; supervision, H.D.; funding acquisition, Y.Y. and H.D. All authors have read and agreed to the published version of the manuscript.

Funding

This research was funded by the Open Fund of State Key Laboratory of Water Resource Protection and Utilization in Coal Mining (Grants nos. WPUKFJJ2019-17 and GJNY-20-113-20), the Fundamental Research Funds for the Central Universities (2021YQDC09), National Natural Science Foundation of China (grant numbers 51574242 and 51404272).

Institutional Review Board Statement

Informed consent was obtained from all subjects involved in the study.

Informed Consent Statement

Informed consent was obtained from all subjects involved in the study.

Data Availability Statement

The data used to support the findings of this study are available from the corresponding author upon request.

Acknowledgments

The authors thank ASI for providing the COSMO-SkyMed data and ESA for providing the Sentinel-1 data.

Conflicts of Interest

The authors declare no conflict of interest.

References

  1. Chen, Y.; Tao, Q.; Liu, G.; Wang, L.; Wang, F.; Wang, K. Detailed mining subsidence monitoring combined with InSAR and probability integral method. Chin. J. Geophys. 2021, 64, 3554–3566. [Google Scholar] [CrossRef]
  2. Dai, H.; Guo, J.; Yi, S.; Wang, G.; Liu, A.; Kong, B.; Zou, B. The mechanism of strata and surface movements induced by extra-thick steeply inclined coal seam applied horizontal slice mining. J. China Coal Soc. 2013, 38, 1109–1115. [Google Scholar] [CrossRef]
  3. Dai, H. Mining subsidence variables and their time-space relationship description. J. China Coal Soc. 2018, 43, 450–459. [Google Scholar] [CrossRef]
  4. Alam, M.S.; Kumar, D.; Chatterjee, R.S. Improving the capability of integrated DInSAR and PSI approach for better detection, monitoring, and analysis of land surface deformation in underground mining environment. Geocarto Int. 2021, 2021, 1864028. [Google Scholar] [CrossRef]
  5. Minami, M.; Morikawa, H.; Aoyama, T.; Mizumachi, M. An adaptive multipath estimation/elimination technique for GPS signals reception. Electron. Commun. Jpn. 2003, 86, 74–82. [Google Scholar] [CrossRef]
  6. Patel, P.R.; Kulkarni, M.N. Preliminary Results of GPS Studies for Monitoring Land Subsidence Over the Shallow Gas Reservoir in India. Surv. Rev. 2013, 40, 356–365. [Google Scholar] [CrossRef]
  7. Zhao, H.; Ma, F.; Zhang, Y.; Gue, J. Monitoring and Assessment of Ming Subsidence in a Metal Mine in China. Environ. Eng. Manag. J. 2014, 13, 3015–3024. [Google Scholar] [CrossRef]
  8. Hung, W.; Hwang, C.; Chang, C.; Yen, J.; Liu, C.; Yang, W. Monitoring severe aquifer-system compaction and land subsidence in Taiwan using multiple sensors: Yunlin, the southern Choushui River Alluvial Fan. Environ. Earth Sci. 2009, 59, 1535–1548. [Google Scholar] [CrossRef]
  9. Kim, D.; Lee, H.; Okeowo, M.A.; Basnayake, S.; Jayasinghe, S. Cost-effective monitoring of land subsidence in developing countries using semipermanent GPS stations: A test study over Houston, Texas. J. Appl. Remote Sens. 2017, 11, 026033. [Google Scholar] [CrossRef]
  10. Ao, J.; Wu, K.; Wang, Y.; Li, L. Subsidence Monitoring Using Lidar and Morton Code Indexing. J. Surv. Eng. 2016, 142, 06015002. [Google Scholar] [CrossRef]
  11. Chen, S.; Wang, C.; Dai, H.; Zhang, H.; Pan, F.; Xi, X.; Yan, Y.; Wang, P.; Yang, X.; Zhu, X.; et al. Power Pylon Reconstruction Based on Abstract Template Structures Using Airborne LiDAR Data. Remote Sens. 2019, 11, 1579. [Google Scholar] [CrossRef] [Green Version]
  12. Jones, L.; Hobbs, P. The Application of Terrestrial LiDAR for Geohazard Mapping, Monitoring and Modelling in the British Geological Survey. Remote Sens. 2021, 13, 395. [Google Scholar] [CrossRef]
  13. Tiwari, A.; Narayan, A.B.; Dwivedi, R.; Dikshit, O.; Nagarajan, B. Monitoring of landslide activity at the Sirobagarh landslide, Uttarakhand, India, using LiDAR, SAR interferometry and geodetic surveys. Geocarto Int. 2018, 35, 535–558. [Google Scholar] [CrossRef]
  14. Dawei, Z.; Lizhuang, Q.; Demin, Z.; Baohui, Z.; Lianglin, G. Unmanned Aerial Vehicle (UAV) Photogrammetry Technology for Dynamic Mining Subsidence Monitoring and Parameter Inversion: A Case Study in China. IEEE Access 2020, 8, 16372–16386. [Google Scholar] [CrossRef]
  15. Ignjatović Stupar, D.; Rošer, J.; Vulić, M. Investigation of Unmanned Aerial Vehicles-Based Photogrammetry for Large Mine Subsidence Monitoring. Minerals 2020, 10, 196. [Google Scholar] [CrossRef] [Green Version]
  16. Mateos, R.M.; Azañón, J.M.; Roldán, F.J.; Notti, D.; Pérez-Peña, V.; Galve, J.P.; Pérez-García, J.L.; Colomo, C.M.; Gómez-López, J.M.; Montserrat, O.; et al. The combined use of PSInSAR and UAV photogrammetry techniques for the analysis of the kinematics of a coastal landslide affecting an urban area (SE Spain). Landslides 2016, 14, 743–754. [Google Scholar] [CrossRef]
  17. Park, S.; Choi, Y. Applications of Unmanned Aerial Vehicles in Mining from Exploration to Reclamation: A Review. Minerals 2020, 10, 663. [Google Scholar] [CrossRef]
  18. Rauhala, A.; Tuomela, A.; Davids, C.; Rossi, P. UAV Remote Sensing Surveillance of a Mine Tailings Impoundment in Sub-Arctic Conditions. Remote Sens. 2017, 9, 1318. [Google Scholar] [CrossRef] [Green Version]
  19. Vlastelica, G.; Matoš, B.; Pikelj, K.; Lužar-Oberiter, B.; Kordić, B. Integration of Terrestrial Laser Scanning and UAS Photogrammetry in Geological Studies: Examples from Croatia. Period. Polytech. Civ. Eng. 2019, 63, 989–1003. [Google Scholar] [CrossRef] [Green Version]
  20. Yao, H.; Qin, R.; Chen, X. Unmanned Aerial Vehicle for Remote Sensing Applications—A Review. Remote Sens. 2019, 11, 1443. [Google Scholar] [CrossRef] [Green Version]
  21. Chen, J.; Zhou, Y.; Chen, G.; Hao, M. Decades of Ground Deformation in the Weihe Graben, Shaanxi Province, China, in Response to Various Land Processes, Observed by Radar Interferometry and Levelling. Remote Sens. 2021, 13, 2374. [Google Scholar] [CrossRef]
  22. Chen, Y.; Tong, Y.; Tan, K. Coal mining deformation monitoring using SBAS-InSAR and offset tracking: A case study of Yu County China. IEEE J. Sel. Top. Appl. Earth Obs. Remote Sens. 2020, 13, 10. [Google Scholar] [CrossRef]
  23. Diao, X.; Wu, K.; Zhou, D.; Li, L. Integrating the probability integral method for subsidence prediction and differential synthetic aperture radar interferometry for monitoring mining subsidence in Fengfeng, China. J. Appl. Remote Sens. 2016, 10, 016028. [Google Scholar] [CrossRef]
  24. Furst, S.L.; Doucet, S.; Vernant, P.; Champollion, C.; Carme, J.L. Monitoring surface deformation of deep salt mining in Vauvert (France), combining InSAR and leveling data for multi-source inversion. Solid Earth 2021, 12, 15–34. [Google Scholar] [CrossRef]
  25. He, Q.; Zhang, Y.; Wu, H.; Luo, Y. Mining Subsidence Monitoring with Modified Time-Series SAR Interferometry Method Based on the Multi-Level Processing Strategy. IEEE Access 2021, 9, 106039–106048. [Google Scholar] [CrossRef]
  26. Liu, X.; Huang, J. An Improved Multi-Platform Stacked D-InSAR Method for Monitoring the Three-Dimensional Deformation of the Mining Area. IEEE Access 2021, 9, 66878–66890. [Google Scholar] [CrossRef]
  27. Ng, A.H.-M.; Ge, L.; Li, X.-j. Assessments of land subsidence in the Gippsland Basin of Australia using ALOS PALSAR data. Remote Sens. Environ. 2015, 159, 15. [Google Scholar] [CrossRef]
  28. Yang, Z.; Li, Z.; Zhu, J.; Yi, H.; Hu, J.; Feng, G. Deriving Dynamic Subsidence of Coal Mining Areas Using InSAR and Logistic Model. Remote Sens. 2017, 9, 125. [Google Scholar] [CrossRef] [Green Version]
  29. Dwornik, M.; Bała, J.; Franczyk, A. Application of a New Semi-Automatic Algorithm for the Detection of Subsidence Areas in SAR Images on the Example of the Upper Silesian Coal Basin. Energies 2021, 14, 3051. [Google Scholar] [CrossRef]
  30. Fan, H.D.; Cheng, D.; Deng, K.Z.; Chen, B.Q.; Zhu, C.G. Subsidence monitoring using D-InSAR and probability integral prediction modelling in deep mining areas. Surv. Rev. 2015, 47, 438–445. [Google Scholar] [CrossRef]
  31. Jiang, C.; Wang, L.; Yu, X. Retrieving 3D Large Gradient Deformation Induced to Mining Subsidence Based on Fusion of Boltzmann Prediction Model and Single-Track InSAR Earth Observation Technology. IEEE Access 2021, 9, 87156–87172. [Google Scholar] [CrossRef]
  32. Li, T.; Zhang, H.; Fan, H.; Zheng, C.; Liu, J. Position Inversion of Goafs in Deep Coal Seams Based on DS-InSAR Data and the Probability Integral Methods. Remote Sens. 2021, 13, 2898. [Google Scholar] [CrossRef]
  33. Balt, K.; Goosen, R.L. MSAHP: An approach to mining method selection. J. South. Afr. Inst. Min. Metall. 2020, 120, 451–460. [Google Scholar] [CrossRef]
  34. Reich, J.; Kinra, A.; Kotzab, H.; Brusset, X. Strategic global supply chain network design how decision analysis combining MILP and AHP on a Pareto front can improve decision making. Int. J. Prod. Res. 2021, 59, 1557–1572. [Google Scholar] [CrossRef]
  35. Satty, T.L. How to make a decision: The analytic hierarchy process. Interfaces 1994, 24, 19–43. [Google Scholar] [CrossRef] [Green Version]
  36. Chen, C. Extensions of the TOPSIS for group decision-making under fuzzy environment. Fuzzy Set. Syst. 2000, 114, 1–9. [Google Scholar] [CrossRef]
  37. Gul, M.; Celik, E.; Aydin, N.; Taskin Gumus, A.; Guneri, A.F. A state of the art literature review of VIKOR and its fuzzy extensions on applications. Appl. Soft Comput. 2016, 46, 60–89. [Google Scholar] [CrossRef]
  38. Onut, S.; Soner, S. Transshipment site selection using the AHP and TOPSIS approaches under fuzzy environment. Waste Manag. 2007, 28, 1552–1559. [Google Scholar] [CrossRef]
  39. Pazand, K.; Hezarkhani, A. Porphyry Cu potential area selection using the combine AHP-TOPSIS methods: A case study in Siahrud area (NW, Iran). Earth Sci. Inform. 2015, 8, 207–220. [Google Scholar] [CrossRef]
  40. Hanine, M.; Boutkhoum, O.; Tikniouine, A.; Agouti, T. An Application of OLAP/GIS-Fuzzy AHP-TOPSIS Methodology for Decision Making: Location Selection for Landfill of Industrial Wastes as a Case Study. KSCE J. Civ. Eng. 2016, 21, 2074–2084. [Google Scholar] [CrossRef]
  41. Mishra, P.K.; Nadda, R.; Kumar, R.; Rana, A.; Sethi, M.; Ekileski, A. Optimization of multiple arcs protrusion obstacle parameters using AHP-TOPSIS approach in an impingement jet solar air passage. Heat Mass Transf. 2018, 54, 3797–3808. [Google Scholar] [CrossRef]
  42. Yu, J.; Wang, L.; Gong, X. Study on the Status Evaluation of Urban Road Intersections Traffic Congestion Base on AHP-TOPSIS Modal. Procedia Soc. Behav. Sci. 2013, 96, 609–616. [Google Scholar] [CrossRef] [Green Version]
  43. Zhuang, Z.-Y.; Lin, C.-C.; Chen, C.-Y.; Su, C.-R. Rank-Based Comparative Research Flow Benchmarking the Effectiveness of AHP–GTMA on Aiding Decisions of Shredder Selection by Reference to AHP–TOPSIS. Appl. Sci. 2018, 8, 1974. [Google Scholar] [CrossRef] [Green Version]
  44. Brady, B.H.G.; Brown, E.T. Rock Mechanics for Underground Mining; George Allen &Unwin: London, UK, 1985. [Google Scholar]
  45. Yin, D.; Chen, S.; Li, B.; Guo, W. Bed separation backfill to reduce surface cracking due to mining under thick and hard conglomerate: A case study. R. Soc. Open Sci. 2019, 6, 190880. [Google Scholar] [CrossRef] [PubMed] [Green Version]
  46. Zuo, J.; Yu, M.; Li, C.; Sun, Y.; Hu, S.; Li, Z. Analysis of Surface Cracking and Fracture Behavior of a Single Thick Main Roof Based on Similar Model Experiments in Western Coal Mine, China. Nat. Resour. Res. 2021, 30, 657–680. [Google Scholar] [CrossRef]
  47. Wang, G.; Wu, Q.; Li, P.; Cui, X.; Gong, Y.; Zhang, J.; Tang, W. Mining Subsidence Prediction Parameter Inversion by Combining GNSS and DInSAR Deformation Measurements. IEEE Access 2021, 9, 89043–89054. [Google Scholar] [CrossRef]
  48. Lian, X.; Li, Z.; Yuan, H.; Hu, H.; Cai, Y.; Liu, X. Determination of the Stability of High-Steep Slopes by Global Navigation Satellite System (GNSS) Real-Time Monitoring in Long Wall Mining. Appl. Sci. 2020, 10, 1952. [Google Scholar] [CrossRef] [Green Version]
  49. Tao, T.; Liu, J.; Qu, X.; Gao, F. Real-time monitoring rapid ground subsidence using GNSS and Vondrak filter. Acta Geophys. 2018, 67, 133–140. [Google Scholar] [CrossRef]
  50. Yao, J.; Yao, X.; Wu, Z.; Liu, X.; Diraco, G. Research on Surface Deformation of Ordos Coal Mining Area by Integrating Multitemporal D-InSAR and Offset Tracking Technology. J. Sens. 2021, 2021, 660922. [Google Scholar] [CrossRef]
  51. Pawluszek-Filipiak, K.; Borkowski, A. Integration of DInSAR and SBAS Techniques to Determine Mining-Related Deformations Using Sentinel-1 Data: The Case Study of Rydułtowy Mine in Poland. Remote Sens. 2020, 12, 242. [Google Scholar] [CrossRef] [Green Version]
  52. Anders, K.; Marx, S.; Boike, J.; Herfort, B.; Wilcox, E.J.; Langer, M.; Marsh, P.; Höfle, B. Multitemporal terrestrial laser scanning point clouds for thaw subsidence observation at Arctic permafrost monitoring sites. Earth Surf. Processes Landf. 2020, 45, 1589–1600. [Google Scholar] [CrossRef]
  53. Barbarella, M.; Fiani, M.; Lugli, A. Landslide monitoring using multitemporal terrestrial laser scanning for ground displacement analysis. Geomat. Nat. Hazards Risk 2013, 6, 398–418. [Google Scholar] [CrossRef]
  54. Lian, X.; Hu, H. Terrestrial laser scanning monitoring and spatial analysis of ground disaster in Gaoyang coal mine in Shanxi, China: A technical note. Environ. Earth Sci. 2017, 76, 287. [Google Scholar] [CrossRef]
  55. Matwij, W.; Gruszczyński, W.; Puniach, E.; Ćwiąkała, P. Determination of underground mining-induced displacement field using multi-temporal TLS point cloud registration. Measurement 2021, 180, 109482. [Google Scholar] [CrossRef]
  56. Puniach, E.; Gruszczyński, W.; Ćwiąkała, P.; Matwij, W. Application of UAV-based orthomosaics for determination of horizontal displacement caused by underground mining. ISPRS J. Photogramm. Remote Sens. 2021, 174, 282–303. [Google Scholar] [CrossRef]
  57. Zhou, T.; Hasheminasab, S.M.; Habib, A. Tightly-coupled camera/LiDAR integration for point cloud generation from GNSS/INS-assisted UAV mapping systems. ISPRS J. Photogramm. Remote Sens. 2021, 180, 336–356. [Google Scholar] [CrossRef]
  58. Jing-xiang, G.; Hong, H. Advanced GNSS technology of mining deformation monitoring. Procedia Earth Planet. Sci. 2009, 1, 1081–1088. [Google Scholar] [CrossRef] [Green Version]
  59. Dai, H.; Luo, J.; Guo, J.; Yan, Y.; Zhang, W.; Zhu, Y. In site surveying and study on development laws of surface cracks by high—intensity mining in Shangwan Mine. Coal Sci. Technol. 2020, 48, 124–129. [Google Scholar] [CrossRef]
  60. Aminbakhsh, S.; Gunduz, M.; Sonmez, R. Safety risk assessment using analytic hierarchy process (AHP) during planning and budgeting of construction projects. J. Saf. Res. 2013, 46, 99–105. [Google Scholar] [CrossRef]
  61. Du, Y.; Chen, W.; Cui, K.; Zhang, K. Study on Damage Assessment of Earthen Sites of the Ming Great Wall in Qinghai Province Based on Fuzzy-AHP and AHP-TOPSIS. Int. J. Archit. Herit. 2019, 14, 903–916. [Google Scholar] [CrossRef]
  62. Ercanoglu, M.; Kasmer, O.; Temiz, N. Adaptation and comparison of expert opinion to analytical hierarchy process for landslide susceptibility mapping. Bull. Eng. Geol. Environ. 2008, 67, 565–578. [Google Scholar] [CrossRef]
  63. Tuzkaya, G.; Onut, S.; Tuzkaya, U.R.; Gulsun, B. An analytic network process approach for locating undesirable facilities: An example from Istanbul, Turkey. J. Environ. Manag. 2008, 88, 970–983. [Google Scholar] [CrossRef] [PubMed]
  64. Vahidnia, M.H.; Alesheikh, A.A.; Alimohammadi, A. Hospital site selection using fuzzy AHP and its derivatives. J. Environ. Manag. 2009, 90, 3048–3056. [Google Scholar] [CrossRef]
  65. Chen, Y.; Yu, S.; Tao, Q.; Liu, G.; Wang, L.; Wang, F. Accuracy Verification and Correction of D-InSAR and SBAS-InSAR in Monitoring Mining Surface Subsidence. Remote Sens. 2021, 13, 4365. [Google Scholar] [CrossRef]
  66. Gu, Y.; Zhou, D.; Zhang, D.; Wu, K.; Zhou, B. Study on subsidence monitoring technology using terrestrial 3D laser scanning without a target in a mining area: An example of Wangjiata coal mine, China. Bull. Eng. Geol. Environ. 2020, 79, 3575–3583. [Google Scholar] [CrossRef]
  67. Ishwar, S.G.; Kumar, D. Application of DInSAR in mine surface subsidence monitoring and prediction. Curr. Sci. 2017, 112, 46–51. [Google Scholar] [CrossRef]
  68. Zhang, C.; Zhao, Y.; He, X.; Guo, J.; Yan, Y. Space-sky-surface integrated monitoring system for overburden migration regularity in shallow-buried high-intensity mining. Bull. Eng. Geol. Environ. 2020, 80, 1403–1417. [Google Scholar] [CrossRef]
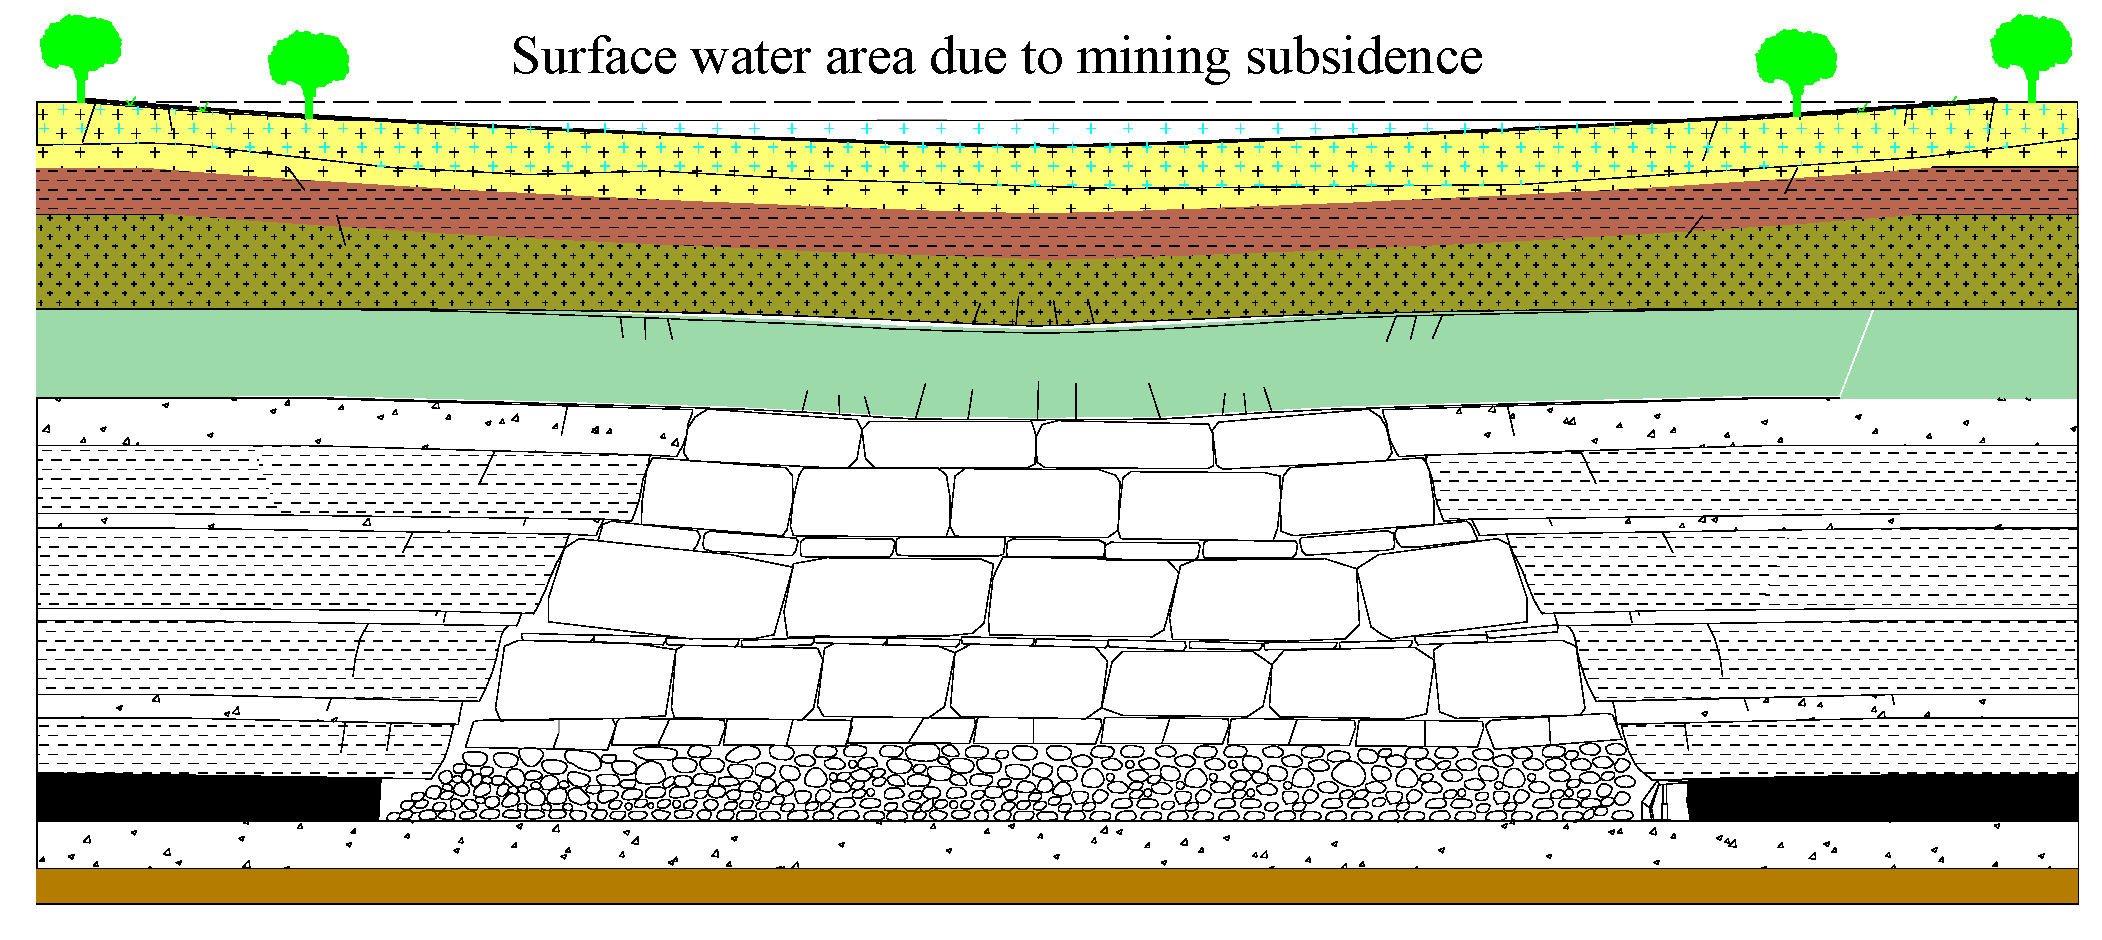
Figure 1. Mining damage transfer process.
Remotesensing 14 00840 g001
Figure 2. Surface subsidence and damages in mining areas: (a) Surface water area; (b) Road cracks; (c) Housing cracks; (d) Surface cracks; (e) Collapse pits.
Remotesensing 14 00840 g002aRemotesensing 14 00840 g002b
Figure 3. “Space-sky-ground” collaborative monitoring framework for surface subsidence in mining area: (a) the content of “Space-sky-ground” collaborative monitoring framework; (b) the diagram of “Space-sky-ground” monitoring framework.
Remotesensing 14 00840 g003
Figure 4. Influencing factors for the preference of surface subsidence monitoring methods selection.
Remotesensing 14 00840 g004
Figure 5. Total index ranking weight.
Remotesensing 14 00840 g005
Figure 6. Location of Shangwan Mine and 401 working face layouts: (a) Location of Shangwan Mine; (b) 401 working face layouts.
Remotesensing 14 00840 g006
Figure 7. Diagram of the optimized solution for “space-sky-ground” collaborative monitoring at working face 401.
Remotesensing 14 00840 g007
Figure 8. TLS deployment and regional location map: (a) TLS distribution; (b) Selection area with the point cloud model, working surface relationship map.
Remotesensing 14 00840 g008
Figure 9. Photos and flight path of UAV on site: (a) UAV photo; (b) Flight path.
Remotesensing 14 00840 g009
Figure 10. Surface crack drop and width measurement:(a) Measurement of ground crack tension; (b) Ground crack step drop measurement.
Remotesensing 14 00840 g010
Figure 11. InSAR monitoring results in Shendong Mining Area: (a) Rate of vertical surface deformation; (b) Accumulated surface deformation.
Remotesensing 14 00840 g011
Figure 12. Schematic diagram of surface subsidence at the mine area: (a) K line and L line; (b) Surface area subsidence.
Remotesensing 14 00840 g012
Figure 13. 3D model results: (a) DOM; (b) DEM; (c) DSM.
Remotesensing 14 00840 g013
Figure 14. The extension process of surface cracks: (a): surface cracks directly above the working face overtake the development of the advancing position of the working face; (b) during the advancing process of the working face, surface cracks expand along the advancing direction of the working face on the one hand, and on the other hand gradually expand gradually from directly above the working face to both sides of the mining area until near the boundary of the mining area; (c) surface cracks develop suddenly directly in front of the working face, indicating that the development of cracks with suddenness; (d) surface cracks develop in the direction of the side of the mining area and the two roadways, but the cracks hardly develop forward; (e) surface cracks continue to develop at the boundary of the mining area; (f) the generation of cracks at the boundary of the mining area usually delays the advancing position of the working face, and large cracks are formed at the surface.
Remotesensing 14 00840 g014
Figure 15. Surface subsidence map of working face based on InSAR and TLS data fusion.
Remotesensing 14 00840 g015
Figure 16. Comparison of levelling monitoring results and data fusion monitoring results.
Remotesensing 14 00840 g016
Figure 17. Surface deformation rate (mm/y) and cracks superimposed map.
Remotesensing 14 00840 g017
Figure 18. Gradient map of surface deformation: (a) Early period (10 August 2018): Cracks at the location of the opencut are distributed in an approximate circle, with a diameter greater than the width of the working face; (b) Active period (18 February 2019): the crack gradient distribution map of the surface was developing along the direction of workface advance as the workface continues to advance; (c) Downhole stoppage (10 September 2019): the surface deformation gradient map has a general “long strip” distribution.
Remotesensing 14 00840 g018
Figure 19. Distribution map of cooperative monitoring cracks at 401 working face of Shangwan Mine in Shendong Mining Area.
Remotesensing 14 00840 g019
Figure 20. “Space-sky-ground” collaborative monitoring framework for in mining area.
Remotesensing 14 00840 g020
Figure 21. Surface subsidence monitoring results at the mine area:(a) Surface subsidence monitoring from single technique (InSAR); (b) Surface subsidence monitoring from "space-sky-ground" integrated collaborative monitoring framework.
Remotesensing 14 00840 g021
Figure 22. Crack manual management process: (a) Filled cracks; (b) Ecological restoration.
Remotesensing 14 00840 g022
Table 1. Common ground deformation monitoring techniques.
Monitoring MethodAdvantagesAccuracy
GNSS and CORSSimple operation; Small workload [47,48,49]5 mm
D-InSARLow cost; Long period; Global surface deformation [26,30,50]1–3 cm
SBAS-InSAR [51]Enhancement of SAR data usage; Low cost<1 cm
TLS [52,53,54,55]Long range; High accuracy1 cm
UAV [56,57]High speed and efficiency; Flexibility10–15 cm
Levelling and Total stationHigh monitoring accuracy; Accurate reflection of the law of settlement1 mm
GNSS and RTKHigh speed and efficiency [58]2 cm
Steel rule and GNSSHigh accuracy; Law of accurate reflection [59]0.1 mm
The abbreviation in Table 1: CORS (Continuously Operating Reference Stations), D-InSAR (Differential Interferometry Synthetic Aperture Radar), SBAS-InSAR (Small Baseline Subset Interferometry Synthetic Aperture Radar), RTK (Real Time Kinematic).
Table 2. Maximum eigenvalue and eigenvector of preferred index.
Judgment MatrixMaximum EigenvalueEigenvector
A (Preferred monitoring method)3.05360.1571, 0.2493, 0.5936
B1 (Natural factors)4.10230.1306, 0.5492, 0.2302, 0.0900
B2 (Targets constraints)6.56160.0603, 0.0440, 0.1162, 0.2355,
0.1829, 0.3611
B3 (Site needs)6.46130.3466, 0.1784, 0.0821, 0.1528,
0.1607, 0.0676
Table 3. Consistency check calculation results.
IndexAB1B2B3
IC0.02680.03410.11230.0923
IR0.04620.03790.09060.0744
Table 4. Monitoring method combination comparison table.
ProgramGNSS and CORSInSARTLSUAVSteel Rule and GNSS
I
II
III
IV
V
Table 5. Experimental use of SAR image data details.
NumberDatePath-FrameOrbital DirectionPolarization ModeModelIncidence Angle
114 October 201711-126AscendingVVIW40-41
226 October 201711-126AscendingVVIW40-41
37 November 201711-126AscendingVVIW40-41
419 November 201711-126AscendingVVIW40-41
51 December 201711-126AscendingVVIW40-41
613 December 201711-126AscendingVVIW40-41
725 December 201711-126AscendingVVIW40-41
86 January 201811-126AscendingVVIW40-41
930 January 201811-126AscendingVVIW40-41
1011 February 201811-126AscendingVVIW40-41
1123 February 201811-126AscendingVVIW40-41
127 March 201811-126AscendingVVIW40-41
1319 March 201811-126AscendingVVIW40-41
1431 March 201811-126AscendingVVIW40-41
1512 April 201811-126AscendingVVIW40-41
1624 April 201811-126AscendingVVIW40-41
176 May 201811-126AscendingVVIW40-41
1818 May 201811-126AscendingVVIW40-41
1930 May 201811-126AscendingVVIW40-41
2011 June 201811-126AscendingVVIW40-41
2123 June 201811-126AscendingVVIW40-41
225 July 201811-126AscendingVVIW40-41
2329 July 201811-126AscendingVVIW40-41
2410 August 201811-126AscendingVVIW40-41
2522 August 201811-126AscendingVVIW40-41
263 September 201811-126AscendingVVIW40-41
2715 September 201811-126AscendingVVIW40-41
2827 September 201811-126AscendingVVIW40-41
299 October 201811-126AscendingVVIW40-41
3021 October 201811-126AscendingVVIW40-41
Table 6. Variation of the development regularity of surface cracks with the advanced distance of working face.
Advance the Position155 m310 m
Crack development lawThe working face advances slowly, the old roof is damaged by mining to a relatively large extent, and the overlying rock and surface cracks are fully developed, resulting in the development of cracks ahead of the working face.All three marginal cracks beyond the working face are developed beyond the mining boundary, and the new ground cracks continue to develop 38 m forward.
Schematic diagram Remotesensing 14 00840 i001 Remotesensing 14 00840 i002
Table 7. Comparison of maximum subsidence values monitored by level data and fused data.
Maximum Subsidence ValuePoint Cloud Data (InSAR and TLS)Levelling Data
K line5579 mm (K36)5562 mm (K36)
L line5067 mm (L22)4942 mm (L22)
Publisher’s Note: MDPI stays neutral with regard to jurisdictional claims in published maps and institutional affiliations.