
Assessing Land Cover and Ecological Quality Changes in the Forest-Steppe Ecotone of the Greater Khingan Mountains, Northeast China, from Landsat and MODIS Observations from 2000 to 2018


Abstract
:
1. Introduction
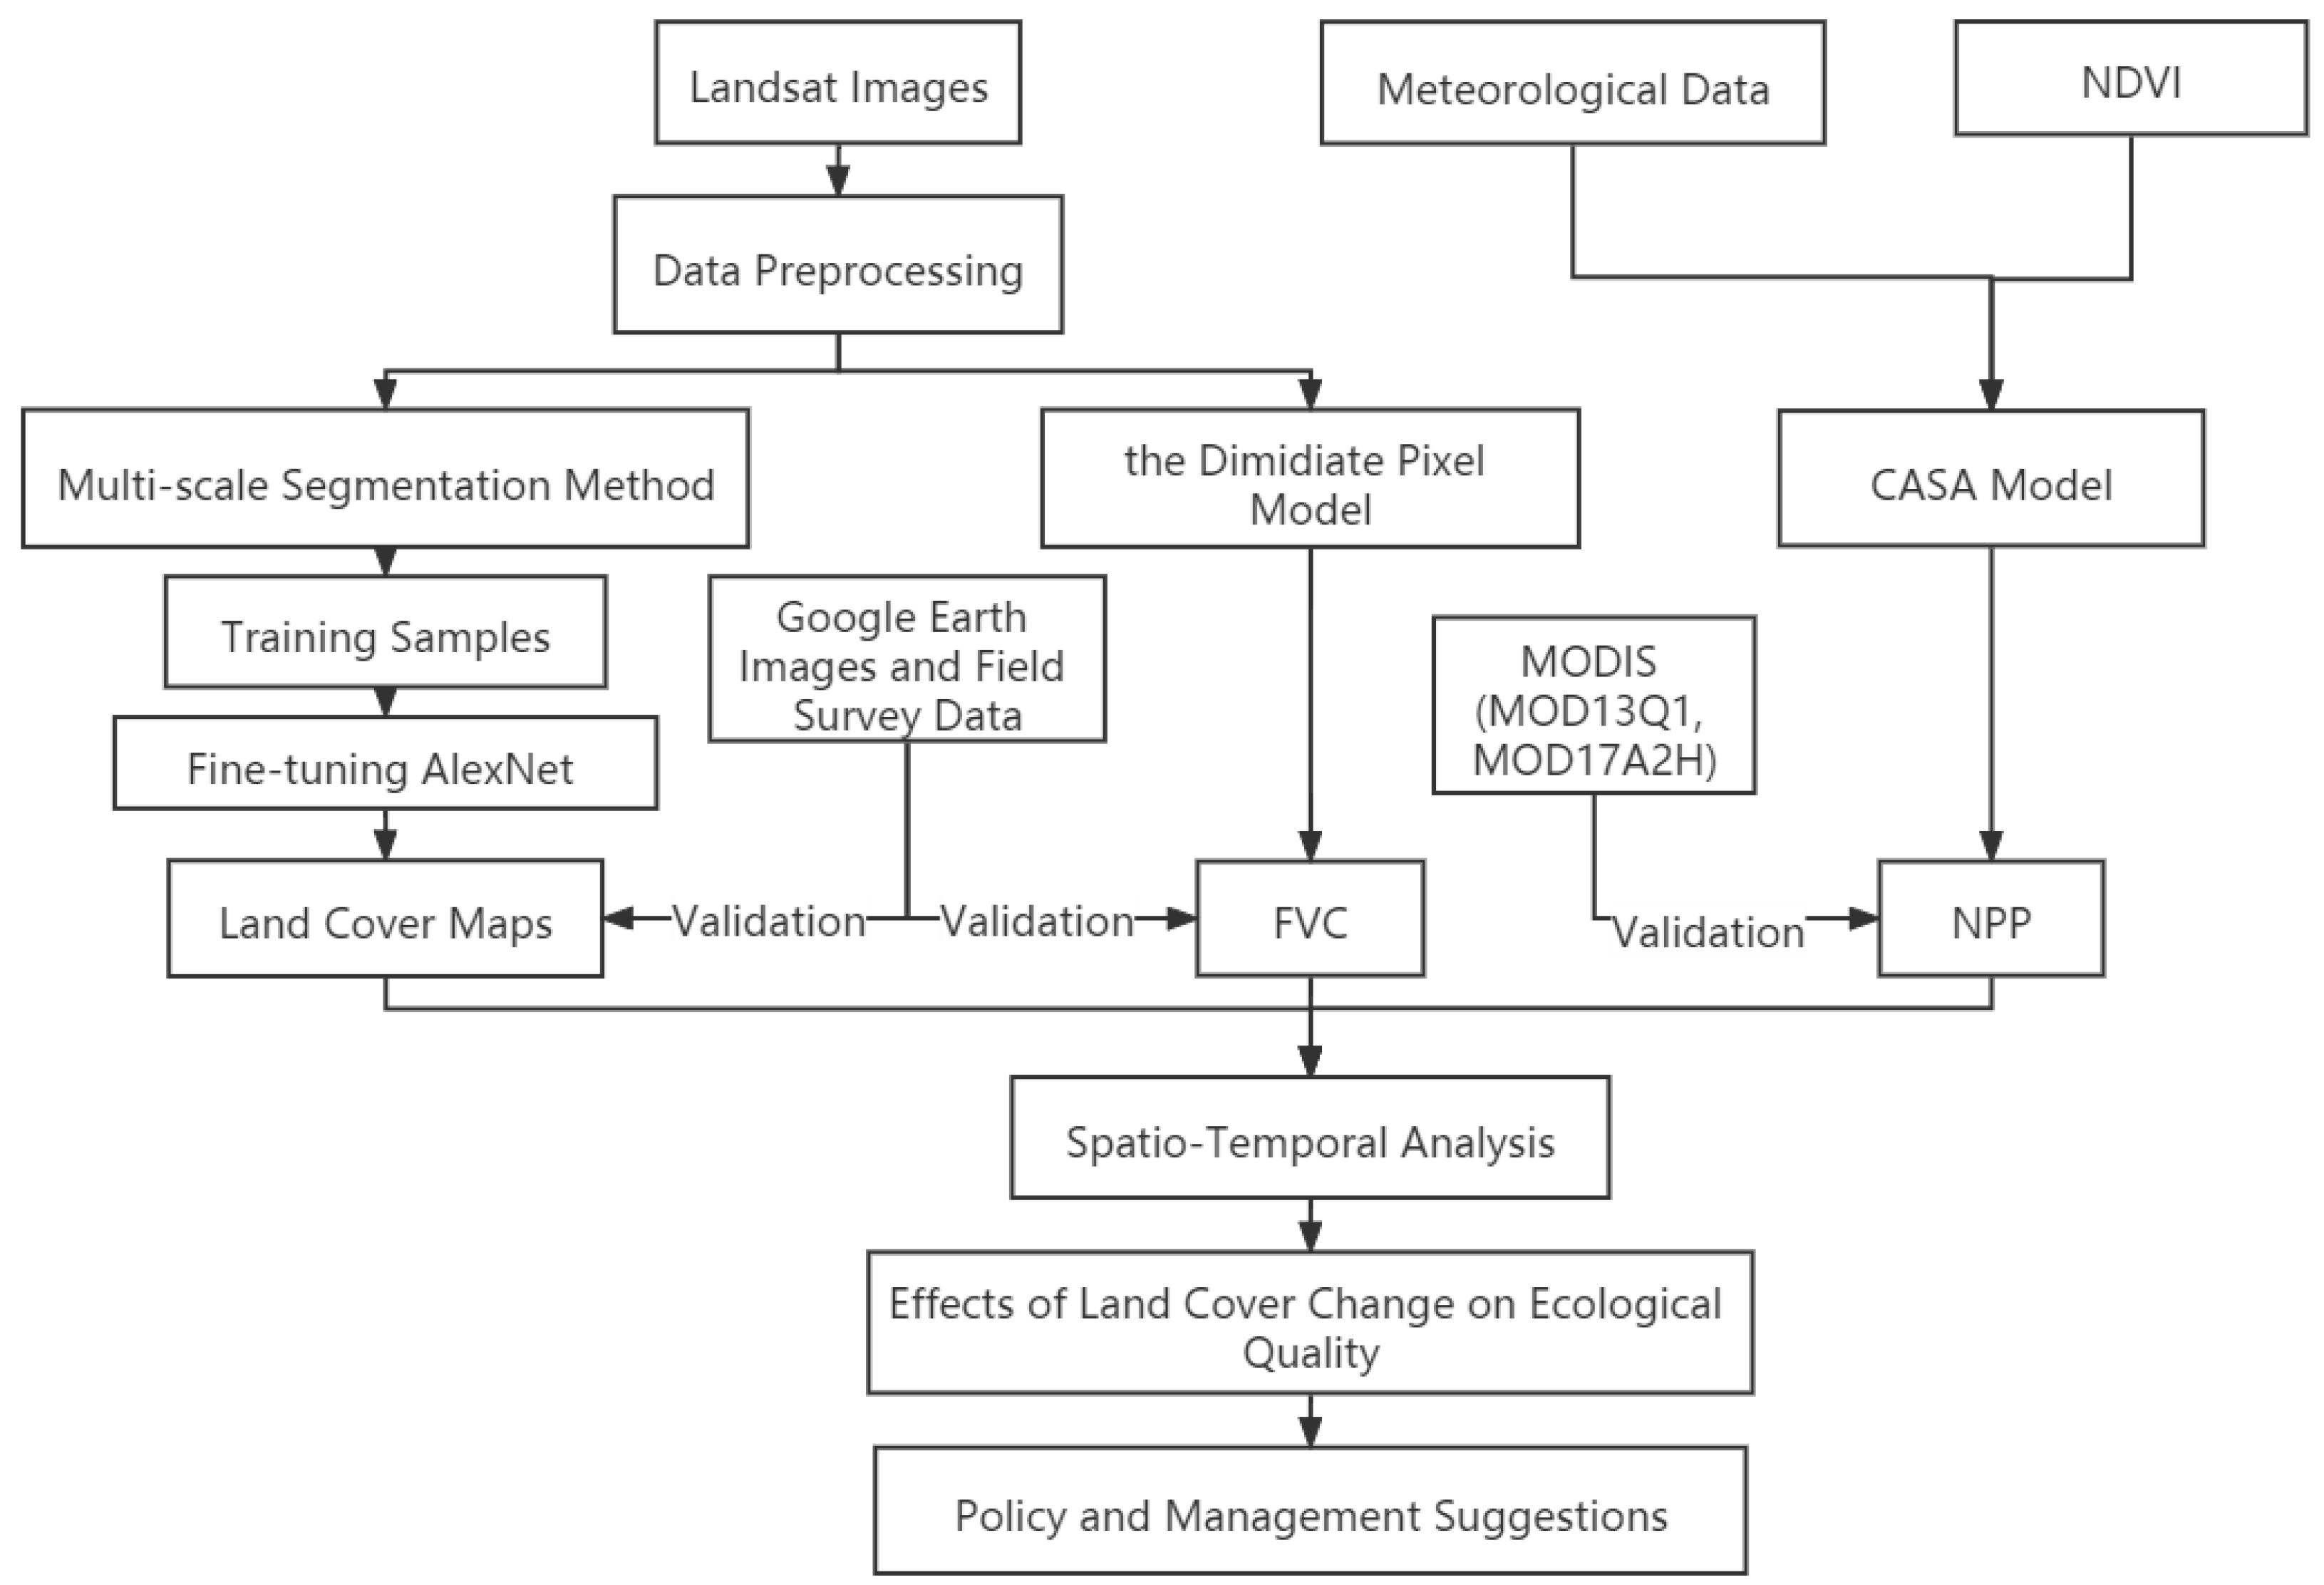
2. Materials and Methods
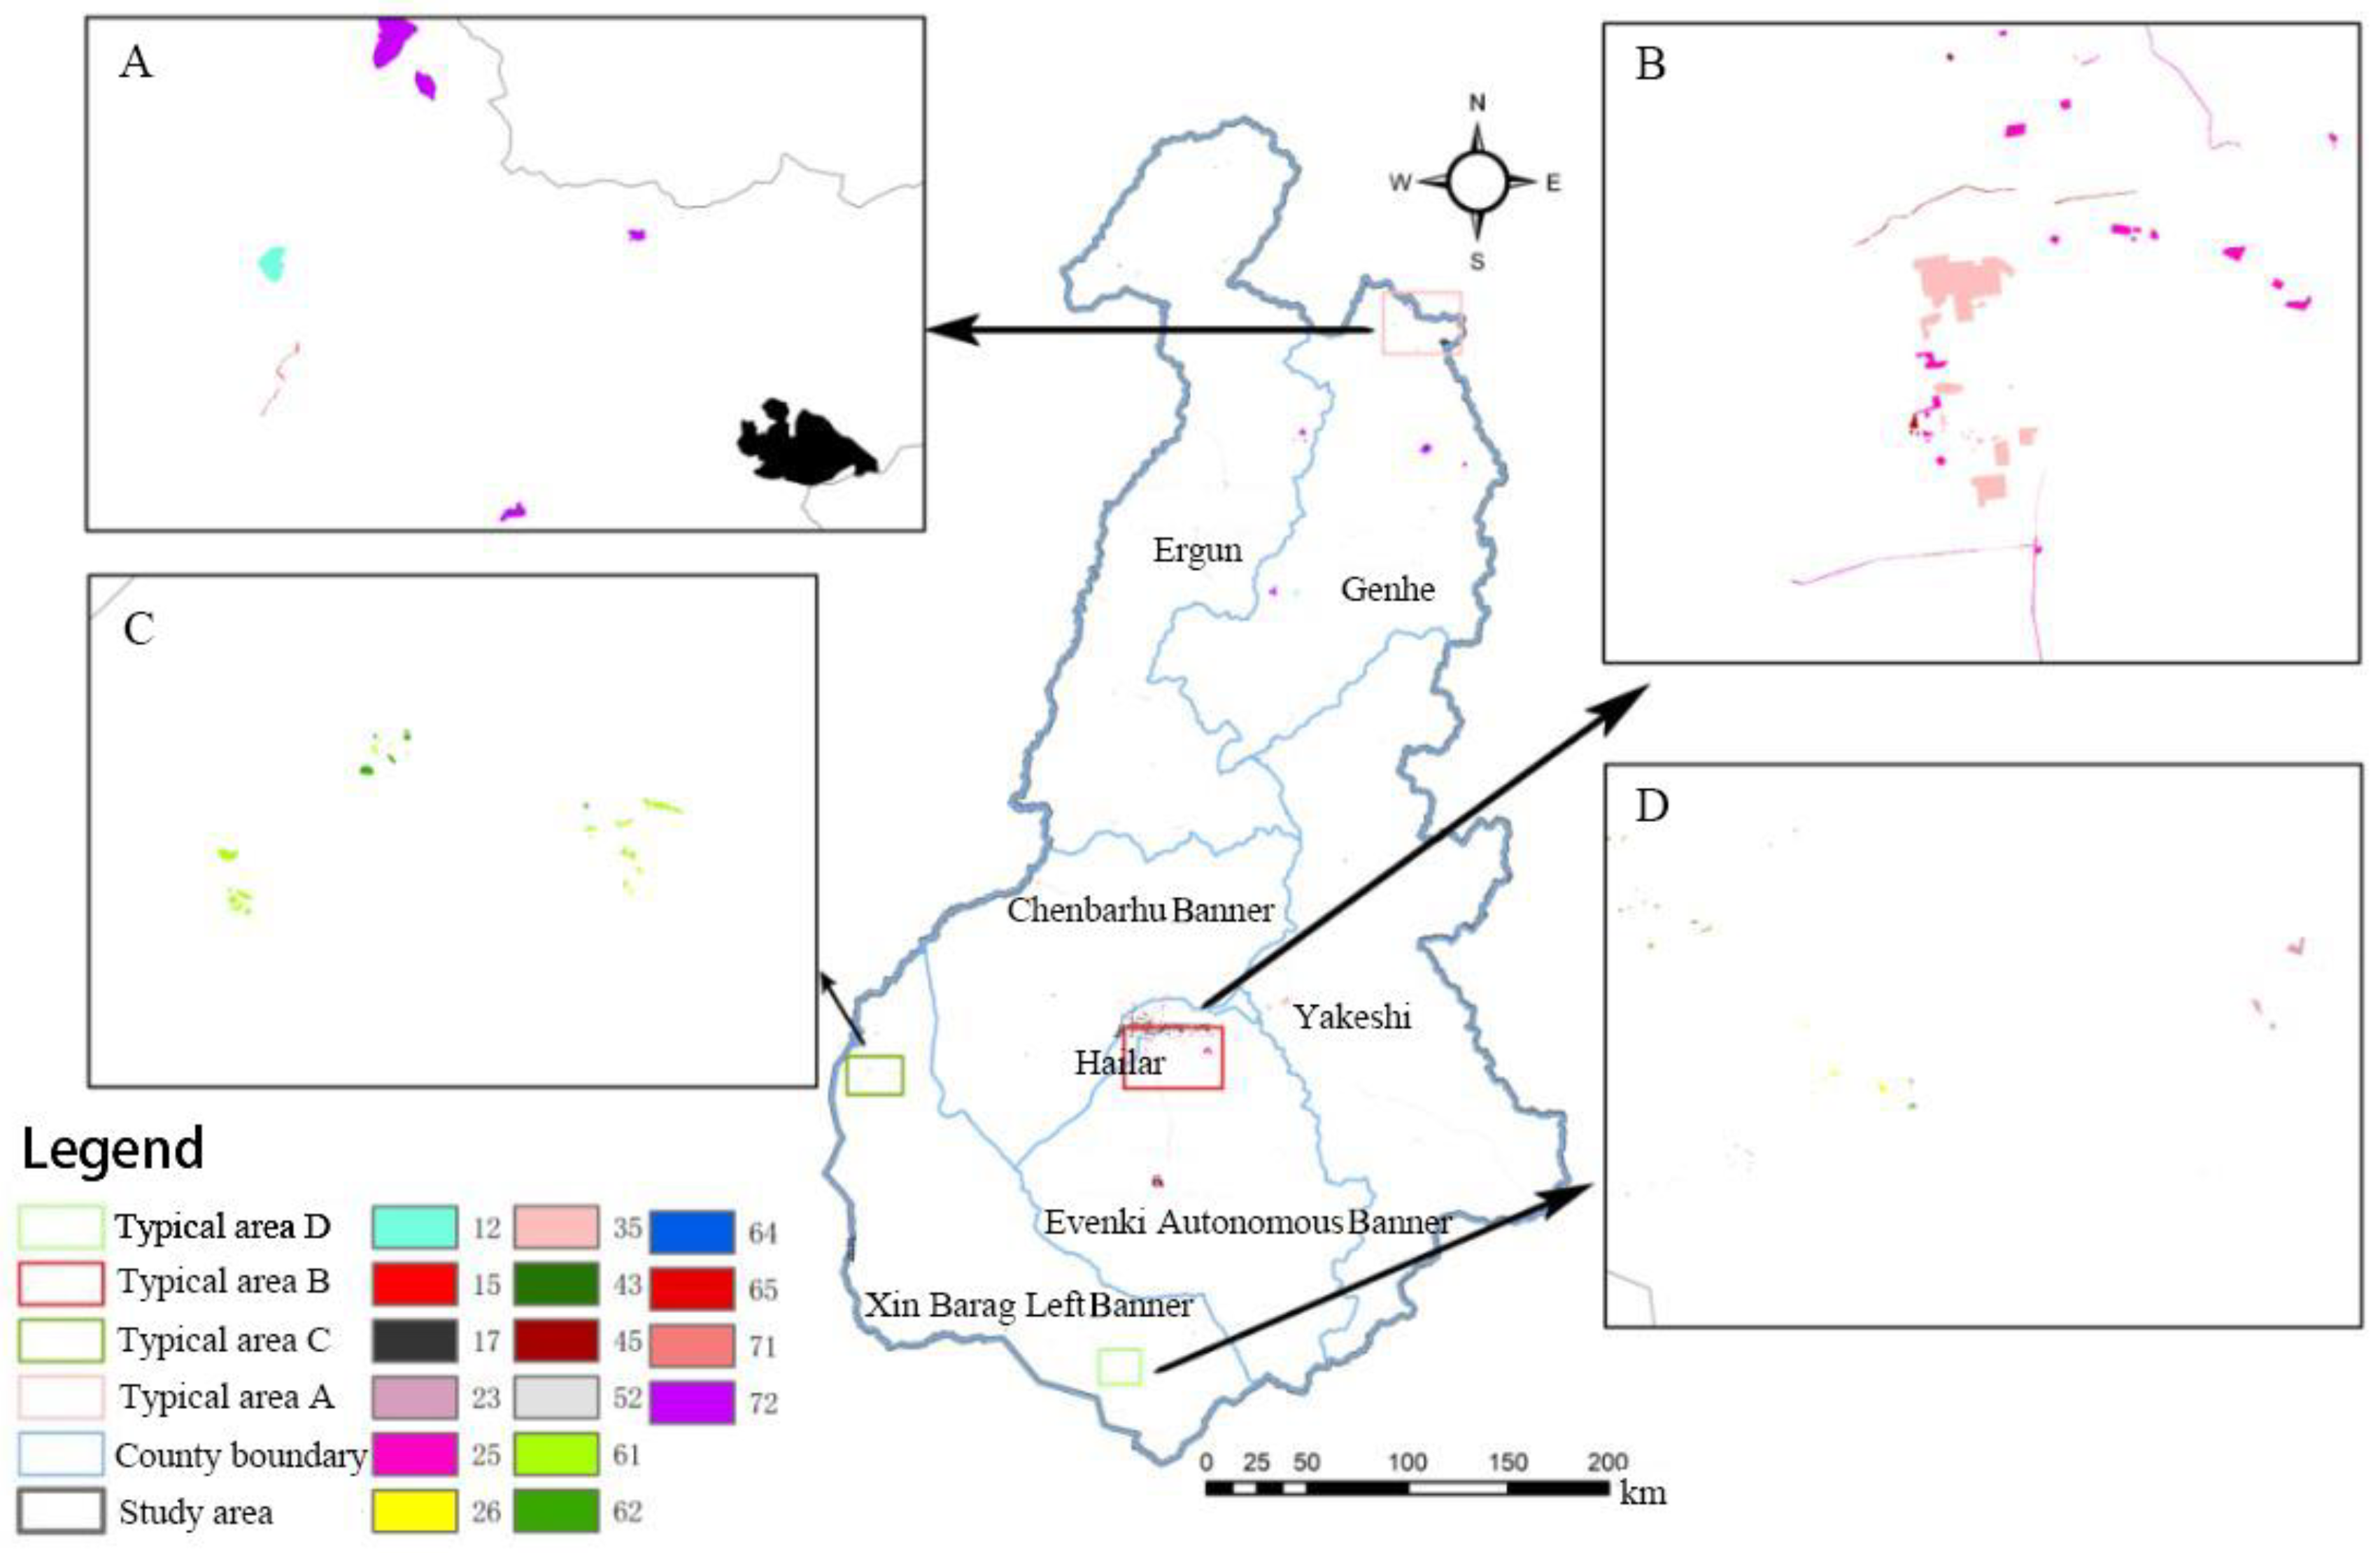
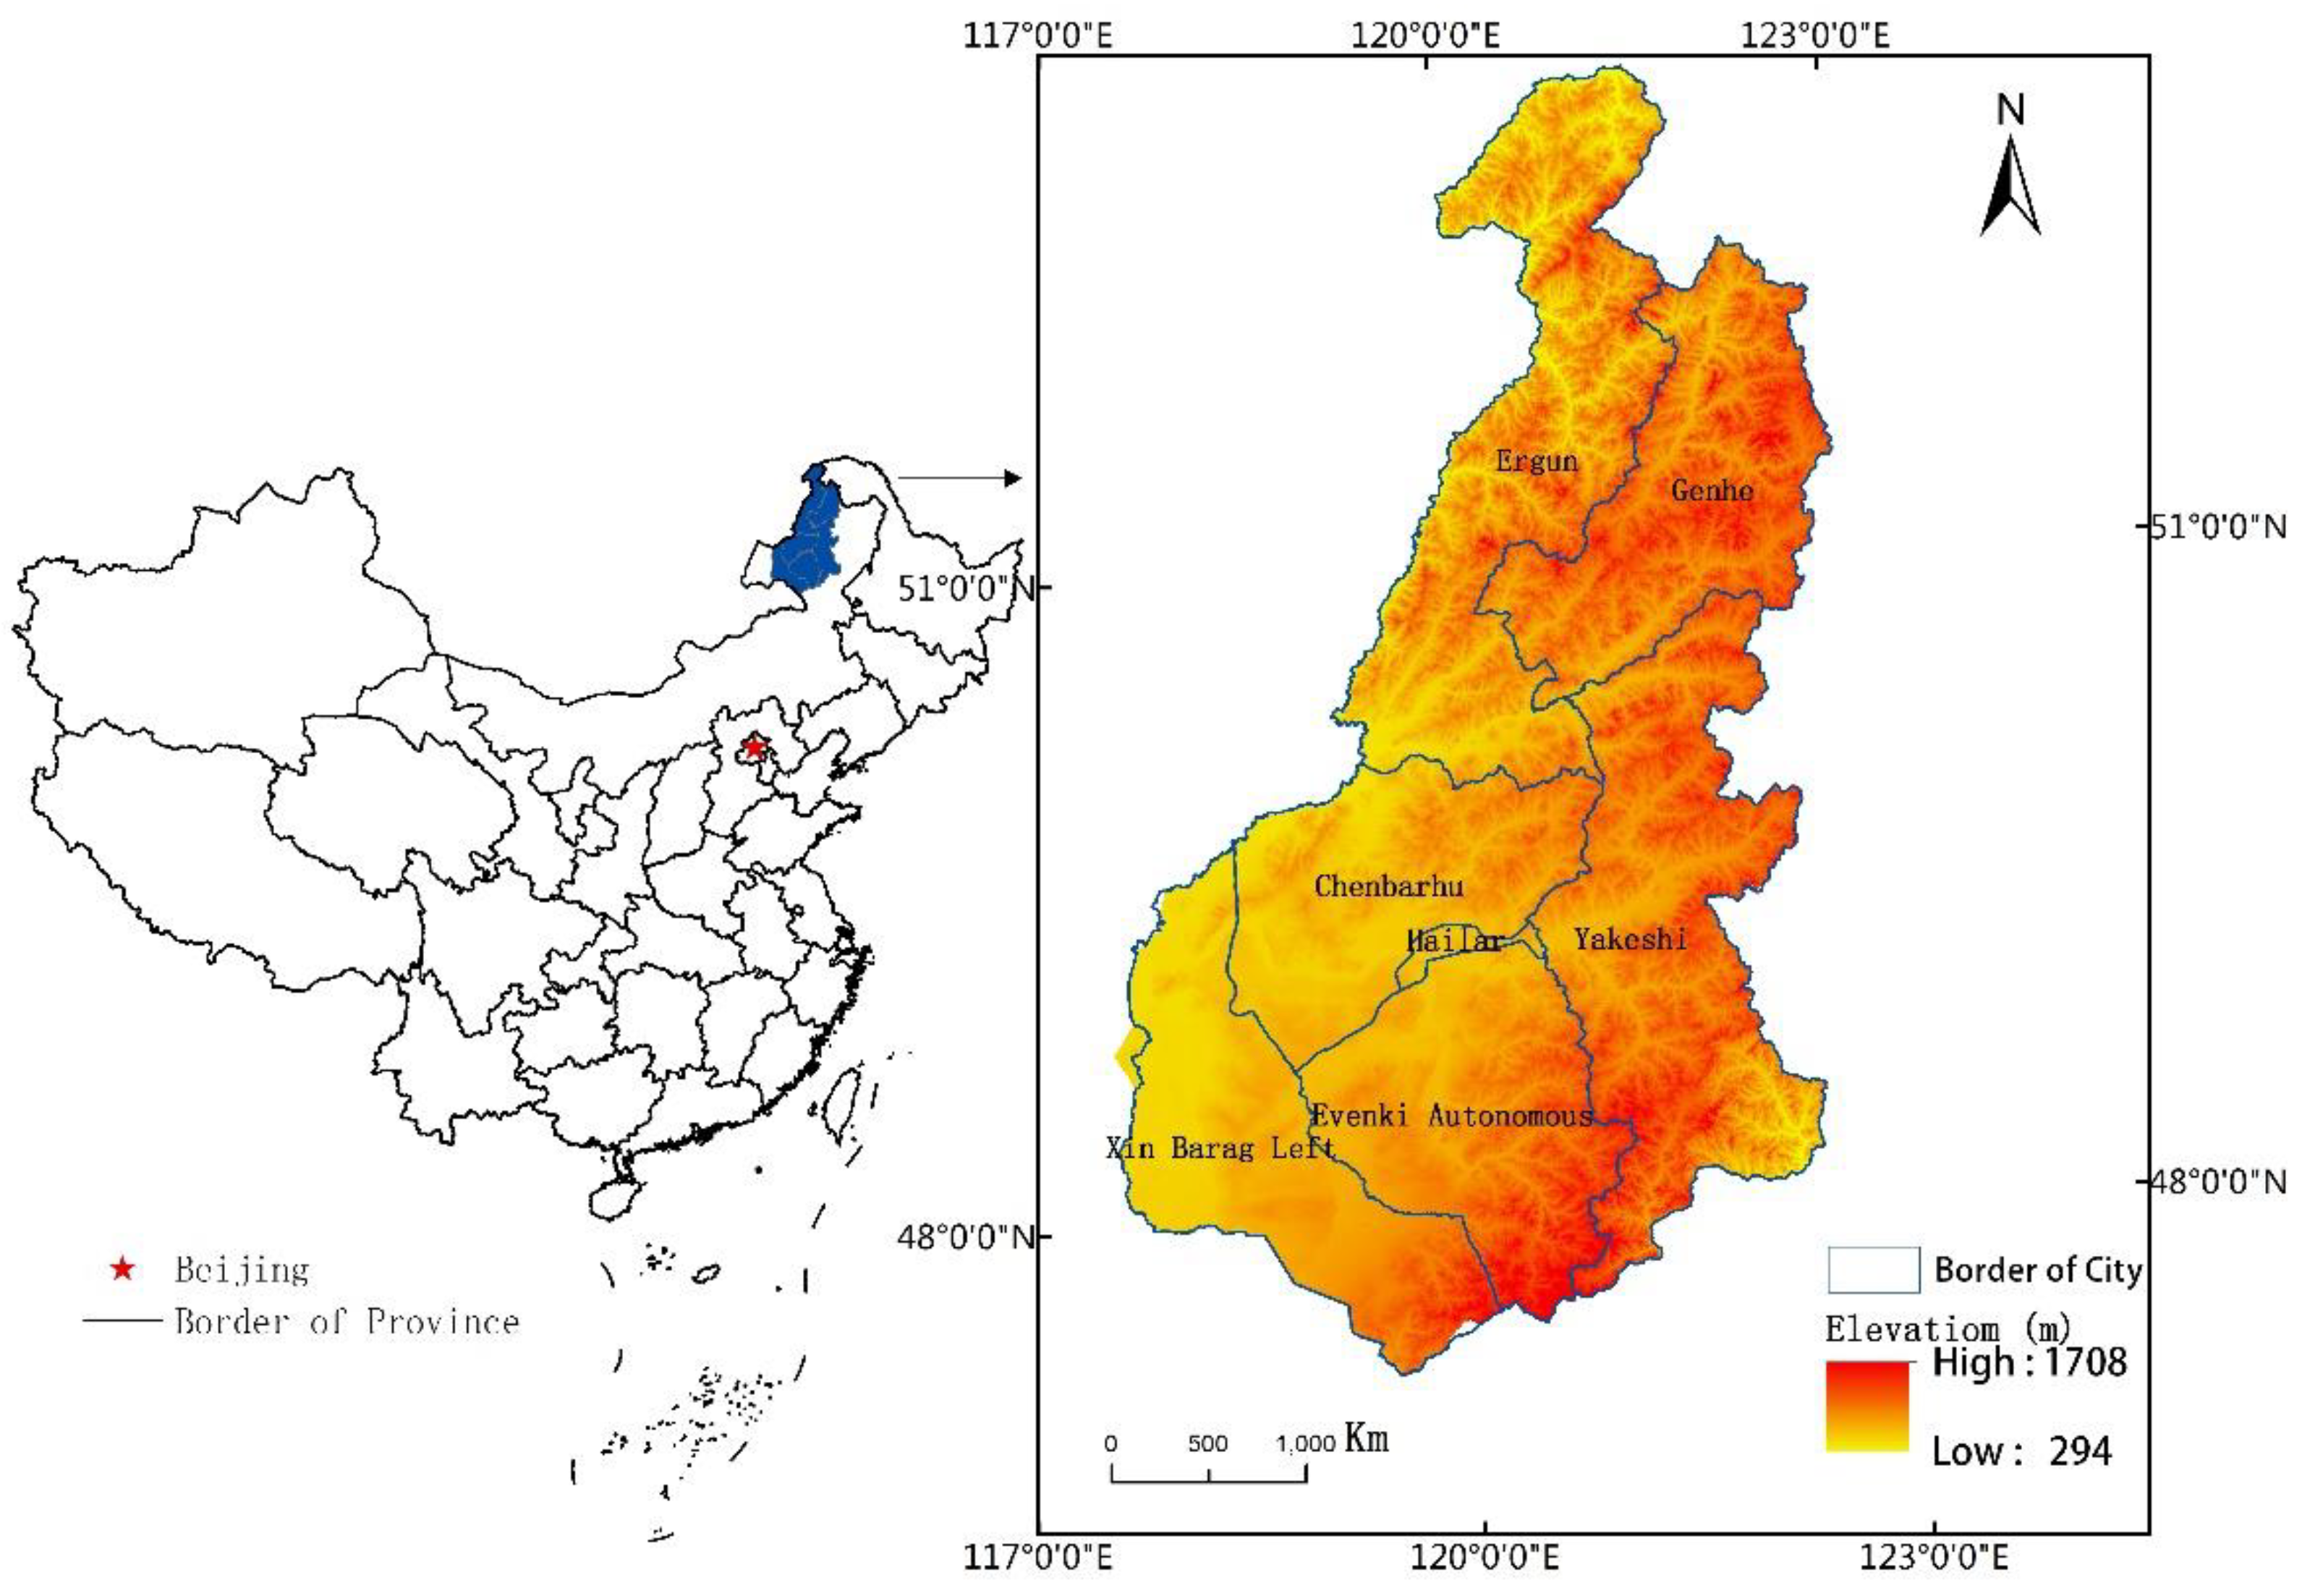
2.1. Study Area
2.2. Data Sources and Preprocessing
2.3. Land Cover Classification Scheme
2.4. Land Cover Classification
2.4.1. Preprocessing
2.4.2. Model Training
2.4.3. Fine-Tuning AlexNet
2.5. Estimation of NPP
2.6. Estimation of FVC
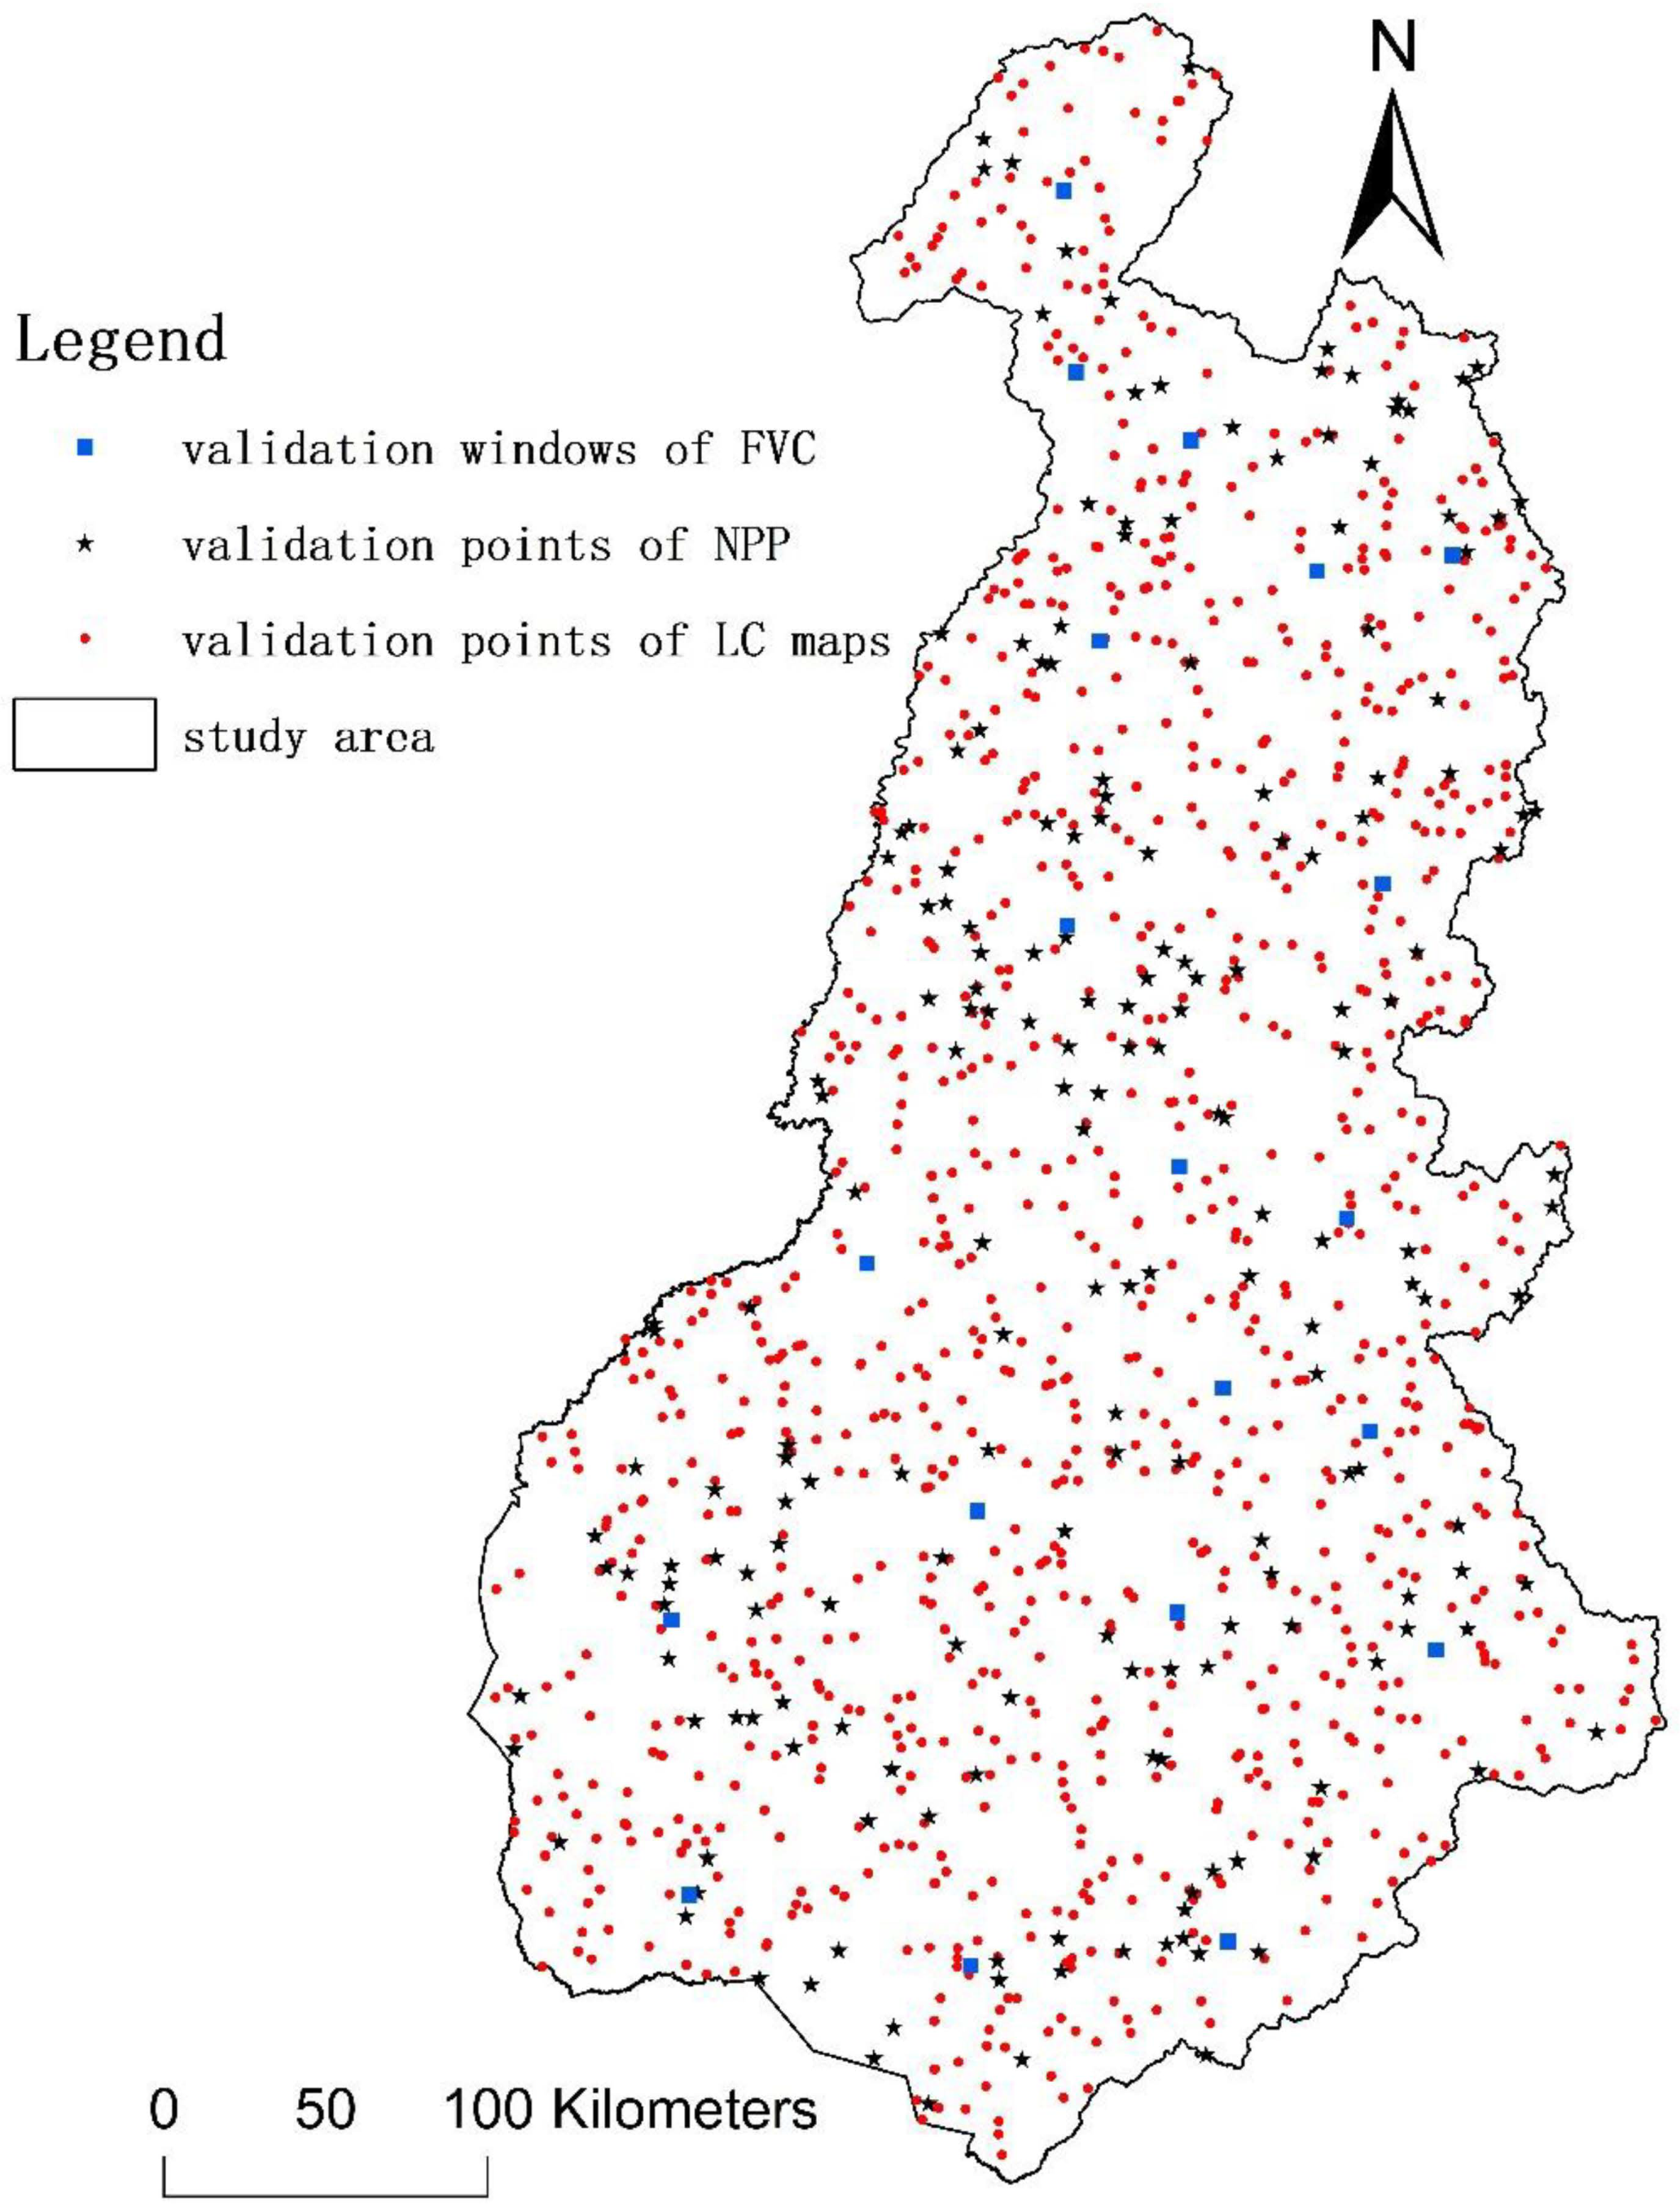
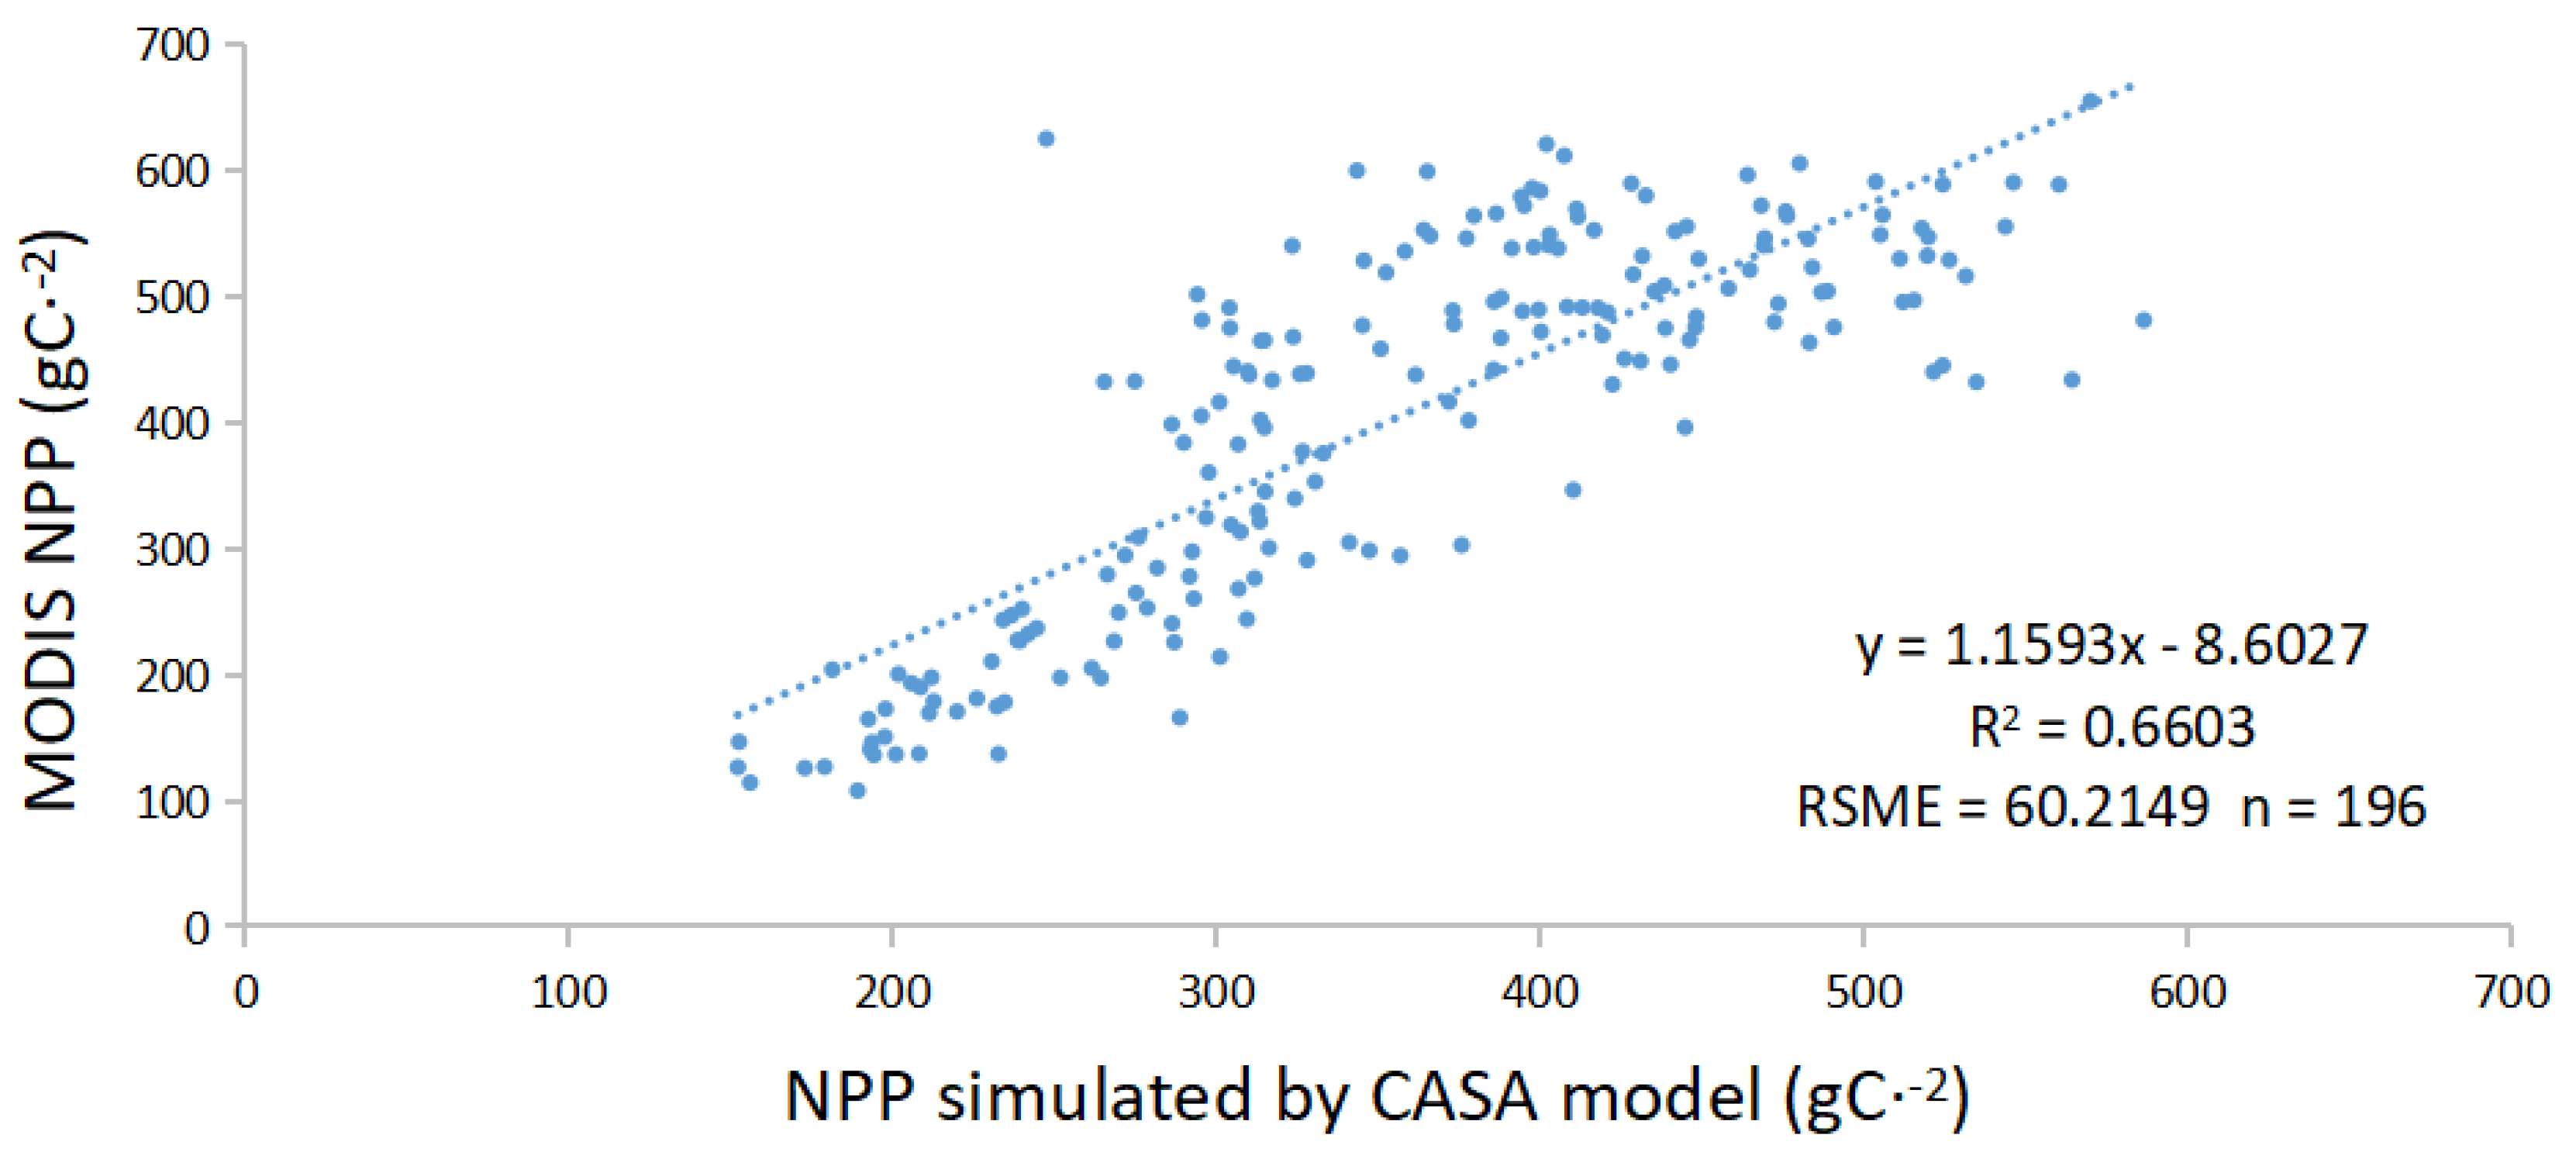
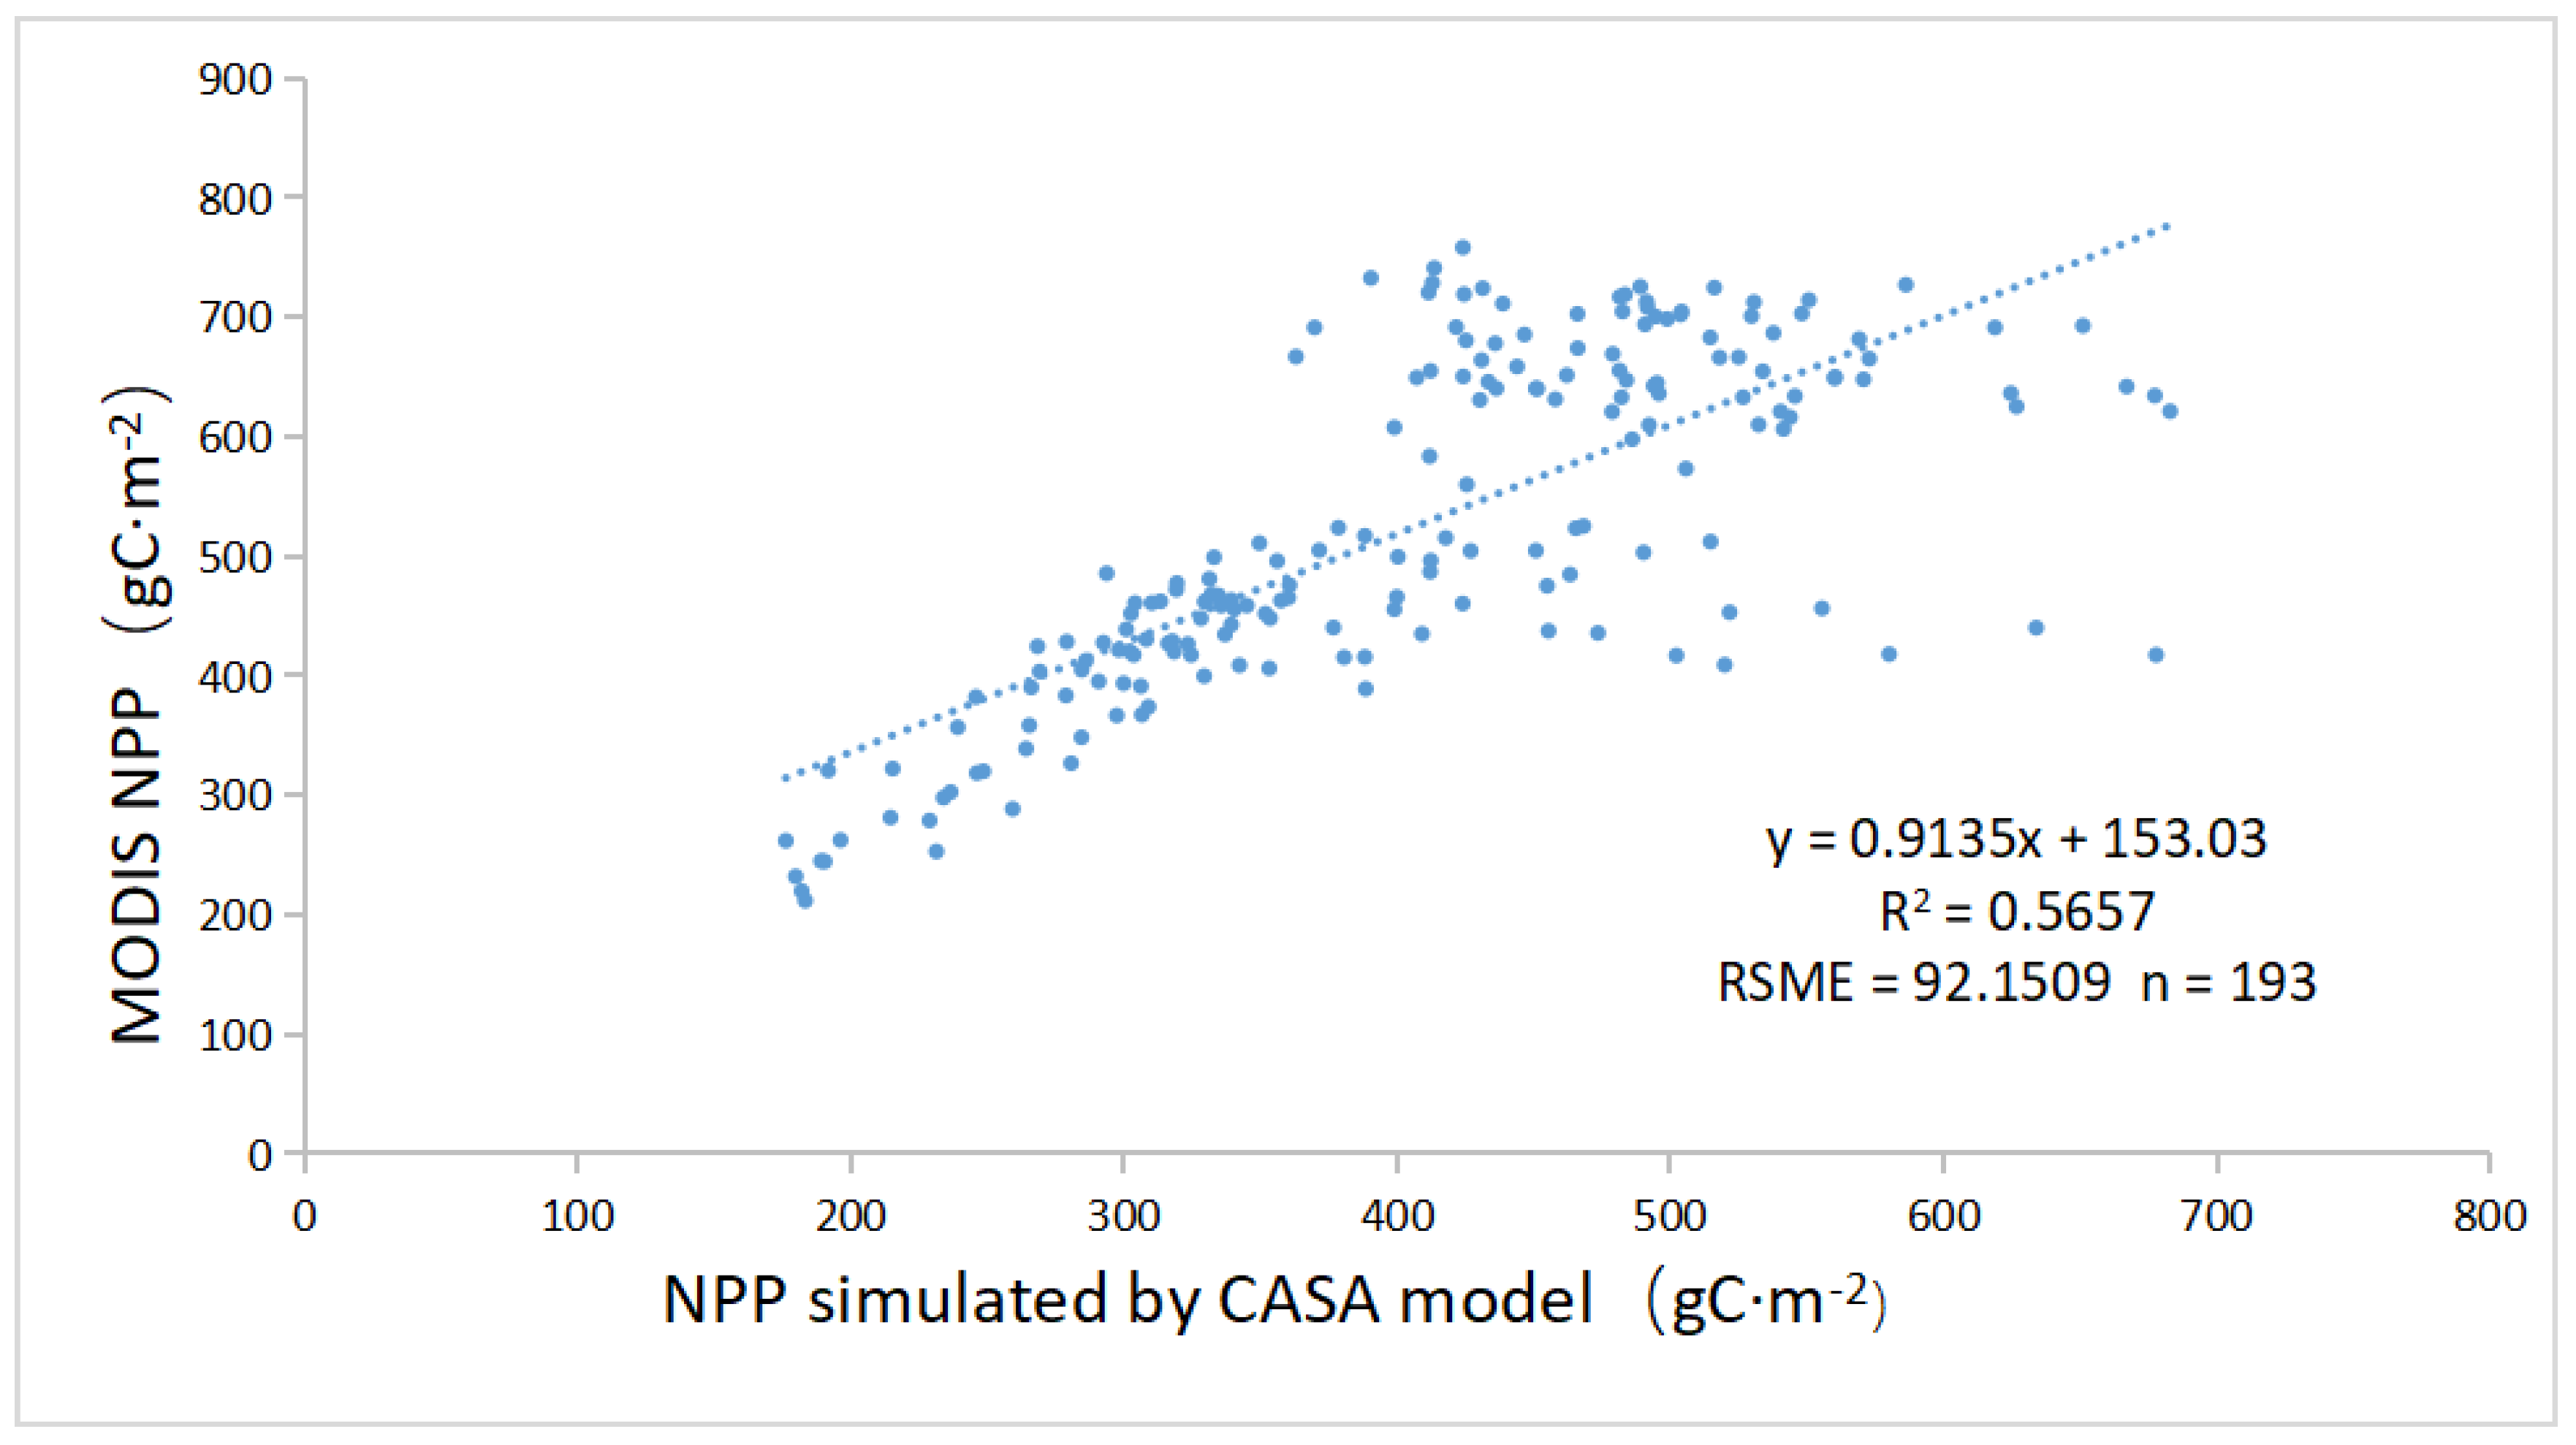
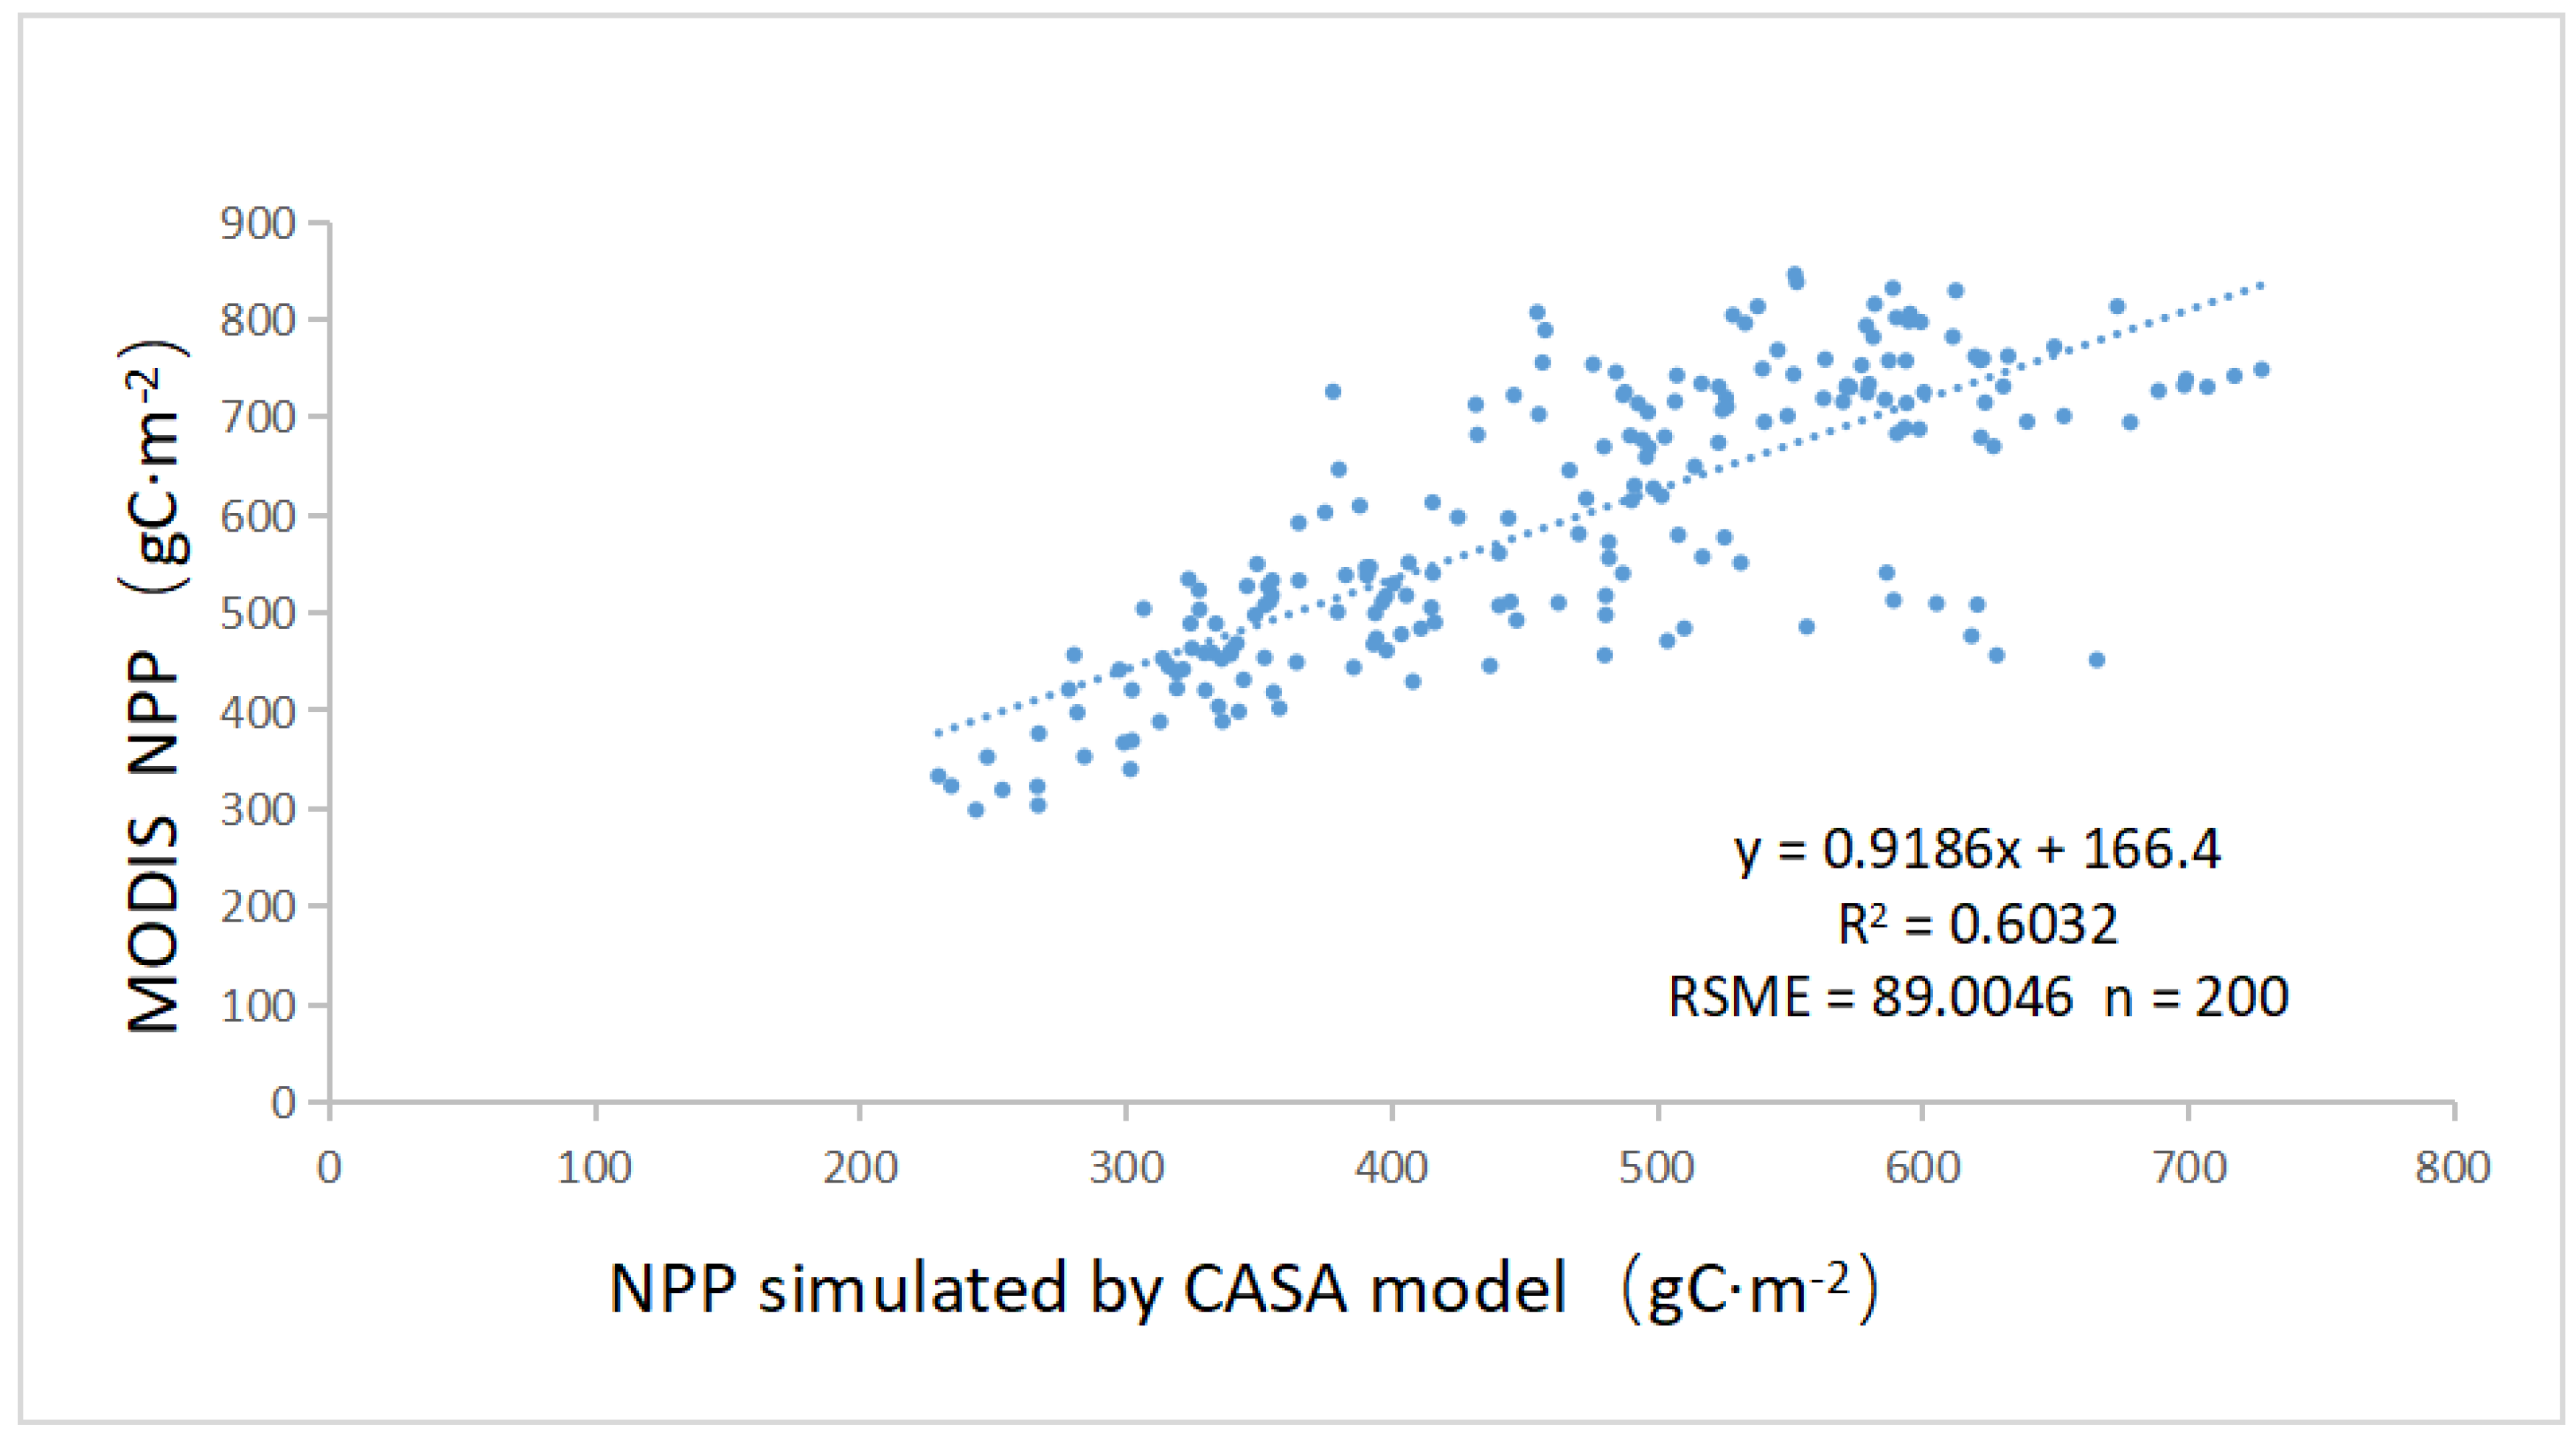
2.7. Verification Method
3. Results
3.1. Accuracy Assessment
3.2. Land Cover Changes
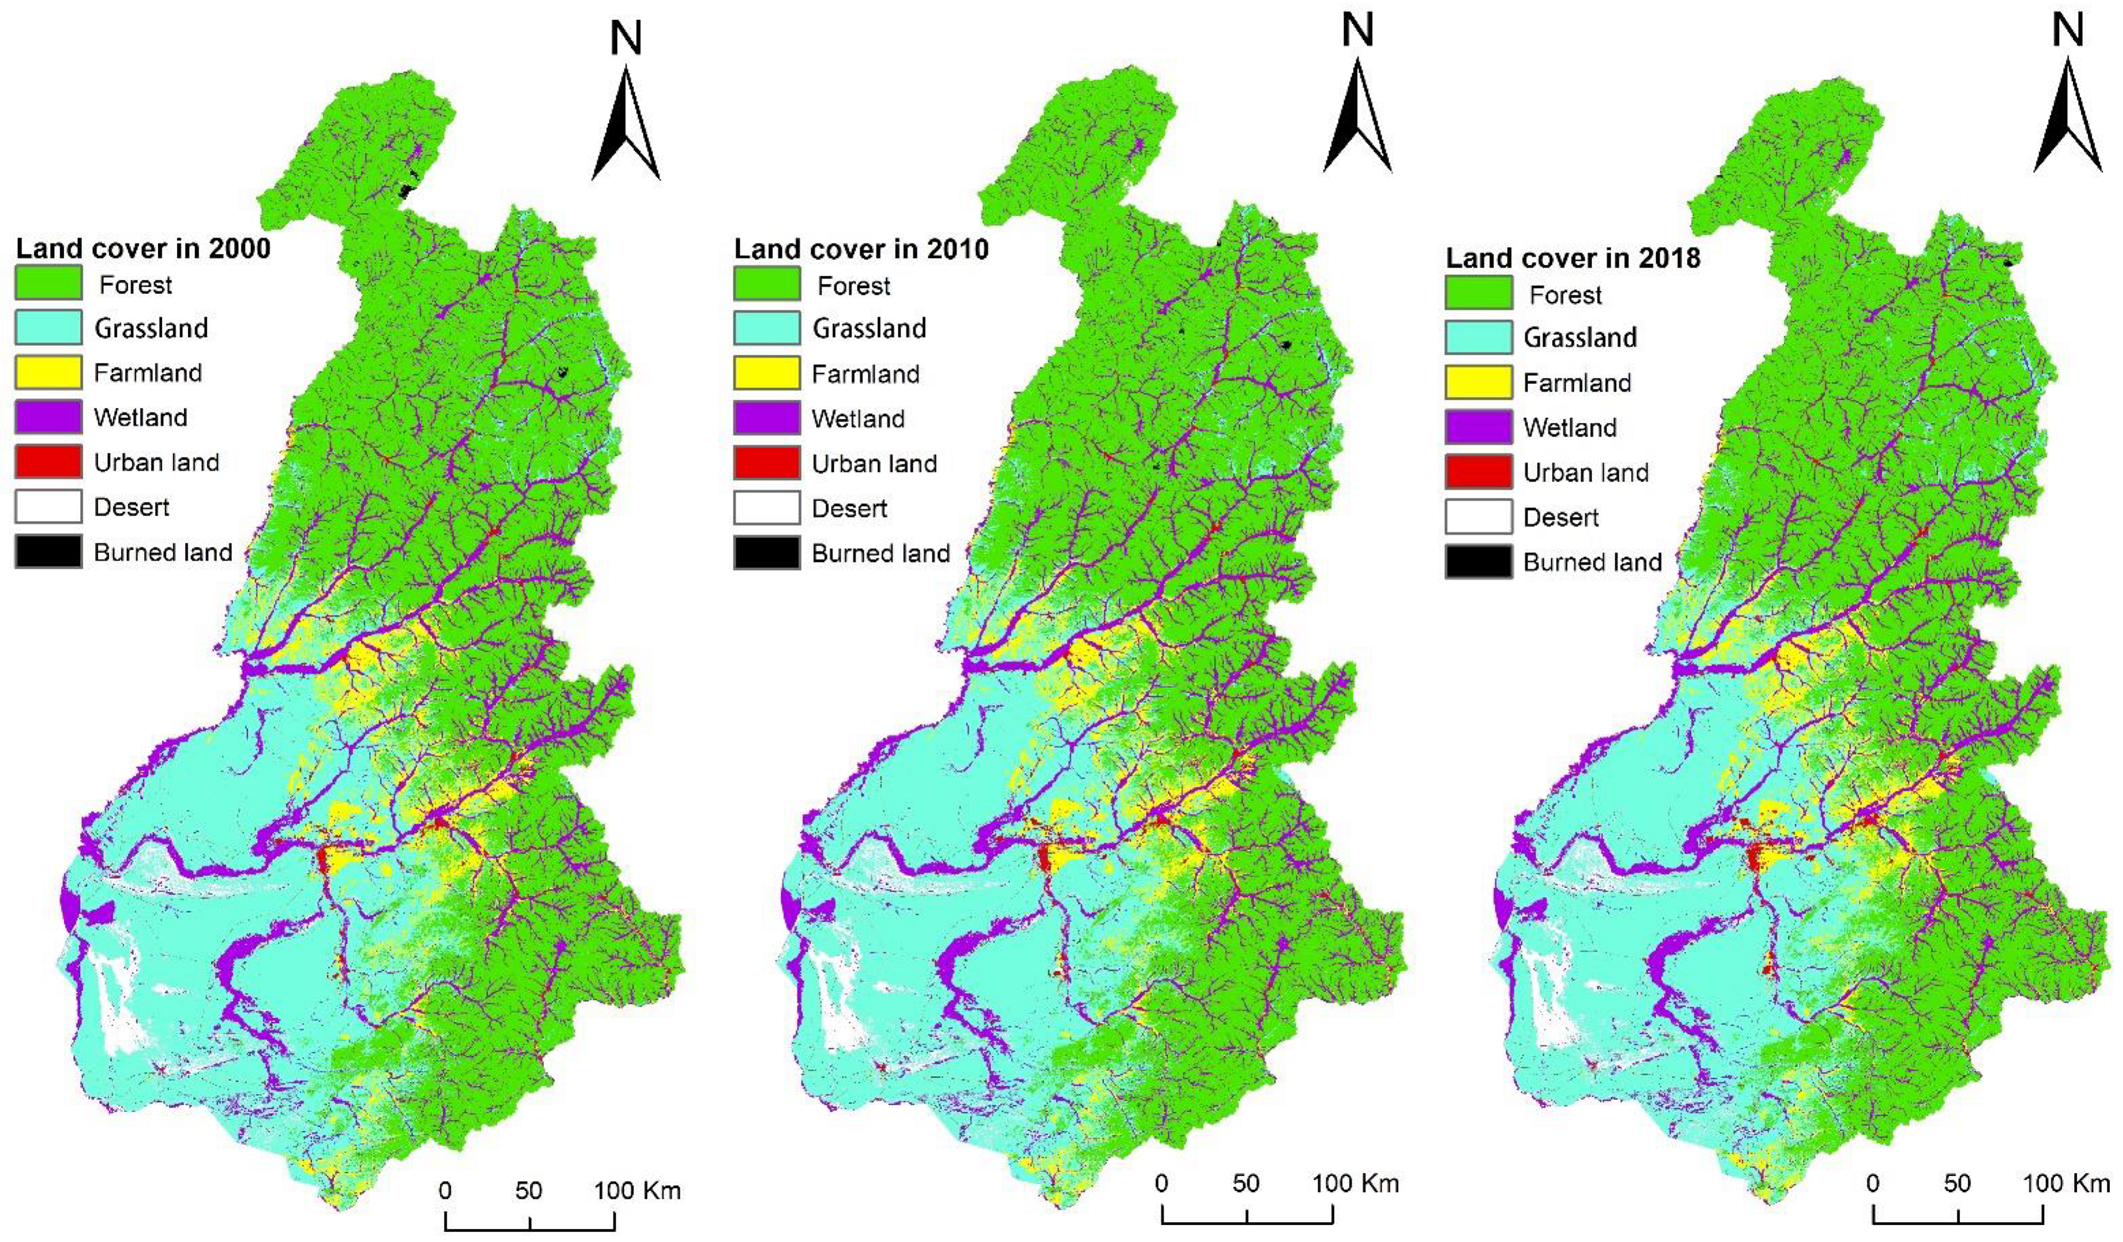
3.2.1. Land Cover Classification Maps
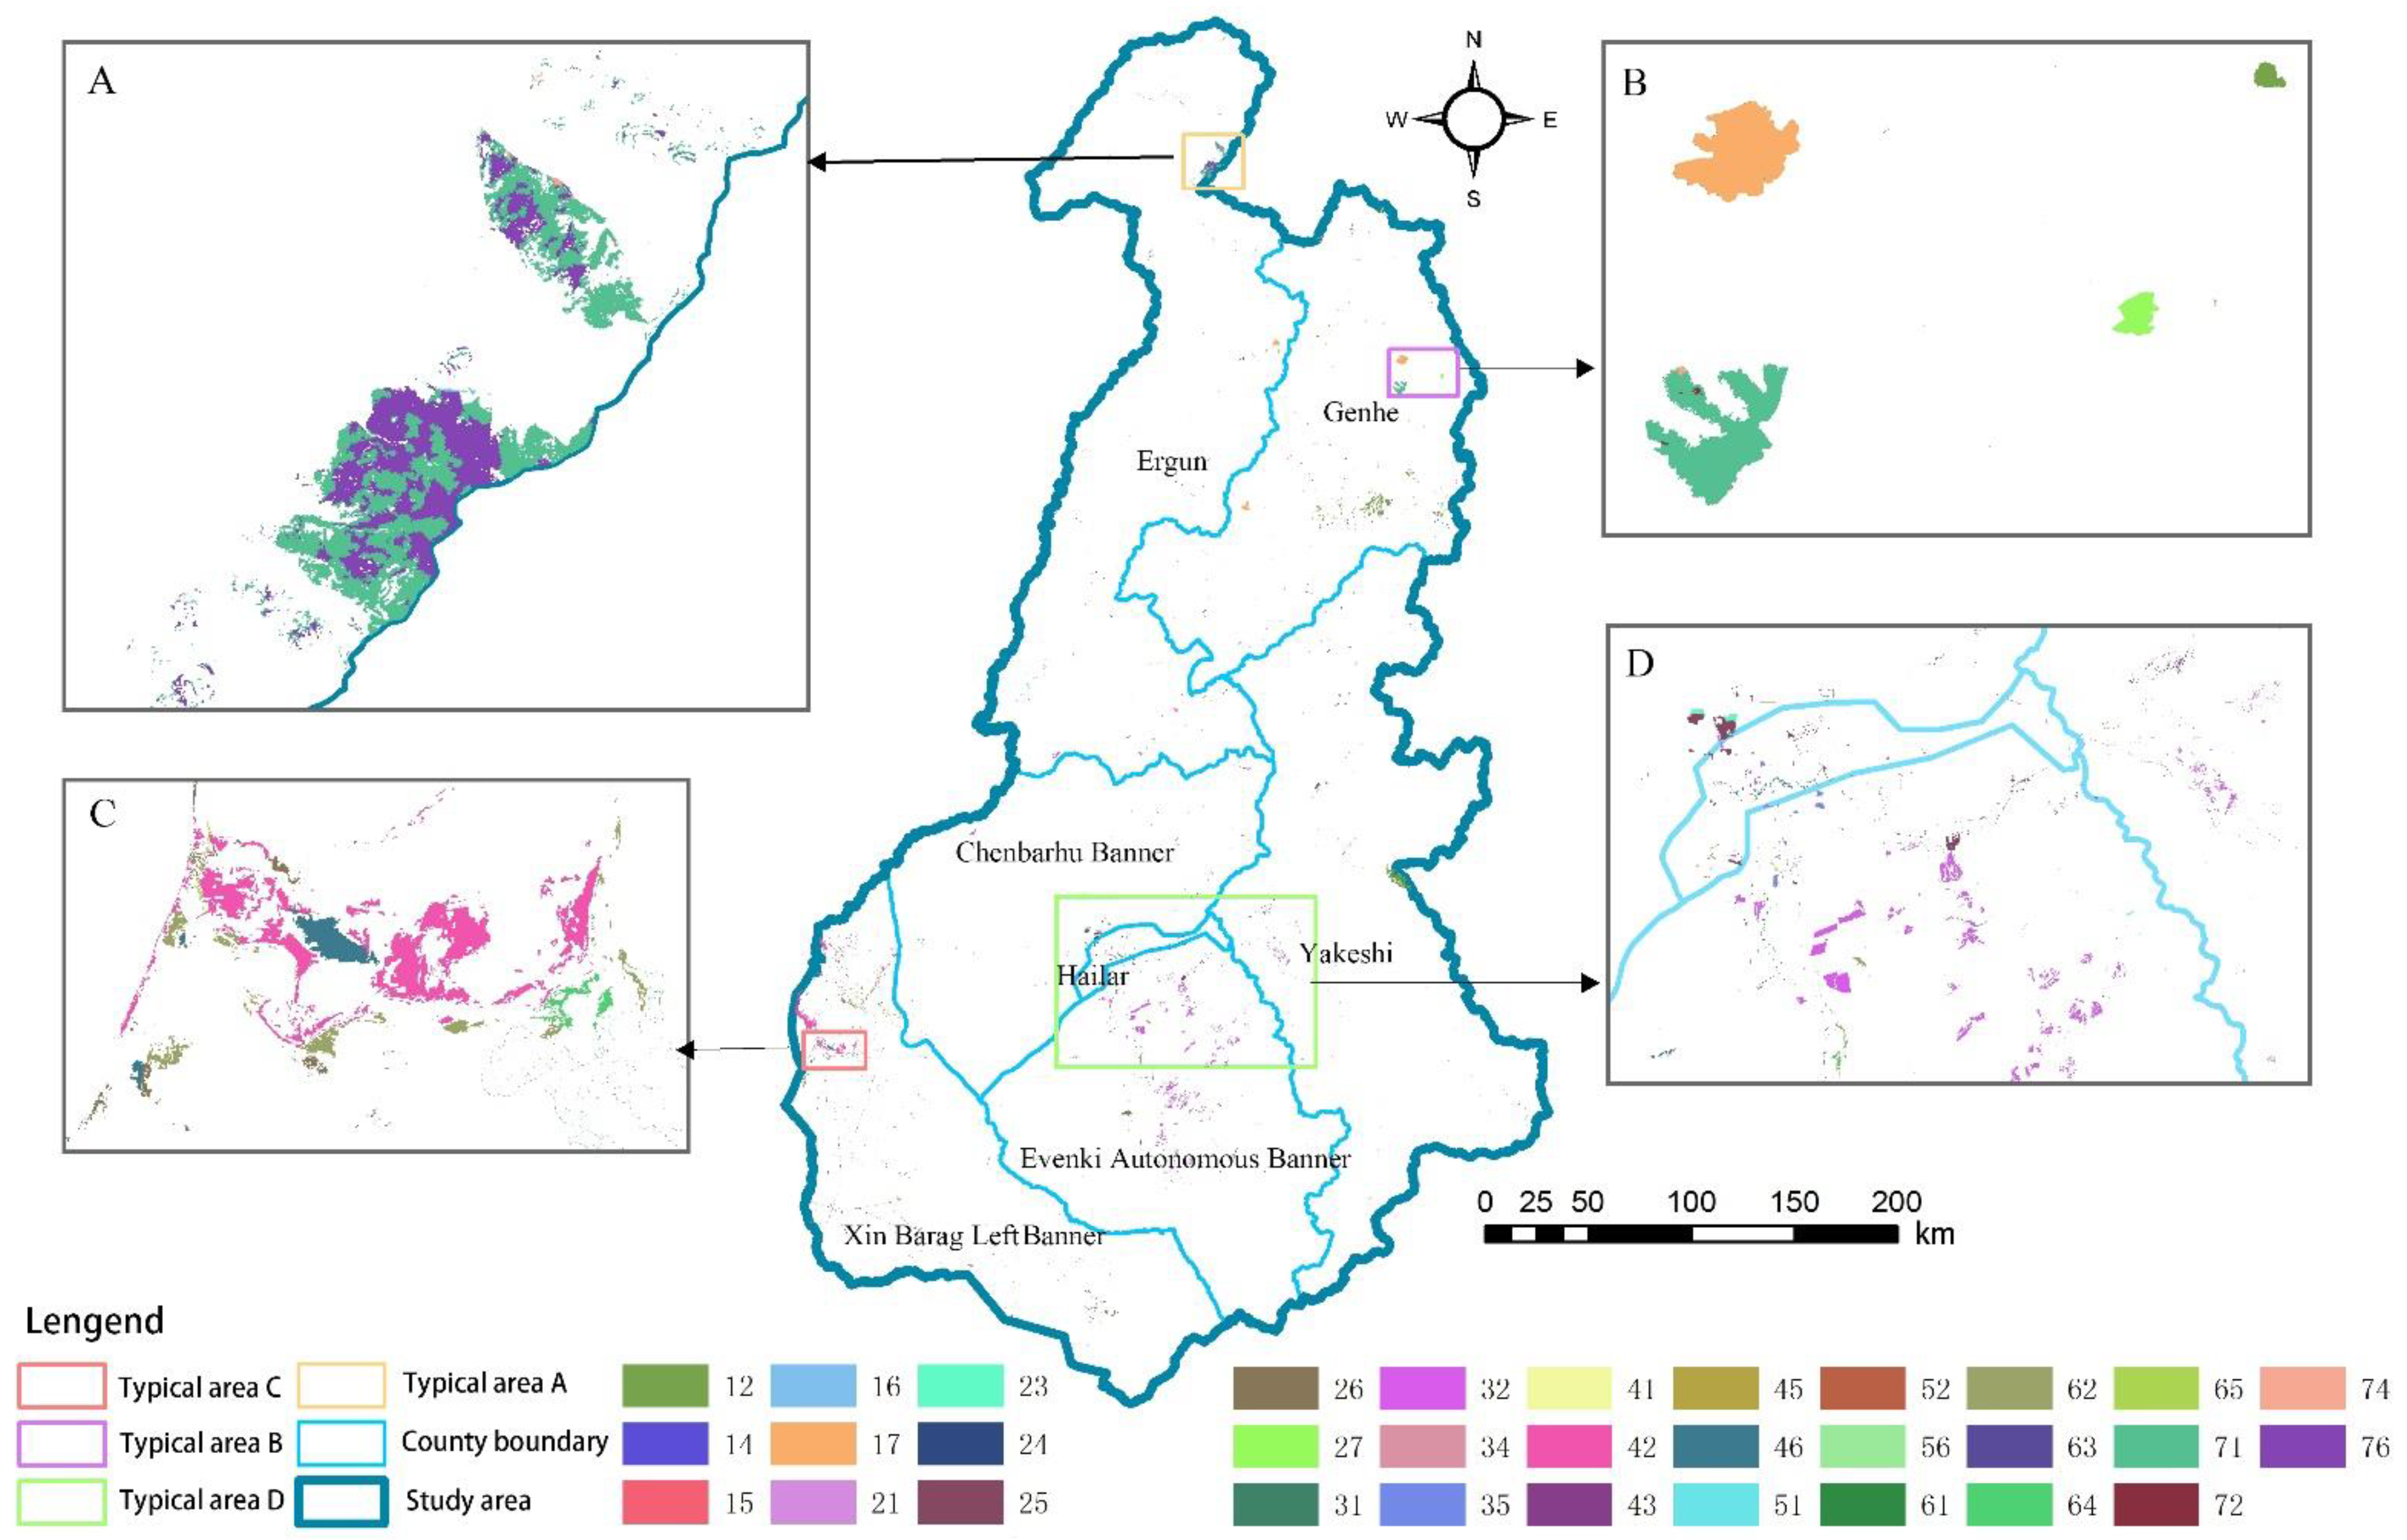
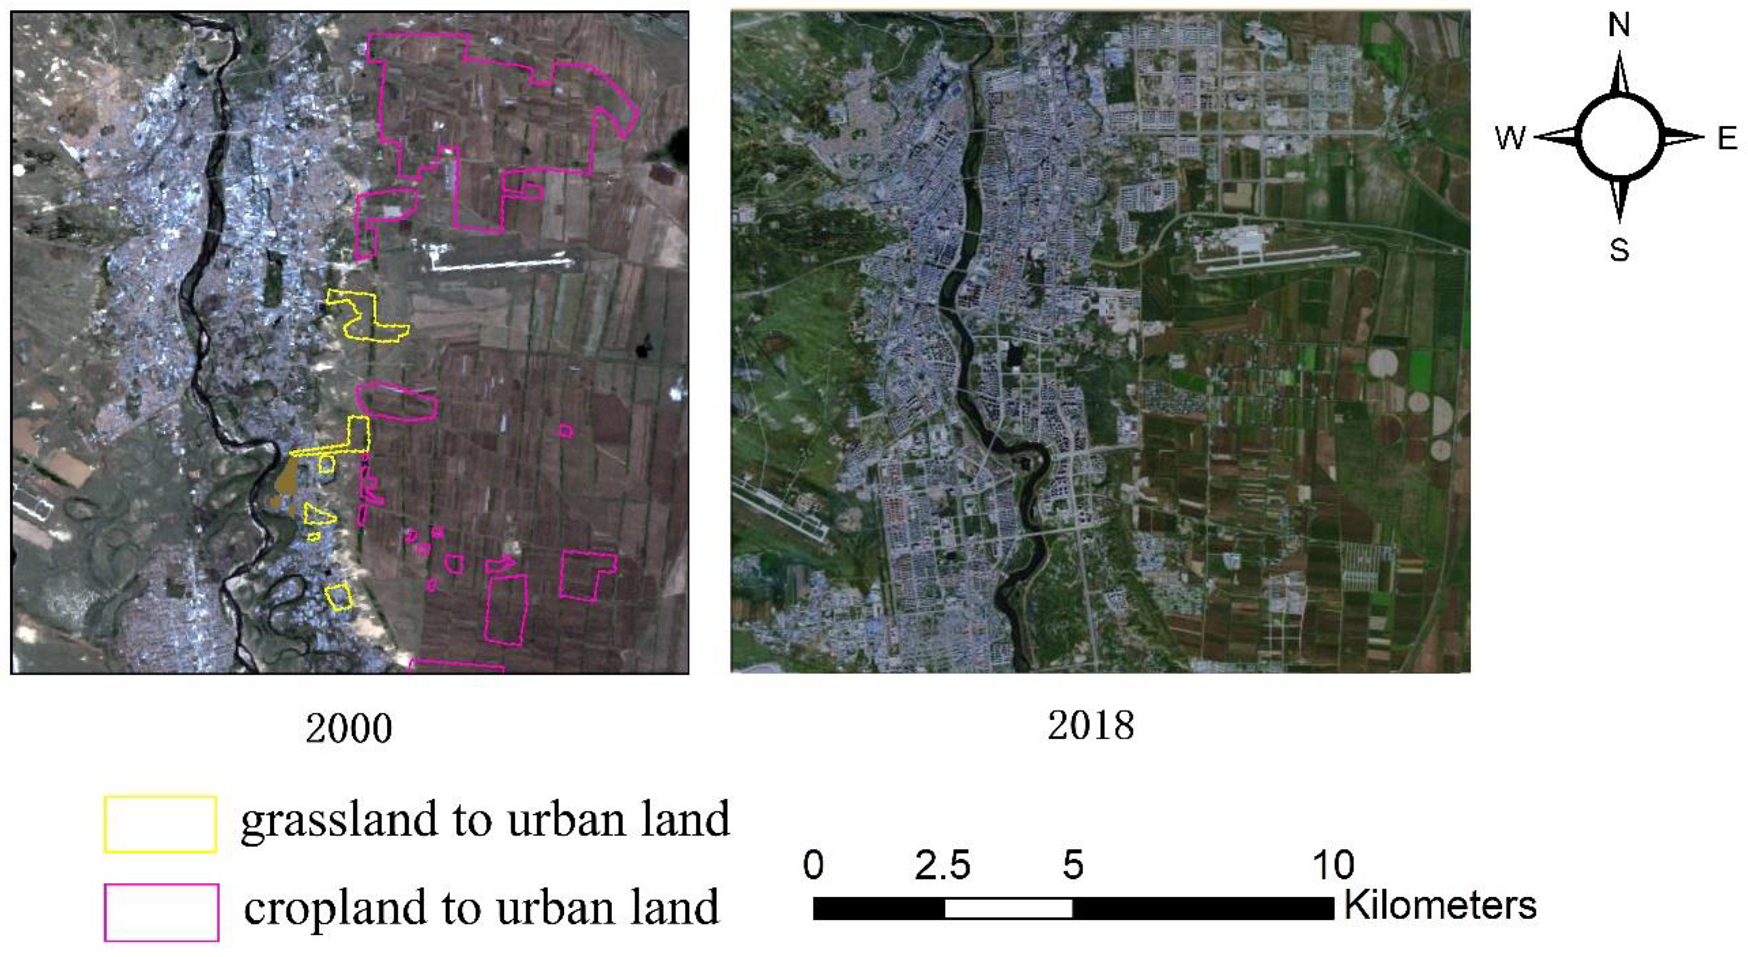
3.2.2. Analysis of Land Cover Conversions
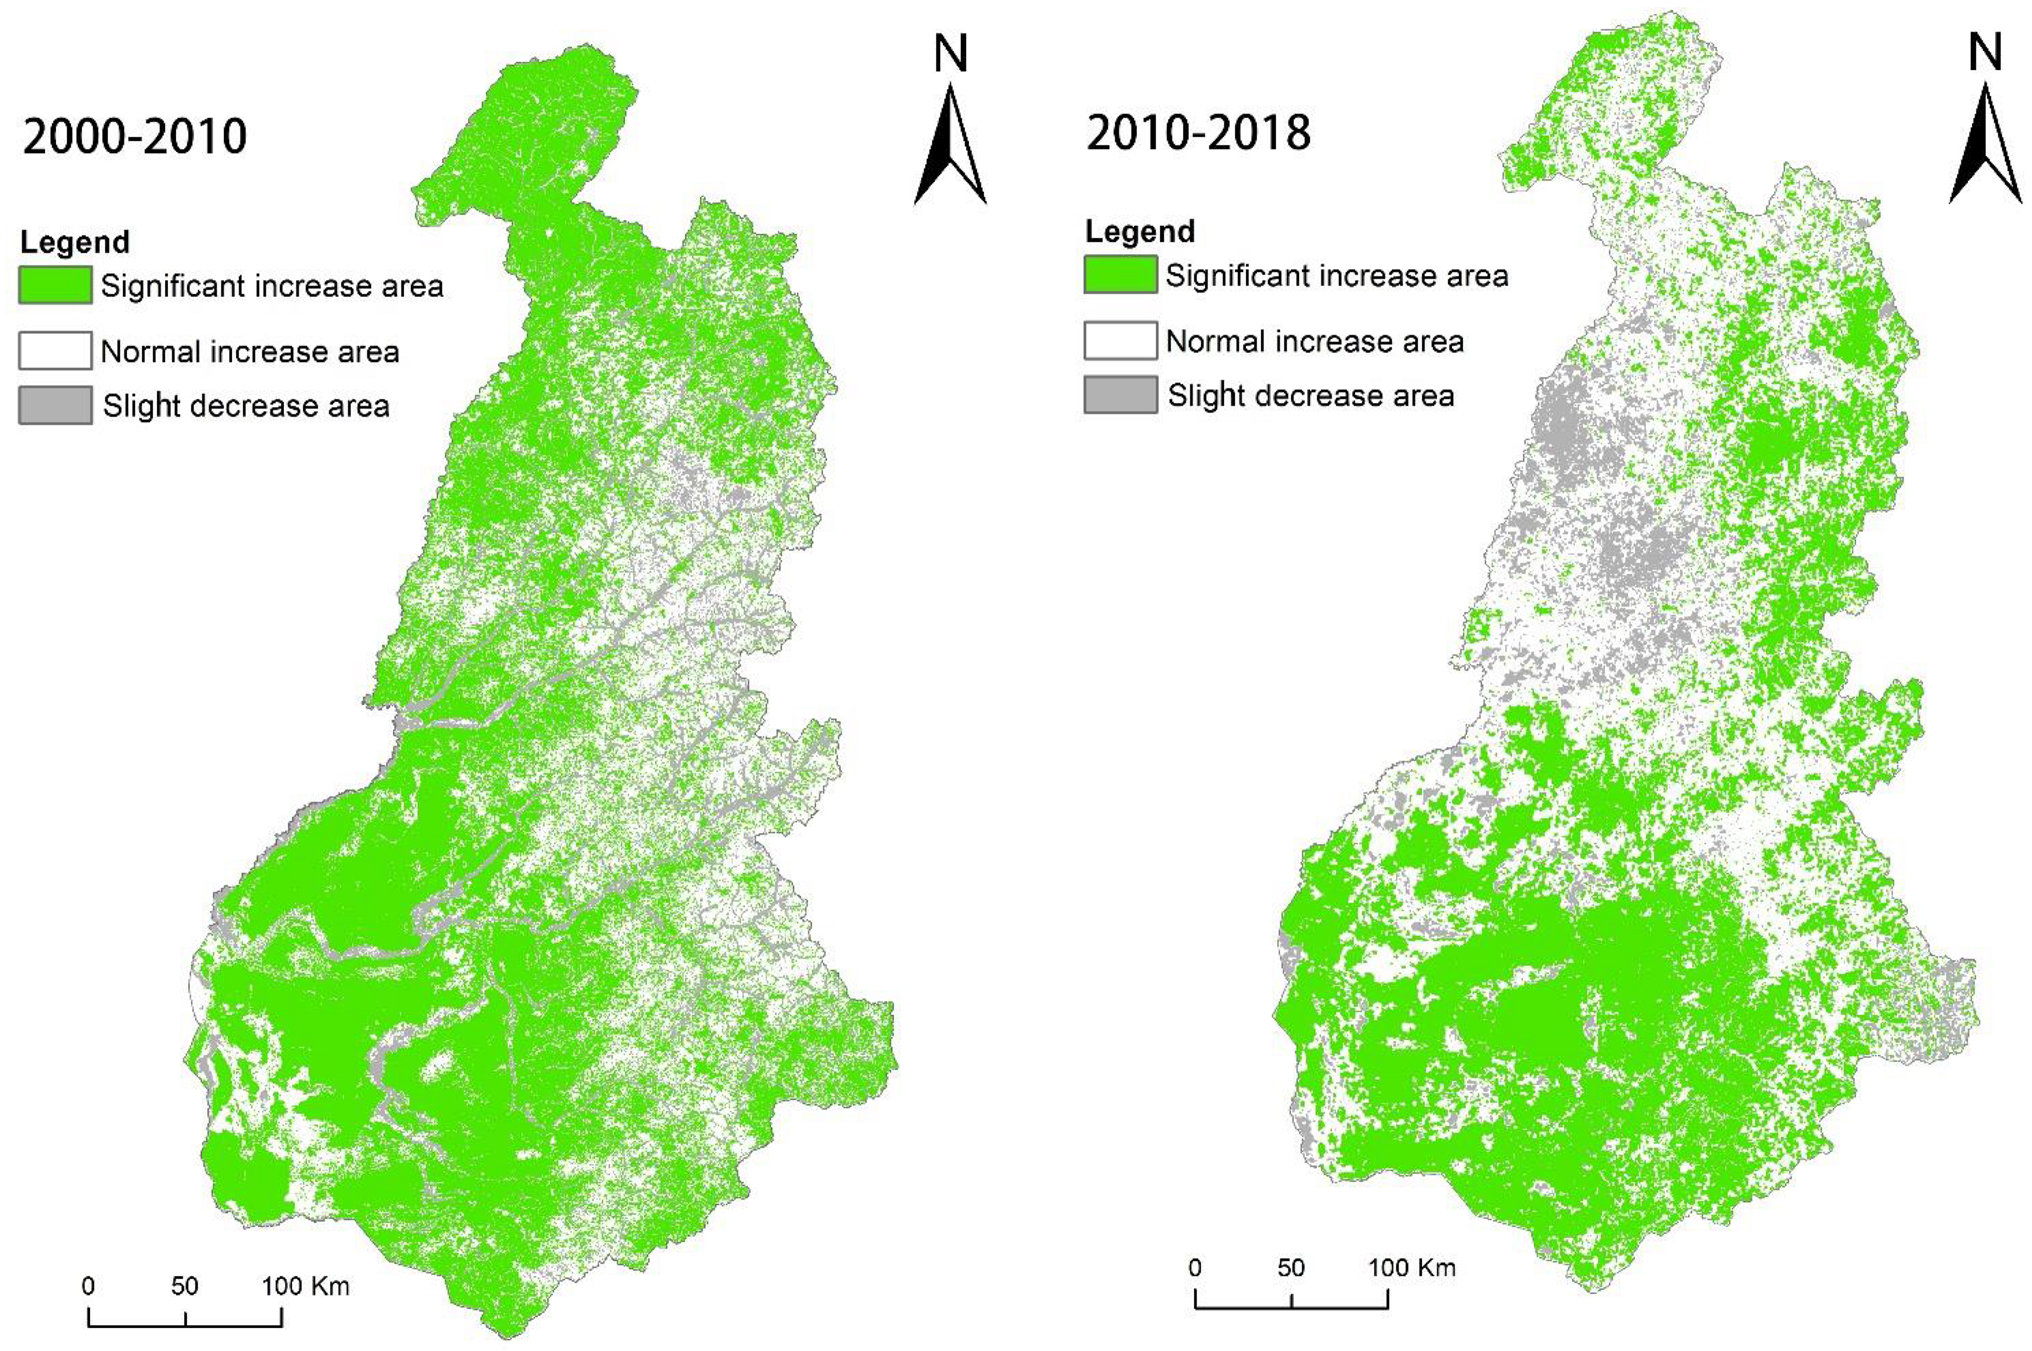
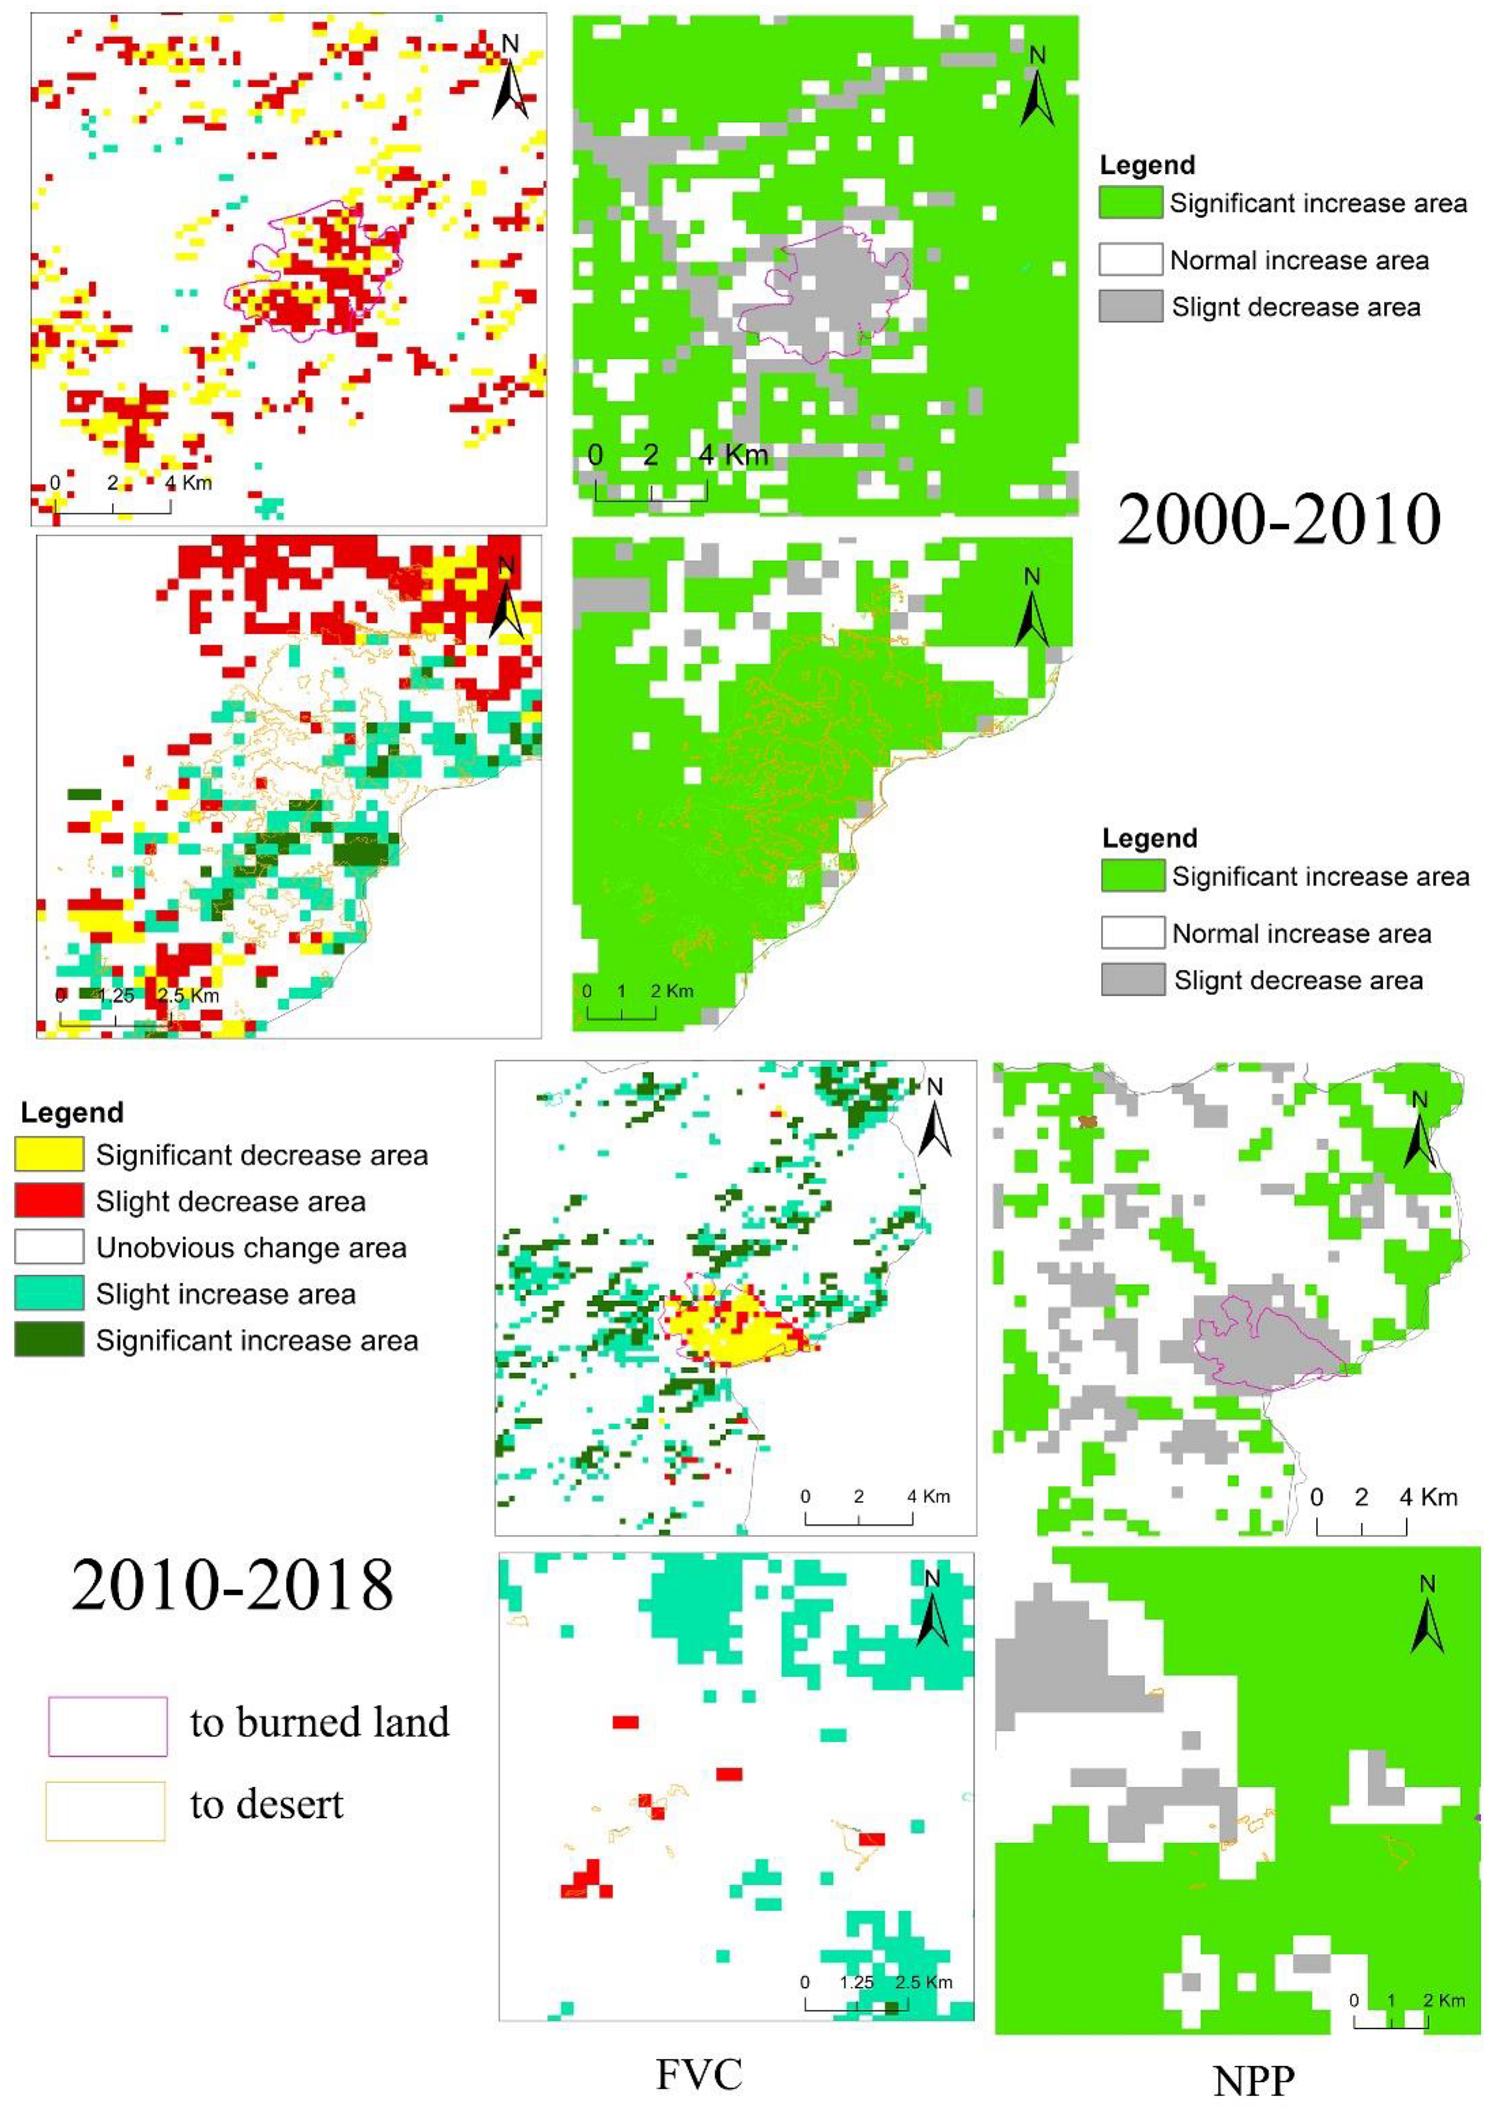
3.3. FVC Change
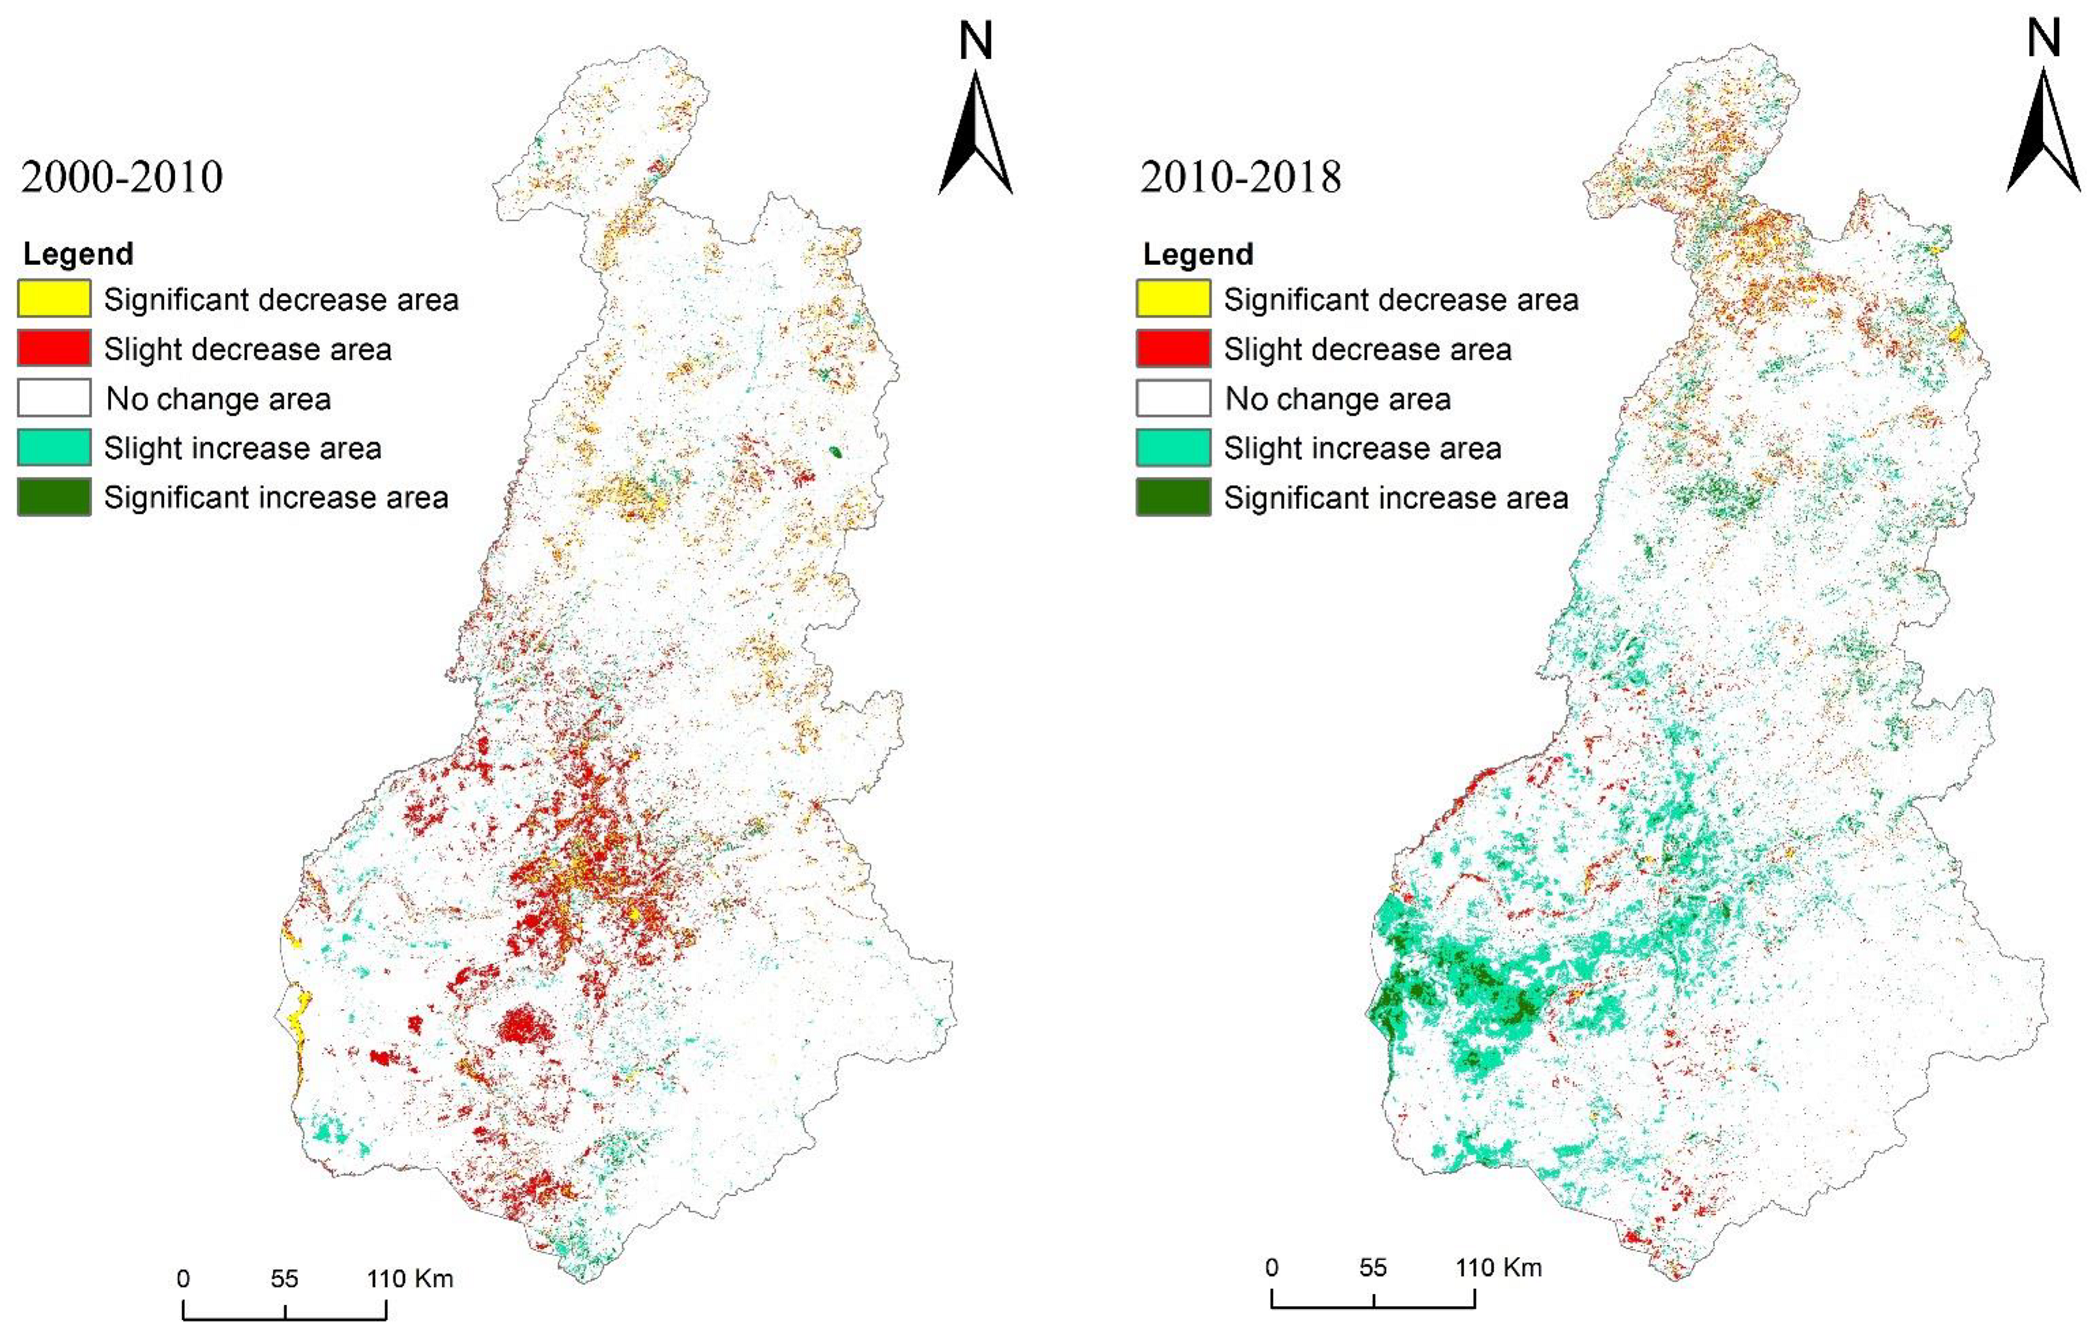
3.4. NPP Change
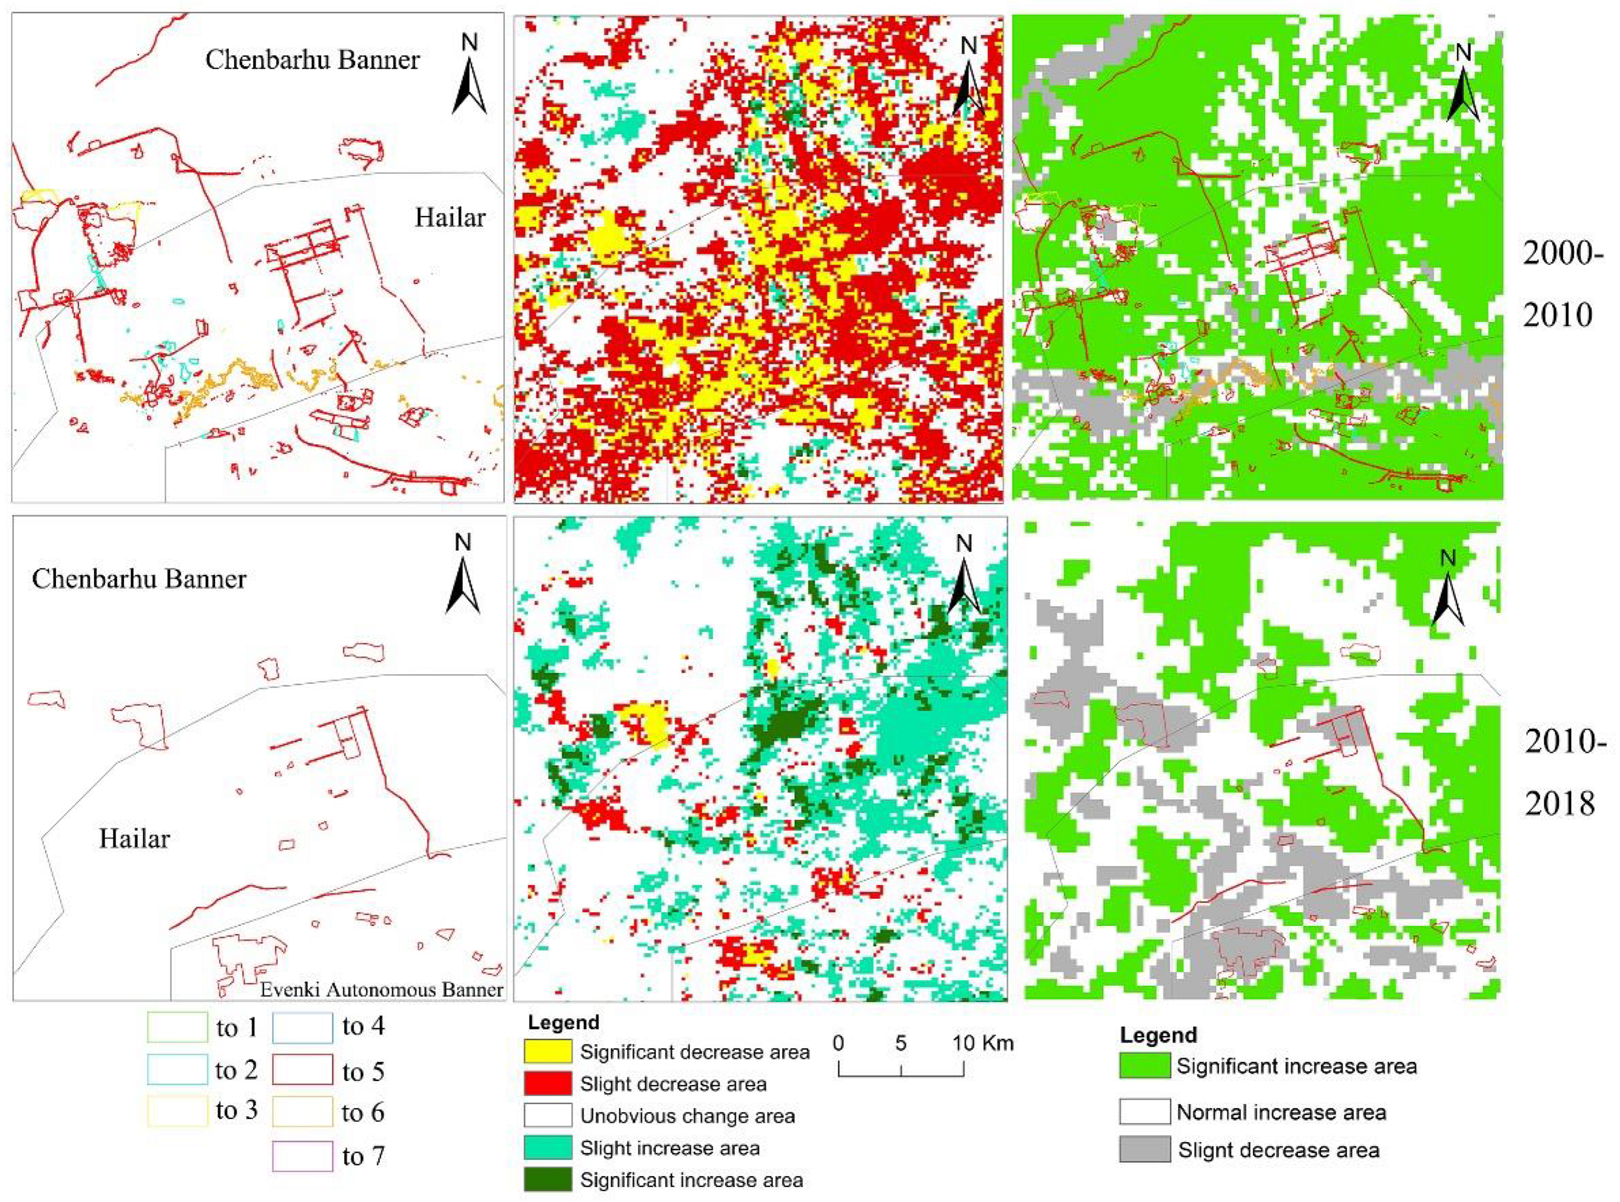
3.5. Spatiotemporal Change in Land Cover and Ecological Quality
4. Discussion
4.1. Management and Policy Implications of Land Cover Change
4.1.1. Strict Enforcement of Forest Fire Prevention and Suppression Regulations and Forest Restoration Schemes in Burned Lands
4.1.2. Increasing the Amount of Cropland Conversion to Grassland
4.1.3. Strengthening Desertification Control
4.1.4. Promoting a Modern Transportation System
4.2. NPP and FVC Change
4.3. Limitations and Challenges
5. Conclusions
Author Contributions
Funding
Institutional Review Board Statement
Informed Consent Statement
Data Availability Statement
Conflicts of Interest
Appendix A

| Classification Map | Forest | Grassland | Farmland | Wetland | Urban Land | Desert | Burned Land | Total | Producer Accuracy |
|---|---|---|---|---|---|---|---|---|---|
| Reference Map | |||||||||
| Forest | 236 | 5 | 0 | 3 | 1 | 0 | 0 | 245 | 96.33% |
| Grassland | 6 | 227 | 5 | 10 | 5 | 2 | 1 | 256 | 88.67% |
| Farmland | 1 | 6 | 92 | 1 | 0 | 0 | 0 | 100 | 92.00% |
| Wetland | 2 | 3 | 1 | 182 | 3 | 6 | 0 | 197 | 92.39% |
| Urban land | 0 | 2 | 0 | 0 | 89 | 0 | 0 | 91 | 97.80% |
| Desert | 0 | 2 | 0 | 0 | 0 | 90 | 0 | 92 | 97.83% |
| Burned land | 0 | 0 | 0 | 0 | 0 | 0 | 19 | 19 | 100% |
| Total | 245 | 245 | 98 | 196 | 98 | 98 | 20 | 1000 | |
| User accuracy | 96.33% | 92.65% | 93.88% | 92.86% | 90.82% | 91.84% | 95.00% | ||
| Overall accuracy 93.50% Kappa coefficient 0.9198 | |||||||||
| Classification Map | Forest | Grassland | Farmland | Wetland | Urban Land | Desert | Burned Land | Total | Producer Accuracy |
|---|---|---|---|---|---|---|---|---|---|
| Reference Map | |||||||||
| Forest | 234 | 4 | 3 | 3 | 2 | 0 | 1 | 247 | 94.74% |
| Grassland | 5 | 229 | 5 | 7 | 6 | 5 | 0 | 257 | 89.10% |
| Farmland | 1 | 4 | 87 | 1 | 0 | 0 | 0 | 93 | 93.55% |
| Wetland | 5 | 2 | 3 | 184 | 2 | 0 | 0 | 196 | 93.88% |
| Urban land | 0 | 1 | 0 | 0 | 88 | 0 | 0 | 89 | 98.88% |
| Desert | 0 | 5 | 0 | 1 | 0 | 93 | 0 | 99 | 93.94% |
| Burned land | 0 | 0 | 0 | 0 | 0 | 0 | 19 | 19 | 100% |
| Total | 245 | 245 | 98 | 196 | 98 | 98 | 20 | 1000 | |
| User accuracy | 95.51% | 93.47% | 88.78% | 93.88% | 89.80% | 94.90% | 95.00% | ||
| Overall accuracy 93.40% Kappa coefficient 0.9156 | |||||||||
| Classification Map | Forest | Grassland | Farmland | Wetland | Urban land | Desert | Burned Land | Total | Producer Accuracy |
|---|---|---|---|---|---|---|---|---|---|
| Reference Map | |||||||||
| Forest | 261 | 6 | 3 | 4 | 0 | 1 | 0 | 275 | 94.91% |
| Grassland | 6 | 201 | 6 | 6 | 1 | 4 | 0 | 224 | 89.73% |
| Farmland | 4 | 3 | 106 | 1 | 1 | 1 | 0 | 116 | 91.38% |
| Wetland | 4 | 3 | 3 | 161 | 1 | 6 | 0 | 178 | 90.45% |
| Urban land | 1 | 2 | 0 | 0 | 71 | 0 | 2 | 76 | 93.42% |
| Desert | 3 | 5 | 1 | 8 | 2 | 87 | 1 | 107 | 81.31% |
| Burned land | 1 | 0 | 1 | 0 | 4 | 1 | 17 | 24 | 70.83% |
| Total | 280 | 220 | 120 | 180 | 80 | 100 | 20 | 1000 | |
| User accuracy | 93.21% | 91.36% | 88.33% | 89.44% | 88.75% | 87.00% | 85.00% | ||
| Overall accuracy 90.40% Kappa coefficient 0.8816 | |||||||||


| Window Number | High-Resolution Images | Study Results | Window Number | High-Resolution Images | Study Results |
|---|---|---|---|---|---|
| 1 | 0.91 | 0.95 | 11 | 0.34 | 0.36 |
| 2 | 0.98 | 0.95 | 12 | 0.89 | 0.90 |
| 3 | 0.91 | 0.96 | 13 | 0.64 | 1.00 |
| 4 | 0.96 | 0.83 | 14 | 1.00 | 0.99 |
| 5 | 0.97 | 0.97 | 15 | 0.66 | 0.99 |
| 6 | 0.98 | 1.00 | 16 | 0.69 | 0.65 |
| 7 | 0.93 | 0.91 | 17 | 0.56 | 0.95 |
| 8 | 0.64 | 0.91 | 18 | 0.77 | 0.95 |
| 9 | 0.61 | 0.66 | 19 | 1.00 | 0.90 |
| 10 | 0.70 | 0.96 | 20 | 0.70 | 0.94 |
| Mean accuracy | 87.23% |
| Window Number | High-Resolution Images | Study Results | Window Number | High-Resolution Images | Study Results |
|---|---|---|---|---|---|
| 1 | 0.99 | 0.96 | 12 | 0.03 | 0.13 |
| 2 | 0.99 | 0.96 | 12 | 0.03 | 0.13 |
| 3 | 1.00 | 0.80 | 13 | 0.81 | 1.00 |
| 4 | 0.93 | 0.93 | 14 | 0.99 | 0.98 |
| 5 | 0.95 | 0.99 | 15 | 0.89 | 1.00 |
| 6 | 0.90 | 0.94 | 16 | 0.77 | 0.68 |
| 7 | 0.98 | 1.00 | 17 | 0.66 | 1.00 |
| 8 | 0.71 | 0.89 | 18 | 0.94 | 1.00 |
| 9 | 0.53 | 0.68 | 19 | 1.00 | 0.96 |
| 10 | 0.90 | 0.34 | 20 | 0.91 | 0.95 |
| Mean accuracy | 88.47% |
| Window Number | High-Resolution Images | Study Results | Window Number | High-Resolution Images | Study Results |
|---|---|---|---|---|---|
| 1 | 0.90 | 0.92 | 11 | 0.50 | 0.53 |
| 2 | 0.94 | 0.98 | 12 | 0.50 | 0.47 |
| 3 | 0.69 | 0.77 | 13 | 0.87 | 0.99 |
| 4 | 0.97 | 0.93 | 14 | 1.00 | 1.00 |
| 5 | 0.96 | 0.80 | 15 | 0.96 | 1.00 |
| 6 | 0.82 | 1.00 | 16 | 0.87 | 0.81 |
| 7 | 0.98 | 0.99 | 17 | 0.87 | 0.97 |
| 8 | 0.74 | 0.89 | 18 | 0.96 | 0.92 |
| 9 | 0.64 | 0.76 | 19 | 1.00 | 0.62 |
| 10 | 1.00 | 1.00 | 20 | 0.93 | 0.98 |
| Mean accuracy | 91.74% |
References
- Chi, W.; Zhao, Y.; Kuang, W.; He, H. Impacts of anthropogenic land use/cover changes on soil wind erosion in China. Sci. Total Environ. 2019, 668, 204–215. [Google Scholar] [CrossRef] [PubMed]
- Niraj, K.C.; Thapa, L.; Shukla, D.P. Fate of agricultural areas of Kailali District of Nepal: A temporal land use land cover change (LUCC) analysis. Int. Arch. Photogramm. Remote Sens. Spat. Inf. Sci —ISPRS 2020, 43, 1601–1606. [Google Scholar] [CrossRef]
- Li, Z.; Sun, Z.; Tian, Y.; Zhong, J.; Yang, W. Impact of land use/cover change on yangtze river delta urban agglomeration ecosystem services value: Temporal-spatial patterns and cold/hot spots ecosystem services value change brought by urbanization. Int. J. Environ. Res. Public Health 2019, 16, 123. [Google Scholar] [CrossRef] [PubMed] [Green Version]
- Msofe, N.K.; Sheng, L.; Li, Z.; Lyimo, J. Impact of land use/cover change on ecosystem service values in the Kilombero valley floodplain, southeastern Tanzania. Forests 2020, 11, 109. [Google Scholar] [CrossRef] [Green Version]
- Huang, J.; Tu, Z.; Lin, J. Land-use dynamics and landscape pattern change in a coastal gulf region, southeast China. Int. J. Sustain. Dev. World Ecol. 2009, 16, 61–66. [Google Scholar] [CrossRef]
- Fan, J.; Wang, Y.; Zhou, Z.; You, N.; Meng, J. Dynamic ecological risk assessment and management of land use in the middle reaches of the heihe river based on landscape patterns and spatial statistics. Sustainability 2016, 8, 536. [Google Scholar] [CrossRef] [Green Version]
- Zhang, J.; Zhu, Y.; Fan, F. Mapping and evaluation of landscape ecological status using geographic indices extracted from remote sensing imagery of the Pearl River Delta, China, between 1998 and 2008. Environ. Earth Sci. 2016, 75, 1–16. [Google Scholar] [CrossRef]
- Ying, X.; Zeng, G.M.; Chen, G.Q.; Tang, L.; Wang, K.L.; Huang, D.Y. Combining AHP with GIS in synthetic evaluation of eco-environment quality—A case study of hunan province, China. Ecol. Modell. 2007, 209, 97–109. [Google Scholar] [CrossRef]
- Tayyebi, A.; Perry, P.C.; Tayyebi, A.H. Predicting the expansion of an urban boundary using spatial logistic regression and hybrid raster-vector routines with remote sensing and GIS. Int. J. Geogr. Inf. Sci. 2014, 28, 639–659. [Google Scholar] [CrossRef]
- Pijanowski, B.C.; Tayyebi, A.; Doucette, J.; Pekin, B.K.; Braun, D.; Plourde, J. A big data urban growth simulation at a national scale: Configuring the GIS and neural network based land transformation model to run in a high performance computing (HPC) environment. Environ. Model. Softw. 2014, 51, 250–268. [Google Scholar] [CrossRef]
- Song, W.; Liu, M. Assessment of decoupling between rural settlement area and rural population in China. Land Use Policy 2014, 39, 331–341. [Google Scholar] [CrossRef]
- Uchida, E.; Xu, J.; Rozelle, S. Grain for green: Cost-effectiveness and sustainability of China’s conservation set-aside program. Land Econ. 2003, 81, 247–264. [Google Scholar] [CrossRef]
- Zhou, J.; Xu, Y.; Gao, Y.; Xie, Z. Land use model research in agro-pastoral ecotone in northern China: A case study of horqin left back banner. J. Environ. Manag. 2019, 237, 139–146. [Google Scholar] [CrossRef]
- Adhikari, A.; Hansen, A.J. Land use change and habitat fragmentation of wildland ecosystems of the North Central United States. Landsc. Urban Plan. 2018, 177, 196–216. [Google Scholar] [CrossRef]
- Hu, Y.; Nacun, B. An analysis of land-use change and grassland degradation from a policy perspective in Inner Mongolia, China, 1990–2015. Sustainability 2018, 10, 4048. [Google Scholar] [CrossRef] [Green Version]
- Loveland, T.R.; Belward, A.S. The igbp-dis global 1km land cover data set, discover: First results. Int. J. Remote Sens. 1997, 18, 3289–3295. [Google Scholar] [CrossRef]
- Hansen, M.C.; Sohlberg, R.; Defries, R.S.; Townshend, J.R.G. Global land cover classification at 1 km spatial resolution using a classification tree approach. Int. J. Remote Sens. 1997, 18, 3289–3295. [Google Scholar] [CrossRef]
- Bartholomé, E.; Belward, A.S. GLC2000: A new approach to global land cover mapping from earth observation data. Int. J. Remote Sens. 2005, 26, 1959–1977. [Google Scholar] [CrossRef]
- Friedl, M.A.; Sulla-Menashe, D.; Tan, B.; Schneider, A.; Ramankutty, N.; Sibley, A.; Huang, X. MODIS Collection 5 global land cover: Algorithm refinements and characterization of new datasets. Remote Sens. Environ. 2010, 114, 168–182. [Google Scholar] [CrossRef]
- Defourny, P.; Vancutsem, C.; Bicheron, C.; Brockmann, C.; Nino, F.; Schouten, L.; Leroy, M. GlobCover: A 300M global land cover product for 2005 using envisat meris time series. using Envisat MERIS time series. In Proceedings of the ISPRS Commission VII Mid-Term Symposium, Remote Sensing from Pixels to Processes, Enschede, The Netherlands, 8–11 May 2006; pp. 8–11. [Google Scholar]
- Jin, S.; Homer, C.; Yang, L.; Danielson, P.; Dewitz, J.; Li, C.; Zhu, Z.; Xian, G.; Howard, D. Overall methodology design for the United States national land cover database 2016 products. Remote Sens. 2019, 11, 2971. [Google Scholar] [CrossRef] [Green Version]
- Gong, P.; Wang, J.; Yu, L.; Zhao, Y.; Zhao, Y.; Liang, L.; Niu, Z.; Huang, X.; Fu, H.; Liu, S.; et al. Finer resolution observation and monitoring of global land cover: First mapping results with Landsat TM and ETM+ data. Int. J. Remote Sens. 2013, 34, 2607–2654. [Google Scholar] [CrossRef] [Green Version]
- Liu, H.; Zhang, Y.; Zhang, X. Monitoring vegetation coverage in tongren from 2000 to 2016 based on landsat7 etm+ and landsat8. An. Acad. Bras. Cienc. 2018, 90, 2721–2730. [Google Scholar] [CrossRef]
- Alton, P.B. Representativeness of global climate and vegetation by carbon-monitoring networks; implications for estimates of gross and net primary productivity at biome and global levels. Agric. For. Meteorol. 2020, 290, 108017. [Google Scholar] [CrossRef]
- Chang, S.; Wang, J.; Zhang, F.; Niu, L.; Wang, Y. A study of the impacts of urban expansion on vegetation primary productivity levels in the Jing-Jin-Ji region, based on nighttime light data. J. Clean. Prod. 2020, 263, 121490. [Google Scholar] [CrossRef]
- Xiao, J.; Moody, A. A comparison of methods for estimating fractional green vegetation cover within a desert-to-upland transition zone in central New Mexico, USA. Remote Sens. Environ. 2005, 98, 237–250. [Google Scholar] [CrossRef]
- Potter, S.; Randerson, T.; Field, B.; Matson, A.; Mooney, H.A. Terrestrial ecosystem production—A process model based on global satellite and surface data. Glob. Biogeochem. Cycles 1993, 7, 811–841. [Google Scholar] [CrossRef]
- Veroustraete, F.; Sabbe, H.; Eerens, H. Estimation of carbon mass fluxes over Europe using the C-fix model and Euroflux data. Remote Sens. Environ. 2002, 83, 376–399. [Google Scholar] [CrossRef]
- Cao, F.; Li, J.; Fu, X.; Wu, G. Impacts of land conversion and management measures on net primary productivity in semi-arid grassland. Ecosyst. Health Sustain. 2020, 6, 6. [Google Scholar] [CrossRef] [Green Version]
- Bao, G.; Tuya, A.; Bayarsaikhan, S.; Dorjsuren, A.; Mandakh, U.; Bao, Y.; Li, C.; Vanchindorj, B. Variations and climate constraints of terrestrial net primary productivity over Mongolia. Quat. Int. 2020, 537, 112–125. [Google Scholar] [CrossRef]
- Gu, Z.; Ju, W.; Li, L.; Li, D.; Liu, Y.; Fan, W. Using vegetation indices and texture measures to estimate vegetation fractional coverage (VFC) of planted and natural forests in Nanjing city, China. Adv. Sp. Res. 2013, 51, 1186–1194. [Google Scholar] [CrossRef]
- Li, S.; Wang, J.; Zhang, M.; Tang, Q. Characterizing and attributing the vegetation coverage changes in North Shanxi coal base of China from 1987 to 2020. Resour. Policy 2021, 74, 102331. [Google Scholar] [CrossRef]
- Zhang, L.; Qiao, N.; Hasan, M.; Baig, A.; Huang, C.; Lv, X. Monitoring vegetation dynamics using the universal normalized vegetation index (UNVI): An optimized vegetation index-VIUPD. Remote Sens. Lett. 2019, 10, 629–638. [Google Scholar] [CrossRef]
- Wang, R.; Yan, F.; Wang, Y. Vegetation growth status and topographic effects in the pisha sandstone area of China. Remote Sens. 2020, 12, 2759. [Google Scholar] [CrossRef]
- Li, P.; He, Z.; He, D.; Xue, D.; Wang, Y.; Cao, S. Fractional vegetation coverage response to climatic factors based on grey relational analysis during the 2000-2017 growing season in Sichuan Province, China. Int. J. Remote Sens. 2020, 41, 1170–1190. [Google Scholar] [CrossRef]
- Gong, P.; Chen, B.; Li, X.; Liu, H.; Wang, J.; Bai, Y.; Chen, J.; Chen, X.; Fang, L.; Feng, S.; et al. Mapping essential urban land use categories in China (EULUC-China): Preliminary results for 2018. Sci. Bull. 2020, 65, 182–187. [Google Scholar] [CrossRef] [Green Version]
- Bayr, U.; Puschmann, O. Automatic detection of woody vegetation in repeat landscape photographs using a convolutional neural network. Ecol. Inform. 2019, 50, 220–233. [Google Scholar] [CrossRef]
- Gong, P.; Liu, H.; Zhang, M.; Li, C.; Wang, J.; Huang, H.; Clinton, N.; Ji, L.; Li, W.; Bai, Y.; et al. Stable classification with limited sample: Transferring a 30-m resolution sample set collected in 2015 to mapping 10-m resolution global land cover in 2017. Sci. Bull. 2019, 64, 370–373. [Google Scholar] [CrossRef] [Green Version]
- Litjens, G.; Kooi, T.; Bejnordi, B.E.; Setio, A.A.A.; Ciompi, F.; Ghafoorian, M.; van der Laak, J.A.W.M.; van Ginneken, B.; Sánchez, C.I. A survey on deep learning in medical image analysis. Med. Image Anal. 2017, 42, 60–88. [Google Scholar] [CrossRef] [Green Version]
- Krizhevsky, B.A.; Sutskever, I.; Hinton, G.E. ImageNet classification with deep convolutional neural networks. Commun. ACM 2017, 60, 84–90. [Google Scholar] [CrossRef]
- Unnikrishnan, A.; Sowmya, V.; Soman, K.P. Deep alexnet with reduced number of trainable parameters for satellite image classification. Procedia Comput. Sci. 2018, 143, 931–938. [Google Scholar] [CrossRef]
- Blaschke, T. Object based image analysis for remote sensing. ISPRS J. Photogramm. Remote Sens. 2010, 65, 2–16. [Google Scholar] [CrossRef] [Green Version]
- Chen, Y.; Qiang, Z.; Chen, X.; Liu, X. Classifition of land use scenarios based on find-tuing convolution naturel network. Remote Sens. Inf. 2019, 34, 70–77. [Google Scholar]
- Koju, U.A.; Zhang, J.; Maharjan, S.; Bai, Y.; Zhang, S.; Yao, F. Analysis of spatiotemporal dynamics of forest net primary productivity of Nepal during 2000–2015. Int. J. Remote Sens. 2020, 41, 4336–4364. [Google Scholar] [CrossRef]
- Jin, H.; Bao, G.; Chen, J.; Chopping, M.; Jin, E.; Mandakh, U.; Jiang, K.; Huang, X.; Bao, Y.; Vandansambuu, B. Modifying the maximal light-use efficiency for enhancing predictions of vegetation net primary productivity on the Mongolian Plateau. Int. J. Remote Sens. 2020, 41, 3740–3760. [Google Scholar] [CrossRef]
- Li, J.; Zhou, K.; Chen, F. Drought severity classification based on threshold level method and drought effects on NPP. Theor. Appl. Climatol. 2020, 142, 675–686. [Google Scholar] [CrossRef]
- Pei, Y.; Huang, J.; Wang, L.; Chi, H.; Zhao, Y. An improved phenology-based CASA model for estimating net primary production of forest in central China based on Landsat images. Int. J. Remote Sens. 2018, 39, 7664–7692. [Google Scholar] [CrossRef]
- Zhu, W.; Pan, Y.; He, H.; Yu, D.; Hu, H. Simulation of maximum light use efficiency for some typical vegetation types in China. Chin. Sci. Bull. 2006, 51, 457–463. [Google Scholar] [CrossRef]
- Boyd, D.S.; Foody, G.M.; Ripple, W.J. Evaluation of approaches for forest cover estimation in the Pacific Northwest, USA, using remote sensing. Appl. Geogr. 2002, 22, 375–392. [Google Scholar] [CrossRef]
- Liu, Q.; Zhang, T.; Li, Y.; Li, Y.; Bu, C.; Zhang, Q. Comparative analysis of fractional vegetation cover estimation based on multi-sensor data in a semi-arid sandy area. Chin. Geogr. Sci. 2019, 29, 166–180. [Google Scholar] [CrossRef] [Green Version]
- Gitelson, A.A.; Stark, R.; Rundquist, D.; Gitelson, A.A.; Kaufman, Y.J.; Stark, R.; Rundquist, D. Novel algorithms for remote estimation of vegetation fraction. Remote Sens. Environ. 2002, 80, 76–87. [Google Scholar] [CrossRef] [Green Version]
- Jia, K.; Li, Y.; Liang, S.; Wei, X.; Yao, Y. Combining estimation of green vegetation fraction in an arid region from Landsat 7 ETM+ data. Remote Sens. 2017, 9, 1121. [Google Scholar] [CrossRef] [Green Version]
- Jing, Y.; Zhang, F.; He, Y.; Kung, H.T.; Johnson, V.C.; Arikena, M. Assessment of spatial and temporal variation of ecological environment quality in Ebinur lake Wetland National Nature Reserve, Xinjiang, China. Ecol. Indic. 2020, 110, 105874. [Google Scholar] [CrossRef]
- Rihan, W.; Zhao, J.; Zhang, H.; Guo, X.; Ying, H.; Deng, G.; Li, H. Wildfires on the Mongolian Plateau: Identifying drivers and spatial distributions to predict wildfire probability. Remote Sens. 2019, 11, 2361. [Google Scholar] [CrossRef] [Green Version]
- Gao, Q.; Schwartz, M.W.; Zhu, W.; Wan, Y.; Qin, X.; Ma, X.; Liu, S.; Williamson, M.A.; Peters, C.B.; Li, Y. Changes in global grassland productivity during 1982 to 2011 attributable to climatic factors. Remote Sens. 2016, 8, 384. [Google Scholar] [CrossRef] [Green Version]
- Bao, G.; Liu, Y.; Liu, N.; Linderholm, H.W. Drought variability in eastern Mongolian Plateau and its linkages to the large-scale climate forcing. Clim. Dyn. 2015, 44, 717–733. [Google Scholar] [CrossRef]
- Wang, R.; Yang, L. The research of livestock carrying capacity of rangeland ecosystem in HulunBuir. Adv. Mater. Res. 2012, 365, 110–114. [Google Scholar] [CrossRef]
- Fang, H.; Fan, Z. Assessment of soil erosion at multiple spatial scales following land use changes in 1980–2017 in the black soil region, (NE) China. Int. J. Environ. Res. Public Health 2020, 17, 7378. [Google Scholar] [CrossRef]
- Na, R.; Du, H.; Na, L.; Shan, Y.; He, H.S.; Wu, Z.; Zong, S.; Yang, Y.; Huang, L. Spatiotemporal changes in the Aeolian desertification of Hulunbuir Grassland and its driving factors in China during 1980–2015. Catena 2019, 182, 104123. [Google Scholar] [CrossRef]
- Hao, L.; Sun, G.; Liu, Y.; Gao, Z.; He, J.; Shi, T.; Wu, B. Effects of precipitation on grassland ecosystem restoration under grazing exclusion in Inner Mongolia, China. Landsc. Ecol. 2014, 29, 1657–1673. [Google Scholar] [CrossRef]
- Wang, Y.; Zhang, J.; Tong, S.; Guo, E. Monitoring the trends of aeolian desertified lands based on time-series remote sensing data in the Horqin Sandy Land, China. Catena 2017, 157, 286–298. [Google Scholar] [CrossRef]
- Wang, Z.; Wang, Z.; Zhang, B.; Lu, C.; Ren, C. Landscape dynamics in Hulunbuir Grassland of China. In Proceedings of the International Conference on Remote Sensing, Environment and Transportation Engineering (RSETE), Nanjing, China, 316–319., 26–28 July 2013; pp. 316–319. [Google Scholar] [CrossRef]
- Wang, Z.; Zhong, J.; Lan, H.; Wang, Z.; Sha, Z. Association analysis between spatiotemporal variation of net primary productivity and its driving factors in inner mongolia, china during 1994–2013. Ecol. Indic. 2019, 105, 355–364. [Google Scholar] [CrossRef]
- Gupta, K.; Kumar, P.; Pathan, S.K.; Sharma, K.P. Urban neighborhood green index—A measure of green spaces in urban areas. Landsc. Urban Plan. 2012, 105, 325–335. [Google Scholar] [CrossRef]
- Sun, C.M.; Zhong, X.C.; Chen, C.; Gu, T.; Chen, W. Evaluating the grassland net primary productivity of southern China from 2000 to 2011 using a new climate productivity model. J. Integr. Agric. 2016, 15, 1638–1644. [Google Scholar] [CrossRef] [Green Version]
- Zhao, Y.; Liu, H.; Zhang, A.; Cui, X.; Zhao, A. Spatiotemporal variations and its influencing factors of grassland net primary productivity in Inner Mongolia, China during the period 2000–2014. J. Arid Environ. 2019, 165, 106–118. [Google Scholar] [CrossRef]
- Chen, Y.; Gao, J.; Feng, C.; Jia, X. Temporal and spatial distribution of vegetation net primary productivity (NPP) in the Years from 1982 to 2010 in Hulunbeier. J. Ecol. Rural Environ. 2012, 8, 647–653. [Google Scholar]
- Mao, D.; Wang, Z.; Wu, C.; Song, K.; Ren, C. Examining forest net primary productivity dynamics and driving forces in northeastern China during 1982–2010. Chin. Geogr. Sci. 2014, 24, 631–646. [Google Scholar] [CrossRef] [Green Version]
- Cao, X.; Wang, J.; Gao, Z.; Ning, J.; Shi, R.; Gao, W. Study on spatio-temporal vegetation cover changes based on MODIS NDVI data in the Mongolian Plateau, 2000–2012. Remote Sens. Model. Ecosyst. Sustain. X 2013, 8869, 88690Z. [Google Scholar] [CrossRef]
- Wei, X.; Wang, S.; Wang, Y. Spatial and temporal change of fractional vegetation cover in North-western China from 2000 to 2010. Geol. J. 2018, 53, 427–434. [Google Scholar] [CrossRef] [Green Version]
- Peng, F.; Fan, W.; Xu, X.; Liu, X. Analysis on temporal-spatial change of vegetation coverage in hulunbuir steppe (2000–2014). Presented at the IEEE International Geoscience and Remote Sensing Symposium (IGARSS). Beijing Daxue Xuebao (Ziran Kexue Ban) 2017, 53, 563–572. [Google Scholar] [CrossRef]
- Li, F.; Chen, W.; Zeng, Y.; Zhao, Q.; Wu, B. Improving estimates of grassland fractional vegetation cover based on a pixel dichotomy model: A case study in Inner Mongolia, China. Remote Sens. 2014, 6, 4705–4722. [Google Scholar] [CrossRef] [Green Version]
- Peng, S.; Piao, S.; CIAIS, P.; Fang, J.; Wang, X. Change in winter snow depth and its impacts on vegetation in China. Glob. Change Biol. 2010, 16, 3004–3013. [Google Scholar] [CrossRef]
- Liu, H.; Ma, L. Spatial pattern and effects of urban coordinated development in China’s urbanization. Sustainability 2020, 12, 2389. [Google Scholar] [CrossRef] [Green Version]
- Wang, Q.; Li, Y.; Luo, G. Spatiotemporal change characteristics and driving mechanism of slope cultivated land transition in karst trough valley area of Guizhou Province, China. Environ. Earth Sci. 2020, 79, 1–18. [Google Scholar] [CrossRef]
- Wolfe, S.A.; Hugenholtz, C.H. Barchan dunes stabilized under recent climate warming on the northern Great Plains. Geology 2009, 37, 1039–1042. [Google Scholar] [CrossRef]
- Liu, J.; Kuang, W.; Zhang, Z.; Xu, X.; Qin, Y.; Ning, J.; Zhou, W.; Zhang, S.; Li, R.; Yan, C.; et al. Spatiotemporal characteristics, patterns, and causes of land-use changes in China since the late 1980s. J. Geogr. Sci. 2014, 24, 195–210. [Google Scholar] [CrossRef]


| Types | 2000 | 2010 | 2018 | |||
|---|---|---|---|---|---|---|
| Area (hm2) | Proportion | Area (hm2) | Proportion | Area (hm2) | Proportion | |
| Forest | 6,302,993.31 | 46.96% | 6,289,026.12 | 46.85% | 6,284,566.53 | 46.82% |
| Grassland | 4,205,763.9 | 31.33% | 4,233,760.38 | 31.54% | 4,237,231.05 | 31.57% |
| Farmland | 693,927.63 | 5.17% | 671,471.73 | 5.00% | 667,805.49 | 4.98% |
| Wetland | 1,783,646.19 | 13.29% | 1,770,893.19 | 13.19% | 1,769,975.55 | 13.19% |
| Urban land | 148,534.83 | 1.11% | 170,261.55 | 1.27% | 180,543.42 | 1.35% |
| Desert | 278,190.27 | 2.07% | 281,807.19 | 2.10% | 280,257.48 | 2.09% |
| Burned land | 9397.53 | 0.07% | 5233.5 | 0.04% | 2074.14 | 0.02% |
| 2018 | Forest | Grassland | Farmland | Wetland | Urban Land | Desert | Burned Land | Total 2018 |
|---|---|---|---|---|---|---|---|---|
| 2000 | ||||||||
| Forest | 18,856.17 | 0.00 | 1887.84 | 3215.07 | 46.26 | 2057.13 | 26,062.47 | |
| Grassland | 279.63 | 711.18 | 0.00 | 17,870.31 | 6067.89 | 0.27 | 24,929.28 | |
| Farmland | 263.61 | 20,098.71 | 993.69 | 7041.87 | 0.00 | 0.00 | 28,397.88 | |
| Wetland | 558.90 | 10,834.11 | 1514.61 | 3090.06 | 1913.31 | 0.00 | 17,910.99 | |
| Urban land | 4.59 | 22.50 | 0.63 | 4.95 | 14.49 | 0.00 | 47.16 | |
| Desert | 172.08 | 5979.60 | 49.05 | 1285.92 | 837.00 | 0.00 | 8323.65 | |
| Burned land | 6356.88 | 604.98 | 0.27 | 68.31 | 1.44 | 2348.91 | 9380.79 | |
| Total 2000 | 7635.69 | 56,396.07 | 2275.74 | 4240.71 | 32,055.75 | 10,390.86 | 2057.4 | 115,052.22 |
| 2010 | Forest | Grassland | Farmland | Wetland | Urban Land | Desert | Burned Land |
|---|---|---|---|---|---|---|---|
| 2000 | |||||||
| Forest | 13,242.87 | 0.09 | 1882.62 | 1194.75 | 57.69 | 4342.23 | |
| Grassland | 157.77 | 736.92 | 10.26 | 8569.35 | 7492.86 | 354.96 | |
| Farmland | 265.86 | 20,171.43 | 1018.62 | 2816.82 | 0.00 | 0.00 | |
| Wetland | 570.51 | 10,859.49 | 1458.90 | 778.32 | 1978.11 | 0.00 | |
| Urban land | 15.30 | 2.70 | 0.00 | 0.09 | 24.66 | 0.00 | |
| Desert | 36.72 | 6362.01 | 50.40 | 1814.67 | 795.51 | 0.00 | |
| Burned land | 6324.39 | 118.08 | 0.27 | 68.40 | 1.44 | 2349.00 |
| 2018 | Forest | Grassland | Farmland | Wetland | Urban Land | Desert | Burned Land |
|---|---|---|---|---|---|---|---|
| 2000 | |||||||
| Forest | 1338.03 | 0.00 | 21.60 | 1273.95 | 0.00 | 2043.36 | |
| Grassland | 0.00 | 325.89 | 0.00 | 2740.32 | 91.08 | 0.00 | |
| Farmland | 0.00 | 0.00 | 0.00 | 4035.42 | 0.00 | 0.00 | |
| Wetland | 0.00 | 0.00 | 63.18 | 928.17 | 0.00 | 0.00 | |
| Urban land | 0.00 | 23.13 | 0.00 | 0.09 | 0.00 | 0.00 | |
| Desert | 277.20 | 381.42 | 0.00 | 54.72 | 909.54 | 0.00 | |
| Burned land | 46.17 | 5156.28 | 0.00 | 0.00 | 0.00 | 0.00 |
| 2010 | Very Low Cover | Low Cover | Medium Cover | High Cover | Very High Cover |
|---|---|---|---|---|---|
| 2000 | |||||
| Very low cover | 211,768.80 | 12,550.00 | 5843.75 | 7125.00 | |
| Low cover | 266,343.80 | 146,987.50 | 28,206.25 | 14,856.25 | |
| Medium cover | 51,987.50 | 439,612.50 | 120,962.50 | 45,006.25 | |
| High cover | 19,850.00 | 110,731.30 | 431,000.00 | 499,775.00 | |
| Very higher cover | 56,225.00 | 48,900.00 | 240,943.80 | 837,293.80 |
| Year | Total (gC) | Mean (gC·m−2) | Maximum (gC·m−2) |
|---|---|---|---|
| 2000 | 215,545,376 | 401.58 | 689.37 |
| 2010 | 285,986,592 | 532.85 | 835.06 |
| 2018 | 320,556,992 | 597.44 | 1002.11 |
Publisher’s Note: MDPI stays neutral with regard to jurisdictional claims in published maps and institutional affiliations. |
© 2022 by the authors. Licensee MDPI, Basel, Switzerland. This article is an open access article distributed under the terms and conditions of the Creative Commons Attribution (CC BY) license (https://creativecommons.org/licenses/by/4.0/).
Share and Cite
Shi, F.; Liu, M.; Qiu, J.; Zhang, Y.; Su, H.; Mao, X.; Li, X.; Fan, J.; Chen, J.; Lv, Y.; et al. Assessing Land Cover and Ecological Quality Changes in the Forest-Steppe Ecotone of the Greater Khingan Mountains, Northeast China, from Landsat and MODIS Observations from 2000 to 2018. Remote Sens. 2022, 14, 725. https://doi.org/10.3390/rs14030725
Shi F, Liu M, Qiu J, Zhang Y, Su H, Mao X, Li X, Fan J, Chen J, Lv Y, et al. Assessing Land Cover and Ecological Quality Changes in the Forest-Steppe Ecotone of the Greater Khingan Mountains, Northeast China, from Landsat and MODIS Observations from 2000 to 2018. Remote Sensing. 2022; 14(3):725. https://doi.org/10.3390/rs14030725
Chicago/Turabian StyleShi, Fang, Mingxing Liu, Jie Qiu, Yali Zhang, Huiyi Su, Xupeng Mao, Xin Li, Jiahui Fan, Junsong Chen, Yingying Lv, and et al. 2022. "Assessing Land Cover and Ecological Quality Changes in the Forest-Steppe Ecotone of the Greater Khingan Mountains, Northeast China, from Landsat and MODIS Observations from 2000 to 2018" Remote Sensing 14, no. 3: 725. https://doi.org/10.3390/rs14030725
APA StyleShi, F., Liu, M., Qiu, J., Zhang, Y., Su, H., Mao, X., Li, X., Fan, J., Chen, J., Lv, Y., Xu, W., Wang, Z., & Li, M. (2022). Assessing Land Cover and Ecological Quality Changes in the Forest-Steppe Ecotone of the Greater Khingan Mountains, Northeast China, from Landsat and MODIS Observations from 2000 to 2018. Remote Sensing, 14(3), 725. https://doi.org/10.3390/rs14030725