Article

Monitoring Post-Flood Recovery of Croplands Using the Integrated Sentinel-1/2 Imagery in the Yangtze-Huai River Basin

1
Department of Earth System Science, Ministry of Education Key Laboratory for Earth System Modeling, Institute for Global Change Studies, Tsinghua University, Beijing 100084, China
2
Ministry of Education Ecological Field Station for East Asian Migratory Birds, Beijing 100084, China
*
Author to whom correspondence should be addressed.
Remote Sens. 2022, 14(3), 690; https://doi.org/10.3390/rs14030690
Submission received: 13 December 2021 / Revised: 22 January 2022 / Accepted: 28 January 2022 / Published: 1 February 2022
(This article belongs to the Special Issue Advances in Remote Sensing for Crop Monitoring and Yield Estimation)

Abstract

:
The increasingly frequent flooding imposes tremendous and long-lasting damages to lives and properties in impoverished rural areas. Rapid, accurate, and large-scale flood mapping is urgently needed for flood management, and to date has been successfully implemented benefiting from the advancement in remote sensing and cloud computing technology. Yet, the effects of agricultural emergency response to floods have been limitedly evaluated by satellite-based remote sensing, resulting in biased post-flood loss assessments. Addressing this challenge, this study presents a method for monitoring post-flood agricultural recovery using Sentinel-1/2 imagery, tested in three flood-affected main grain production areas, in the middle and lower Yangtze and Huai River, China. Our results indicated that 33~72% of the affected croplands were replanted and avoided total crop failures in summer 2020. Elevation, flood duration, crop rotation scheme, and flooding emergency management affect the post-flood recovery performance. The findings also demonstrate rapid intervention measures adjusted to local conditions could reduce the agricultural failure cost from flood disasters to a great extent. This study provides a new alternative for comprehensive disaster loss assessment in flood-prone agricultural regions, which will be insightful for worldwide flood control and management.

1. Introduction

The increasing extreme weather in the context of global climate change has posed severe threats to the function of living environments and the health of humans [1]. Among these threats, floods have become the most common type accounting for 44% of natural disasters and affecting 1.6 billion people globally from 2000 to 2019 [2]. In addition to the increased proportion of the population exposed to floods [3], agricultural production activities tend to be another relatively vulnerable sector in response to damaging floods. For example, the United Nations reported that 70% of global rain-fed agriculture and 1.3 billion people relying on arable lands are exposed to the threats of shifting rainfall patterns and larger precipitation variability [2]. The impact of flooding on crop yield varies dependent on flood characteristics (i.e., frequency, duration, depth, seasonality), crop types (tolerance of excess water and anaerobic soil conditions), and emergency activities [4]. Apart from fluvial flooding, flash floods primarily caused by heavy rain events are more dangerous as they occur suddenly and hinder early warning and emergency response. Coastal flooding may cause similar scale and immediate property damage, while the influence of salt deposition from seawater on agricultural soils could be persistent for years. In Asia, the primary crop growing season such as rice, highly overlap with the monsoon season, resulting in serious storm-related crop loss in extensive vulnerable floodplains [5], for example, in Bangladesh [6,7], Cambodia [8], Thailand [9] and China [10], etc. Without effective strategies to respond to the increasingly frequent flood disasters, the goal of poverty eradication and food safety becomes difficult to achieve.
Satellite remote sensing provides a spatially and temporally explicit framework for detecting flood extent [6,11,12,13,14], measuring flooding severity [15,16,17], and assessing flooding hazard and post-flood loss and recovery [18,19]. Among them, extensive studies have been working in remote sensing-based water body extraction [14,20,21,22,23,24,25] since it is the basis of flood monitoring and management. Compared with other applications requiring water extraction techniques such as wetland mapping [26,27,28] and coastline extraction [29,30,31]), flood detection confronts more challenges, including cloudy and rainy weather conditions. Beyond that, a flood occurs suddenly in general, and the flood recession process varies under the control of rainfall and surface conditions. Observations with a long revisit period would overlook short-lived flooding and lead to underestimating the hazard level. Thus, the higher spatial and temporal resolution of satellite observations is pivotal in flood monitoring.
Two types of satellite data primarily map the inundation area, the synthetic aperture radar (SAR) images and optical sensor images [3,17]. The active microwave remote sensing displays its advantage with the character of working day and night and passing through clouds in flood monitoring. SAR-derived information including backscatter intensity, polarimetric parameters, and interferometric coherence, is commonly used for water inundation classification [21]. Optical sensor is more often used in pre- or post-disaster flood extent extraction due to cloud contaminations [3]. Besides, its ample spectral information enables identifying flood-affected land cover types. Methods of flood extent extraction can be categorized into pixel- and object-based, or from other perspectives, into supervised and unsupervised approaches [21]. Traditional segmentation methods such as thresholding, edge detection, active contour model and region growing always use specific bands (i.e., VV and VH) or water indices (i.e., NDWI, MNDWI) to extract water body. Most of these methods require parameter selection which is particularly complicated and uncertain for time-serious monitoring of rapidly changing flood extent. In recent years, machine learning (ML) techniques (i.e., the Random Forest Classifier, the Support Vector Machine) have been applied in flood monitoring [11,32] with the benefit of combining multi-source features. Also, deep learning (DL, i.e., Convolutional Neural Network) is increasingly developed in this field to achieve rapid and more accurate flood mapping without data annotation [33,34]. However, the computation cost and efficiency remain concerns for large-scale flood detection. There are also amounts of research integrating digital elevation data into hydrodynamic or conceptual models to predict flood inundation [35]. In a data-rich environment, the integration of high spatial resolution imagery with flood inundation modelling allows robust and temporally consistent flood propagation simulations. In addition, remote sensing products including land cover datasets, global surface water [36], cropping intensity maps [37], and social media data [38] are also important auxiliary information for flood detection and subsequent hazard assessment. Adequately combing data from both Radar and optical systems and other “Big Data” systems is of great potential in future flood assessment [3].
There are a wide range of remote sensing applications centered on flooding mapping. At a global scale, the UNU-INWEH developed the World Flood Mapping Tool based on the Google Earth Engine with decades of Landsat data since 1985, which provides the first comprehensive historical flooding information globally [39]. The automatic near real-time flood detection software using Suomi-NPP/VIIRS data has been running routinely since 2014 [40]. These map products including daily products and post-processed 5-day composite flood extent datasets at the 375 m resolution, are updated routinely, supporting monitoring global outburst flood. Nardi et al. [41] published a global high-resolution dataset of Earth’s flood plain at a 250 m resolution with the Shuttle Radar Topography Mission (SRTM) digital terrain model using the geomorphic algorithm GFPLAIN [42,43]. Such maps can support large-scale risk management studies, including assessing human exposure to potential flooding [41] and categorizing flood insurance levels for different human settlement areas. Several attempts have been made to reveal large-scale annual and interannual flooding patterns for some flood-prone areas such as the Mekong Delta and the Ganges Delta [6,7,44]. In addition, many studies focus on specific extreme flood events at local scales [16,17,32]. With abundant flooding products derived from space observations, understanding detailed flooding progress and human reactions to natural disasters is insufficient and more pressing.
In rural areas which inhabit more poor households and exist large-scale fertile farmlands, the flooding condition is highly correlated with dwellers’ livelihood and food security. Although remote sensing data have been applied on crop loss assessment [45], the contributions of adaptation measures such as rush planting have been limitedly considered. At present, flood crop loss assessment could be categorized into the flood-intensity-based approach and crop-condition-based approach. For the flood-based methods, most researches stimulate flood conditions (i.e., inundation depth) and evaluate crop loss using flood damage functions [45]. In this way, the natural ability of crops to withstand floods is the preoccupation. The crop-condition-based approach is mainly achieved by comparing pre- and post-flood vegetation conditions and establishing relations between vegetation index and crop yield. Similarly, researchers hardly take account of the phenomenon that Vegetation Index (VI) profiles decrease followed by the subsequent increase in the disaster year. To date, few researchers apply remote sensing technology to highlight the effects of rapid post-flood recovery activities initiatively conducted by local residents, which is indispensable for comprehensive damage evaluation.
In the 2020 summer monsoon season, the unusually heavy and continuous precipitation caused extensive flooding in many Asian countries, resulting in serious losses of lives and properties [46]. According to the Ministry of Emergency Management of the People’s Republic of China, the 2020 flood season in southern China has been recognized as the most severe flood situation since 1998. July’s heavy rainfall and flooding event in the Yangtze and Huai River basins, which affected 34.173 million people in 11 provinces and caused 132.2 billion yuan economic losses, has been officially selected as one of the top 10 natural disasters in China 2020. As important grain-cultivating areas in southern China, Yangtze-Huai River basin were exposed to immense pressure in agricultural production. Nevertheless, local residents and agricultural technicians implemented active and timely remedial measures adjusting to different types of flooded croplands. Hence the flooding disaster losses were successfully mitigated [47].
In this paper, we proposed a method by combining SAR and optical imaging to detect flood-affected cropland and monitor spontaneous agricultural recovery during and after the flooding disasters. Specifically, we chose three experimental sites in Jiangxi and Anhui Province which were seriously affected by the 2020 summer flood to test the proposed methodology pipeline, with the aim to answer the following scientific questions: (1) What is the spatial distribution of flood-affected croplands during the 2020 monsoon season? (2) how to determine the timing and extent of recovered agricultural productions? and (3) what are differences in local characteristics between recovered and unrecovered agricultural productions?

2. Study Area and Data
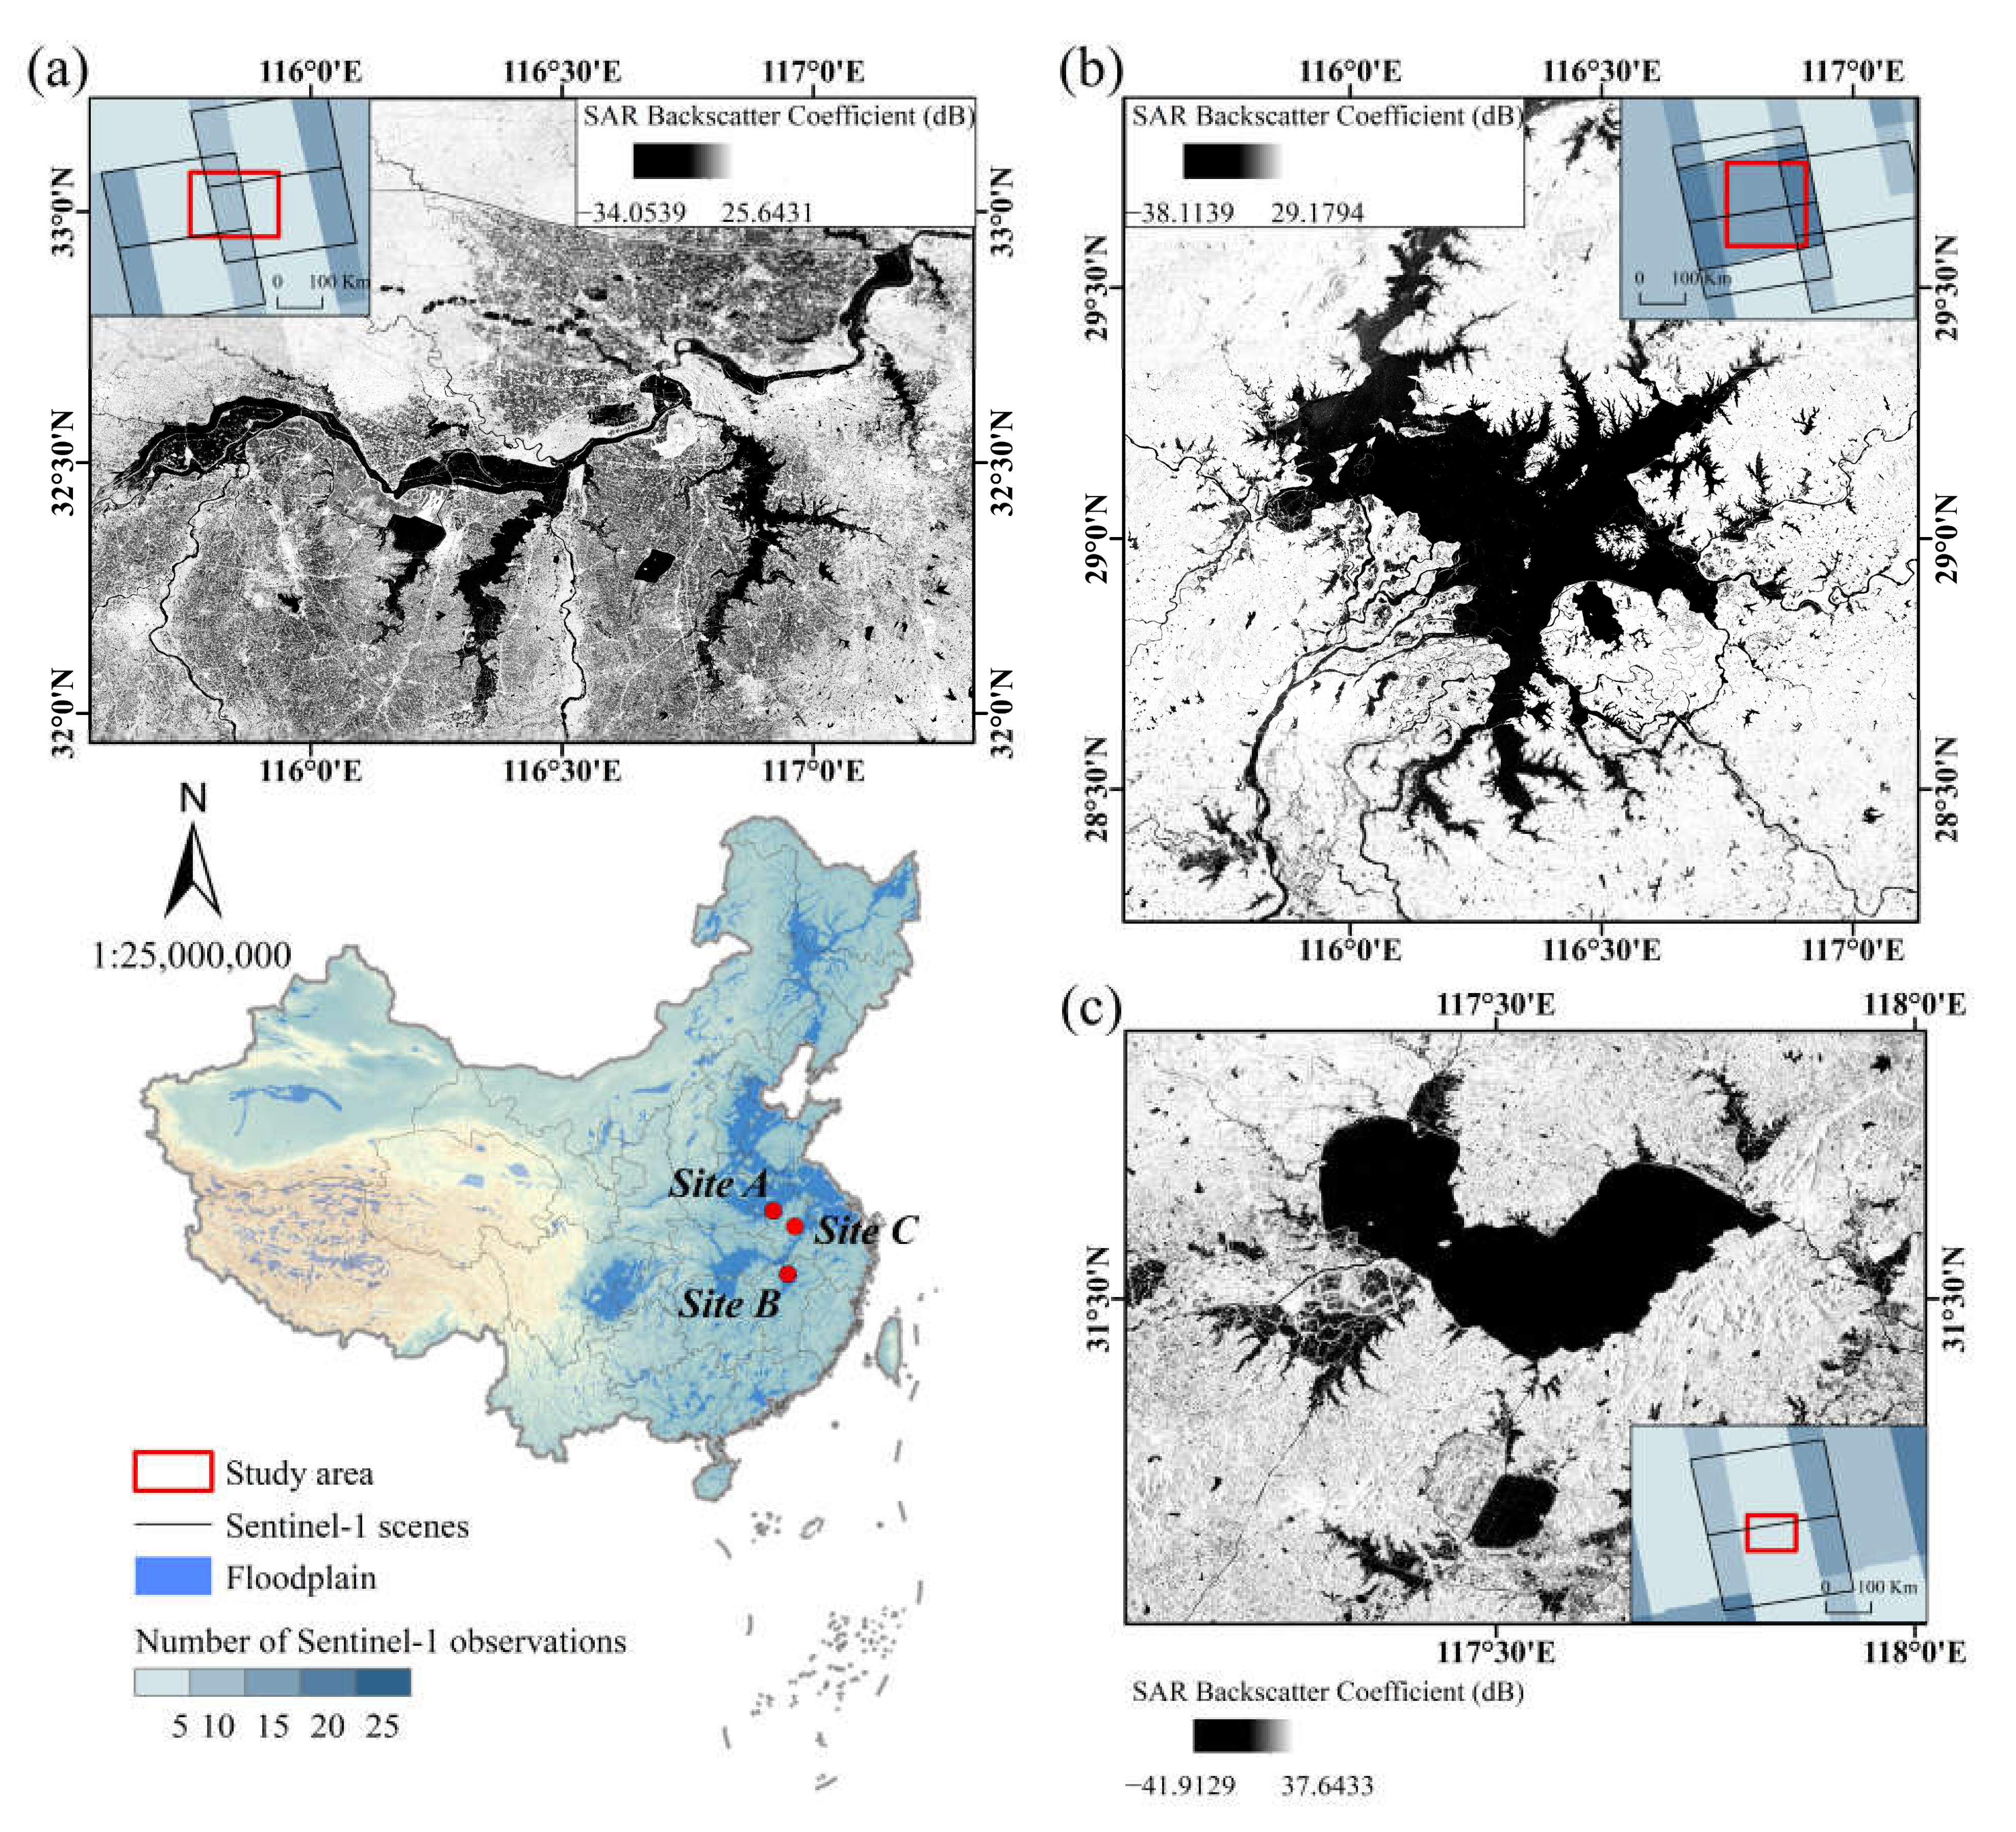
2.1. Study Area

We focused on three regions with diverse natural environments and social functions, including the Huai River, the Poyang Lake, and the Chao Lake. These three sites were all exposed to severe flooding and experienced flood emergency management and post-disaster agriculture recovery. The geographic position, the flood extent, and the number of available observations captured by Sentinel-1 during the 2020 flooding period (July to August) are presented in Figure 1.
The Huai River region (Figure 1a) is highly populated with croplands covering around 70% of the study site. In the 2020 monsoon season, the rainfall along the Huai River exceeds 33% compared with the same period last year. Eight flood retention areas along the Huai River were used by turn in late July. The Poyang Lake (Figure 1b) is the biggest freshwater lake in China. Situated in the Jiangxi Province, it relieves flood discharge pressure of the Yangtze River and regulates the surrounding five river systems. Benefitting from abundant water resources, moderate climate, and fertile soils, the Poyang Lake region is one of southern China’s most intensified agricultural regions [48]. In 2020, the flood season of the middle and upper reaches of the Yangtze River began simultaneously. The rainfall in Jiangxi Province was more than three times over former years, causing severe agricultural losses. The Chao Lake (Figure 1c) is situated in Hefei City, the provincial capital of Anhui Province. Intensive population, artery traffic, and infrastructure surround the lake. The Chao Lake reaches a 150-year return period high water level in the 2020 monsoon season due to the heavy rainfall, synchronously high water level in the Yangtze River and surrounding rivers, and lacking flood detention areas.
Geo-tagged photographs (Figure 2) taken during a field investigation in the Sanjiao Township show different cropland statuses about two months after the flooding. Situated at the west of the Poyang Lake, the Sanjiao Township is one of the most seriously affected areas. Over 20,000 people were evacuated and nearly all crops failed because of dikes broken in early July. Not until late August did some residents could turn back and rebuilt their homes. The crops hanging on the electric transmission lines (Figure 2a) and watermarks on the building walls (Figure 2d) recorded high water levels during the flood period. Cropland across the river in Figure 2b shows patches of crops near high embankment have markedly turned green and recovered from the flooding. In contrast, lands in Figure 2a and left side of Figure 2d were still in varying degrees of waterlogging. Additionally, there were also some farmlands in the initial stage of recovery during the ground survey (Figure 2c and right side of Figure 2d).

2.2. Data and Processing

2.2.1. Sentinel-1 Imagery and Pre-Processing

Launched by European Space Agency (ESA), Sentinel-1 is an imaging radar mission with twin polar-orbiting satellites (Sentinel-1A/B), providing all-weather, day-and-night imagery at C-band with four-mode data combinations [49]. We selected imagery of the primary operational mode over land, the Interferometric Wide swath (IW) mode, provided in dual-polarization, vertical transmit and vertical receive (VV), and vertical transmit and horizontal receive (VH). It features a wide swath (250 km) with high geometric resolutions suitable for flood detection. We obtained the 10 m pixel spacing Ground Range Detected (GRD) Level-1 data with multi-looked intensity pre-processed, mainly including thermal noise removal, radiometric calibration, and terrain correction on Google Earth Engine (GEE). The final terrain-corrected values are converted to decibels [50].
The Sentinel-1 data in this study was mainly used for flood mapping. Images were selected according to the flood peak period separately in the three areas to extract the maximum flood extent (Table S1). Further, all available Sentinel-1 images in July and August 2020 were used for agricultural recovery assessment. The number of Sentinel-1 observations in each site is shown in Figure 1. In this study, the VV polarized data was chosen for its advantages in detecting floods [6,51]. A median filter with a 50 m radius circle kernel was applied to reduce speckle noises.

2.2.2. Sentinel-2 Imagery and Pre-Processing

Sentinel-2 is a European high-resolution and multi-spectral imaging mission with twin satellites flying in the same orbit and providing a high revisit frequency of 5 days at the Equator [52]. In this study, we used Bottom-Of-Atmosphere (BOA) Level-2A product from 15 September to 31 December 2020, to detect the post-disaster agricultural reconstruction. We first filtered out granules with cloudy pixel percentages greater than 50% and then removed poor-quality surface reflectance values for the left Sentinel-2 archive using the quality assessment (QA) information. The Normalized Difference Vegetation Index (NDVI) and Enhanced Vegetation Index (EVI) were calculated from the retained values for each pixel. We further merged the vegetation indexes and spectral bands (i.e., blue, red, green, near-infrared, and short-wave infrared bands) to derive the cloud-free greenest post-disaster Sentinel-2 composite.

2.2.3. Cropping Intensity Maps

In this paper, we used the 30 m global Cropping Intensity (CI) Maps during 2016–2018 [37] to identify cropland extent, map recovery conditions and analyze the influence of flooding and timely agricultural recovery measurements on CI in China 2020. We assumed no drastic changes in rotations and cropland areas in the three study regions during the past few years. The dataset was downloaded from the National Earth System Science Data Center, National Science & Technology Infrastructure of China [53]. It was developed with the reconstructed time series of Normalized Difference Vegetation Index (NDVI) from multiple optical satellite data, including Landsat, Sentinel-2, and MODIS on the GEE cloud computing platform [37]. The cropland extent of interest was based on Global Food Security-support Analysis Data at a 30 m resolution (GFSAD30) and also refined by incorporating an ensemble of three other global land cover products [37]. The satisfactory overall accuracy (OA) of the provided CI Maps reached from 80.0% to 98.9% across different regions worldwide [37].

2.2.4. Other Auxiliary Data

The 250 m GFPLAIN product [41] delineating the global floodplain was used as the baseline for comparing different flood mapping methods. The gridded dataset was produced with the Shuttle Radar Topography Mission (STRM) digital terrain model (DTM) and a set of terrain analysis procedures [41]. We also collected the NASA SRTMGL1 product at a spatial resolution of 1 arc-second [54] to calculate slope and exclude hill shadows (i.e., slope greater than 15 degrees) because the shaded hills are likely to be misclassified as water.

2.3. Methods

Figure 3 presents a two-step methodology framework to map the flooded croplands and quantify agricultural recovery conditions in the three study regions: (1) mapping of flooded croplands using Sentinel-1 SAR composite images and (2) determination of post-flooding recovery conditions at different times and places.

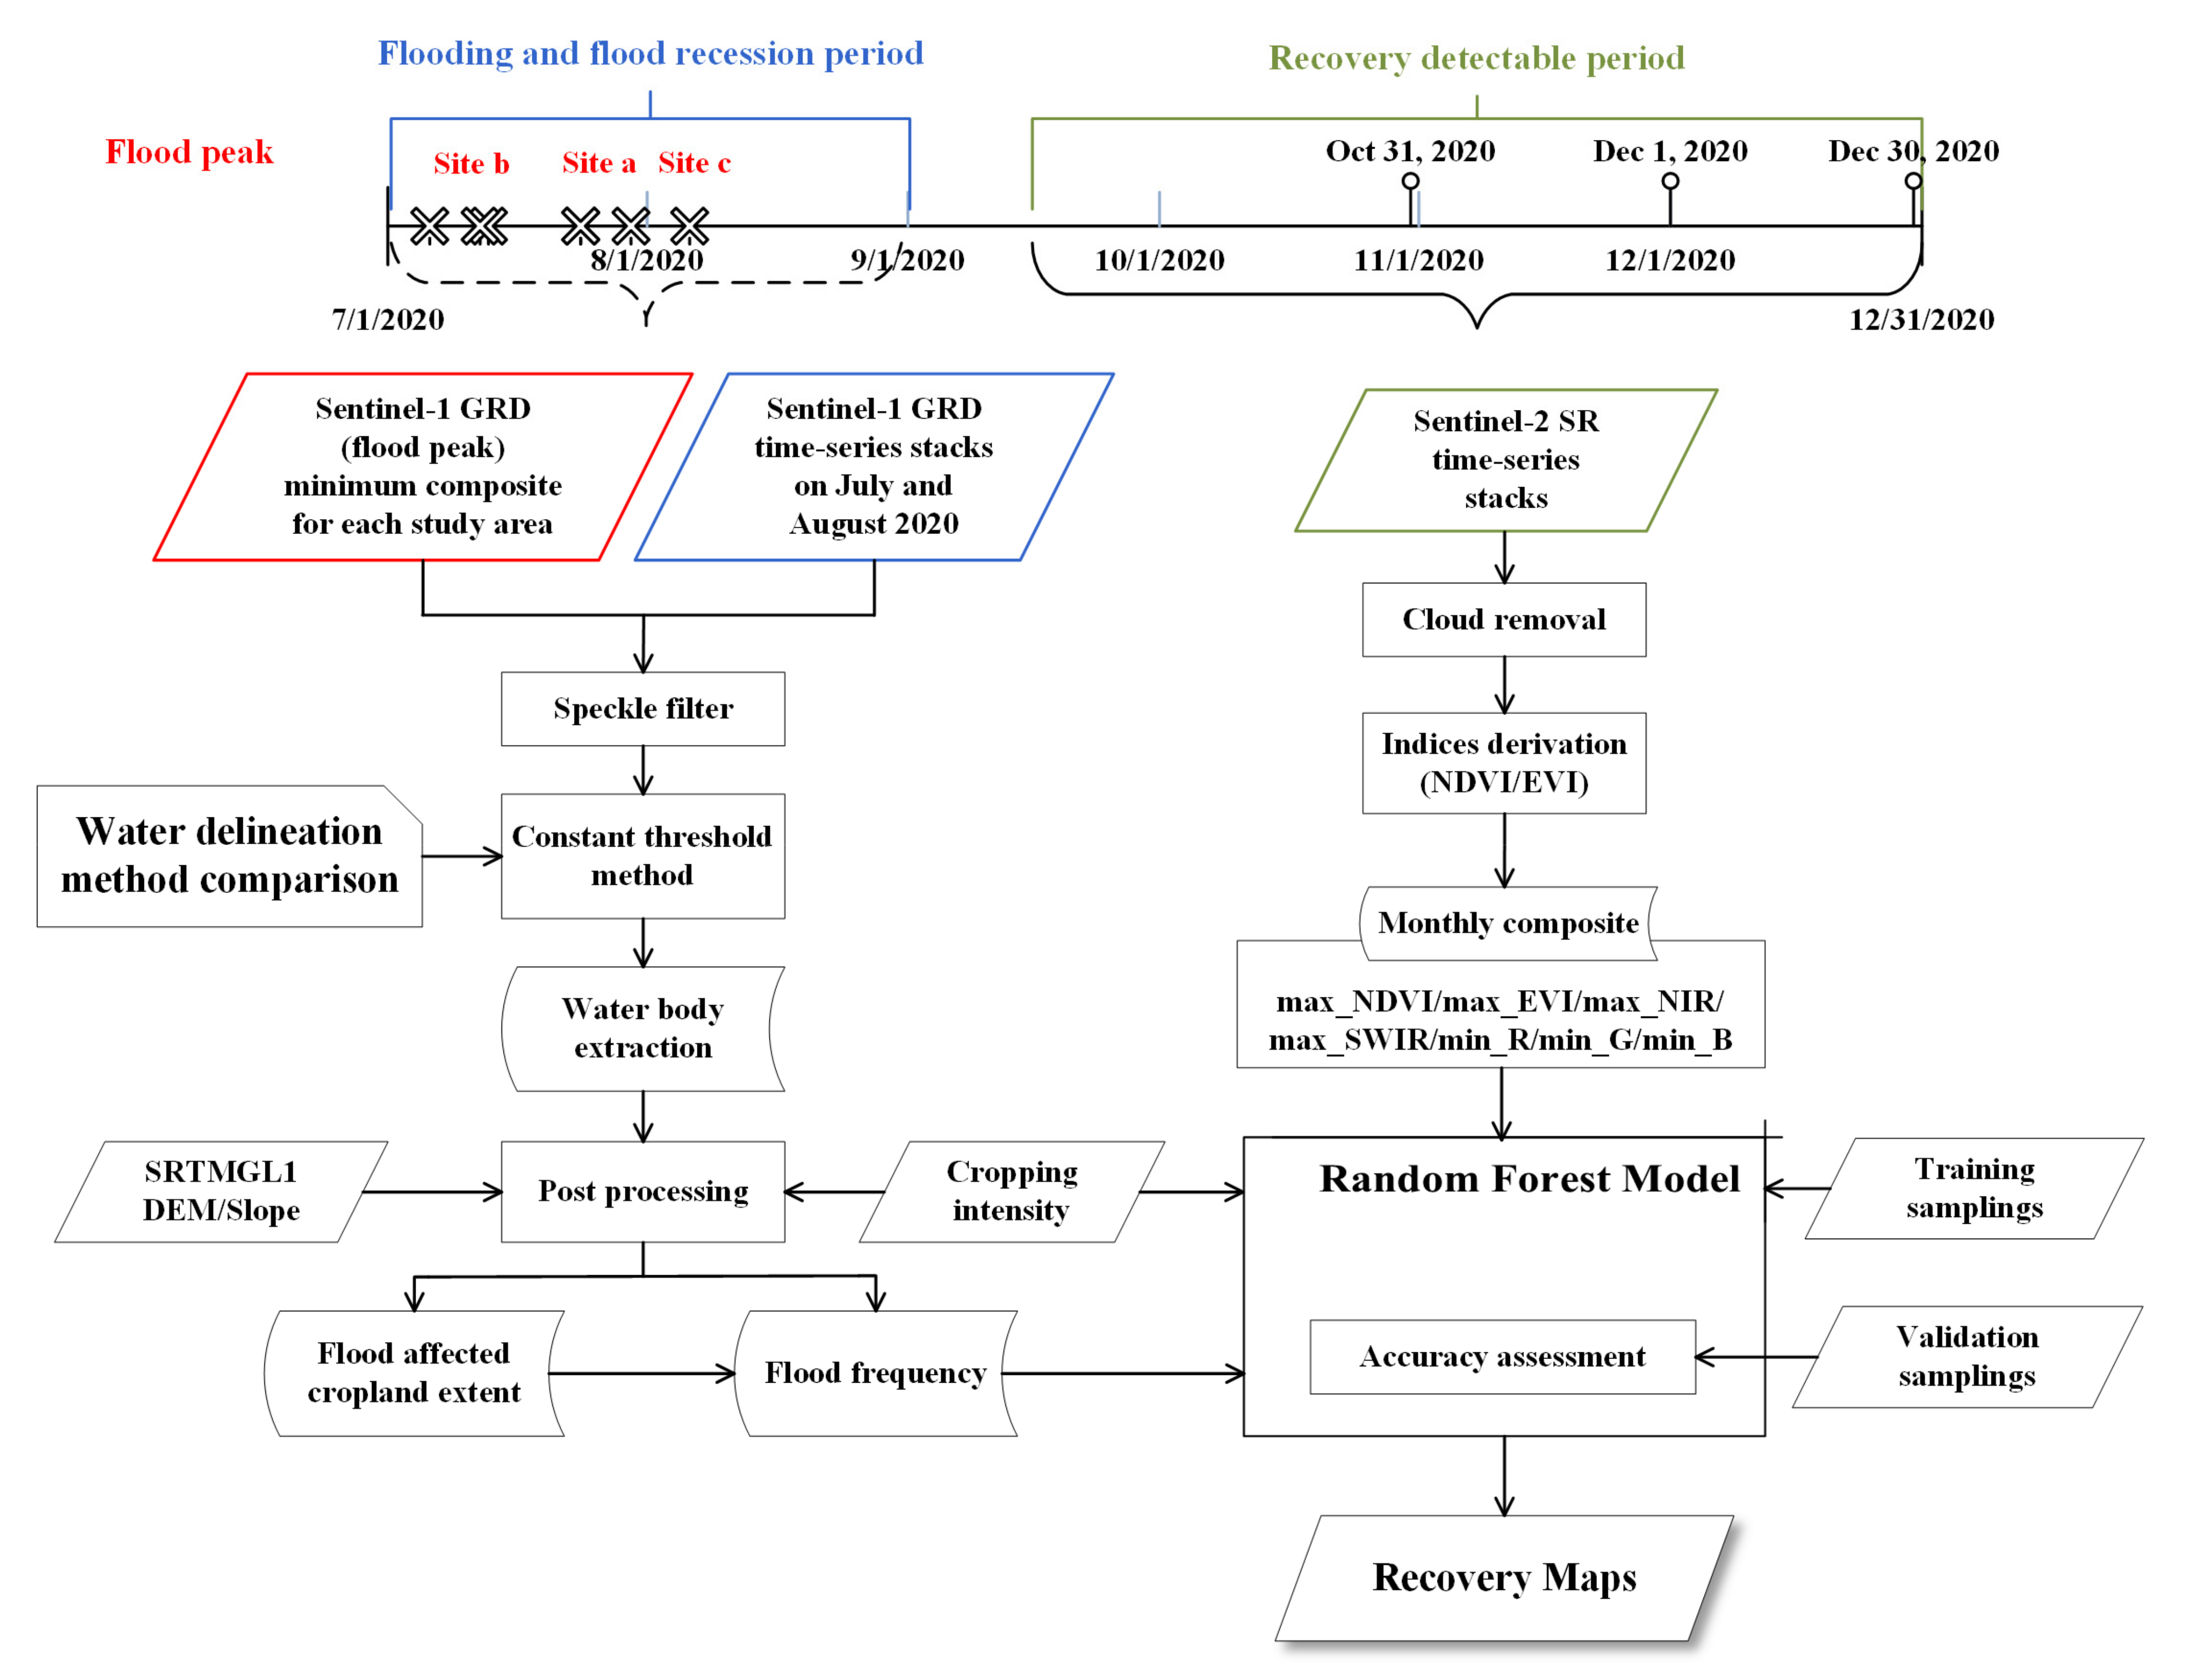
2.3.1. Mapping of Flooded Croplands

We first combined the SAR imagery during the period of flooding peak (Table S1) to generate the maximum flood extent of each study area using the minimum composite method. Given that the 2020 summer flood is highly variable across space and time, the short-duration flood is likely to be underestimated within a single image. Moreover, the SAR backscatter signal will decrease when floods submerge croplands, and the minimum composite can identify the maximum possible croplands that turned to be flooded surfaces. Then, we applied a constant threshold method to extract the water extent. Specifically, the threshold was selected and validated as below.
First, we selected Sentinel-1 (acquired on 23 October 2020) and Sentinel-2 imagery (acquired on 24 October 2020) pairs around the Poyang Lake with only a one-day gap for lacking suitable cloud-free optical images during or shortly after the flood. Grids of 0.05 × 0.05 degrees and 0.2 × 0.2 degrees fully covered by the selected Sentinel-1 and Sentinel-2 images were created separately for algorithm comparison (Figure 4c) and reference samplings generation (Figure 4b). We developed a randomly distributed dataset annotated with two classes (280 water points and 612 land points) within the 0.2 × 0.2 degrees grids by visual interpretation based on the Sentinel-2 image (Figure S1). Then, we computed Receiver operating characteristic (ROC) curve for threshold selection using the 892 validation points. A threshold range between −16.5 dB to −14 dB was determined for water body extraction based on Sentinel-1 VV polarized image (Figure S2). Croplands that are affected by riverine flooding and waterlogging sometimes share similar signals with paddy fields flooded for irrigation purposes, a normal process of agricultural activities [55]. In order to minimize the possibility of unaffected paddy fields misclassified as flooded croplands, we compared water areas extracted by different thresholds and sieving values between the normal year (2019) and the flood year (2020) during the same time period (Table S2). We found that large proportions of paddy fields would be considered as flooded areas especially in the Huai River Region when applying higher water extraction thresholds. Therefore, we selected −16.5 dB as the constant threshold to extract flooded croplands through overlapping water extent and the cropping intensity map. Finally, flooded patches with an area of 100 pixels (about 0.09 km2) or less were sieved using the 8-connected algorithm [56].
To validate the model performance of flooding mapping, we compared the following three methods, including the constant threshold of −16.5 dB, the Global Otsu Thresholding [57], the adaptive local threshold algorithm [58,59] in the Poyang Lake region. The Global Otsu Algorithm [57] has been widely used in SAR-based water mappings. An optimum threshold was determined from maximizing the between-class variance of foreground and background pixels in the image [22]. The adaptive local threshold detection combining MNDWI, Canny Edge Filter, and Otsu thresholding was proposed to improve the ability to detect the small fraction of water pixels in flat areas [58]. We compared these methods in Sentinel-1 VV polarized images (acquired on 23 October 2020) within the floodplain areas. We also included the Random Forest Model to generate water extent using Sentinel-2 imagery (acquired on 24 October 2020) as the benchmark to evaluate the performances of the three Sentinel-1-derived water mappings. The above four methods are compared by calculating water percentages in grids of 0.05 × 0.05 degrees (Figure 4c). Considering the inapplicability for the local thresholding method in hilly areas [57], we used a resampled floodplain dataset [41] to reduce confusion of shaded hills and water by excluding 0.05 × 0.05 degrees grids on the condition that the proportion of floodplain areas are less than 40%. Spectral predictor variables including Red, Green, Blue, NIR, Normalized Differenced Vegetation Index (NDVI) [60], and Normalized Differenced Water Index (NDWI) [61] were derived from the Sentinel-2 data. Further, we ran the classifications using the Random Forest Model. For each classified pixel, ten decision trees were used at each split. 80% of the samplings were used for training and 20% for model validation (Figure S1). We assessed the accuracy using the overall accuracy (OA) metric with a standard error matrix approach. Finally, the Sentinel-2-derived water map was compared with the three Sentinel-1-based water mappings separately in the unit of 0.05 × 0.05 degrees grid.

2.3.2. Determination of Post-Flooding Recovery

We used the Random Forest Model [62] to map recovery conditions of flood-affected croplands by training models separately for each study site in October and ran the classification in October, November, and December. We first created a randomly distributed training dataset through visual interpretation in each study area that identified the status of the flooded cropland in late October. Regarding time-series of true-color and false-color images, maximum NDVI composite image of Sentinel-2 from mid-September to the end of October, pixels exhibiting greening trend within the flood-affected cropland areas were classified as recovered croplands or otherwise uncovered ones. Nine predictor variables were used in the Random Forest classification (Table 1). Considering that flood is highly variable, we used flood frequency calculated from all Sentinel-1 SAR data during the major flooding and recession period (July and August) in 2020 to represent flood duration and velocity of flood recession. The characteristics of returning to green for the stricken cropland were identified by ample spectral information from Sentinel-2 optical images. All predictor layers were preprocessed at a 30 m resolution using the nearest-neighbor interpolation for unification.
We ran the model and delineated the extent of agricultural recovery in late October. As a result of the difficulty in drainage or longer growth cycles for some rush-plant vegetation, the model was also implemented to classify recovered croplands in late November and December using longer time series of Sentinel-2 archives (from 15 September 2020 to 30 November 2020, and from 15 September 2020 to 31 December 2020) to comprehensively evaluate the agricultural recovery measurements. Figure 5 illustrates the asynchronous flood recession and cropland recovery process in 2020 in the northern Changzhou Township, Poyang County. Specifically, cropland with a higher elevation near the dikes was more timely replanted and turned green earlier than the low-lying inner polder. The time series of NDVI indicates crop rotation delays in 2020 compared with 2019 due to the flood.
Finally, we analyzed the statistical results of agricultural loss and recovery conditions. Spatial patterns and local details were captured and visually interpreted separately for each study site using official announcements and local news. All these analyses were conducted on Google Earth Engine, which is a free cloud-based platform comprising a large archive of public geospatial data with high-performance parallel computing ability [64].

3. Results

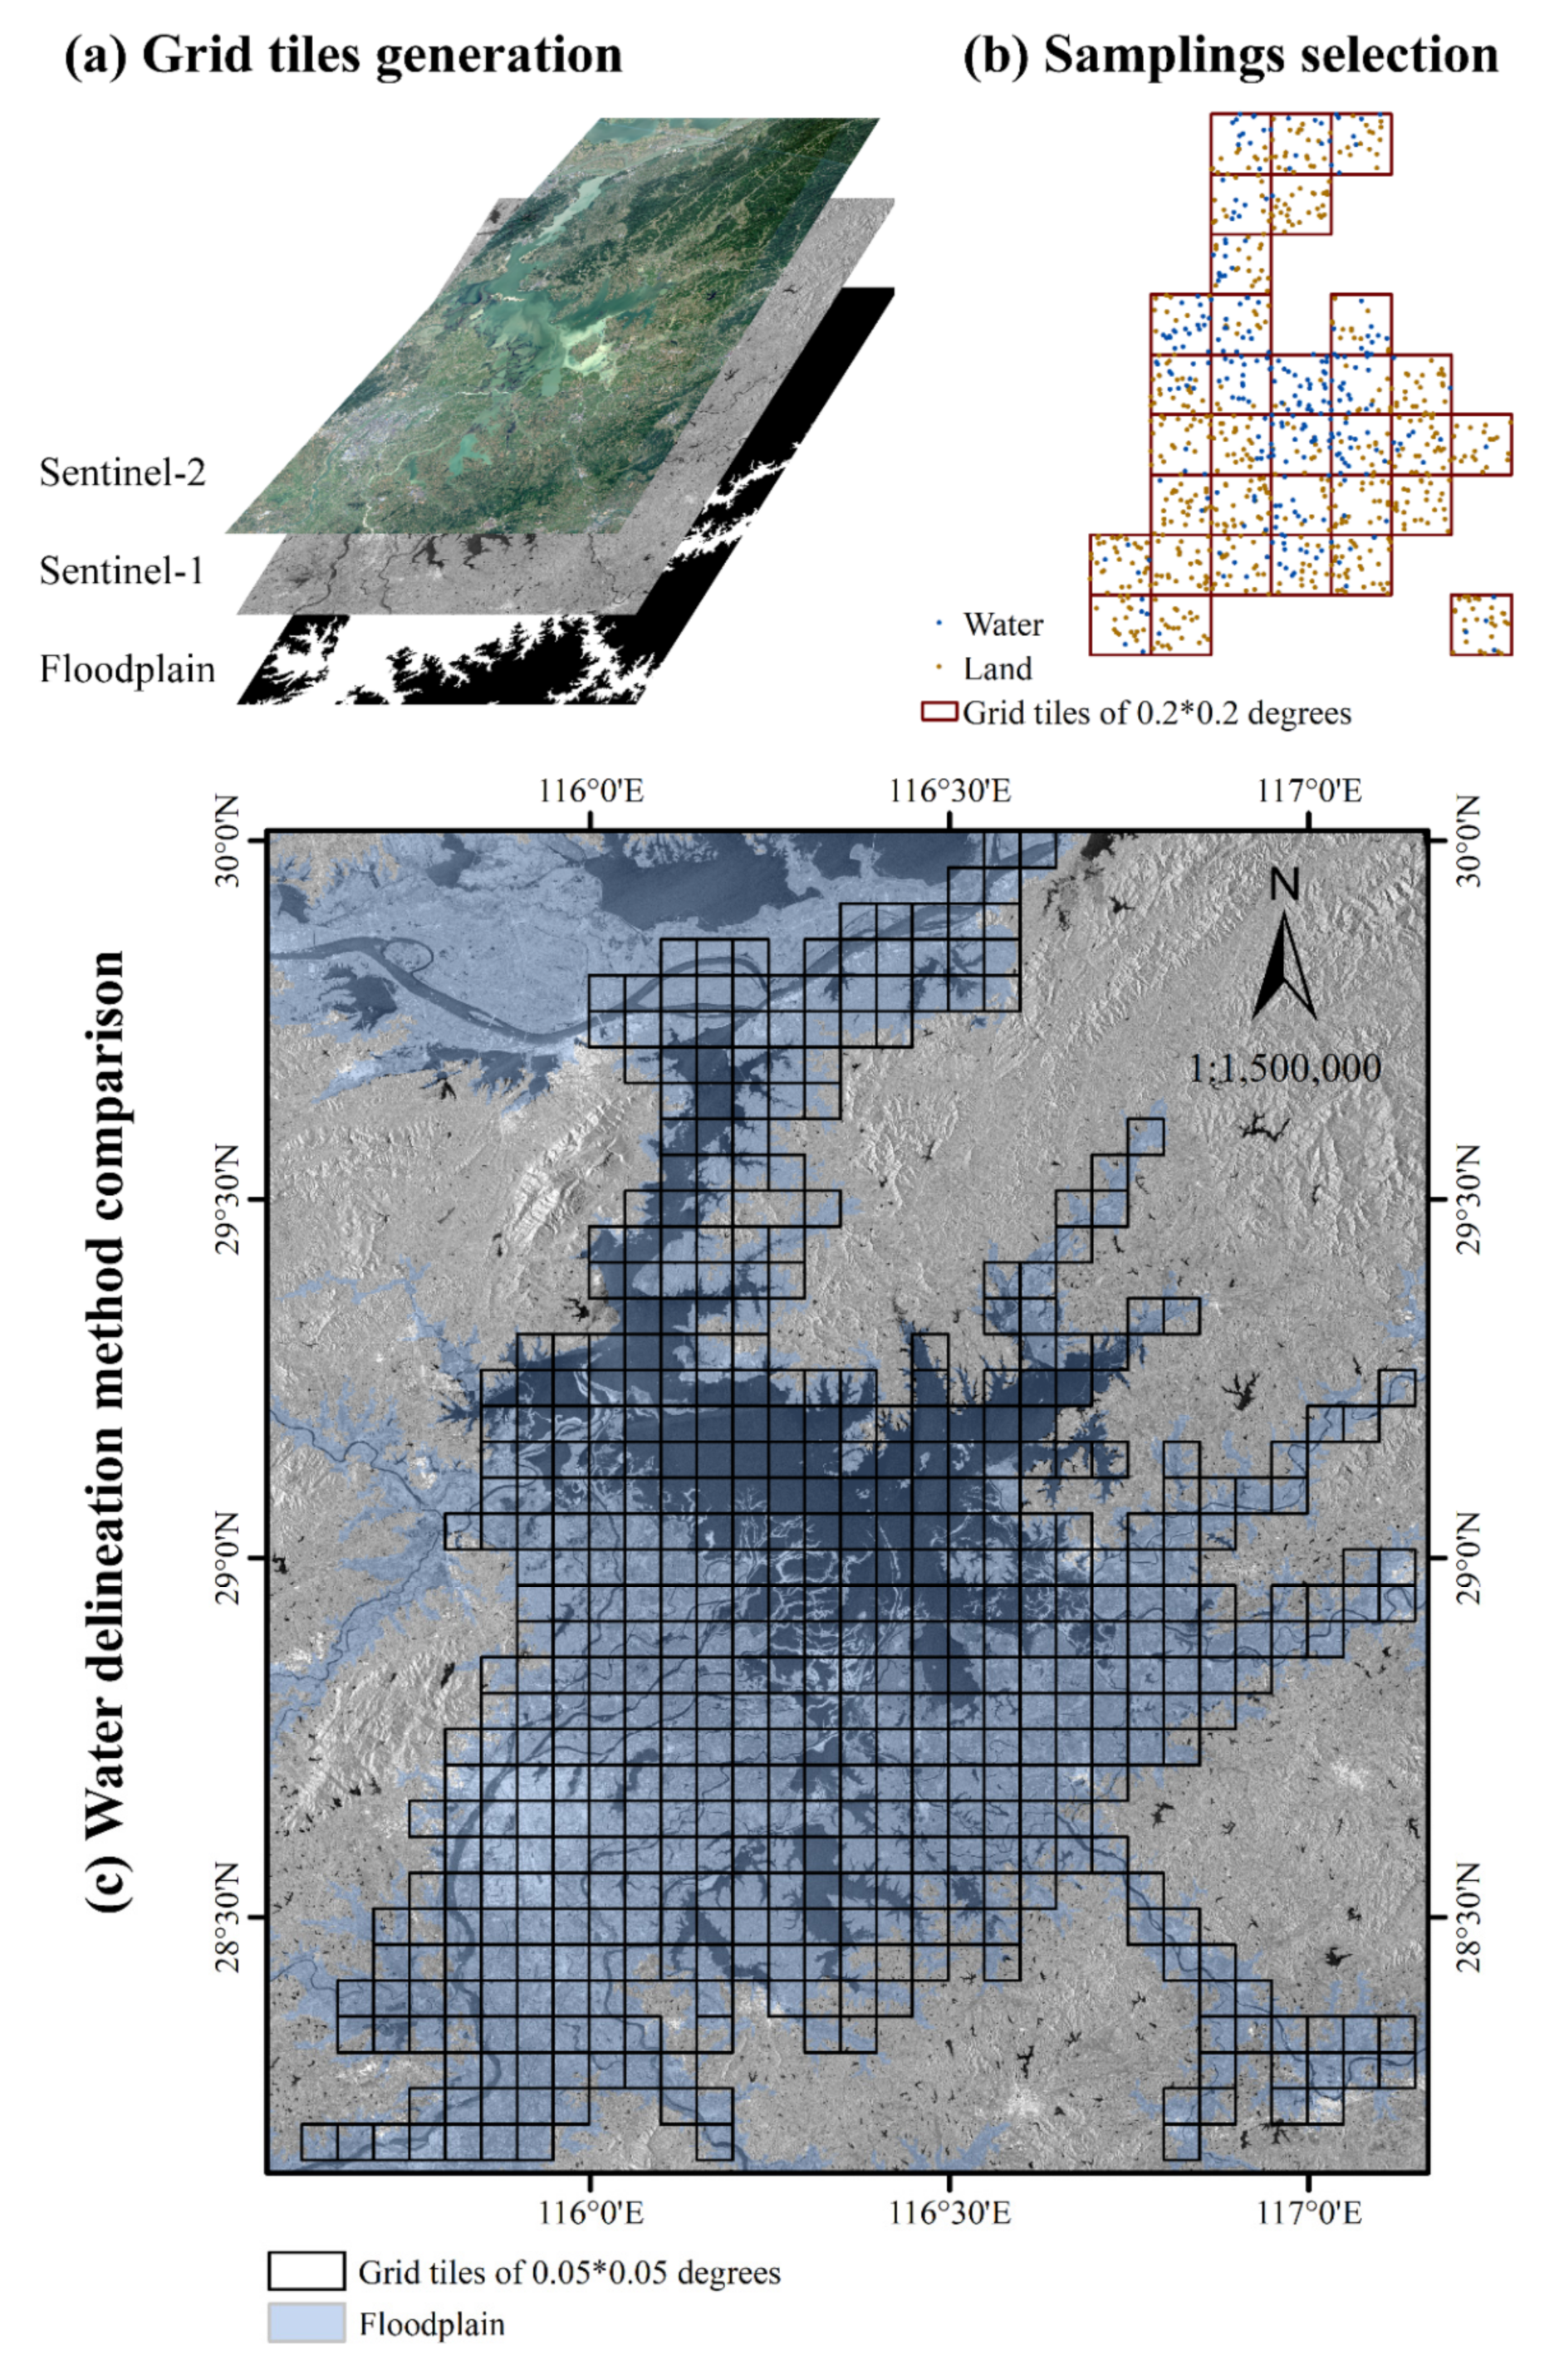
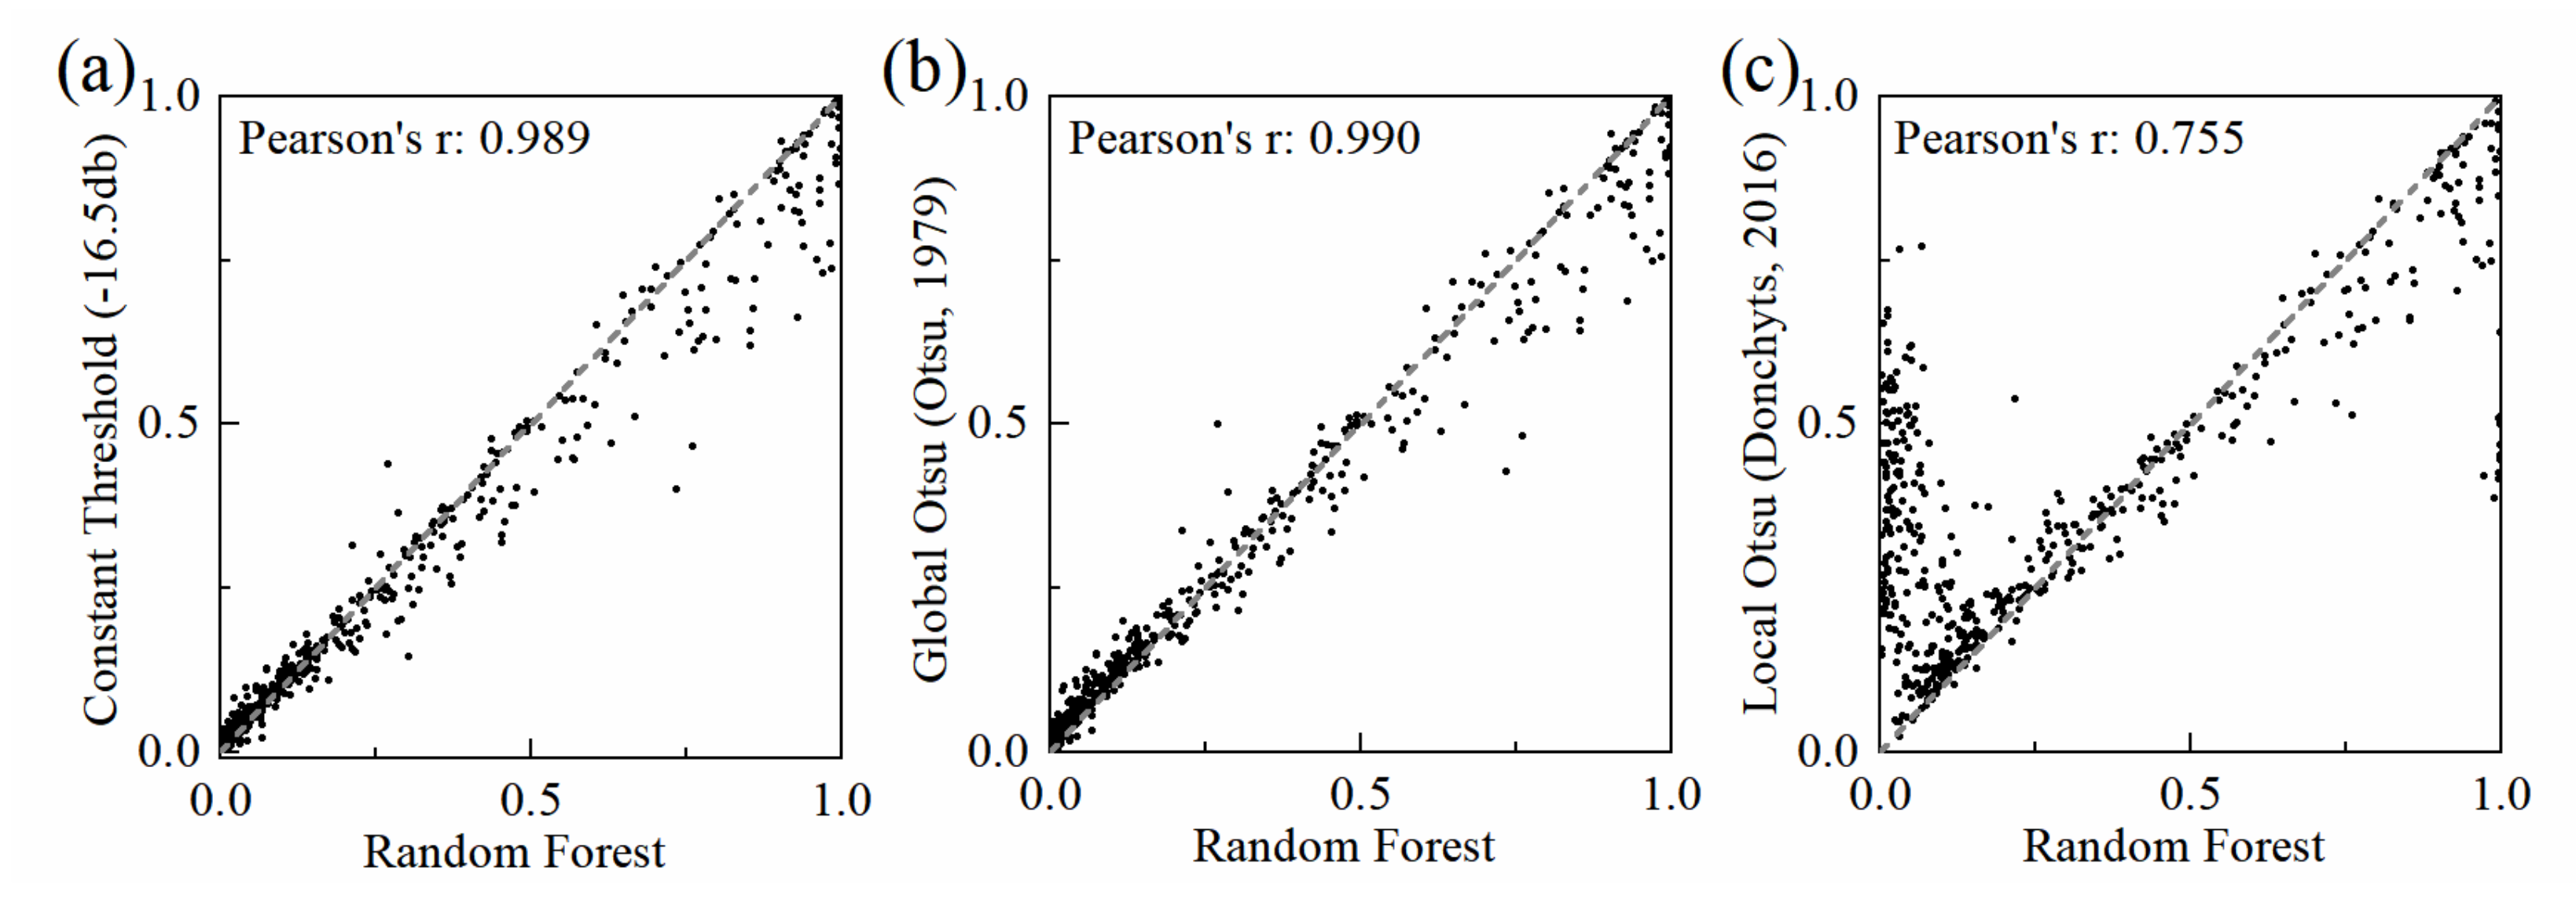
3.1. Comparison of Flood Mapping Result

Figure 6 shows the relationships between reference water ratios in grids of 0.05 × 0.05 degrees derived from Random Forest algorithm using Sentinel-2 imagery and classified water ratios derived from (a) constant threshold of −16.5 dB, (b) the Global Otsu Algorithm [57], and (c) the adaptive local threshold method [58] using Sentinel-1 imagery. The overall accuracy of the Sentinel-2-derived water mapping reached 96.7%. Grey dashed lines are the 1-to-1 lines assessing the flood mapping accuracy at the scale of 0.05 × 0.05 degrees. Results show that the constant threshold of −16.5 dB and the Global Otsu Algorithm achieve a high correlation coefficient with the reference water map (i.e., Pearson’s r = 0.99). The adaptive local threshold method performs well when the extent of flooded areas is moderate. However, when the flooded extent relative to the grid tile size is less than 25%, the flooded area is highly overestimated with high commission errors. This phenomenon informs us that although we have applied floodplain dataset to exclude hilly regions, the terrain is still an influencing factor of flood mapping accuracy, especially in the grid tiles with small water proportions [58].
Finally, pixels with backscatter coefficients less than −16.5 dB on VV polarized images were regarded as water in our study. Compared with other segmentation algorithms, first, spatially and temporally, the mapping results are more stable than with methods such as Otsu Thresholding [57] because the proportion of water bodies varies considerably in different images tracks in the same study region on adjacent dates. While the performance of the Global Otsu Algorithm strongly depends on flood extent size relative to full image size [22]. Second, it is simple and computationally efficient.

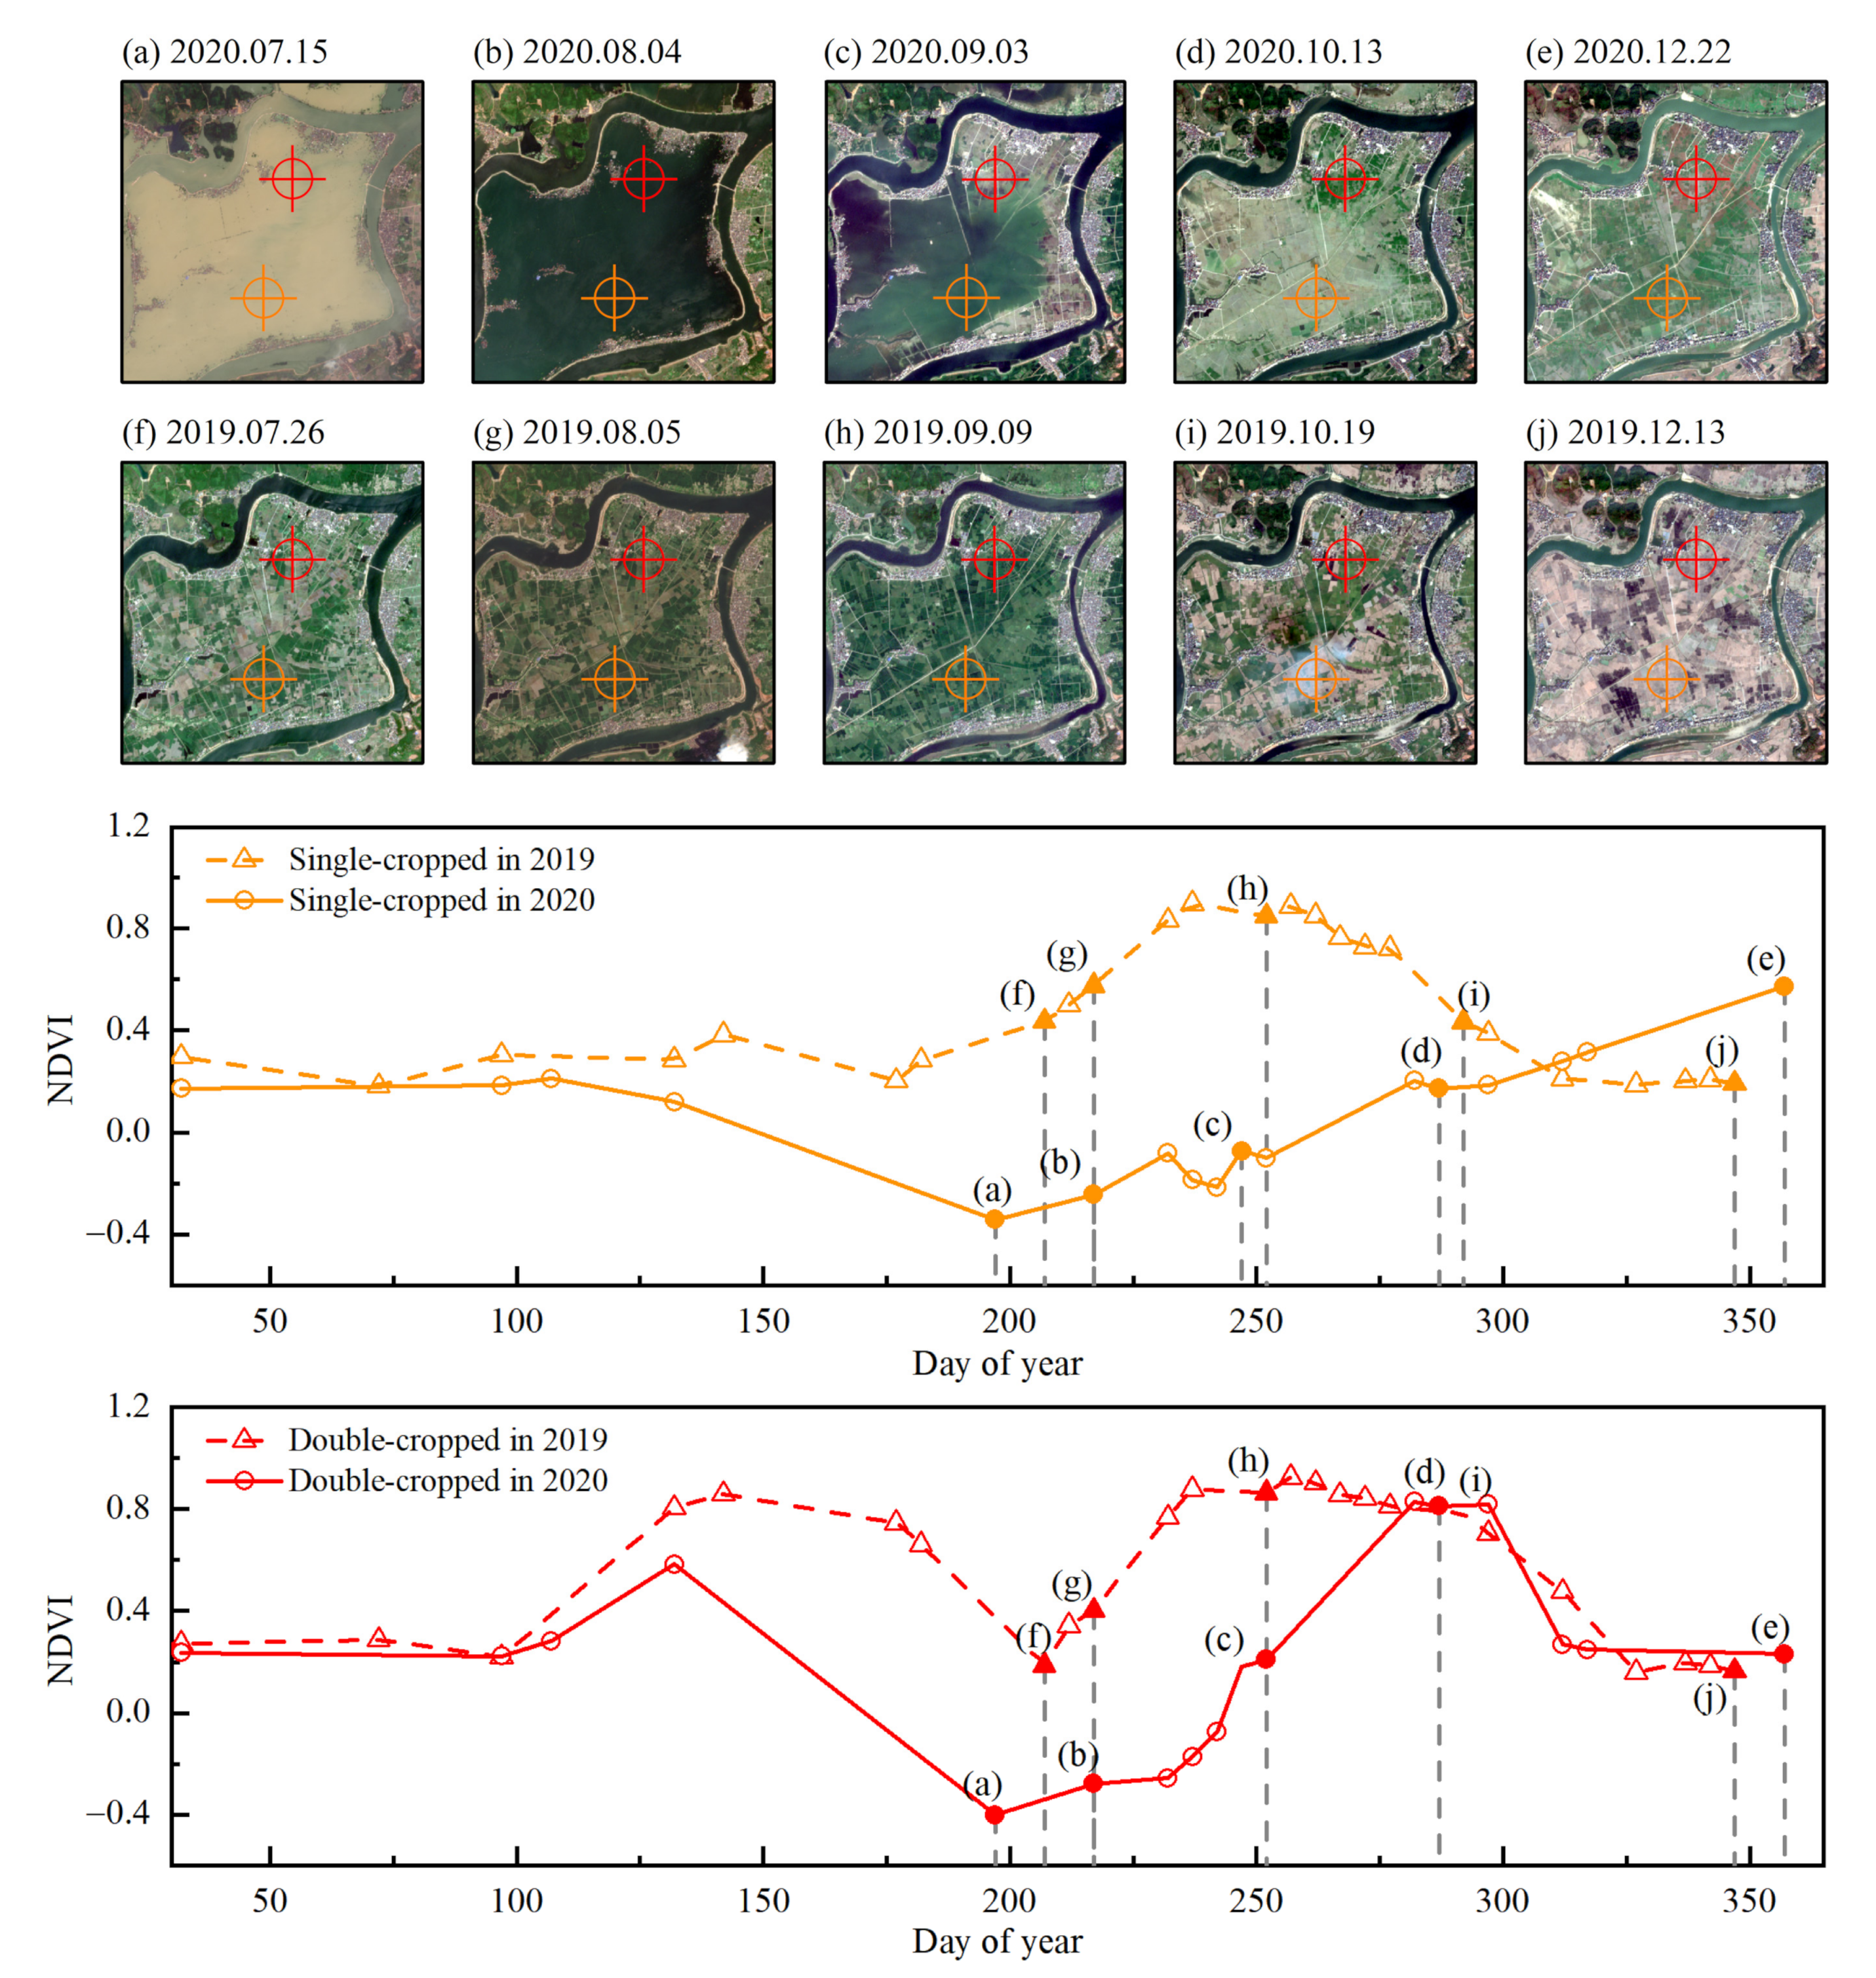
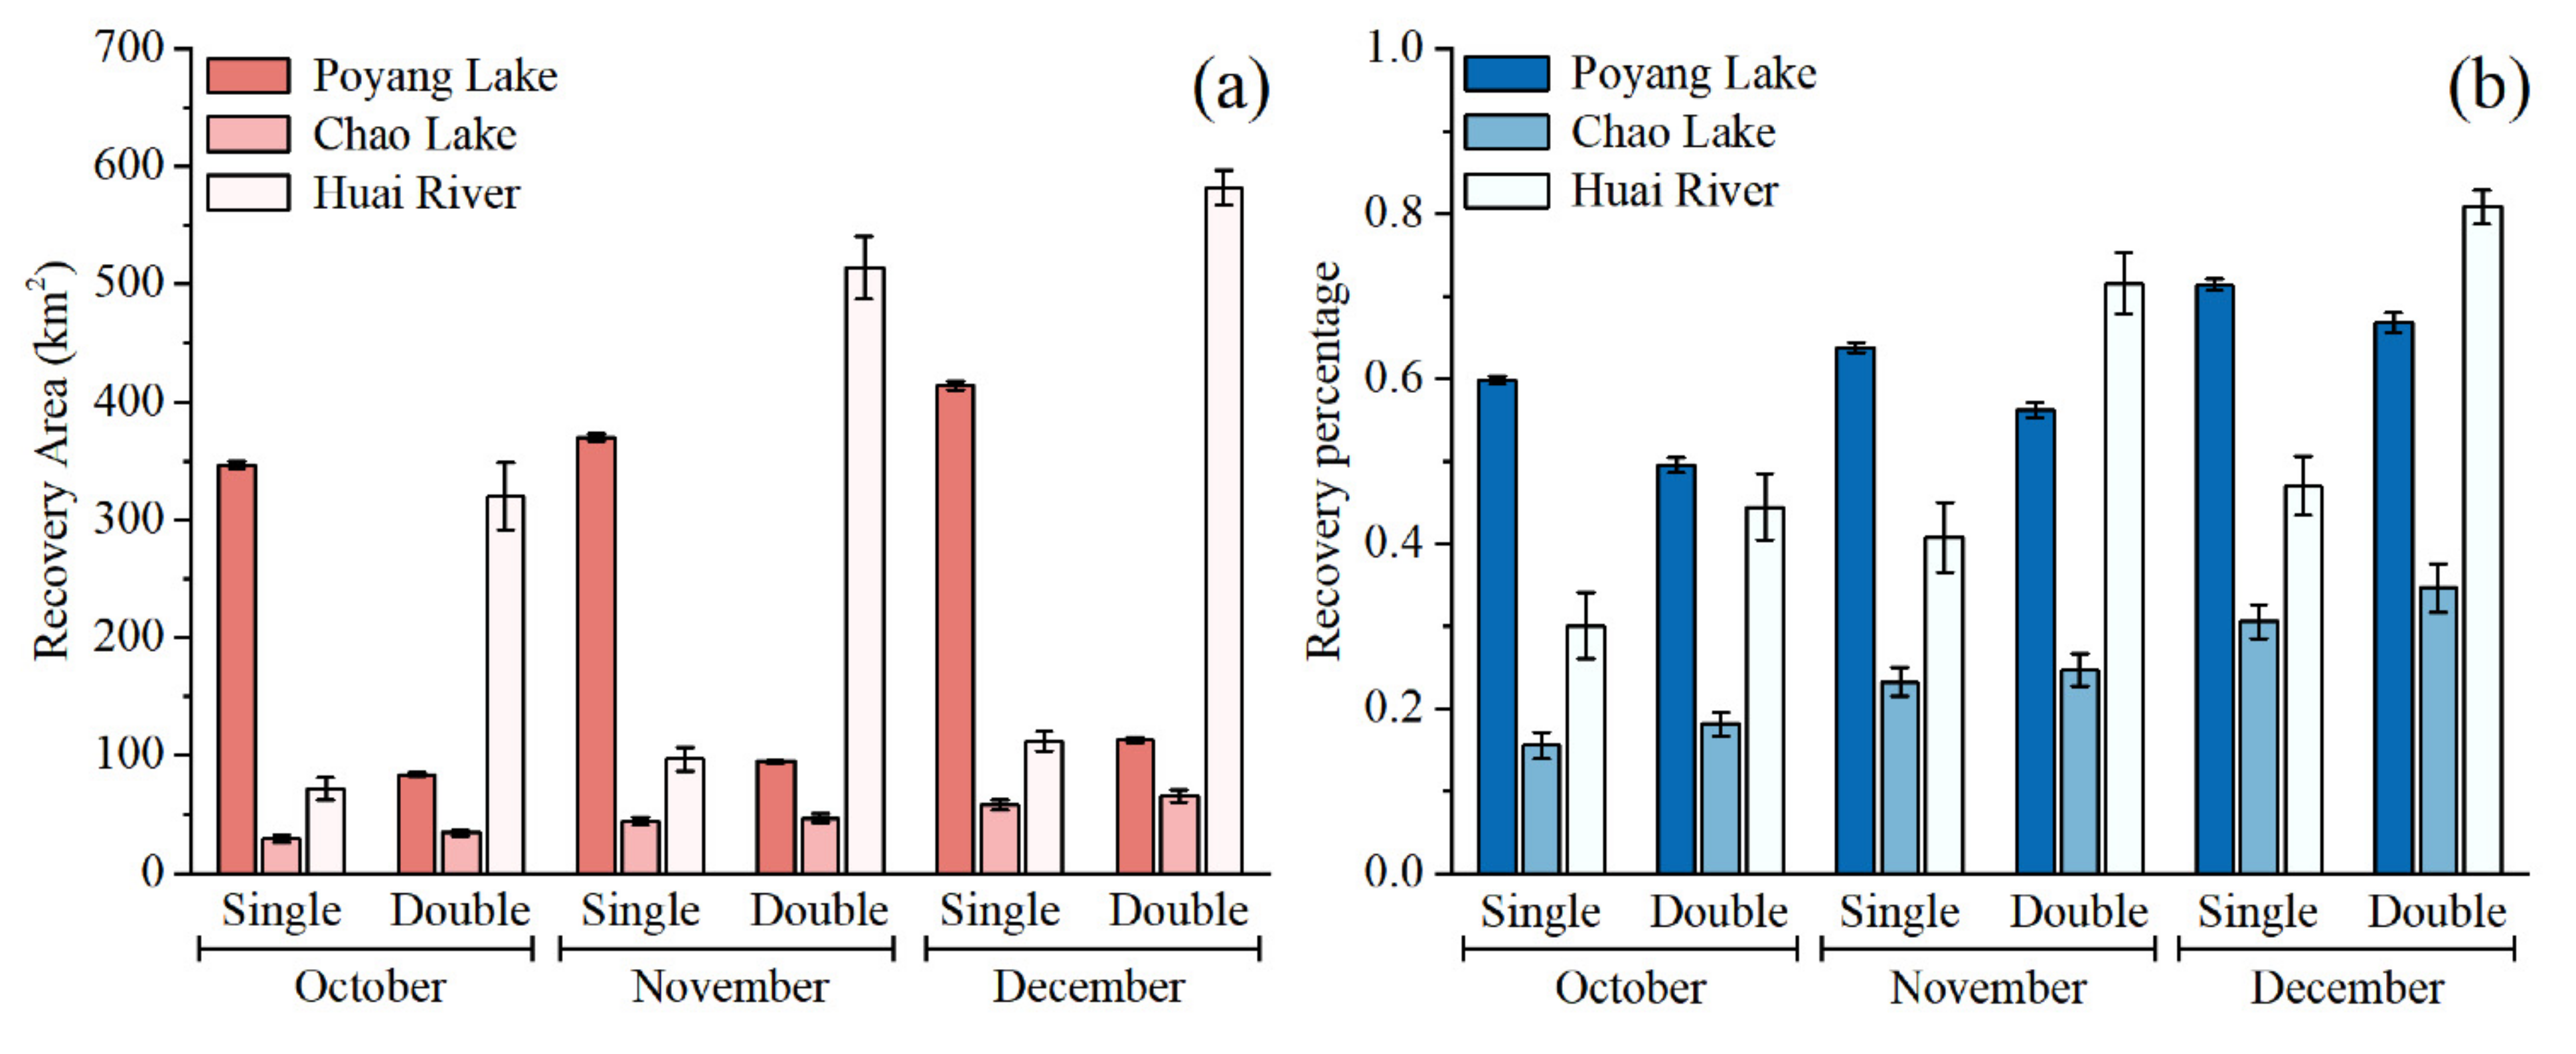
3.2. Flooding and Post-Flood Recovery Condition

The affected cropland areas and recovery statistics are presented in Table S3 and Figure 7. The total area of flood-affected cropland was approximately 749 km2, 379 km2, and 958 km2, accounting for 7.24%, 8.41%, and 5.69% of the agricultural land in the study region of the Poyang Lake, the Chao Lake and the Huai River, respectively. The damaged area around the Chao Lake was the smallest. However, the stricken proportion was the largest, indicating the severe condition of local food production. The affected single cropping land area was three times more than double cropping around the Poyang Lake. On the contrary, affected single cropping farmland was about three times less than double cropping near the Huai River. When considering the original planting proportions, the differences are weakened.
The recovery areas and the ratio of regions recovered to the flood-affected areas are separately categorized by different cropping intensities in Figure 7. The study area around the Poyang Lake and the Huai River shows effective recovery results, indicating that extensive croplands avoid being abandoned in the disaster year. Their differences existed in that the total recovered areas and percentage were higher around the Poyang Lake in late October but were surpassed by the Huai River in late December. The results could be explained by the flood peak around the Poyang Lake being approximately a half month earlier than the study site near the Huai River. Besides, the high recovery rate also indicates that the flooded cropland near the Huai River has conducted powerful and timely measurements.

3.3. Validation of the Post-Flooding Recovery Maps

A standard confusion matrix approach was used to assess the overall accuracy (OA) of the recovery classification results. We randomly selected 50 recovered points and 50 unrecovered points from time-series Sentine-2 images by visual interpretation for each study site and period. We ran each model ten times. The mean overall accuracies are shown in Table 2. The recovery maps in the three study sites reach high overall accuracies and exceed 98%. Crops with less complex backgrounds at their peak growth stage could be easily delineated using high-quality remote sensing data. The accuracy of the results could meet the demand of our subsequent spatial–temporal analysis.

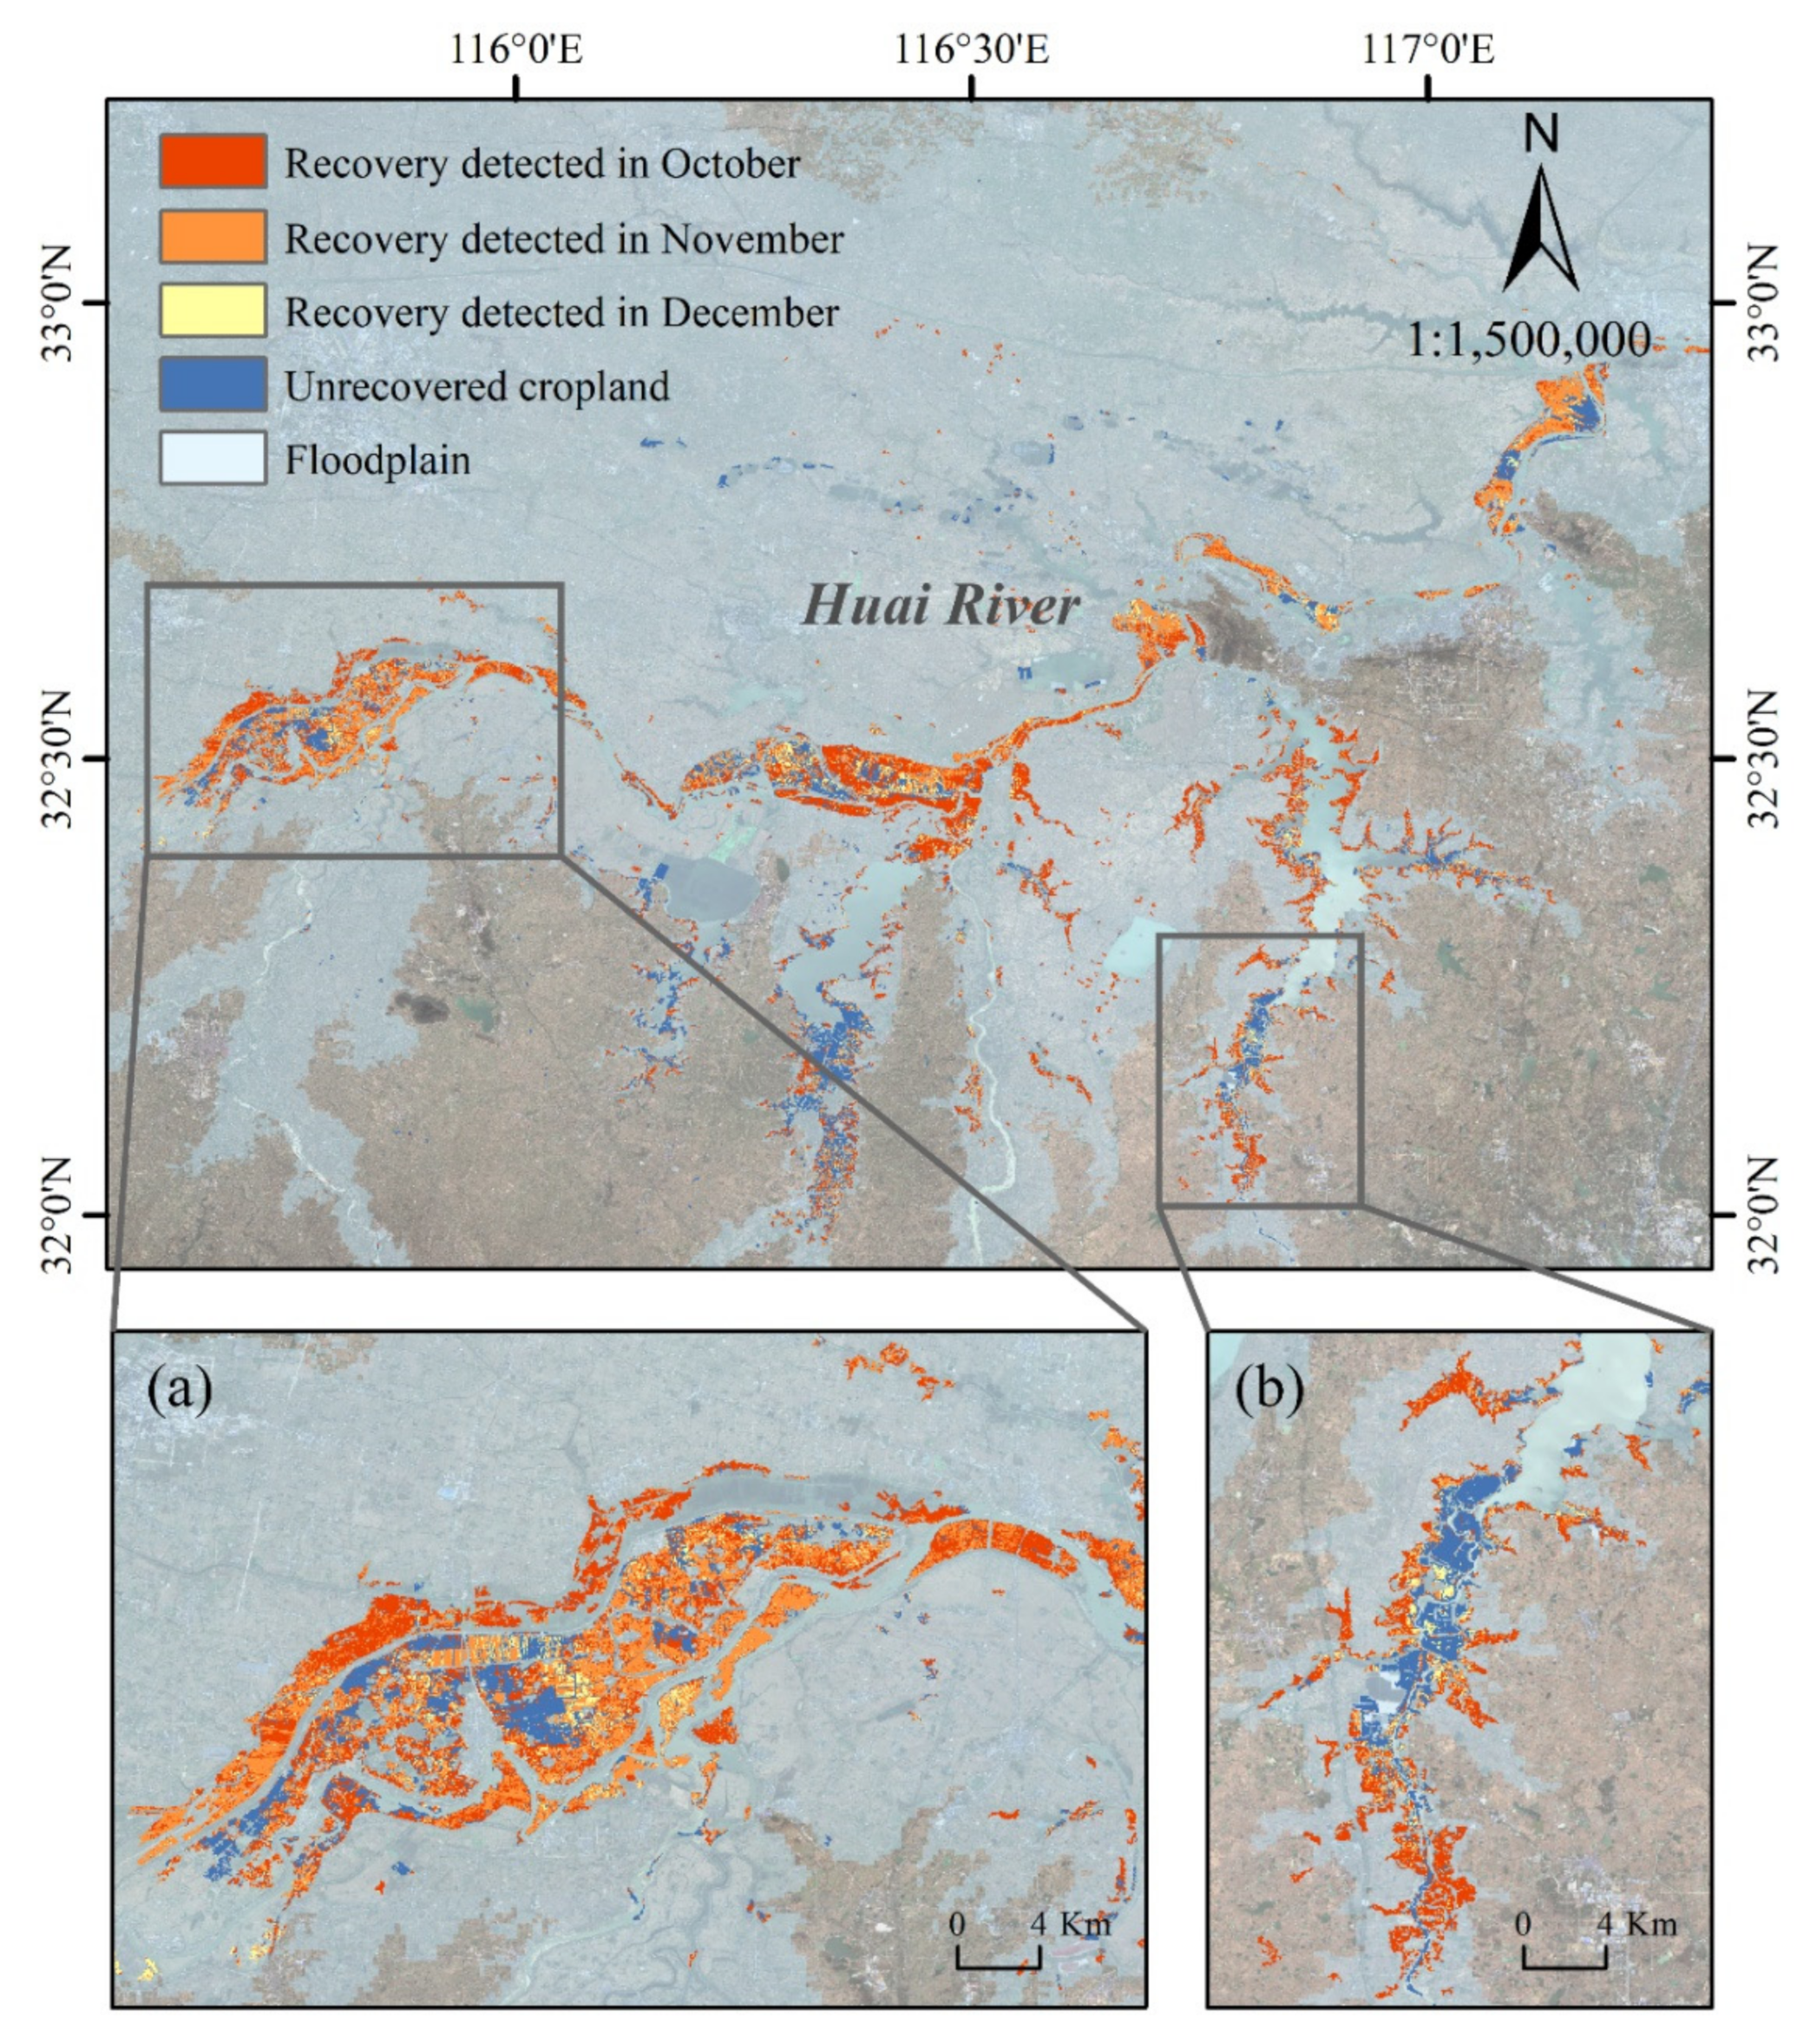
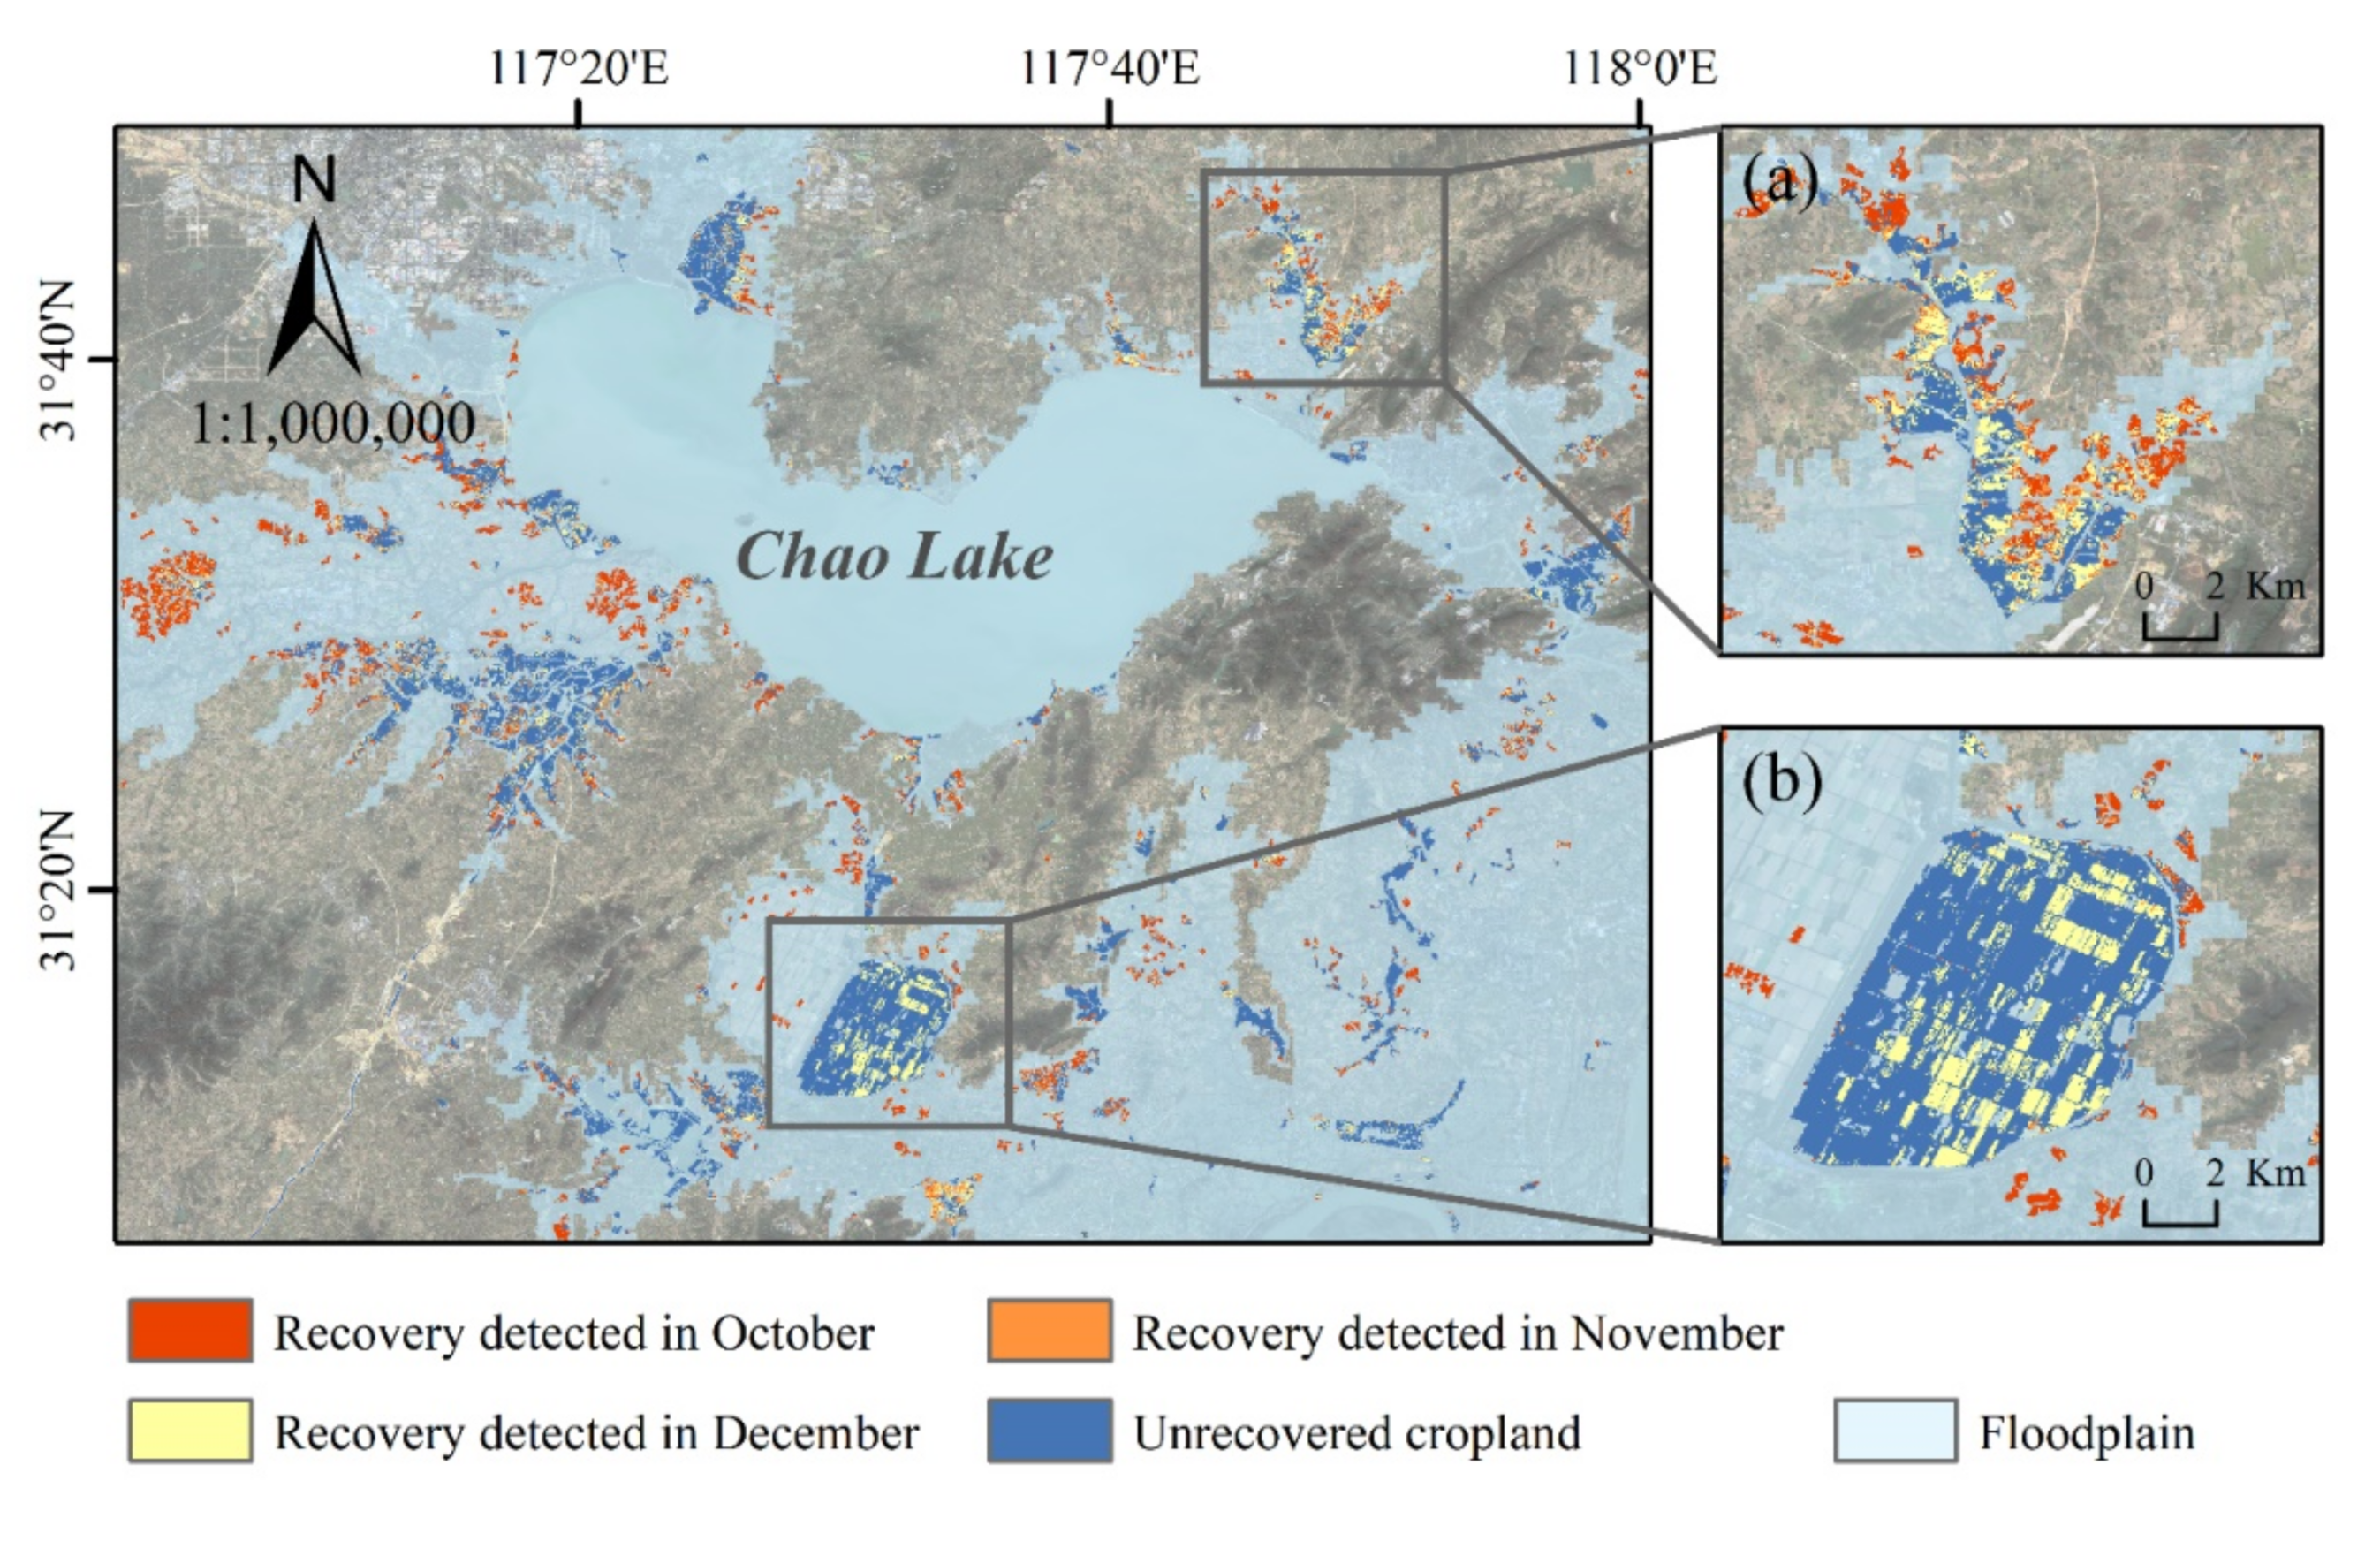
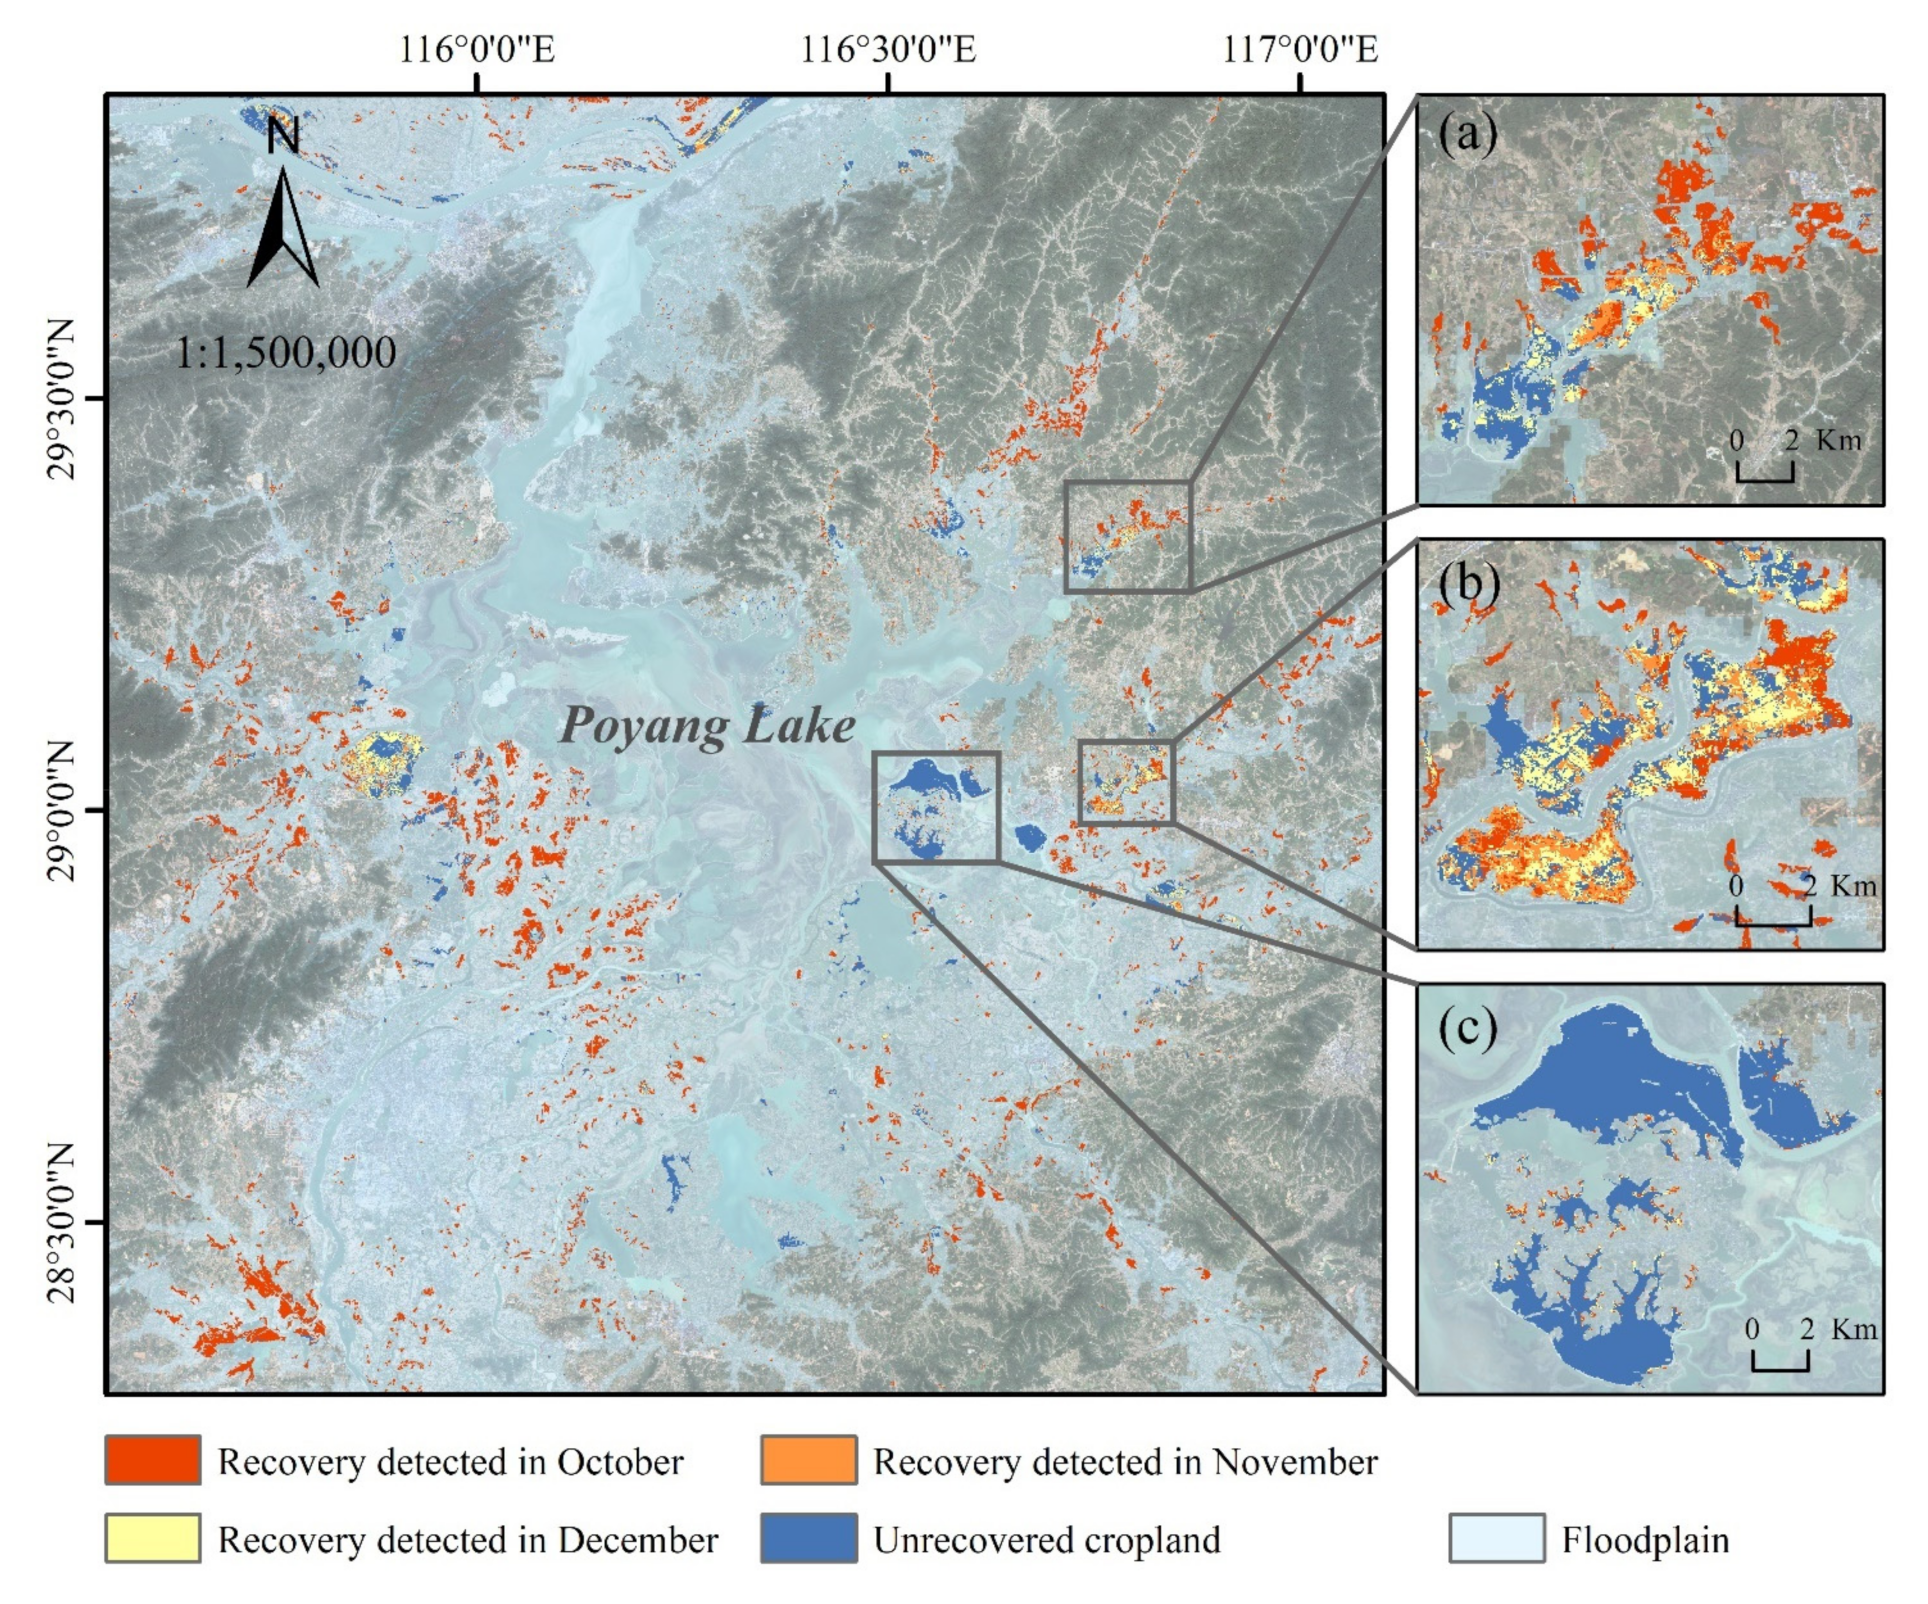
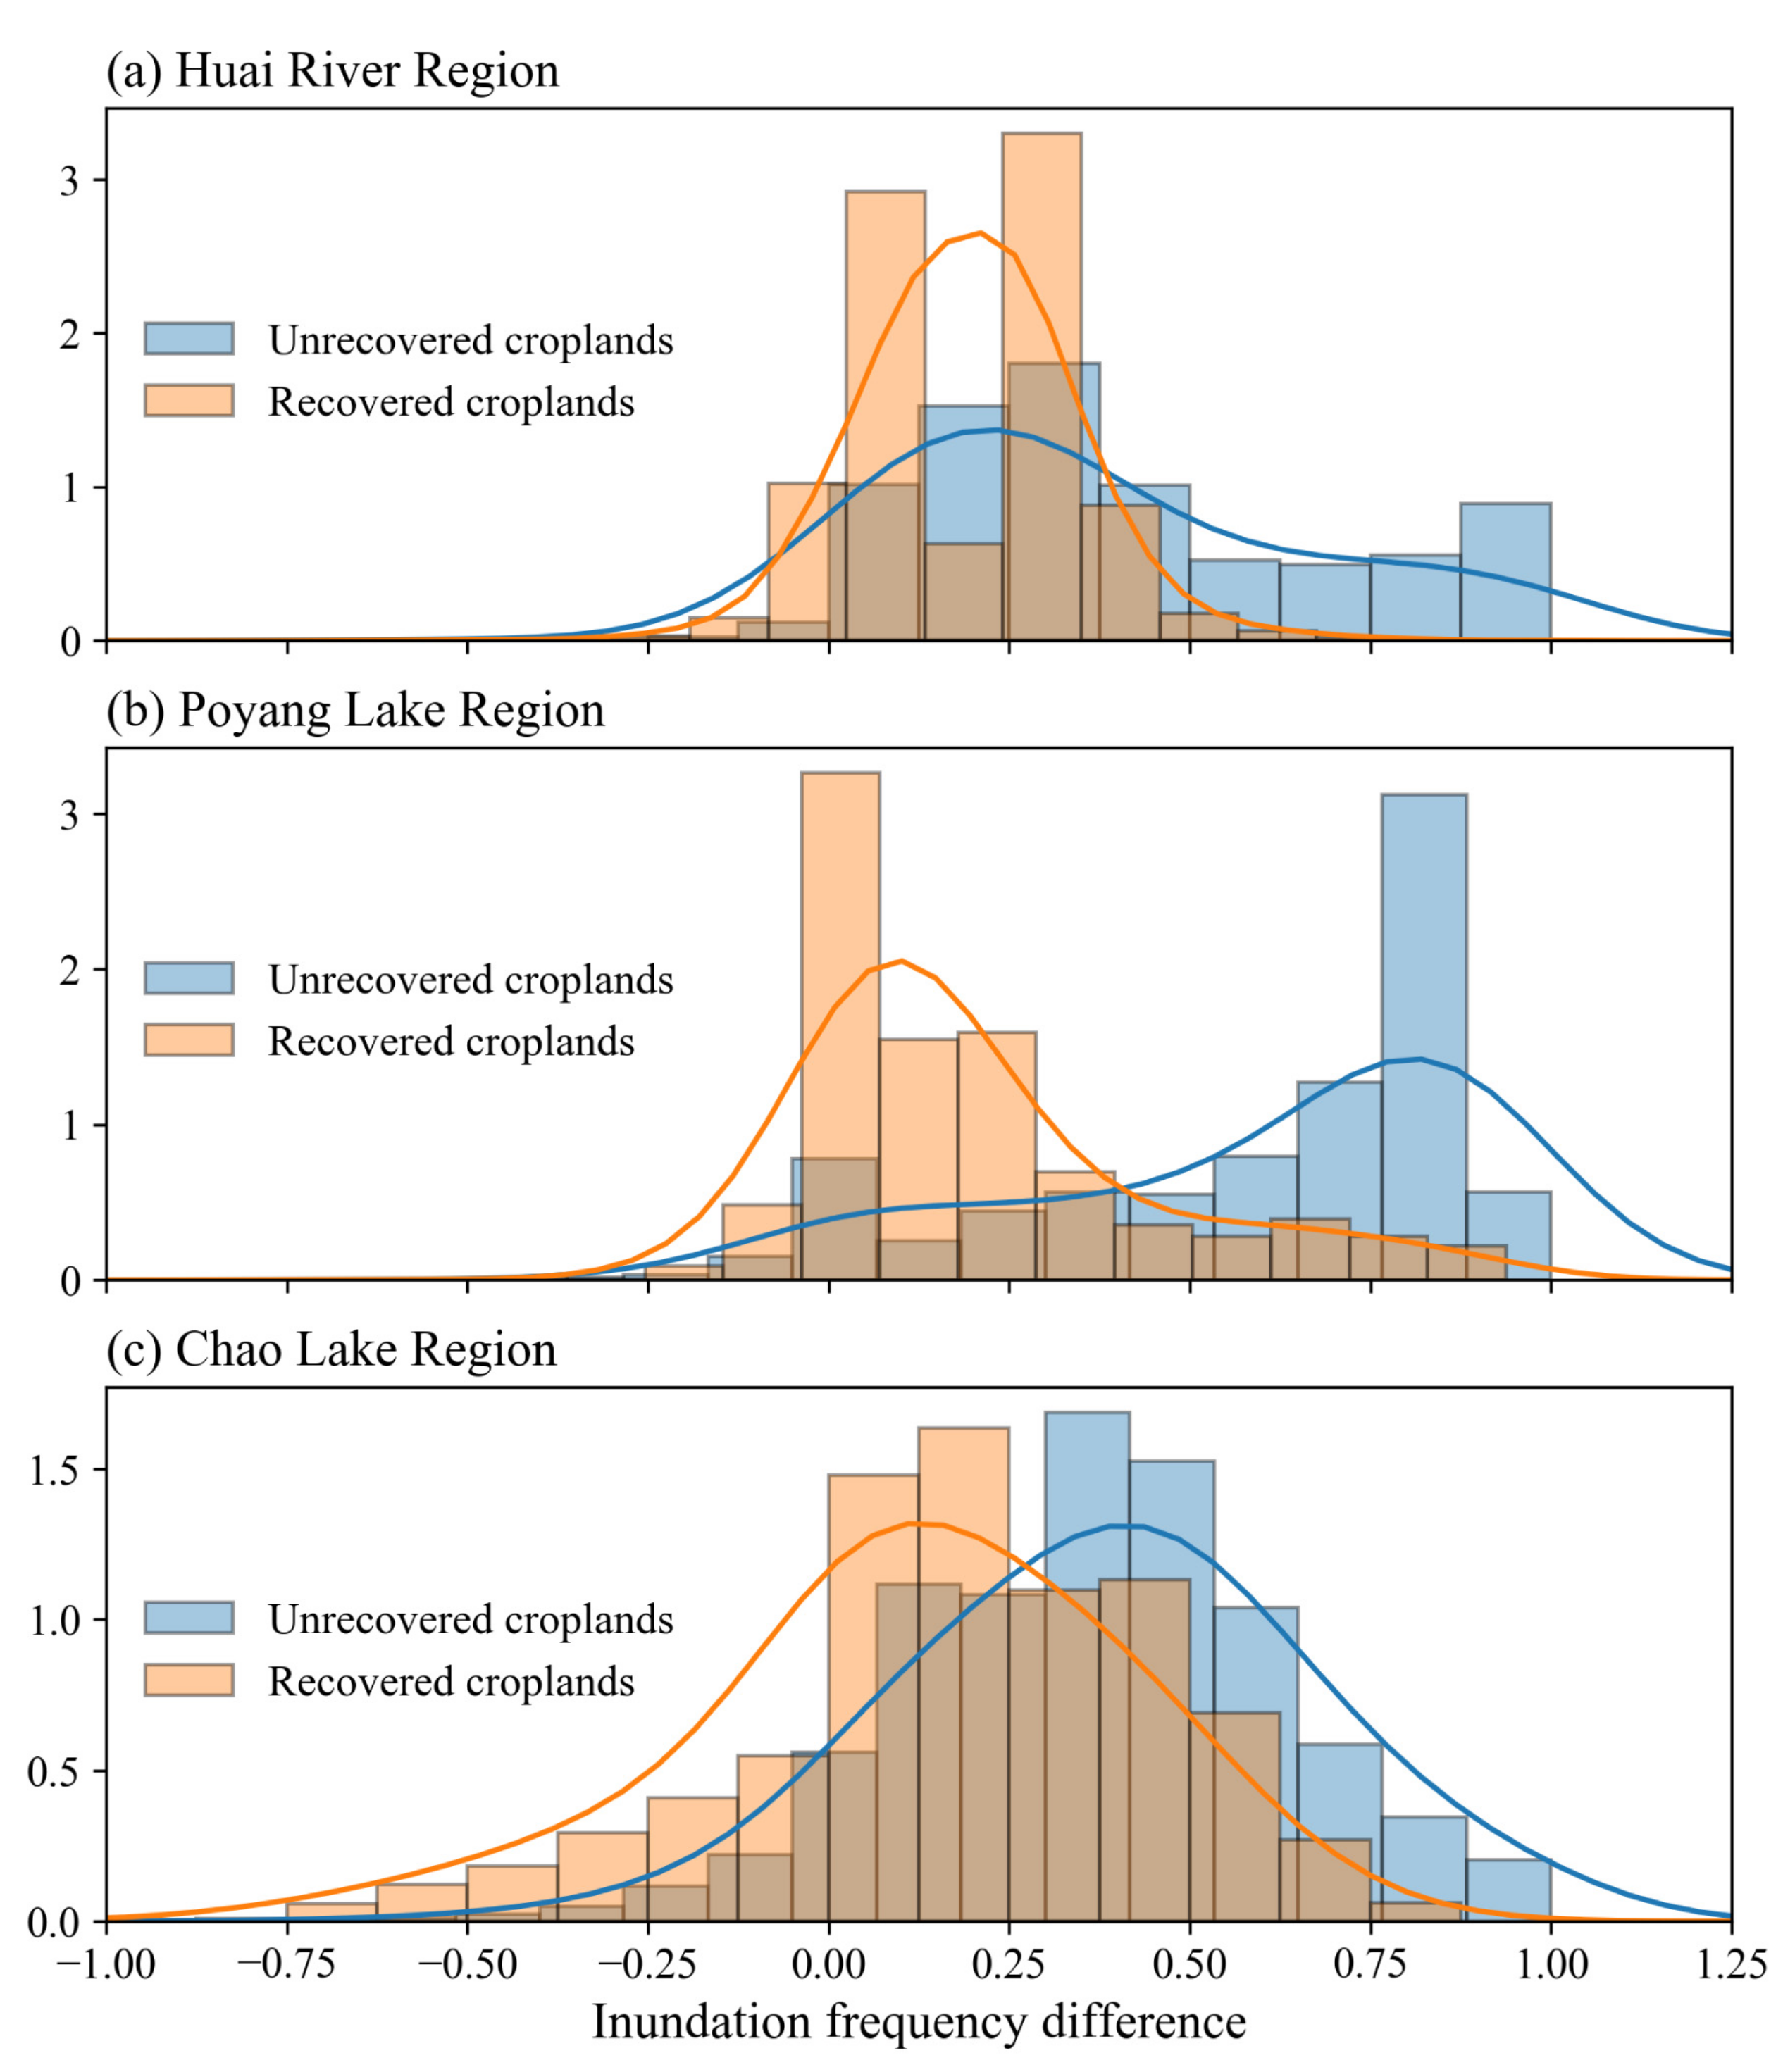
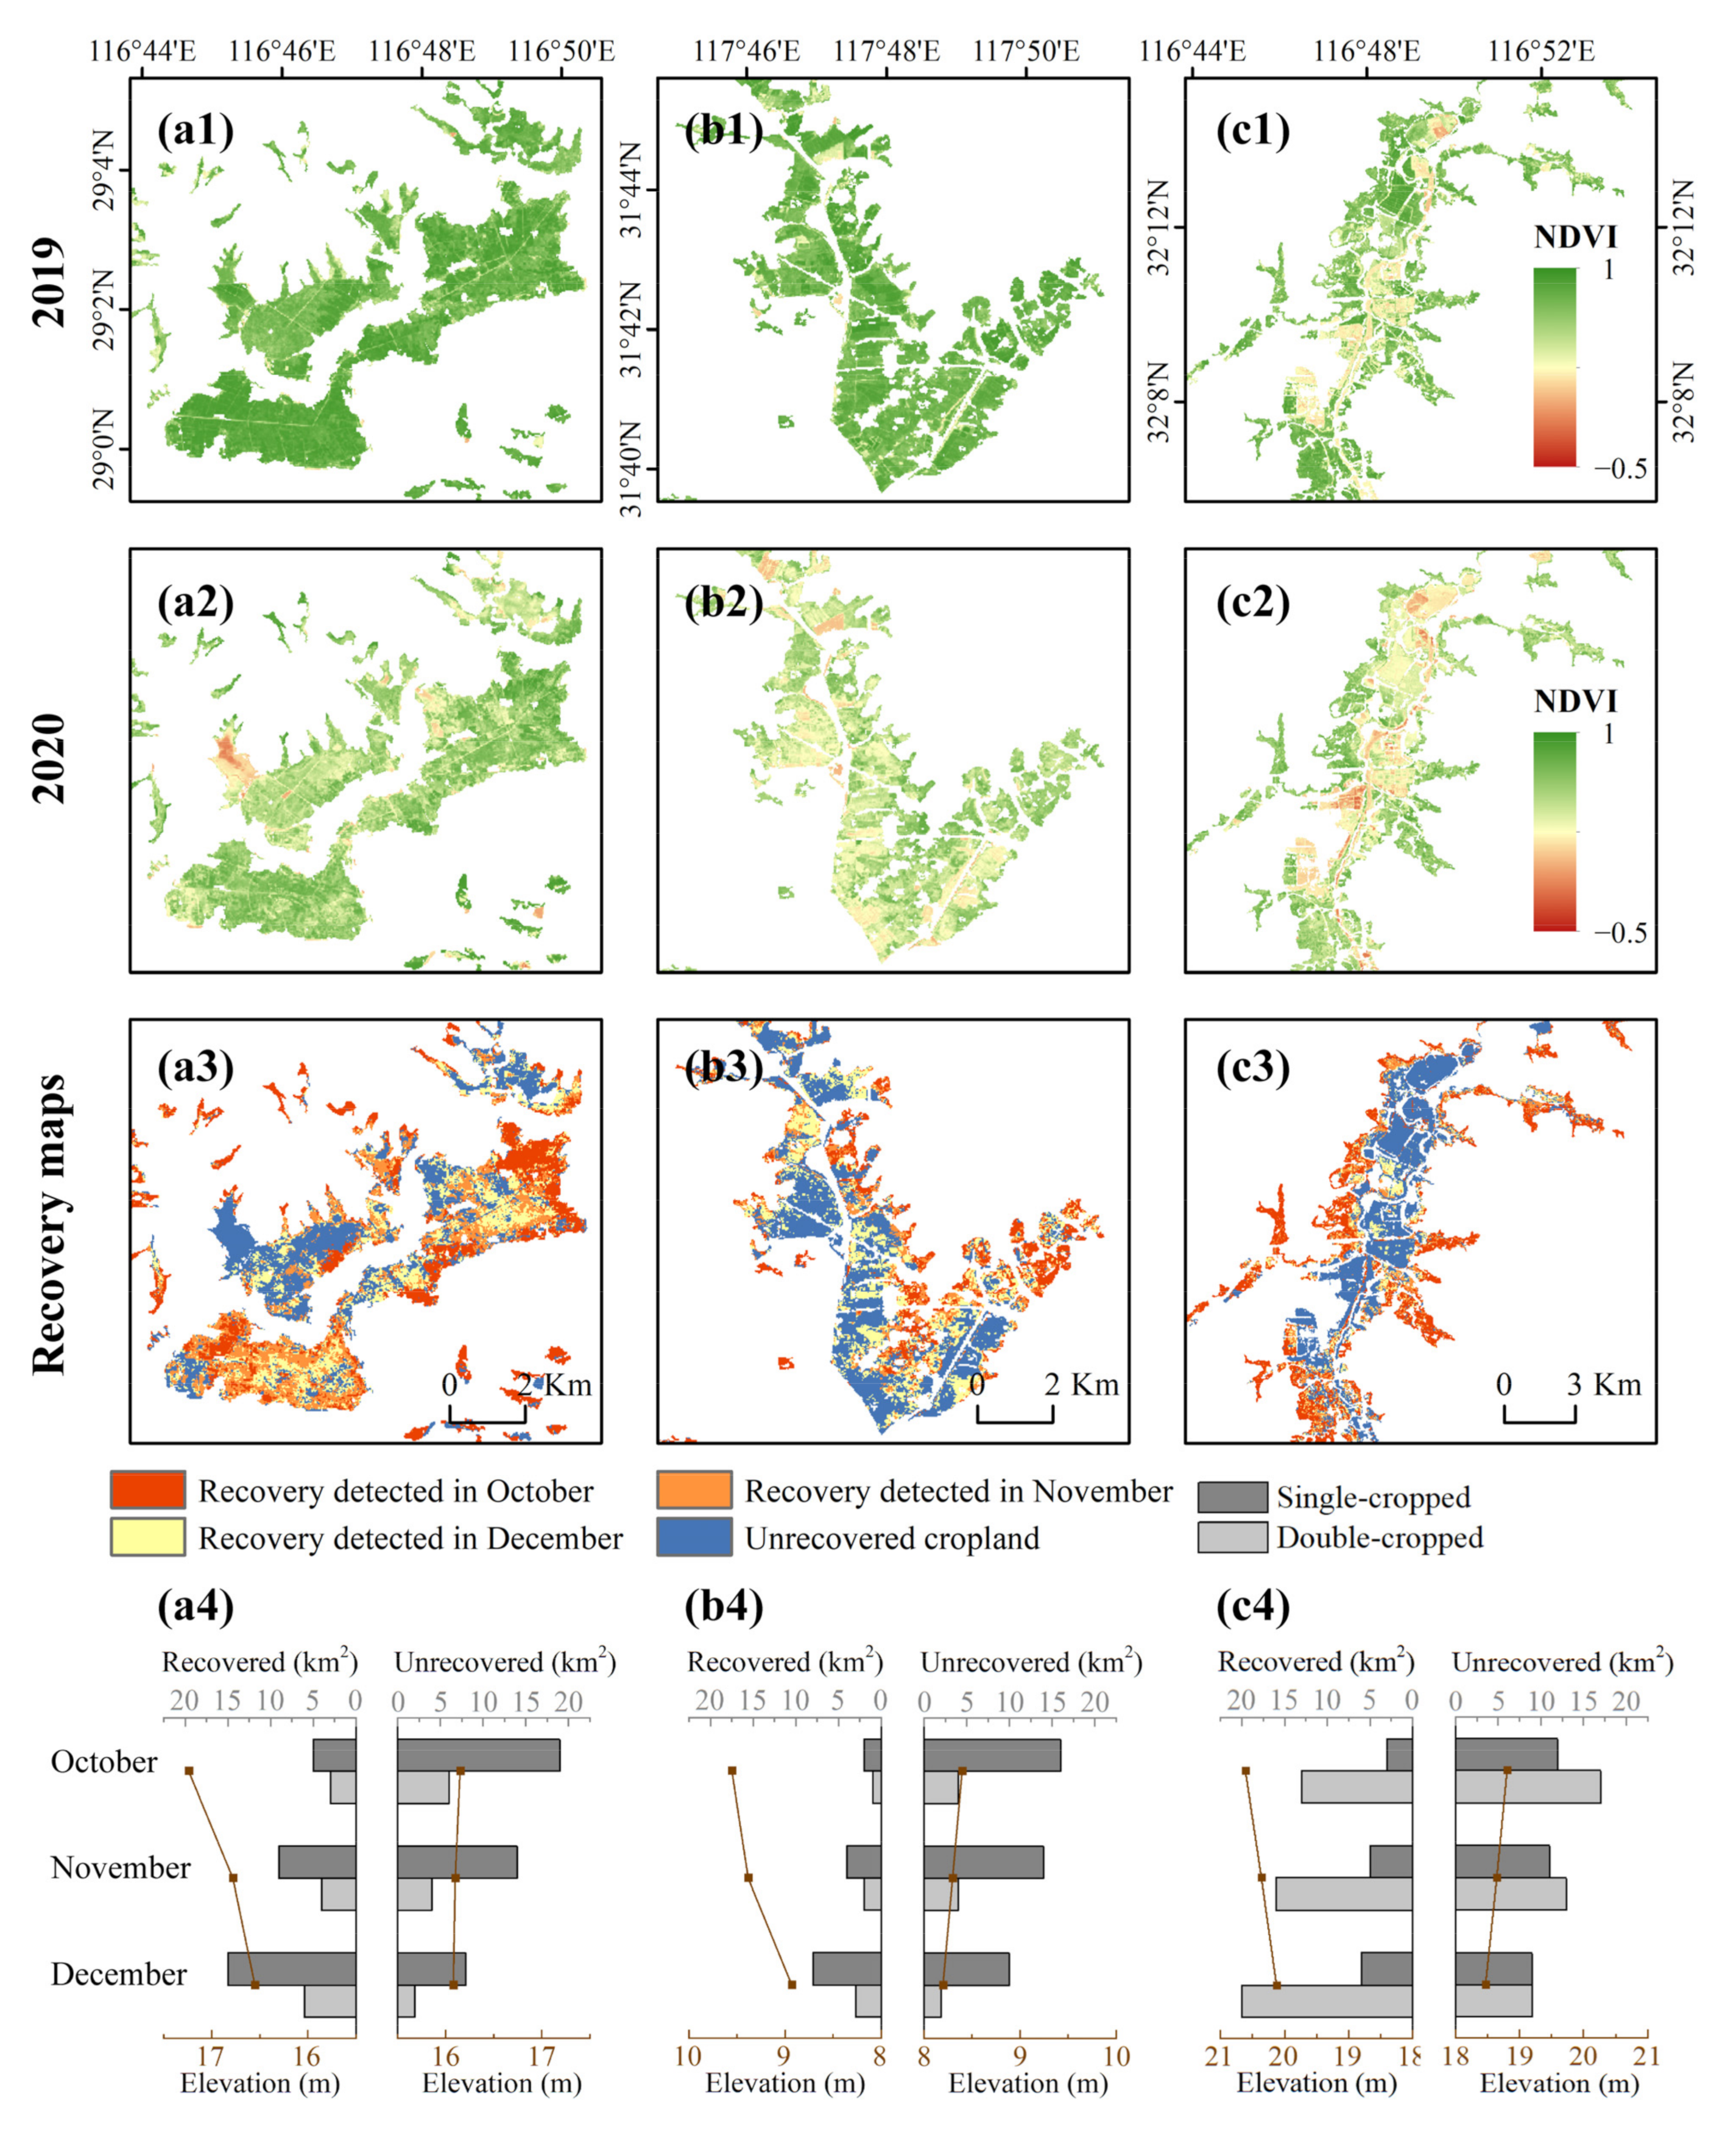
3.4. Spatial Patterns of Regional Agricultural Recovery

Figure 8, Figure 9 and Figure 10 show the spatial patterns of agricultural recovery in three study areas. Large areas of flooded cropland were located around the lake or along rivers and streams due to leave break, while sporadically distributed inland flooded croplands possibly owned to waterlogging caused by continuous precipitation during the monsoon season in 2020. All study regions showed varying degrees of gradual agricultural recovery after flooding and waterlogging disasters, where edges of affected areas and small patches of flooded lands were found earlier to recover.
In the middle–lower Huai Basin, the flooded cropland was mainly situated along the trunk (Figure 8) due to the government’s application of flood diversion and detention areas [47]. These sites were employed every few years and made great contributions to prevent a flood from destroying major cities, main traffic arteries, and large tracts of fertile land. For example, the Mengwa Flood Storage area (Figure 8a) has opened its sluice gate sixteenth times by the end of 2020. Apart from flood damages caused by artificial regulation, the lake edges in the southern Huai River were also affected due to rising water levels (Figure 8b). Nevertheless, over 80% of the flood-affected double-season croplands were classified as recovery until late December in this study (Table S3). The successful self-help production could be attributed to residents’ ample experience of flood emergency response. According to the official announcements and local news [65], suitable crops were timely replanted as long as the water receded. The active reactions reduce economic losses and avoid regional poverty for poor villages under frequent flooding threats.
Figure 9 exhibits the spatial pattern of agricultural recovery around the Chao Lake. Similarly, some paddy fields were used to diverse water for the Chao Lake (Figure 9b). Many small dispersive croplands along tributaries flooded due to rapidly rising water levels (Figure 9a). However, only around one-third of the flooded cropland was detected as recovered (Table S3), mainly distributed at the flood periphery (Figure 9). Unlike the disaster area near the Huai River, many flood storage areas around the Chao Lake had never experienced flood diversion. Therefore, mass evacuation and agricultural recovery were harder to carry out. Besides, the hydrothermal condition also possibly resulted in a relatively low recovery rate.
The status of cropland after flooding around the Poyang Lake is presented in Figure 10. Grain production is seriously affected by riverine flooding and waterlogging. For instance, the Lianhu Township (Figure 10c) and Changzhou Township (Figure 10b) in Poyang County, located east of the lake, were inundated entirely after the old embankment broke. Agricultural recovery condition was highly related to the geographical position of farmland. The Lianhu Township, located on an island in the Poyang Lake and surrounded by water, was difficult to drain away water and hence hardly showed signals of turning green and recovery (Figure 10c). In contrast, the boundary of flooded dike paddy fields (Figure 10b) or small patches of waterlogged lands away from the Poyang Lake water (Figure 10a) were found more straightforward to organize agricultural reconstruction. Overall, the damages of flooded cropland (over 70%) were reduced benefit from the emergent and periodic local recovery measurements.
In reference to the announcements released by the Department of Agriculture and Rural Affairs of Jiangxi Province [66] and Anhui Academy of Agricultural Sciences [67], primary remedial measures adjusting to different types of flooded croplands implemented by residents and agrotechnician were concluded. We summarized primary active arrangements by farmers around the flooding areas in Table S4. Flooding in the three study areas mainly affected double-cropped early rice at harvest time and single-cropped rice at late tillering stage or booting stage. After active arrangements, including draining, fertilizing, and spraying insecticide, for the cropland with a relatively high elevation and washed out in a short period, farmers rushed harvesting and planting in double-season cropland and recovering the growth of single-season rice. As for the low-lying waterlogged farmlands, once the water receded, practical measurements including replanting vegetables or dry crops, applying ratooning rice technologies, and replacing double-season late rice with early rice varieties were taken in terms of flood duration and hydrothermal condition. Our results finely captured the spatial and temporal agricultural recovery patterns in the three study sites.

4. Discussion

A practical and detailed understanding of post-flooding processes considered of human responses is essential. On the one hand, taking adaptation measures into count is necessary for comprehensive flood economic loss assessments [68]. On the other hand, the experience in agricultural recovery patterns could provide valuable information on predicting resilience in other flood-prone farmlands. Specifically, it would support enacting suitable risk reduction strategies at appropriate times and regions. Several attempts have been made to monitor long-term recovery and community resilience from severe natural disasters such as Hurricane Katrina [18,69]. Nevertheless, the effects of short-term agricultural adaptation measures such as replanting the same crop or a new one in the disaster year have not been treated in much detail.
The research proposes a method framework of mapping flood extents and quantifying rapid post-flood recovery of agricultural production. Benefit from the combined utilization of SAR and optical imagery acquired by Sentinel-1/2, a simple and effective method was proposed and used to evaluate the recovery conditions of the severe flooding events in the Yangtze and Huai River basins in July 2020. During the flood period, SAR signals can accurately penetrate through clouds and delineate inundated croplands [33,34]. While in the flood recession period, SAR-optical data fusion provides ample information on plant growth. The study has demonstrated the remarkable subsequent recovery efforts in the three disaster areas. It would inspire more flood-prone poor places worldwide to actively conduct post-disaster self-help production adapted to local circumstances.

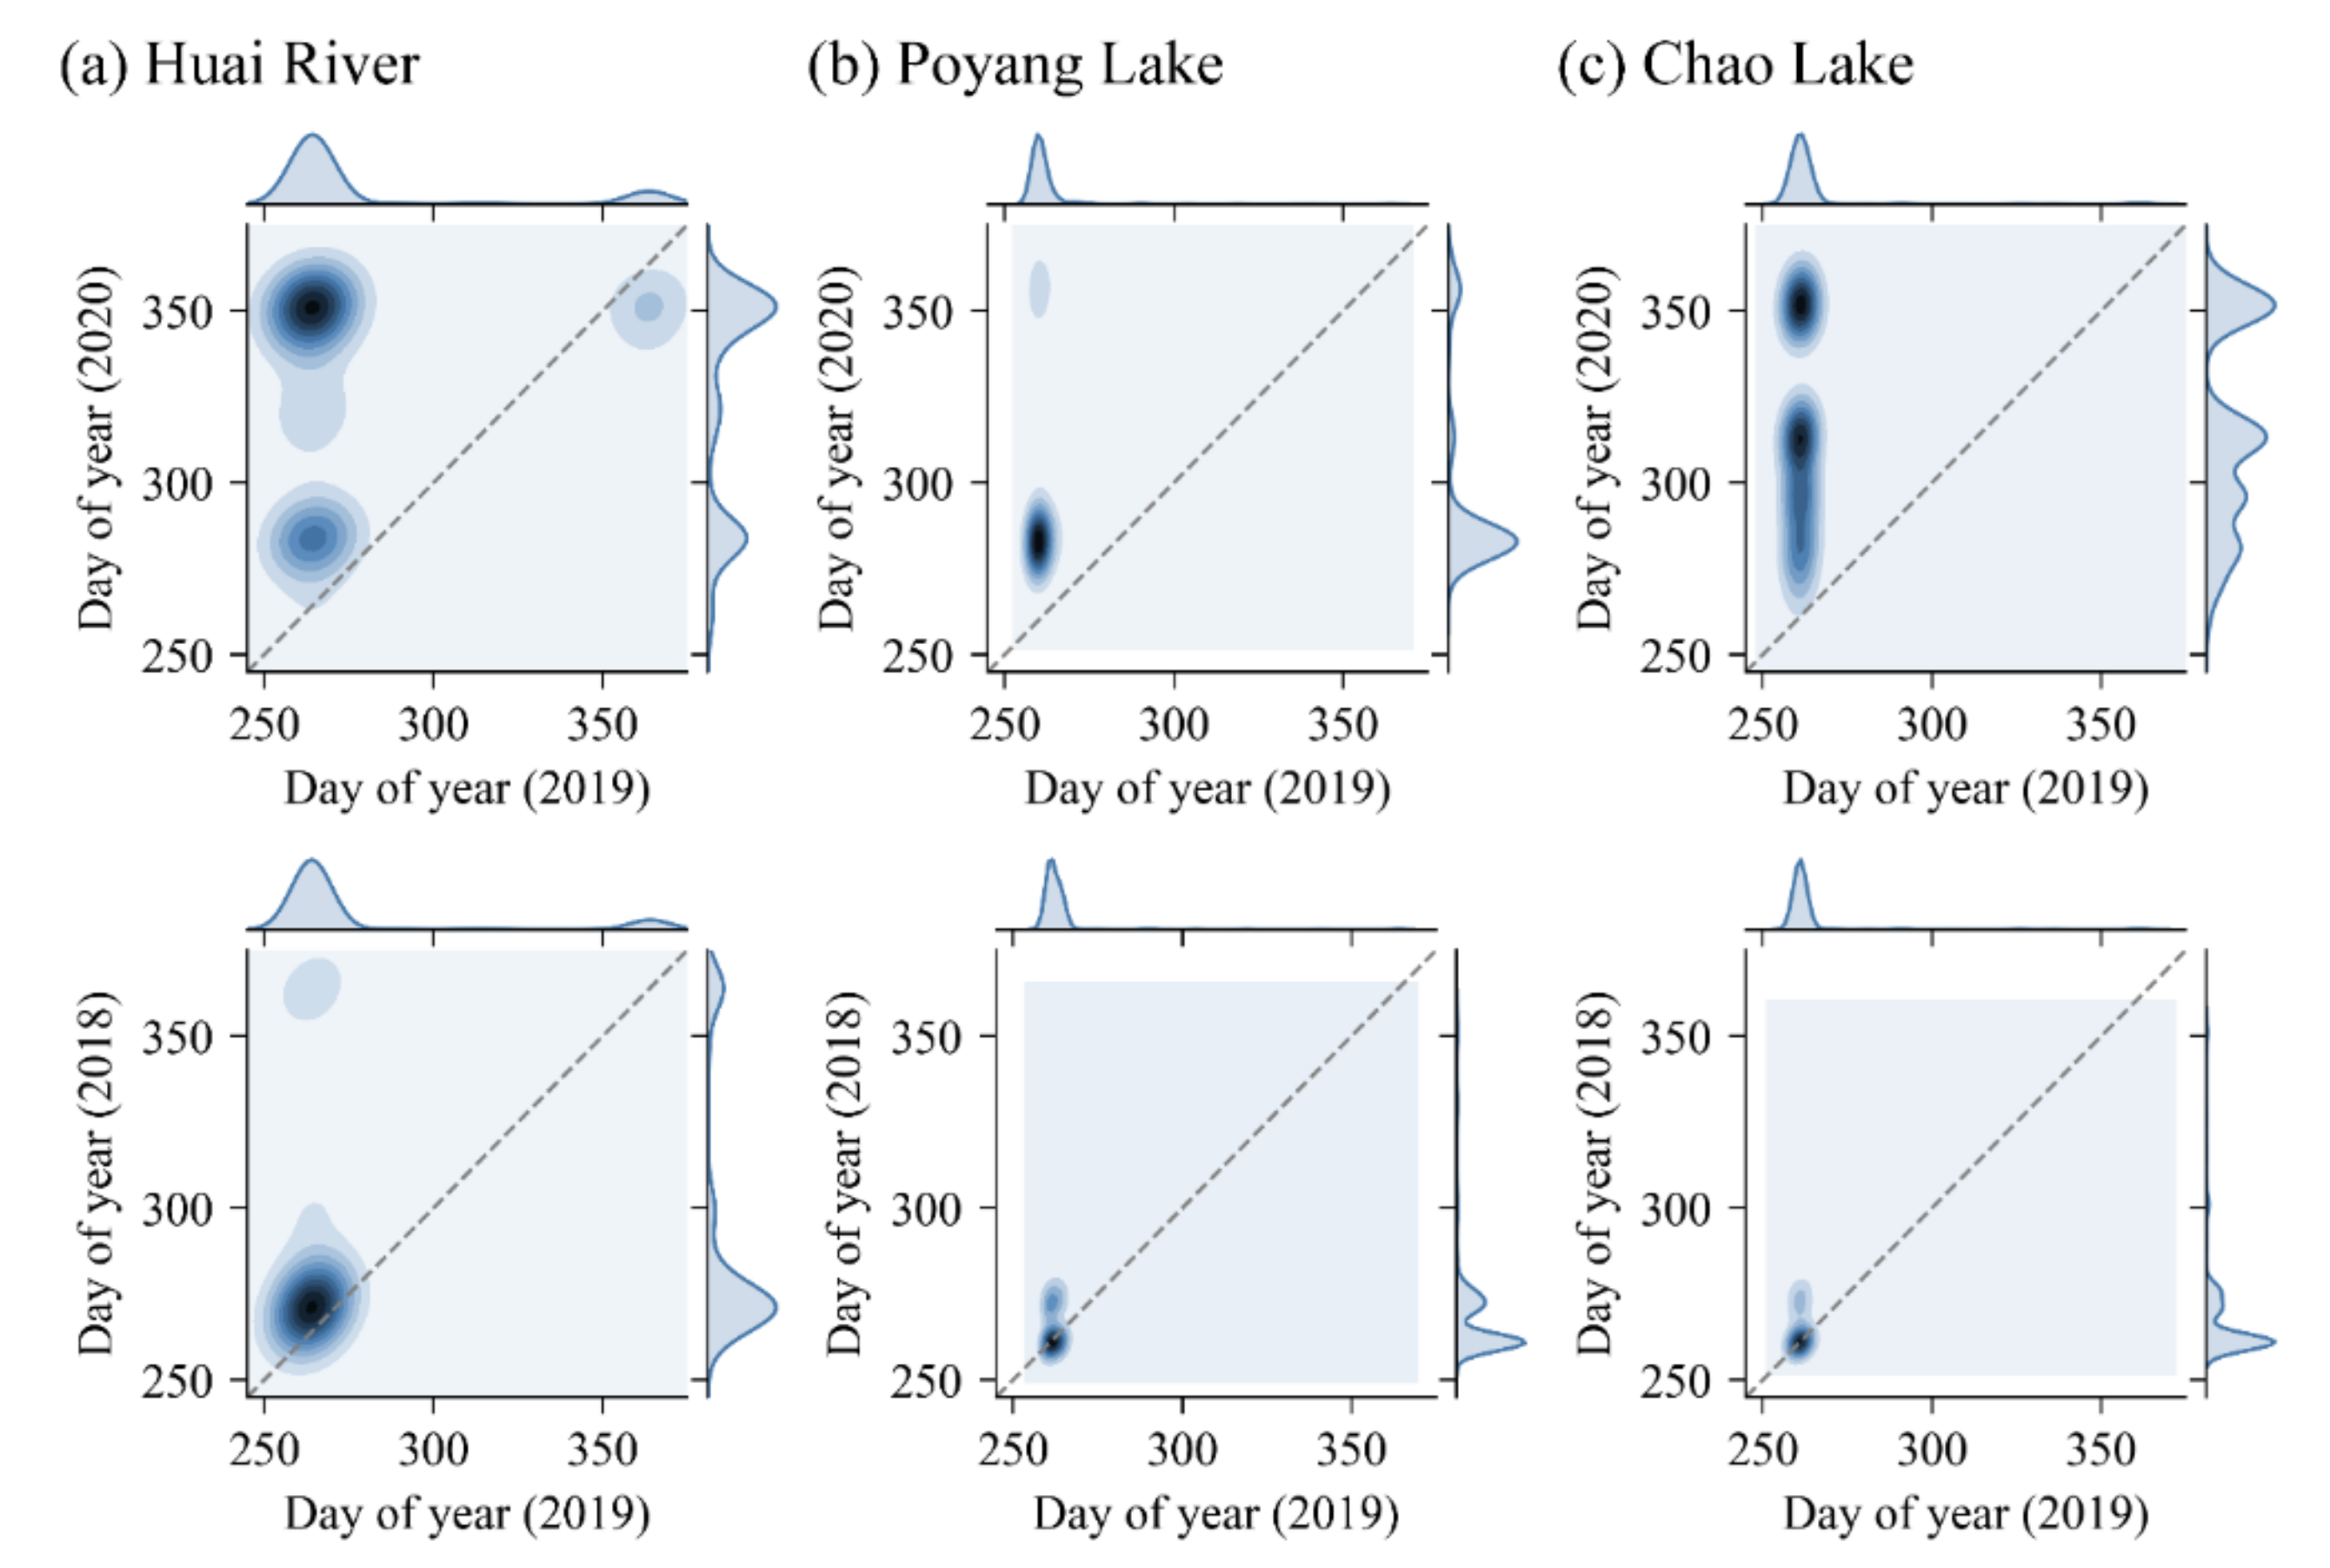
4.1. Characteristics of the Recovered Cropland

Previous researches have indicated that there is a significant association between flooded regions and plant green-up delay in the United States [70]. In this study, we also find periodical green-up delay of flood-stricken croplands in the middle and lower Yangtze and Huai Rivers, China. Different periodical recovery measurements carried out based on varying degrees of flood damage and hydrothermal condition in 2020 were visualized by joint kernel density estimation (KDE) plots. The relationship of day of year (DOY) between 2019 and 2018 on the second row (Figure 11) demonstrates no significant changes in cropping patterns, because high-density regions are primarily distributed along the diagonal lines. It is also apparent that delays of the maximum NDVI in 2020 due to floods from the vertical distribution of KDE plots in the first row (Figure 11) represent the relationship of DOY between 2019 and 2020. Besides, different periodical recovery measurements could be deduced from the two primary high-density regions.
Flood duration, also known as water persistence, has been widely used as an indicator to assess severity of flooding events [16,70,71,72]. Long flooding or waterlogging duration has significant effects on stem characteristics [73] and causes more pressure on conducting timely agricultural recovery activities. Based on the derived recovery maps, we visualized the probability density function (PDF) of the inundation frequency difference, which is defined as the difference between the inundation frequency three months after the flood peaks in 2020 and that of the same period in 2019 (Figure 12). The formula of inundation frequency is presented in Table 1. We find that the recovered croplands have the characteristics of relatively short flood recession time compared with the unrecovered lands in all three flooded areas. Despite the hydrothermal and social conditions, we could infer that the Chao Lake Region had less effective emergency responses than the Poyang Lake Region, because large proportions of flooded croplands with relative short flood duration were discarded in 2020 (Figure 12).

4.2. Uncertainties in Cropland Recovery Mapping

Some cautions should be pointed out when extrapolating the methodology to other areas. First, we provided the lowest estimated recovered proportions for the three agricultural regions using the constant threshold of −16.5 dB to delineate water extent. However, it is difficult to distinguish between unaffected paddy fields and flood-stricken croplands during monsoon season in the three study areas based on remote sensing data. In the future, SAR-optical data fusion and the flood inundation model combined with high-resolution terrain data would help delineate more precise flooded croplands.
Second, the cropping intensity dataset for extracting the cropland area was produced from 2016 to 2018 [37]. Although no significant change (e.g., cropland losses with urban expansion or policy implementation year of returning farmlands to lakes) occurred in crop areas and rotation patterns in the three study areas in 2020, the time gap would still deteriorate the accuracy of the results.
Third, in this study, a primary hypothesis is that croplands in the three study areas were supposed to have a period of high greenness from middle September 2020 to late December 2020 if not affected by the flooding disasters. This assumption is reasonable for double-, triple-, and most single-cropped farmlands in our three study areas. One exception exists in a small proportion of single-cropped lands where the crop maturity and harvest time are similar to double-cropped early crops. Such cropland was merely affected by the flooding and did not need recovery intervention because the land in the normal second-half years was uncropped.
A localized comparison of maximum NDVI from mid-September to the end of December in 2019 and 2020 is shown in Figure 13. The geographic locations of the three representative sites are exhibited in Figure 8b, Figure 9a, and Figure 10b, respectively. In 2019, most areas in Figure 13(a1,b1) during the period show good crop condition and yield status inferred from the large proportion of high peak NDVI values. However, along the tributary at the southern Huai River (Figure 13(c1)), many farmlands were uncultivated in 2019 after mid-September.
To quantify the combined errors from the second and third circumstances, we plot a frequency histogram of maximum NDVI of the unrecovered croplands from mid-September to late December in 2019 for each study area (Figure 14). When applying the NDVI threshold of 0.5 to separate crops at peak growth stage from sparse vegetation or barren land, about 14% (around the Chao Lake), 24% (around the Poyang Lake), and 40% (along the Huai River) of the flooded land classified as unrecovered were found uncropped after mid-September in previous years [74]. These areas are either uncropped in 2020, or particular single-cropped lands mentioned ahead, resulting in 3.4% (around the Chao Lake), 5.4% (around the Poyang Lake), and 9.0% (along the Huai River) underestimation of the recovery rates. Therefore, a large-scale and high spatial–temporal resolution vegetation growth curve dataset, cropping intensity dataset with more details such as maturity period and crop type maps would be of great help for more precise post-disaster assessment of flooded agricultural fields.

4.3. Impications for Application and Future Development

It is worth mentioning that the successful case of agricultural recovery from flooding in China 2020 is not only because of active post-disaster measurements such as rush planting, but also benefit from hydraulic engineering, great dedication from soldiers, and corporations of local residents living in the flood detention areas, etc. Still, general experiences such as agricultural recovery measurements conducted from high to low elevations and the local response of current cropping intensities to flooding and recovery measurements (Figure 13(a4,b4,c4)) are essential for future disaster prevention and reduction. Our results indicated that, for other flood-prone agricultural regions worldwide, annually flooding duration maps combined with natural conditions (e.g., terrain, heat and precipitation) and socioeconomic backgrounds would help delineate potential areas to conduct timely agricultural recovery and schedule appropriate cropping patterns. Future studies on the current topic would help vulnerable areas increase adaptability to global climate change and reduce the adverse effects of extreme weather events in rural agricultural areas.

5. Conclusions

The present study was designed to determine the effects of agricultural recovery measurements after the catastrophic flooding at three seriously affected grain-producing areas in China 2020 with multi-sensor and multi-temporal satellite data. The results have shown that croplands in all study areas have experienced flooding and waterlogging at varying degrees. In contrast, as a result of active coping, over 33~72% of the affected croplands were replanted and recovered from flooding. These results have significant implications for understanding how much governments and residents could do to reduce the flood damage with timely measures adapted to local conditions. The findings will be of interest to major grain-producing countries where some districts are exposed to constant flooding threats like climate change. Understanding the spatial distribution of flood-prone cropland and the characteristics of water recession and agricultural recovery is significant. By exploiting the potential of land resources, optimizing the management of agricultural disaster assistance, applying continuous post-disaster monitoring, and motivating local residents to conduct measurements according to local hydrothermal conditions would potentially contribute to the world’s flood control and management.

Supplementary Materials

The following supporting information can be downloaded at: https://www.mdpi.com/article/10.3390/rs14030690/s1. Table S1: The acquisition date and identifier information of the employed Sentinel-1 IW datasets for flood extent extraction, Table S2: Water areas within croplands extracted by different thresholds and sieving values between the normal year (2019) and the flood year (2020), Table S3: Statistics of the flood-affected croplands and recovery conditions in the three study areas, Table S4: Active arrangements summarized in reference to the official announcements, Figure S1: Spatial distribution of visually interpreted training and test samples for water extraction method comparison, Figure S2: Receiver operating characteristic (ROC) curve for water extraction threshold selection. The ROC curve was calculated over the dataset of 892 validation points.

Author Contributions

Conceptualization, M.L. and B.X.; methodology, M.L.; software, M.L.; validation, M.L.; formal analysis, M.L.; investigation, M.L., T.Z. and Y.T.; resources, M.L.; data curation, M.L.; writing—original draft preparation, M.L.; writing—review and editing, T.Z., Z.R., Y.T. and B.X.; visualization, M.L.; supervision, B.X.; project administration, B.X.; funding acquisition, B.X. All authors have read and agreed to the published version of the manuscript.

Funding

This study was supported by the Major Program of the National Natural Science Foundation of China (42090015) and the National Natural Science Foundation of China (42071400, 72091514).

Acknowledgments

The authors would like to thank the “National Earth System Science Data Center, National Science & Technology Infrastructure of China. (http://www.geodata.cn (accessed on 15 December 2020))” for their data support.

Conflicts of Interest

The authors declare no conflict of interest.

References

  1. Field, C.B.; Barros, V.; Stocker, T.F.; Dahe, Q. Managing the Risks of Extreme Events and Disasters to Advance Climate Change Adaptation: Special Report of the Intergovernmental Panel on Climate Change; Cambridge University Press: Cambridge, UK, 2012. [Google Scholar]
  2. Centre for Research on the Epidemiology of Disasters CRED & UN office for Disaster Risk Reduction. The Human Cost of Disasters: An Overview of the Last 20 Years (2000–2019). Available online: https://reliefweb.int/sites/reliefweb.int/files/resources/Human%20Cost%20of%20Disasters%202000-2019%20Report%20-%20UN%20Office%20for%20Disaster%20Risk%20Reduction.pdf (accessed on 5 May 2021).
  3. Tellman, B.; Sullivan, J.; Kuhn, C.; Kettner, A.; Doyle, C.; Brakenridge, G.; Erickson, T.; Slayback, D.J.N. Satellite imaging reveals increased proportion of population exposed to floods. Nature 2021, 596, 80–86. [Google Scholar] [CrossRef]
  4. Posthumus, H.; Morris, J.; Hess, T.M.; Neville, D.; Phillips, E.; Baylis, A. Impacts of the summer 2007 floods on agriculture in England. J. Flood Risk Manag. 2009, 2, 182–189. [Google Scholar] [CrossRef]
  5. Boschetti, M.; Nelson, A.; Nutini, F.; Manfron, G.; Busetto, L.; Barbieri, M.; Laborte, A.; Raviz, J.; Holecz, F.; Mabalay, M.R.O.; et al. Rapid Assessment of Crop Status: An Application of MODIS and SAR Data to Rice Areas in Leyte, Philippines Affected by Typhoon Haiyan. Remote Sens. 2015, 7, 6535–6557. [Google Scholar] [CrossRef] [Green Version]
  6. Singha, M.; Dong, J.W.; Sarmah, S.; You, N.S.; Zhou, Y.; Zhang, G.L.; Doughty, R.; Xiao, X.M. Identifying floods and flood-affected paddy rice fields in Bangladesh based on Sentinel-1 imagery and Google Earth Engine. ISPRS J. Photogramm. Remote Sens. 2020, 166, 278–293. [Google Scholar] [CrossRef]
  7. Uddin, K.; Matin, M.A.; Meyer, F.J. Operational Flood Mapping Using Multi-Temporal Sentinel-1 SAR Images: A Case Study from Bangladesh. Remote Sens. 2019, 11, 1581. [Google Scholar] [CrossRef] [Green Version]
  8. Dao, P.D.; Liou, Y.-A. Object-Based Flood Mapping and Affected Rice Field Estimation with Landsat 8 OLI and MODIS Data. Remote Sens. 2015, 7, 5077–5097. [Google Scholar] [CrossRef] [Green Version]
  9. Son, N.T.; Chen, C.F.; Chen, C.R.; Chang, L.Y. Satellite-based investigation of flood-affected rice cultivation areas in Chao Phraya River Delta, Thailand. ISPRS J. Photogramm. Remote Sens. 2013, 86, 77–88. [Google Scholar] [CrossRef]
  10. He, X.; Hayes, D.J.; Zhang, W. The Impact of Flooding on China’s Agricultural Production and Food Security in 2020. Agric. Policy Rev. 2020, 2020, 4. [Google Scholar]
  11. Tong, X.; Luo, X.; Liu, S.; Xie, H.; Chao, W.; Liu, S.; Liu, S.; Makhinov, A.N.; Makhinova, A.F.; Jiang, Y. An approach for flood monitoring by the combined use of Landsat 8 optical imagery and COSMO-SkyMed radar imagery. ISPRS J. Photogramm. Remote Sens. 2018, 136, 144–153. [Google Scholar] [CrossRef]
  12. DeVries, B.; Huang, C.; Armston, J.; Huang, W.; Jones, J.W.; Lang, M.W. Rapid and robust monitoring of flood events using Sentinel-1 and Landsat data on the Google Earth Engine. Remote Sens. Environ. 2020, 240, 111664. [Google Scholar] [CrossRef]
  13. Chini, M.; Pelich, R.; Pulvirenti, L.; Pierdicca, N.; Hostache, R.; Matgen, P. Sentinel-1 InSAR Coherence to Detect Floodwater in Urban Areas: Houston and Hurricane Harvey as A Test Case. Remote Sens. 2019, 11, 107. [Google Scholar] [CrossRef] [Green Version]
  14. Shen, X.; Wang, D.; Mao, K.; Anagnostou, E.; Hong, Y. Inundation Extent Mapping by Synthetic Aperture Radar: A Review. Remote Sens. 2019, 11, 879. [Google Scholar] [CrossRef] [Green Version]
  15. Psomiadis, E.; Diakakis, M.; Soulis, K.X. Combining SAR and Optical Earth Observation with Hydraulic Simulation for Flood Mapping and Impact Assessment. Remote Sens. 2020, 12, 3980. [Google Scholar] [CrossRef]
  16. Rättich, M.; Martinis, S.; Wieland, M. Automatic Flood Duration Estimation Based on Multi-Sensor Satellite Data. Remote Sens. 2020, 12, 643. [Google Scholar] [CrossRef] [Green Version]
  17. Kotera, A.; Nagano, T.; Hanittinan, P.; Koontanakulvong, S. Assessing the degree of flood damage to rice crops in the Chao Phraya delta, Thailand, using MODIS satellite imaging. Paddy Water Environ. 2016, 14, 271–280. [Google Scholar] [CrossRef]
  18. Li, X.; Yu, L.; Xu, Y.; Yang, J.; Gong, P. Ten years after Hurricane Katrina: Monitoring recovery in New Orleans and the surrounding areas using remote sensing. Sci. Bull. 2016, 61, 1460–1470. [Google Scholar] [CrossRef] [Green Version]
  19. Lee, K.S.; Lee, S.I. Assessment of post-flooding conditions of rice fields with multi-temporal satellite SAR data. Int. J. Remote Sens. 2003, 24, 3457–3465. [Google Scholar] [CrossRef]
  20. Wagner, W.; Freeman, V.; Cao, S.; Matgen, P.; Chini, M.; Salamon, P.; McCormick, N.; Martinis, S.; Bauer-Marschallinger, B.; Navacchi, C.; et al. Data Processing Architectures for Monitoring Floods Using Sentinel-1. ISPRS Ann. Photogramm. Remote Sens. Spat. Inf. Sci. 2020, V-3-2020, 641–648. [Google Scholar] [CrossRef]
  21. Tsyganskaya, V.; Martinis, S.; Marzahn, P.; Ludwig, R. SAR-based detection of flooded vegetation—A review of characteristics and approaches. Int. J. Remote Sens. 2018, 39, 2255–2293. [Google Scholar] [CrossRef]
  22. Landuyt, L.; Van Wesemael, A.; Schumann, G.J.P.; Hostache, R.; Verhoest, N.E.C.; Van Coillie, F.M.B. Flood Mapping Based on Synthetic Aperture Radar: An Assessment of Established Approaches. IEEE Trans. Geosci. Remote Sens. 2019, 57, 722–739. [Google Scholar] [CrossRef]
  23. Musa, Z.N.; Popescu, I.; Mynett, A. A review of applications of satellite SAR, optical, altimetry and DEM data for surface water modelling, mapping and parameter estimation. Hydrol. Earth Syst. Sci. 2015, 19, 3755–3769. [Google Scholar] [CrossRef] [Green Version]
  24. Dan, L.; Baosheng, W.; Bowei, C.; Yuan, X.; Yi, Z. Review of water body information extraction based on satellite remote sensing. J. Tsinghua Univ. 2020, 60, 147–161. [Google Scholar] [CrossRef]
  25. Malinowski, R.; Groom, G.B.; Heckrath, G.; Schwanghart, W. Do Remote Sensing Mapping Practices Adequately Address Localized Flooding? A Critical Overview. Springer Sci. Rev. 2017, 5, 1–17. [Google Scholar] [CrossRef]
  26. Huang, W.; DeVries, B.; Huang, C.; Lang, M.W.; Jones, J.W.; Creed, I.F.; Carroll, M.L. Automated Extraction of Surface Water Extent from Sentinel-1 Data. Remote Sens. 2018, 10, 797. [Google Scholar] [CrossRef] [Green Version]
  27. DeVries, B.; Huang, C.; Lang, M.; Jones, J.; Huang, W.; Creed, I.; Carroll, M. Automated Quantification of Surface Water Inundation in Wetlands Using Optical Satellite Imagery. Remote Sens. 2017, 9, 807. [Google Scholar] [CrossRef] [Green Version]
  28. Dronova, I.; Gong, P.; Wang, L.; Zhong, L. Mapping dynamic cover types in a large seasonally flooded wetland using extended principal component analysis and object-based classification. Remote Sens. Environ. 2015, 158, 193–206. [Google Scholar] [CrossRef]
  29. Sagar, S.; Roberts, D.; Bala, B.; Lymburner, L. Extracting the intertidal extent and topography of the Australian coastline from a 28 year time series of Landsat observations. Remote Sens. Environ. 2017, 195, 153–169. [Google Scholar] [CrossRef]
  30. Dai, C.; Howat, I.M.; Larour, E.; Husby, E. Coastline extraction from repeat high resolution satellite imagery. Remote Sens. Environ. 2019, 229, 260–270. [Google Scholar] [CrossRef]
  31. Li, W.; Gong, P. Continuous monitoring of coastline dynamics in western Florida with a 30-year time series of Landsat imagery. Remote Sens. Environ. 2016, 179, 196–209. [Google Scholar] [CrossRef]
  32. Moya, L.; Mas, E.; Koshimura, S. Learning from the 2018 Western Japan Heavy Rains to Detect Floods during the 2019 Hagibis Typhoon. Remote Sens. 2020, 12, 2244. [Google Scholar] [CrossRef]
  33. Jiang, X.; Liang, S.; He, X.; Ziegler, A.D.; Lin, P.; Pan, M.; Wang, D.; Zou, J.; Hao, D.; Mao, G.; et al. Rapid and large-scale mapping of flood inundation via integrating spaceborne synthetic aperture radar imagery with unsupervised deep learning. ISPRS J. Photogramm. Remote Sens. 2021, 178, 36–50. [Google Scholar] [CrossRef]
  34. Dong, Z.; Wang, G.; Amankwah, S.O.Y.; Wei, X.; Hu, Y.; Feng, A. Monitoring the summer flooding in the Poyang Lake area of China in 2020 based on Sentinel-1 data and multiple convolutional neural networks. Int. J. Appl. Earth Obs. Geoinf. 2021, 102, 102400. [Google Scholar] [CrossRef]
  35. Teng, J.; Jakeman, A.J.; Vaze, J.; Croke, B.F.W.; Dutta, D.; Kim, S. Flood inundation modelling: A review of methods, recent advances and uncertainty analysis. Environ. Model. Softw. 2017, 90, 201–216. [Google Scholar] [CrossRef]
  36. Pekel, J.-F.; Cottam, A.; Gorelick, N.; Belward, A.S. High-resolution mapping of global surface water and its long-term changes. Nature 2016, 540, 418–422. [Google Scholar] [CrossRef]
  37. Liu, C.; Zhang, Q.; Tao, S.; Qi, J.; Ding, M.; Guan, Q.; Wu, B.; Zhang, M.; Nabil, M.; Tian, F.; et al. A new framework to map fine resolution cropping intensity across the globe: Algorithm, validation, and implication. Remote Sens. Environ. 2020, 251, 112095. [Google Scholar] [CrossRef]
  38. Rosser, J.F.; Leibovici, D.G.; Jackson, M.J. Rapid flood inundation mapping using social media, remote sensing and topographic data. Nat. Hazards 2017, 87, 103–120. [Google Scholar] [CrossRef] [Green Version]
  39. Flood-Mapping Tool Could Change How Agricultural Planning Works. Available online: https://www.openaccessgovernment.org/flood-mapping-tool/121488/ (accessed on 5 December 2021).
  40. Li, S.; Sun, D.; Goldberg, M.D.; Sjoberg, B.; Santek, D.; Hoffman, J.P.; DeWeese, M.; Restrepo, P.; Lindsey, S.; Holloway, E. Automatic near real-time flood detection using Suomi-NPP/VIIRS data. Remote Sens. Environ. 2018, 204, 672–689. [Google Scholar] [CrossRef]
  41. Nardi, F.; Annis, A.; Di Baldassarre, G.; Vivoni, E.R.; Grimaldi, S. GFPLAIN250m, a global high-resolution dataset of Earth’s floodplains. Sci. Data 2019, 6, 180309. [Google Scholar] [CrossRef]
  42. Nardi, F.; Morrison, R.R.; Annis, A.; Grantham, T.E. Hydrologic scaling for hydrogeomorphic floodplain mapping: Insights into human-induced floodplain disconnectivity. River Res. Appl. 2018, 34, 675–685. [Google Scholar] [CrossRef]
  43. Nardi, F.; Vivoni, E.R.; Grimaldi, S. Investigating a floodplain scaling relation using a hydrogeomorphic delineation method. Water Resour. Res. 2006, 42, W09409. [Google Scholar] [CrossRef]
  44. Sakamoto, T.; Van Nguyen, N.; Kotera, A.; Ohno, H.; Ishitsuka, N.; Yokozawa, M. Detecting temporal changes in the extent of annual flooding within the Cambodia and the Vietnamese Mekong Delta from MODIS time-series imagery. Remote Sens. Environ. 2007, 109, 295–313. [Google Scholar] [CrossRef]
  45. Rahman, M.S.; Di, L. A Systematic Review on Case Studies of Remote-Sensing-Based Flood Crop Loss Assessment. Agriculture 2020, 10, 131. [Google Scholar] [CrossRef] [Green Version]
  46. Li, S.; Goldberg, M.D.; Sjoberg, W.; Zhou, L.; Nandi, S.; Chowdhury, N.; Straka, W.; Yang, T.; Sun, D. Assessment of the Catastrophic Asia Floods and Potentially Affected Population in Summer 2020 Using VIIRS Flood Products. Remote Sens. 2020, 12, 3176. [Google Scholar] [CrossRef]
  47. Eight Flood Storage Areas along the Main Stream of the Huai River are Subsiding Water. Available online: http://www.gov.cn/xinwen/2020-08/01/content_5531885.htm (accessed on 5 May 2021).
  48. Yan, H.; Huang, H.; Xiao, X.J.A.E.S. Spatio-temporal distribution of multiple cropping systems in the Poyang Lake region. Acta Ecol. Sin. 2008, 28, 4517–4523. [Google Scholar]
  49. Sentinel-1. Available online: https://sentinel.esa.int/web/sentinel/missions/sentinel-1 (accessed on 5 December 2021).
  50. Sentinel-1 Algorithms. Available online: https://developers.google.com/earth-engine/guides/sentinel1 (accessed on 22 May 2021).
  51. Clement, M.A.; Kilsby, C.G.; Moore, P. Multi-temporal synthetic aperture radar flood mapping using change detection. J. Flood Risk Manag. 2018, 11, 152–168. [Google Scholar] [CrossRef]
  52. Sentinel-2 User Handbook. Available online: https://sentinel.esa.int/documents/247904/685211/Sentinel-2_User_Handbook (accessed on 5 May 2021).
  53. A 30-m Planetary-Scale Cropping Intensity Dataset. Available online: http://www.geodata.cn/data/datadetails.html?dataguid=8950600&docid=96 (accessed on 3 December 2020).
  54. Farr, T.G.; Rosen, P.A.; Caro, E.; Crippen, R.; Duren, R.; Hensley, S.; Kobrick, M.; Paller, M.; Rodriguez, E.; Roth, L.; et al. The Shuttle Radar Topography Mission. Rev. Geophys. 2007, 45, RG2004. [Google Scholar] [CrossRef] [Green Version]
  55. Moya, L.; Endo, Y.; Okada, G.; Koshimura, S.; Mas, E. Drawback in the Change Detection Approach: False Detection during the 2018 Western Japan Floods. Remote Sens. 2019, 11, 2320. [Google Scholar] [CrossRef] [Green Version]
  56. Szeliski, R. Computer Vision: Algorithms and Applications; Springer Science & Business Media: Berlin, Germany, 2010. [Google Scholar]
  57. Otsu, N. A threshold selection method from gray-level histograms. IEEE Trans. Syst. Man Cybern. 1979, 9, 62–66. [Google Scholar] [CrossRef] [Green Version]
  58. Donchyts, G.; Schellekens, J.; Winsemius, H.; Eisemann, E.; van de Giesen, N. A 30 m Resolution Surface Water Mask Including Estimation of Positional and Thematic Differences Using Landsat 8, SRTM and OpenStreetMap: A Case Study in the Murray-Darling Basin, Australia. Remote Sens. 2016, 8, 386. [Google Scholar] [CrossRef] [Green Version]
  59. Donchyts, G. Planetary-Scale Surface Water Detection from Space. Ph.D. Thesis, Delft University of Technology, Delft, The Netherlands, 2018. [Google Scholar]
  60. Pettorelli, N.; Vik, J.O.; Mysterud, A.; Gaillard, J.M.; Tucker, C.J.; Stenseth, N.C. Using the satellite-derived NDVI to assess ecological responses to environmental change. Trends Ecol. Evol. 2005, 20, 503–510. [Google Scholar] [CrossRef]
  61. McFeeters, S.K. The use of the Normalized Difference Water Index (NDWI) in the delineation of open water features. Int. J. Remote Sens. 2007, 17, 1425–1432. [Google Scholar] [CrossRef]
  62. Breiman, L. Random forests. Mach. Learn. 2001, 45, 5–32. [Google Scholar] [CrossRef] [Green Version]
  63. Liu, H.Q.; Huete, A. A feedback based modification of the NDVI to minimize canopy background and atmospheric noise. IEEE Trans. Geosci. Remote Sens. 1995, 33, 457–465. [Google Scholar] [CrossRef]
  64. Gorelick, N.; Hancher, M.; Dixon, M.; Ilyushchenko, S.; Thau, D.; Moore, R. Google Earth Engine: Planetary-scale geospatial analysis for everyone. Remote Sens. Environ. 2017, 202, 18–27. [Google Scholar] [CrossRef]
  65. The Ongoing Reconstructions to Regulate the Huai River and Prevent Disasters Benefit Residents for a Long Time. Available online: http://www.ahnews.com.cn/yaowen1/pc/con/2020-08/22/496_238585.html (accessed on 5 May 2021).
  66. Guidance on Early Rice Harvesting and Baking After Flooding, and Strengthening the Technology Application for Semilate and Late Rice to Garantee a Good Harvest. Available online: http://nync.jiangxi.gov.cn/art/2020/7/17/art_28519_2620024.html (accessed on 5 April 2021).
  67. Technical Measures to Cope with Rice Flooding in Anhui Province. Available online: http://www.aaas.org.cn/4303171/13583673.html (accessed on 4 April 2021).
  68. Mao, G.; Onfroy, T.; Moncoulon, D.; Quantin, A.; Robert, C. Comprehensive flood economic losses: Review of the potential damage and implementation of an agricultural impact model. In Proceedings of the 3rd European Conference on Flood Risk Management, Lyon, France, 17–21 October 2016; Lang, M., Klijn, F., Samuels, P., Eds.; EDP Sciences: Paris, France, 2016; Volume 7. [Google Scholar]
  69. Qiang, Y.; Huang, Q.; Xu, J. Observing community resilience from space: Using nighttime lights to model economic disturbance and recovery pattern in natural disaster. Sustain. Cities Soc. 2020, 57, 102115. [Google Scholar] [CrossRef]
  70. Shirzaei, M.; Khoshmanesh, M.; Ojha, C.; Werth, S.; Kerner, H.; Carlson, G.; Sherpa, S.F.; Zhai, G.; Lee, J.-C. Persistent impact of spring floods on crop loss in U.S. Midwest. Weather Clim. Extrem. 2021, 34, 100392. [Google Scholar] [CrossRef]
  71. Samuele, D.P.; Filippo, S.; Enrico, B.-M. Multi-temporal mapping of flood damage to crops using sentinel-1 imagery: A case study of the Sesia River (October 2020). Remote Sens. Lett. 2021, 12, 459–469. [Google Scholar] [CrossRef]
  72. Kwak, Y.; Shrestha, B.B.; Yorozuya, A.; Sawano, H. Rapid Damage Assessment of Rice Crop After Large-Scale Flood in the Cambodian Floodplain Using Temporal Spatial Data. IEEE J. Sel. Top. Appl. Earth Obs. Remote Sens. 2015, 8, 3700–3709. [Google Scholar] [CrossRef]
  73. Tian, L.; Bi, W.; Ren, X.; Li, W.; Sun, L.; Li, J. Flooding has more adverse effects on the stem structure and yield of spring maize (Zea mays L.) than waterlogging in Northeast China. Eur. J. Agron. 2020, 117, 126054. [Google Scholar] [CrossRef]
  74. The Climate Data Guide. NDVI: Normalized-Difference-Vegetation-Index: NOAA AVHRR. Available online: https://climatedataguide.ucar.edu/climate-data/ndvi-normalized-difference-vegetation-index-noaa-avhrr (accessed on 5 May 2021).
Figure 1. Geographic locations, flooding extents, and available Sentinel-1 imagery in July and August 2020 at three study areas: (a) the Huai River, (b) the Poyang Lake and, (c) the Chao Lake.
Remotesensing 14 00690 g001
Figure 2. In-site observations were collected on 20 September 2020, two months after the local flooding event in the Sanjiao Township, Yongxiu County. Red triangles show spatial locations and viewing direction of the photos. The background is Sentinel-1 VV polarized image acquired on 18 September 2020. Photos show croplands at different stages of waterlogging and recovery: (a) water logging, (b) recovered, (c) initial recovery, (d) severe waterlogging on the left and intial recovery on the right side of houses.
Remotesensing 14 00690 g002
Figure 3. Flowchart of the methodology.
Remotesensing 14 00690 g003
Figure 4. The procedure of water delineation methods comparison. (a) Grid tiles generation by overlapping floodplain dataset, Sentinel-1 and Sentinel-2 imagery with close dates; (b) Water/land samplings creation through visual interpretation within the grids of 0.2 × 0.2 degrees; (c) grid tiles of 0.05 × 0.05 degrees overlaying the Sentinel-1 imagery for water fraction calculation and methods comparison.
Remotesensing 14 00690 g004
Figure 5. The RGB composite of Sentinel-2 imagery in close dates of 2019 and 2020 shows gradual agricultural recovery after the flooding in 2020 in the Changzhou Township, Poyang County. The red and orange points indicate diverse recovery conditions due to different positions, cropping intensity, and flooding duration. The solid and dashed lines represent temporal trajectories of NDVI based on the two selected pixels in 2020 and 2019 separately. NDVI was derived from time series of Sentinel-2 imagery. (ae) Sentinel-2 images acquired after flooding in 2020, (fj) Sentinel-2 images in 2019 acquired with close dates in correspondance to the year of 2020.
Remotesensing 14 00690 g005
Figure 6. The relationships between reference water ratios in grids of 0.05 × 0.05 degrees derived from Random Forest algorithm using Sentinel-2 imagery and classified water ratios derived from (a) constant threshold of −16.5 dB, (b) the Global Otsu Algorithm [57], and (c) the adaptive local threshold method [58] using Sentinel-1 imagery. Grey dashed lines are the 1:1 lines.
Remotesensing 14 00690 g006
Figure 7. (a) Recovery area, and (b) recovery percentage statistics of the flood-affected croplands until late October, November, and December in the three study sites.
Remotesensing 14 00690 g007
Figure 8. Spatial pattern of agricultural recovery near the Huai River. The zoom-in maps show local recovery conditions at (a) a flood diversion and storage area and (b) edges of a tributary.
Remotesensing 14 00690 g008
Figure 9. Spatial and temporal patterns of agricultural recovery around the Chao Lake. The zoom-in maps show recovery conditions of the flooded cropland mainly due to (a) rising waters and (b) flood diversion.
Remotesensing 14 00690 g009
Figure 10. Spatial and temporal patterns of agricultural recovery around the Poyang Lake. The zoom-in maps highlight different distributions of recovered cropland owing to diverse stricken geographical locations: (a) recovered from away to close to the Poyang Lake; (b) recovered from outer to inner side of a polder; (c) unrecovered cropland as encircled by lake water.
Remotesensing 14 00690 g010
Figure 11. Joint kernel density estimation (KDE) plots show DOY delays of maximum NDVI due to flood disasters in 2020 compared with 2019 and 2018 in the three study areas: (a) the Huai River Region; (b) the Poyang Lake Region; (c) the Chao Lake Region. The KDE plots were generated by 5000 random points within the recovered flood-affected croplands.
Remotesensing 14 00690 g011
Figure 12. Probability density function (PDF) plots show differences between the inundation frequency three months after the flood peaks in 2020 and that of the same period in 2019: (a) the Huai River Region; (b) the Poyang Lake Region; (c) the Chao Lake Region. The PDF plots were generated using 2500 points within the recovered croplands and 2500 points within the unrecovered croplands by stratified random sampling.
Remotesensing 14 00690 g012
Figure 13. Local details of the classification results. The maximum NDVI composite from mid-September to December in 2019 and 2020, the zoom-in agricultural recovery map and local characteristics of recovered and unrecovered croplands in the east of the Poyang Lake (a1a4), northeast of the Chao Lake (b1b4) and south of the Huai River (c1c4).
Remotesensing 14 00690 g013
Figure 14. Frequency histograms of maximum NDVI values after 15 September 2019 at the area of classified unrecovered croplands. The dash line indicates a NDVI value of 0.5. (ac) represent the study site in the Chao Lake, the Poyang Lake, and the Huai River.
Remotesensing 14 00690 g014
Table 1. Predictor data layers utilized by the Random Forest Classifier to classify pixels as recovered croplands and unrecovered croplands.
Explanatory VariablesFormulaVariable Identifier
Near-Infrared (NIR)Near-Infrared (NIR)Nir_max
Short-wave infrared (SWIR)Short-wave infrared (SWIR)Swir_max
BlueBlueBlue_min
GreenGreenGreen_min
RedRedRed_min
Normalized Difference Vegetation Index (NDVI) [59] N I R R e d N I R + R e d NDVI_max
Enhanced Vegetation Index (EVI) [63] 2.5 × N I R R e d N I R + 6 × R e d 7.5 × B l u e + 1 EVI_max
Frequency of inundation during the flood period Σ N w a t e r Σ N t o t a l   1 VV_freq
Cropping intensityCropping intensityCI
1 N w a t e r is the number of times classified as water bodies for each pixel during the flood period in 2020. N t o t a l is the total number of Sentinel-1 observations in the flood period in 2020.
Table 2. Overall accuracies of the recovery results.
RegionOA (October)OA (November)OA (December)
Poyang Lake199%99.9%
Chao Lake99.4%99.8%98.9%
Huai River98.6%99.9%99.9%
Publisher’s Note: MDPI stays neutral with regard to jurisdictional claims in published maps and institutional affiliations.

