Article

Effectiveness of Semi-Supervised Learning and Multi-Source Data in Detailed Urban Landuse Mapping with a Few Labeled Samples

1
Shenzhen Institute of Advanced Technology, Chinese Academy of Sciences, Shenzhen 518055, China
2
Centre for Geocomputation Studies and Department of Geography, Hong Kong Baptist University, Kowloon, Hong Kong, China
3
School of Geography and Remote Sensing, Guangzhou University, Guangzhou 510006, China
*
Author to whom correspondence should be addressed.
Remote Sens. 2022, 14(3), 648; https://doi.org/10.3390/rs14030648
Submission received: 9 December 2021 / Revised: 20 January 2022 / Accepted: 25 January 2022 / Published: 29 January 2022
(This article belongs to the Section Urban Remote Sensing)

Abstract

:
Detailed urban landuse information plays a fundamental role in smart city management. A sufficient sample size has been identified as a very crucial pre-request in machine learning algorithms for urban landuse classification. However, it is often difficult to recognize and label landuse categories from remote sensing images alone. Alternatively, field investigation is time-consuming with a high demand in human resources and monetary cost. Therefore, previous studies on urban landuse classification have often relied on a small size of labeled samples with very uneven spatial distribution. This study aims to explore the effectiveness of a semi-supervised classification framework with multi-source data for detailed urban landuse classification with a few labeled samples. A disagreement-based semi-supervised learning approach, the Co-Forest, was employed and compared with traditional supervised methods (e.g., random forest and XGBoost). Multi-source geospatial data were utilized including optical and nighttime light remote sensing and geospatial big data, which present the physical and socio-economic features of landuse categories. Taking urban landuse classification in Shenzhen City as a case, results show that the classification accuracy of the semi-supervised method are generally on par with that of traditional supervised methods, and less labeled samples are needed to achieve a comparable result under different training set ratios. Given a small sample size, the accuracy tends to be stable with training samples no less than 5% in total. Our results also indicate that the classification accuracy by using multi-source data is significantly higher than that with any single data source being applied. Among these data, map POI and high-resolution optical remote sensing data make larger contributions on the classification, followed by mobile data and nighttime light remote sensing data.

1. Introduction

With the development of smart city construction, accurate and detailed urban landuse information plays a fundamental role for urban planning, resource allocation, and public administration. Up-to-date urban landuse map is in high demand in the management of a smart society. Remote sensing technology, providing the ability of wide-range observation and rapid response to change, has been widely used in many studies on urban landuse and land cover classification [1,2,3,4]. Traditional urban landuse classification techniques are based on multi-spectral remote sensing images. In addition to the spectral features, geometric and texture features are employed to obtain a more accurate classification as the spatial resolution of remote sensing imagery has improved [5,6,7]. However, it is often difficult to derive detailed urban landuse information from imagery data due to the complexity of social attributes in urban land. With the advent of the big data era, human behavior and socio-economic features from multi-source geospatial data such as taxi trajectories [8], map point-of-interest (POI) data [9,10], geo-tagged photos [11], social media data [12,13], and mobile phone data [14,15] have been utilized for urban functional zoning and landuse classification.
Numerous machine learning algorithms have been developed and applied to urban landuse classification. The number of training samples is crucial in machine learning algorithms, which is directly associated with model training performance. For instance, Wieland and Pittore [16] employed several machine learning algorithms including naive Bayes (NB), k-nearest neighbors (kNN), random trees (RT) and support vector machine (SVM) for the recognition of urban landuse patterns based on multi-scale remote sensing data. They indicated that these algorithms would show better performance if the training sample size was large enough. Sun et al. [17] compared another five classifiers including logistic regression (LR), decision tree (DT), random forests (RF), gradient boosted decision trees (GBDT), and AdaBoost in the extraction of urban built-up areas based on the integration of multi-source data. They used an official map of urban built-up areas to retrieve labeled samples and adopted a large number of samples for model training. Cao et al. [18] compared the eXtreme gradient boosting (XGBoost) algorithm with classical machine learning algorithms in urban landuse classification based on multi-source geospatial data. They chose 80% of labeled samples for model training. Zhang et al. [19] applied the RF algorithm to urban landuse classification based on the combination of remote sensing and social sensing data. They used training samples accounting for 50% of labeled samples. From the previous studies, a sufficient sample size is necessary in model training and learning. However, it is often difficult to recognize and label landuse categories from remote sensing images alone, even assisted by manual interpretation. Alternatively, field investigation is labor-intensive and time-consuming with a high demand in human resources and monetary cost [20]. Particularly for detailed urban landuse classification, challenges include obtaining more explicit and detailed landuse labels such as distinguishing between residential and commercial landuse rather than roughly labeling as a “built-up area”. It is almost impossible to obtain a reliable classification result of urban landuse with limited samples. Besides, few studies have indicated an ideal training size that balances sampling cost and classification accuracy. The selection of samples for model training is relatively arbitrary, which may result in a poor generalization performance. We still lack a theoretical guidance of sampling strategy in urban landuse classification based on the small size of samples. Due to the above reasons, most detailed urban landuse classifications face the problem of small sample learning.
Recently, semi-supervised learning methods have been increasingly developed to solve small sample learning issues [21,22]. However, the effectiveness of applying semi-supervised classification for detailed urban landuse classification has not been reported. In addition, it is broadly believed that multi-source data can provide more dimensional features for a better classification accuracy, but may also introduce redundance and even conflicting information [18,23]. Therefore, we address two research questions in this study: (1) Is the semi-supervised classification framework effective in detailed urban landuse classification with a smaller sample size? and (2) Does the use of multi-source geospatial big data effectively improve the accuracy of detailed urban landuse classification?
Considering the difficulty of obtaining a large number of labeled samples, we aimed to adopt a semi-supervised classification method for detailed urban landuse classification by incorporating the physical and socio-economic features from multi-source geospatial data. Under the small sample size level, we also attempted to test the classification stability with different proportions of training samples to find an optimal training set ratio for reliable classification results.

2. Related Work

To implement urban landuse classification based on multi-source geospatial big data including remote sensing and social attribute data, there are some key issues. (1) Traditional machine learning algorithms including deep learning methods need a large number of training samples to build a reliable classifier. However, it is usually difficult to obtain a large number of labeled samples since reliable labeling work of urban landuse types by field investigation is time-consuming and needs a high demand on human and monetary resources. (2) Considering the balance between the cost of sampling and the effect of model training, the optimal size of training samples for different algorithms in urban landuse classification has not been well addressed. This section reviews the existing urban landuse classification methods and the relevant discussion on classification stability issues with limited training samples.

2.1. Urban Landuse Classification Methods

Variety of machine learning algorithms have been developed for urban landuse and land cover classification and urban functional zoning in the past decades. Apart from remote sensing images, multi-source social sensing data have increasingly been adopted. The application of multi-source data has become an important direction of the urban landuse classification field [24]. The most commonly used algorithms include SVM, DT, RF, which are also regarded as the benchmarks in comparative analyses. Mountrakis et al. [25] reviewed the SVM algorithm in remote sensing applications and pointed out that the SVM algorithm was suitable for multi-class image classification tasks. Considering the simplicity in algorithms, the DT algorithm is widely used in remote sensing urban landuse classification with advantages of fusing complex features at different scales [26]. As a further advance of the tree-based DT algorithm, the RF algorithm is another commonly used method. Talukdar et al. [27] summarized several machine learning algorithms including RF, SVM, and artificial neural network (ANN) in landuse and land cover classification based on multi-spectral remote sensing images. They found that the RF algorithm obtained the best performance. Zhang et al. [28] compared machine learning algorithms in landuse classification based on map POI data. They drew the conclusion that the tree-based methods such as the RF algorithm performed better than the Bayesian network, rule-based learning, and the SVM. With the development of deep learning, deep neural network algorithms with high-level features have been used in the recognition of urban functional zones [29]. Jozdani et al. [30] compared deep learning algorithms with traditional machine learning algorithms in an object-based landuse classification. They indicated that traditional machine learning algorithms such as the XGBoost algorithm had a comparable result with deep learning algorithms. Besides, unsupervised algorithms such as Gaussian mixture model, the k-means algorithm, kernel density classification algorithm, and hierarchical clustering algorithm have been applied to urban landuse classification [31,32]. The classification results are generally not as good as the supervised methods.

2.2. Classification Stability with Small Sample Size

In practical applications, the use of limited samples is very common in urban landuse classification because labeled samples are always rare, and labeling a large number of unlabeled samples costs too much. A small sample size refers to a situation where the proportion of labeled or training samples is small relative to the samples to be classified. Zhao et al. [33] reviewed the current work of machine learning with small size of labeled samples. They concluded that there were still many challenges, although progress has been made in this area. Based on multi-spectral remote sensing data, Li et al. [34] tested the impact of training sample size on urban landuse classification by using supervised and unsupervised classifiers. They indicated that tree-based classifiers were more sensitive to training sample size. Based on multi-source geospatial data, Su et al. [35] analyzed the impact of training sample size on detailed urban landuse classification by using the RF algorithm. They pointed out that a stable result could be achieved with a proportion of training samples no less than 7%. From the angle of increasing labeled samples, Gong et al. [36] employed a crowd-sourcing method to obtain a large number of labeled urban landuse samples in more than 30 cities in China to improve the generalization performance of the classification model. However, considering the total number of samples to be classified over the 30 cities, the number of labeled samples is still regarded as a small size for a specific urban landuse category. Furthermore, labeling landuse information on urban land parcels is highly dependent on expert experience (e.g., urban planner) and is usually difficult to obtain through a crowd-sourcing approach.

3. Materials and Methods
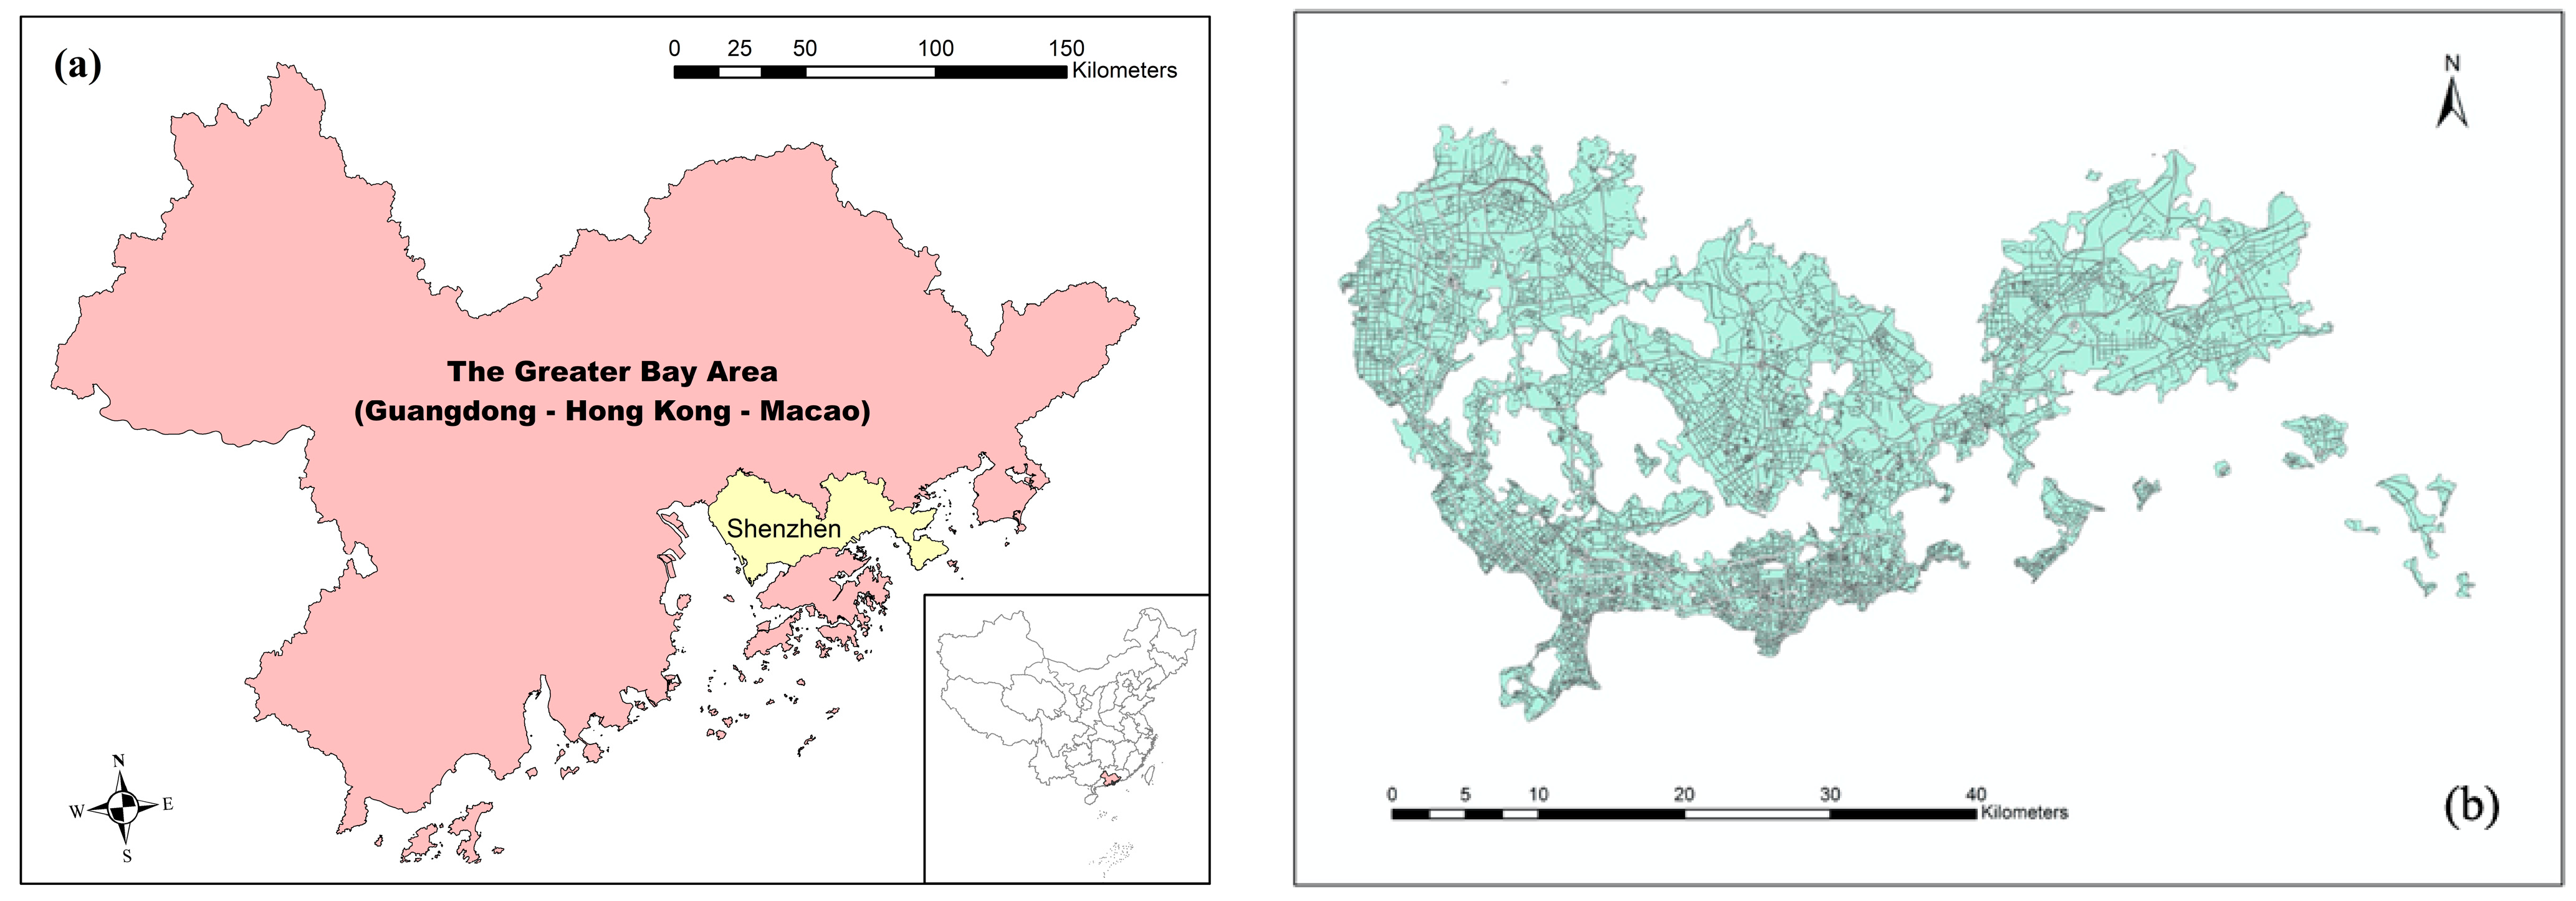
In this study, we conducted a parcel-based landuse classification based on road segmentation. We chose a set of urban landuse features from multi-source geospatial big data for model training and classification including multi-spectral and textural features from high-resolution optical remote sensing images, light brightness features from nighttime light (NTL) remote sensing images, and human activity and behavior features from map POI and mobile phone data. Based on the multi-dimensional features, we adopted a semi-supervised Co-Forest classification framework for detailed urban landuse classification, and compared it with the most popular supervised tree-based classifiers such as the RF and XGBoost. To analyze the impact of small sample size on the model performance, we also tested the stability of the classification models under different proportions of training samples.

3.1. Study Area

We chose Shenzhen City as the study area (Figure 1a). Shenzhen is a coastal city in southern China and on the border with Hong Kong. It has an area of 1997 km2 with a population of more than 13 million by the end of 2020. The city is one of the pioneer cities experiencing reform and the opening-up policy in China. With rapid urban development in the past decades, it has experienced a dramatic change including changes in the urban landscape. Shenzhen has been designated as a national pilot city for China’s comprehensive reform, and to lead the construction of the Guangdong–Hong Kong–Macao Greater Bay Area. New residential areas, industrial parks, transport network, and tourism infrastructure have been planned. More changes in urban landscape are expected in the future. As one of the fastest growing cities in China, Shenzhen can offer more open and comprehensive geospatial big data and is regarded as a natural template for urban studies.

3.2. Road Segmentation for Land Parcels

Road network information from an open-source dataset—OpenStreetMap (OSM) (https://www.openstreetmap.org, accessed on 6 December 2021)—was utilized to divide the whole study area into land parcels. Two levels of important roads from the OSM data were utilized, namely, the main road and secondary road. The geometry of the road network is presented in the OSM data with single lines (i.e., road centerline). Buffer zones were applied to those lines based on the widths of the roads, which were determined by road levels. Since we aimed to classify detailed urban landuse rather than land cover, an impervious surface data of Shenzhen from GAIA_2018 (http://data.ess.tsinghua.edu.cn/gaia.html, accessed on 6 December 2021) was utilized to mask non-built-up areas such as woodland, grassland, wetland. The sizes of land parcels were heterogeneous. After segmentation, very small land parcels with an area of less than 1000 square meters were removed. Finally, the number of urban land parcels to be classified was more than 6800. Figure 1b shows the distribution of these land parcels in Shenzhen.

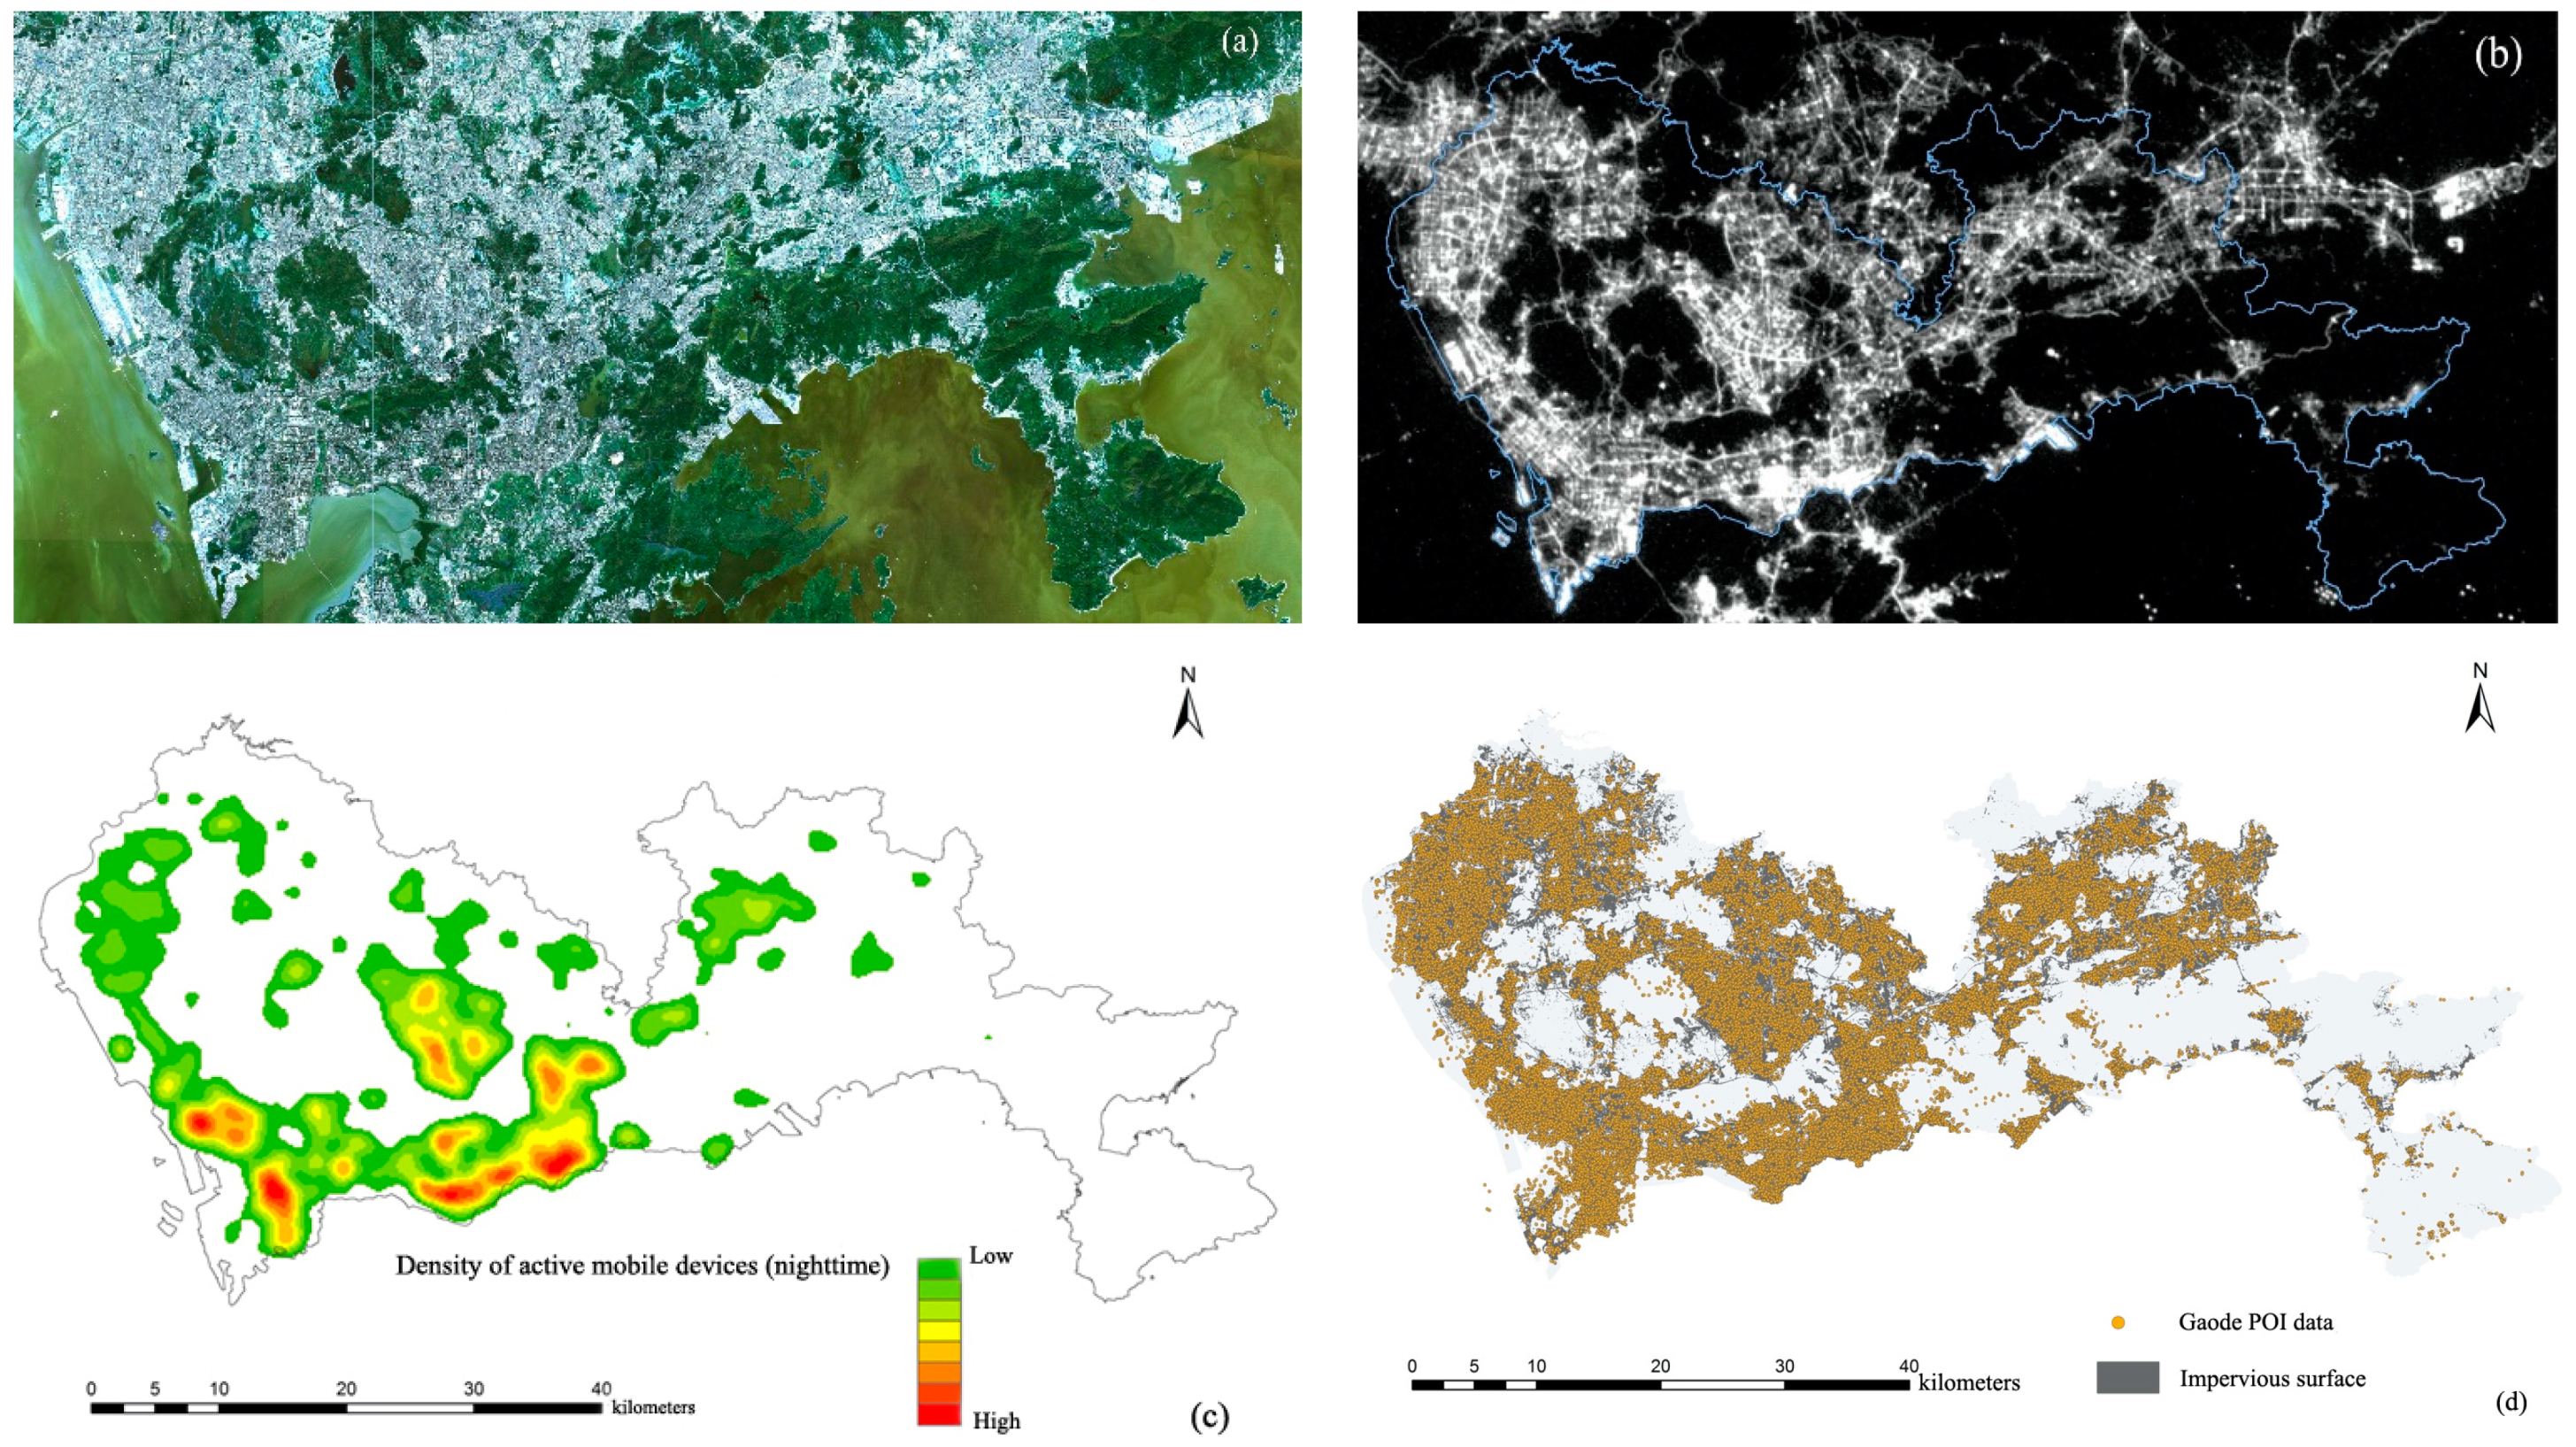
3.3. Data and Data Pre-Processing

To present the characteristics of urban landuse in multiple dimensions, multi-source geospatial data were utilized, most of them free-of-charge (Figure 2). These are from Sentinel-2 high-resolution remote sensing data (source: https://earthengine.google.com/, accessed on 6 December 2021), Luojia-1 NTL remote sensing data (source: http://59.175.109.173:8888/app/login.html, accessed on 6 December 2021), Gaode Map POI data (source: https://lbs.amap.com, accessed on 6 December 2021), and GPS location-based mobile big data provided by a leading third-party big data company in China. The mobile data recorded the cumulative number of active mobile devices in a grid (around 140 m resolution) by month. Daytime (9 a.m.–5 p.m.) and nighttime statistics (9 p.m.–5 a.m.) were adopted. To maintain the temporal consistency of the data, all datasets were collected from the same period of 2019, except for the map POI data, because of the difficulty of obtaining the historical POI data through public methods. Hence, the POI data in 2020 were collected to keep the temporal consistency as much as possible. Table 1 summarizes the basic characteristics of the data.
To reduce the influence of clouds and precipitation on remote sensing data (Sentinel-2 and Luojia-1), cloud-free composite images in autumn and winter were utilized. Considering that Shenzhen is an immigrant city, human activities are easily affected by holiday economy and population migration. The mobile data were collected in October 2018 (National Day holiday), November 2018 (non-holiday), and February 2019 (Chinese Lunar New Year). Data pre-processing included data cleansing and coordinate transformation. As for map POI data, the pre-processing also included category reclassification to match the urban landuse classification system.

3.4. Feature Selection and Dimension Reduction

The multi-scale data were spatially unified based on land parcels in the form of data features (i.e., attributes to land parcels). The statistical characteristics were utilized to generate these attributes (e.g., the average NTL brightness value in a land parcel). Based on prior knowledge, initial features were manually selected including physical and socio-economic features. The former was mainly from remote sensing imagery data such as band spectral characteristics, vegetation index, and nighttime light brightness. The latter is mainly from map POI and mobile big data such as population density in the daytime and nighttime, population in different months, POI density, and type.
Similar to most machine learning algorithms, it is necessary to reduce the dimension of feature space to simplify the complexity of the classification model. A few features that can best describe and present urban landuse types were finalized. Generally, there are two approaches to dimension reduction, namely, feature extraction and feature selection [37]. Feature extraction aims to construct a new feature space through feature transformation or a combination of features. It involves the generation of new features that may result in the loss of original feature information. The newly generated attributes are usually difficult to be explained physically while feature selection aims to obtain a subset of the original attribute features, which can retain the physical interpretability of the features. To preserve the features’ physical interpretability, feature selection was adopted for feature dimension reduction. Correlation coefficient (r) was utilized to filter the redundancy with a threshold score of 0.95 to minimize the feature dimension. If the r is greater than 0.95, only one of the paired features remains. After feature dimension reduction, a subset of the features was utilized for model training.

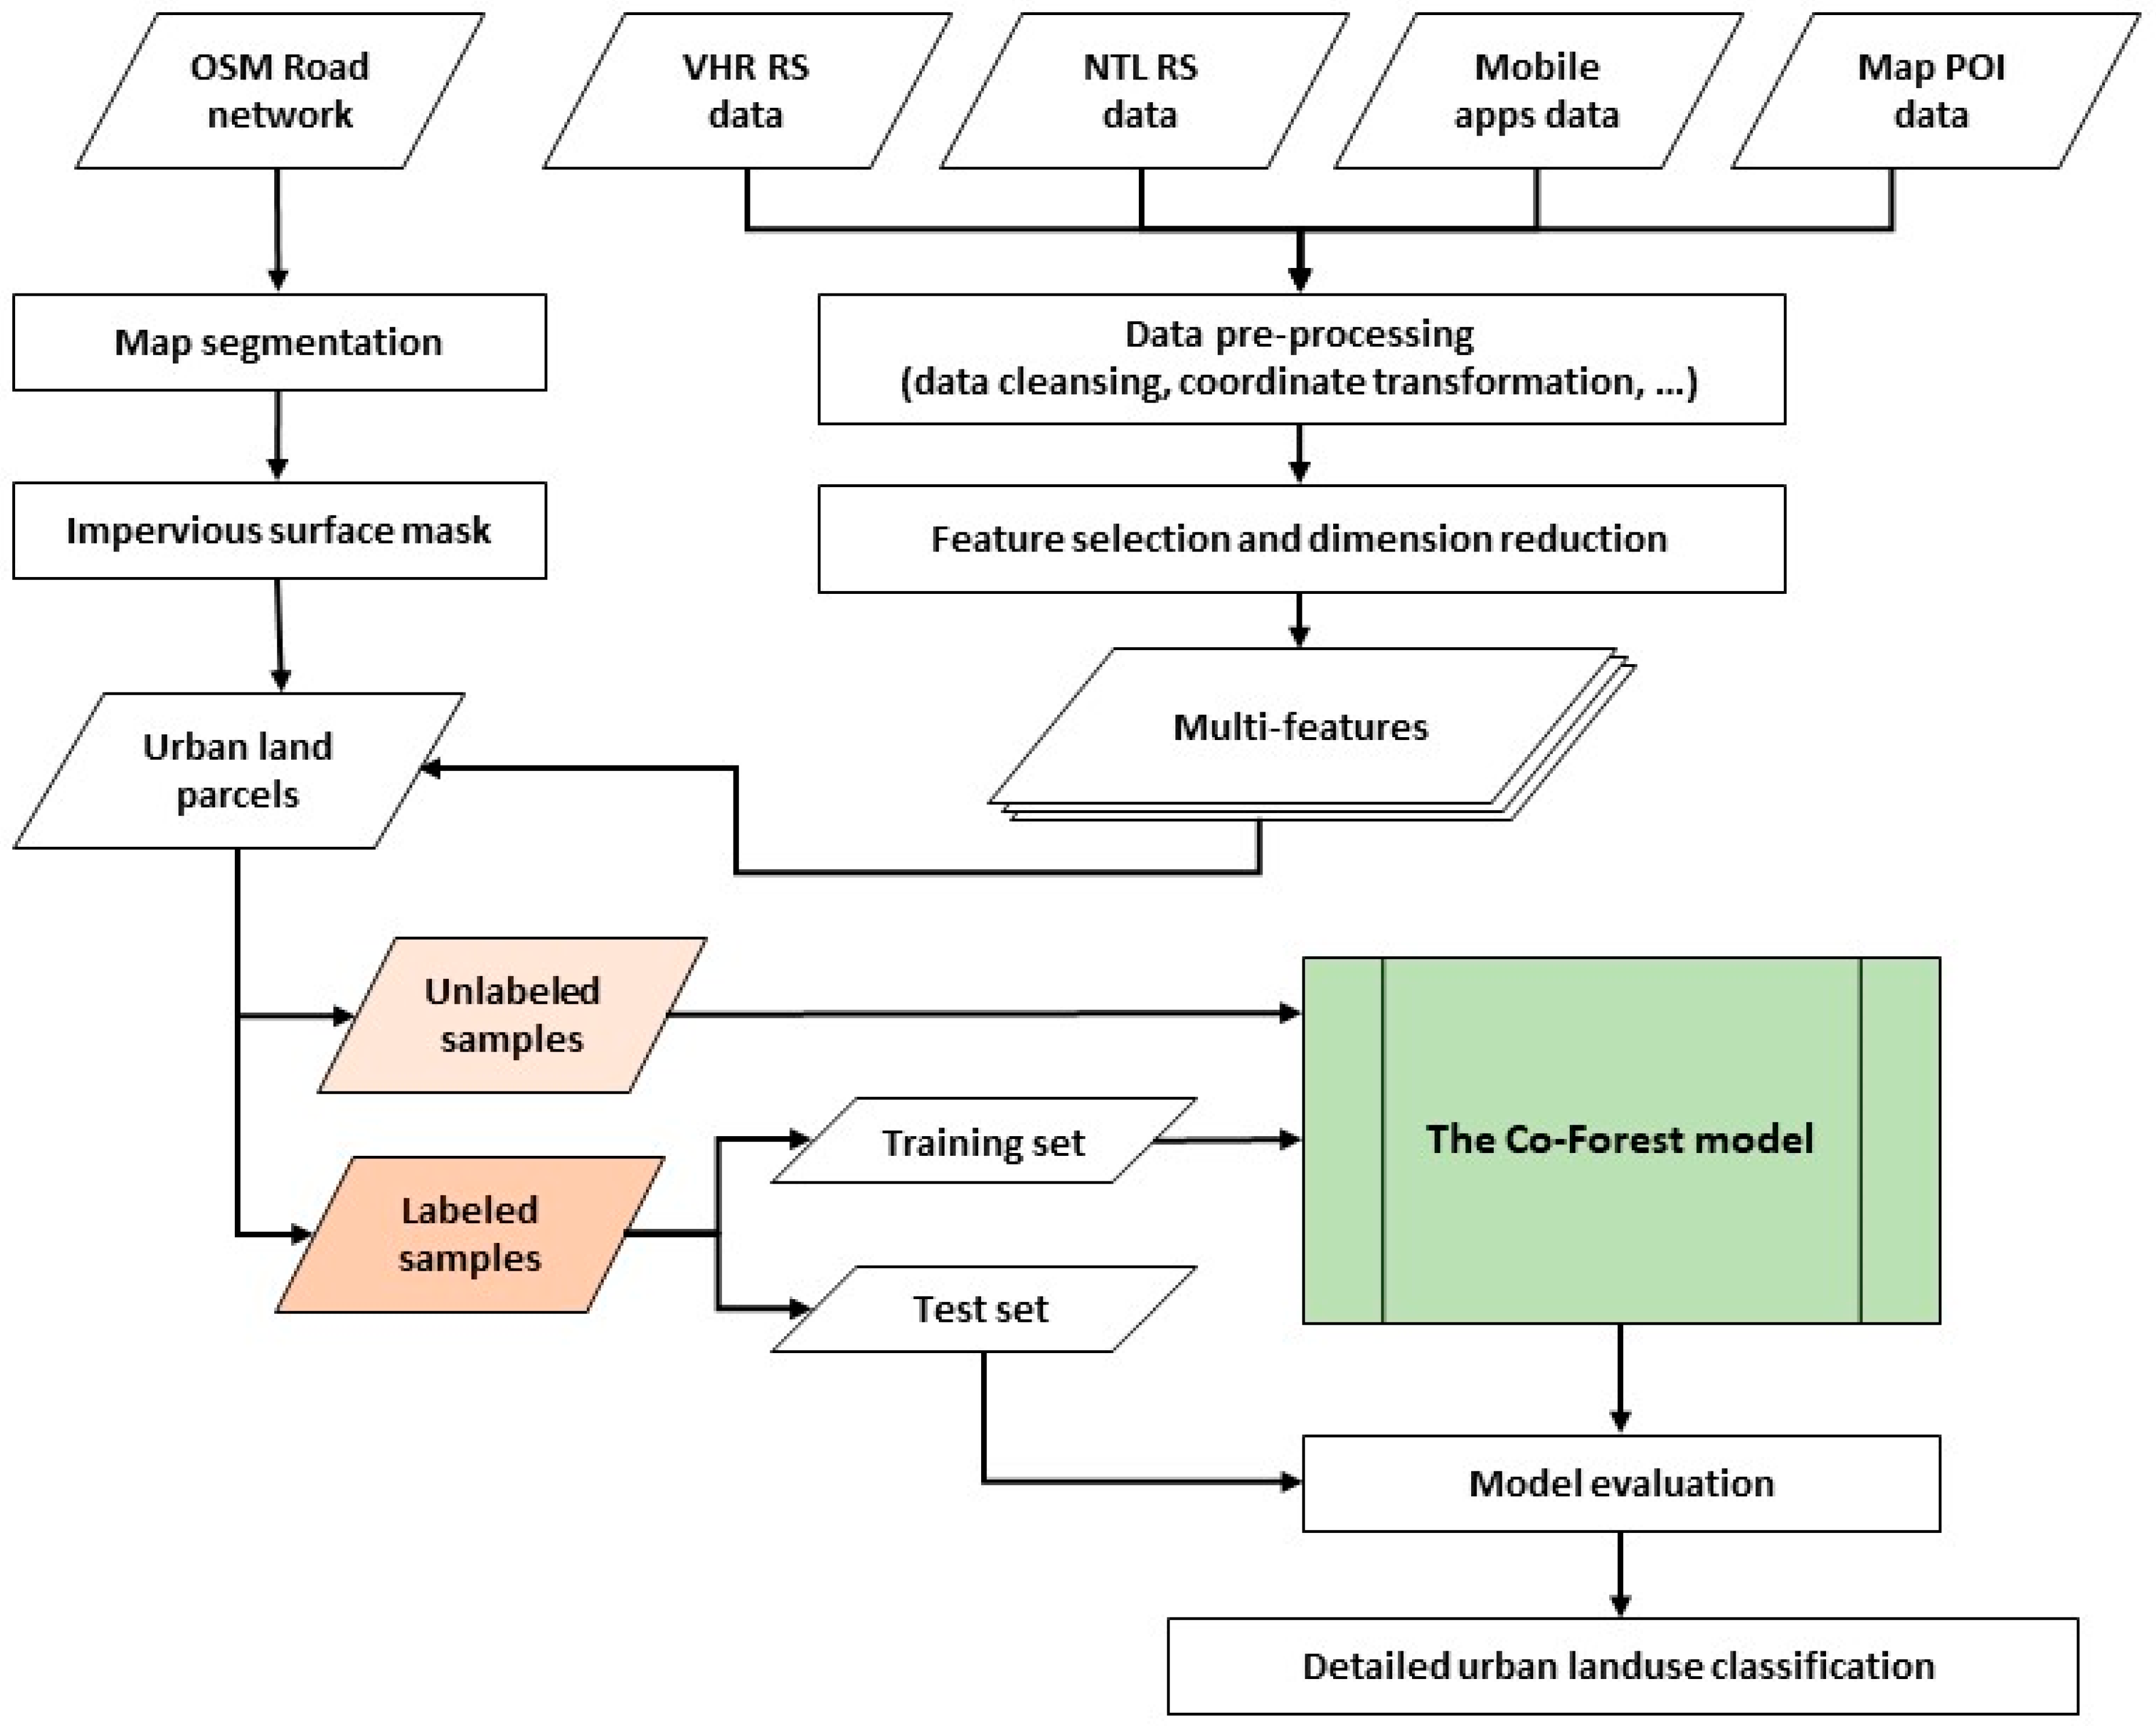
3.5. Semi-Supervised Multi-Feature Classification Framework

The main objective of semi-supervised learning is to train classifiers with both labeled and unlabeled samples. The classification model is first trained from labeled samples and then refined by unlabeled samples [38]. In our study, the semi-supervised Co-Forest algorithm was applied to detailed urban landuse classification. The Co-Forest algorithm is a disagreement-based semi-supervised classification method and is regarded as an extension of co-training based on the RF algorithm (a co-training-style RF algorithm) [39]. In the Co-Forest, N (N > 3) classifiers such as random decision trees are first individually trained based on an original labeled sample set. If the classifiers make an agreement on labeling some unlabeled samples with a certain confidence, a new training set will be generated based on the original and newly labeled samples to re-train the classifiers. The automated labeling strategy for unlabeled samples was characterized with higher cost-performance [40]. Figure 3 illustrates the research framework of detailed urban landuse classification based on multi-source geospatial data and the Co-Forest algorithm.

3.6. Model Adjustment and Improvement

Urban landuse classification is a typical multi-nominal classification task. There is a common problem that the training set has an imbalance issue. For instance, various urban landuse types are not evenly distributed in a city, which can easily cause a sampling bias. Besides, unlike traditional target recognition and extraction tasks in which the samples are certain with a clear-cut definition or attribute, urban land parcels may be a mixed landuse type (e.g., commercial-residential mixed), especially in many well-developed mega cities. This will cause the deviation of training results in a semi-supervised model. To minimize the above problems, three improvement schemes of the Co-Forest algorithm were applied as follows.
Improvement scheme 1: Add the weight of the sample in the process of initialing and constructing classifiers to deal with the sample imbalance issue; set a judgement in the model that unlabeled samples should not be added into the labeled sample set unless a certain confidence level is reached (exclude mixed landuse samples).
Improvement scheme 2: On the basis of improvement scheme 1, add a restriction of error rate in the iteration process (i.e., limits the error to below 0.2 to end the iteration to avoid over fitting).
Improvement scheme 3: On the basis of improvement scheme 2, a noise cutting step is executed after adding the unlabeled samples into the labeled sample set.

3.7. Model Evaluation and Accuracy Assessment

In this study, the k-fold (k = 5) cross-validation was adopted to evaluate the model performance to ensure the reliability of model evaluation. To quantify the classification accuracy, a confusion matrix was used and the assessment metrics included overall accuracy (OA) and Kappa coefficient [41].

3.8. Impact Analysis of Small Sample Size

In order to investigate the influence of small sample size on the classification result, we tested the stability of the classification by using different proportions of the training samples. Based on all training samples, the classification models were tested as the number of training samples decreased by 1% each time. A stratified random sampling method was adopted for each sampling process to keep the proportion of sample distribution consistent. The optimal cost-performance for the number of training samples was determined by the change rate of the accuracy. The change rate (m) can be calculated by using the following formular: m = (Aa_k)/A, where A represents the best accuracy by using all training samples and a_k represents the accuracy by using k% training samples.
To make the model learning more reliable, training samples were randomly selected from the training set for model training five times at every training set ratio. The average of five-time accuracy scores was adopted as the classification accuracy under that training set ratio.

4. Experiments

4.1. Subset of Features

According to the researchers’ prior knowledge, 59 features from multi-source geo-spatial data were initially selected as the main characteristics of urban landuse types. The correlation coefficient between any two of those features was computed to eliminate redundant features. Finally, 34 individual features were adopted for model training. Table 2 lists the selected features by data type.

4.2. Urban Landuse Classification System

Referring to previous studies [34,35] and the national standard of landuse classification (GB/T 21010-2017), an urban landuse classification system was adopted that consists of five level-1 urban landuse categories, namely residential (R), commercial (C), industrial (I), transportation (T), and public management and service (P). Table 3 lists the detailed landuse categories with descriptions or examples.

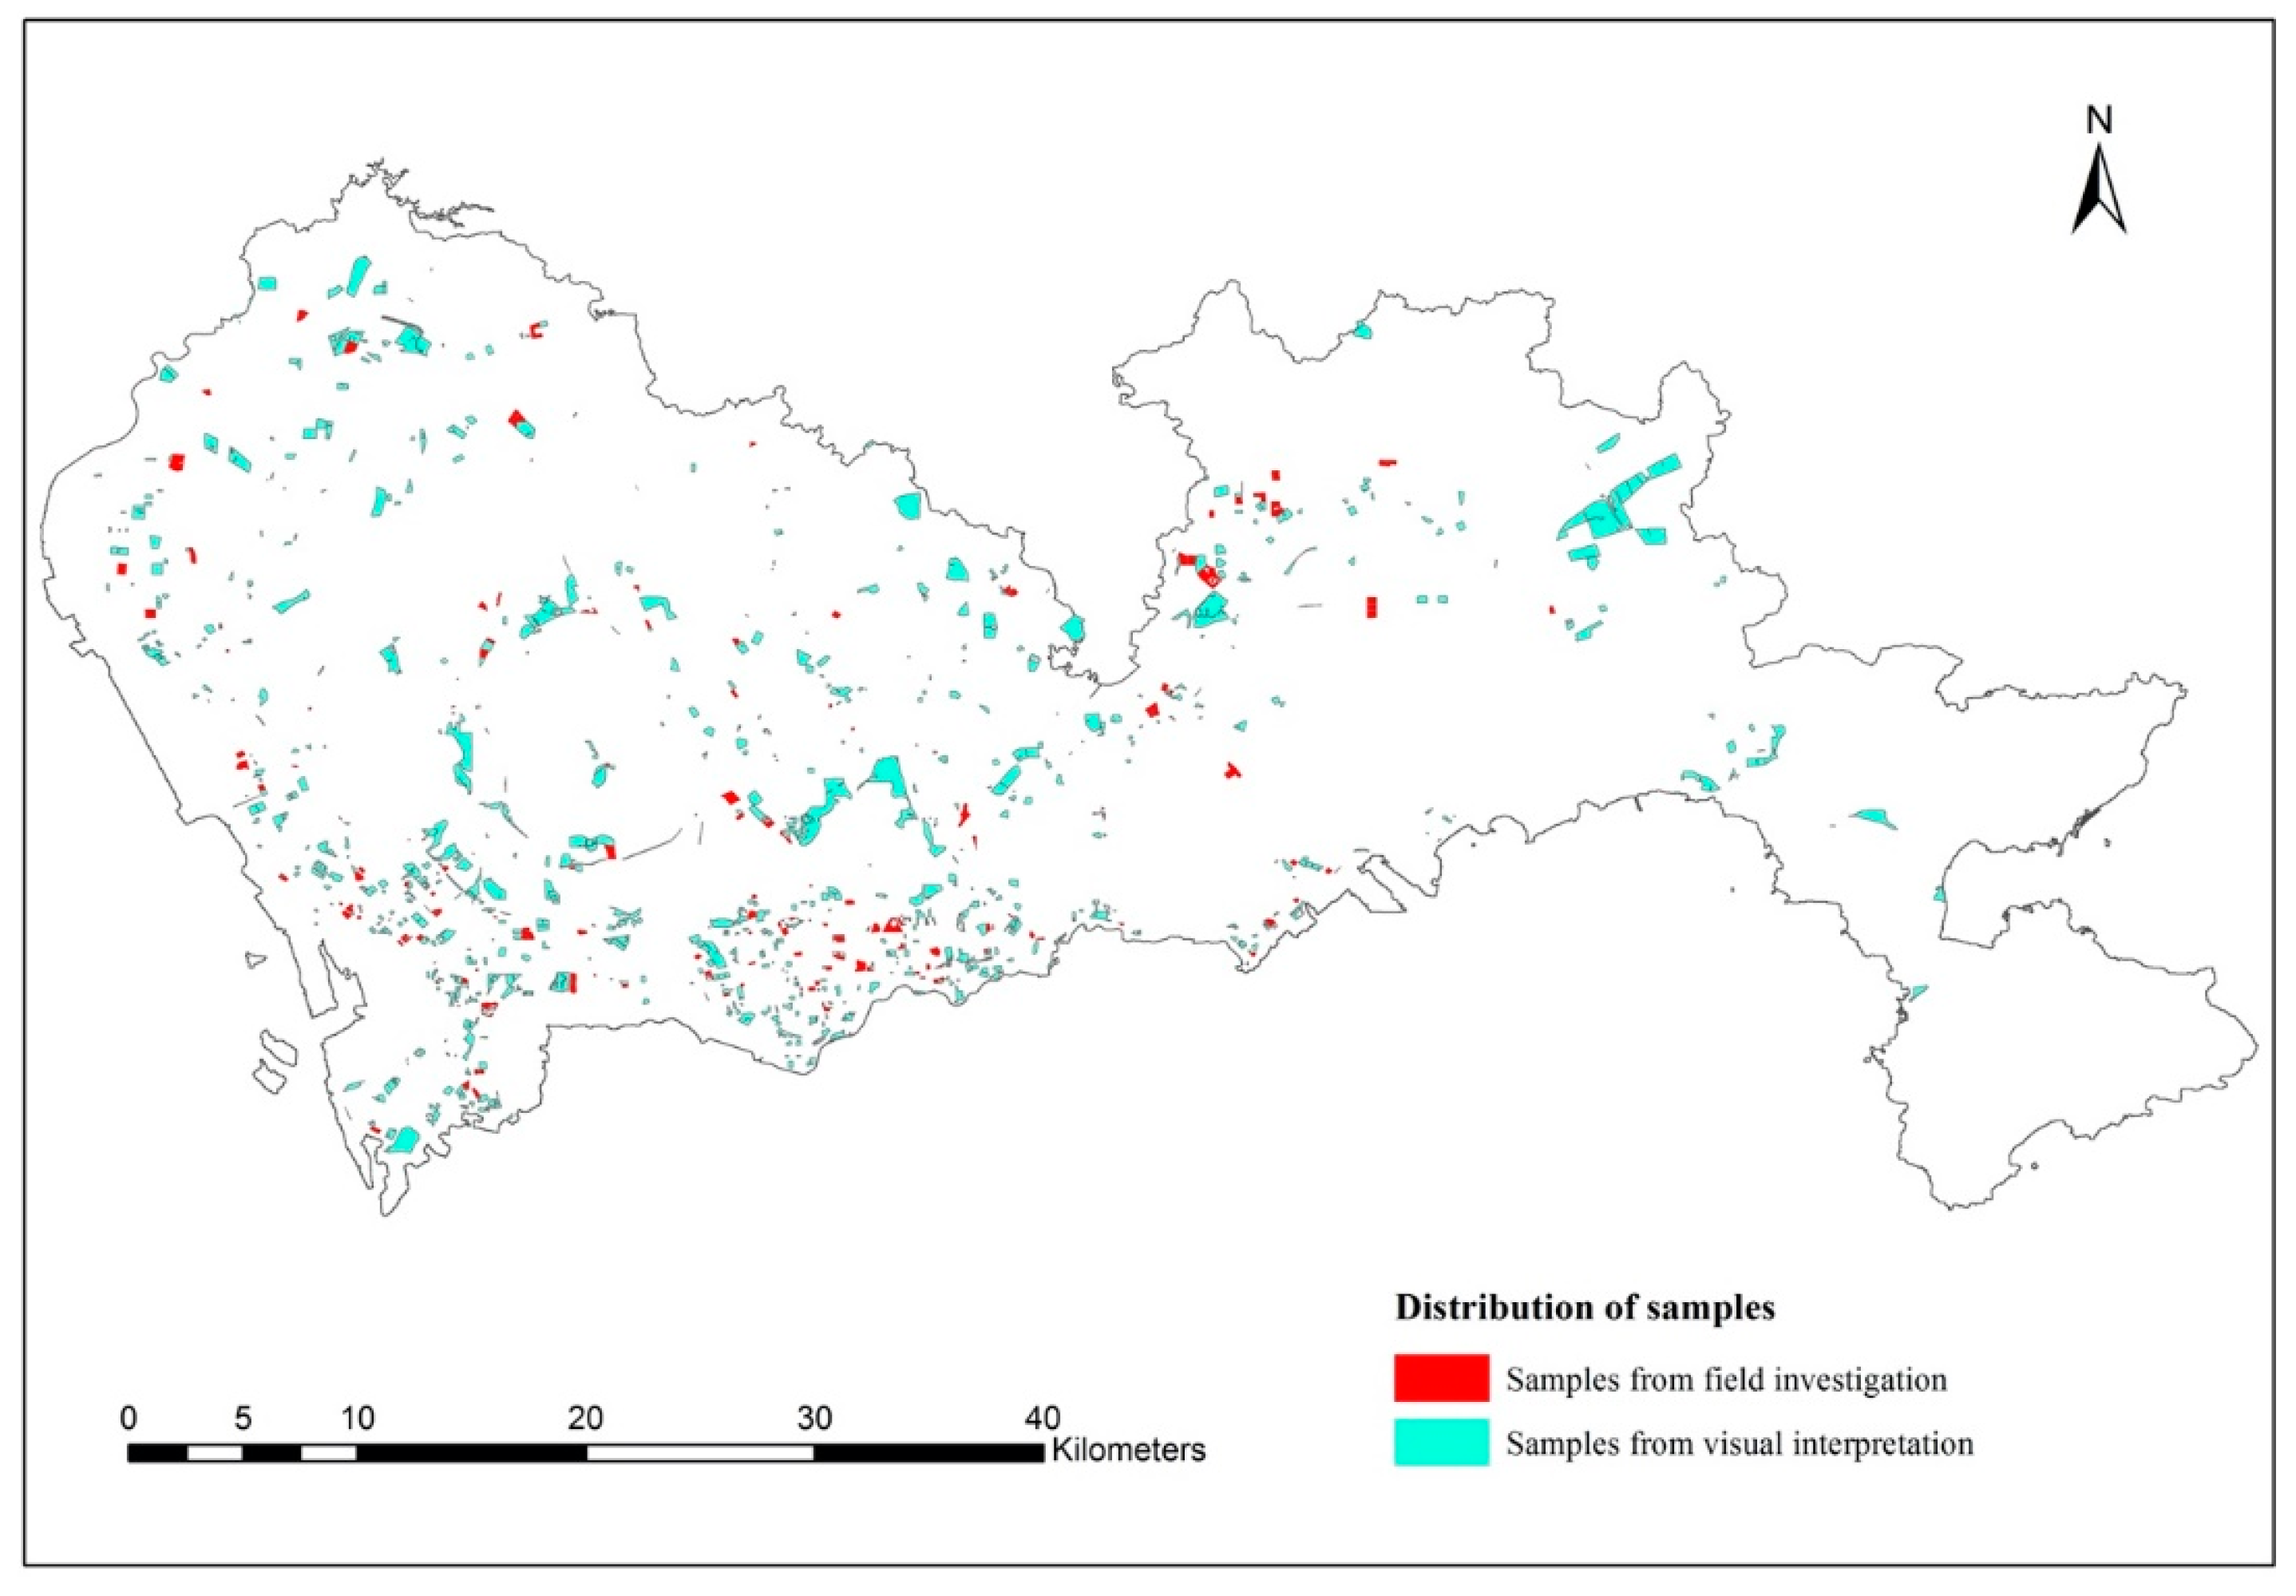
4.3. Labeling and Train/Test Split

Figure 4 illustrates the distribution of labeled samples including two sources from field survey and manual interpretation of very high-resolution (VHR) imagery. Field survey data contain 162 labeled land parcels, which were sourced from the Urban Planning and Land Resource Research Center, Planning and Nature Resource Bureau of Shenzhen Municipality. The other labeled samples were derived from VHR image interpretation by human vision. The visual interpretation process is based on VHR images from Google Earth and assisted with map apps including Gaode maps and Microsoft Bing maps. Besides, field survey data are also used to assist in manual image interpretation. Through sample quality control, a total of 1021 labeled samples accounting for around 15% of all land parcels were finally collected for model training and testing.
All labeled samples were divided into two groups, namely, the training set and test set. The stratified sampling method was adopted to ensure the same sample distribution for different landuse categories. To make the model training results comparable, a fixed number of labeled samples (i.e., 204) accounting for 3% of all land parcels was selected as the test set. The remaining labeled samples (i.e., 817), accounting for 12% of all land parcels, were employed as the training set. In order to find an optimal training set ratio, the proportion of labeled samples used for model training decreased by 1% each time. For each proportion, training samples were randomly selected five times. The model training results were evaluated by the fixed test set. The average of five-time calculation results at every training set ratio was regarded as the accuracy of the model at that ratio.

4.4. Experimental Environment and Parameters

The experiment was carried out on a Mac OS platform (4-core CPU, 16G memory). The implementation of the Co-Forest algorithm and the modified versions was based on Java language, JDK version 8.1, and Waikato Environment for Knowledge Analysis (Weka) framework, version 3.8.4. The number of co-training classifiers for the Co-Forest algorithm was set from 3 to 20.

5. Results and Analysis

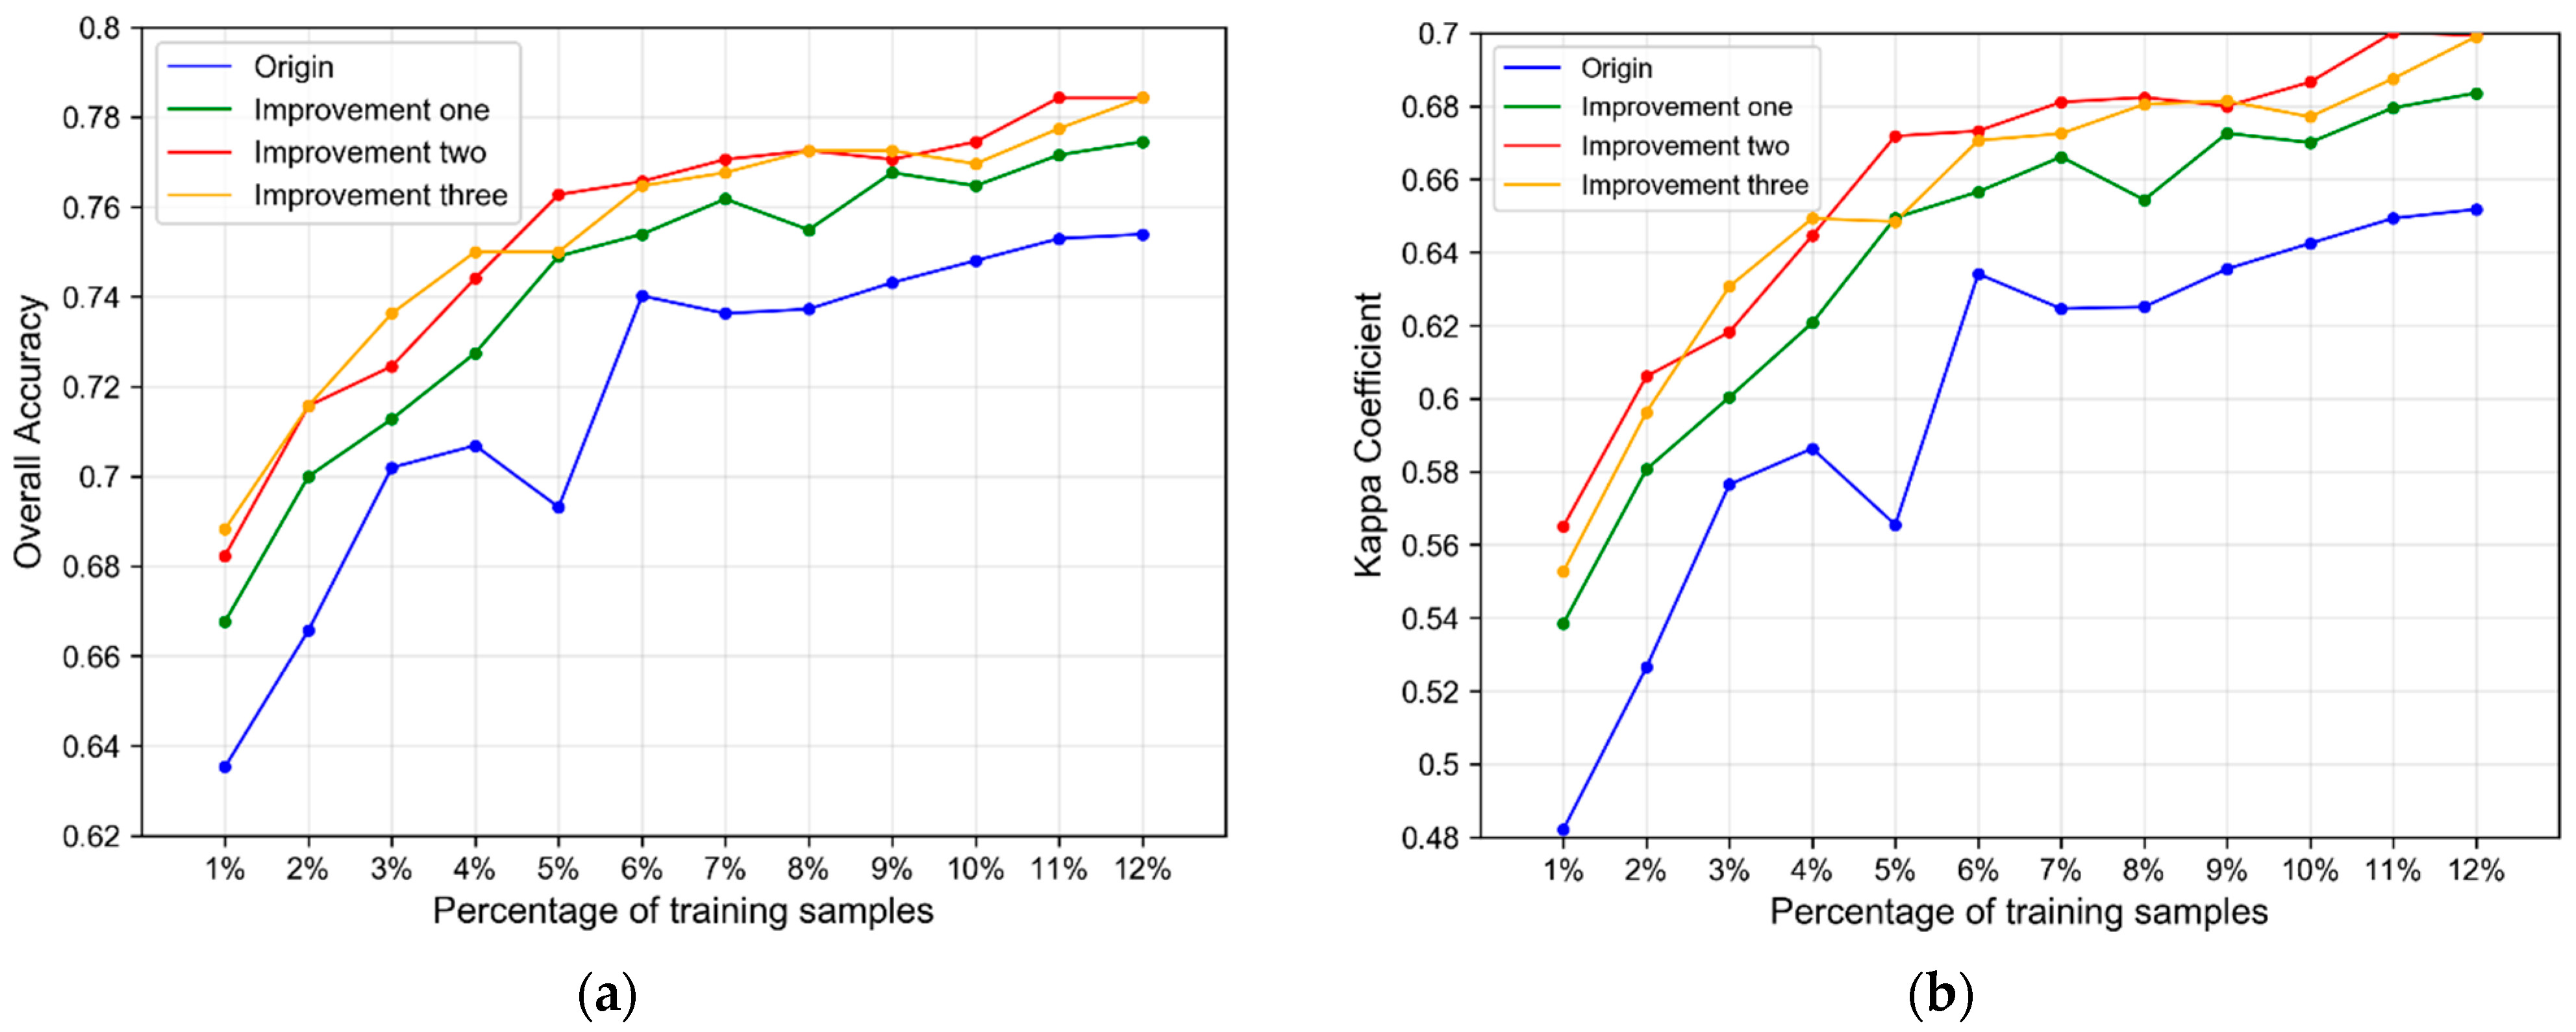
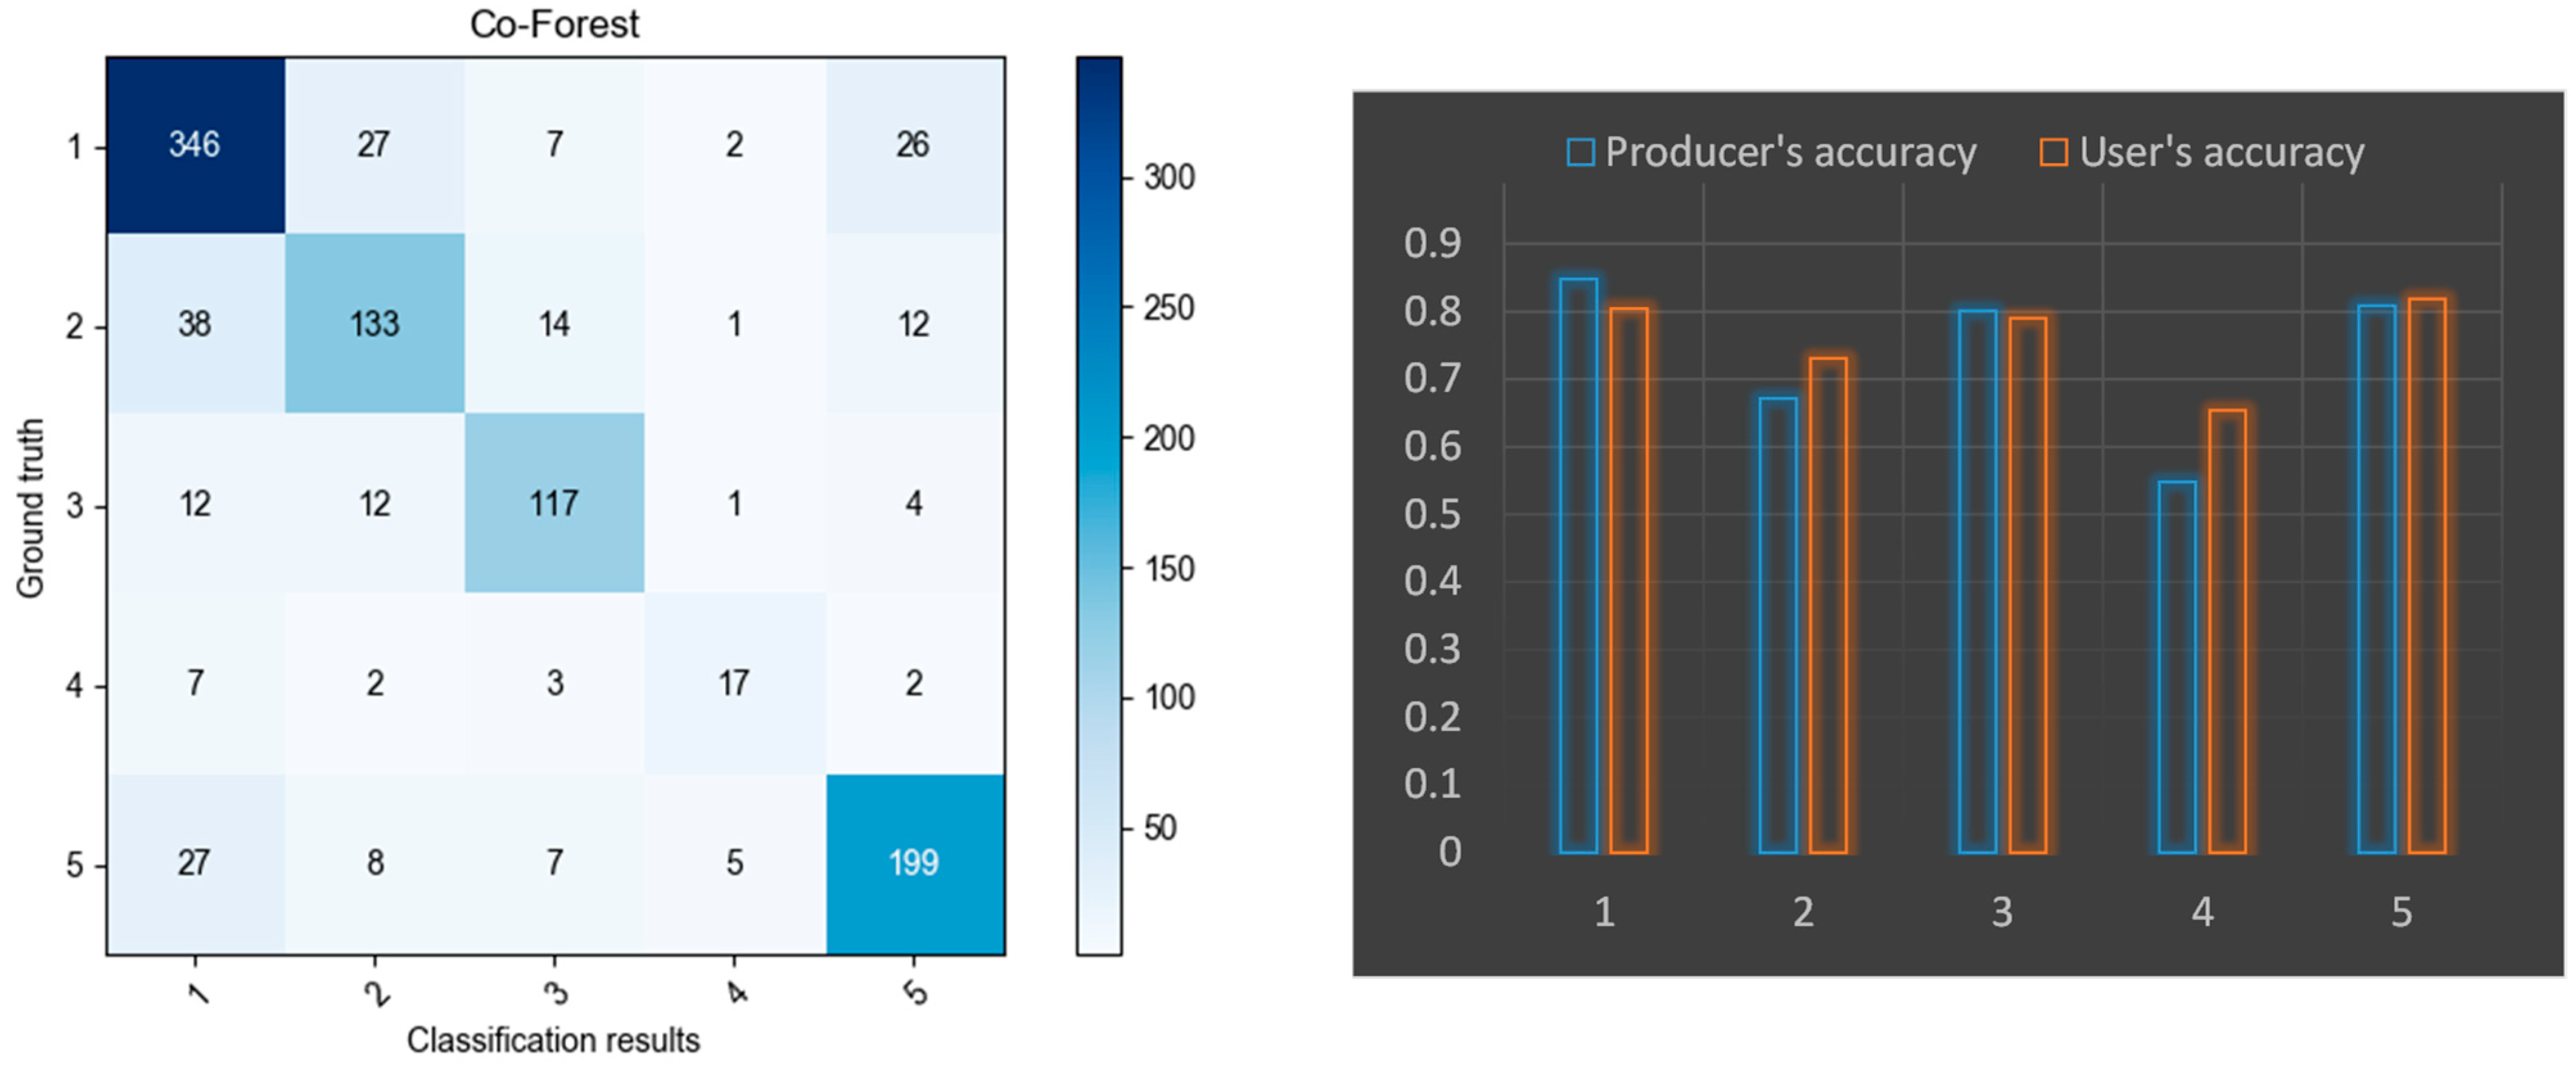
5.1. Performance of Algorithm Improvement of the Co-Forest

Figure 5 shows the classification accuracies of the original Co-Forest algorithm and the improved versions by the overall accuracy and Kappa coefficient, respectively. Results showed that all of the three improvement schemes were better than the original version of the Co-Forest algorithm. Among them, improvement scheme two had a better performance compared with the other improvement schemes, since it obtained a ranking as No.1 more times. Therefore, improvement scheme two was employed as the preferred method in the further comparison and analysis.

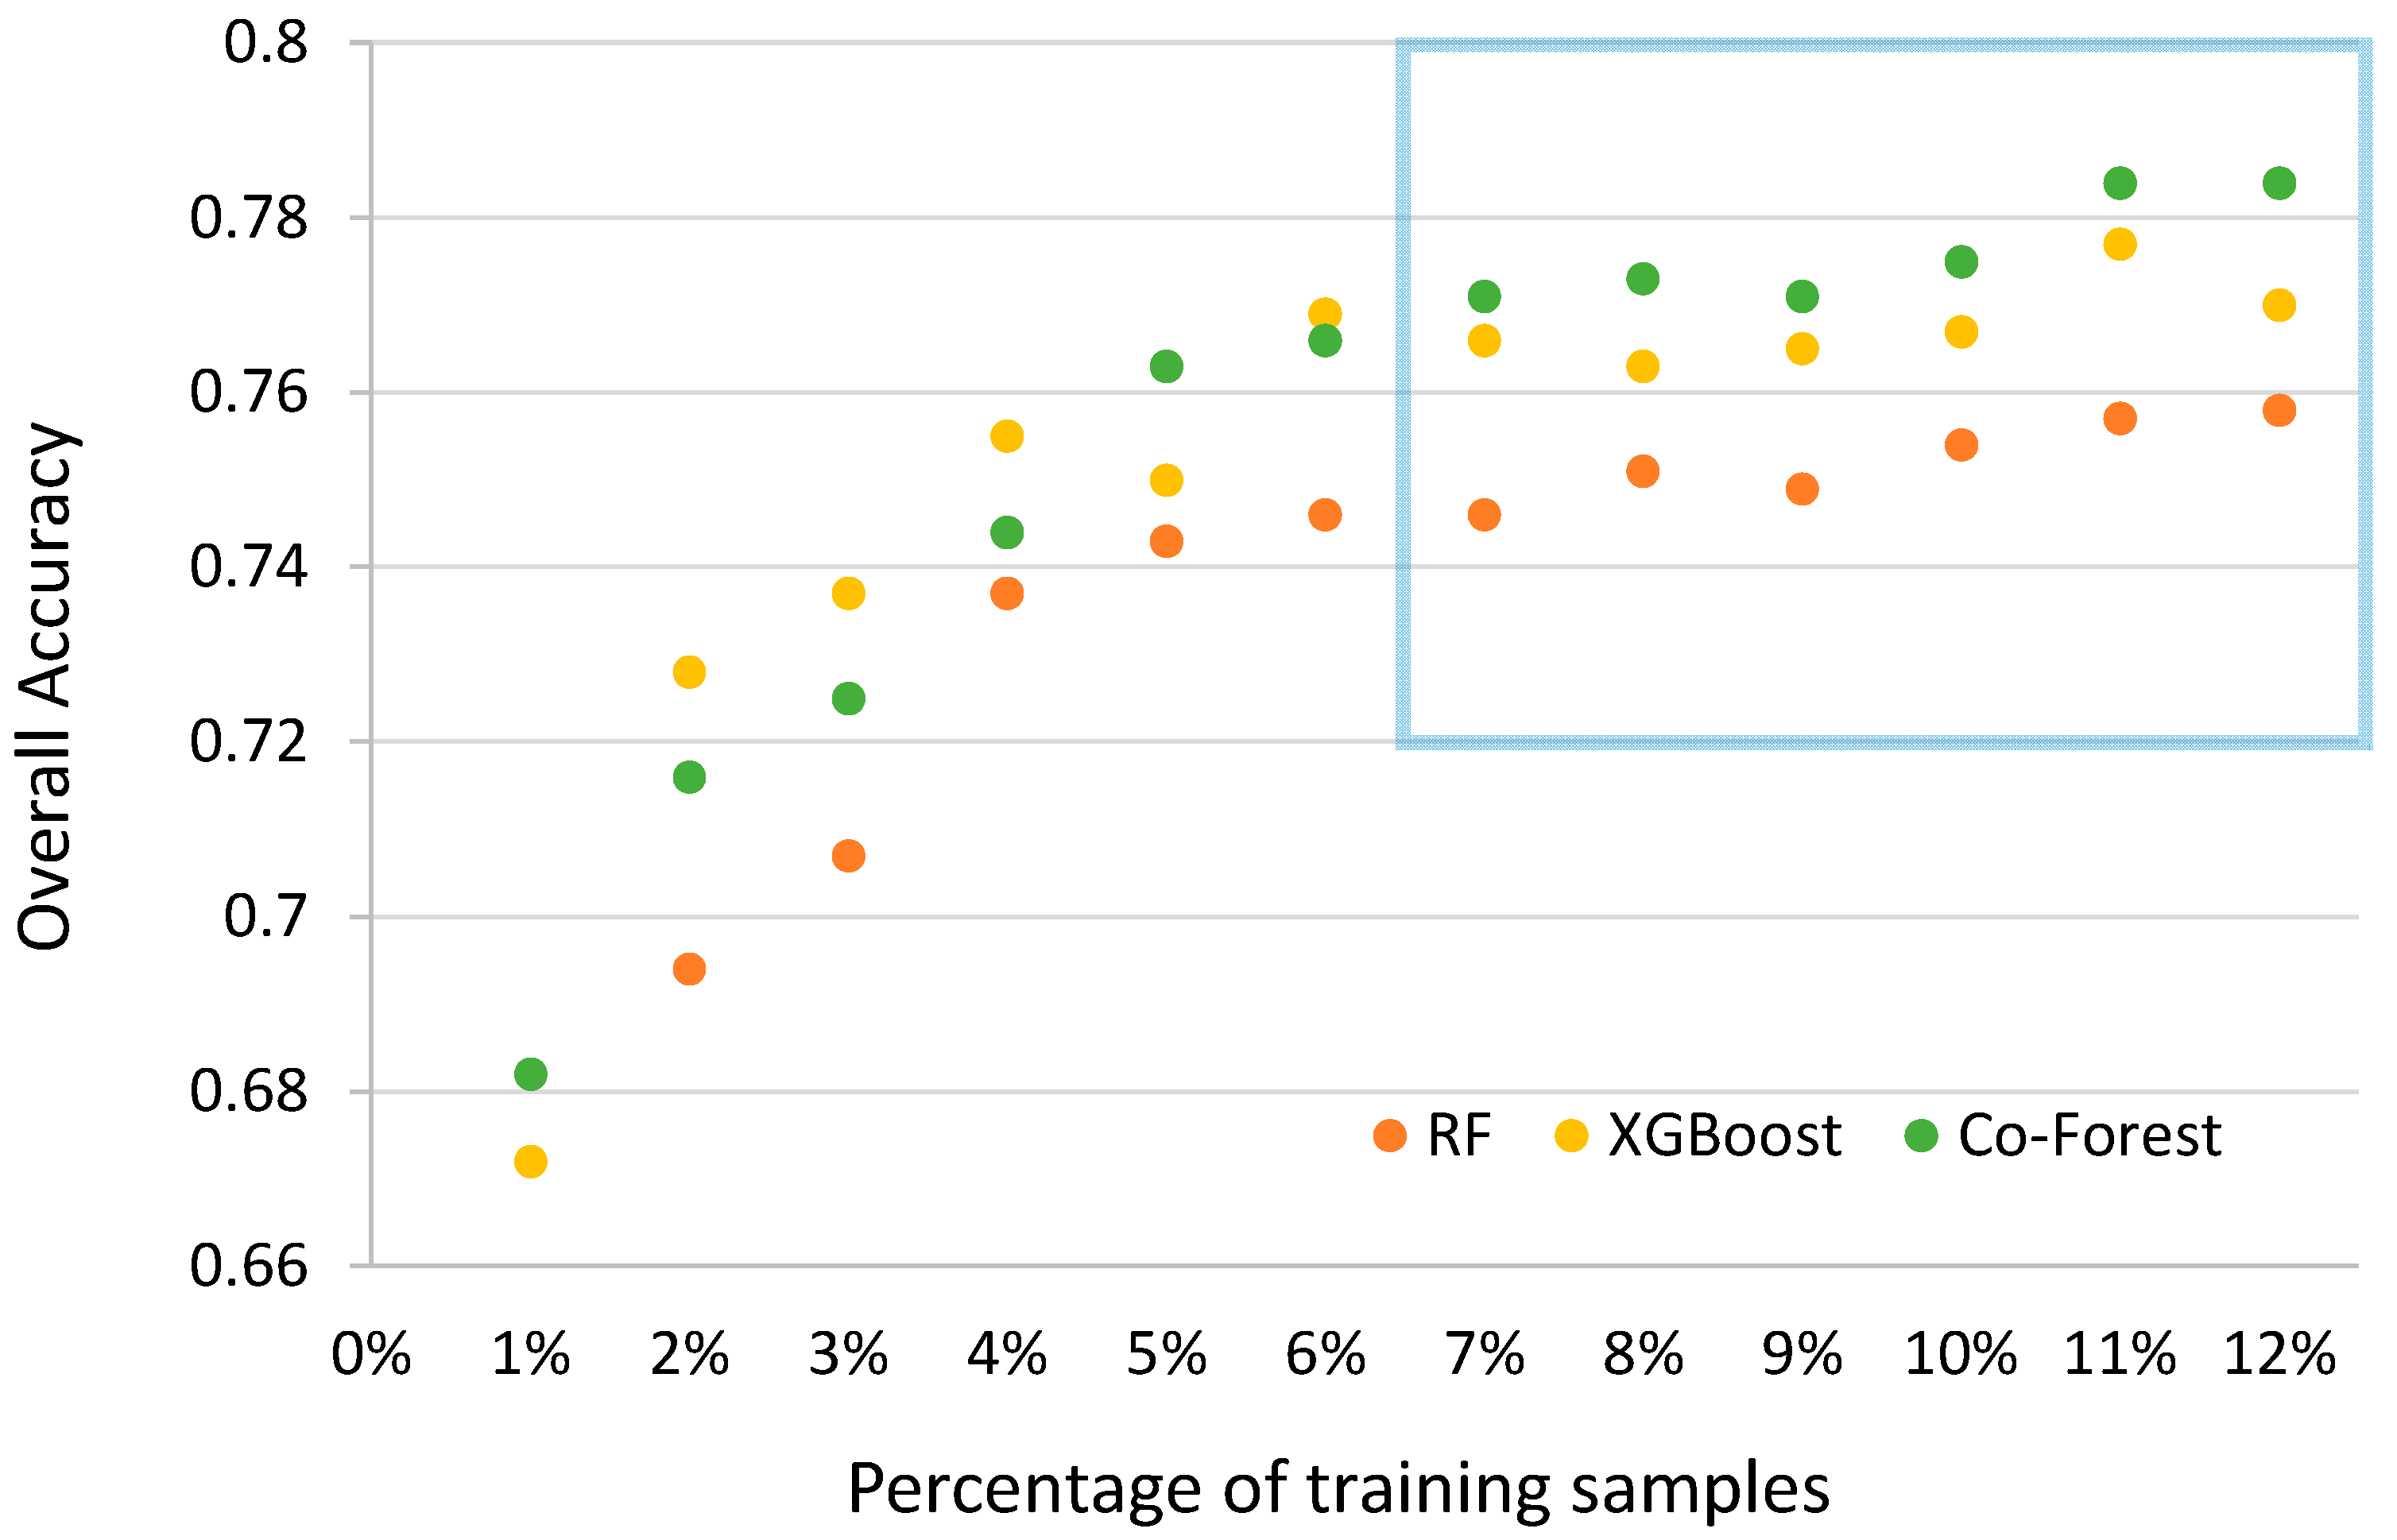
5.2. Comparison with Traditional Supervised Algorithms

Based on the model improvement, the classification accuracy of the semi-supervised Co-Forest algorithm was compared with traditional supervised algorithms including the RF and XGBoost at different levels of the training sample size. From Figure 6, the semi-supervised algorithm performance was better than the other two supervised algorithms in the case of using a 7% training set ratio or above. In other words, the proposed Co-Forest classification method can achieve a comparable, and even a better classification result by using less labeled training samples. Table 4 lists the minimum sample size requirement for the three algorithms at different accuracy levels. Compared with the similar tree-based classifiers, the semi-supervised learning framework (Co-Forest) could reduce 17~20% of labeled samples to achieve the same accuracy level.

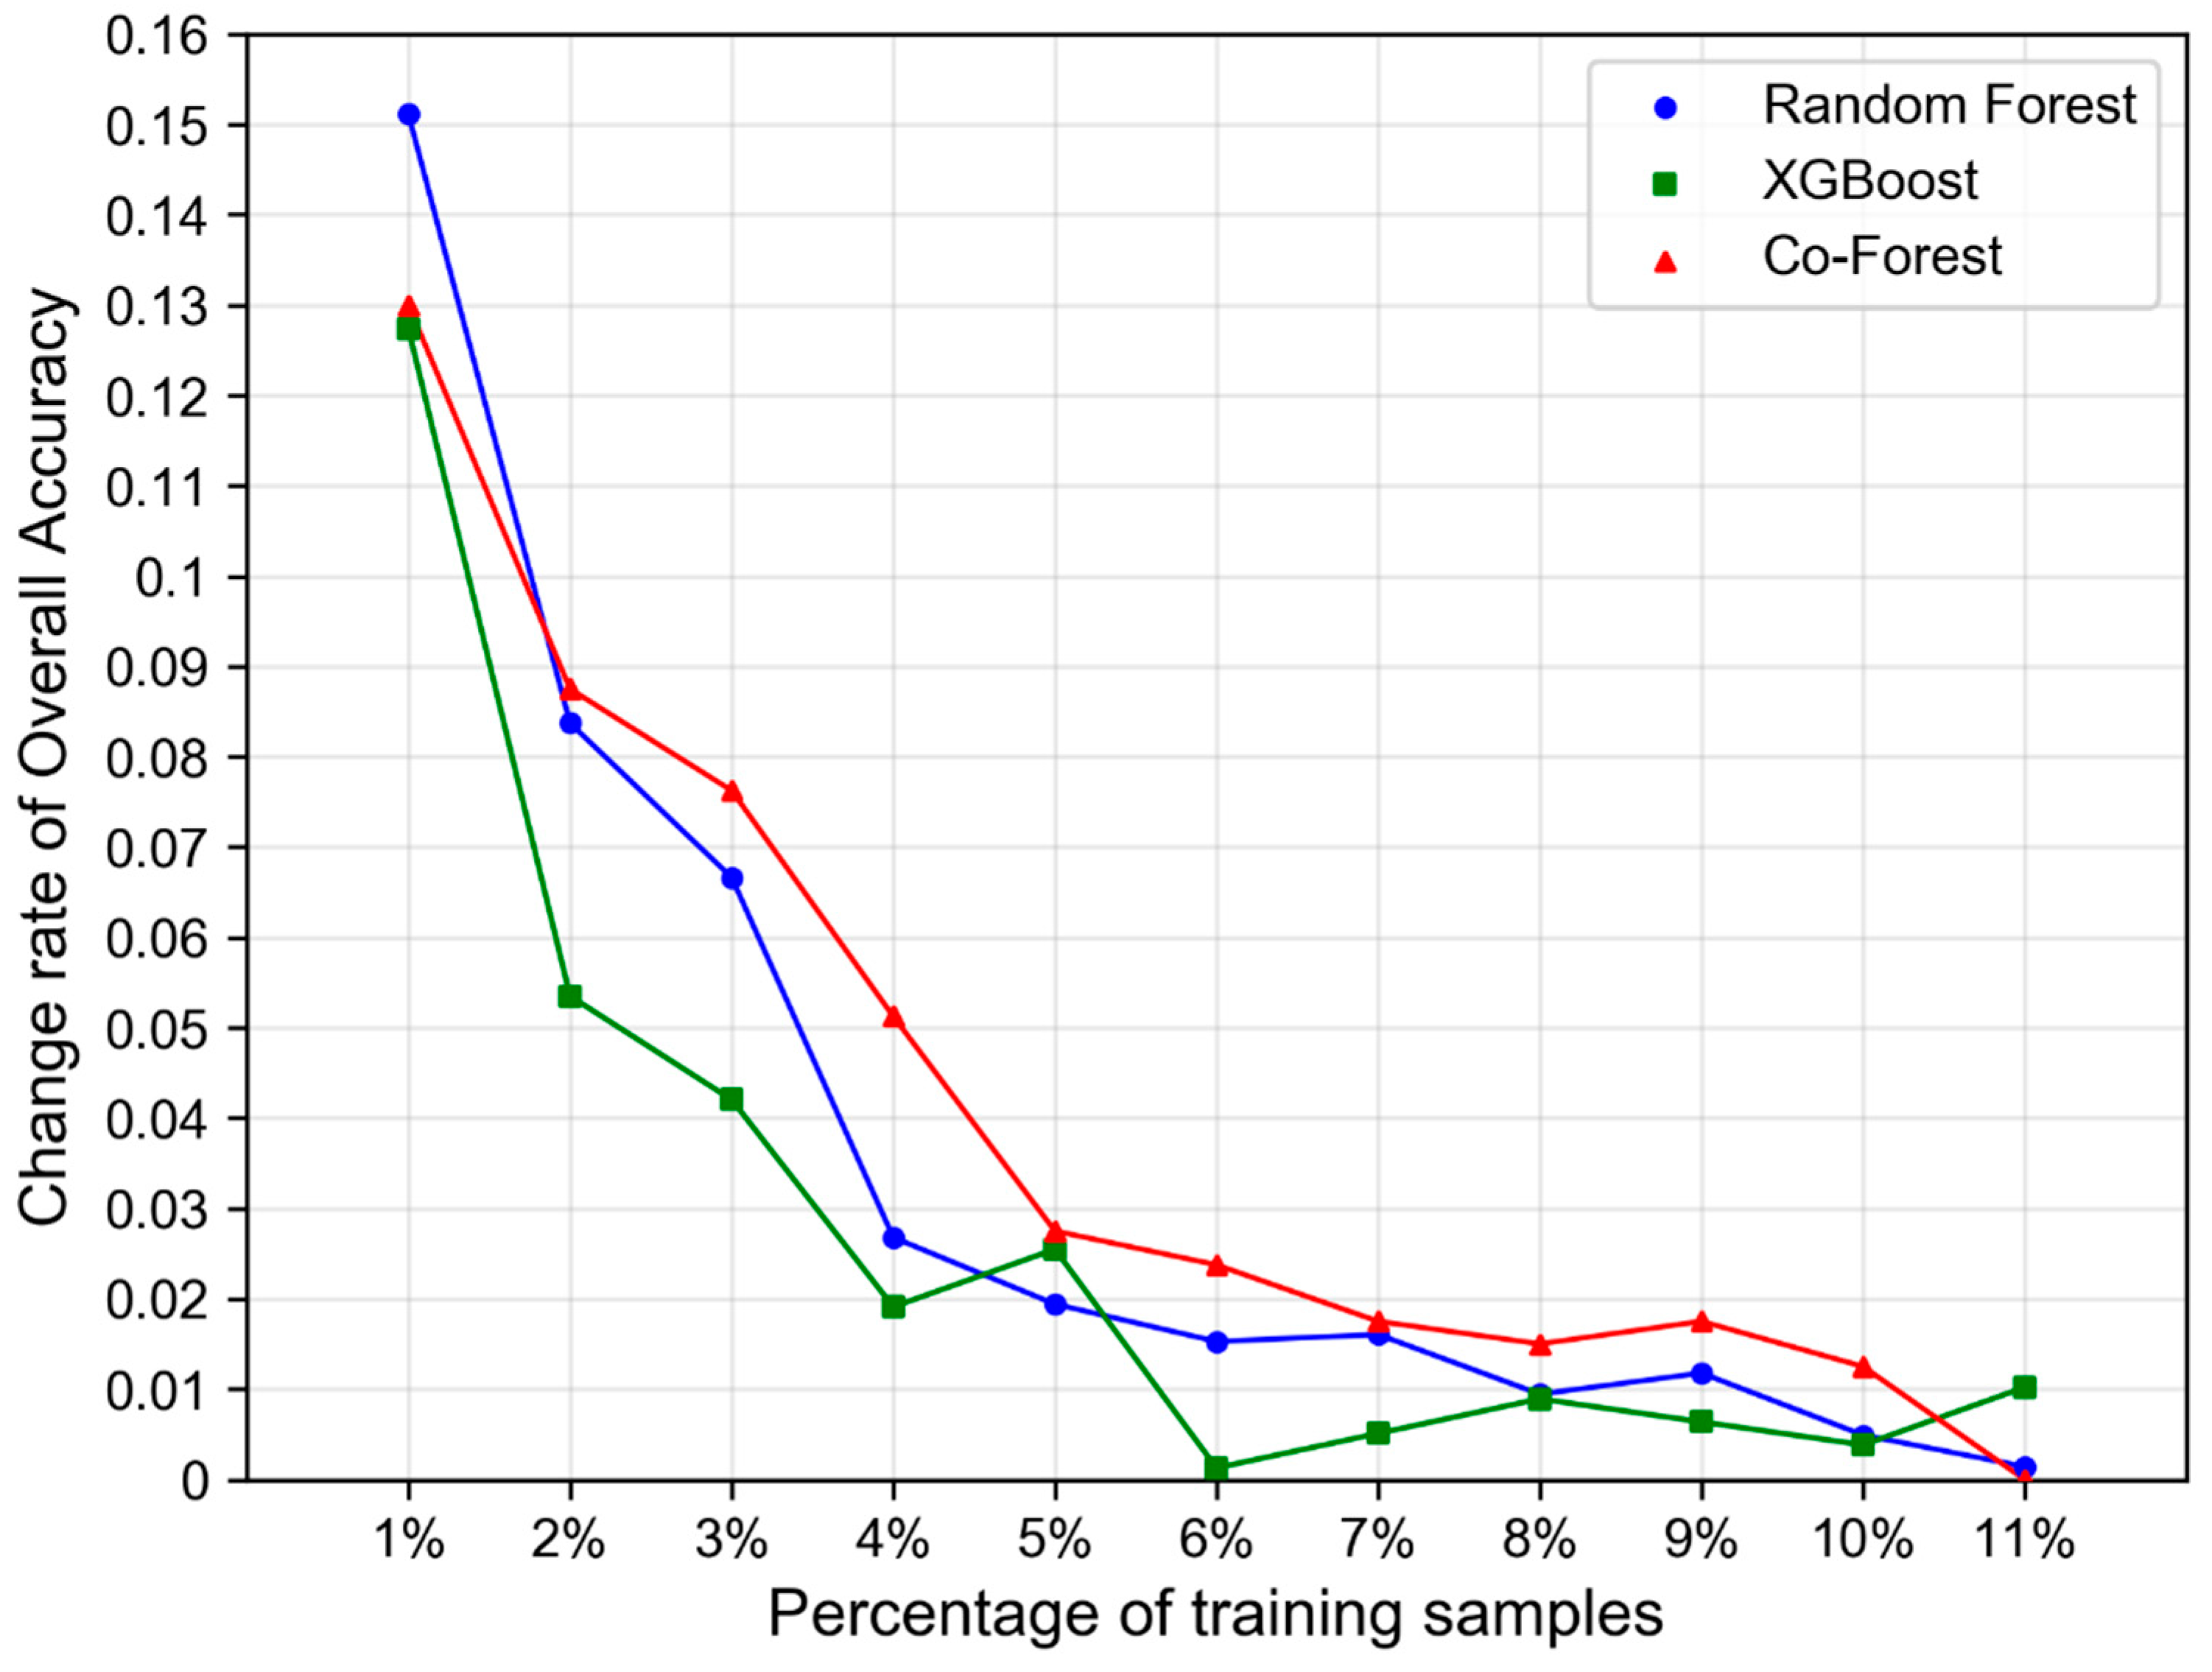
5.3. Impact of Training Sample Size

In order to analyze the influence of the training sample size on the classification performance, Figure 7 shows the change rate in the classification accuracy in the case of using a small sample size. By taking the best accuracy with a 12% training set ratio as a reference, the model performance declined as the training sample size became smaller. The classification accuracy declined rapidly once the training sample size was smaller than 5%. Accordingly, we can obtain a high cost-performance (i.e., the ratio of the labor cost in sampling and the accuracy of classification) with a training sample size no less than 5%.

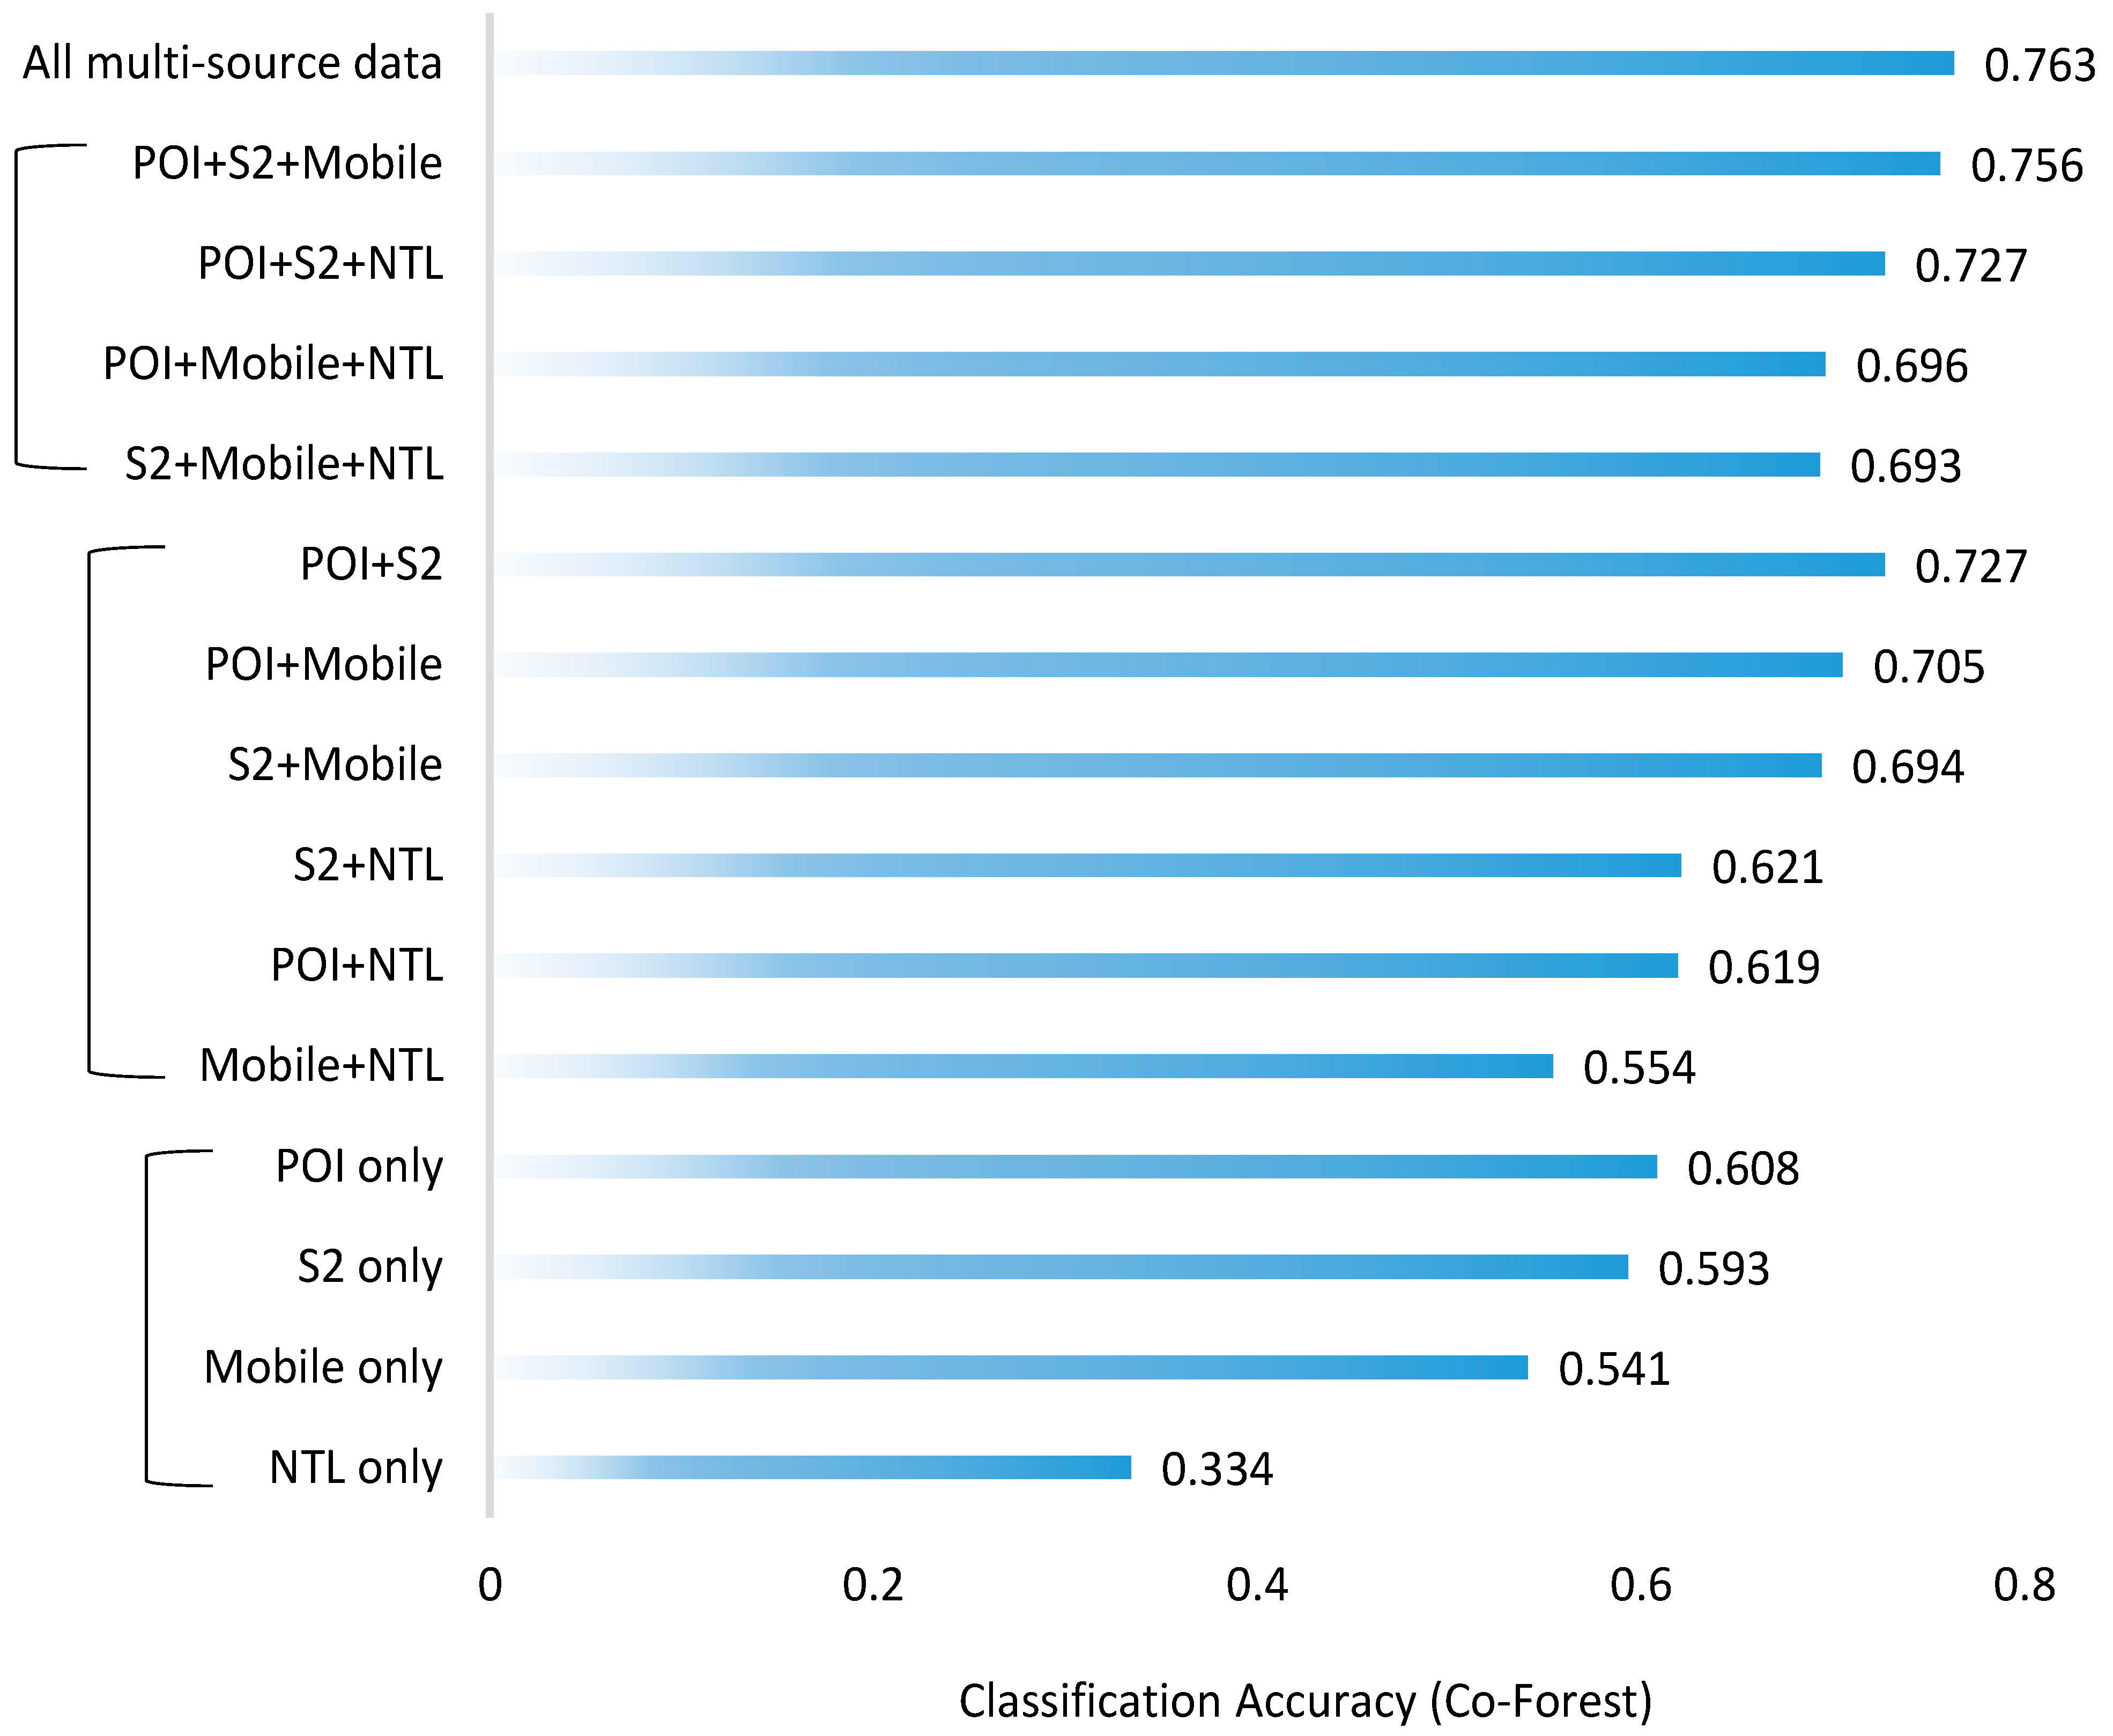
5.4. Importance of Multi-Source Geospatial Data

Figure 8 presents the influence of different combinations of multi-source data on classification accuracy. The use of all multi-features leads a better accuracy of the classification. In general, we can obtain better accuracy when more features are added. When considering the sources separately, map POI and high-resolution optical remote sensing (Sentinel-2) data showed better results than the other datasets.

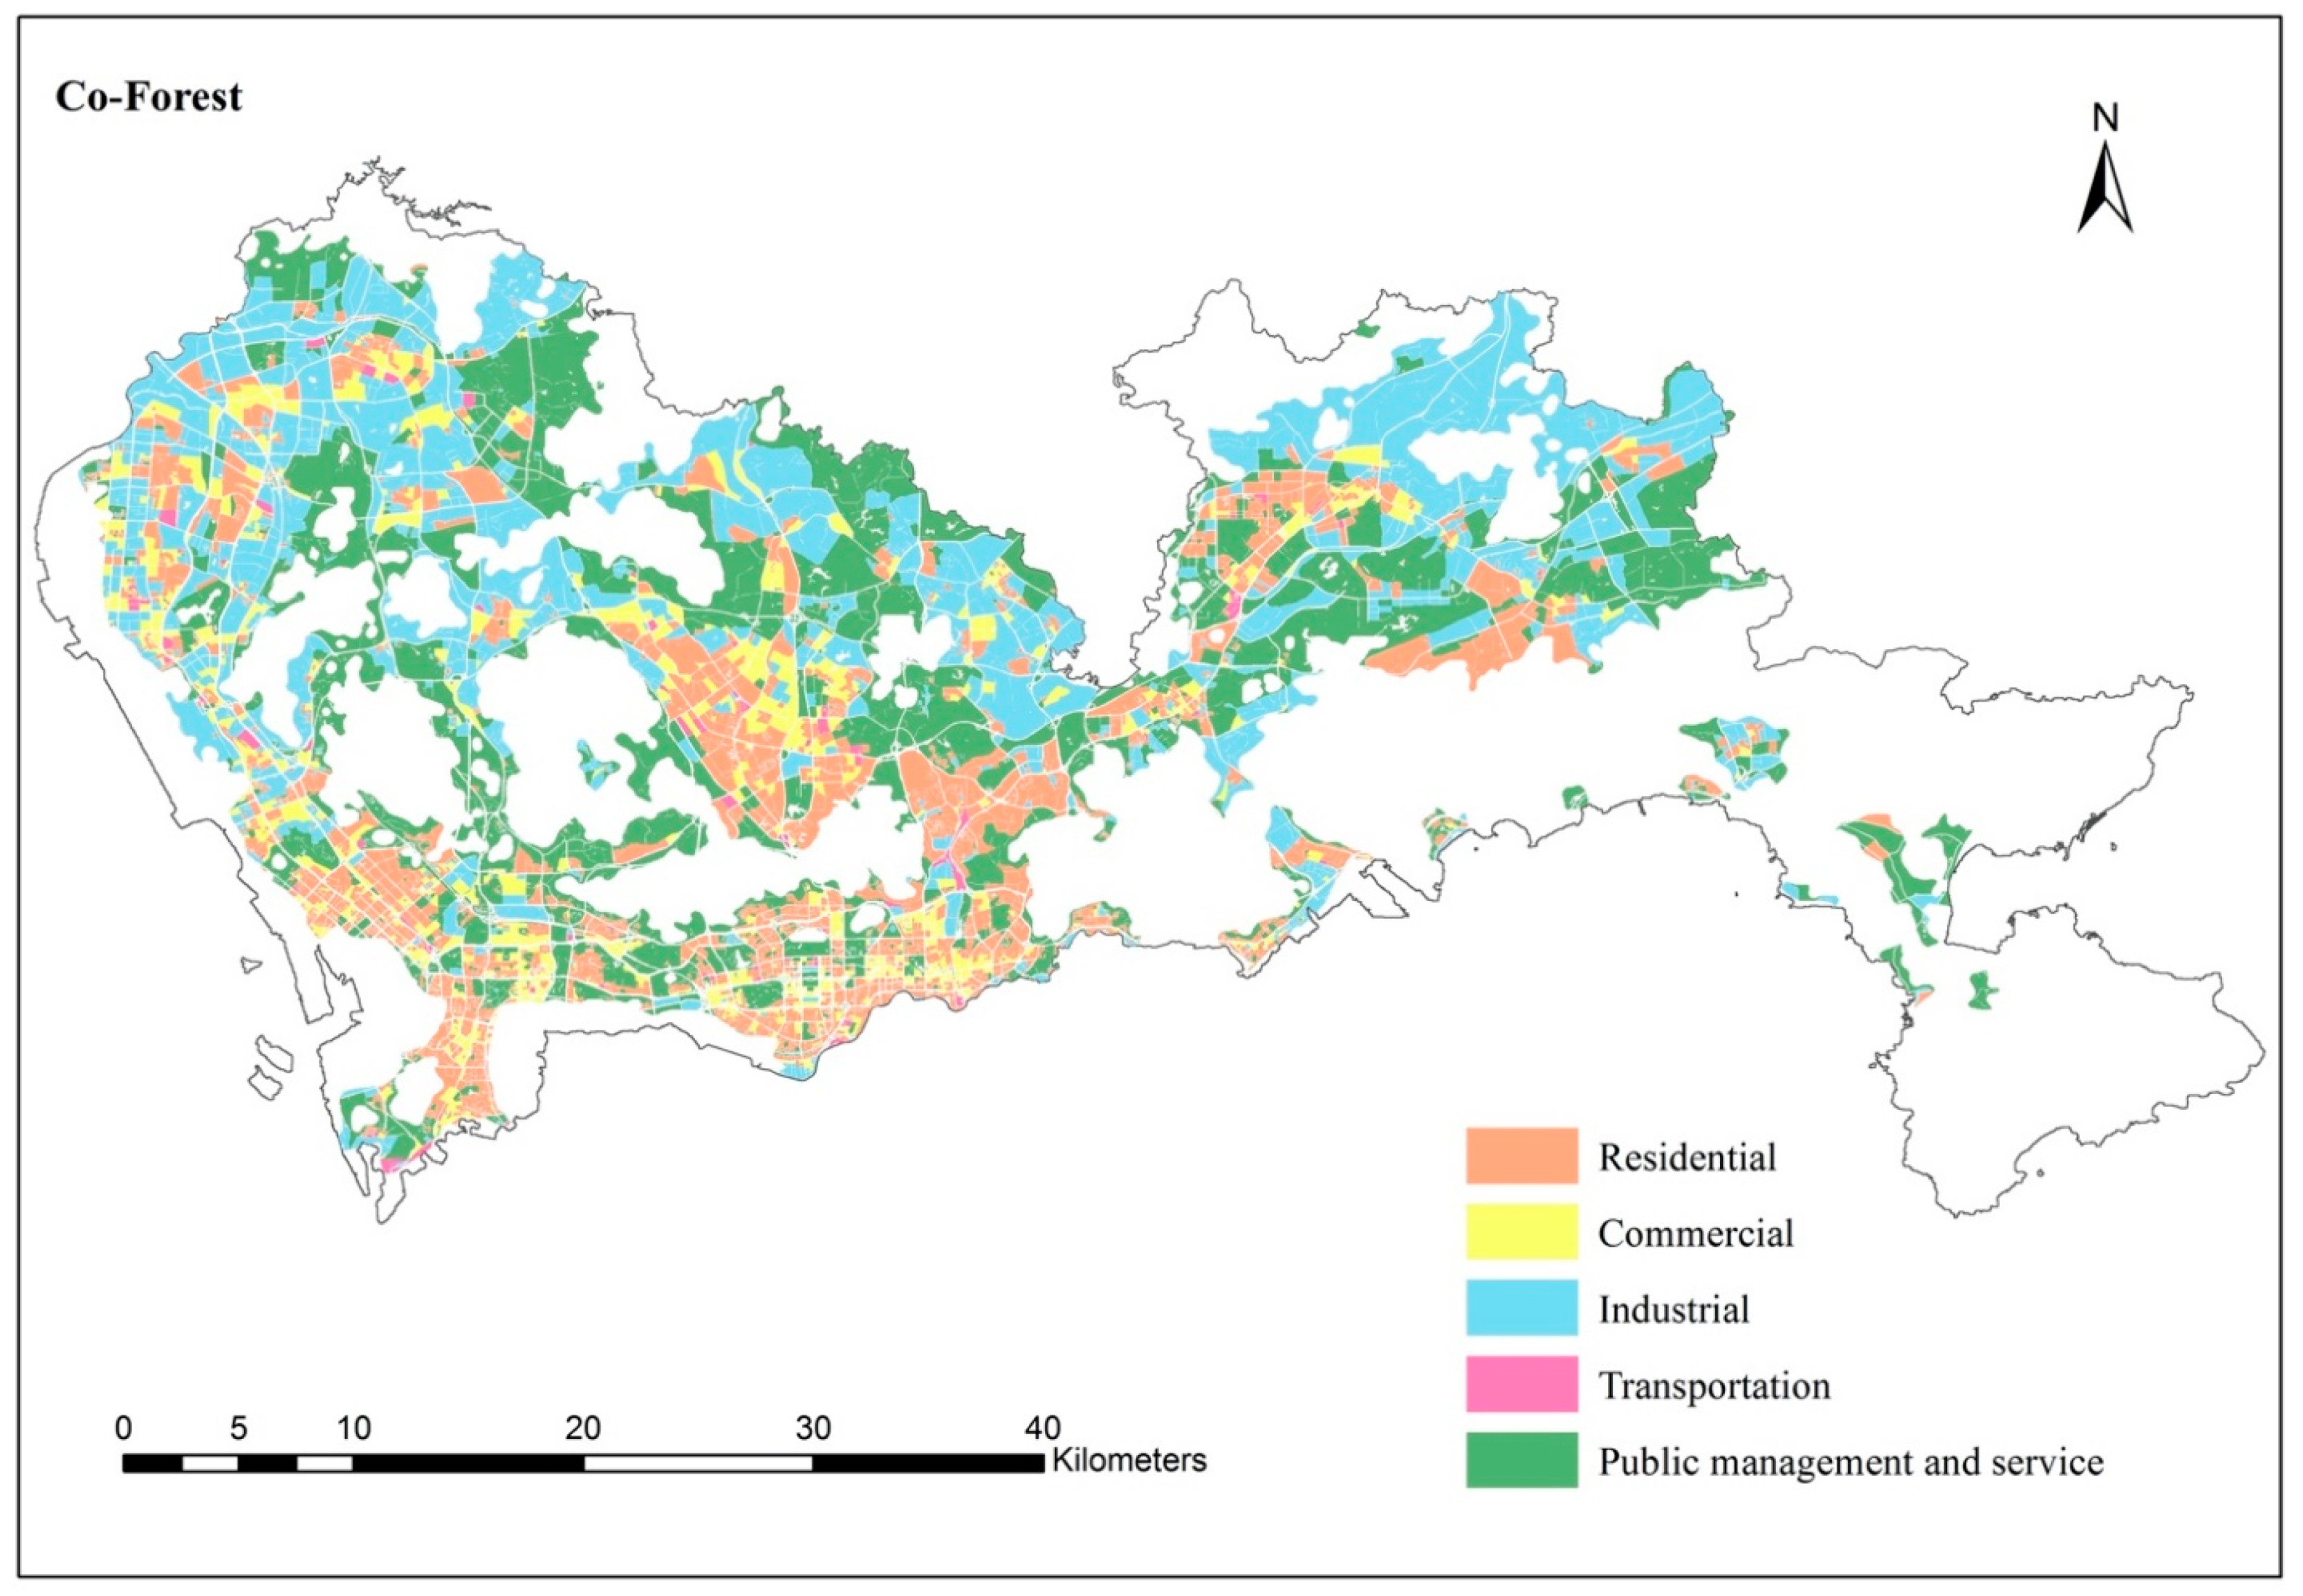
5.5. Detailed Urban Landuse Mapping with Few Samples

Based on the modified Co-Forest algorithm and multi-source data, Figure 9 illustrates the detailed urban landuse classification result in Shenzhen with 5% training samples. The spatial distributions of detailed urban landuse categories were consistent with the official urban planning scheme to some extent. Residential and commercial lands were mainly distributed in the downtown, while industrial lands were mainly distributed in the suburbs.
To quantify the classification result, Figure 10 shows the confusion matrix and accuracy assessment. The overall accuracy of the classification was 0.79. For the accuracy of specific urban landuse category, the producer and user accuracies measure the omission and commission errors, respectively. From the results, “residential”, “industrial”, and “public management and service” types achieved higher accuracies. The classification errors mainly concentrated in the misclassification between “commercial” and “residential” types, and the misclassification between “public management and service” and “residential” types.

6. Discussion

6.1. Small Sample Learning in Urban Landuse Classification

The selection of the training sample size is always an empirical process. Although the usual guidance is “use as much as possible”, it is a tradeoff when considering the cost and time of collecting the labeled samples for model training and testing [42]. In the case of urban landuse classification with limited labeled samples, the ideas to improve the utilization of labeled samples are mainly from the data level or the model level. The former includes the use of high-dimensional data, and the latter includes the automatically train of unlabeled samples by active learning or semi-supervised learning methods. In this study, the two ideas are both considered.
The physical property of landuse such as “buildings” and “built-up areas” can be obtained directly through remote sensing imagery data. However, remote sensing data are not enough to obtain high-level semantic information of detailed urban landuse. By providing high-dimensional landuse features, socio-economic big data provide a better approach to the classification of detailed urban landuse. For example, map POI data are usually considered to be very closely related to the identification of urban landuse categories [43]. It should be pointed out that a single data source is still insufficient. According to our experiment, it is hard to obtain a satisfied classification result only by using map POI data or the combination of POI and optical remote sensing data. This confirms the importance of multi-features, where a better classification accuracy can be achieved with all multi-source and multi-modal data.
Since there might be many more parameters than the training samples, it is generally considered to be a reason for the failure of deep neural networks when the training sample size is small. The tree-based classifiers such as the RF and XGBoost have been proven to show a better classification effect and have been widely utilized in urban landuse classification applications [44]. Therefore, in this study, we adopted a semi-supervised tree-based classification framework for the comparison. The results prove that the semi-supervised method performed better than the supervised classifiers, and it effectively reduced the demand of labeled samples for model training without reducing the classification accuracy.

6.2. Classification Stability under Small Size of Training Samples

To examine the classification stability with small sample size, a previous study pointed out that the number of training samples should not be less than 7% of all land parcels for the RF algorithm based on multi-source geospatial data [35]. Our study agrees with this conclusion. For the semi-supervised Co-Forest algorithm, even a 5% sample size can ensure the variation of classification accuracy within an acceptable range. Our study also showed that the semi-supervised algorithm attained a better performance than the supervised algorithms when the training sample size was larger than 7%.

6.3. Limitations and Uncertainties

Most previous studies have focused on the classification of broad landuse/land cover categories rather than detailed urban landuse categories. Due to the difficulty of semantic segmentation, it is hard to obtain a highly-accurate result of detailed urban landuse classification. Some scholars have reported that the overall accuracy of detailed urban landuse classification in mega cities such as Shenzhen is lower than 0.76 [35,36]. Although our results reached or even exceeded that accuracy level, in this study, we focused more on the effectiveness of applying multi-source geospatial data and semi-supervised classifier to improve small sample size-based landuse classification, rather than the absolute accuracy of the classification task.
In this study, training samples were mainly from high-purity landuse samples (e.g., the dominant type occupies more than 90% of the area in a land parcel). However, as a fast and well-developed city, Shenzhen has various mixed models of landuse such as “commercial-residential mixed” land. The models of mixed use include the mixture in horizontal space and vertical space. This may introduce a certain degree of uncertainty in the classification. When considering the generalization to other cities (e.g., using the original labels from one city to another), the major challenges come from the difference in urban landuse structure. The same urban landuse may have a distinct physical description in different cities. Therefore, more city cases and landuse labels are needed to verify the generalization performance of the model.

7. Conclusions

In this study, we explored the effectiveness of the semi-supervised Co-Forest algorithm and multi-source geospatial data in detailed urban landuse classification with a small sample size. Given that the collection of the large number of labeled samples in urban landuse classification practice is very difficult and has a high-cost, we also tested an optimal training set ratio of maintaining a stable classification result. By taking Shenzhen City as a case, the semi-supervised Co-Forest method showed a comparable result with the traditional supervised classifiers such as RF and XGBoost with a lower training set ratio level (reduced by 17–20%). The model performance declined rapidly once the training sample size was less than 5% in total. Therefore, 5% training samples or above are necessary to keep the loss of classification accuracy within an acceptable range. This study also confirms the importance of multi-source and multi-modal data, which have significantly improved the classification accuracy. Among them, POI data and high-resolution remote sensing data make a higher contribution.
In the future, we will extend the proposed method to other rapidly changing cities to evaluate the generalization performance. For more efficient usage of labeled samples, we will introduce data enhancement methods such as unsupervised enhancement algorithms to generate new labeled samples based on the existing labeled and unlabeled samples. Besides, we will analyze the mixed landuse by creating more labels to mine the features of the mixed landuse category.

Author Contributions

Conceptualization, B.S. and Q.Z.; Data curation, B.S. and Y.Z.; Formal analysis, Y.Z.; Funding acquisition, Q.Z.; Methodology, B.S. and Y.Z.; Resources, B.S.; Supervision, Q.Z.; Validation, X.Z.; Visualization, B.S. and Y.Z.; Writing—original draft, B.S.; Writing—review & editing, Q.Z. and X.Z. All authors have read and agreed to the published version of the manuscript.

Funding

This work was supported by the Natural Science Foundation of China (NSFC) General Program [Grant number: 41971386], the Hong Kong Research Grant Council (RGC) General Research Fund [Grant number: HKBU 12301820] and Shenzhen Science and Technology Innovation Committee General Project [Grant number: JCYJ20210324101406019].

Data Availability Statement

Publicly accessible datasets presented in this study are available. The data can be found from the links in text.

Acknowledgments

Field survey data were provided by Urban Planning and Land Resource Research Center, Planning and Nature Resource Bureau of Shenzhen Municipality. Mobile apps data were provided by Talking Data Ltd. Impervious surface data of GAIA_2018 were provided by Tsinghua University. The authors would like to acknowledge the editors and reviewers for their constructive and valuable comments on this manuscript.

Conflicts of Interest

The authors declare no conflict of interest.

References

  1. Lu, D.; Weng, Q. Use of impervious surface in urban land-use classification. Remote Sens. Environ. 2006, 102, 146–160. [Google Scholar] [CrossRef]
  2. Zhou, Q.; Sun, B. Analysis of spatio-temporal pattern and driving force of land cover change using multi-temporal remote sensing images. Sci. China Ser.-Technol. Sci. 2010, 53, 111–119. [Google Scholar] [CrossRef]
  3. Hu, S.; Wang, L. Automated urban land-use classification with remote sensing. Int. J. Remote Sens. 2013, 34, 790–803. [Google Scholar] [CrossRef]
  4. Liu, X.; Hu, G.; Chen, Y.; Li, X.; Xu, X.; Li, S.; Pei, F.; Wang, S. High-resolution multi-temporal mapping of global urban land using Landsat images based on the Google Earth Engine Platform. Remote Sens. Environ. 2018, 209, 227–239. [Google Scholar] [CrossRef]
  5. Herold, M.; Liu, X.; Clarke, K.C. Spatial metrics and image texture for mapping urban land use. Photogramm. Eng. Remote Sens. 2003, 69, 991–1001. [Google Scholar] [CrossRef] [Green Version]
  6. Carleer, A.P.; Wolff, E. Urban land cover multi-level region-based classification of VHR data by selecting relevant features. Int. J. Remote Sens. 2006, 27, 1035–1051. [Google Scholar] [CrossRef]
  7. Pacifici, F.; Chini, M.; Emery, W. A neural network approach using multi-scale textural metrics from very high-resolution panchromatic imagery for urban land-use classification. Remote Sens. Environ. 2009, 113, 1276–1292. [Google Scholar] [CrossRef]
  8. Liu, X.; Tian, Y.; Zhang, X.; Wan, Z. Identification of urban functional regions in chengdu based on taxi trajectory time series data. ISPRS Int. J. Geo-Inf. 2020, 9, 158. [Google Scholar] [CrossRef] [Green Version]
  9. Yao, Y.; Li, X.; Liu, X.; Liu, P.; Liang, Z.; Zhang, J.; Mai, K. Sensing spatial distribution of urban land use by integrating points-of-interest and Google Word2Vec model. Int. J. Geogr. Inf. Sci. 2017, 31, 825–848. [Google Scholar] [CrossRef]
  10. Andrade, R.; Alves, A.; Bento, C. POI Mining for Land Use Classification: A Case Study. ISPRS Int. J. Geo-Inf. 2020, 9, 493. [Google Scholar] [CrossRef]
  11. Fang, F.; Yuan, X.; Wang, L.; Liu, Y.; Luo, Z. Urban Land-Use Classification From Photographs. IEEE Geosci. Remote Sens. Lett. 2018, 15, 1927–1931. [Google Scholar] [CrossRef]
  12. Liu, X.; He, J.; Yao, Y.; Zhang, J.; Liang, H.; Wang, H.; Hong, Y. Classifying urban land use by integrating remote sensing and social media data. Int. J. Geogr. Inf. Sci. 2017, 31, 1675–1696. [Google Scholar] [CrossRef]
  13. Shi, Y.; Qi, Z.; Liu, X.; Niu, N.; Zhang, H. Urban land use and land cover classification using multisource remote sensing images and social media data. Remote Sens. 2019, 11, 2719. [Google Scholar] [CrossRef] [Green Version]
  14. Pei, T.; Sobolevsky, S.; Ratti, C.; Shaw, S.-L.; Li, T.; Zhou, C. A new insight into land use classification based on aggregated mobile phone data. Int. J. Geogr. Inf. Sci. 2014, 28, 1988–2007. [Google Scholar] [CrossRef] [Green Version]
  15. Jia, Y.; Ge, Y.; Ling, F.; Guo, X.; Wang, J.; Wang, L.; Chen, Y.; Li, X. Urban land use mapping by combining remote sensing imagery and mobile phone positioning data. Remote Sens. 2018, 10, 446. [Google Scholar] [CrossRef] [Green Version]
  16. Wieland, W.; Pittore, M. Performance evaluation of machine learning algorithms for urban pattern recognition from multi-spectral satellite images. Remote Sens. 2014, 6, 2912–2939. [Google Scholar] [CrossRef] [Green Version]
  17. Sun, L.; Tang, L.; Shao, G.; Qiu, Q.; Lan, T.; Shao, J. A machine learning-based classification system for urban built-up areas using multiple classifiers and data sources. Remote Sens. 2019, 12, 91. [Google Scholar] [CrossRef] [Green Version]
  18. Cao, K.; Guo, H.; Zhang, Y. Comparison of approaches for urban functional zones classification based on multi-source geospatial data: A case study in Yuzhong District, Chongqing, China. Sustainability 2019, 11, 660. [Google Scholar] [CrossRef] [Green Version]
  19. Zhang, Y.; Li, Q.; Huang, H.; Wu, W.; Du, X.; Wang, H. The combined use of remote sensing and social sensing data in fine-grained urban land use mapping: A case study in Beijing, China. Remote Sens. 2017, 9, 865. [Google Scholar] [CrossRef] [Green Version]
  20. Li, W. Mapping urban land use by combining multi-source social sensing data and remote sensing images. Earth Sci. Inform. 2021, 14, 1537–1545. [Google Scholar] [CrossRef]
  21. Hong, D.; Yokoya, N.; Ge, N.; Chanussot, J.; Zhu, X.X. Learnable manifold alignment (LeMA): A semi-supervised cross-modality learning framework for land cover and land use classification. ISPRS J. Photogramm. Remote Sens. 2019, 147, 193–205. [Google Scholar] [CrossRef] [PubMed]
  22. Ligthart, A.; Catal, C.; Tekinerdogan, B. Analyzing the effectiveness of semi-supervised learning approaches for opinion spam classification. Appl. Soft Comput. 2021, 101, 107023. [Google Scholar] [CrossRef]
  23. Yin, J.; Dong, J.; Hamm, N.A.; Li, Z.; Wang, J.; Xing, H.; Fu, P. Integrating remote sensing and geospatial big data for urban land use mapping: A review. Int. J. Appl. Earth Obs. Geoinf. 2021, 103, 102514. [Google Scholar] [CrossRef]
  24. Cao, R.; Tu, W.; Yang, C.; Li, Q.; Liu, J.; Zhu, J.; Zhang, Q.; Li, Q.; Qiu, G. Deep learning-based remote and social sensing data fusion for urban region function recognition. ISPRS J. Photogramm. Remote Sens. 2020, 163, 82–97. [Google Scholar] [CrossRef]
  25. Mountrakis, G.; Im, J.; Ogole, C. Support vector machines in remote sensing: A review. ISPRS J. Photogramm. Remote Sens. 2011, 66, 247–259. [Google Scholar] [CrossRef]
  26. Yang, C.; Wu, G.; Ding, K.; Shi, T.; Li, Q.; Wang, J. Improving land use/land cover classification by integrating pixel unmixing and decision tree methods. Remote Sens. 2017, 9, 1222. [Google Scholar] [CrossRef] [Green Version]
  27. Talukdar, S.; Singha, P.; Mahato, S.; Pal, S.; Liou, Y.-A.; Rahman, A. Land-use land-cover classification by machine learning classifiers for satellite observations—A review. Remote Sens. 2020, 12, 1135. [Google Scholar] [CrossRef] [Green Version]
  28. Zhang, X.; Sun, Y.; Zheng, A.; Wang, Y. A New Approach to refining land use types: Predicting point-of-interest categories using weibo check-in data. ISPRS Int. J. Geo-Inf. 2020, 9, 124. [Google Scholar] [CrossRef] [Green Version]
  29. Xu, S.; Qing, L.; Han, L.; Liu, M.; Peng, Y.; Shen, L. A new remote sensing images and point-of-interest fused (rpf) model for sensing urban functional regions. Remote Sens. 2020, 12, 1032. [Google Scholar] [CrossRef] [Green Version]
  30. Jozdani, S.E.; Johnson, B.A.; Chen, D. comparing deep neural networks, ensemble classifiers, and support vector machine algorithms for object-based urban land use/land cover classification. Remote Sens. 2019, 11, 1713. [Google Scholar] [CrossRef] [Green Version]
  31. Tu, W.; Hu, Z.; Li, L.; Cao, J.; Jiang, J.; Li, Q.; Li, Q. Portraying urban functional zones by coupling remote sensing imagery and human sensing data. Remote Sens. 2018, 10, 141. [Google Scholar] [CrossRef] [Green Version]
  32. Jiang, Y.; Yan, X. Discovering the relationship between travel behavior and land use: A case study of Beijing, China. In Proceedings of the 2019 4th International Conference on Electromechanical Control Technology and Transportation (ICECTT 2019), Guilin, China, 26–28 April 2019. [Google Scholar]
  33. Zhao, K.; Jin, X.; Wang, Y. Survey on few-shot learning. J. Softw. 2021, 32, 349–369. (In Chinese) [Google Scholar]
  34. Li, C.; Wang, J.; Wang, L.; Hu, L.; Gong, P. Comparison of classification algorithms and training sample sizes in urban land classification with Landsat Thematic Mapper imagery. Remote Sens. 2014, 6, 964–983. [Google Scholar] [CrossRef] [Green Version]
  35. Su, M.; Guo, R.; Chen, B.; Hong, W.; Wang, J.; Feng, Y.; Xu, B. Sampling strategy for detailed urban land use classification: A systematic analysis in Shenzhen. Remote Sens. 2020, 12, 1497. [Google Scholar] [CrossRef]
  36. Gong, P.; Chen, B.; Li, X.; Liu, H.; Wang, J.; Bai, Y.; Chen, J.; Chen, X.; Fang, L.; Feng, S.; et al. Mapping essential urban land use categories in China (EULUC-China): Preliminary results for 2018. Sci. Bull. 2019, 65, 182–187. [Google Scholar] [CrossRef] [Green Version]
  37. Hartmann, W.M. Dimension Reduction vs. Variable Selection. In Applied Parallel Computing. State of the Art in Scientific Computing. PARA 2004; Dongarra, J., Madsen, K., Waśniewski, J., Eds.; Lecture Notes in Computer Science; Springer: Berlin/Heidelberg, Germany, 2004; Volume 3732. [Google Scholar] [CrossRef]
  38. Blum, A.; Mitchell, T. Combining labeled and unlabeled data with co-training. In Proceedings of the Eleventh Annual Conference on Computational Learning Theory-COLT’ 98, Madison, WI, USA, 24–26 July 1998. [Google Scholar] [CrossRef]
  39. Zhou, Z.-H.; Li, M. Semi-supervised learning by disagreement. Knowl. Inf. Syst. 2009, 24, 415–439. [Google Scholar] [CrossRef]
  40. Tanha, J.; Van Someren, M.; Afsarmanesh, H. Semi-supervised self-training for decision tree classifiers. Int. J. Mach. Learn. Cybern. 2017, 8, 355–370. [Google Scholar] [CrossRef] [Green Version]
  41. Foody, G.M. Status of land cover classification accuracy assessment. Remote Sens. Environ. 2002, 80, 185–201. [Google Scholar] [CrossRef]
  42. Wang, Y.; Yao, Q.; Kwok, J.T.; Ni, L.M. Generalizing from a Few Examples. ACM Comput. Surv. 2021, 53, 1–34. [Google Scholar] [CrossRef]
  43. Chen, B.; Xu, B.; Gong, P. Mapping essential urban land use categories (EULUC) using geospatial big data: Progress, challenges, and opportunities. Big Earth Data 2021, 5, 410–441. [Google Scholar] [CrossRef]
  44. Chen, S.; Zhang, H.; Yang, H. Urban functional zone recognition integrating multisource geographic data. Remote Sens. 2021, 13, 4732. [Google Scholar] [CrossRef]
Figure 1. Location of the study area (a) and road segmentation for land parcels to be classified (b).
Remotesensing 14 00648 g001
Figure 2. Examples of multi-source geospatial data for detailed urban landuse classification: (a) high-resolution optical remote sensing image, (b) NTL remote sensing image, (c) mobile phone data, (d) map POI data.
Remotesensing 14 00648 g002
Figure 3. The classification framework based on the Co-Forest algorithm.
Remotesensing 14 00648 g003
Figure 4. Spatial distribution of labeled samples.
Remotesensing 14 00648 g004
Figure 5. The performance evaluation of algorithm improvements, (a) overall accuracy, (b) Kappa coefficient.
Remotesensing 14 00648 g005
Figure 6. Comparison of the accuracy with traditional supervised algorithms at different levels of the training sample size.
Remotesensing 14 00648 g006
Figure 7. Change rate in classification accuracy at different training size ratios by taking the result with all training samples (12% in total) as a reference.
Remotesensing 14 00648 g007
Figure 8. The accuracies of detailed urban landuse classification by using different combinations of multi-source data.
Remotesensing 14 00648 g008
Figure 9. Detailed urban landuse mapping in Shenzhen City (2019) based on the semi-supervised Co-Forest algorithm with 5% training samples.
Remotesensing 14 00648 g009
Figure 10. The confusion matrix and accuracy assessment, the code of landuse category from 1 to 5 represents residential (1), commercial (2), industrial (3), transportation (4), and public management and service (5), respectively.
Remotesensing 14 00648 g010
Table 1. The characteristics of data for detailed urban landuse classification.
Type of DataSourceSpatial ResolutionAcquisition Time
Optical remote sensingSentinel-210 m2019
NTL remote sensingLuojia-1130 mNovember 2018 to March 2019
Mobile big dataApps with GPS location sharing140 m (approx.)October 2018 to February 2019
Map POIGaode map POI/June 2020
Table 2. Selected features after dimension reduction.
TypeSelected Features
Optical remote sensing imagerymean and standard deviation of NDVI, NDBI, MNDWI, band 4 (red), band 8 (NIR), band 7 (red edge), band 11 (SWIR)
NTL remote sensing imageryDN value (or brightness) in November 2018, January 2019, and March 2019, mean brightness
Mobile apps dataaverage number of mobile devices, no. at daytime and nighttime
Map POI datano. of POI, no. and ratio of POI by landuse category (5 categories)
Note: NDVI = normalized difference of vegetation index, NDBI = normalized difference of built-up index, MNDWI = modified normalized difference of waterbody index, NIR = near infrared, SWIR = shortwave infrared, DN = digital number.
Table 3. Urban landuse classification system of Shenzhen City.
CodeCategoryDescriptions
1Residential (R)Residential area including village-in-city (urban village specific to China).
2Commercial (C)Commercial area including business districts, shopping areas, etc.
3Industrial (I)Industrial area including manufacturing districts, storage areas, etc.
4Transportation (T)Roads * and transportation hubs (e.g., station, airport, harbor, etc.).
5Public management and service (P)Governmental office zone, medical and health services, sports and cultural facilities.
* Because land parcels are from road network segmentation, the classification of roads was excluded in our study.
Table 4. Minimum sample size requirements to achieve different accuracy levels.
The Level of Accuracy (by OA)Training Sample Size Requirement (% in Total)* Training Samples Saved (%)
RFXGBoostCo-Forest
0.745%4%4%20%
0.76/6%5%17%
0.78//11%/
* Compared with the supervised methods (i.e., RF and XGBoost).
Publisher’s Note: MDPI stays neutral with regard to jurisdictional claims in published maps and institutional affiliations.

