Abstract
The small scale of transmission towers and the environmental diversity around their situations make their detection in Synthetic Aperture Radar (SAR) images a challenging task. This paper presents a new hierarchical detection algorithm for transmission towers. First, Signal-to-Clutter Ratios (SCRs) of pixels are calculated. Afterwards, a SCR threshold is set. Since transmission towers possess strong scattering characteristics, pixels with SCRs above the threshold are considered as potential transmission tower pixels. Second, spatial densities of potential transmission tower pixels are calculated. According to the aggregation characteristics of transmission tower pixels, some potential transmission tower pixels with small spatial densities are removed. The remained potential transmission tower pixels are considered as candidate transmission tower pixels. The candidate transmission tower pixels are grouped by the nearest neighbour scheme such that in each group the distance between pixels is under a given threshold. Thus, each of the groups is viewed as a quasi-transmission tower. Convex-hulls of quasi-transmission towers are built, and then Minimum Bounding Rectangle (MBR) for each convex-hull is generated. According to the rectangle aspect ratios of MBRs, the real transmission towers are extracted. C-band HH-polarization GaoFen-3 (GF-3) amplitude images are used for experiments and four of the most popular transmission tower detection algorithms are selected as comparing algorithms to validate the proposed algorithms. The detection performance of transmission towers is evaluated with detection rate and quality factor. Experimental results verify that the proposed algorithm can efficiently and accurately detect transmission towers while maintaining the transmission tower geometry to a certain extent, which indicates that the proposed algorithm is efficient and promising.
1. Introduction
As protection and support equipment for overhead transmission lines, transmission towers are important infrastructure for the power industry [1]. They are situated in a wide variety of natural environments such as the suburbs, farmland, forests and other field areas, and are very vulnerable to various natural disasters such as floods, landslide, wildfire, wind damage and so on [2]. To ensure the uninterrupted and safe transmission of electricity, effective detection and maintenance of transmission towers are essential [3,4]. Initially, transmission towers are mostly monitored by unmanned aerial vehicles (UAV) [5,6] and helicopter patrols to collect information about the status of transmission towers. Obviously, these methods consume a lot of manpower, material and financial resources and are prone to measurement errors. Therefore, the transmission tower detection based on remote sensing images is developed. Transmission towers are symmetrical in structure, unchanged for a long time and numerous in number. However, they are vertical structures that occupy a small area, so it is often difficult to detect transmission towers in remote sensing images. Synthetic Aperture Radar (SAR) system [7,8] can effectively avoid the influence of cloud, fog, rain, snow and other climatic conditions, and can continuously observe the ground surface for a long time [9,10], so it is widely applied in various fields such as target detection [11,12] and disaster monitoring [13,14]. However, SAR images have strong speckle noise [15,16,17], which increases the difficulty of the object detection task. With the continuous improvement of SAR system resolution, the information of transmission towers in the images becomes more and more abundant, so the detection of transmission towers from SAR images has gradually received the attention of many researchers [18].
Over the past decades, numerous transmission tower detection algorithms have been proposed. Depending on the data types, they are mainly divided into airborne or spaceborne SAR-based. In the early transmission tower detection, airborne SAR images are mainly used. For example, Woods et al. [19] proposed to construct Digital Surface Models (DSMs) using airborne InSAR [20] images and to detect vertical obstacles such as various towers based on the DSMs by modeling their geometries. However, this algorithm did not fully utilize the spectral information within the SAR images. Yang et al. [21] proposed an algorithm for automatic detection of transmission towers based on airborne fully polarized SAR images. This algorithm analyzes the four-component scattering model [22] and the spiral scattering component separately, extracts the point targets, and then connects all the isolated points as the final transmission tower lines. Currently, it is becoming a trend that spaceborne SAR images are used to detect transmission towers. Liu et al. [23] used the TerraSAR-X SSC images to detect and estimate the height of transmission towers. From the detection results of these algorithms, there still exist large false alarms.
Depending on the cardinal principles used, transmission tower detection methods can be divided into Constant False Alarm Rate (CFAR) [24,25] methods and deep learning methods [4,24,26]. For transmission tower detection in SAR images, the CFAR algorithm is one of the most commonly used algorithms, which has been used and studied for many years due to its computational simplicity and stable performance. For example, He et al. [27] proposed a local CFAR-based detection model to reconstruct transmission towers by local CFAR model, extract scale parameters, and eliminate coherent scattering noise to implement the detection algorithm. Therefore, Zhang et al. [28] combined CFAR with Extended Fractal (EF) to detect transmission towers as point targets in SAR intensity images. However, EF features have limited ability to describe geometric features, resulting in less accurate detection results. Subsequently, based on the characteristics of transmission towers. Guo et al. [29] proposed an algorithm to detect transmission towers using contrario theory. However, the algorithm is limited and needs to satisfy the equidistant linear arrangement, and the wrong detection is more serious. In addition, as an important research method of target detection, deep learning is also sought after by many scholars. Such as, Region-based CNNs (R-CNN) [30], Faster-RCNN [31], YOLO (You Only Look Once) [32] and SSD (Single Shot Multibox) [33] have been developed in the recent years for object detection tasks [26]. However, as the depth of the network increases, the convolutional neural network often encounters some negative effects, such as overfitting and gradient explosion, which affect the performance of the network itself. To this end, Gao et al. [34] proposed a deep cascaded network for change detection in SAR images. In addition, it is well known that speckle noise in SAR images has a great impact on detection. Zhang et al. [35] proposed a two-stage target-based deep learning method for multi-temporal SAR image change detection. Although this method reduced the false alarm rate to a certain extent, it can be found from the results that there was a loss of spatial details, over-reliance on the characteristics of deep learning, can only handle specialized tasks, and was not applicable to other complex tasks. Apparently, deep learning methods are mainly used for transmission detection by training a large number of transmission tower samples. Zeng et al. [36] used Polar Coordinate Semi-Variogram (PCSV) to extract the geometric features of Region of Interest (ROI) and transmission tower detection is implemented by using a three-layer neural network. However, the algorithm requires extensive preprocessing before the experiment, resulting in the detection of a large number of false alarm targets with similar geometric features to the transmission towers. Gao et al. [4] proposed an improved SSD-based transmission tower detection method to speed up the training by reducing the categories in the dataset and changing the scale and aspect ratio of default boxes in SSD, which improves the detection speed but tends to reduce the detection accuracy. In summary, from the results and basic ideas of these proposed algorithms, for large-scale images, all of them extract transmission towers as point targets, and the detection results have high false alarm rates or improve the detection rate through the idea of image enhancement and noise suppression [37]. Additionally, the algorithms that consider the geometric shape features of transmission towers ignore the amplitude information of transmission towers in SAR images.
This paper proposes a hierarchical algorithm from high-resolution SAR images. First, the Signal-to-Clutter Ratio (SCR) [38] features of the transmission towers in SAR images are used to extract the potential transmission tower pixels, which is different from the above literature that constructs an a priori model to detect the transmission towers. Secondly, based on the aggregation characteristics of transmission tower pixels, some potential transmission tower pixels with small spatial density are eliminated, and the remaining potential transmission tower pixels are considered as candidate transmission tower pixels. Finally, the convex-hulls [39] of quasi-transmission towers are generated by calculating the minimum distance between the candidate transmission tower pixel pairs, grouping the quasi-transmission tower pixel groups, and generating their minimum bounding rectangles (MBRs) [40]. The MBR aspect ratio extraction criterion is set according to the actual size of the transmission tower and its imaging morphology in the SAR images to complete the accurate extraction of transmission tower. Fast, robust and effective detection of transmission towers is realized to meet the detection needs of transmission towers.
The remainder of this paper is organized as follows. Section 2 describes the proposed algorithm in detail. Section 3 presents the experimental results of the proposed algorithm. Section 4 presents the comparison and analysis of the proposed algorithm and the comparative experimental results. Finally, Section 5 concludes this paper.
2. Methodology
2.1. Preliminary
Since transmission towers are made of steel metal materials with stronger reflective properties than their surrounding background, and appear as strongly bright small elongated targets in high-resolution SAR images. Meanwhile, according to the geographical conditions on which transmission towers are situated, it can be known that the background around the transmission towers can be usually viewed as distributed targets, such as land and forest. Therefore, the transmission tower pixels have a stronger correlation each other compared to the background pixels in spectral and spatial. In conclusion, there are the following characteristics of transmission towers.
(1) The backscattering intensity of background clutter is required to be much lower than the peak signals of transmission towers, so it is reasonable to select potential transmission tower pixels by the SCRs.
(2) The spatial density of potential transmission tower pixels detected on a transmission tower area is greater than for ones on background area.
(3) The transmission towers in the SAR images appear as simple and recognizable long strips.
2.2. Potential Transmission Tower Pixels Detection
For a given preprocessed and cropped amplitude SAR image , where is the image domain, i is the pixel index, is the grid position coordinate of pixel i, is the pixel index set, n is the total number of pixels, and is the spectral reflection amplitude of pixel i. The idea behind potential transmission tower pixels detection corresponds to the transmission tower characteristics (1) in Section 2.1. That is, using transmission towers possessing strong scattering characteristics can distinguish potential transmission tower pixels with strong scattering characteristics from background pixels with weak scattering characteristics. In order to judge the scattering ability of pixels more accurately, it is necessary to convert the original SAR image to its image, as the image is more representative of the scattering ability by calculating the spectral values of central pixel and its neighboring pixels.
The definition of SCR is motivated by the spatial distribution of potential transmission tower pixels and the sliding detection window, as shown in Figure 1. Each transmission tower presents a number of aggregated pixels. The SCR value of the pixels within each window can be obtained by sliding the window. That is, first, an appropriate detection window is established on the SAR image to be detected. By sliding the window, the pixels in the window are arranged in ascending order, the pixel with the largest amplitude is regarded as the target pixel, and the average value of the other smallest of the pixels is regarded as the background pixel, thereby calculating the signal-to-noise ratio of the target pixel. The schematic diagram is shown in Figure 1. Let be a detection window and its size be set according to the number of pixels occupied by the transmission tower and the SAR image resolution to minimize the detection of pseudo-pixels while ensuring that the transmission tower pixels are not missed. The detection window with too-large size will miss the transmission tower pixels, otherwise, it will result in too many pseudo pixels. Accordingly, for pixel i, its SCR is calculated as follows,
where is the SCR value at pixel i, is the maximum spectral reflection amplitude of pixels within the detection window central on pixel i, i.e., , is the index set of pixel i and its neighboring pixels in the detection window, is the index set of pixels of the lowest amplitude in the detection window, is the number of pixels in . Therefore, the generated image can be expressed as .
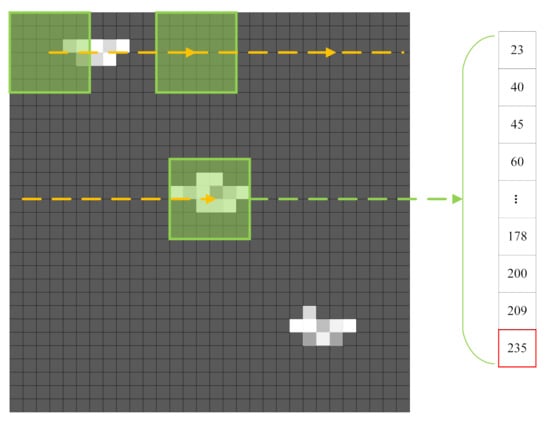
Figure 1.
Schematic diagram for transmission towers distribution and sliding detection window.
To obtain the potential transmission tower pixels, the SCR threshold of the image is set to , i.e., the potential transmission tower pixels can be detected as . Due to the different background complexity within the image, the statistical distribution of the pixels’ amplitudes is prone to different situations such as single-peak distribution or multi-peak distribution, and the corresponding images also show a variety of distributions, as shown in Figure 2a,b. In order to accurately describe the image statistical distribution, a Gaussian mixture model is used,
where is the probability density function (pdf) of the Gaussian mixture model, is the weight, and are the mean and variance of kth class, , and can be calculated by Expectation-Maximization (EM) algorithm. The threshold is chosen according to the Gaussian mixture model distribution at the wave crest corresponding to the maximum and next largest . Without loss of generality, ’s, k = 1,…, K, are arranged in ascending order. Thus, it can be said that the SCR threshold is between K-1 and K (K > 2) means. To be accurate, SCR threshold can be calculated as follows,
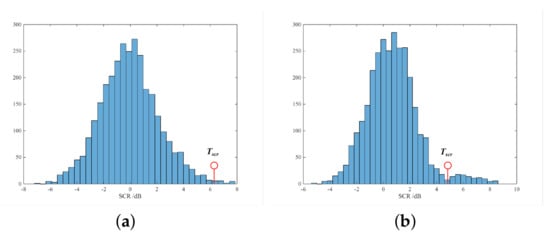
Figure 2.
SCR histogram. (a) Single-peak distribution. (b) Multi-peak distribution.
As a result, the set of indexes of potential transmission tower pixels can be obtained as .
2.3. Candidate Transmission Tower Pixels Detection
According to the transmission tower characteristic (2) in Section 2.1, the spatial density of potential transmission tower pixels is higher than the spatial density of pixels in the background area. Therefore, candidate transmission tower pixels can be further filtered by calculating spatial density of the potential transmission tower pixel and based on a density threshold. Constructing a square window centered at potential transmission tower pixel i, and the spatial density of the can be expressed as
for all potential transmission tower pixels, their spatial density set is , where # denotes the operation of counting the number of elements in a set.
As shown in Figure 3, the number of pixels contained in different windows varies. By calculating the pixel spatial density, the windows with higher density are detected by combining the predefined density threshold to obtain the set of candidate transmission tower pixels. Taking the threshold = 16 as an example, Figure 3 shows the calculation of the pixel spatial density for candidate transmission tower pixels, in which the interfering pixels in the two green square windows will be filtered out. Therefore, the index set of candidate transmission tower pixels can be expressed as . By statistical analysis of the image, can be obtained as follows:
where is the downward rounding symbol, represents the total number of pixels in the window . The reason is that if they are transmission tower pixels, they should dominate within the and correspond to a higher number of pixels, otherwise, smaller than are background pixels.
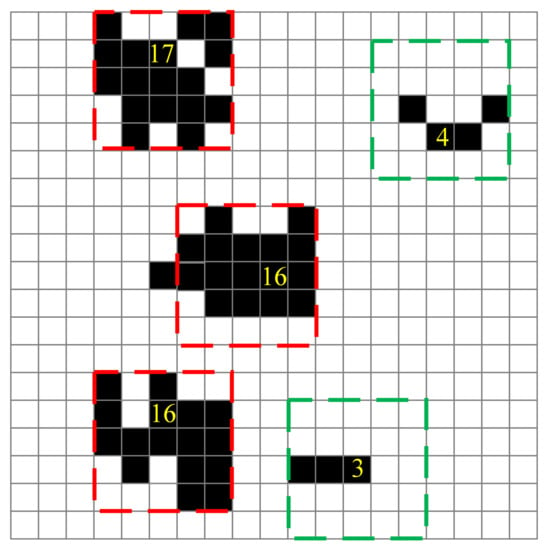
Figure 3.
Sketch of candidate transmission tower pixels space density calculation.
2.4. Transmission Tower Detection
In order to remove false alarm targets in detected candidate transmission tower pixels, such as ground background, road edge lines and surrounding artificial targets, the geometric feature-based filtering algorithm is designed. Based on the imaging characteristics of transmission towers in SAR images, it is found that the constituent pixels of the same transmission tower will inevitably break and thus be divided into several subsets. Surrounding them are also interspersed with independent interfering pixels that are not removed by spatial density detection. Therefore, the candidate transmission tower pixel sets are first grouped by calculating the pixel distances and the interfering pixels will be removed as well.
The distance between the pixels of the candidate transmission towers is as,
Setting the distance threshold as , candidate transmission tower pixels that satisfy the threshold range will be divided into one group, and each group of pixels is considered as a quasi-transmission tower. Therefore, the quasi-transmission tower pixels can be expressed as . The distance threshold can be calculated by the following:
where is the upward rounding symbol, denotes the maximum break length between subsets of pixels in one transmission tower, which is determined by counting the transmission tower pixels within the image. is the length of window . Furthermore, if the distances to any of the other pixels are larger than , it will be judged as a background interference pixel and filtered out.
The schematic diagram of candidate transmission tower pixels grouped into several quasi-transmission towers is shown in Figure 4. Observing Figure 4, which contains two sets of candidate transmission tower pixels, A and B. The single pixel marked as #1 in A is considered as interference background pixels, so is #3 in B. Therefore, the two groups of pixels labeled #2 and #4 in A and B constitute two quasi-transmission towers, respectively. The proposed method can effectively filter out the independent interference pixels around the transmission towers.
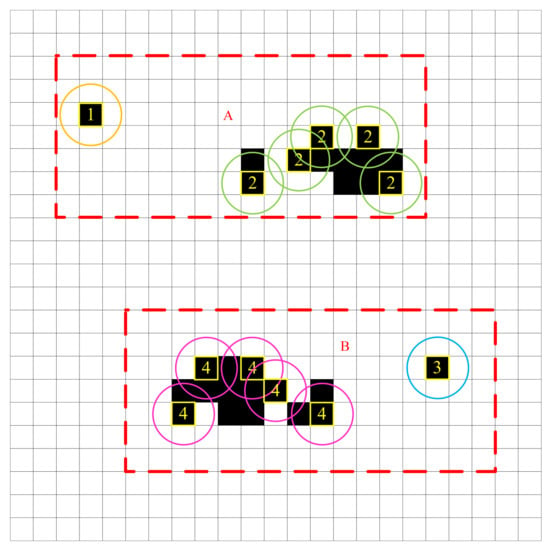
Figure 4.
Sketch of the quasi-transmission towers selected based on pixel distance.
Therefore, the quasi-transmission towers can be denoted as , where is the set of quasi-transmission tower pixels corresponding to transmission tower j, satisfying ; , M is the number of transmission towers.
Then, the convex-hull is generated for each quasi-transmission tower which can be denoted as .
After that, a MBR is constructed for each convex-hull which is used to define the geometric shape of the transmission tower. The MBRs of convex-hulls can be denoted as . Figure 5a–c show the MBR corresponding to quasi-transmission tower, the MBR superimposed onto the original image and the sketch of the convex-hull.
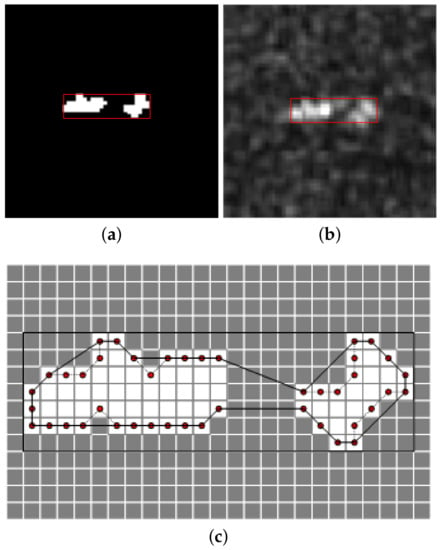
Figure 5.
(a) MBR. (b) MBR superimposed on the original image. (c) Sketch of the convex-hull and its MBR.
Finally, the aspect ratio is determined in accordance with transmission tower geometry to further filter out quasi-transmission towers that do not satisfy the geometric parameters of transmission towers. That is, let , where is the coordinate of the center position of the rectangle, is the length of the rectangle, is the width of the rectangle, and is the angle between the long side of the rectangle and the horizontal coordinate axis. Therefore, the ratio of length to width is,
The aspect ratio thresholds are chosen based on the size of the transmission towers and the resolution of the images, and the MBRs that do not satisfy the aspect ratio are further filtered to obtain the exact MBRs. Additionally, the real transmission towers results can be denoted as , is threshold of r for real transmission tower.
The detailed procedures of the proposed Algorithm 1 are described as follows.
| Algorithm 1. The detailed procedures of the proposed algorithm. |
| Input: Amplitude SAR image . |
| Output: Detection results . |
| Step 1. Setting the window size for detecting pixels as . |
| Step 2. Calculating the SCR by using Formula (1) and SCR threshold to obtain potential |
| transmission tower pixels . |
| Step 3. Calculating spatial density by using Formula (4) to obtain candidate transmission |
| tower pixels . |
| Step 4. Calculating pixels distances by Formula (6) and distance threshold to obtain |
| quasi-transmission towers . |
| Step 5. Generating convex-hulls of , constructing MBRs of the convex-hulls and |
| set aspect ratio of MBRs by Formula (8). |
| Step 6. Obtaining the detection results . |
Therefore, the overall flowchart of the proposed method is shown in Figure 6.
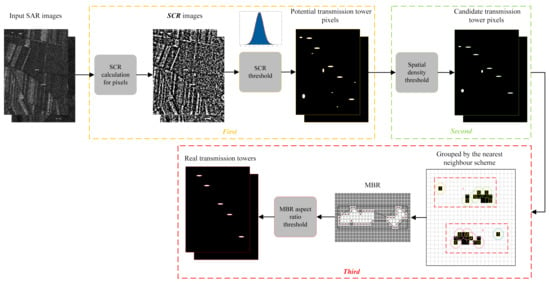
Figure 6.
The overall flowchart of the proposed algorithm.
3. Experiments and Results
3.1. Data Used
In the experiment, C-band HH-polarization GF-3 amplitude images are employed to validate the proposed algorithm. Figure 7 shows the experimental images with sizes of 535 × 433 pixels, where Figure 7a shows a farmland with 8 m resolution, located in Shenyang City, China, and contains five transmission towers; Figure 7b–d show farmland and wasteland with 3 m resolution, located in Fuxin City, China, and contain three, five and nine transmission towers, respectively.
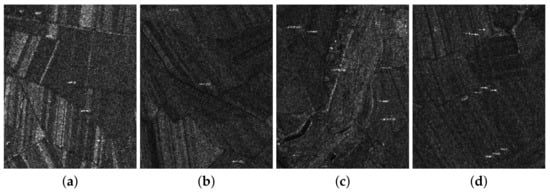
Figure 7.
Experimental SAR images.(a) farmland with 8m resolution, located in Shenyang City, China, and contains five transmission towers (b–d) show farmland and wasteland with 3 m resolution, located in Fuxin City, China, and contain three, five and nine transmission towers, respectively.
3.2. Experimental Results and Analysis
To validate the feasibility and effectiveness of the proposed algorithm, transmission towers detection experiments in real SAR remote sensing images are performed on a PC with Intel (R) Core (TM) i5-4460, 3.20 GHz and 8 GB memory using MATLAB R2020b.
Figure 8 shows the normalized image results, with white pixels the high SCR region and black pixels the low SCR region. As seen in Figure 8, the detail information within the SCR image is stronger than that of the original image. Although the transmission tower is hidden in a large amount of background clutter, it can be seen using Formula (1) that the proposed algorithm fully considers the relationship between transmission tower pixels and neighboring pixels, and has a stronger SCR value compared to other white background pixel clutter. Figure 9a–d show the histograms of the images corresponding to Figure 8a–d, respectively, and fitted Gaussian distribution curves (in red) to the histograms. According to Formula (3), the SCR thresholds can be calculated as 5.70, 4.63, 6.32 and 5.72 for the images shown in Figure 9a–d, respectively.
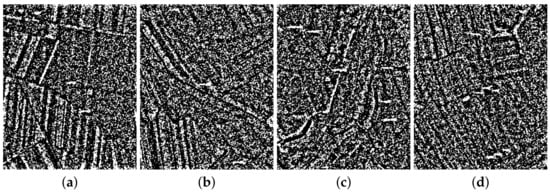
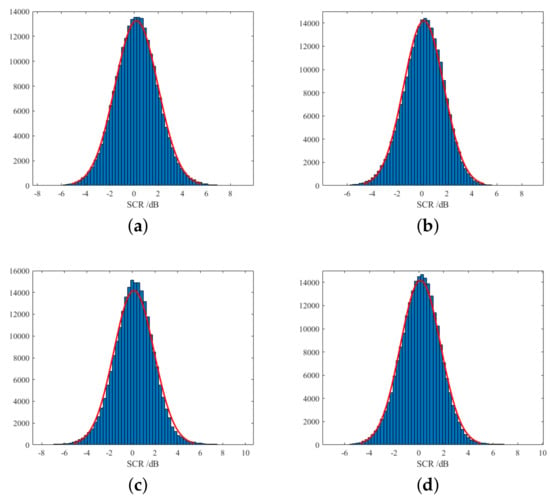
Figure 9.
images histograms fitting. (a–d) represent the histograms fitting results of images in Figure 8, respectively.
Figure 10a–d show the potential transmission tower pixels by thresholding the SCR images in Figure 8a–d, respectively. It can be seen from Figure 10a–d, for each transmission tower, there are always part of its pixels being detected, although there are still some false alarm pixels in the potential transmission tower pixels. Figure 11a–h show the results using gray threshold method with different threshold in Figure 7a–d, respectively. Comparing the detection results of the two methods, it is found that the detection using images is more advantageous compared to the original images. A large number of background interference pixels are removed while ensuring that transmission towers are not missed, and the geometry of transmission tower pixels is preserved. Taking the transmission tower in Figure 10a as an example, a red box is used to mark the corresponding location of the transmission tower and it is zoomed in to show that the pixel distribution and geometry of the transmission tower can be clearly observed without losing important component pixels. However, when the threshold is increased, most of the transmission tower pixels are filtered out, leaving only a few main pixels, as shown in Figure 11e–h. Among them, by observing Figure 11f, it can be found that the geometry of the transmission tower cannot be identified, and a transmission tower is missed in Figure 11h. Therefore, a comparison with Figure 11 indicates that the proposed algorithm is not simply and irregularly filtered by the amplitude values.
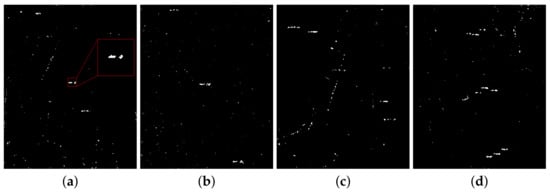
Figure 10.
Results of SCR threshold. (a–d) represent the results of SCR threshold based on Figure 8, respectively. The red box is used to zoom in the details of the transmission tower.
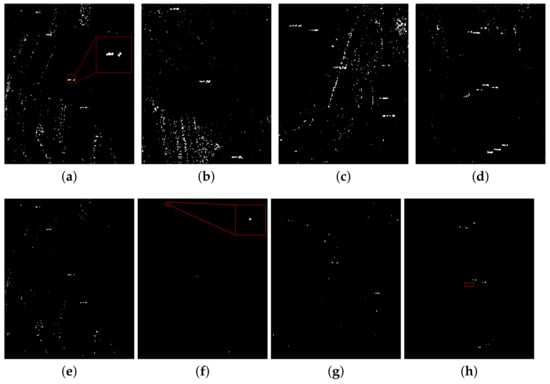
Figure 11.
Results of the gray threshold method. (a–d) show the results with the threshold set to 150. (e–h) show the results with the threshold set to 180. The red box is used to zoom in the details of the transmission tower.
By calculating the spatial densities of potential transmission tower pixels, candidate transmission tower pixels can be obtained by thresholding the densities. Observing the detection results in Figure 10, the transmission tower pixels have obvious spatial aggregation. According to Formula (5), the density threshold ranges of Figure 10a–d are set to 18–66. Therefore, Figure 12a–d show the candidate transmission tower pixels by thresholding the densities of potential transmission tower pixels in Figure 10a–d, respectively. Observing Figure 12, it can be noticed that most of the false alarm pixels have been filtered out and only a few pixels are detected as candidates for the number of transmission tower pixels. Additionally, all the transmission tower main pixels within the four images have also been retained, which verifies the effectiveness of the density thresholding algorithm.
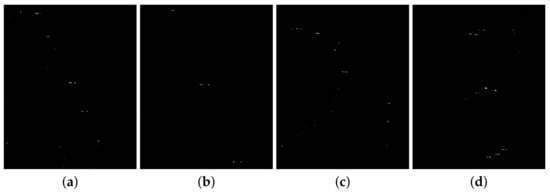
Figure 12.
Detection results of spatial density threshold. (a–d) show the results of spatial density threshold based on Figure 10, respectively.
The results of grouping the candidate transmission tower pixels by the nearest neighbor scheme are shown in Figure 13a–d. By calculating the distance between pixel pairs, several sets of pixels are determined and each set of pixels is considered as a quasi-transmission tower. Figure 13a–d contain 7, 3, 6 and 11 quasi-transmission towers, respectively. Figure 14a–d show the results of MBRs extraction for each quasi-transmission tower. The details of each transmission tower from Figure 14a–d are shown by zooming in, which can qualitatively verify that proposed algorithm can detect the transmission towers relatively effectively and preserve their geometric features.
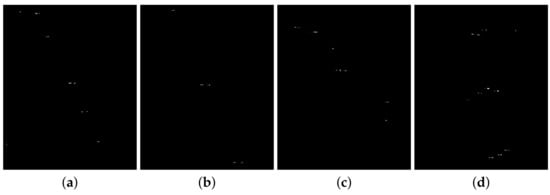
Figure 13.
Results of the nearest neighbor scheme for candidate transmission tower. (a–d) represent the candidate transmission tower results from Figure 12.
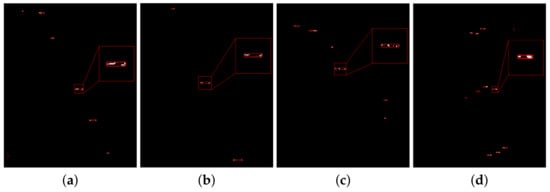
Figure 14.
Results of the construction of MBRs. (a–d) show the MBRs of each transmission tower in red and show the details of the MBRs of the transmission tower in red boxes.
The aspect ratio of each quasi-transmission tower is obtained by extracting the MBR of the quasi-transmission tower, and the results are shown in Figure 14a,c as examples and are listed in Table 1. (It is worth noting that in this paper, based on the imaging characteristics of transmission towers, the default horizontal axis is the length and the vertical axis is the width.) Among them, the aspect ratio thresholds of Figure 14a–d are set to 1.0, 3.5, 1.2, 3.5, respectively. Therefore, the non-transmission towers are further filtered to obtain the real transmission tower detection results, as shown in Figure 15a–d, and the real and the false alarm transmission towers are marked with red rectangles and yellow triangles, respectively. Observing Figure 15a–d, most of the false alarm targets are eliminated, and it can be seen that the detection results do not show any missed detection, only Figure 15c shows one false alarm. Overall, as expected, the proposed algorithm can detect the transmission towers well, so as to better improve the detection rates. Figure 16 shows the effect of superimposing the final transmission tower detection results onto the original image, which can better show the detection effect of the proposed algorithm.

Table 1.
Figure 14a,c for each quasi-transmission tower aspect ratio.
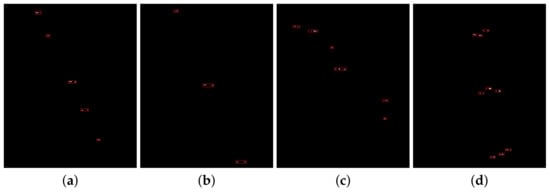
Figure 15.
Transmission tower detection results. (a–d) represent the transmission tower detection results in red from Figure 14, respectively.
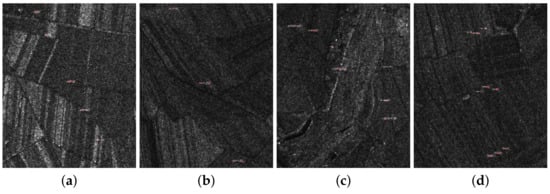
Figure 16.
Detection results and the original image superposition results. (a–d) show the results of the detection results superimposed with Figure 7, respectively.
4. Discussion
For comparison, some known and proven detection algorithm are utilized. In this paper, Log-normal distribution of CFAR detection algorithm, the combined CFAR and EF algorithm [28], the combined CFAR and Contrario algorithm [29] and deep learning method [35] are used as comparison algorithms to confirm the detection performance of the proposed algorithm.
Figure 17 shows results from the comparison algorithms for transmission towers detection in Figure 7a–d. Among them, Figure 17(a1)–(d1) show the results of Log-normal distribution of CFAR detection algorithm. Figure 17(a2)–(d2) show the results of the combined CFAR and EF algorithm. Figure 17(a3)–(d3) show the results of and the combined CFAR and Contrario algorithm. Additionally, Figure 17(a4)–(d4) show the results of the proposed algorithm. In Figure 17, the red and yellow rectangle marks the real and false alarm transmission towers, respectively, and the green oval marks the missed detection transmission towers.
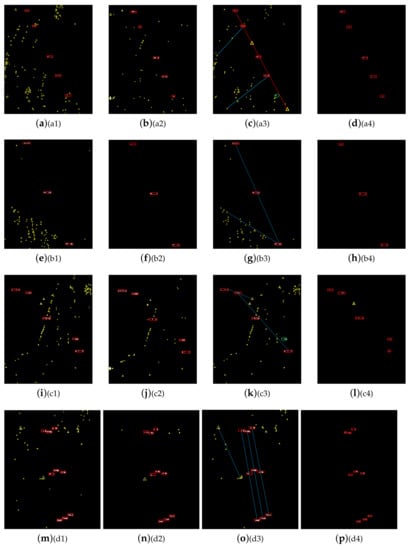
Figure 17.
Detection results of four images by comparison algorithms. (a1–d1) Log-normal distribution of CFAR algorithm. (a2–d2) CFAR+EF algorithm [28]. (a3–d3) CFAR + Contrario algorithm [29]. (a4–d4) Proposed algorithm.
As seen from the first row of Figure 17, the log-normal distribution of CFAR detection algorithm is simple and can describe the asymmetrical distribution of tailing phenomenon, it is not suitable for the identification of small targets under complex scenes. For example, in experimental images shown in Figure 7a,c with relatively complex background, there are a large number of false alarm transmission towers in the detection results, resulting in wrong detection. Compared with the log-normal distribution of CFAR detection algorithm, the false alarm transmission towers detected by the combined CFAR and EF algorithm are significantly reduced, but the EF feature has a weak ability to describe the geometric features of targets. As a result, the detection results cannot effectively distinguish transmission towers from non-transmission towers. The combined CFAR and Contrario algorithm is based on the characteristic of being linearly aligned to detect transmission towers, and it can be seen from Figure 17(a3)–(d3) that the detection results have a large number of false alarm targets, and even the alignments of false alarm targets. Obviously, the algorithm first filters out some candidate points and then detects the transmission towers by using the feature that they present a linear arrangement. However, many false alarm targets can easily be detected by the linear arrangement, and the arrangement of real transmission towers is very demanding, for example, they must be equally spaced and arranged in a straight line, and will be missed if they are turned around.
The proposed algorithm not only accurately identifies the transmission towers, but also preserves the geometric characteristics of the transmission towers. Among them, only one false alarm transmission tower appears in Figure 17(c4). Moreover, it can be observed that the size and geometry of the false alarm target is similar to that of the transmission tower, which is the reason why the false alarm target is mistakenly detected as a transmission tower.
In addition, in order to verify the superiority of the proposed algorithm, the currently popular deep learning method is used for experimental comparison. As shown in Figure 18a–d, are the detection results of YOLO v5, and Figure 18e–h show the results of the proposed algorithm superimposed on the original images, so as to show the comparison of the results of the two algorithms more intuitively. Observing Figure 18a–d, it can be clearly found that the detection results of the deep learning method are poor, and there are a large number of missed detections and false detections in the four images. The reason is that the detection results are not ideal due to the lack of enough transmission tower training samples and public data sets. Moreover, the small size of the transmission tower makes it difficult to judge its accurate geometry in SAR images with large speckle noise, which is also the reason for the poor results of deep learning methods.
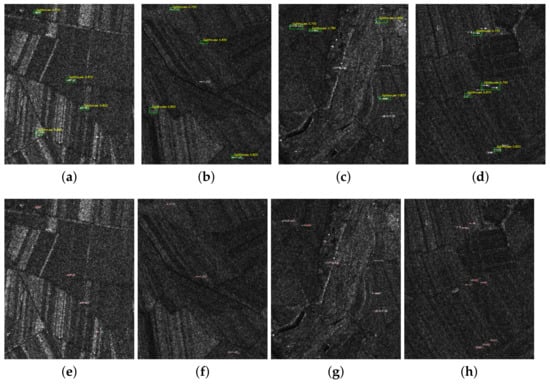
Figure 18.
Detection results. (a–d) YOLO v5 results. (e–h) Proposed algorithm results.
To quantitatively evaluate the detection performance of the five algorithms, this paper uses the detection rate , quality factor and the number of false detections to evaluate them,
where is the correct number of detections, is the real number of transmission towers, is the number of missed detections, and is the false alarm target. The higher the detection rate, the better the ability to detect really transmission towers, and the higher the quality factor, the more sensitive the detection algorithm is in discriminating between transmission towers and non-transmission towers.
Table 2 presents the detection results of the five algorithms. Comparing the indicators in Table 2, the following conclusions can be drawn: (1) The other three algorithms have high detection rates, except for the combined CFAR and Contrario algorithm and YOLO v5 method. In the experiment, it is found that the combined CFAR and Contrario algorithm is more suitable for detection when the background is simple and the number of transmission towers is large. If the number of transmission towers is small, it is easy to cause other false alarm targets that are linearly arranged to be misdetected. In addition, transmission towers are usually erected based on the local geological and environmental conditions, so it is not guaranteed that all transmission towers are kept evenly distributed and equally spaced. This case leads to the low detection rate of the combined CFAR and Contrario algorithm. Furthermore, the deep learning method needs to train a large number of samples, which is time-consuming and labor-intensive. In the case of lack of sufficient samples and few targets in the image, it is easy to lead to low detection accuracy. Moreover, the small size of the transmission tower brings great difficulties to the training results. (2) Among the five algorithms, only the proposed algorithm has a higher accuracy of quality factor. Due to the existence of a large number of false alarm targets, the complexity of the scene increases, such as Figure 7a,c, especially the log-normal distribution of CFAR detection algorithm and the combined CFAR and Contrario algorithm, so the number of false detections increases and subsequently the quality factor decreases to an unsatisfiable accuracy range. In contrast, the proposed algorithm has a small number of false detections, so the quality factor accuracy remains high in all four experimental images. This is not the case for one false alarm in Figure 17(c4), which causes the quality factor to drop to . After comparison, it is found that proposed algorithm has the strongest detection ability compared with the other four algorithms, and the identification results for transmission and non-transmission towers are more accurate.

Table 2.
Comparison of the detection results of the four algorithms.
Computational complexities are measured by the algorithms’ CPU time. Table 3 presents the running time of different algorithms, as shown in Figure 7a. For the comparison algorithms, the Log-normal distribution of CFAR detection algorithm has the shortest running time for the same image size, followed by the proposed algorithm and deep learning method, while the combined CFAR and EF algorithm and the combined CFAR and Contrario algorithm have a relatively longer running time. As the EF algorithm needs to consider both the intensity and geometric features of the target, it takes a longer time to run. Moreover, the Contrario algorithm needs to filter all point targets detected by CFAR detection algorithm, which takes more time. In addition, the combined CFAR and Contrario algorithm has a much greater computational complexity than other algorithms. On the other hand, the hierarchical detection process leads to a longer time for the proposed algorithm to perform the stepped thresholding. However, the computational complexity is much lower than the other four algorithms, and does not need to train a large number of samples.

Table 3.
Running time.
5. Conclusions
The main contribution of this paper is to provide a new method for hierarchical detection of transmission towers based on SAR images.
The method is simple, fast, it has high precision, and fully combines various characteristics of the transmission tower to achieve high-precision detection results. Compared with the other known and proven techniques, the proposed algorithm has the following advantages. (1) The idea of combining high SCR with geometric features is fully utilized to hierarchical detection, without relying too much on any one step. (2) There is no need to do much preprocessing work and to consider a priori knowledge. (3) The proposed algorithm can better demonstrate the imaging morphology of transmission towers within SAR images. In addition, comparative experiments are conducted to verify the superiority of the proposed algorithm. Although the proposed algorithm is effective in distinguishing transmission and non-transmission towers, it has some shortcomings. For example, a large number of small targets with similar geometric and scattering characteristics to transmission towers within the image are not accurately detected and classified. In future work, the study will focus on detecting targets with characteristics similar to transmission towers and perform more accurate analysis.
Author Contributions
Conceptualization, J.L. and Y.L.; methodology, J.L.; validation, J.L.; writing—original draft preparation, J.L.; writing—review and editing, Y.L., H.J. and Q.Z.; visualization, J.L. and H.J. All authors have read and agreed to the published version of the manuscript.
Funding
This research was funded by the Project for Key Scientific Issues from Education Department of Liaoning (LJ2020ZD003) and the Youth Foundation of National Natural Science Foundation of China (42001286).
Institutional Review Board Statement
Not applicable.
Informed Consent Statement
Not applicable.
Data Availability Statement
Not applicable.
Acknowledgments
We gratefully thank the anonymous reviewers for their critical comments and constructive suggestions on the manuscript.
Conflicts of Interest
The authors declare no conflict of interest.
References
- Roy, S.; Kundu, C.K. State of the art review of wind induced vibration and its control on transmission towers. Structures 2021, 29, 254–264. [Google Scholar] [CrossRef]
- Yingbo, Z.; Hang, C.; Qiupeng, Z.; Zhiqiang, D.; Xiaojing, G. Influence of transmission tower load under extreme conditions during operation period on the stability of landslide and tower foundation. J. Phys. Conf. Ser. 2020, 1654, 012123. [Google Scholar] [CrossRef]
- Matikainen, L.; Lehtomäki, M.; Ahokas, E.; Hyyppä, J.; Karjalainen, M.; Jaakkola, A.; Kukko, A.; Heinonen, T. Remote sensing methods for power line corridor surveys. ISPRS J. Photogramm. Remote Sens. 2016, 119, 10–31. [Google Scholar] [CrossRef] [Green Version]
- Gao, Y.; Yang, W.; Li, C.; Zou, F. Improved SSD-based transmission tower detection in SAR images. J. Eng. 2019, 2019, 7161–7164. [Google Scholar] [CrossRef]
- Xing, M.; Jiang, X.; Wu, R.; Zhou, F.; Bao, Z. Motion compensation for UAV SAR based on raw radar data. IEEE Trans. Geosci. Remote Sens. 2009, 47, 2870–2883. [Google Scholar] [CrossRef]
- Everaerts, J. The use of unmanned aerial vehicles (UAVs) for remote sensing and mapping. Int. Arch. Photogramm. Remote Sens. Spat. Inf. Sci. 2008, 37, 1187–1192. [Google Scholar]
- Wahl, D.E.; Eichel, P.H.; Ghiglia, D.C.; Jakowatz, C.V. Phase Gradient Autofocus—A Robust Tool for High Resolution SAR Phase Correction. IEEE Trans. Aerosp. Electron. Syst. 1994, 30, 827–835. [Google Scholar] [CrossRef] [Green Version]
- Ferretti, A.; Prati, C.; Rocca, F. Nonlinear subsidence rate estimation using permanent scatterers in differential SAR interferometry. IEEE Trans. Geosci. Remote Sens. 2000, 38, 2202–2212. [Google Scholar] [CrossRef] [Green Version]
- Li, Y.; Wang, S.; Zhao, Q.; Wang, G. A new SAR image filter for preserving speckle statistical distribution. Signal Process. 2020, 176. [Google Scholar] [CrossRef]
- Freeman, A. Sar Calibration: An Overview. IEEE Trans. Geosci. Remote Sens. 1992, 30, 1107–1121. [Google Scholar] [CrossRef]
- Gao, G.; Kuang, G.; Zhang, Q.; Li, D. Fast detecting and locating groups of targets in high-resolution SAR images. Pattern Recognit. 2007, 40, 1378–1384. [Google Scholar] [CrossRef]
- He, C.; Tu, M.; Liu, X.; Xiong, D.; Liao, M. Mixture statistical distribution based multiple component model for target detection in high resolution SAR imagery. ISPRS Int. J.-Geo-Inf. 2017, 6, 336. [Google Scholar] [CrossRef] [Green Version]
- Kitajima, N.; Seto, R.; Yamazaki, D.; Zhou, X.; Ma, W.; Kanae, S. Potential of a sar small-satellite constellation for rapid monitoring of flood extent. Remote Sens. 2021, 13, 1959. [Google Scholar] [CrossRef]
- Metternicht, G.; Hurni, L.; Gogu, R. Remote sensing of landslides: An analysis of the potential contribution to geo-spatial systems for hazard assessment in mountainous environments. Remote Sens. Environ. 2005, 98, 284–303. [Google Scholar] [CrossRef]
- Torres, L.; Sant’Anna, S.J.; Da Costa Freitas, C.; Frery, A.C. Speckle reduction in polarimetric SAR imagery with stochastic distances and nonlocal means. Pattern Recognit. 2014, 47, 141–157. [Google Scholar] [CrossRef] [Green Version]
- Wu, J.; Ma, M.; Liu, M. An adaptive region-based method for speckle reduction in SAR images with local geometric correlation. In Proceedings of the IGARSS 2018—2018 IEEE International Geoscience and Remote Sensing Symposium, Valencia, Spain, 22–27 July 2018; pp. 2793–2796. [Google Scholar] [CrossRef]
- Qi Huang, S.; zhi Liu, D.; qing Gao, G.; jian Guo, X. A novel method for speckle noise reduction and ship target detection in SAR images. Pattern Recognit. 2009, 42, 1533–1542. [Google Scholar] [CrossRef]
- Ding, B.; Wen, G.; Ma, C.; Yang, X. An Efficient and Robust Framework for SAR Target Recognition by Hierarchically Fusing Global and Local Features. IEEE Trans. Image Process. 2018, 27, 5983–5995. [Google Scholar] [CrossRef]
- Woods, D.; Folley, C.; Kwan, Y.T.; Houshmand, B. Automatic extraction of vertical obstruction information from interferometric SAR elevation data. In Proceedings of the IGARSS 2004. 2004 IEEE International Geoscience and Remote Sensing Symposium, Anchorage, AK, USA, 20–24 September 2004; Volume 6, pp. 3938–3941. [Google Scholar] [CrossRef]
- Ferretti, A.; Prati, C.; Rocca, F. Permanent scatterers in SAR interferometry. IEEE Trans. Geosci. Remote Sens. 2001, 39, 8–20. [Google Scholar] [CrossRef]
- Wen, Y.; Haijian, Z.; Jiayu, C.; Hong, S. Automatic detection of power transmission series in full polarimetric SAR imagery. In Proceedings of the 2007 IEEE Radar Conference, Waltham, MA, USA, 17–20 April 2007; pp. 789–793. [Google Scholar] [CrossRef]
- Yamaguchi, Y.; Moriyama, T.; Ishido, M.; Yamada, H. Four-component scattering model for polarimetric SAR image decomposition. IEEE Trans. Geosci. Remote Sens. 2005, 43, 1699–1706. [Google Scholar] [CrossRef]
- Yan, L.; Wu, W.; Li, T. Power transmission tower monitoring technology based on TerraSAR-X products. In International Symposium on Lidar and Radar Mapping 2011: Technologies and Applications; 2011; Volume 8286, p. 82861E. [Google Scholar] [CrossRef]
- Touzi, R.; Lopes, A.; Bousquet, P. A Statistical and Geometrical Edge Detector for SAR Images. IEEE Trans. Geosci. Remote Sens. 1988, 26, 764–773. [Google Scholar] [CrossRef]
- Kaplan, L.M. Improved SAR target detection via extended fractal features. IEEE Trans. Aerosp. Electron. Syst. 2001, 37, 436–451. [Google Scholar] [CrossRef]
- Alganci, U.; Soydas, M.; Sertel, E. Comparative research on deep learning approaches for airplane detection from very high-resolution satellite images. Remote Sens. 2020, 12, 458. [Google Scholar] [CrossRef] [Green Version]
- He, C.; Zhang, Y.; Su, X.; Xu, X.; Liao, M.S. Target detection on high-resolution SAR image using Part-based CFAR Model. In Proceedings of the 2013 IEEE International Geoscience and Remote Sensing Symposium—IGARSS, Melbourne, VIC, Australia, 21–26 July 2013; pp. 3570–3573. [Google Scholar] [CrossRef]
- Zhang, P.; Li, Z.; Chen, Q. Detection of power transmission tower from SAR image based on the fusion method of CFAR and EF feature. In Proceedings of the 2013 IEEE International Geoscience and Remote Sensing Symposium—IGARSS, Melbourne, VIC, Australia, 21–26 July 2013; pp. 4018–4021. [Google Scholar] [CrossRef]
- Guo, W.; Fu, K.; Huang, P.; Yang, W. Automatic Extraction of Linear Arranged Targets from Polarimetric SAR Imagery. In Proceedings of the 2016 IEEE International Geoscience and Remote Sensing Symposium (IGARSS), Beijing, China, 10–15 July 2016; pp. 6405–6408. [Google Scholar]
- Girshick, R.; Donahue, J.; Darrell, T.; Malik, J. Rich feature hierarchies for accurate object detection and semantic segmentation. In Proceedings of the IEEE Computer Society Conference on Computer Vision and Pattern Recognition, Columbus, OH, USA, 23–28 June 2014; pp. 580–587. [Google Scholar] [CrossRef] [Green Version]
- Ren, S.; He, K.; Girshick, R.; Sun, J. Faster R-CNN: Towards Real-Time Object Detection with Region Proposal Networks. IEEE Trans. Pattern Anal. Mach. Intell. 2017, 39, 1137–1149. [Google Scholar] [CrossRef] [Green Version]
- Redmon, J.; Divvala, S.; Girshick, R.; Farhadi, A. You only look once: Unified, real-time object detection. In Proceedings of the IEEE Computer Society Conference on Computer Vision and Pattern Recognition, Las Vegas, NV, USA, 27–30 June 2016; Volume 2016, pp. 779–788. [Google Scholar] [CrossRef] [Green Version]
- Liu, W.; Anguelov, D.; Erhan, D.; Szegedy, C.; Reed, S.; Fu, C.Y.; Berg, A.C. SSD: Single shot multibox detector. In Lecture Notes in Computer Science (Including Subseries Lecture Notes in Artificial Intelligence and Lecture Notes in Bioinformatics), Proceedings of the 14th European Conference, Amsterdam, The Netherlands, 11–14 October 2016; Springer: Cham, Switzerland, 2016; pp. 21–37. [Google Scholar] [CrossRef] [Green Version]
- Gao, Y.; Gao, F.; Dong, J.; Wang, S. Change Detection from Synthetic Aperture Radar Images Based on Channel Weighting-Based Deep Cascade Network. IEEE J. Sel. Top. Appl. Earth Obs. Remote Sens. 2019, 12, 4517–4529. [Google Scholar] [CrossRef]
- Zhang, X.; Liu, G.; Zhang, C.; Atkinson, P.M.; Tan, X.; Jian, X.; Zhou, X.; Li, Y. Two-phase object-based deep learning for multi-temporal SAR image change detection. Remote Sens. 2020, 12, 548. [Google Scholar] [CrossRef] [Green Version]
- Zeng, T.; Gao, Q.; Ding, Z.; Tian, W.; Yang, Y.; Zhang, Z. Power Transmission Tower Detection Based on Polar Coordinate Semivariogram in High-Resolution SAR Image. IEEE Geosci. Remote Sens. Lett. 2017, 14, 2200–2204. [Google Scholar] [CrossRef]
- Kang, M.; Baek, J. Sar image change detection via multiple-window processing with structural similarity. Sensors 2021, 21, 6645. [Google Scholar] [CrossRef]
- Namuduri, K.; Murenzi, R.; Asika, E.; Kaplan, L.M. Effect of signal-to-clutter ratio on template-based ATR. In Algorithms for Synthetic Aperture Radar Imagery V; International Society for Optics and Photonics; International Society for Optics and Photonics: Bellingham, WA, USA, 1998; Volume 3370, pp. 408–419. [Google Scholar]
- Yang, C.; Zhang, L.; Lu, H. Graph-Regularized Saliency Detection with Convex-Hull-Based Center Prior. IEEE Signal Process. Lett. 2013, 20, 637–640. [Google Scholar] [CrossRef]
- Rosin, P.L. Measuring rectangularity. Mach. Vis. Appl. 1998, 11, 191–196. [Google Scholar] [CrossRef]
Publisher’s Note: MDPI stays neutral with regard to jurisdictional claims in published maps and institutional affiliations. |
© 2022 by the authors. Licensee MDPI, Basel, Switzerland. This article is an open access article distributed under the terms and conditions of the Creative Commons Attribution (CC BY) license (https://creativecommons.org/licenses/by/4.0/).