Article

Quantifying the Intra-Habitat Variation of Seagrass Beds with Unoccupied Aerial Vehicles (UAVs)

1
Ocean and Earth Science, University of Southampton, European Way, Southampton SO14 3ZH, UK
2
Ocean Biogeosciences, National Oceanography Centre, European Way, Southampton SO14 3ZH, UK
3
Green Rebel Marine, Crosshaven Boatyard, Crosshaven, P43 EV21 Cork, Ireland
4
UK Centre for Ecology & Hydrology, Environment Centre Wales, Deiniol Road, Bangor LL57 2UW, UK
5
ICOS Ocean Thematic Centre, NORCE—Norwegian Research Centre, Bjerknes Centre for Climate Research, Jahnebakken 5, 5007 Bergen, Norway
6
Faculty of Science and Technology, University of Belize, Belmopan, Belize
7
Coastal Zone Management Authority and Institute, Princess Margaret Drive, Belize City, Belize
8
Turneffe Atoll Sustainability Association, 1216 Blue Marlin Blvd, Belize City, Belize
*
Author to whom correspondence should be addressed.
Remote Sens. 2022, 14(3), 480; https://doi.org/10.3390/rs14030480
Submission received: 29 November 2021 / Revised: 7 January 2022 / Accepted: 13 January 2022 / Published: 20 January 2022

Abstract

:
Accurate knowledge of the spatial extent of seagrass habitats is essential for monitoring and management purposes given their ecological and economic significance. Extent data are typically presented in binary (presence/absence) or arbitrary, semi-quantitative density bands derived from low-resolution satellite imagery, which cannot resolve fine-scale features and intra-habitat variability. Recent advances in consumer-grade unoccupied aerial vehicles (UAVs) have advanced our ability to survey large areas at higher resolution and at lower cost. This has improved the accessibility of mapping technologies to developing coastal nations, where a large proportion of the world’s seagrass habitats are found. Here, we present the application of UAV-gathered imagery to determine seagrass habitat extent and percent of canopy cover. Four contrasting sites were surveyed in the Turneffe Atoll Marine Reserve, Belize, and seagrass canopy cover was ground truthed from in situ quadrats. Orthomosaic images were created for each site from the UAV-gathered imagery. Three modelling techniques were tested to extrapolate the findings from quadrats to spatial information, producing binary (random forest) and canopy cover (random forest regression and beta regression) habitat maps. The most robust model (random forest regression) had an average absolute error of 6.8–11.9% (SE of 8.2–14), building upon previous attempts at mapping seagrass density from satellite imagery, which achieved errors between 15–20% approximately. The resulting maps exhibited great intra-habitat heterogeneity and different levels of patchiness, which were attributed to site energetics and, possibly, species composition. The extra information in the canopy cover maps provides greater detail and information for key management decisions and provides the basis for future spatial studies and monitoring programmes.

Graphical Abstract

1. Introduction

Obtaining high-resolution maps of seagrass beds is critical to improving our understanding of how spatial characteristics influence service provision and to quantifying seagrass change and loss over time. Seagrass beds can cover extensive areas of the shallow coastal zone and provide multiple services, including reef fish nursery grounds [1,2], shoreline stabilisation [3], storm surge protection [4], and increased biodiversity [5,6,7], amongst other ecosystem services [8]. They can also sequester and store organic carbon in globally significant quantities [9,10]. Mapping typically focusses on habitat extent, but the degree of service provision within a given seagrass meadow is determined not only by habitat extent, but by spatial characteristics. These include canopy complexity (shoot/leaf density, biomass, and leaf area), canopy cover, patchiness, and meadow edge proximity (e.g., for biodiversity [5,11,12], and carbon sequestration [13,14,15,16]). These relationships have been detected through single point (in time and space) sampling, but high-resolution maps for the spatial extrapolation of these data is lacking, constraining our ability to track and assess changes to these ecologically and economically valuable habitats that are vulnerable to loss and degradation at local, regional, and global scales [17,18].
Producing such seagrass habitat maps traditionally requires a trade-off between resolution, costs, and spatial coverage. Satellites are suitable for large-scale detection of seagrass extent (e.g., [19,20]), which can be inferred with relatively high certainty when ground truthing data are available [21], but freely available data provides only coarse resolution imagery of around 10–20 m per pixel and higher resolution data of around 1 m per pixel can be costly to obtain. Traditional surface vessel surveys using acoustic instruments (e.g., [22,23,24,25,26]), in situ photography [27,28], and extrapolating point measurements collected by SCUBA surveys [29], can produce high-resolution maps of seagrass presence and density. However, the close proximity of the optical or acoustic instrument to the shallow seafloor that seagrass inhabits restricts the swath footprint and field of view, making such methods time consuming, costly, and only suitable for small areas. To bridge the gap between limited extent, high-resolution in situ photographic surveys, and large extent, low-resolution satellite imagery, low altitude photography above the water provides a suitable compromise in image resolution and the spatial extent of survey coverage possible. While aerial photography from aircraft has been used to map seagrass beds and other shallow-water habitats [30,31,32], the associated costs are high and can exceed available resources. Although unoccupied aerial vehicles (UAVs), such as quadcopter drones, require favourable meteorological conditions [33], they present fewer logistical issues and permit a higher degree of user control at a lower cost. The recent development of accessible, high-quality consumer-grade (GBP 400–2000) UAVs has progressed shallow-water seagrass research [34]. UAVs have been used to map seagrass and proximal habitats using a variety of techniques underpinned by differing statistical methods. For example, Ventura et al., 2016 [35], and Chen and Sasaki, 2021 [36], used a pixel-based approach whereby each individual photographic pixel is assigned a value or classification representing a habitat type. Alternatively, Ventura et al., 2016 [35], Ventura et al., 2018 [37], Duffy et al., 2018 [33], Nahirnick et al., 2018 [38], Ellis et al., 2020 [39], and Papakonstantinou et al., 2020 [40], used an object-based image analysis (OBIA) approach in which pixels are spatially grouped together in segments based on the similarity of their properties and classified. These studies typically produce maps of seagrass presence/absence and/or semi-quantitative density, but have not achieved quantitative information on the density of the above-ground vegetation. Some studies have nonetheless developed models to detect percentage cover of seagrass in classes based on high-resolution satellite imagery [19,41], but few provide high accuracy levels of percentage cover [21].
In this study, we detail a reproducible approach using UAV-acquired imagery that achieves quantification of seagrass canopy cover as a percentage on a scale of centimetres, a prerequisite to gain an insight into local habitat spatial variability. Different models are tested to compare quantitative differences between mapping seagrass as a binary habitat (presence/absence) and as a gradated habitat (percentage canopy cover). We demonstrate this method in four contrasting seagrass meadows at Turneffe Atoll, a globally important biodiversity hotspot offshore of Belize, Central America.

2. Methods

2.1. Study Area

Turneffe Atoll is the fourth largest atoll in the world and the largest atoll in the Northern Hemisphere. Located in the Caribbean Sea, offshore Belize (Figure 1), the atoll is a designated Marine Protected Area (MPA) and contains 18.9% of the country’s seagrass beds covering 366 km2 [42], providing a valuable area for artisanal fishing, tourism, and marine wildlife. 78% and 21% of Belize’s seagrass habitat are considered to be at medium or high risk, respectively, from human activities [43]. Four sites with characteristics of different seagrass habitats were selected for study (Figure 1). Site A is a bay off Calabash Caye, located on the eastward (sea-facing) side of the atoll and is partly sheltered by a smaller landmass (Bikini island). Site B, located towards the northeast of the atoll, is also sheltered as it is angled inward of the atoll, away from the reef flat and waves. Site C is located across a channel from site B, is fringed by mangroves, and is more exposed than site B. Site D is located on the relatively sheltered west side of the atoll and is fringed by mangrove. The extent of the mapped sections of the sites is summarized in Table 1.

2.2. Survey Methodology

A Phantom 4 drone was flown in a boustrophedonic (lawn-mower) pattern with waypoints pre-programmed in Pix4D Capture (Pix4D), with the camera triggering automatically. The optical sensor is a 12.4 megapixel, 1/2.3” sensor camera attached to a 3-axis gimbal on the base of the drone. Flights were undertaken at 80 m and 100 m altitude in order to produce images of <5 cm per pixel over several hundred m2. All hardware calibration steps were undertaken on land before embarking to the survey site.
Surveys were undertaken late in the afternoon when the sun was lower on the horizon to reduce the influence of glare and glint on the images [44]. No ground control points (GCPs) were deployed due to the expanse of the area surveyed, time constraints, and difficulty of deploying in deeper parts of the survey sites. Instead, the UAV GPS was used to georeference the mosaic, in a method known as direct georeferencing [45,46]. Geographic data sets produced with direct referencing should be considered in context of the onboard GPS positioning accuracy [47], which for the DJI Phantom 4 is ± 1.5 m horizontally and ±0.5 vertically according to the technical specifications from DJI. However, Gauci et al., 2018 [48], found the average geographic accuracy of aerial imagery collected from a DJI Phantom 4 (flown at 75 m altitude) was approximately 1.2 m (horizontal) and of ~3 (vertical) on average with no GCPs. All images were taken with the camera facing down, to ensure camera position was associated with the centre of the image. Quadrats measuring 50 cm used to collect ground truth data (described below) provided an in situ scale reference to check the scale accuracy of the orthomosaics. This was calculated by measuring the size of each quadrat clearly observable in the orthomosaic (n = 35). The quadrats were not used in the processing steps as a true scale calibration due to their relatively small size, which surface ripples could visually distort, and due to their clustered distribution, which could introduce a bias to the scaling of the rest of the mosaic. A handheld GPS (Garmin) was used to locate the quadrats but was not used to georeference the photomosaics as the quadrats were clustered in accessible areas of the surveys, which can introduce biased and skewed vertical errors [49].
Agisoft Photoscan (Version 1.4.0; now Agisoft Metashape) was used to create a mosaic of the drone imagery, using a scale-invariant feature transformation algorithm to detect features for matching images. ‘Reference preselection’ was chosen to align photos, as geo-referencing data was incorporated within image metadata. ‘Reference preselection’ is a setting in Agisoft Photoscan which improves processing time by selecting images located geographically close to each other to select tie-points. A key point limit of 40,000 points and tie-point limit of 4000 per image was deemed suitable to align all datasets during preliminary tests. High quality alignment was chosen to utilise the full image resolution. Orthomosaics were generated and clipped to the areas with only seagrass beds and sand, based on the visual information derived from the orthomosaics. The orthomosaics were exported in GeoTIFF format at their highest resolution and at 50 cm per pixel resolution to match the ground truth quadrat size in the projection UTM 16N, Datum WGS84.

2.3. Ground Truth Data

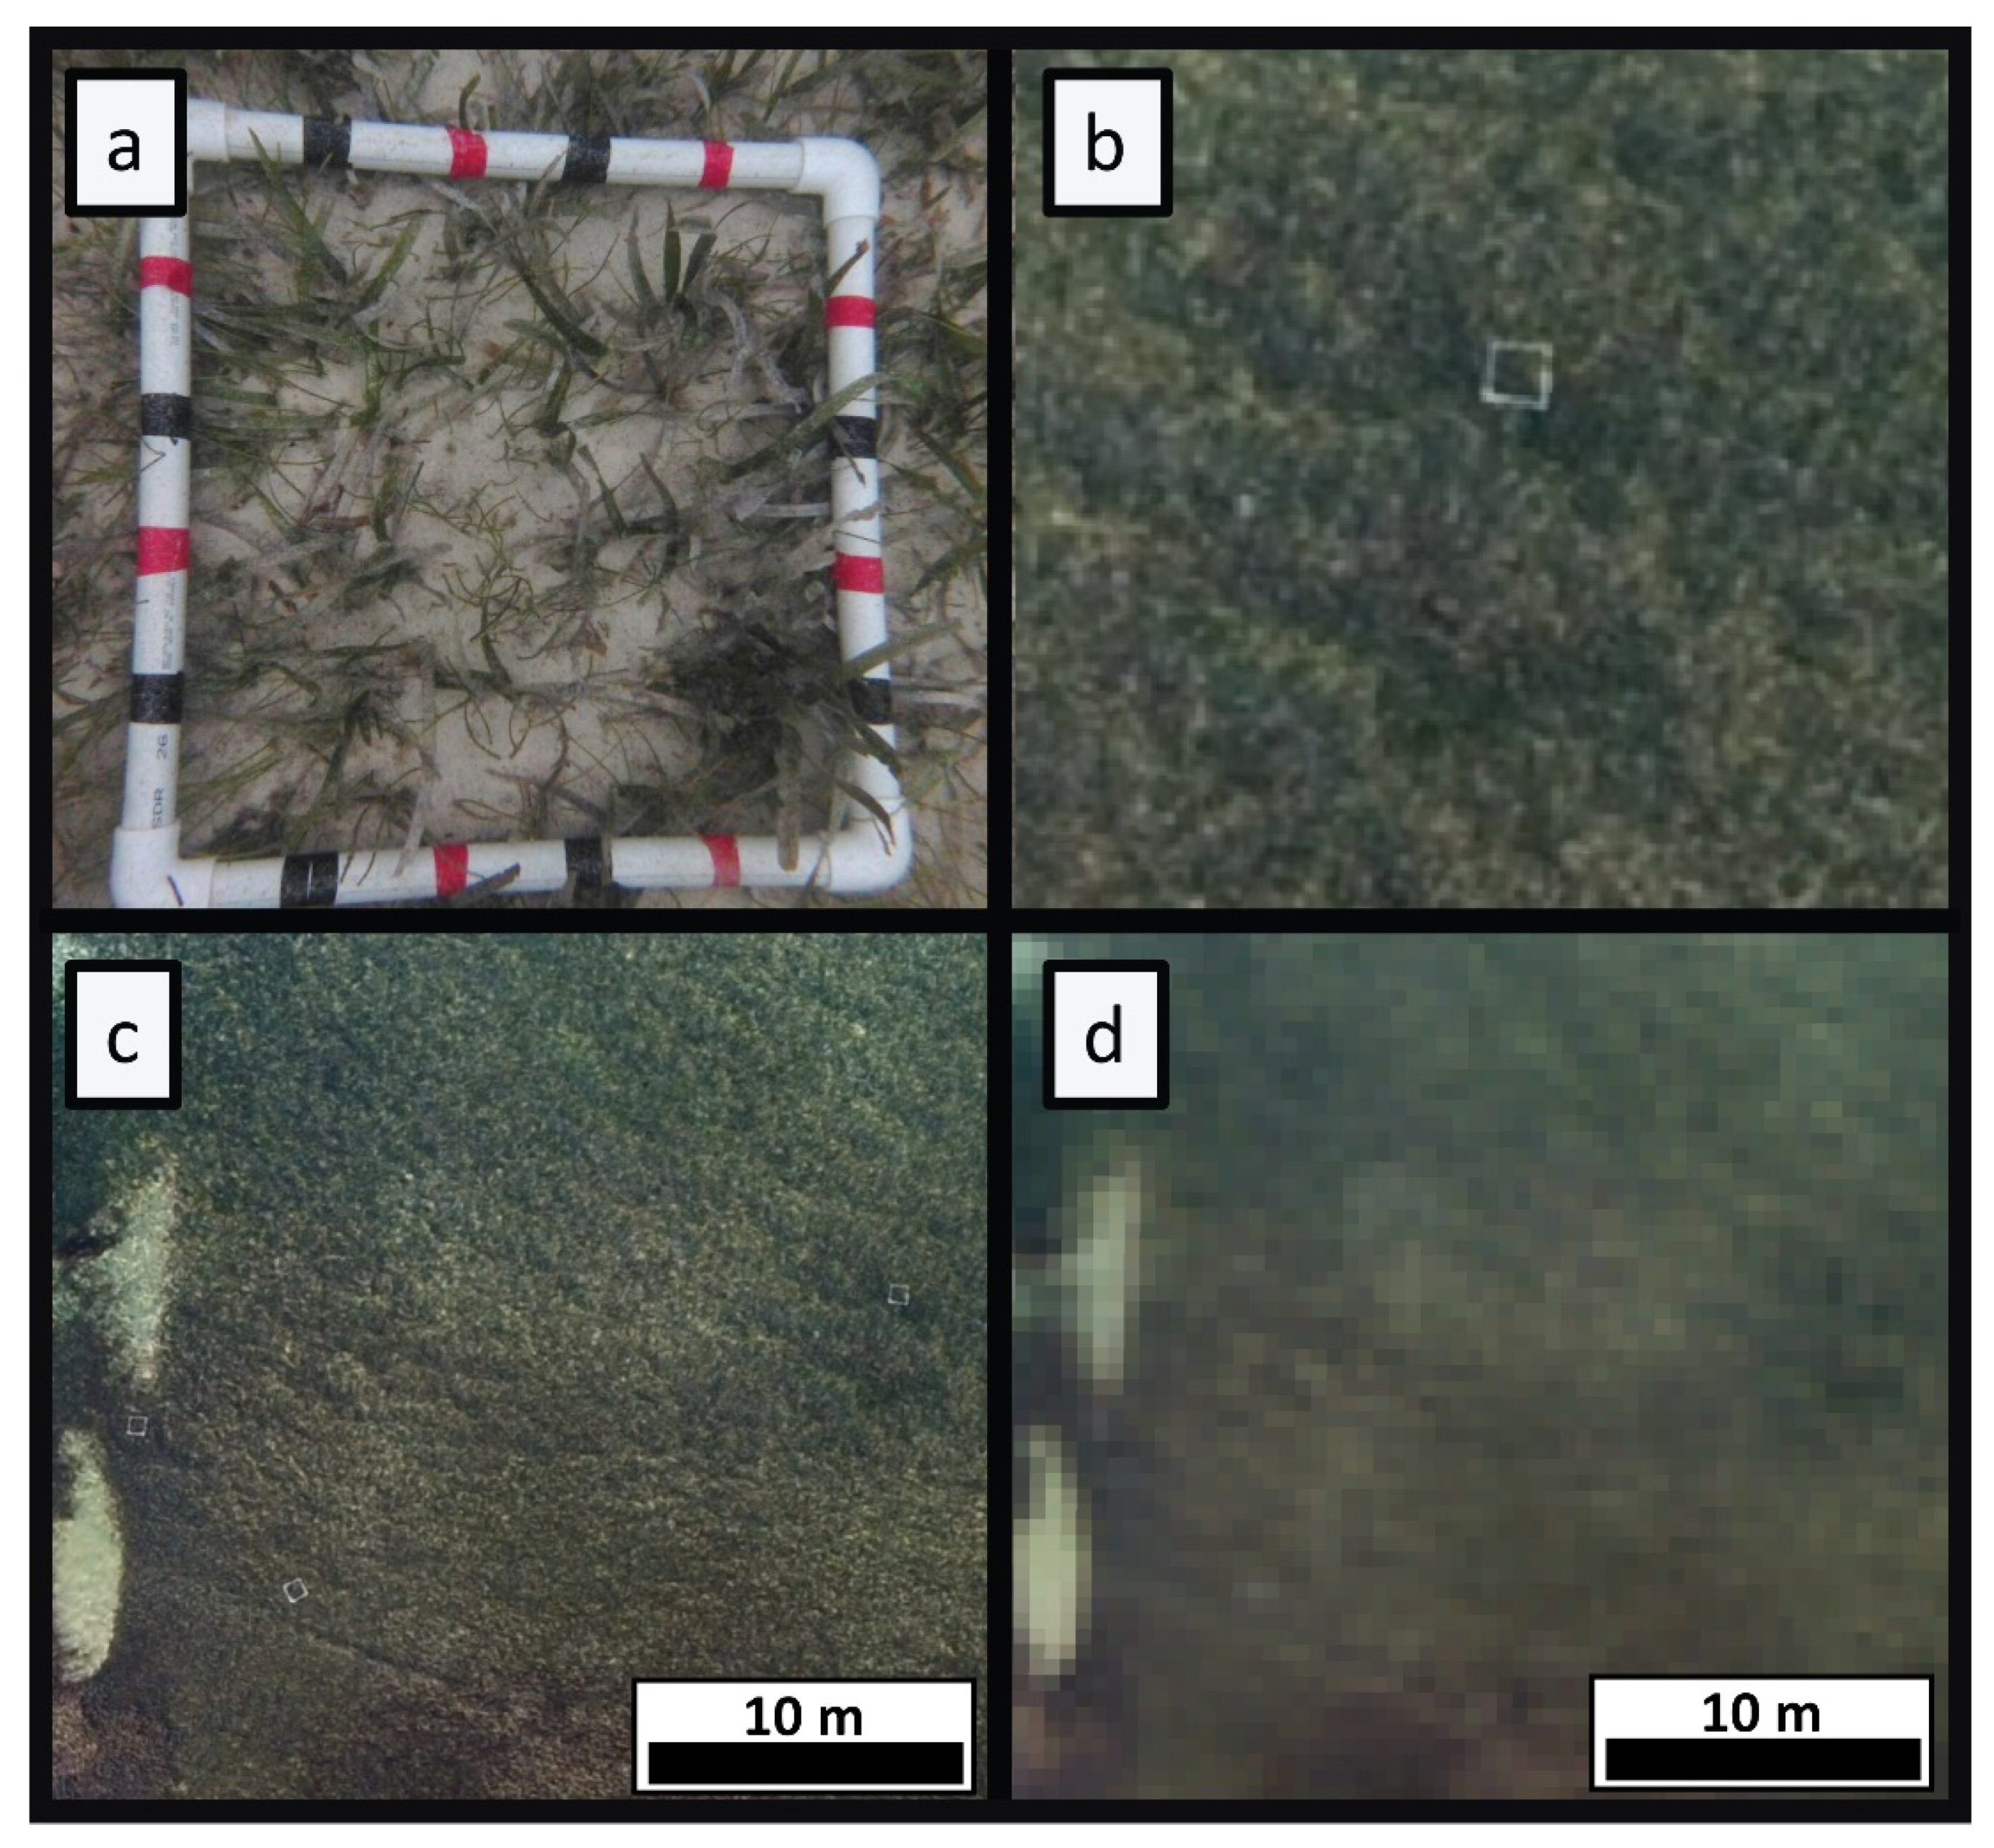
The 50 cm quadrats left in situ for the aerial surveys were used as ground truth datasets to estimate seagrass canopy cover (Figure 2). An underwater image of each quadrat was taken, and canopy cover of seagrass within each quadrat was estimated from that image by seven independent annotators, with the mean taken as the ground truth data. Each quadrat was located in the orthomosaic and a polygon was drawn within the quadrat to isolate the pixel values for modelling. The number of ground truth quadrats was 5–15 at each site because of time constraints and some unsafe areas for human-supported fieldwork (notably, the presence of American Crocodiles and stinging jellyfish). The average depth of the quadrats measured in situ was 0.96 m (range: 0.37–2.17 m). To attain at least 15 training samples at each site, additional post hoc ground truth data points were chosen from the orthomosaics at areas that could be visually identified as 100% sand or 100% seagrass with high confidence, which was possible due to the high-resolution optical data acquired. Similar use of digital quadrats has been successfully demonstrated to quantify percentage cover of marine photosynthetic organisms [50]. A total of 71 training samples were created (38 post hoc samples).

2.4. Modelling

Three different modelling approaches were undertaken to create two types of output maps: presence/absence and percentage cover. Presence/absence maps were based on random forest classification whilst percentage cover maps were modelled using two different approaches (beta regression and random forest regression).
Modelling exercises were undertaken using the green band of the orthomosaics and site location (A, B, C, or D) as independent variables. The sites were included as an independent variable due to the variability of lighting between days and locations. The red band was removed due to greater attenuation of light with increased depth in the water column when compared with the blue and green bands. As there was pronounced collinearity between the blue and green bands (Pearson correlation, r = 0.97), blue bands were also excluded.
A random forest classification approach was undertaken using binary presence (>10% seagrass cover) and absence (<10%) to create a simpler presence–absence map. A total of 500 trees and 3 random variables in each tree were used.
The second modelling technique used was a beta regression [51]; an extension of generalised linear models that can deal with continuous proportions that has been used in terrestrial remote sensing to predict canopy percentage cover [52,53]. The beta regression structure cannot utilise 0s and 1s, and thus 0% and 100% training samples were converted to 0.000001 and 0.99999, respectively. R package “betareg” was used to create beta regression models.
The third modelling technique was a random forest regression. Random forest, a machine learning technique, creates decision trees based upon random subsamples of the dataset. Multiple decision trees (which form the forest) are used from different sub-samples to create a range of predictions which are averaged to provide the predicted value. A total of 500 trees and 3 random variables in each tree were used. Random forest was chosen because the numerical prediction range is constrained by the input values and therefore will not predict beyond 100% and below 0%. The inclusion of the location categorical values (sites A, B, C, and D) was implemented by one-hot encoding which resulted in 4 dummy binary values to represent each site. R package “randomForest” was used to create both the binary and regression random forest models [54].
The data were randomly split to 80% (n = 57) for training data, and 20% (n = 14) for validation data. The models were developed from the same training dataset, based on the mean green band pixel value within the quadrats in the orthomosaics taken at their highest resolution (Figure 2b,c). Performance was assessed with correlation coefficients of the actual and estimated values as a linear model of the training and test datasets for the continuous datasets. However, generating a goodness of fit, R2 value from data inflated with 0 s and 100 s is likely to lead to an overestimation of R2. Therefore, we additionally generated 10 random data splits and ran 10 models (for both the beta regression and the random forest regression). From each of the test datasets (n = 14), the post hoc data was removed from the test data, leaving only data points collected in situ. This resulted in 53 independent testing data points not included in models to test the predicted values against. We additionally calculated the difference between the predicted and actual data (both training and testing) to get a percentage error estimate and percentage bias to observe if the models over- or under-predicted seagrass percentage cover. Standard error of estimate (SE) was also calculated. Out of bag error (OOB) was used to assess the binary random forest model. The models were run on and exported at 50 cm per pixel resolution orthomosaics to match the quadrat size and for true representation as a percentage metric (Figure 2). The modelled output on the full resolution orthomosaics would have not been representative of a percentage coverage as each pixel (approximately 5 cm) would have been too small to register an accurate percentage cover.

3. Results

3.1. Flights and Mosaics

Six flights were completed across five days (Table 1). All flights were undertaken at 80 m altitude except for site A, which was undertaken at 100 m. This was due to high glare from the water surface on the day of the 80 m flight; thus, instead a test flight undertaken at 100 m which yielded superior data was used in the analysis. Typically, flights were undertaken later in the afternoon when the sun was low in the sky to reduce glare, approximately 1:30 h before sunset (Table 1). Thirty-five quadrats (50 cm) were measured in the orthomosaics. The mean measurement was 50.1 cm with a mean difference between the actual and measured distance of 1.2 cm.

3.1.1. Site A

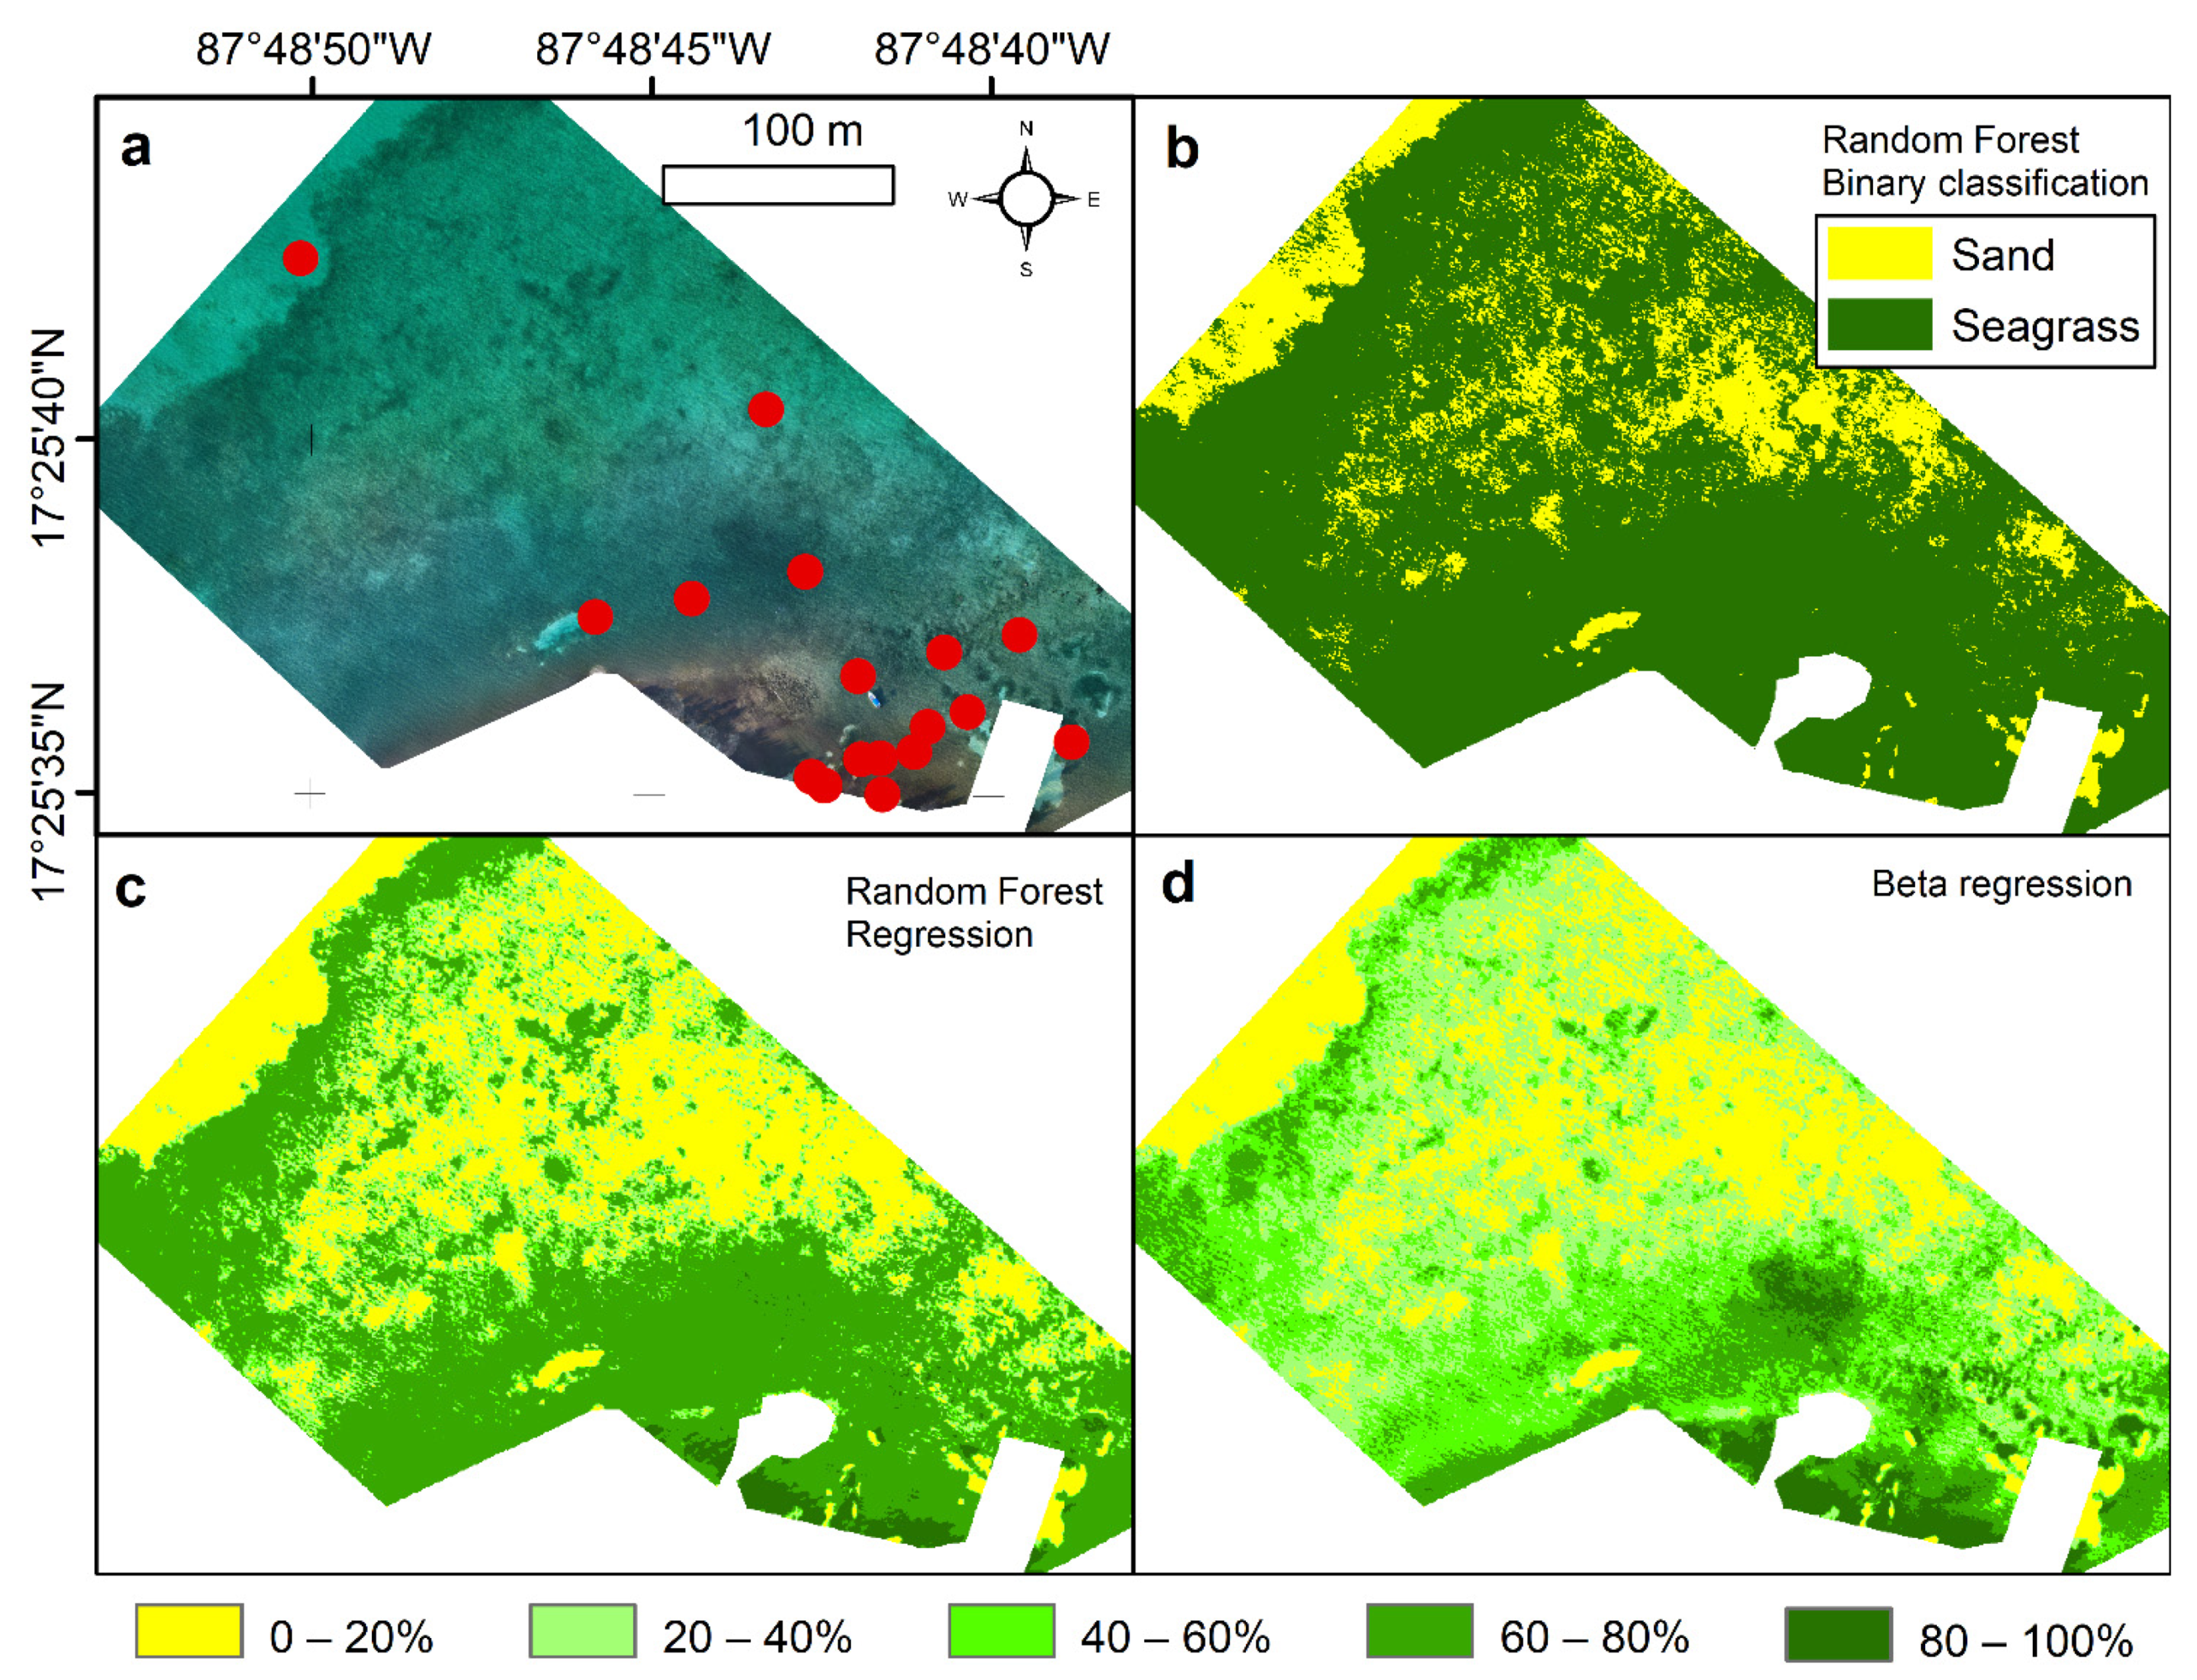
Site A was characterised by dense seagrass beds, fringing 15–20 m offshore, with interspersed dense patches nearer the shoreline (Figure 3). Sparser patches were observed in the centre and northeast of the survey. In small areas along the sandy patch closest to the shore in the north, there was evidence of a false positive whereby a veneer of dark detritus appears to have been classified as seagrass. All three modelling approaches were in general agreement with each other, although the random forest regression output was more sensitive to sparser patches, predicting lower percent agevalues than that assigned by the beta regression. The continuous predictions (0–100%) were represented as 20% percentiles in the figures to aid visual ques and distinction between models. This is consistent here on.

3.1.2. Site B

Seagrass cover at site B was patchy, with few dense patches of seagrass. Only very near the shoreline were dense patches found (Figure 4). The random forest (regression) predicted a greater spatial extent of higher percentage cover (shown by the 60–80% and 80–100% percentiles in Figure 4c,d) than the beta regression spatial prediction.

3.1.3. Site C

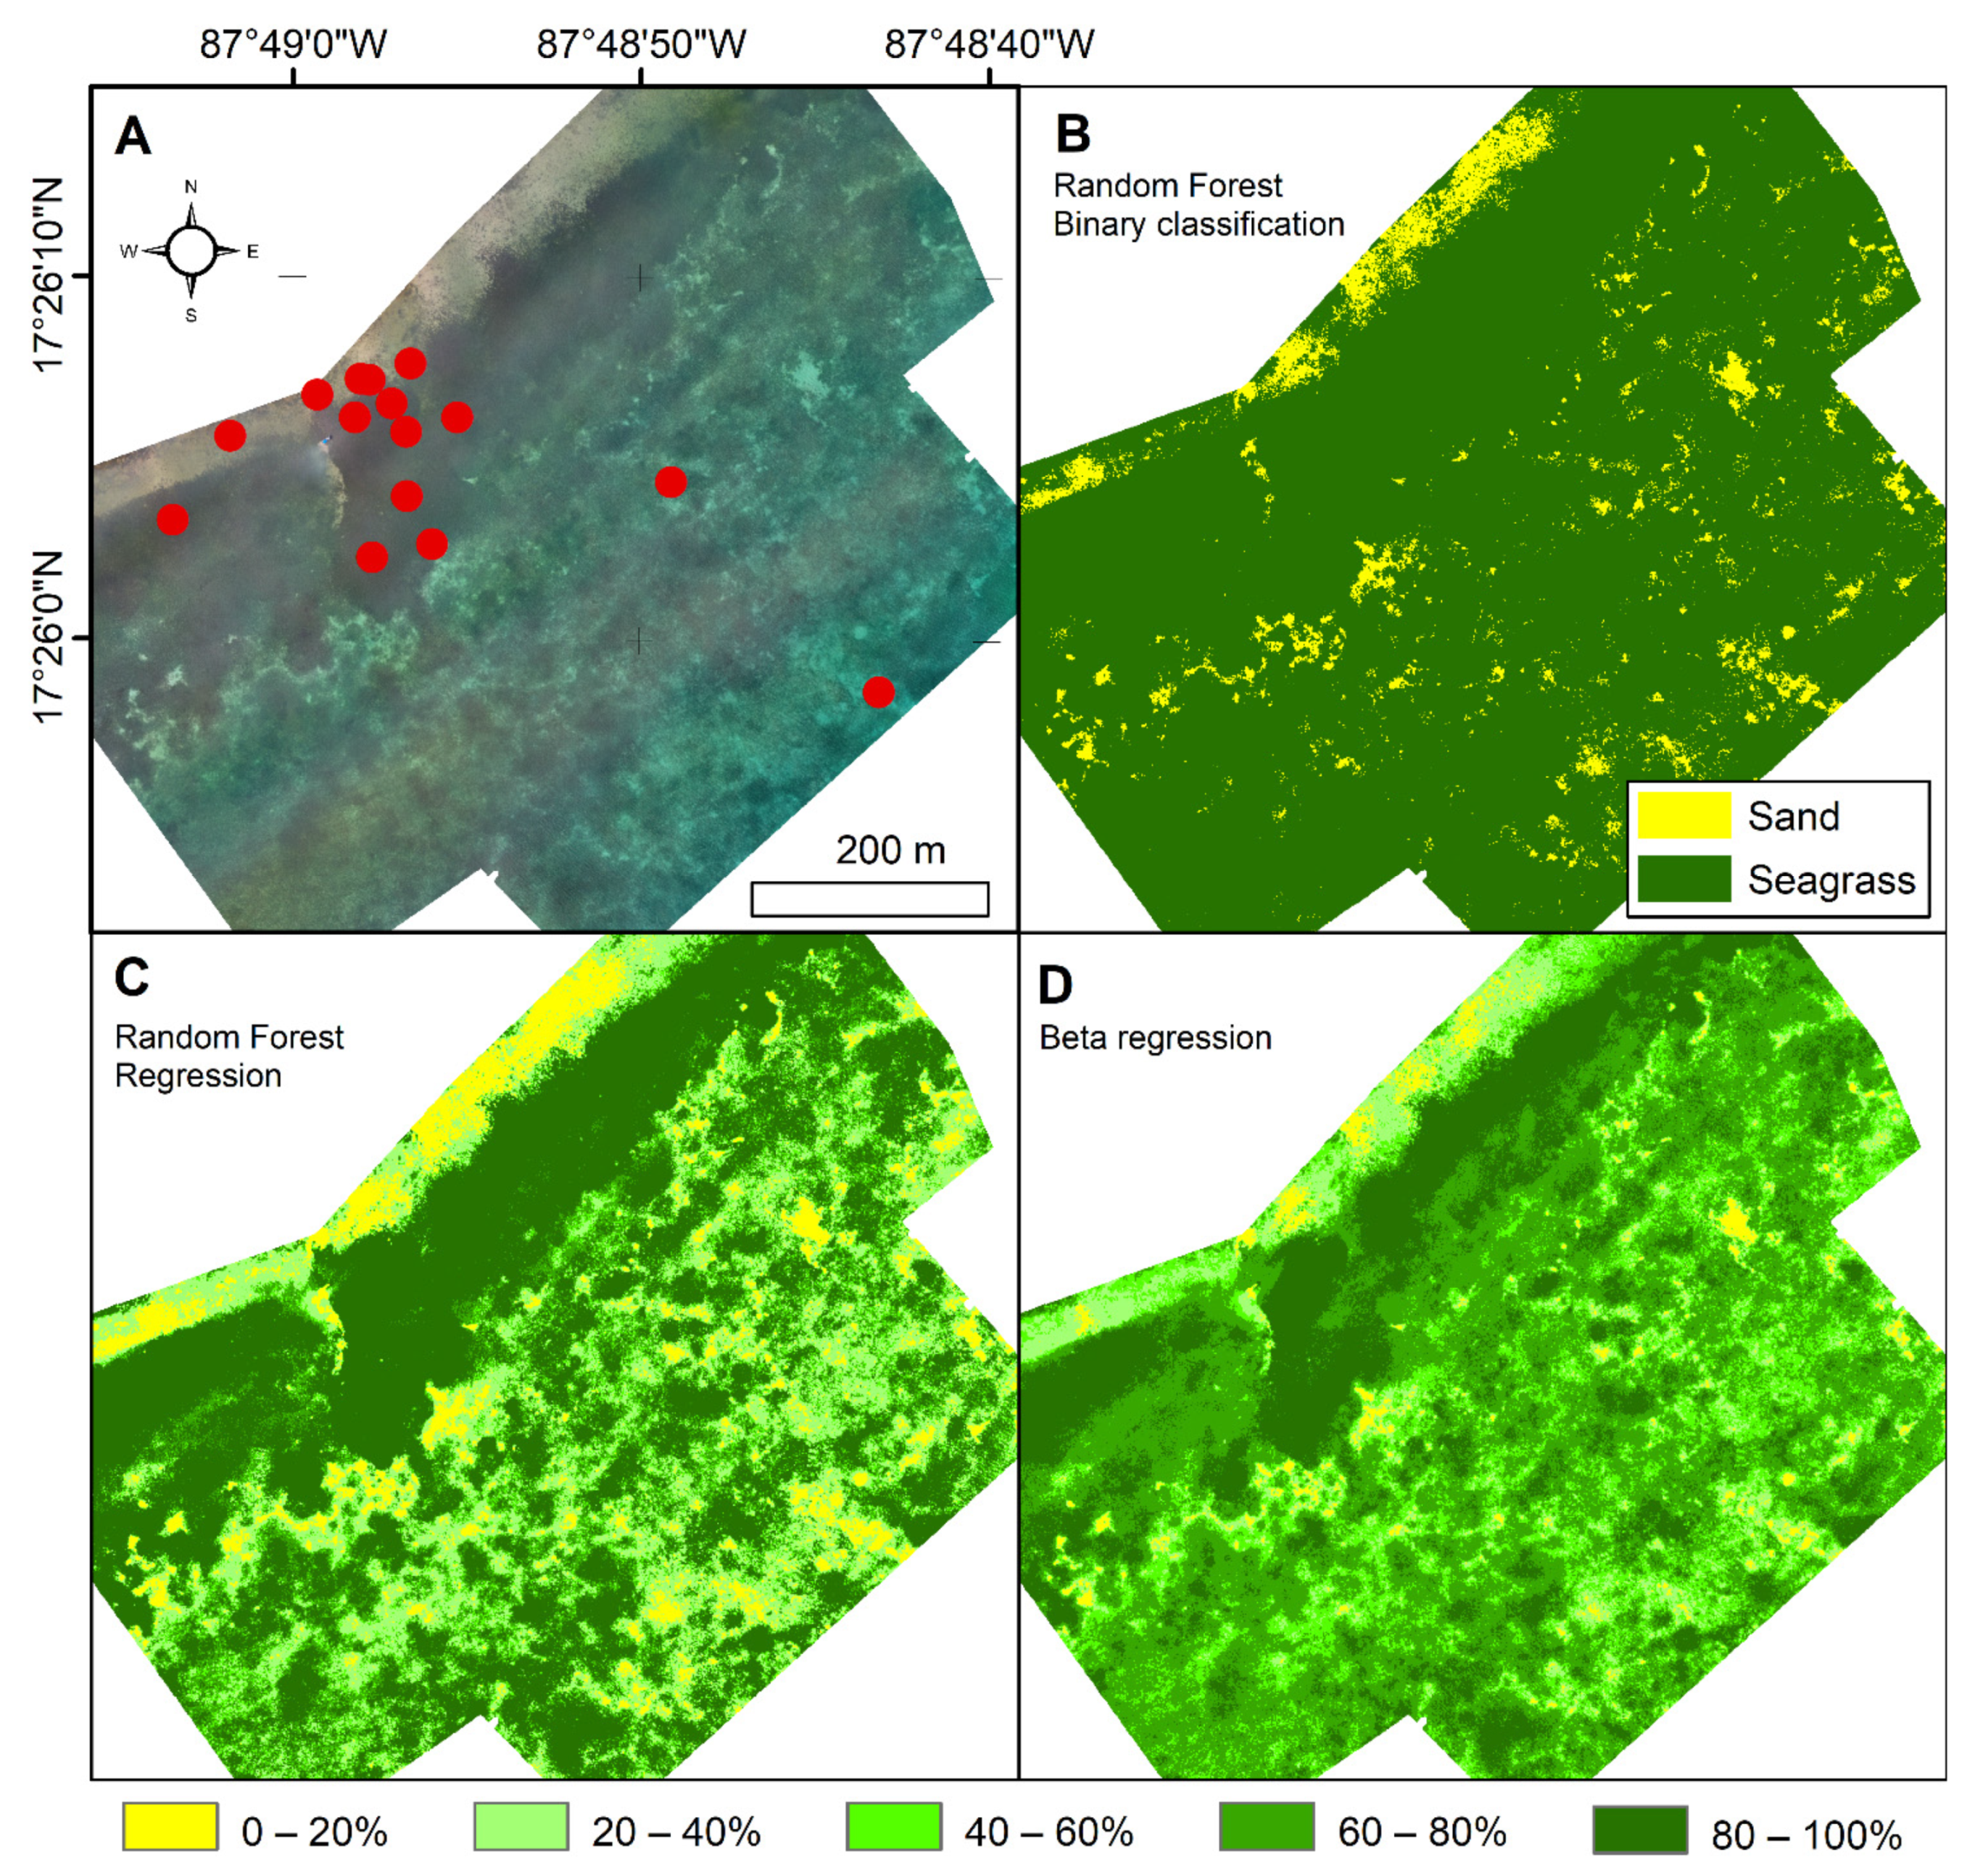
Seagrass cover was patchy at site C (Figure 5). Dense, high percentage cover, continuous patches were observed ~40 m from the mangrove line (immediately northwest of the extent shown), which became more sparse and patchy with increasing distance from the mangroves. The strip between the dense seagrass and mangrove line was characterised by sparse seagrass (20–40%; Figure 5C,D), but upon visual inspection of the orthomosaic it was determined to likely be biased by a darker substratum due to veneers of debris. The random forest model predicted a greater spatial extent of very high and very low percentage cover of seagrass.

3.1.4. Site D

Continuous dense seagrass beds characterised site D with few areas containing an intermediate density of seagrass (Figure 6a). A strip of sand separated the seagrass from the mangrove stands on the east side of the survey. The beta regression model, however, predicted a large proportion of the seagrass bed to be in the 60–80% percentile, which was not observed in the quadrat datasets nor the orthomosaic (as a qualitative observation upon close inspection). Based on in situ observations, this percentile coincided with elevated levels of turbidity in the water. The random forest regression outputs, however, suggest more extreme percentage values below 20% and above 80% cover of seagrass.

3.2. Influence of Modelling

The influence of model choice was more profound when comparing the predictions as percentile classes (Figure 7, Table 2). The proportion of seagrass predicted within the 80–100% class predicted by the random forest (regression) covered a greater amount than predicted by the beta regression at most sites. At site A, there was a general agreement across all three models (Figure 7). However, there was a contrast between models from sites B–D, with a significantly greater area predicted by random forest regression to have a higher proportion of higher seagrass coverage. For predicting presence/absence, taking the 0–20% band as roughly equivalent to absence, the methods are broadly comparable, although this is less true for site B where random forest regression produced a much smaller estimate of low seagrass cover than binary or beta regression.

3.3. Seagrass Canopy Cover Predictions

The random forest binary model had a producer accuracy of 94% and user accuracy of 91% for seagrass detection (see Supplementary Materials for confusion matrix). Random forest (regression) and beta regression approaches predicted mean absolute errors of cover percentage from the true input value of respectively, 6.8% (SE = 8.2) and 11.8% (SE= 13.8). There was a bias of −0.4% and −1% for the random forest and beta regression predictions, respectively. The absolute error of cover percentage from the true input value for the data independent of post hoc values (averaged over 10 models) was 11.9% (SE = 14) for the random forest prediction and 12.9% (SE = 14.5) for the beta regression prediction. The summary statistics given in Table 2 show that that the random forest regression performed slightly better than the beta regression on the training data. This was more evident for model performance against the test or validation datasets that were averaged over 10 models based on different training datasets: the random forest model had an R2 of 0.76 compared with the beta regression model that had an R2 of 0.67 (Table 3).

4. Discussion

Using three different statistical models, we demonstrate that a continuous prediction of seagrass canopy cover is possible using low-altitude drone surveys and minimal ground truthing, with a relatively high degree of accuracy (mean error = 6.8–12.9%). Our results go beyond basic extent data to quantify percentage cover, revealing the complex spatial structure and patchy nature of Turneffe Atoll’s seagrass meadows, and further demonstrate the utility of drone photography for monitoring shallow-water seagrass habitats with great detail and precision.

4.1. Turneffe Atoll Seagrass Beds

At site A we observed continuous seagrass cover with some patchiness in the centre and around the periphery. At sites B and C, seagrass coverage was generally patchy with more dense, continuous strips near shore. Site D showed little variation in terms of intermediate seagrass cover and was instead characterised by solid continuous seagrass beds. This inter-site variation may relate to the different species’ growth patterns (species found within our study sites were Syringodium filiforme, Thalassia testudinum, and Halodule wrightii), hydrodynamic energetic differences between sites [55], or depth as an abiotic driver of seagrass growth due to light limitation [56]. Visualising seagrass habitats in the way presented in this study reveals the variety of seagrass coverage patterns between sites and spatial patterns within each site. It is likely that the pattern of these patches influences spatial biodiversity and carbon storage patterns across the atoll and at individual sites, as it is known that landscape parameters (such as patchiness, patch size and habitat edge proximity) can exert significant influences on the environment [12,15,16]. These results demonstrate the pertinence of extrapolating ground surveys to the local area in a spatial context and comparing different sites within the nature reserve.

4.2. Advances in the Methodology of Mapping Seagrass with UAVs

To the best of our knowledge, the results presented in this study form the first continuous quantification of seagrass coverage from drone imagery. Our UAV-based data yielded seagrass leaf density-driven canopy cover as a percentage as well as spatial extent of the habitat. This distinction is important as mapping studies which provide fine-scale detail of the factors driving spatial variation, in addition to spatial extent, provide greater resolution of characteristics that are key to understanding ecosystem service provision and habitat health. Whilst the presence/absence map revealed seagrass extent, the percentage cover map more accurately represented areas with lower and higher seagrass density (Figure 3, Figure 4, Figure 5 and Figure 6). Previous attempts to predict seagrass percent coverage from satellite imagery using linear models and random forest regression attained standard errors of 14.9–15.6% [57] and 19.4% [58]. These larger errors can be attributed to the lower resolution satellite imagery pixel (scale of metres) whereby quadrats and ground truth data only provide a snapshot of the pixel, whereas higher resolution UAV imagery improves our ability to map seagrass coverage more accurately due to the higher resolution data where in situ quadrats are more representative of the image resolution. Our mean difference of 6.8–12.9% between the predicted and actual quadrat data with biases <2% is consistent with recent studies using unsupervised classification of drone imagery [33]. Duffy et al., (2018) [33], used a high-resolution binary classifier, but the results are comparable because the resolution was high enough to detect individual leaves (4.36 mm pixel−1). Our study supports the feasibility of accurate prediction of seagrass percentage cover from UAV imagery with different regression and classification approaches. Other studies which predicted seagrass percentage cover from satellite imagery produced statistical outputs as percentage band classes, but these cannot be compared with each other due to a lack of consistent percentage cover class sizes [59], or with the current study due to different data type approaches.
The different seagrass species present may have influenced the green band pixel values, but considering each site is dominated by a single species, the inclusion of “site” as an independent variable in the modelling process would help account for these differences. The different species observed in this study may also have had an unquantified influence on annotation and final map accuracy due to variations in leaf width, shoot distribution, and leaf length (considering the potential for canopy draping due to low water level which would influence the canopy cover observation from above). Although our training data were skewed to the extremes, we found that the models performed well on test data collected in the field, independent of post hoc data points (Table 2). The random forest model produced slightly more accurate maps than the beta regression in this study. However, subtle contrasts in predictions between the two modelling approaches highlight the importance of exploring different modelling approaches when predicting spatial data. Multiple modelling techniques or ensemble modelling approaches could be considered for use in further studies, as the modelling techniques applied yielded robust, yet slightly different area extents (Figure 7 and Table 3).
Whilst our modelling approaches were statistically robust according to the accuracy assessments, they could be improved with more extensive ground truthing. In particular, a low number of intermediate density patches sampled (see Supplementary Materials) may have introduced sampling bias even though it may reflect the nature of seagrass growth on Turneffe Atoll. Furthermore, a lack of consistency between the annotators to estimate percentage cover of seagrass at these intermediate classes may also have influenced the final output maps, as indicated by larger standard deviation values for intermediate estimates (see Supplementary Materials). Sediment plumes created by the scientific party prior to flights introduced additional errors in the images, and this could be reduced by ensuring a suitable waiting period between placing in-field instruments and drone flights. Furthermore, despite efforts to remove additional habitat types from the maps, coral colonies and veneers of debris may have been classified as seagrass due to their dark appearance. The inclusion of a two-step classification approach (combined with appropriate additional ground truthing) to isolate seagrass from other habitats such as coral reef may create a more informative habitat map from the imagery. These peripheral environments appeared to have a minimal footprint in the areas analysed in this study, and thus had minimal influence on the quantified class cover estimates.

4.3. Fine-Scale Resolution Mapping in Marine Protected Areas

Here we demonstrate workflows and methods for aerial image acquisition that are reproducible and relatively inexpensive compared with other methods, such as chartering planes. The low-cost aspect of this method makes it appealing for use in developing countries that may have limited financial resources for detailed monitoring. These costs can be driven down further with the use of cheaper drones (such as entry-level DJI drones, the spark and mavic mini) and by exclusively using free software for mosaic generation (e.g., Microsoft Image Composite Editor) and GIS analysis (e.g., QGIS). In addition to the advancement of ecological understanding provided by centimetric resolution seagrass maps, they will also aid management and infrastructure planning, promoting the sustainability of vulnerable and/or important habitats. Turneffe Atoll is already a protected reserve, though Belize plans to increase their coverage of no-take protected zones from 4.5% to 11.6% [60] with expansions already undertaken [61]. Identifying areas of high value (in terms of ecosystem services) is key to deciding on the locations suitable for further protection. The outputs of seagrass density or canopy cover maps can provide information that allow stakeholders and marine spatial managers to harness the links between the seagrass density/coverage and ecosystem services they provide, such as carbon sequestration and biodiversity. For example, Congdon et al., 2017 [62], and Mallombasi et al., 2020 [63], found a linear relationship between seagrass percent coverage and above- and below-ground biomass, from which thresholds for carbon sequestration can be calculated (e.g., [64]). Furthermore, Fonseca and Bell, 1998 [65], found that seagrass landscapes can lose their physical stabilising ability at below 59% seagrass coverage, with consequences for the associated communities. Whilst thresholds and general spatial relationships are likely to be species and region specific, validated percentage cover thresholds such as these, combined with high-resolution spatial information obtained from drone data can provide a powerful management tool.
Quantifying seagrass beyond presence and absence may also be useful in wider scale predictive mapping or satellite mapping to extrapolate the findings of high-resolution maps from relatively small survey areas, such as those presented in this paper. Species distribution models typically utilise seagrass presence data points to inform ecological niche theory-based models which link species of interest with environmental conditions (e.g., [66]). Access to datasets derived from drones can formulate continuous (percentage cover) or categorical (“dense/sparse seagrass”, percentage classes, etc.) datasets, which may yield more informative modelling outputs for management and ecological understanding. Furthermore, the data provided in this manuscript could be used as ground truth data for classification studies utilising satellite imagery over a larger area, for example, across the entire atoll [67]; however, there is a risk of error propagation.
High-resolution information from UAVs is conducive to effective management at local scales, such as rapid detection of degradation and loss. The ability to map seagrass habitat on a centimetric scale is useful for creating robust baseline datasets with which to track changes in seagrass coverage and to spatially quantify their influence on ecosystem service provision. This potential has already been realised in coral reef research (e.g., [68]) and has been suggested as an important tool that experts and non-experts alike can use to monitor seagrass habitats [69]. The direct georeferencing method employed in this study produced minimal scaling error and thus can be considered fairly reliable for orthomosaics. Our study did not utilize any topographic information derived from structure from motion due to the well-documented cartographic issues such as the “bowling” or “doming” of digital elevation models [70] when no ground control points are present. In the context of time-series studies, a more accurate georeferencing system is recommended, such as real-time kinematic (RTK), which uses a fixed base station to provide correctional data to a mobile receiver, providing positioning data to a geographical accuracy of ~1 cm. This technique can be used for GCP data collection and incorporated within the UAV (for example, the recent development of the DJI Phantom 4 RTK). Alternatively, multiple static points with longevity (such as wooden piers) in the survey area could be used as fixed GCPs to provide consistent scaling information within and between mosaics. It should be noted that any variations in lighting between surveys will influence predicted values, reducing the chance of repeat surveys to detect changes in seagrass percentage coverage, without the specific ground truth datasets to train the models.

4.4. Future of Mapping Seagrass Habitats with Drones

Whilst the methods demonstrated in this study reveal a robust methodology, environmental factors such as sun glare and water surface movement can impair the accuracy of subtidal habitat maps. Future studies should consider additional spectral properties that can be used in satellite remote sensing research (e.g., [71,72]) and which have recently been incorporated in UAVs for marine (intertidal) habitat mapping [73]. Using further wavelengths (multispectral and hyperspectral) can help improve our ability to map seagrass beds from UAVs [74], and can also be useful in detecting and alleviating surface glare and glint issues [75,76]. In addition, the recent development of fluid lensing technologies, which accounts for distortions of water surface movement, can result in an unimpeded view of the seafloor [77,78], could improve our capability to identify and correctly classify subtidal habitats.
Finally, the area mapped in this study was relatively small in the context of the atoll. There is a need to expand the survey area size where possible and to account for other habitats, such as coral reefs. The flights took between 8 min and 22 min each and covered an area of approximately 8000–450,000 m 2. Including time to prepare the equipment and to collect the ground truth data, each site took approximately 4 h to survey. To survey the atoll’s c. 366.43 km2 of seagrass meadow [42] would prove a considerable undertaking. In order to extrapolate these results to larger areas of the atoll efficiently, the high-resolution UAV outputs could be used to train satellite imagery classifiers [67]. Alternatively, utilising fixed-wing drones which can cover a larger area than traditional quadcopter UAVs can improve our ability to map seagrass over larger areas at each site [39].

5. Conclusions

This study demonstrates that it is possible to combine consumer-grade UAV surveys and limited ground truth data to produce seagrass coverage maps at much higher resolution than is possible using satellite data, and at much lower cost by comparison with other low-altitude methods (i.e., aircraft). Therefore, UAV imagery provides a powerful, responsive dataset with which to survey and monitor individual seagrass meadows, essential for localised management decisions. Future work should explore the potential to extrapolate UAV surveys over larger areas and to utilise maps for the quantification of ecosystem services.

Supplementary Materials

The following are available online at https://www.mdpi.com/article/10.3390/rs14030480/s1. Figure S1: Relationship between annotator consistency and final mean percentage cover. Figure S2: Histogram of training samples. Figure S3: Site A predicted seagrass cover as a percentage value. Figure S4: Site B predicted seagrass cover as a percentage value. Figure S5: Site C predicted seagrass cover as a percentage value. Figure S6: Site D predicted seagrass cover as a percentage value. Table S1: Confusion matrix of binary random forest model.

Author Contributions

Conceptualization, D.M.P., S.L.F. and R.S.; methodology, D.M.P., V.A.I.H. and J.S.; software, D.M.P.; formal analysis, D.M.P.; investigation, D.M.P., S.L.F., S.C., C.B., A.L., E.C. and H.B.; resources, S.L.F. and T.L.B.; data curation, S.L.F.; writing—original draft preparation, D.M.P.; writing—review and editing, D.M.P., S.L.F., V.A.I.H., J.S., S.C., C.B., A.L., R.S., A.C., A.Y., V.A., E.C., T.L.B., H.B. and C.E.; visualization, D.M.P.; supervision, V.A.I.H., J.S., R.S., T.L.B. and C.E.; project administration, S.L.F., A.Y., V.A., E.C. and T.L.B.; funding acquisition, R.S. and C.E. All authors have read and agreed to the published version of the manuscript.

Funding

This work was funded through the Commonwealth Marine Economies Programme (The U.K. government). D.M.P. and S.L.F. were supported by the Natural Environmental Research Council (grant no. NE/N012070/1 and NE/L002531/1, respectively). C.E. was supported by the Natural Environment Research Council (NERC) Independent Research Fellowship NE/M018806/1. V.A.I.H. was also funded by the NERC Grant No. NE/R000123/1 (ACCORD) and Grant No. NE/R015953/1 (CLASS). During the final preparation stage of the manuscript, V.A.I.H. further enjoyed a fellowship from the Hanse-Wissenschaftskolleg Institute for Advanced Study.

Data Availability Statement

Data available on request.

Acknowledgments

We wish to thank everyone involved in the fieldwork of this study, in particular Jayron Young, Maurice Westby, Ellis Requena, and Estella. We thank the Turneffe Atoll Sustainability Association (TASA) and the Coastal Zone Management Authority and Institute (CZMAI) for their logistical support and for hosting the field team. We thank the reviewers for their important insight, improving the clarity and quality of the paper.

Conflicts of Interest

The authors declare no conflict of interest.

References

  1. Nagelkerken, I.; Roberts, C.M.; van der Velde, G.; Dorenbosch, M.; van Riel, M.C.; de la Morinere, E.C.; Nienhuis, P.H. How important are mangroves and seagrass beds for coral-reef fish? The nursery hypothesis tested on an island scale. Mar. Ecol. Prog. Ser. 2002, 244, 299–305. [Google Scholar] [CrossRef] [Green Version]
  2. Dorenbosch, M.; Grol, M.G.G.; Christianen, M.J.A.; Nagelkerken, I.; van der Velde, G. Indo-Pacific seagrass beds and mangroves contribute to fish density coral and diversity on adjacent reefs. Mar. Ecol. Prog. Ser. 2005, 302, 63–76. [Google Scholar] [CrossRef] [Green Version]
  3. Pau, M. The protection of sandy shores—Can we afford to ignore the contribution of seagrass? Mar. Pollut. Bull. 2018, 134, 152–159. [Google Scholar]
  4. Christianen, M.J.A.; van Belzen, J.; Herman, P.M.J.; van Katwijk, M.M.; Lamers, L.P.M.; van Leent, P.J.M.; Bouma, T.J. Low-Canopy Seagrass Beds Still Provide Important Coastal Protection Services. PLoS ONE 2013, 8, e26413. [Google Scholar] [CrossRef] [PubMed] [Green Version]
  5. Attrill, M.J.; Strong, J.A.; Rowden, A.A. Are macroinvertebrate communities influenced by seagrass structural complexity? Ecography 2000, 23, 114–121. [Google Scholar] [CrossRef]
  6. Duffy, J.E. Biodiversity and the functioning of seagrass ecosystems. Mar. Ecol. Prog. Ser. 2006, 311, 233–250. [Google Scholar] [CrossRef] [Green Version]
  7. Horinouchi, M. Review of the effects of within-patch scale structural complexity on seagrass fishes. J. Exp. Mar. Biol. Ecol. 2007, 350, 111–129. [Google Scholar] [CrossRef]
  8. Nordlund, L.M.; Koch, E.W.; Barbier, E.B.; Creed, J.C. Seagrass Ecosystem Services and Their Variability across Genera and Geographical Regions. PLoS ONE 2016, 11, e0163091. [Google Scholar] [CrossRef] [PubMed] [Green Version]
  9. Mcleod, E.; Chmura, G.L.; Bouillon, S.; Salm, R.; Björk, M.; Duarte, C.M.; Lovelock, C.E.; Schlesinger, W.H.; Silliman, B.R. A blueprint for blue carbon: Toward an improved understanding of the role of vegetated coastal habitats in sequestering CO2. Front. Ecol. Environ 2011, 9, 552–560. [Google Scholar] [CrossRef] [Green Version]
  10. Fourqurean, J.W.; Duarte, C.M.; Kennedy, H.; Marba, N.; Holmer, M.; Mateo, M.A.; Apostolaki, E.T.; Kendrick, G.A.; Krause-Jensen, D.; McGlathery, K.J.; et al. Seagrass ecosystems as a globally significant carbon stock. Nat. Geosci. 2012, 5, 505–509. [Google Scholar] [CrossRef]
  11. McCloskey, R.M.; Unsworth, R.K.F. Decreasing seagrass density negatively influences associated fauna. Peerj 2015, 3, 3. [Google Scholar] [CrossRef] [PubMed] [Green Version]
  12. Whippo, R.; Knight, N.S.; Prentice, C.; Cristiani, J.; Siegle, M.R.; O’Connor, M.I. Epifaunal diversity patterns within and among seagrass meadows suggest landscape-scale biodiversity processes. Ecosphere 2018, 9, e02490. [Google Scholar] [CrossRef] [Green Version]
  13. Samper-Villarreal, J.; Lovelock, C.E.; Saunders, M.I.; Roelfsema, C.; Mumby, P.J. Organic carbon in seagrass sediments is influenced by seagrass canopy complexity, turbidity, wave height, and water depth. Limnol. Oceanogr. 2016, 61, 938–952. [Google Scholar] [CrossRef] [Green Version]
  14. Ricart, A.M.; Perez, M.; Romero, J. Landscape configuration modulates carbon storage in seagrass sediments. Estuar. Coast. Shelf Sci. 2017, 185, 69–76. [Google Scholar] [CrossRef]
  15. Oreska, M.P.J.; McGlathery, K.J.; Porter, J.H. Seagrass blue carbon spatial patterns at the meadow-scale. PLoS ONE 2017, 12, e0176630. [Google Scholar] [CrossRef]
  16. Mazarrasa, I.; Sarnper-Villarreal, J.; Serrano, O.; Lavery, P.S.; Lovelock, C.E.; Marba, N.; Duarte, C.M.; Cortes, J. Habitat characteristics provide insights of carbon storage in seagrass meadows. Mar. Pollut. Bull. 2018, 134, 106–117. [Google Scholar] [CrossRef]
  17. Waycott, M.; Duarte, C.M.; Carruthers, T.J.B.; Orth, R.J.; Dennison, W.C.; Olyarnik, S.; Calladine, A.; Fourqurean, J.W.; Heck, K.L.; Hughes, A.R.; et al. Accelerating loss of seagrasses across the globe threatens coastal ecosystems. Proc. Natl. Acad. Sci. USA 2009, 106, 12377–12381. [Google Scholar] [CrossRef] [Green Version]
  18. Githaiga, M.N.; Frouws, A.M.; Kairo, J.G.; Huxham, M. Seagrass Removal Leads to Rapid Changes in Fauna and Loss of Carbon. Front. Ecol. Evol. 2019, 7, 7. [Google Scholar] [CrossRef] [Green Version]
  19. Phinn, S.; Roelfsema, C.; Dekker, A.; Brando, V.; Anstee, J. Mapping seagrass species, cover and biomass in shallow waters: An assessment of satellite multi-spectral and airborne hyper-spectral imaging systems in Moreton Bay (Australia). Remote Sens. Environ. 2008, 112, 3413–3425. [Google Scholar] [CrossRef]
  20. Topouzelis, K.; Makri, D.; Stoupas, N.; Papakonstantinou, A.; Katsanevakis, S. Seagrass mapping in Greek territorial waters using Landsat-8 satellite images. Int. J. Appl. Earth Obs. 2018, 67, 98–113. [Google Scholar] [CrossRef]
  21. Hossain, M.S.; Bujang, J.S.; Zakaria, M.H.; Hashim, M. The application of remote sensing to seagrass ecosystems: An overview and future research prospects. Int. J. Remote Sens. 2015, 36, 61–114. [Google Scholar] [CrossRef]
  22. Lo Iacono, C.; Mateo, M.A.; Gracia, E.; Guasch, L.; Carbonell, R.; Serrano, L.; Serrano, O.; Danobeitia, J. Very high-resolution seismo-acoustic imaging of seagrass meadows (Mediterranean Sea): Implications for carbon sink estimates. Geophys. Res. Lett. 2008, 35, 5. [Google Scholar] [CrossRef]
  23. Micallef, A.; Le Bas, T.P.; Huvenne, V.A.I.; Blondel, P.; Huhnerbach, V.; Deidun, A. A multi-method approach for benthic habitat mapping of shallow coastal areas with high-resolution multibeam data. Cont. Shelf Res. 2012, 39, 14–26. [Google Scholar] [CrossRef] [Green Version]
  24. Greene, A.; Rahman, A.F.; Kline, R.; Rahman, M.S. Side scan sonar: A cost-efficient alternative method for measuring seagrass cover in shallow environments. Estuar Coast. Shelf Sci. 2018, 207, 250–258. [Google Scholar] [CrossRef]
  25. Tyllianakis, E.; Callaway, A.; Vanstaen, K.; Luisetti, T. The value of information: Realising the economic benefits of mapping seagrass meadows in the British Virgin Islands. Sci. Total Environ. 2019, 650, 2107–2116. [Google Scholar] [CrossRef]
  26. Rende, S.F.; Bosman, A.; Di Mento, R.; Bruno, F.; Lagudi, A.; Irving, A.D.; Dattola, L.; Di Giambattista, L.; Lanera, P.; Proietti, R.; et al. Ultra-High-Resolution Mapping of Posidonia oceanica (L.) Delile Meadows through Acoustic, Optical Data and Object-based Image Classification. J. Mar. Sci. Eng. 2020, 8, 647. [Google Scholar] [CrossRef]
  27. Rende, F.S.; Irving, A.D.; Lagudi, A.; Bruno, F.; Scalise, S.; Cappa, P.; Montefalcone, M.; Bacci, T.; Penna, M.; Trabucco, B.; et al. Pilot Application of 3d Underwater Imaging Techniques for Mapping Posidonia oceanica (L.) Delile Meadows. Int. Arch. Photogramm. 2015, 45, 177–181. [Google Scholar]
  28. Rende, S.F.; Irving, A.D.; Bacci, T.; Parlagreco, L.; Bruno, F.; De Filippo, F.; Montefalcone, M.; Penna, M.; Trabucco, B.; Di Mento, R.; et al. Advances in micro-cartography: A two-dimensional photo mosaicing technique for seagrass monitoring. Estuar. Coast Shelf Sci. 2015, 167, 475–486. [Google Scholar] [CrossRef]
  29. Scardi, M.; Chessa, L.A.; Fresi, E.; Pais, A.; Serra, S. Optimizing interpolation of shoot density data from a Posidonia oceanica seagrass bed. Mar. Ecol. 2006, 27, 339–349. [Google Scholar] [CrossRef] [Green Version]
  30. Chauvaud, S.; Bouchon, C.; Maniere, R. Remote sensing techniques adapted to high resolution mapping of tropical coastal marine ecosystems (coral reefs, seagrass beds and mangrove). Int. J. Remote Sens. 1998, 19, 3625–3639. [Google Scholar] [CrossRef]
  31. Kendrick, G.A.; Aylward, M.J.; Hegge, B.J.; Cambridge, M.L.; Hillman, K.; Wyllie, A.; Lord, D.A. Changes in seagrass coverage in Cockburn Sound, Western Australia between 1967 and 1999. Aquat. Bot. 2002, 73, 75–87. [Google Scholar] [CrossRef]
  32. Murdoch, T.J.T.; Glasspool, A.F.; Outerbridge, M.; Ward, J.; Manuel, S.; Gray, J.; Nash, A.; Coates, K.A.; Pitt, J.; Fourqurean, J.W.; et al. Large-scale decline in offshore seagrass meadows in Bermuda. Mar. Ecol. Prog. Ser. 2007, 339, 123–130. [Google Scholar] [CrossRef] [Green Version]
  33. Duffy, J.P.; Pratt, L.; Anderson, K.; Land, P.E.; Shutler, J.D. Spatial assessment of intertidal seagrass meadows using optical imaging systems and a lightweight drone. Estuar. Coast. Shelf Sci. 2018, 200, 169–180. [Google Scholar] [CrossRef]
  34. Veettil, B.K.; Ward, R.D.; Lima, M.D.A.C.; Stankovic, M.; Hoai, P.N.; Quang, N.X. Opportunities for seagrass research derived from remote sensing: A review of current methods. Ecol. Indic. 2020, 117, 106560. [Google Scholar] [CrossRef]
  35. Ventura, D.; Bruno, M.; Lasinio, G.J.; Belluscio, A.; Ardizzone, G. A low-cost drone based application for identifying and mapping of coastal fish nursery grounds. Estuar. Coast. Shelf Sci. 2016, 171, 85–98. [Google Scholar] [CrossRef]
  36. Chen, J.; Sasaki, J. Mapping of Subtidal and Intertidal Seagrass Meadows via Application of the Feature Pyramid Network to Unmanned Aerial Vehicle Orthophotos. Remote Sens. 2021, 13, 4880. [Google Scholar] [CrossRef]
  37. Ventura, D.; Bonifazi, A.; Gravina, M.F.; Belluscio, A.; Ardizzone, G. Mapping and Classification of Ecologically Sensitive Marine Habitats Using Unmanned Aerial Vehicle (UAV) Imagery and Object-Based Image Analysis (OBIA). Remote Sens. 2018, 10, 1331. [Google Scholar] [CrossRef] [Green Version]
  38. Nahirnick, N.K.; Reshitnyk, L.; Campbell, M.; Hessing-Lewis, M.; Costa, M.; Yakimishyn, J.; Lee, L. Mapping with confidence; delineating seagrass habitats using Unoccupied Aerial Systems (UAS). Remote Sens. Ecol. Con. 2019, 5, 121–135. [Google Scholar] [CrossRef]
  39. Ellis, S.L.; Taylor, M.L.; Schiele, M.; Letessier, T.B. Influence of altitude on tropical marine habitat classification using imagery from fixed-wing, water-landing UAVs. Remote Sens. Ecol. Con. 2021, 7, 50–63. [Google Scholar] [CrossRef]
  40. Papakonstantinou, A.; Stamati, C.; Topouzelis, K. Comparison of True-Color and Multispectral Unmanned Aerial Systems Imagery for Marine Habitat Mapping Using Object-Based Image Analysis. Remote Sens. 2020, 12, 554. [Google Scholar] [CrossRef] [Green Version]
  41. Roelfsema, C.M.; Lyons, M.; Kovacs, E.M.; Maxwell, P.; Saunders, M.I.; Samper-Villarreal, J.; Phinn, S.R. Multi-temporal mapping of seagrass cover, species and biomass: A semi-automated object based image analysis approach. Remote Sens. Environ. 2014, 150, 172–187. [Google Scholar] [CrossRef]
  42. Fedler, T. The Value of Turneffe Atoll Mangrove Forests, Seagrass Beds and Coral Reefs in Protecting Belize City from Storms. 2018. Available online: https://www.turneffeatoll.org/app/webroot/userfiles/66/File/Turneffe%20Storm%20Mitigation%20Value%20Report%20FINAL.pdf (accessed on 28 November 2021).
  43. Coastal Zone Management Authority and Institute (CZMAI). Belize Integrated Coastal Zone Management Plan; CZMAI: Belize City, Belize, 2016. [Google Scholar]
  44. Casella, E.; Collin, A.; Harris, D.; Ferse, S.; Bejarano, S.; Parravicini, V.; Hench, J.L.; Rovere, A. Mapping coral reefs using consumer-grade drones and structure from motion photogrammetry techniques. Coral. Reefs. 2017, 36, 269–275. [Google Scholar] [CrossRef]
  45. Turner, D.; Lucieer, A.; Watson, C. An Automated Technique for Generating Georectified Mosaics from Ultra-High Resolution Unmanned Aerial Vehicle (UAV) Imagery, Based on Structure from Motion (SfM) Point Clouds. Remote Sens. 2012, 4, 1392–1410. [Google Scholar] [CrossRef] [Green Version]
  46. Pfeifer, N.; Glira, P.; Briese, C. Direct Georeferencing with on Board Navigation Components of Light Weight Uav Platforms. Xxii Isprs. Congr. Tech. Comm. Vii 2012, 39, 487–492. [Google Scholar] [CrossRef] [Green Version]
  47. Joyce, K.E.; Duce, S.; Leahy, S.M.; Leon, J.; Maier, S.W. Principles and practice of acquiring drone-based image data in marine environments. Mar. Freshw. Res. 2019, 70, 952–963. [Google Scholar] [CrossRef]
  48. Gauci, A.A.; Brodbeck, C.J.; Poncet, A.M.; Knappenberger, T. Assessing the geospatial accuracy of aerial imagery collected with various UAS platforms. Trans. ASABE 2018, 61, 1823–1829. [Google Scholar] [CrossRef]
  49. Woodget, A. Quantifying Physical River Habitat Parametres Using Hyperspatial Resolution UAS Imagery and SfM-Photogrammetry; University of Worcester: Worcester, UK, 2015. [Google Scholar]
  50. Murfitt, S.L.; Allan, B.M.; Bellgrove, A.; Rattray, A.; Young, M.A.; Ierodiaconou, D. Applications of unmanned aerial vehicles in intertidal reef monitoring. Sci Rep. 2017, 7, 10259. [Google Scholar] [CrossRef] [Green Version]
  51. Ferrari, S.L.P.; Cribari-Neto, F. Beta regression for modelling rates and proportions. J. Appl. Stat. 2004, 31, 799–815. [Google Scholar] [CrossRef]
  52. Coulston, J.W.; Moisen, G.G.; Wilson, B.T.; Finco, M.V.; Cohen, W.B.; Brewer, C.K. Modeling Percent Tree Canopy Cover: A Pilot Study. Photogramm. Eng. Remote Sens. 2012, 78, 715–727. [Google Scholar] [CrossRef] [Green Version]
  53. Korhonen, L.; Korhonen, K.T.; Stenberg, P.; Maltamo, M.; Rautiainen, M. Local models for forest canopy cover with beta regression. Silva. Fenn. 2007, 41, 671–685. [Google Scholar] [CrossRef] [Green Version]
  54. Liaw, A.; Wiener, M. Classification and regression by randomForest. R News 2002, 2, 18–22. [Google Scholar]
  55. Kendrick, G.A.; Holmes, K.W.; Van Niel, K.P. Multi-scale spatial patterns of three seagrass species with different growth dynamics. Ecography 2008, 31, 191–200. [Google Scholar] [CrossRef]
  56. Van der Heide, T.; Bouma, T.J.; van Nes, E.H.; van de Koppel, J.; Scheffer, M.; Roelofs, J.G.M.; van Katwijk, M.M.; Smolders, A.J.P. Spatial self-organized patterning in seagrasses along a depth gradient of an intertidal ecosystem. Ecology 2010, 91, 362–369. [Google Scholar] [CrossRef] [PubMed] [Green Version]
  57. Ariasari, A.; Hartono; Wicaksono, P. Random Forest Classification and Regression for Seagrass Mapping using PlanetScope Image in Labuan Bajo, East Nusa Tenggara. Proc. SPIE 2019, 11372, 113721Q. [Google Scholar]
  58. Fauzan, M.A.; Kumara, I.S.W.; Yogyantoro, R.; Suwardana, S.; Fadhilah, N.; Nurmalasari, I.; Apriyani, S.; Wicaksono, P. Assessing the capability of Sentinel-2A data for mapping seagrass percent cover in Jerowaru, East Lombok. Indones. J. Geogr. 2017, 49, 195–203. [Google Scholar] [CrossRef] [Green Version]
  59. Roelfsema, C.; Kovacs, E.M.; Saunders, M.I.; Phinn, S.; Lyons, M.; Maxwell, P. Challenges of remote sensing for quantifying changes in large complex seagrass environments. Estuar. Coast. Shelf Sci. 2013, 133, 161–171. [Google Scholar] [CrossRef]
  60. Government of Belize Press Office. Expansion of Fisheries Replenishment (No-Take) Zones. Available online: https://www.pressoffice.gov.bz/expansion-of-fisheries-replenishment-no-take-zones/ (accessed on 28 November 2021).
  61. Government of Belize Press Office. Expansion of the Sapodilla Cayes Marine Reserve to Protect Important Reef Ecosystem. Available online: https://www.pressoffice.gov.bz/expansion-of-the-sapodilla-cayes-marine-reserve-to-protect-important-reef-ecosystem/ (accessed on 28 November 2021).
  62. Congdon, V.M.; Wilson, S.S.; Dunton, K.H. Evaluation of Relationships Between Cover Estimates and Biomass in Subtropical Seagrass Meadows and Application to Landscape Estimates of Carbon Storage. Southeast Geogr. 2017, 57, 231–245. [Google Scholar] [CrossRef]
  63. Mallombasi, A.; Mashoreng, S.; La Nafie, Y.A. The relationship between seagrass Thalassia hemprichii percentage cover and their biomass. J. Ilmu Kelaut. SPERMONDE 2020, 6, 7–10. [Google Scholar] [CrossRef]
  64. Duarte, C.M.; Marbà, N.; Gacia, E.; Fourqurean, J.W.; Beggins, J.; Barrón, C.; Apostolaki, E.T. Seagrass community metabolism: Assessing the carbon sink capacity of seagrass meadows. Glob. Biogeochem. Cycles 2010, 24, 1–8. [Google Scholar] [CrossRef] [Green Version]
  65. Fonseca, M.S.; Bell, S.S. Influence of physical setting on seagrass landscapes near Beaufort, North Carolina, USA. Mar. Ecol. Prog. Ser. 1998, 171, 109–121. [Google Scholar] [CrossRef] [Green Version]
  66. Downie, A.L.; von Numers, M.; Boström, C. Influence of model selection on the predicted distribution of the seagrass Zostera marina. Estuar. Coast. Shelf Sci. 2013, 121, 8–19. [Google Scholar] [CrossRef]
  67. Carpenter, S.; Byfield, V.; Felgate, S.; Price, D.; Andrade, V.; Cobb, E.; Strong, J.; Lichtschlag, A.; Brittain, H.; Barry, C.; et al. Using Unoccupied Aerial Vehicles (UAVs) to Map Seagrass Cover from Sentinel-2 imagery. Remote Sens. 2022, 14, 477. [Google Scholar] [CrossRef]
  68. Fallati, L.; Saponari, L.; Savini, A.; Marchese, F.; Corselli, C.; Galli, P. Multi-Temporal UAV Data and Object-Based Image Analysis (OBIA) for Estimation of Substrate Changes in a Post-Bleaching Scenario on a Maldivian Reef. Remote Sens. 2020, 12, 2093. [Google Scholar] [CrossRef]
  69. Yang, B.; Hawthorne, T.L.; Hessing-Lewis, M.; Duffy, E.J.; Reshitnyk, L.Y.; Feinman, M.; Searson, H. Developing an Introductory UAV/Drone Mapping Training Program for Seagrass Monitoring and Research. Drones 2020, 4, 70. [Google Scholar] [CrossRef]
  70. Sanz-Ablanedo, E.; Chandler, J.H.; Ballesteros-Pérez, P.; Rodríguez-Pérez, J.R. Reducing systematic dome errors in digital elevation models through better UAV flight design. Earth Surf. Process. Landf. 2020, 45, 2134–2147. [Google Scholar] [CrossRef]
  71. Lesser, M.P.; Mobley, C.D. Bathymetry, water optical properties, and benthic classification of coral reefs using hyperspectral remote sensing imagery. Coral. Reefs. 2007, 26, 819–829. [Google Scholar] [CrossRef]
  72. Bajjouk, T.; Mouquet, P.; Ropert, M.; Quod, J.P.; Hoarau, L.; Bigot, L.; Le Dantec, N.; Delacourt, C.; Populus, J. Detection of changes in shallow coral reefs status: Towards a spatial approach using hyperspectral and multispectral data. Ecol. Indic. 2019, 96, 174–191. [Google Scholar] [CrossRef]
  73. Rossiter, T.; Furey, T.; McCarthy, T.; Stengel, D.B. UAV-mounted hyperspectral mapping of intertidal macroalgae. Estuar. Coast. Shelf Sci. 2020, 242, 106789. [Google Scholar] [CrossRef]
  74. James, D.; Collin, A.; Houet, T.; Mury, A.; Gloria, H.; Le Poulain, N. Towards Better Mapping of Seagrass Meadows using UAV Multispectral and Topographic Data. J. Coast. Res. 2020, 95, 1117–1121. [Google Scholar] [CrossRef]
  75. Hochberg, E.J.; Andréfouët, S.; Tyler, M.R. Sea surface correction of high spatial resolution Ikonos images to improve bottom mapping in near-shore environments. IEEE Trans. Geosci. Remote Sens. 2003, 41, 1724–1729. [Google Scholar] [CrossRef]
  76. Cavanaugh, K.C.; Cavanaugh, K.C.; Bell, T.W.; Hockridge, E.G. An automated method for mapping giant kelp canopy dynamics from UAV. Front. Environ. Sci. 2021, 8, 301. [Google Scholar] [CrossRef]
  77. Chirayath, V.; Earle, S.A. Drones that see through waves—Preliminary results from airborne fluid lensing for centimetre-scale aquatic conservation. Aquat. Conserv. 2016, 26, 237–250. [Google Scholar] [CrossRef] [Green Version]
  78. Chirayath, V.; Instrella, R. Fluid lensing and machine learning for centimeter-resolution airborne assessment of coral reefs in American Samoa. Remote Sens. Environ. 2019, 235, 111475. [Google Scholar] [CrossRef]
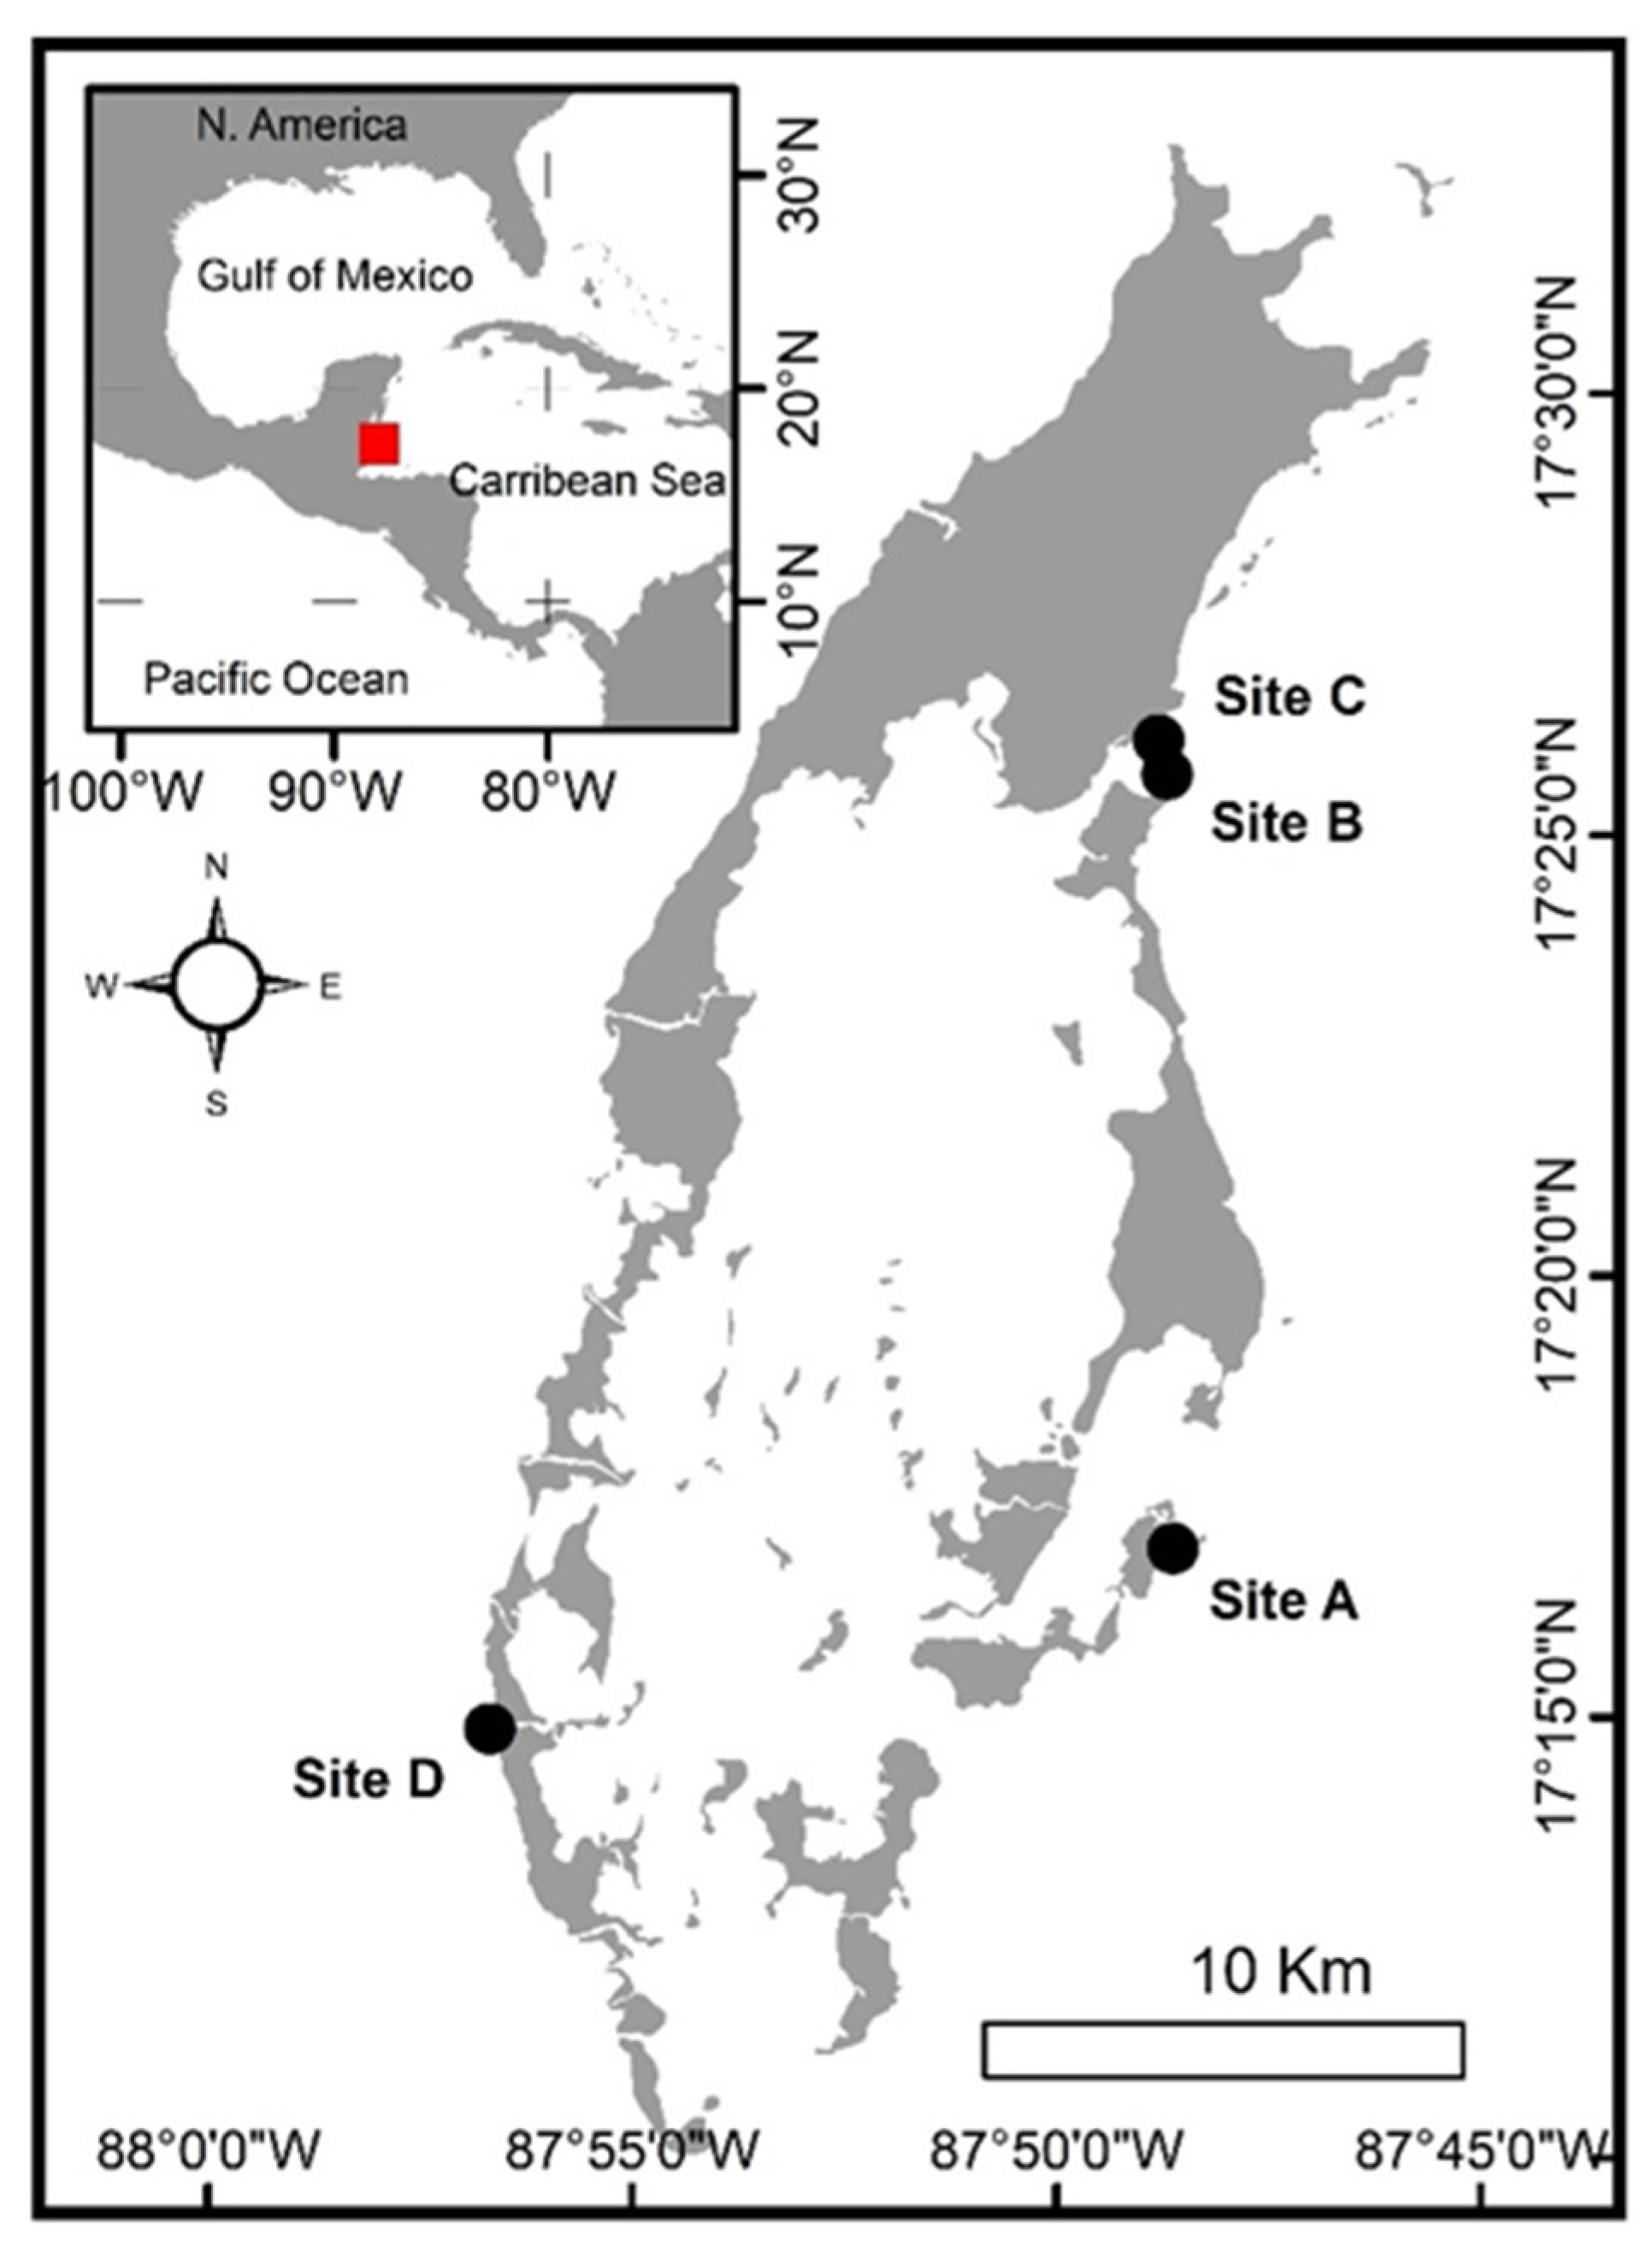
Figure 1. Map of Turneffe Atoll and sites survey with a UAV. Turneffe Atoll location is represented by the red square in the regional inset.
Remotesensing 14 00480 g001
Figure 2. Images of seagrass data collection: (a) in situ image of a quadrat; (b) image of a quadrat from a UAV flying at an altitude of 80 m; (c) high-resolution orthomosaics with some quadrats in view; and (d) same view as panel c at 50 cm per pixel.
Remotesensing 14 00480 g002
Figure 3. Site A. (a) Orthomosaic: red dots represent ground truth samples; (b) binary output of seagrass presence based on a random forest classifier; (c) percentage cover of seagrass based on a random forest regression presented in percentile classes; and (d) percentage cover of seagrass based on a beta regression presented in percentile classes. Maps of continuous percentage cover of seagrass are presented in the Supplementary Materials.
Remotesensing 14 00480 g003
Figure 4. Site B. (a) Orthomosaic: Red dots represent ground truth samples; (b) binary output of seagrass presence based on a random forest classifier; (c) predicted percentage cover of seagrass based on a random forest regression presented in percentile classes; and (d) predicted percentage cover of seagrass based on a beta regression presented in percentile classes. Maps of continuous percentage cover of seagrass are presented in the Supplementary Materials.
Remotesensing 14 00480 g004
Figure 5. Site C. (A) Orthomosaic: red dots represent ground truth samples; (B) binary output of seagrass presence based on a random forest classifier; (C) predicted percentage cover of seagrass based on a random forest regression presented in percentile classes; and (D) predicted percentage cover of seagrass based on a beta regression presented in percentile classes. Maps of continuous percentage cover of seagrass are presented in the Supplementary Materials.
Remotesensing 14 00480 g005
Figure 6. Site D. (a) Orthomosaic: red dots represent ground truth samples; (b) binary output of seagrass presence based on a random forest classifier; (c) predicted percentage cover of seagrass based on a random forest regression presented in percentile classes; and (d) predicted percentage cover of seagrass based on a beta regression presented in percentile classes. Maps of continuous percentage cover of seagrass are presented in the Supplementary Materials.
Remotesensing 14 00480 g006
Figure 7. Pie charts to represent the area of seagrass presence and percentage coverage as predicted by a random forest classifier, random forest regression, and a beta regression at four sites on Turneffe Atoll. Continuous data are represented within percentiles for clarity.
Remotesensing 14 00480 g007
Table 1. Details of UAV flights.
LocationDateTimeNumber of FlightsNumber of Images CollectedNumber of Images UtilisedFlight AltitudeArea of Orthomosaic Used in Analysis (ha)
Site A22 January 201916:00166661008.49
Site B24 January 201916:271128123808.6
Site C25 January 201916:0824183388043.73
Site D26 January 201916:0523962738011.66
Table 2. The area of seagrass coverage predicted across 4 sites on Turneffe Atoll.
Class Area Predicted from the Random Forest (Regression) Model (m2)Class Area Predicted from the Beta Regression Model (m2)
Seagrass
(% Cover)
Site ASite BSite CSite DSite ASite BSite CSite D
0–20783423,62535,43417,594567622,65410,0237821
20–40638012,52592,9572045389225,70340,19511,939
40–604858760443,2701451733221,52687,55812,924
60–8011,66240,63977,172275621,65412,873199,15950,997
80–10054,1821567188,48092,78546,3623205100,37932,949
ClassClass area (m2) predicted from the Random Forest (binary) model
Seagrass77,07571,098411,614100,537
Sand784014,86225,70016,094
Table 3. Model validation results.
Variance Explained (%)Pseudo R2Out of Bag Error (%)Adjusted R2Adjusted R2
TrainTestTest Data (Exc. Post Hoc)
Random Forest classification 8.77
Random Forest94.15 0.980.910.76
Beta regression 0.75 0.920.910.67
Publisher’s Note: MDPI stays neutral with regard to jurisdictional claims in published maps and institutional affiliations.