Abstract
A research study aimed at the extending the means of estimating ISRM (International Society for Rock Mechanics) geomechanical parameters through non-contact methodologies, in the frame of the remote survey of rock masses, is herein presented. It was conducted by coupling UAV-based photogrammetry and Infrared Thermography. Starting from georeferenced UAV surveys and the definition of rock masses’ RGB point clouds, different approaches for the extraction of discontinuity spatial data were herein compared according to the ISRM subjective and objective discontinuity sampling criteria. These were applied to a survey a window and along a scanline, both defined on the dense point clouds, to simulate a field rock mass survey, although carried out on remotely acquired data. Spatial discontinuity data were integrated via the analysis of dense point clouds built from IRT images, which represents a relatively new practice in remote sensing, and the processing of thermograms. Such procedures allowed the qualitative evaluation of the main geomechanical parameters of tested rock masses, such as aperture, persistence and weathering. Moreover, the novel parameters of Thermal-spacing (T-spacing) and Thermal-RQD (T-RQD) are herein introduced in a tentative attempt at extending the application field of IRT to remote rock mass surveys for practical purposes. The achieved results were validated by field campaign, demonstrating that a remote survey of rock masses can be conducted according to the ISRM procedures even on models built by integrating RGB and IRT photogrammetry. In fact, these two technologies are positively complementary and, besides being feasible, are characterized by a relatively quick and non-contact execution. Thanks to the positive and satisfactory results achieved herein, this research contributes to the implementation of the scientific and technical casuistry on the remote survey of rock masses, which is a technical field offering a wide range of applications.
1. Introduction
The use of non-contact remote surveying methodologies is a growing practice in the frame of rock mass characterization. Their usefulness relies on the possibility of surveying wide areas in short times, as well as overcoming field limitations connected to the poor accessibility of some rock mass sectors. Field remote survey methodologies applied to rock masses are enhanced by technological development, which is in turn favored by the increasing scientific casuistry. Among the remote surveying technologies, Unmanned Aerial Vehicles (UAV) systems, originally used for military scopes [1], can be addressed as a reference for photogrammetric applications in rockfall stability studies, e.g., [2,3,4,5]. In fact, UAV photogrammetry integrated with Structure from Motion (SfM) [6], allowing the reconstruction of reliable three-dimensional models of exposed rock mass planes, offers a low-budget, lightweight, time-saving, and user-friendly remote sensing solution [7]. In recent decades, many scholars have tested such non-contact surveying approaches, e.g., [8,9,10,11,12]. Dewez et al. [13] monitored a cliff over time, identifying the detachment points along the rock mass, through the reconstruction of point clouds from both laser scanners and UAV. Tannat [14] focused on the application of photogrammetry-based techniques in the characterization and hazard assessment of rock faces, while Giordan et al. [15] provided a summary of the main goals achieved by the IAEG (International Association for Engineering Geology and the environment) Commission on the topic of the UAV use for engineering geological applications, highlighting the potential of such practices along with the need of a rigorous approach. In fact, the availability of a well georeferenced 3D rock mass model leads to the possibility of extracting the direction of exposed planes, thus providing the basis for a remote structural survey even for block kinematic analyses.
Another non-contact technology that is progressively gaining ground in the remote survey of rock masses is Infrared Thermography (IRT). It exploits the thermal radiation emitted by matter, which travels with wavelengths mainly falling within the Infrared band of the electromagnetic spectrum (0.1–100 µm). The Stefan–Boltzmann law explains that the emissivity of an object is directly proportional to its temperature; therefore, it is possible to estimate its surface temperature by employing specific devices called thermal cameras if the characteristic emissivity value of the framed subject is known [16]. The application of IRT on rock masses returned satisfactory results in detecting open fractures [17], weathered rock sectors [18], the integrity of rock [19], the presence of rock bridges [20] and, more generically, in supporting rock stability studies, e.g., [21,22,23], even in both post-rockfall emergency [24] and underground settings [25]. Pappalardo et al. [26] provided the first attempt to quantify the thermal behavior of a rock mass by introducing the concept of the Cooling Rate Index (CRI), which was correlated to the rock fracturing degree. They found also that there is a relation between the surface temperature offered by discontinuity traces, surveyed at night, and their aperture and persistence, with the highest temperatures found at the most open/persistent cracks. The aspect related to CRI was further investigated by Loche et al. [27] in the field and by Mineo and Pappalardo [28] in the laboratory, who implemented the application of such methodologies.
The integration between the afore-reported remote surveying techniques is the new frontier of rock mass remote surveys. Casagli et al. [29] combined different technologies, including UAV and IRT, for landslide mapping and monitoring, while Frodella et al. [30] used UAV photogrammetry and IRT for the non-destructive survey of a large rupestrian site. Grechi et al. [31] worked on 3D dense point clouds of rock masses built from both RGB and IRT images, highlighting the potential and feasibility of such approaches even in the study of the relation between geomechanical and thermal properties.
In this paper, a step forward in the scientific and technical application of UAV-IRT integrated surveys is presented with the aim of finding a practical utility for the definition of the main geomechanical parameters in qualitative and quantitative discontinuity sampling and description, as suggested by the International Society for Rock Mechanics (ISRM [32]). This could provide key utility either in the surveying of badly accessible rock slopes, or when emergency condition requires non-contact measurements, or in case of projects with low financial availability. In this latter case, the preliminary planning stages could benefit from quick and non-contact surveys, even from the perspective of locating peculiar sectors of features deserving further investigations. For this purpose, UAV-based photogrammetric surveys were carried out at two rock masses, located in northern Sicily (Italy) and chosen as test sites, and georeferenced dense point clouds were built for the extraction of discontinuities. This was carried out according to three different approaches, which were applied to both a survey window and a scanline to reproduce a remote version of random and biased ISRM suggested discontinuity sampling procedures. On the other hand, nighttime IRT surveys were carried out at the same outcrops and thermal dense point clouds were built to analyze the peculiar thermal features of the rock masses related to their geomechanical characteristics. The analysis of thermal point clouds was accompanied by the in-depth processing of key thermograms for the IR-based quantitative estimation of some geomechanical parameters, such as Thermal-spacing (T-spacing) and the Thermal-Rock Quality Designation (T-RQD), which represent a novelty in the international state of the art. Data were then validated by field rock mass surveys and outcomes were compared to better define the reliability of the used approaches.
2. Materials and Methods
The methodology developed in this study was intended as a combined photogrammetric RGB-IRT rock slope modeling method for discontinuity surveying and characterization, which represents a strategic surveying solution for areas affected by a poor field logistics (Figure 1). The experimental procedure reported herein was tested at two rock masses selected as test sites, from now on referred to as RM1 and RM2, located along the Tyrrhenian coastline of Sicily (Italy) in the province of Messina. From the geological point of view, the studied rock masses belong to the Calabria-Peloritani Orogen, an arcuate mountainous belt consisting of a set of south-verging basement nappes and remnants of a Mesozoic–Cenozoic cover sequence [33]. Rock types cropping out along the studied slopes are intensely fractured two-mica marbles and paragneiss, which experienced a heavy tectonic history.
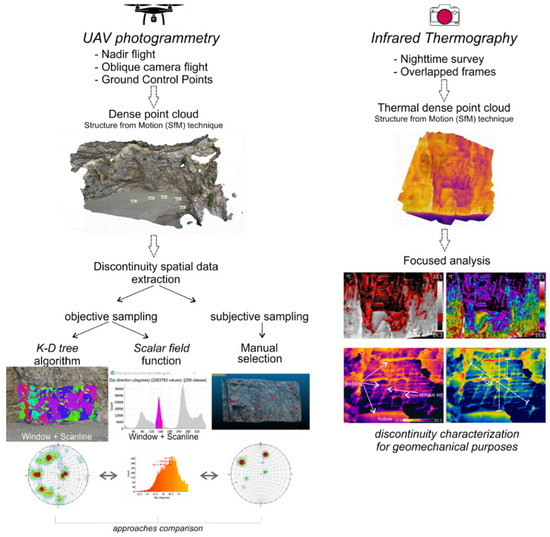
Figure 1.
Conceptual map describing the methodological approach of the research.
Photogrammetric RGB remote surveys were carried out, in daylight condition, using a Parrot Anafi Thermal quadcopter equipped with a digital sensor 1/2.4‘‘ CMOS (active-pixel sensor) and 21 Mpixel with 26 mm focal length for the photogrammetric part. Targets of 50 cm × 50 cm size were placed as Ground Control Points (GCP), homogeneously distributed in the framed area, for a precise GPS localization and two flight plans were set to guarantee an average overlapping of 70% between contiguous frames. The first one was carried out in nadir conditions by aligning the camera axis with the vertical direction, so as to achieve a clear overview of the survey area and related GCPs. The second flight was aimed at performing frontal and oblique shots (45°) to survey both the sub-vertical and inclined (35–50°) rock facets. The acquired images were combined to create dense point clouds by using the SfM technique [34,35], which allows overlapping two-dimensional images acquired from multiple viewpoints to define a three-dimensional model of the framed subject. The RGB point cloud was then analyzed by CloudCompare, which is an open-source 3D point cloud and mesh processing software application with a series of advanced algorithms herein used to extract spatial information of discontinuities. In this paper, such data were extracted according to three different approaches aimed at reproducing the basic ISRM surveying criteria: In the first case, a specific plugin to automatically extract planar facets (e.g., fracture planes) from the point cloud and to classify the facets based on their orientation and orthogonal distance [36] was used. The algorithm it is based on refers to a K-D tree (k-dimensional tree), which is a space-partitioning data structure for organizing points in a k-dimensional space. This algorithm, relying on a least-squares approximation [37], allows the generation of a series of facets defined by a specific dip/dip direction. Such a procedure was carried out to extract discontinuity spatial data both within a survey window and along a scanline, according to the objective ISRM sampling criterion. Similarly, the second approach used herein is based on the discontinuity extraction by the “scalar field” function owned by the CloudCompare code. In particular, a scalar field is a set of values associated with a point (or vertex), which can be displayed by a custom color ramp. For this study, the dip/dip direction value was considered as a scalar field, with the aim of achieving a color ramp-based rock mass model, where the groups of planes with comparable orientations in space were labeled with the same color. By plotting the count of the extracted dip directions on a two-variable diagram, a series of peaks could be identified between 0 and 360 degrees (Figure 1). These represented the range of the most occurring dip direction values along the surveyed rock face (both window and scanline). The third approach was considered as a subjective ISRM remote rock mass survey criterion, carried out by exploiting the precise point cloud georeferencing and manually selecting the most exposed discontinuity planes. The corresponding dip/dip direction was noted to compile a final stereogram (in a similar way to what is undertaken during a traditional subjective ISRM rock mass field survey).
IRT surveys were carried out at the same test rock masses using a 320 × 240-pixel thermal camera operating within a −20–650 °C temperature range (with ±2 °C accuracy). Thermography campaigns were performed after sunset, which proved the best time of the day for the discontinuity IR characterization [23]. In fact, under such ambient conditions, the disturbing effects of parasite radiation are low. Images were taken, in autofocus mode, from a short distance (2 to 5 m) both to gain the best thermal detail of the rock face and to reduce uncertainty in the measurement because of the atmospheric absorption. A certain rate of overlapping between adjacent thermograms, so as to make the generation of a thermal point cloud feasible, was ensured. More specifically, this was built according to the same procedure used for RGB images and the result was a thermal 3D mesh of the framed rock masses (Figure 1). The emissivity was set to 0.93 according to previous accounts in the literature, e.g., [24,38], and it was regarded as a representative value of the whole rock face, where elements affected by different emissivity values may have occurred (e.g., bare rock, vegetation, debris, weathering film, wet/dry sectors). With specific reference to this point, emissivity is known to be one of the main sources of uncertainty in infrared thermal imaging, especially when quantitative measurements are requested, e.g., [39,40,41,42,43]. In this specific case, the application of IRT was aimed at a qualitative approach, which made it possible to reasonably overlook this aspect. The analysis of thermal point clouds presented herein allowed detecting peculiar geomechanical features related to the most visible discontinuity sets. Based on such thermal information, a focused analysis of key post-processed thermograms was carried out to analyze, in detail, some specific geomechanical parameters related to the rock mass fracturing.
Finally, the obtained UAV and IRT remote data were compared to define a remote geomechanical characterization of selected rock masses and the goodness of the data was verified through field rock mass surveys performed at the test sites according to the ISRM [32].
3. Results
3.1. UAV Photogrammetry
The SfM technique, applied to the selected RM1 and RM2 rock masses, returned two scattered point clouds with 21,225 points and 52,594 points, respectively. The optimization of the cloud, by reporting the GCP field arrangement, allowed the minimization of the reprojection error and the generation of two dense point clouds made up of about 19 mln points and 45 mln points for RM1 and RM2, respectively (Figure 2). The final triangular mesh returned the three-dimensional model of the rock mass, which represents the basis for this kind of scientific–technical approach. In particular, the RM1 dense point cloud (Figure 2) shows a reliable reproduction of the field setting, with the surveyed rock mass located within close proximity of a bare rock tunnel mouth (Figure 2), and thus, is partly hollowed with respect to the whole rock slope. The preponderant discontinuity system occurring along the rock face is clearly visible, along with the intense degree of fracturing. The RM2 point cloud (Figure 2) adequately represents the field setting of the surveyed rock mass, with a hollow sector located in the central portion and some exposed planes. A sub-vertical fracture, cutting the whole rock face height, occurs at the southern portion of the point cloud.
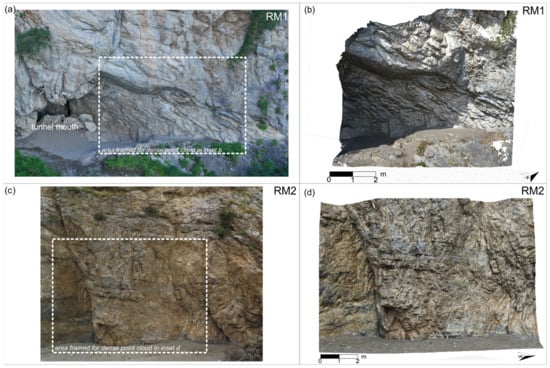
Figure 2.
(a) Photo of RM1 rock wall with indication of the area framed for the dense point cloud construction; (b) dense point cloud built by SfM for RM1; (c) photo of RM2 rock wall with indication of the area framed for the dense point cloud construction; (d) dense point cloud built by SfM for RM2.
3.2. IRSM Discontinuity Sampling from Dense Point Cloud
The standards defined by the ISRM commission on the standardization of laboratory and field testing constitute the reference for the quantitative description of discontinuities in rock masses, the sampling philosophy of which relies on two basic levels. There is a subjective (biased) surveying approach, which is aimed at the sampling of those discontinuities considered important, and the objective (random) survey, focused on the description of all the discontinuities intersecting a fixed line or area of rock exposure. The ISRM specifications [32] report that the objective approach suffers from the major disadvantage that it is time consuming, while the subjective criterion is best applied where the structural setting of the rock mass is well definable. Nevertheless, both approaches have been proven to identify key field activity for rock mass characterization, as well as being the most reliable tools to achieve a complete knowledge of the geomechanical attitude of rock masses. In the frame of technological and scientific development, these two approaches were herein applied to remotely surveyed data and discontinuity spatial data were extracted both automatically, according to the random ISRM criterion, and manually, referring to a remote objective survey.
3.2.1. Objective Discontinuity Survey through the K-D Tree Algorithm
According to the methodology described above, discontinuity data were herein automatically extracted by considering all the discontinuities intersecting either an area of the rock face (window) or a fixed line (scanline). In the first case, a segmentation area of the point cloud was set to resemble a survey window (5.5 × 3.0 m at RM1 and 9.0 × 5.0 m at RM2). In the second one, the segmentation area height was narrowed for a realistic approximation to a scanline. With reference to this latter aspect, we considered a reasonable rock mass band (15 cm) above and below the hypothetical scanline, which was the likely reference rock mass portion during a field survey of discontinuities along a line. Recognized planes were treated as polygons by considering a ±30° tolerance span referring to their orientation in space. This choice arose from the intense fracturing affecting the selected rock masses, and enabled good reliability of the data.
With respect to RM1, 426 poles were extracted from the point cloud and plotted on a stereogram, where the statistical contouring highlights the presence of multiple concentration spots (Figure 3a). Considering the survey window, due to the great data scattering, discontinuity sets were defined according to a contour calculation performed by taking into account a Count Circle Size of 1% of the surface area of the lower reference hemisphere. Discontinuity sets were recognized at pole concentration areas greater than 3.3%, resulting in seven clusters (Table 1). Each cluster was indicated with a progressive number for an easier identification throughout the manuscript. On the other hand, scanline outcomes were characterized by a lower number of poles (75) whose contouring allowed the definition of five average sets according to the previous criterion. Based on the comparison of both stereograms, a good match between five of the seven sets is outlined, although sets 1 and 3 are missing among the scanline plot. This is because the number of poles belonging to such sets, compared to the total number of surveyed ones, is not significant enough to allow their recognition as sets.
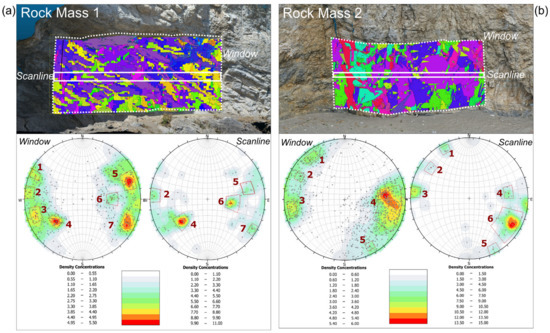
Figure 3.
Outcomes of the discontinuity extraction by K-D tree algorithm according to both a surveying window and a scanline at RM1 (a) and RM2 (b).

Table 1.
List of the discontinuity sets extracted by K-D tree algorithm through both survey window and scanline; n.a. is reported when the corresponding discontinuity set was not detected.
At RM2, the data extracted from window are represented by 783 poles, which can be grouped into five systems based on the density pole concentration being greater than 2.4% (Figure 3b). More specifically, it was found that there is a wide pole concentration area spanning from 58/254 to 85/304, which was herein considered as a single system affected by a relevant geometrical variability. On the other hand, the corresponding scanline stereogram returned 44 poles which, despite their lower number, could be grouped into six discontinuity families. This consideration arose from the presence of two different contour spots, which allowed the differentiation of set number 4, which was previously found, into two separate families (4 and 6).
3.2.2. Objective Discontinuity Survey through the Scalar Field Function
The discontinuity extraction through the scalar field function relies on the ability of the open source CloudCompare software to exploit the properties of scalar fields. As for the previous approach, the analysis presented herein was performed on both a segmented measurement window and along a scanline fixed on the dense point cloud, where the previously generated normal vectors were converted to the Scalar Field Dip direction (0–360°) view. Outcomes were returned in the form of a histogram showing the distribution of a selected entity. In this case, the analysis was primarily focused on the “dip direction” entity, plotted on the histogram with respect to the count within the selected survey area on the point cloud. Each peak corresponds to recurring dip directions, likely belonging to one or more discontinuity sets. Such outcomes allowed a quick identification of the number of families and of the related scattering. Once the most representative dip direction values were selected for each peak (the selection could be based on either the mean or the modal value, depending on the data distribution), the statistical distribution of the corresponding angle of dip could be obtained on a second histogram, so as to complete the spatial geostructural rock mass characterization.
In the RM1 case, the dip direction histogram resulting from the window extraction (Figure 4a) returned 6 main peaks with a count of between 10 k and 60 k (Figure 4b). It must be stressed that although some peaks were evident, others needed to be selected after a reasoned analysis of the point cloud where planes were colored according to their direction. Representative dip values were selected on the corresponding histogram and the main discontinuity sets were therefore identified (Table 2). For simplicity, such sets were named according to previously outlined data (Table 1) in an attempt to uniquely identify the surveyed discontinuity families, as well as for an easier reading of this paper. The peak referring to set 6 was preponderant, followed by sets 7 and 4. The remaining three smaller peaks were selected according to the corresponding evidence on the point cloud (Figure 4a), suggesting a certain recurrence of selected dip directions, although with a lower concentration. For each peak, the distribution of frequency of dip angle values was analyzed and the most representative dip was chosen for each set (Figure 4b). With reference to the scanline extraction (Figure 4c), the dip direction frequency histogram is comparable to the previous one, although with a lower count of values. Peak 4 is more evident, while set 5 is represented by two consecutive peaks covering a dip direction variability range of about ±15° (Figure 4d, Table 2).
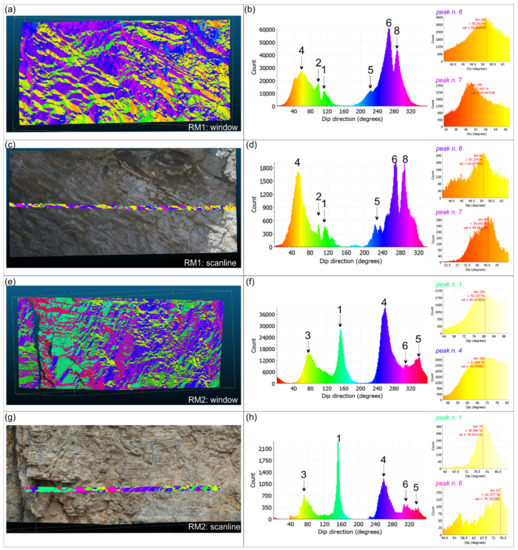
Figure 4.
Outcomes of the discontinuity extraction by the scalar field approach. (a) Extraction window at RM1; (b) frequency histogram of dip direction data with two examples of dip angle frequency distribution for selected peaks of RM1; (c) extraction scanline along RM1; (d) frequency histogram of dip direction data with two examples of dip angle frequency distribution for selected peaks of RM1; (e) extraction window at RM2; (f) frequency histogram of dip direction data with two examples of dip angle frequency distribution for selected peaks of RM2; (g) extraction scanline along RM1; (h) frequency histogram of dip direction data with two examples of dip angle frequency distribution for selected peaks of RM1.
Table 2.
List of the discontinuity sets extracted by the scalar field approach through both survey window and scanline; n.a. is reported when the corresponding discontinuity set was not detected.
At the RM2 survey window (Figure 4e), 5 main peaks with a dip direction count ranging between 10 k and 39 k can be identified (Figure 4f). Peaks belonging to sets 4 and 1 suggest the predominant recurrence of such sets, while there is a gap in the dip direction data between 200 and 220. The scanline data (Figure 4g) are comparable, with a relatively lower count, and suggest the preponderance of set 1 (Figure 4h).
3.2.3. Subjective Discontinuity Sampling from Dense Point Cloud
In this section, discontinuity sampling from the dense point cloud is outlined, which was conducted with the aim of reproducing the subjective surveying criterion, suggested by the ISRM [32], from remotely sensed data. This biased approach is based on the survey of those discontinuities considered relevant in the frame of the rock mass geomechanical setting. For this study, the discontinuity choice was operated directly on the georeferenced point clouds and measurements were performed through the “Compass” plug-in offered by the CloudCompare software. It is a structural geology toolbox for the interpretation and analysis of virtual outcrop models. The tool allows the measurement orientations of well-exposed planar geometries; a point in the virtual outcrop model is chosen with a mouse click, and a plane is fitted to all points lying within a red circle (using least squares), providing an estimate of orientation (dip/dip direction) [44].
At the RM1 point cloud, 89 poles were selected (Figure 5a) and plotted on a stereogram (Figure 5b) to analyze their statistical contouring. In particular, six discontinuity sets were found by considering a density pole concentration greater than 4.5% (Table 3).
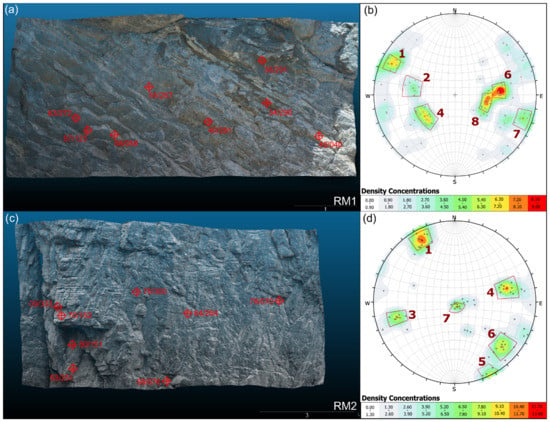
Figure 5.
Biased discontinuity survey from dense point clouds of RM1 (a) and related stereogram (b), RM2 (c) and related stereogram (d).
Table 3.
List of discontinuity sets extracted according to the biased ISRM criterion.
3.3. Rock Mass Characterization from Thermal Dense Point Cloud
The SfM technique was also applied to generate dense point clouds from combinations of IRT images acquired by terrestrial surveys. The resulting thermal point clouds are composed of 77,296 and 56,719 points with respect to RM1 and RM2, respectively, providing a reliable three-dimensional IRT model of the studied rock masses.
With reference to RM1, the daily shadowed prevailing condition led to a low heating of the rock mass, resulting in a poorly detailed IR outcome even though the point clouds were built from nighttime thermal images. The surface temperatures ranged between 17 °C and 22 °C and the generated thermal point cloud made it possible to recognize the morphological setting of the rock face, characterized by a relevant irregularity due to the intense fracturing. Hollow rock face portions were labeled by the highest surface temperatures (19–20 °C), according to previous accounts in the literature [24,26], while exposed sectors were affected by negative thermal anomalies (17–18 °C). The most evident linear anomalies were related to the main discontinuity sets, which locally intersected, giving rise to unstable kinematic patterns. Not by chance, the most evident intersection defined one of the hollowest rock mass portion, which was a bare dip-slope plane (Figure 6a). By analyzing the thermal cloud from a lateral perspective, it can be highlighted that the anomalies related to the main discontinuity set occurred at linear protruding rock mass portions, thus strengthening the hypothesis that thermal contrasts are influenced by the rock mass morphology at the preponderant discontinuity traces (Figure 6b).
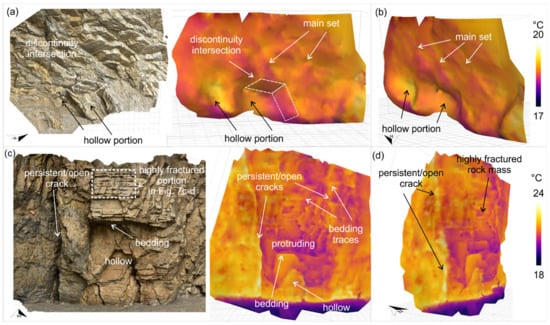
Figure 6.
Thermal point clouds generated from overlapped thermograms: (a) frontal view of both point clouds (RGB and IRT) belonging to RM1 with the main elements highlighted; (b) lateral view of the thermal point cloud belonging to RM1; (c) frontal view of both point clouds (RGB and IRT) belonging to RM2 with the main elements highlighted; (d) lateral view of the thermal point cloud belonging to RM2.
The RM2 thermal point cloud, characterized by its greater detail, shows the contrast occurring between the protruding rock mass sector (lower surface temperatures of around 21 °C) and the hollow portion below it (higher surface temperatures between 22.5 and 23 °C) (Figure 6a). Such hollow portions represent a past rock detachment zone, which likely occurred through a free fall movement due to the presence of sub-horizontal bedding planes. The top of such cavity is, indeed, a horizontal plane, whose recurrence along the rock face is labeled by positive linear anomalies (average surface temperature of 22.5 °C) occurring within the colder protruding rock mass (Figure 6a). Furthermore, the highest surface temperature of 23.5–24 °C was found to be related to a sub-vertical anomaly crossing the whole rock mass height and representing a persistent and open fracture likely belonging to a regional set (Figure 6b). The high persistence and opening rate can be assumed based on such thermal intensity, according to the considerations made by Pappalardo et al. [26] in relation to a similarly intensely jointed rock mass. Finally, the lowest surface temperature (around 18 °C) was found for the ground surface at the foot of the slope, which can be neglected herein.
3.4. Analysis of Thermograms
In order to shed light on such thermal features, some key thermograms were selected and processed by using the FlirTools software to analyze specific ranges of temperatures. With respect to the RM1 thermogram, by narrowing the surface temperature range within the 19.5–18.3 °C interval, the best contrast was achieved between hollow rock mass portions and bare planes (Figure 7a). More specifically, the hollow sectors originated from the detachment of parallelepiped rock volumes, leaving an exposed dip-slope sliding plane, for simplicity referred to as plane “a”, which is upstream bounded by the intersection of the two discontinuity sets (herein called “b” and “c”) already identified in the thermal point cloud. This geometry is redundant along the framed slope, where the bare sliding plane “a” can be identified by lower surface temperatures (18.3–18.5 °C) due to its exposition to the external environment and the presence of a weathering film. This latter element is labeled by surface temperatures falling outside the lower boundary of the temperature range considered herein. Plane “a” represents the exposed expression of a highly persistent discontinuity set, as testified by the linear anomalies crossing the rock mass, which correspond to its traces. This result is useful in terms of recognizing the most recurrent kinematic features affecting the rock mass, which potentially represent the main instability features in this case, as well as in identifying source areas of past detachment rock volumes.
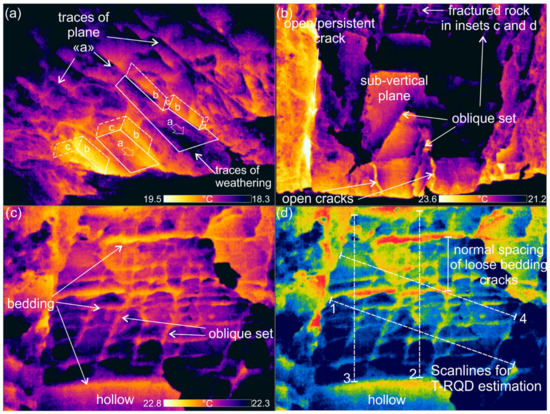
In the post-processed thermogram belonging to RM2 (Figure 7b), filtered so as to emphasize the positive anomalies (surface temperature range 21.2–23.6 °C), the highest surface temperatures were found to be related to the sub-vertical open and persistent crack, which was already highlighted in the thermal point cloud. It is characterized by surface temperatures falling out of the upper boundary of the temperature range considered herein (23.5–24 °C), but this processing choice was useful to better highlight other open cracks, which were not clearly visible in the thermal cloud. This is the value added in this case, as the fractures occurring at the foot of the rock mass, within the main hollow sector, are labeled by positive linear anomalies, supporting the previous accounts of discontinuous thermal outcomes given in the literature ([23] and references therein). In this case, open cracks are characterized by a thermal output within the 22.8–23.2 °C surface temperature range, slightly lower than the most open subvertical crack, but certainly greater than the surrounding rock face. Furthermore, an inclined discontinuity set is outlined both within the hollow and in the uppermost rock mass portion, thanks to the thermal contrast that occurred when it intersected sub-vertical planes that were likely parallel to the slope face. By focusing the analysis on the intensely fractured rock mass portion above the hollow sector with a surface temperature range constrained between 22.3 °C and 22.8 °C (Figure 7c), the fracture net was found to be highlighted by positive anomalies retracing the discontinuities. Higher temperatures (22.6–22.8 °C) were found at the most opened/loose cracks. The bedding set appears to be a key feature for the rock mass stability, especially if considered in conjunction with both the oblique and slope parallel sets. This consideration paves the way to a further interesting application of IRT on rock mass, related to the possibility of estimating not only the normal spacing of discontinuity sets, but also the normal spacing between two discontinuities of the same system, which show the highest surface temperature (i.e., bordering the loosest rock mass portion) (Figure 7d). This provides a useful tool for the approximate estimation of specific, potentially unstable, rock mass areas, which cannot be easily evaluated in field through traditional rock mass surveys, especially if the studied sector is not directly accessible. In this case, a spacing value could be estimated by the identification of thermal anomalies, which were in turn related to the IR-visible discontinuities, and it is herein referred to as Thermal-spacing (T-spacing). For example, at RM2m, the average normal T-spacing of the bedding set was 8.3 cm. Similarly, the normal T-spacing of set 4 was 15.2 cm. Moreover, by considering the most intense thermal anomalies, the normal T-spacing of the bedding discontinuities offering the highest surface temperatures (most open) was from 33 to 55 cm, allowing the recognition of the most likely volume that is about to fail.
Based on this criterion, an estimation of the Rock Quality Designation (RQD) value [45] could be carried out by scaling the thermal image acquired from a frontal perspective (Figure 7d). By setting two scanlines along the thermal frame, each one normal to a discontinuity set, the Thermal-RQD (T-RQD) value could be estimated by counting the rock mass elementary blocks with lengths of greater than 10 cm, measured along the scanline, divided by the scanline length. In this case, at RM2, T-RQD was between 21 and 24% along the vertical scanlines and between 11 and 49% along the oblique ones running at differently fractured rock mass portions. Such values suggest geomechanical quality ranging from “very poor” to “poor” according to the classification proposed by Palmstrom [46].
4. Data Validation and Comparison
The data obtained using the two remote surveying approaches are herein matched and validated by field data surveyed at the same rock masses. Starting from the comparison between discontinuous geometrical data extraction from RGB dense point clouds (Figure 8), it can be asserted that the three extraction approaches basically achieved similar outcomes, although with some differences, which are consistent with verified field data. At RM-1, for example, the main discrepancy was found for set 3, which was detected only by the K-D three approach along scanline. Set 8 could not be defined by such a method due to the low statistical contour (Figure 3a), while set 7 was missing at the Scalar Field. On the other hand, only a low number of poles likely belonging to set 5 was detected during validation, probably due to a lower number of sampled discontinuities. Field validation also allowed the verification of the goodness of the IRT data, with specific reference to the polygonal geometry arising from the intersection of discontinuities and the presence of a weathering film on such well exposed discontinuity planes, already hypothesized by the IRT post-processed thermogram.
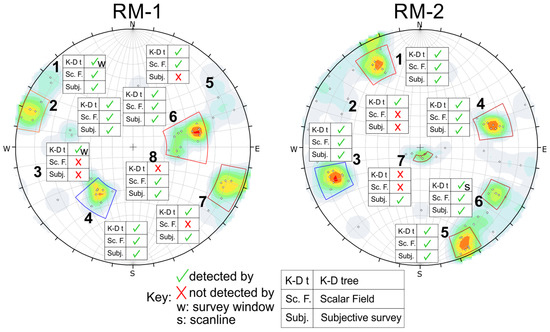
Figure 8.
Field validation stereogram for the surveyed rock masses, with an overlapping schematic summary of the match with the remote discontinuity extraction approaches.
At RM-2, a good match between the applied approaches for discontinuity spatial data extraction is outlined, except for sets 2 and 7. This latter set is a key one, because it represents the bedding arrangement of the rock mass and its presence is evident even to the naked eye. Nevertheless, there is a lack of exposed bedding planes along the outcrop and this is the likely reason for its poor detection by automatic extraction approaches. On the other hand, it was well detected by IRT, which also allowed the recognition, from a qualitative point of view, of its degree of aperture at the most jointed rock mass sector. Field validation surveys confirmed the interpretations derived from the IRT images with respect to both the aperture and persistence of the considered discontinuities. More specifically, the high persistence (>10 m) of the sub-vertical fracture labeled by the highest surface temperature was verified along with its centimetric aperture.
5. Discussion
5.1. Discontinuity Orientation
According to the previous section, it is herein demonstrated that the extraction of discontinuity data from RGB point cloud returns satisfactory outcomes in terms of field reliability. This is the first aspect to discuss as the discontinuity direction sampling is the basis of the geostructural survey of rock masses. The results achieved herein are consistent with the data in the literature, e.g., [15,47,48,49], proving that the technological development allows the study of the structural setting of rock masses through non-contact methodologies. This aspect gains significance in the frame of surveys carried out either in areas characterized by a bad logistics, or when quick and safe operations are requested. In both of the automatic extraction methodologies applied for this research, the scanline data were poorer in terms of the number of poles, although this should not necessarily be framed as a disadvantage. In fact, the lower number of poles also implies a lower number of random ones, thus allowing an easier statistical contouring and set definition. On the other hand, data extraction from a window, covering a wider rock mass surface, was found to provide a good alternative for detecting some non-uniform cropping-out geometries, which could be missed by the intersection of a scanline. This led to a more complete geostructural dataset. In any case, both K-D three and the Scalar Field, despite providing an automatic extraction of spatial data, need the contribution of an operator to group poles in discontinuity sets, thus resulting in a certain degree of subjectivity. Therefore, although the orientation extraction is automatic, such procedures should be regarded as semi-automatic.
Moreover, even if the main contribution for discontinuity extraction is given by georeferenced photogrammetry, the automatic sampling is not selective. This is a limitation, as it leads to the presence of a relevant rate of random poles, bringing disorder and lowering the statistical significance of potential sets. This was, for instance, the case for the bedding set (set 7) at RM-2, whose poles were mingled with other random poles due to the low occurrence of representing planes in the RGB point cloud (only a few planes were clearly exposed). This set was indeed well identified by the biased remote survey, where the operator could select its representative planes once they were located on the point cloud. In this specific case, IRT analysis can be useful to find some key planes and to suggest the presence of low-recurring ones according to the thermal contrasts between discontinuities and intact rock.
5.2. Aperture and Persistence
A qualitative indication of persistence and aperture can be provided by IRT applied to a fractured rock mass thanks to the different surface temperatures shown by discontinuity traces. It was proven by Pappalardo et al. [26] that open and persistent discontinuities, surveyed on a rock mass in dark conditions, offer higher surface temperatures than others. This is likely because cracks represent a preferential means of heat dissipation from the inner rock mass considering that intact rock is a bad heat conductor [50]. Such phenomena were also observed on heated porous rock specimens in the laboratory, where greater and/or more interconnected (persistent) voids were labeled by the highest surface temperatures if observed by a thermal camera [51]. These scientific outcomes suggest the potential of IRT in estimating, at least qualitatively, the persistence and aperture degree of a discontinuity. Nevertheless, positive thermal anomalies are not always related to the afore mentioned geomechanical parameters, as hollow rock mass portions behave similarly from the infrared thermal point of view. This was the case of RM-1, where the highest surface temperatures were found at the hollow sectors located at the intersection between the a, b and c planes (Figure 7a). On the other hand, at RM-2, the sub-vertical fracture occurring at the left side of the rock mass (Figure 7b) was retraced by the strongest positive thermal anomaly, suggesting a relevant degree of aperture and persistence. Field data validation confirmed that this fracture was affected by a decimetric aperture and had a persistence greater than 10 m. Further positive thermal anomalies indicated secondary open cracks located at the foot of the cliff, while a detailed analysis of the most fractured rock mass section highlighted a dissimilar condition in the rock fracturing, allowing the loosest rock mass portions identified to be regarded as the rock volumes that potentially caused the incipient failure.
5.3. Spacing and RQD
Once the dense point cloud is georeferenced and scaled, some linear measurements can be performed along it. This allows the possibility of achieving a reliable spacing measure between discontinuities, e.g., [9,52]. In this study, such a procedure was tested on the RGB point cloud and also extended to the acquired thermal images, where the positive linear anomalies retraced the most open and persistent discontinuities. These could be initially observed in the thermal dense point cloud and then could be analyzed in depth on specific thermograms. In fact, starting from the fact that thermal point clouds were made by unprocessed thermal images, automatically scaled to the same temperature range for a uniform merging, their use was preparatory for the post-processing stage of the images, as they allowed the recognition of peculiar features that should be analyzed in specific thermograms.
In this case, by scaling a frontal IRT image of the rock mass and processing it to achieve a satisfactory visual of the main intersecting sets, their spacing could be evaluated. In this paper, this is referred to as Thermal-spacing (T-spacing) and it represents a scientific novelty in the international state of the art, although a similar application was provided in [53], which evaluated the potential enlargement area of unstable wedge along carbonate rock masses. The T-spacing is indeed the measure between two linear thermal anomalies retracing adjacent discontinuities, which are characterized by an IR-perceptible aperture. It must be underlined that, indeed, this geomechanical parameter measured by IRT is related to the most evident discontinuity traces (those that are the most open, persistent and/or exposed). Their normal T-spacing could, therefore, be measured by considering the perpendicular distance between two adjacent linear anomalies retracing discontinuities (Figure 7) and could be compared to the same measurements taken along the RGB point cloud. In this case, for example, the average T-spacing of set 7 at RM-2 was 6.5 cm, while the corresponding RGB average normal spacing was 4.8 cm. Similarly, the average normal T-spacing of set 4 was 16 cm against 15 cm measured on the RGB point cloud. This slight difference likely arose from the different resolution of the two slope models, with the best accuracy related to the RGB point cloud, where even the closest/smallest cracks could be detected. Nevertheless, acquired measures are well comparable in the frame of a geomechanical remote analysis. In this perspective, the T-spacing can be regarded as a parameter related to those discontinuities playing a key role in the rock mass geomechanical quality. Moreover, the potential of this parameter evaluated by IRT is the adjunct possibility of locating only the most open/loose cracks within a set, if necessary, which are likely labeled by the highest surface temperatures. In this case, the measure of their T-spacing (Figure 7) would allow the evaluation of the extension of the loosest rock material to be regarded as indicating unstable rock mass portions. Such considerations pave the way to further innovative hints proposed by this research, such as the possibility to estimate the Thermal-RQD (T-RQD) by taking into account the positive thermal anomalies characterizing the thermogram. Numerical tests carried out at the RM-2 returned comparable values between T-RQD and RQD measured on the RGB point cloud (Table 4), with couples of values affected by a slight differences likely occurring due to the afore-reported resolution difference between the RGB and IRT models. This is a relevant outcome as it suggests the possibility of introducing the IRT technique even in the geomechanical classification of rock masses. However, this application is strongly linked to a good thermal outcome, i.e., a thermal image offering a suitable contrast between discontinuities and intact rock. According to some experiences, such a condition can be achieved by surveys carried out in dark conditions, when the contribution of parasite radiation is minimal. This consideration strengthens what [26] stated after having monitored the cooling behavior of some rock masses over time.
Table 4.
Comparison between T-RQD and RGB-RQD data. The scanline n# refers to Figure 7d.
5.4. Weathering and Hydraulic Conditions
From the analysis of thermograms, information of rock weathering and hydraulic conditions along discontinuities can be achieved. This is possible thanks to the different thermal behaviors of weathered or wet rock portions if compared to the intact rock. Mineo at al. [18] highlighted that weathered rocks tend to absorb a certain rate of moisture from the external environment, thus gaining a lower surface temperature than the surrounding rock mass. Similarly, wet rock portions can be easily detected by IRT according to several other experiences not necessarily referring to rock masses or engineering geology, e.g., [54,55]. According to such considerations, the thermal images analyzed herein can return some information on the presence of weathering along some exposed discontinuity planes characterized by lower surface temperatures. This is a further useful hint in the Infrared survey of rock masses, especially in the frame of reflecting international standards for the geomechanical characterization of rock outcrops.
6. Conclusions
In this paper, the combined approach of UAV-based photogrammetry and terrestrial Infrared Thermography was presented as an innovative remote surveying tool for rock mass characterization. The main goal of the research was to provide a remote solution to the classical rock mass survey carried out according to the ISRM guidelines, which could be useful in the context of developing remote sensing solutions. Starting from the application of the ISRM surveying criterion for discontinuity sampling, a remote survey of rock mass was carried out at two test sites by producing detailed dense point clouds from the combination of both RGB and IRT images that were properly acquired and georeferenced. The analysis of RGB point clouds allowed the obtaining of information on the geostructural setting of the rock masses, with the definition of the main discontinuity sets’ spatial orientations. In this frame, the comparison between different data extraction approaches, herein employed as both objective and subjective ISRM sampling criteria, returned satisfactory results in terms of reliability, further strengthened by field validation. The analysis of IRT point clouds allowed the identification of the main thermal anomalies occurring along the studied rock mass, which were related to the specific geomechanical setting. Accompanied by a focused analysis of post-processed IRT images, the thermal analysis of rock masses allowed the qualitative evaluation of some ISRM geomechanical parameters, such as the aperture and persistence of discontinuities, as well as the presence of weathering. Moreover, the thermal analysis of fractured rock mass portions paves the way to a novel practice in the evaluation of the spacing and RQD parameters. In fact, based on the thermal anomalies offered by discontinuities, the Thermal-spacing (T-spacing) and the Thermal-RQD (T-RQD) were introduced herein as new pioneering parameters that can be evaluated when dealing with rock mass thermal analysis. The thermal results were consistent with those achieved both in field and on the RGB point cloud, thus paving the way towards new frontiers for the application of IRT in remote rock mass surveys. In conclusion, the presented outcomes demonstrate the potential of integrating RGB and IRT remote surveying methodologies, thanks to the complementary information that can be achieved. This combined methodology proved suitable for remote rock mass surveys based on the international ISRM standards, thus suggesting the need of further studies to test the applicability of such procedures on different rock masses and in different geological and environmental settings.
Author Contributions
Conceptualization, methodology and writing: S.M., D.C. and G.P.; software, data analysis: S.M. and D.C.; supervision: S.M and G.P.; funding acquisition: G.P. All authors have read and agreed to the published version of the manuscript.
Funding
This research was financially supported by University of Catania, “CH2V—Cultural Heritage Hazard and Vulnerability” project, Linea 2- PIACERI, funds granted to Giovanna Pappalardo.
Conflicts of Interest
The authors declare no conflict of interest.
References
- Glade, D. Unmanned Aerial Vehicles: Implications for Military Operations; Air University Maxwell Air Force Base: Montgomery, AL, USA, 2000. [Google Scholar]
- Gigli, G.; Casagli, N. Semi-Automatic Extraction of Rock Mass Structural Data from High Resolution LIDAR Point Clouds. Int. J. Rock Mech. Min. Sci. 2011, 48, 187–198. [Google Scholar] [CrossRef]
- Salvini, R.; Mastrorocco, G.; Seddaiu, M.; Rossi, D.; Vanneschi, C. The Use of an Unmanned Aerial Vehicle for Fracture Mapping within a Marble Quarry (Carrara, Italy): Photogrammetry and Discrete Fracture Network Modelling. Geomat. Nat. Hazards Risk 2017, 8, 34–52. [Google Scholar] [CrossRef]
- Rodriguez, J.; Macciotta, R.; Hendry, M.T.; Roustaei, M.; Gräpel, C.; Skirrow, R. UAVs for Monitoring, Investigation, and Mitigation Design of a Rock Slope with Multiple Failure Mechanisms—A Case Study. Landslides 2020, 17, 2027–2040. [Google Scholar] [CrossRef]
- Mineo, S.; Pappalardo, G.; Onorato, S. Geomechanical Characterization of a Rock Cliff Hosting a Cultural Heritage through Ground and UAV Rock Mass Surveys for Its Sustainable Fruition. Sustainability 2021, 13, 924. [Google Scholar] [CrossRef]
- Westoby, M.J.; Brasington, J.; Glasser, N.F.; Hambrey, M.J.; Reynolds, J.M. ‘Structure-from-Motion’ Photogrammetry: A Low-Cost, Effective Tool for Geoscience Applications. Geomorphology 2012, 179, 300–314. [Google Scholar] [CrossRef] [Green Version]
- Kong, D.; Saroglou, C.; Wu, F.; Sha, P.; Li, B. Development and Application of UAV-SfM Photogrammetry for Quantitative Characterization of Rock Mass Discontinuities. Int. J. Rock Mech. Min. Sci. 2021, 141, 104729. [Google Scholar] [CrossRef]
- Sturzenegger, M.; Stead, D. Close-Range Terrestrial Digital Photogrammetry and Terrestrial Laser Scanning for Discontinuity Characterization on Rock Cuts. Eng. Geol. 2009, 106, 163–182. [Google Scholar] [CrossRef]
- Assali, P.; Grussenmeyer, P.; Villemin, T.; Pollet, N.; Viguier, F. Surveying and Modeling of Rock Discontinuities by Terrestrial Laser Scanning and Photogrammetry: Semi-Automatic Approaches for Linear Outcrop Inspection. J. Struct. Geol. 2014, 66, 102–114. [Google Scholar] [CrossRef]
- Buyer, A.; Aichinger, S.; Schubert, W. Applying Photogrammetry and Semi-Automated Joint Mapping for Rock Mass Characterization. Eng. Geol. 2020, 264, 105332. [Google Scholar] [CrossRef]
- Stead, D.; Donati, D.; Wolter, A.; Sturzenegger, M. Application of Remote Sensing to the Investigation of Rock Slopes: Experience Gained and Lessons Learned. IJGI 2019, 8, 296. [Google Scholar] [CrossRef] [Green Version]
- Riquelme, A.J.; Abellán, A.; Tomás, R.; Jaboyedoff, M. A New Approach for Semi-Automatic Rock Mass Joints Recognition from 3D Point Clouds. Comput. Geosci. 2014, 68, 38–52. [Google Scholar] [CrossRef] [Green Version]
- Dewez, T.J.B.; Leroux, J.; Morelli, S. Cliff Collapse Hazard from Repeated Multicopter Uav Acquisitions: Return on Experience. Int. Arch. Photogramm. Remote Sens. Spat. Inf. Sci. 2016, XLI-B5, 805–811. [Google Scholar] [CrossRef] [Green Version]
- Tannant, D. Review of Photogrammetry-Based Techniques for Characterization and Hazard Assessment of Rock Faces. Int. J. Georesources Environ. 2015, 1, 76–87. [Google Scholar] [CrossRef] [Green Version]
- Giordan, D.; Adams, M.S.; Aicardi, I.; Alicandro, M.; Allasia, P.; Baldo, M.; De Berardinis, P.; Dominici, D.; Godone, D.; Hobbs, P.; et al. The Use of Unmanned Aerial Vehicles (UAVs) for Engineering Geology Applications. Bull. Eng. Geol. Environ. 2020, 79, 3437–3481. [Google Scholar] [CrossRef] [Green Version]
- Mineo, S.; Pappalardo, G. Rock Emissivity Measurement for Infrared Thermography Engineering Geological Applications. Appl. Sci. 2021, 11, 3773. [Google Scholar] [CrossRef]
- Baroň, I.; Bečkovský, D.; Míča, L. Application of Infrared Thermography for Mapping Open Fractures in Deep-Seated Rockslides and Unstable Cliffs. Landslides 2014, 11, 15–27. [Google Scholar] [CrossRef]
- Mineo, S.; Pappalardo, G.; Rapisarda, F.; Cubito, A.; Di Maria, G. Integrated Geostructural, Seismic and Infrared Thermography Surveys for the Study of an Unstable Rock Slope in the Peloritani Chain (NE Sicily). Eng. Geol. 2015, 195, 225–235. [Google Scholar] [CrossRef]
- Wu, J.-H.; Lin, H.-M.; Lee, D.-H.; Fang, S.-C. Integrity Assessment of Rock Mass behind the Shotcreted Slope Using Thermography. Eng. Geol. 2005, 80, 164–173. [Google Scholar] [CrossRef]
- Guerin, A.; Jaboyedoff, M.; Collins, B.D.; Derron, M.-H.; Stock, G.M.; Matasci, B.; Boesiger, M.; Lefeuvre, C.; Podladchikov, Y.Y. Detection of Rock Bridges by Infrared Thermal Imaging and Modeling. Sci. Rep. 2019, 9, 13138. [Google Scholar] [CrossRef] [PubMed] [Green Version]
- Squarzoni, C.; Galgaro, A.; Teza, G.; Acosta, C.A.T.; Pernito, M.A.; Bucceri, N. Terrestrial laser scanner and infrared thermography in rock fall prone slope analysis. Geophys. Res. Abstr. 2008, 10. Available online: https://meetings.copernicus.org/www.cosis.net/abstracts/EGU2008/09254/EGU2008-A-09254.pdf (accessed on 10 December 2021).
- Frodella, W.; Gigli, G.; Morelli, S.; Lombardi, L.; Casagli, N. Landslide Mapping and Characterization through Infrared Thermography (IRT): Suggestions for a Methodological Approach from Some Case Studies. Remote Sens. 2017, 9, 1281. [Google Scholar] [CrossRef] [Green Version]
- Pappalardo, G.; Mineo, S. Study of Jointed and Weathered Rock Slopes Through the Innovative Approach of InfraRed Thermography. In Landslides: Theory, Practice and Modelling; Pradhan, S.P., Vishal, V., Singh, T.N., Eds.; Advances in Natural and Technological Hazards Research; Springer: Cham, Switzerland, 2019; Volume 50, pp. 85–103. [Google Scholar] [CrossRef]
- Pappalardo, G.; Mineo, S.; Imposa, S.; Grassi, S.; Leotta, A.; La Rosa, F.; Salerno, D. A Quick Combined Approach for the Characterization of a Cliff during a Post-Rockfall Emergency. Landslides 2020, 17, 1063–1081. [Google Scholar] [CrossRef]
- Prendes-Gero, M.; Suárez-Domínguez, F.; González-Nicieza, C.; Álvarez-Fernández, M. Infrared Thermography Methodology Applied to Detect Localized Rockfalls in Self-Supporting Underground Mines. In Rock Mechanics for Resources, Energy and Environment; Kwaśniewski, M., Łydżba, D., Eds.; CRC Press: Boca Raton, FL, USA, 2013; pp. 825–829. [Google Scholar] [CrossRef]
- Pappalardo, G.; Mineo, S.; Zampelli, S.P.; Cubito, A.; Calcaterra, D. InfraRed Thermography Proposed for the Estimation of the Cooling Rate Index in the Remote Survey of Rock Masses. Int. J. Rock Mech. Min. Sci. 2016, 83, 182–196. [Google Scholar] [CrossRef]
- Loche, M.; Scaringi, G.; Blahůt, J.; Melis, M.; Funedda, A.; Da Pelo, S.; Erbì, I.; Deiana, G.; Meloni, M.; Cocco, F. An Infrared Thermography Approach to Evaluate the Strength of a Rock Cliff. Remote Sens. 2021, 13, 1265. [Google Scholar] [CrossRef]
- Mineo, S.; Pappalardo, G. InfraRed Thermography Presented as an Innovative and Non-Destructive Solution to Quantify Rock Porosity in Laboratory. Int. J. Rock Mech. Min. Sci. 2019, 115, 99–110. [Google Scholar] [CrossRef]
- Casagli, N.; Frodella, W.; Morelli, S.; Tofani, V.; Ciampalini, A.; Intrieri, E.; Raspini, F.; Rossi, G.; Tanteri, L.; Lu, P. Spaceborne, UAV and Ground-Based Remote Sensing Techniques for Landslide Mapping, Monitoring and Early Warning. Geoenviron. Disasters 2017, 4, 9. [Google Scholar] [CrossRef]
- Frodella, W.; Elashvili, M.; Spizzichino, D.; Gigli, G.; Adikashvili, L.; Vacheishvili, N.; Kirkitadze, G.; Nadaraia, A.; Margottini, C.; Casagli, N. Combining InfraRed Thermography and UAV Digital Photogrammetry for the Protection and Conservation of Rupestrian Cultural Heritage Sites in Georgia: A Methodological Application. Remote Sens. 2020, 12, 892. [Google Scholar] [CrossRef] [Green Version]
- Grechi, G.; Fiorucci, M.; Marmoni, G.M.; Martino, S. 3D Thermal Monitoring of Jointed Rock Masses through Infrared Thermography and Photogrammetry. Remote Sens. 2021, 13, 957. [Google Scholar] [CrossRef]
- International Society for Rock Mechanics (ISRM). The complete ISRM suggested methods for rock characterization, testing and monitoring: 1974–2006. In Suggested Methods Prepared by the Commission on Testing Methods; Ulusay, R., Hudson, J.A., Eds.; Compilation Arranged by the ISRM Turkish National Group; International Society for Rock Mechanics: Ankara, Turkey, 2007; p. 628. [Google Scholar]
- Atzori, P.; Vezzani, L. Lineamenti petrografico-strutturali della catena peloritana. Geol. Romana 1974, 13, 21–27. [Google Scholar]
- Micheletti, N.; Chandler, J.H.; Lane, S.N. Structure from Motion (SfM) Photogrammetry. In Geomorphological Techniques; Clarke, L.E., Nield, J.M., Eds.; British Society for Geomorphology: London, UK, 2015. [Google Scholar]
- Tonkin, T.; Midgley, N. Ground-Control Networks for Image Based Surface Reconstruction: An Investigation of Optimum Survey Designs Using UAV Derived Imagery and Structure-from-Motion Photogrammetry. Remote Sens. 2016, 8, 786. [Google Scholar] [CrossRef] [Green Version]
- Dewez, T.J.B.; Girardeau-Montaut, D.; Allanic, C.; Rohmer, J. Facets: A Cloudcompare Plugin to Extract Geological Planes from Unstructured 3d Point Clouds. Int. Arch. Photogramm. Remote Sens. Spatial Inf. Sci 2016, XLI-B5, 799–804. [Google Scholar] [CrossRef]
- Fernández, O. Obtaining a Best Fitting Plane through 3D Georeferenced Data. J. Struct. Geol. 2005, 27, 855–858. [Google Scholar] [CrossRef]
- Pappalardo, G.; Mineo, S.; Carbone, S.; Monaco, C.; Catalano, D.; Signorello, G. Preliminary Recognition of Geohazards at the Natural Reserve “Lachea Islet and Cyclop Rocks” (Southern Italy). Sustainability 2021, 13, 1082. [Google Scholar] [CrossRef]
- Ball, M.; Pinkerton, H. Factors Affecting the Accuracy of Thermal Imaging Cameras in Volcanology: Thermal Imaging Cameras in Volcanology. J. Geophys. Res. 2006, 111, B11203. [Google Scholar] [CrossRef]
- Minkina, W.; Dudzik, S. Infrared Thermography: Errors and Uncertainties; John Wiley & Sons: Chichester, UK, 2009. [Google Scholar]
- OuYang, X.; Wang, N.; Wu, H.; Li, Z.-L. Errors Analysis on Temperature and Emissivity Determination from Hyperspectral Thermal Infrared Data. Opt. Express 2010, 18, 544. [Google Scholar] [CrossRef] [PubMed]
- Manuel, M.; Lin, S.; Lu, W.; Lin, P. Errors in Thermographic Camera Measurement Caused by Known Heat Sources and Depth Based Correction. Int. J. Autom. Smart Technol. 2016, 6, 5–12. [Google Scholar] [CrossRef]
- Playà-Montmany, N.; Tattersall, G.J. Spot Size, Distance and Emissivity Errors in Field Applications of Infrared Thermography. Methods Ecol. Evol. 2021, 12, 828–840. [Google Scholar] [CrossRef]
- CloudCompare Version 2.6.1—User Manual. Available online: http://www.cloudcompare.org/doc/qCC/CloudCompare%20v2.6.1%20-%20User%20manual.pdf (accessed on 17 January 2022).
- Deere, D.U. Technical description of rock cores for engineering purposes. Rock Mech. Eng. Geol. 1963, 1, 16–22. [Google Scholar]
- Palmstrom, A. Measurements of and Correlations between Block Size and Rock Quality Designation (RQD). Tunn. Undergr. Space Technol. 2005, 20, 362–377. [Google Scholar] [CrossRef]
- Riquelme, A.J.; Tomás, R.; Abellán, A. Characterization of Rock Slopes through Slope Mass Rating Using 3D Point Clouds. Int. J. Rock Mech. Min. Sci. 2016, 84, 165–176. [Google Scholar] [CrossRef] [Green Version]
- Haneberg, W.C. Using Close Range Terrestrial Digital Photogrammetry for 3-D Rock Slope Modeling and Discontinuity Mapping in the United States. Bull. Eng. Geol. Environ. 2008, 67, 457–469. [Google Scholar] [CrossRef]
- Nagendran, S.K.; Mohamad Ismail, M.A.; Wen, Y.T. Photogrammetry Approach on Geological Plane Extraction Using CloudCompare FACET Plugin and Scanline Survey. Bull. Geol. Soc. Malays. 2019, 68, 151–158. [Google Scholar] [CrossRef]
- De La Beche, H.T.; Broderip, W.J. Researches in Theoretical Geology; Charles Knight: London, UK, 1972. [Google Scholar]
- Pappalardo, G.; Mineo, S. Investigation on the Mechanical Attitude of Basaltic Rocks from Mount Etna through InfraRed Thermography and Laboratory Tests. Constr. Build. Mater. 2017, 134, 228–235. [Google Scholar] [CrossRef]
- Lemy, F.; Hadjigeorgiou, J. Discontinuity Trace Map Construction Using Photographs of Rock Exposures. Int. J. Rock Mech. Min. Sci. 2003, 40, 903–917. [Google Scholar] [CrossRef]
- Pappalardo, G.; Mineo, S.; Calcaterra, D. Geomechanical analysis of unstable rock wedges by means of geostructural and infrared thermography surveys. Ital. J. Eng. Geol. Environ. 2017, 1, 93–101. [Google Scholar] [CrossRef]
- Grinzato, E.; Bressan, C.; Marinetti, S.; Bison, P.G.; Bonacina, C. Monitoring of the Scrovegni Chapel by IR Thermography: Giotto at Infrared. Infrared Phys. Technol. 2002, 43, 165–169. [Google Scholar] [CrossRef]
- Pauline, E.; Carreño-Alvarado; Meza, G.R. Water Leak Detection by Termographic Image Analysis, in Laboratory Tests. Proceedings 2020, 48, 15. [Google Scholar] [CrossRef] [Green Version]
Publisher’s Note: MDPI stays neutral with regard to jurisdictional claims in published maps and institutional affiliations. |
© 2022 by the authors. Licensee MDPI, Basel, Switzerland. This article is an open access article distributed under the terms and conditions of the Creative Commons Attribution (CC BY) license (https://creativecommons.org/licenses/by/4.0/).