Abstract
A ground-based, integrated path, differential absorption (IPDA) light detection device capable of measuring multiple greenhouse gas (GHG) species in the atmosphere is presented. The device was developed to monitor greenhouse gas concentrations in small-scale areas with high emission activities. It is equipped with two low optical power tunable diode lasers in the near-infrared spectral range for the atmospheric detection of carbon dioxide, methane, and water vapors (CO2, CH4 and H2O). The device was tested with measurements of background concentrations of CO2 and CH4 in the atmosphere (Crete, Greece). Accuracies in the measurement retrievals of CO2 and CH4 were estimated at 5 ppm (1.2%) and 50 ppb (2.6%), respectively. A method that exploits the intensity of the recorded H2O absorption line in combination with weather measurements (water vapor pressure, temperature, and atmospheric pressure) to calculate the GHG concentrations is proposed. The method eliminates the requirement for measuring the range of the laser beam propagation. Accuracy in the measurement of CH4 using the H2O absorption line is estimated at 90 ppb (4.8%). The values calculated by the proposed method are in agreement with those obtained from the differential absorption LiDAR equation (DIAL).
Keywords:
greenhouse gases; ground based; CO2; CH4; H2O; IPDA; integrated path differential absorption; DIAL 1. Introduction
The reduction in greenhouse gases (GHGs) atmospheric concentration requires accurate measurements of their global emissions. Currently, a combination of satellite observatories and ground-based stations operate to provide global coverage [1]. Detailed GHG emission estimation requires extensive atmospheric concentration measurements of regions with high GHG emissions (cities, airports, power plants, oil and natural gas production and distribution facilities, landfills, cultivated fields, etc.). Calculation of the emissions from these specific locations have large uncertainties due to insufficient emission monitoring [2,3,4,5]. The installation and operation of ground-based stations are considered an optimal solution for the detection and monitoring of GHG concentration measurement [6,7,8] from such locations. Therefore, robust, reliable, easy to maintain, remotely-operated instruments detecting GHG in the atmosphere are essential to survey GHG concentration in the atmosphere from places with high emissions. These instruments must have low detection limits and high accuracies to measure global variations of GHG concentrations. In particular, their accuracy must be in the range of sub ppm for carbon dioxide (CO2) detection and a few ppb for methane (CH4) detection. However, such autonomous instruments are currently unavailable.
Two networks have been created for GHG monitoring that both provide measurements of column-averaged abundances of greenhouse gases by analyzing the solar radiation using Fourier-transform infrared (FTIR) spectrometers. The Total Carbon Column Observing Network (TCCON) operates high sensitivity, stationary FTIR spectrometers initiated in 2004 by the California Institute of Technology, Pasadena, USA [9] that measure total columns of CO2, CO, CH4, N2O, H2O, HF, and other atmospheric gases. In addition, the COllaborative Carbon Column Observing Network (COCCON) is a recent greenhouse-gas-observing network that uses common FTIR instrumental standards and data analysis procedures [10]. The main objective of the COCCON is to increase the global greenhouse gas observations due to the simplicity of the FTIR spectrometers used on the network.
Several publications have reported CO2 and CH4 concentration measurements from small-scale locations with high emission activities. Mitchell et al. have reported variations of CO2 and CH4 concentrations in Salt Lake City, USA, from 410 to 450 ppm (0.3 ppm uncertainty) and from 2.0 to 2.4 ppm (2 ppb uncertainty), respectively, using cavity-enhanced laser absorption spectroscopy [11]. Abdul-Wahab et al. predicted peak concentrations of CO2 357.19 (~200 ppm) and 36.11 mg/m3 (~20 ppm) for 1-h and 24-h averaging periods, respectively, by modelling CO2 emissions from a cement plant’s sources [12]. Dimitriou et al. have reported approximately 30 ppm (5 ppm uncertainty) diurnal variation of CO2 and 100 ppb (10 ppb uncertainty) diurnal variation in the city of Athens, Greece, during winter [13] using a Picarro G2401 cavity ring-down spectrometer. Fugitive CH4 emissions from the U.K. National Transmission System high-pressure pipeline have been reported [14]. The group has detected 26 peaks of CH4 above 2.1 ppm from pipelines using a Picarro Surveyor P0021-S cavity ring-down spectrometer with a stated precision of 5 ppb. Furthermore, emissions of methane from offshore oil and gas platforms in Southeast Asia have shown a substantial increase in CH4 (>50 ppb) [15]. The group stored flask samples that were analyzed using a gas chromatograph equipped with a flame ionization detector (Agilent Technologies, HP-5890) with a precision less than a 1.7 ppb [16]. Sun et al. reported the distribution of CH4 concentration in the range of 1940–2370 ppb in the city of Beijing [17]. The analysis was based on a cavity ring-down spectrometer (Picarro, G1301 and G2401) with a precision better than 0.7 ppb. Moreover, agricultural CH4 concentrations measured in a field of 0.42 hectares had a variation of 0.1 ppm during 24 h, using broadband open-path dual-comb spectroscopy that provided methane measurements with a precision of 25 ppb [18]. We can deduce from these publications that GHG emissions from small-scale areas can be reliably estimated using atmospheric measurements from instruments with lower sensitivity and higher detection limits than those measuring concentrations globally, such as satellite observatories. The accuracy of those instruments should be in the range of a few ppm for CO2 and a few tens of ppb for CH4 concentration measurements. However, these instruments should be capable of operating day and night and measuring GHG concentrations in various directions. These features are essential for GHG emission monitoring from small-scale areas since the emissions continuously change in short ranges.
Among several methods suitable for detecting, multiple GHG free-path, laser-based are the most promising [19]. The differential absorption light detection and ranging (DIAL) technique emerges as a new technology that has great potential for measuring the local increase in GHGs and supporting international climate agreements [6]. Briefly, in the DIAL method, a tunable-wavelength laser beam is propagated to the direction of a target to perform an absorption measurement. The laser wavelength is tuned firstly to a strong absorption line and subsequently to a nearby wavelength with weak absorption of the gas of interest. The ratio of the backscattered light intensities is related to the concentration of the gas in the atmosphere.
There are a few variations of the DIAL method. The range-resolved DIAL detects the backscattered signal of short laser pulses propagating in the atmosphere from aerosols and gas molecules, providing spatial information of the measured GHG concentration [20,21,22,23]. However, the recorded signal is weak and therefore high-power lasers are required for an adequate signal-to-noise ratio (SNR). Recently, an up-conversion detection system has been developed that efficiently translates infrared signals to the visible region combined with a visible detector that has high sensitivity. The detection system has been used in a DIAL system for CO2 and CH4 detection [24]. Scheimpflug lidar is also a recent method that has been proposed by Larson et al. for the detection of CO2 [25,26] that is a triangulation method based on continuous-wave (cw) lasers. The Scheimpflug lidar developed by Larsson et al. is equipped with a 1.3 W at 1.57 μm tunable laser. The group has reported CO2 concentrations averaged over five hours in an experiment performed in Lund, Sweden, during January 2018. The lidar provides range-resolved CO2 concentrations at a range of 2 km. The most accurate results were obtained at a range interval of 1 km and the CO2 concentration measured was 369 ± 13 ppm for the first kilometer and 283 ± 20 ppm for the second [25]. The design is simple and easy to use providing also spatial information of CO2 concentration in the atmosphere. However, there is intense interference in the signal from the background light that limits the performance of the method. Thus, special care has to be taken to avoid the detector’s saturation and to subtract the background signal during daylight in the presence of sunlight.
We present an autonomous, ground-based, integrated path, differential absorption (IPDA) system capable of measuring the concentration of multiple gas species in the atmosphere. Commonly, the IPDA method uses the surface back reflection of laser light from a target to determine average concentrations of trace gases in the atmosphere at the spatial extent of the laser beam. The IPDA is a promising method for monitoring GHG from space. Several studies are published reporting case studies for the detection of GHG concentrations from space [27,28,29,30]. Moreover, IPDA has been used for GHG detection from air [29,31,32] and ground [33,34,35]. The reflected tunable diode laser absorption spectroscopy (backscatter TDLAS) approach was followed that employs three tunable diode lasers with a very narrow linewidth to obtain gas absorption lines at very high spectral resolution by current and thermal tuning of the laser wavelength [36,37,38,39].
The IPDA method is inadequate for providing range-resolved information since the laser reflected signal comes from a single point on a surface. However, IPDA method results in a higher signal-to-noise ratio (SNR) considering that the reflected signal from a surface is typically orders of magnitude higher than the backscattered signal from aerosols, even when integrated over the entire laser beam propagation path [33].
The range of the laser beam from the IPDA device to the reflective surface (0.1 to 10 km) required in the DIAL method [33,40] is an essential parameter to infer the concentration of the atmospheric gases. The laser beam propagation range measurement is straightforward in the case of range-resolved DIAL. In the IPDA methodology, the calculation of the laser range demands an additional method capable of providing the propagation range of the laser beam. Therefore, the GHG measurement becomes complex and increases the uncertainty of the concentration values.
An additional method for the calculation of the GHG concentration is proposed based on the water vapor (H2O) absorption line and atmospheric measurements (water vapor pressure, temperature, and atmospheric pressure) from a local weather station. The water vapor concentration in the atmosphere is calculated from the atmospheric measurements. Furthermore, the DIAL equation is modified to provide GHG concentrations using the water concentration and the absorption of the water peak from the recorded signal. The calculation of the gases concentrations in the atmosphere based on the H2O peak provided similar values with those of the direct distance measurement and the DIAL equation.
The device developed is able to detect various gases in the atmosphere just by installing additional diode lasers emitting light in the proper near-infrared range. This feature is of great importance since not only do CO2 and CH4 gases intensify the greenhouse effect but also other climate-relevant trace gases [41], in particular those produced from plastics such as ethylene, ethane, and propylene [42]. Therefore, devices capable of monitoring several gases in the atmosphere are crucial for studying the greenhouse effect and other atmospheric phenomena. Such simple sensors, easy to maintain, with lower costs compared with available instruments, can be deployed to reliably monitor several sources of GHG emissions from different sectors.
2. Materials and Methods
Detection of multiple species requires laser beams at various wavelengths. Tunability of the laser wavelength is essential, but tunable lasers in the near-infrared spectral range are sophisticated laser systems and, therefore, inadequate for autonomous instruments that can operate in harsh environments. Single wavelength telecommunication diode lasers (such as distributed feedback, DFB, and distributed Bragg reflector, DBR, diode lasers) with a small tunability range (~1 nm) is the optimum solution for the development of devices for stand-off operation since such telecommunication lasers are low cost, highly robust, and reliable devices. In this case, a different telecommunication laser is required to detect each of the selected GHGs.
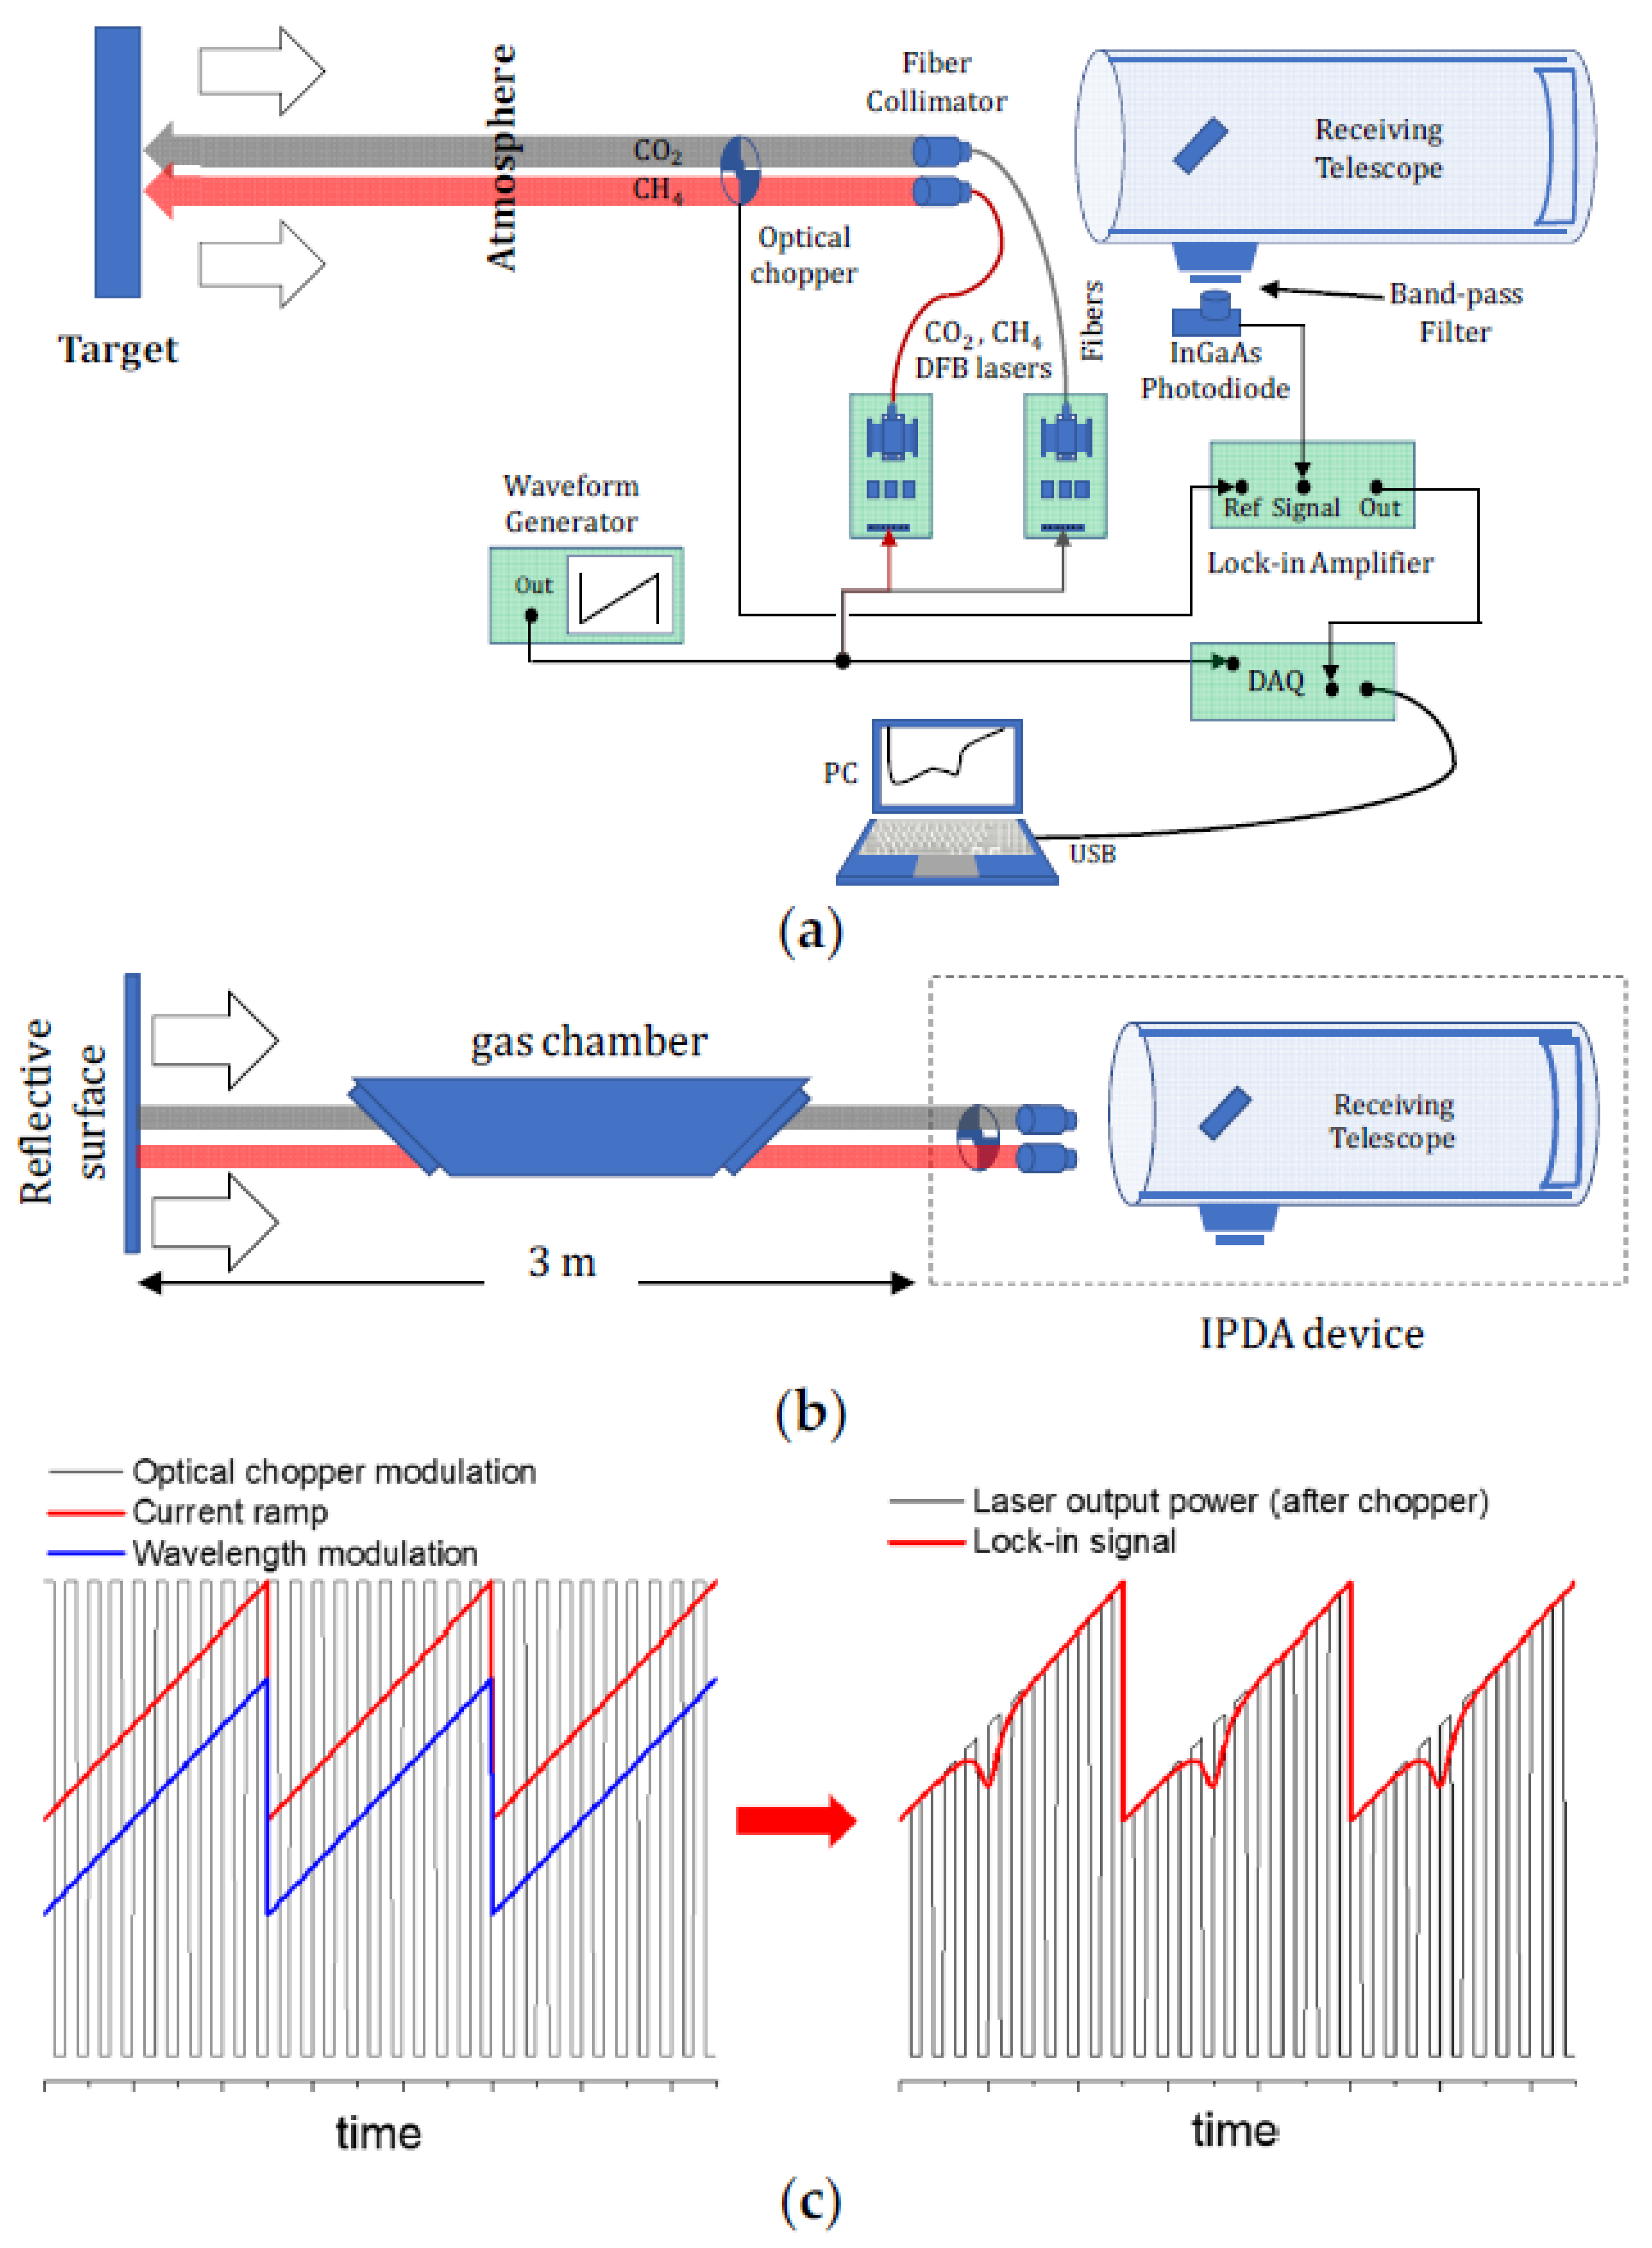
A diagram of the system design is presented in Figure 1a. The system is equipped with two cw DFB tunable diode lasers in a 14pin butterfly package. The first one has a central wavelength of 1.57 μm (6369 cm−1) with a linewidth of 1 MHz and maximum output power of 60 mW (#LD-1550-0060-DFB-1, Toptica, Gräfelfing, Germany) and is used for the detection of atmospheric CO2. The second one emits around 1.652 μm (6053 cm−1) with a linewidth lower than 2 MHz and maximum output power of 15 mW (PL-DFB-1650-A-A81-PA, ld-pd, Singapore) for the detection of CH4. Each laser is controlled by a current and temperature controller (SF8075-ZIF14, Maiman, Saint-Petersburg, Russia). The emission wavelengths of the CO2 and CH4 detection lasers were adjusted from 6365 to 6375 cm−1 and 6040 to 6050 cm−1, respectively.
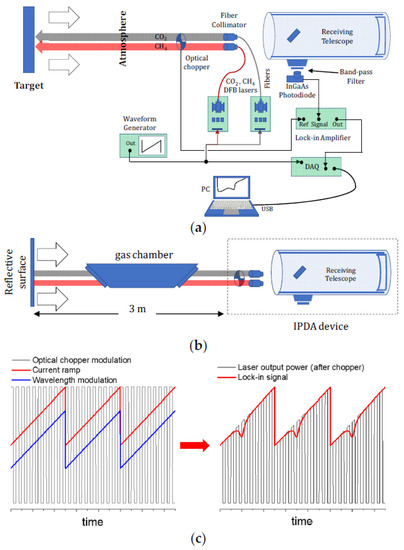
Figure 1.
(a) Diagram of the instrument’s setup; (b) configuration of gas chamber(s) used for optimization of the system parameters; and (c) timing diagram for the chopped signal relative to laser diode current modulation.
The two laser beams are propagated through single-mode fibers and are collimated using fiber collimators with a focal length of 19 mm (F280APC-1550, Thorlabs, Newton, NJ, USA). Only one laser operates at a time to separately measure CO2 or CH4 concentration. Finally, the laser beams are modulated by an optical chopper (360C-OEM, Scitec, Trowbridge, UK) at a low frequency (400 Hz) and transmitted into the atmosphere. The modulation signal from the optical chopper is used as a reference for a lock-in amplifier.
The back reflected light is collected by an f/5 Newtonian telescope (200/1000 PDS, SkyWatcher, Suzhou, China) with 1 m focal length mirror and detected by a home-made photodetector equipped with a 3 mm diameter InGaAs photodiode (G12180-030A, Hamamatsu, Hamamatsu, Japan). To achieve maximum sensitivity, the signal from the photodetector was introduced to a dual-phase digital lock-in amplifier (LIA-200MVD-H, Femto, Berlin, Germany) which is using the optical chopper signal as a reference. A digital oscilloscope (DSO7034A, Agilent, Santa Rosa, CA, USA) was used to record the signal from the lock-in amplifier and transfer it to a personal computer. Finally, a 25 MHz waveform generator (DG822, Rigol, Suzhou, China) was used to adjust the current of the laser controller. The optimization of the system and the detection methodology were performed using the setup of Figure 1b. The laser beam is transmitted through a chamber filled with the target gas of interest at various pressures and then directed towards a reflection surface approximately 3 m away. Chamber length was 1.3 m for CO2 and 0.3 m for the CH4 and the reflected light of the lasers was directly collected by the telescope of the device. All the experimental parameters, such as lock-in amplifier time constant, ramp duration for laser current control, and integrated thermoelectric cooling (TEC) temperature, were optimized using the chamber experimental setup for each GHG.
In most IPDA setups, concentration measurements are performed using only two specific wavelengths. The first wavelength is in resonance (on-line) and the second is out of resonance (off-line) with the same absorption line of the GHG. However, a different approach is selected in our case that provides detailed validation of the system capabilities for accurate atmospheric GHG concentration measurements. A current ramp is applied to perform a wavelength scan of the diode lasers over the range of the GHG absorption line. Therefore, a full profile of the absorption peak is recorded instead of the ratio of the signals detected using the on-line and off-line wavelength.
The lock-in amplifier used in an IPDA device extracts the weak signal from the reflected light and rejects the background signal from daylight and other near-infrared sources. This means that the device can operate continuously throughout the day. The lock-in amplification approach requires modulation of the laser beam. The laser beam modulation is achieved using the optical chopper that operates at a frequency of 400 Hz. A current ramp over time is used to continuously regulate the current of the diode and subsequently the wavelength of the laser. However, due to the characteristics of the DFB laser, there is an unwanted laser output power modulation simultaneously with the desirable wavelength modulation (Figure 1c).
The integration time (time constant) of the lock-in amplifier must be considerably longer than the period of the chopper’s modulation frequency to achieve maximum sensitivity for detecting extremely weak reflected light. The time constant of the lock-in amplifier is set to 1 s in our case to achieve longer integration times and a higher detection limit. In this case, the duration of the ramp function that regulates the wavelength of the laser has to be set significantly longer than the time constant. Otherwise, any signal variation due to CO2 absorption will be suppressed by the long integration time of the lock-in amplifier and consequently, limit the detection capabilities of the IPDA device. Therefore, optimum ramp duration, lock-in time constant, and chopper frequency have to fulfil the condition:
where Tchopper is the optical chopper period, tlock-in is the time constant of the lock-in amplifier, and tramp is the duration of the laser current ramp.
tramp >> tlock-in >> Tchopper,
The wavelength of the laser is also affected by the temperature of the laser diode. The integrated TEC unit of the laser regulates the temperature to achieve wavelength stabilization. However, the current ramp produces a strong oscillation of the electric current of the TEC that destabilizes the temperature of the laser diode. The temperature instability changes the wavelength of the laser and affects the recorded signal. An effective way for TEC regulation is to increase the duration of the ramp function. On the other hand, a very long ramp duration requires long recording times without notable improvement of the SNR and sensitivity of the device; hence, optimum ramp duration has to be determined. It is concluded that the optimum ramp duration for the IPDA device is 40 to 60 s, while 15 accumulations are required for recording to observe a CO2 and CH4 signal with low SNR.
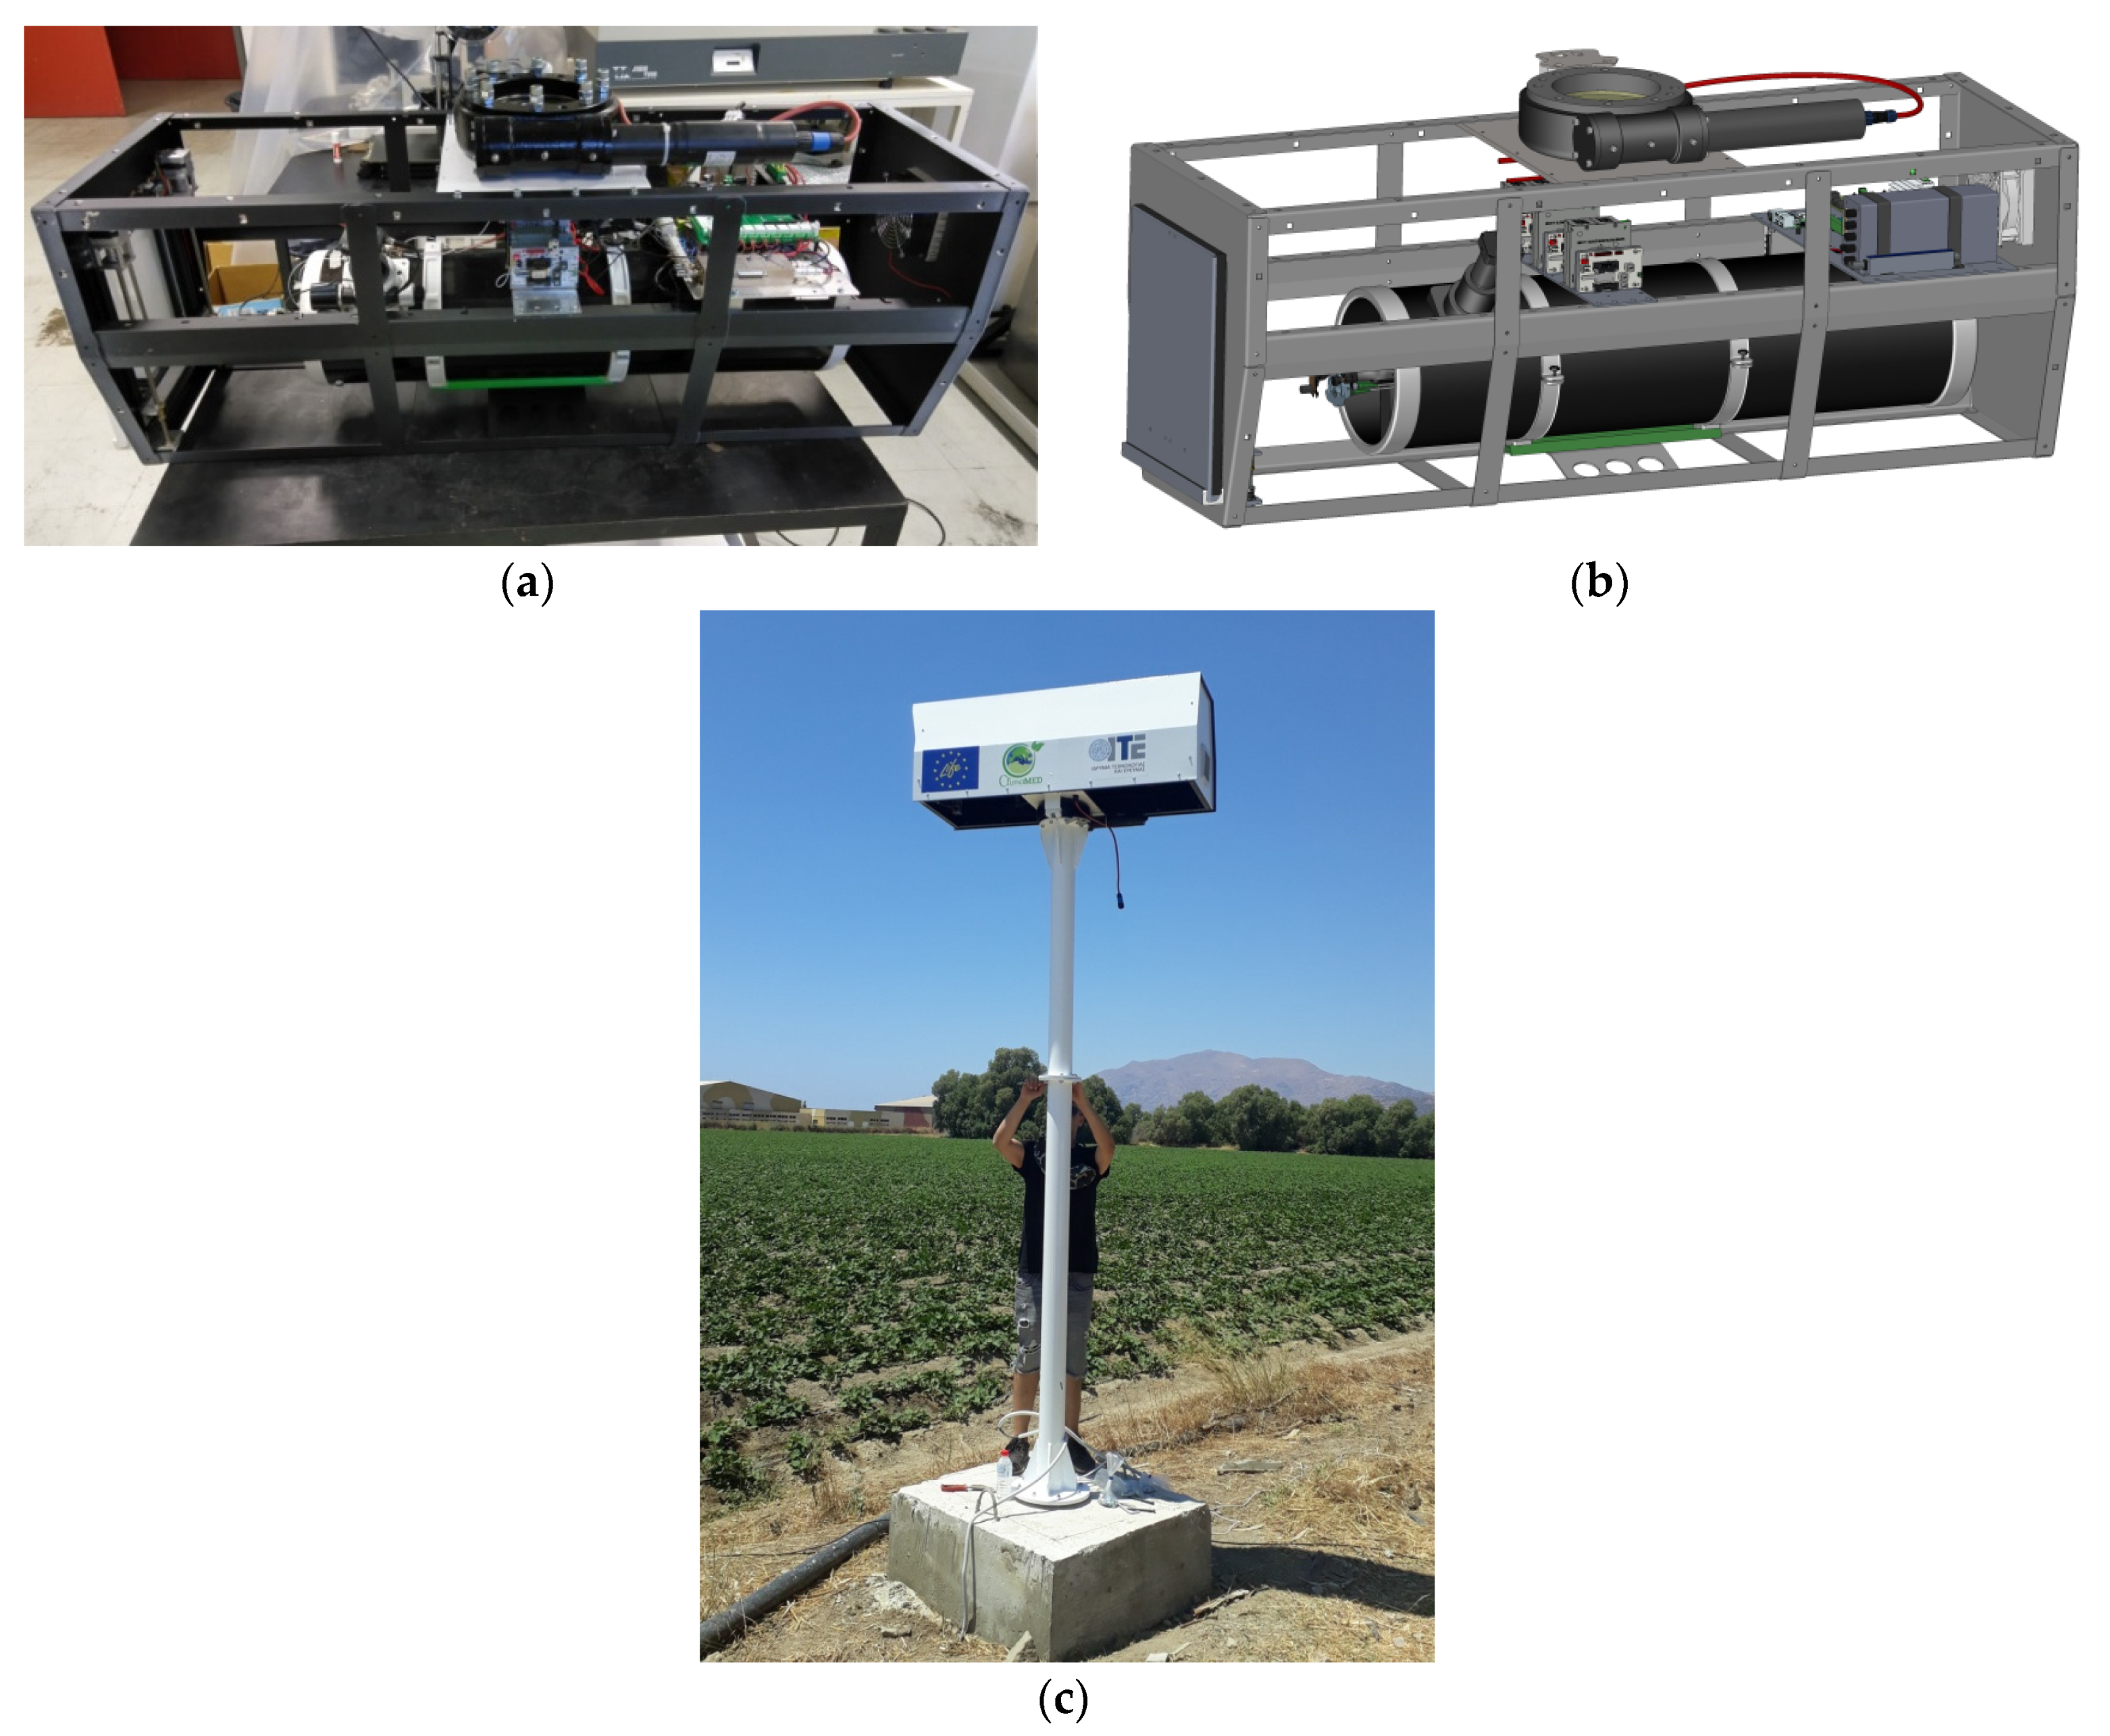
In Figure 2, images and a drawing of the device during a field test are presented. The case and support of the device were developed for an 18-month autonomous operation. The casing comprises a sealed waterproof case containing the sensitive components of the device. Furthermore, the device is placed onto a 3.5 m long pole to avoid obstacles that block the telescope’s line of sight. Initially, the protection hatch opens and all optoelectronics components turn on, followed by the sequence of operations for GHG measurements. The device operates autonomously and can rotate to a selected angle at the desired orientation. However, the device is versatile and can be placed on a table or installed on a heavy-duty tripod.
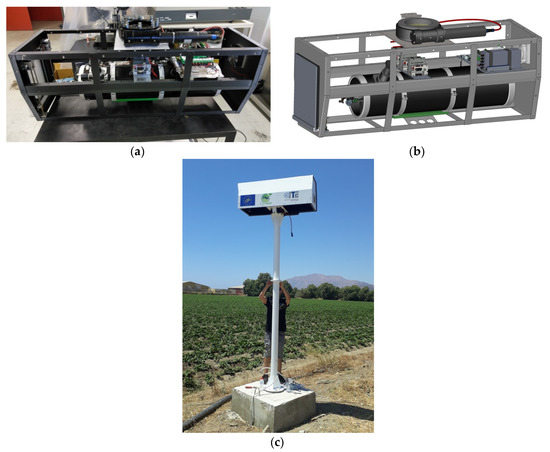
Figure 2.
(a) Image, (b) 3D sketch of the device, and (c) image of the device installed in Heraklion, Crete, Greece.
A Raspberry Pi3 handles external communication through Ethernet, automation, and controls the laser drivers. The component’s control is handled by an Arduino Due equipped with a custom-designed shield that features 7 relays that are used to turn on the optical chopper, power supplies for the laser drivers, the photodetector, and the lock-in amplifier. Data acquisition, which includes the lock in amplifier phase output, the laser driver current and the temperature, is carried out by Arduino using 12 bit sampling.
Through a parametric interface, the current of the laser was modulated. A graphical user interface has been developed to provide a direct communication option for remote operation commands. Information such as the device’s position angle, door status, internal temperature and selected laser driver status are also controlled and monitored.
3. Results and Discussion
3.1. Gas Chamber Measurements
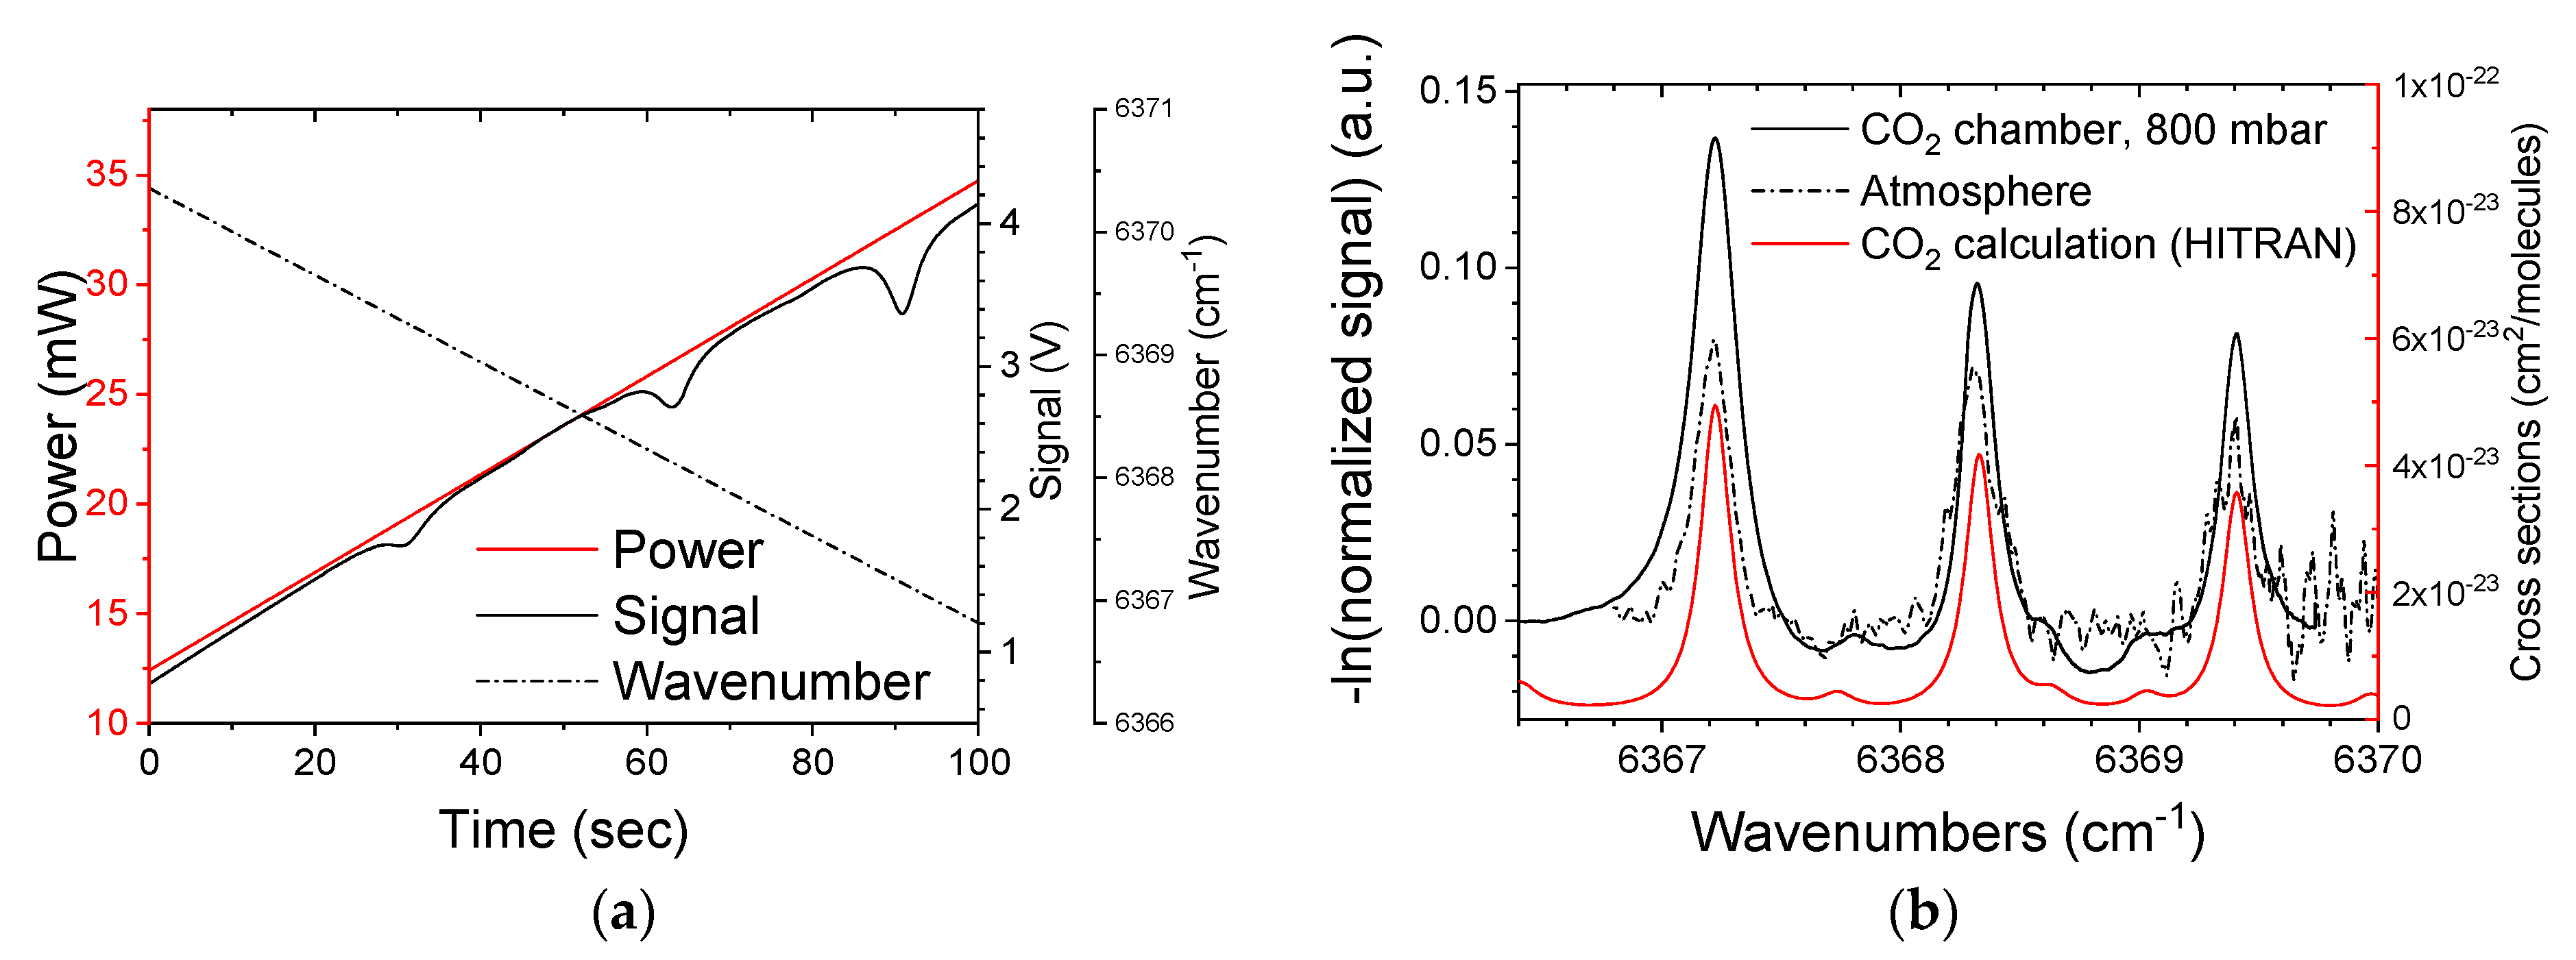
The parameters of the device have been optimized for measuring the atmospheric content of the gas using a chamber filled with CO2 (Figure 1b). The wavelength of the laser beam was adjusted by regulating the current of the laser diode, applying a ramp function (Figure 3a, black dashed line). However, the laser’s output power changes simultaneously with the wavelength (Figure 3a, red line). Due to these changes, the recorded signal of the amplifier increased proportionally to the laser power; however, sharp drops of the signal were observed at wavelengths resonant with the three absorption lines of CO2 (Figure 3a, black line).
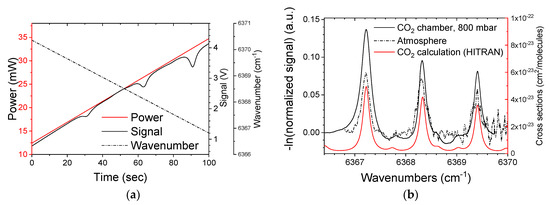
Figure 3.
(a) Output optical power (solid red line), laser’s wavelength alteration (dashed black line), and recorded signal (solid black line) over acquisition time using the 1.57 μm DFB diode laser. (b) Recorded spectrum of the CO2 using the CO2 chamber (dashed black line) and atmospheric measurement (solid black line). The corresponding absorption cross section values for the CO2 from the HITRAN database (solid red line) are also shown for comparison [43,44].
The detector’s signal is divided by the current value of the ramp function that is proportional to the laser power of the laser beam. Afterwards, the natural logarithm of the normalized signal is calculated (Figure 3b, solid and dashed black lines). The calculated spectrum was qualitatively compared with the theoretical absorption cross-sections provided by the HITRAN database (Figure 3b, solid red line) [43,44]. The wavelength of the cross-section peaks is in agreement with those recorded experimentally. Moreover, the peak profiles (full width at half maximum, FWHM) are almost identical to the theoretical cross sections. The CO2 pressure in the chamber was calculated from the recorded spectrum using the Beer–Lambert equation and it was found to be 800 ± 20 mbar, which is the same value provided by the pressure sensor of the chamber.
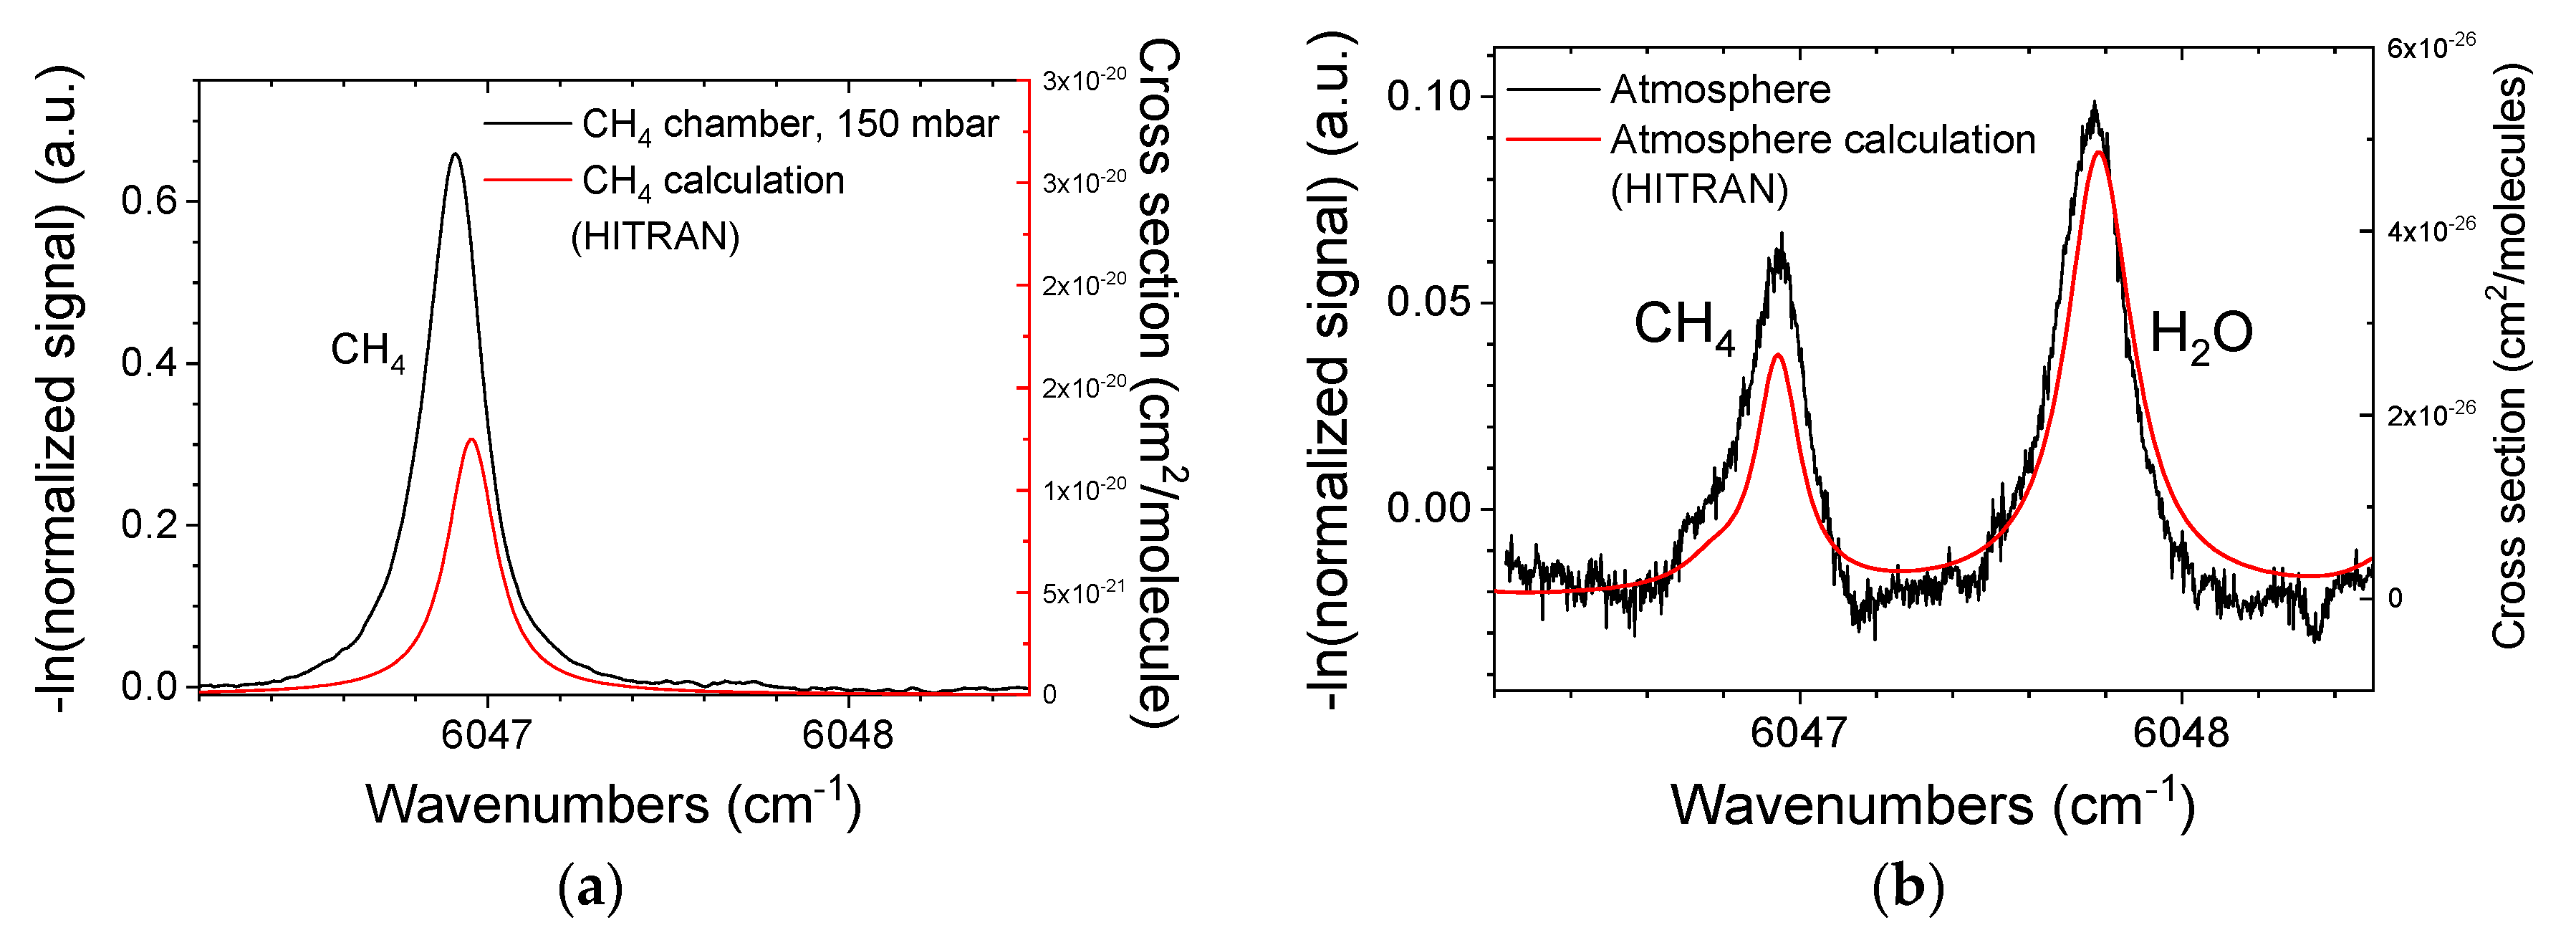
A similar procedure was followed for the CH4 detection and concentration measurement (Figure 4a). A 30 cm long chamber was partially filled with CH4 at a pressure of 65 ± 8 mbar and then additionally filled with atmospheric air up to 1 bar total pressure. The shorter chamber was used since the absorption cross section of CH4 (Figure 4a, red line) is almost two orders of magnitude stronger than the CO2 cross section. The wavelength of the cross-section peaks is in agreement with the signal recorded experimentally (Figure 4b, black lines). Moreover, the peak profiles (FWHM) are almost identical to the theoretical cross sections. There is a discrepancy in the measured and calculated relative intensities of CH4 and H2O peaks. The atmospheric cross-section calculations were performed using the USA standard atmospheric model (USA model, mean latitude, zero altitude, and summer). Therefore, the relative intensities of water vapor and methane peaks have significant differences compared with those measured during the atmospheric experiments. The relative pressure of the CH4 in the chamber was calculated based on the recorded signal and found to be 70 mbar.
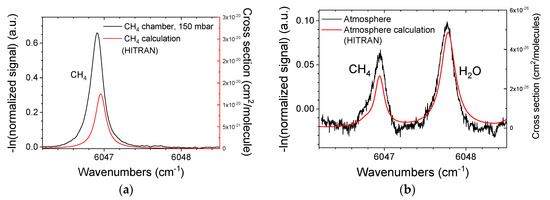
Figure 4.
(a) Spectrum of the CH4 recorded using the CH4 chamber (black line) and the corresponding absorption cross section values for the CH4 from the HITRAN database (red line). (b) The recorded spectrum of the atmosphere (black line) with clear peaks of CH4 and H2O and the corresponding absorption cross section values for the CH4 and H2O from the HITRAN database (red line) [43,44].
These calculations validate that the methodology followed produces accurate CO2 and CH4 concentration values and, therefore, the device is optimized for testing on atmospheric measurements of the specific GHG.
3.2. Atmospheric Measurements
The GHG measurements were carried out by expanding the laser beam of the device (Figure 1a) into the atmosphere in the vicinity of the Foundation for Research and Technology-Hellas (FORTH) location, Heraklion, Greece (Figure 5). The recorded atmospheric spectrum is presented in Figure 3b (black, solid line) along with the recorded spectrum of the CO2 chamber (black dashed line) and the theoretical one (red line) calculated using HITRAN database [43,44]. Atmospheric measurements for the detection of CO2 present three peaks related to CO2 absorption. A decrease in the SNR is observed that is attributed to the laser power decrease at higher wavenumbers. The signal of the peak at 6367.2 cm−1 has the highest SNR of all three CO2 absorption peaks. Therefore, the device is optimized to record only this peak for the calculation of the CO2 concentration in the atmosphere. Measuring a single peak instead of three requires a smaller range of values for the current ramp that regulates the laser wavelength. A smaller current range can be attained in a shorter period of the ramp. Due to this, the required time for a single acquisition reduced significantly without limiting the accuracy of the measurement.
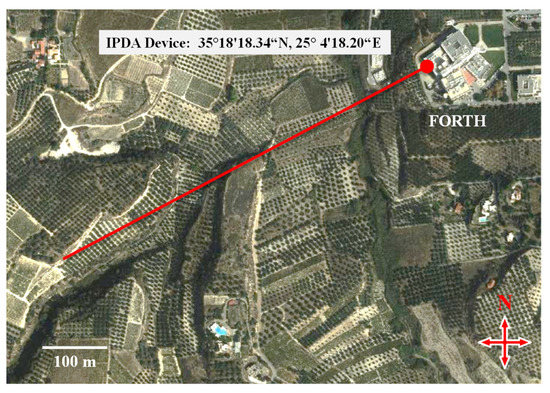
Figure 5.
Map and diagram of the test area of the system (image from Hellenic Land Registry [46]).
Moreover, the recorded signal from the atmospheric measurement of CH4 is presented in Figure 4b (6347.79 cm−1). An additional absorption peak is observed related to the H2O absorption line at 6346.96 cm−1 next to the CH4 line. Therefore, CH4 and H2O signals are recorded simultaneously and atmospheric concentrations are calculated from a single spectrum, using a single laser at 1.65 μm.
The range-resolved gas assessments are derived from the recorded signal using the DIAL technique [40,45]. DIAL is based on the retrieval of the atmospheric reflected light from a pulsed laser that is transmitted into the atmosphere. The wavelength is sequentially alternated between two wavelengths, one coinciding with an absorption line of the gas of interest (λon), the other in close vicinity, but off the absorption line (λoff). By assuming that the atmosphere and the detection system have the same properties at the two wavelengths apart from the absorption due to the gas of interest, the average over a range, z, gas absorption imprint can then be measured from the ratio of the atmospheric reflected light at the two wavelengths:
where, z is the propagation range of the laser beam from the device to the reflection surface, P(λon) and P(λoff) are the recorded signals at λon and λoff, N is the averaged gas concentration in the atmospheric line of the laser beam, and σ(λ) is the gas absorption cross section which can be found in the literature [43,44].
The system presented in this work measure the content of CO2 and CH4 in an atmospheric path. Any available surface from a nearby mountain, hill, or building can be used as a reflection surface for the laser beam. The distance, z (laser range), from the device to the reflective surface is measured by the following procedure; the photodiode installed in the telescope is temporarily replaced by the telescope eyepiece and the exact location of the reflective object is determined. A GNSS device is used to measure the latitude–longitude coordinates of the position of the reflective object and the position of the IPDA device. The distance, z, is calculated by the difference in the GNSS coordinates of the device and the reflective surface.
Several objects at various distances from 0.3 km to 2.0 km were tested for laser beam reflection to evaluate the intensity and stability of the recorded signal. The methodology followed is unaffected by the absorption characteristics of a surface since the wavelength scan range of the lasers is 1 nm, approximately. The variation of the absorption coefficient is negligible in such a short spectral range. Therefore, any surface that provides sufficient reflection is suitable for the system operation. Limestone cliffs with minimum vegetation provided the most intense signal, thus they are selected for the GHG measurements. The CO2 laser provides a sufficient reflection signal at distances of up to 1.5 km, while the CH4 laser provides a sufficient signal at distances of up to 1.0 km since the CH4 laser has lower optical power than the CO2 laser. These values determine the maximum operation ranges of the system to detect and measure the two GHGs.
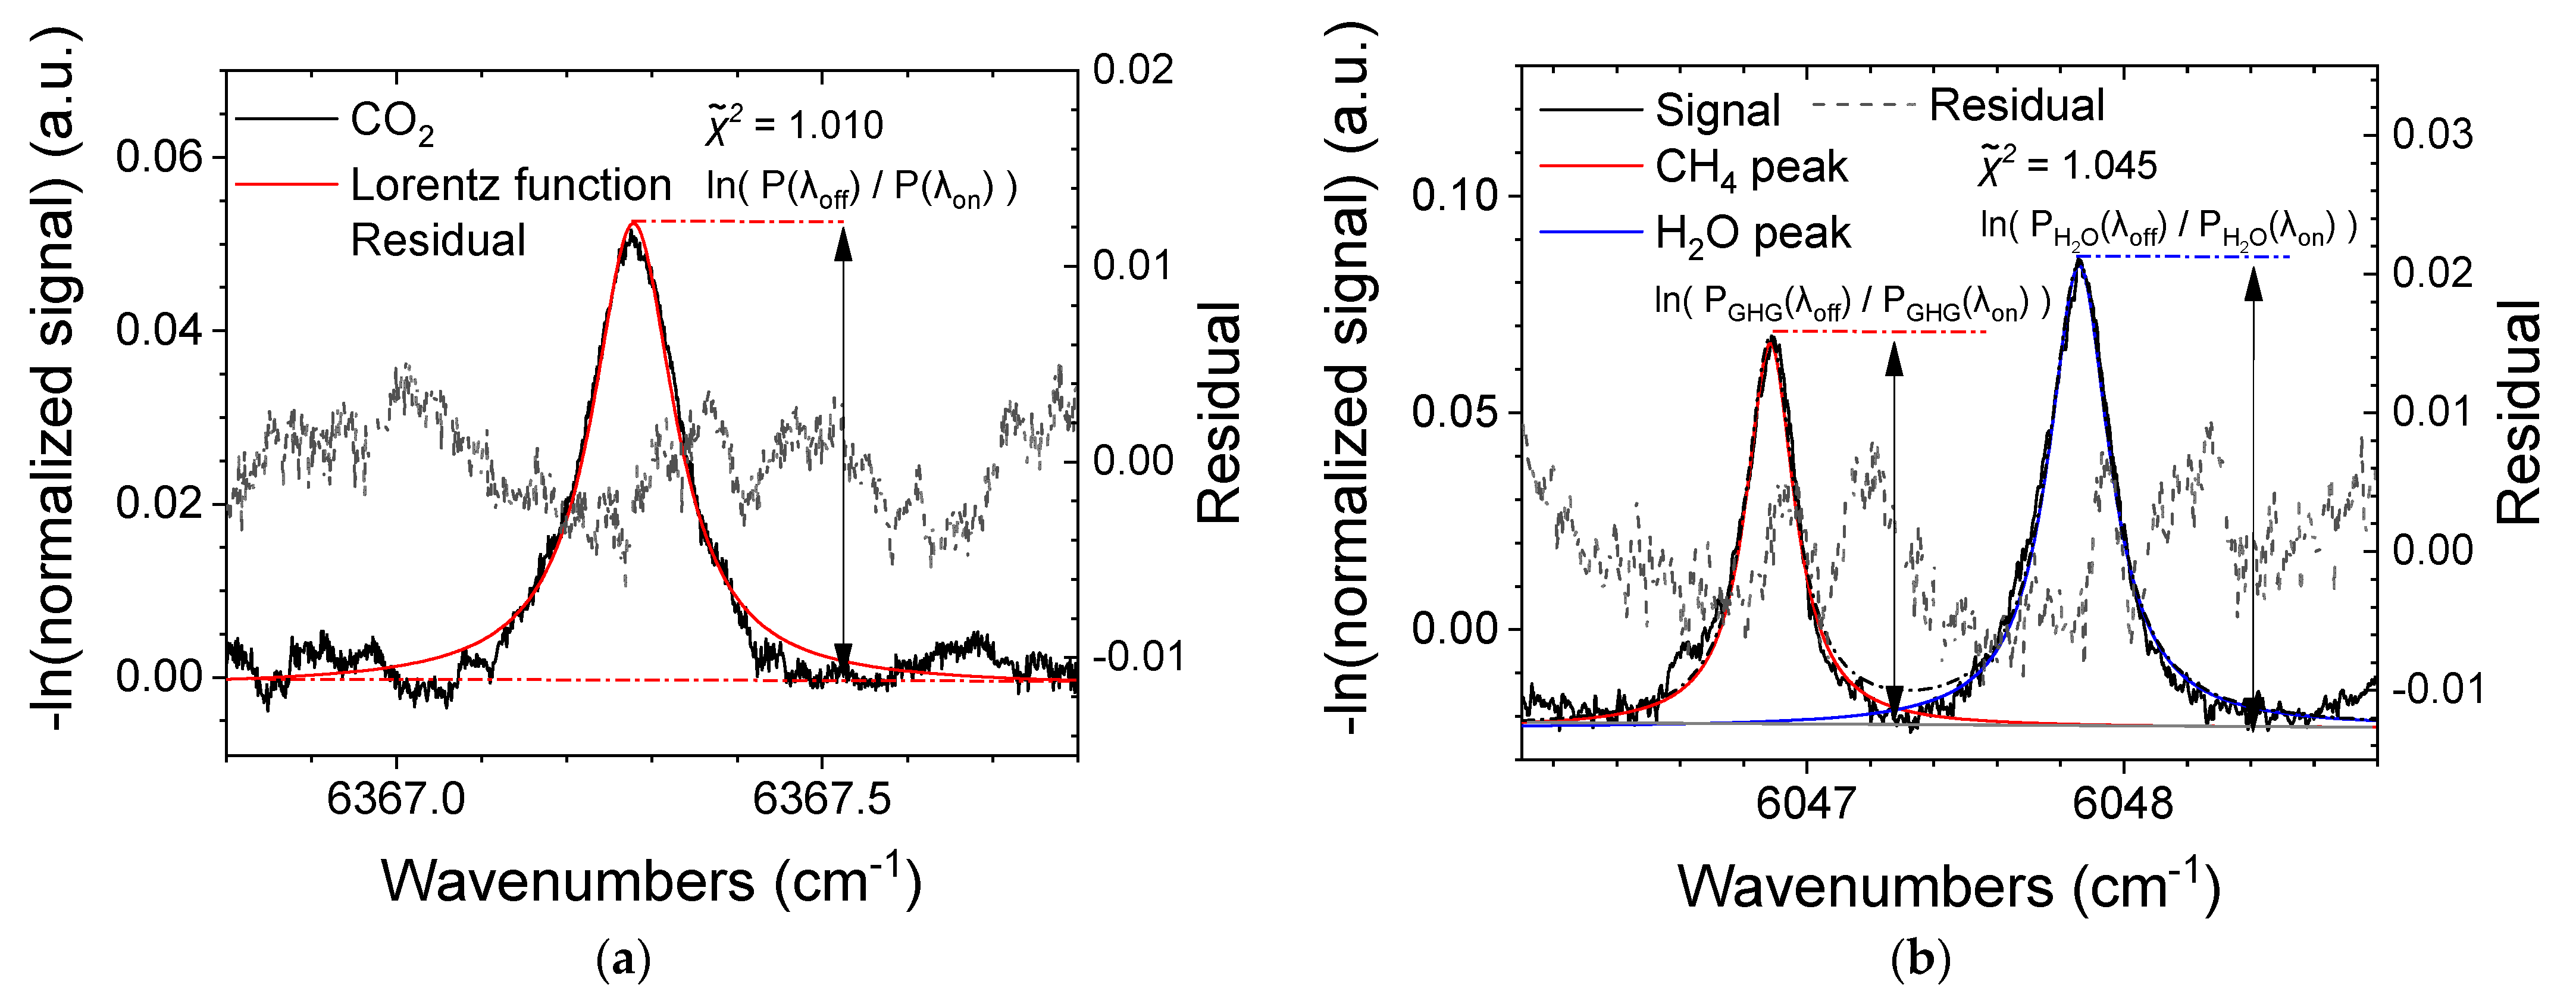
The recorded signal of the CO2 absorption line and the fitted function of a typical measurement is presented in Figure 6a. Moreover, the recorded peaks of the CH4 absorption line with the water vapor absorption line and their fitted functions are presented in Figure 6b. Both measurements took place during the daytime to determine the influence of sunlight.
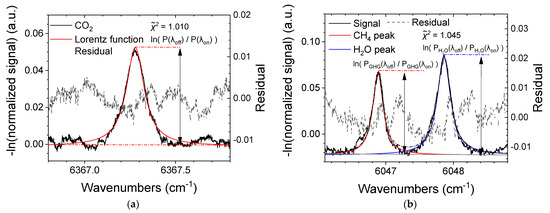
Figure 6.
Typical (a) CO2 signal, fitted function, and the residual between the fitted profile and the CO2 signal; and (b) CH4 and H2O signal, fitted functions, and the residual between the fitted profile and the CH4 signal.
The calculation of CO2 and CH4 content from DIAL Equation (2) requires the measurement of the laser range z. The range z was calculated using the GNSS coordinates and found to be 750 m (Figure 6). This value is used for the CO2 and CH4 concentration calculation based on the DIAL equation.
A data fitting procedure is necessary to improve the accuracy of the measurement since the recorded signal has a low SNR. The CO2 and CH4 measurements were conducted at low elevations (<500 m) where the absorption peak broadening is dominated by the atmospheric pressure. Therefore, a Lorentz function is selected for the fitting of the absorption spectra since this function predicts the pressure broadening effect [47]. The ln(P(λon)/P(λoff)) ratio that is required in the DIAL equation to calculate the concentration of the GHGs is equal to the difference of the maximum from the baseline of the fitted function (Figure 6).
The dominant source of error in the calculation of atmospheric GHG concentrations is the uncertainty of the distance, z, value between the device position and the reflective surface. The accuracy of the GNSS data and the reflective surface position determines the accuracy of the z value. An additional error source is the SNR that affects the accuracy of the fitting function. The error of the instrument is calculated from the equation:
where, s(N) is the error of the calculated averaged gas concentration, z is the range of the laser beam, s(z) the error of the range z, A is equal to the ln(P(λon)/P(λoff)) that is calculated from the fitted function, s(A) the error of A, and σ(λ) is the gas absorption cross sections (Figure 6) derived from the HITRAN database [43,44]. The s(A) is the standard error produced from the fitting procedure. The s(A) value is calculated from the square root of the diagonal of the parameters’ covariance matrix. The s(z) is calculated from the GNSS measurements and found to be 2% of the measured range, z. The CO2 and the CH4 atmospheric concentrations are estimated to be 414 ± 5 ppm and 1890 ± 50 ppb, respectively, based on the calculations of the measurements in Figure 6.
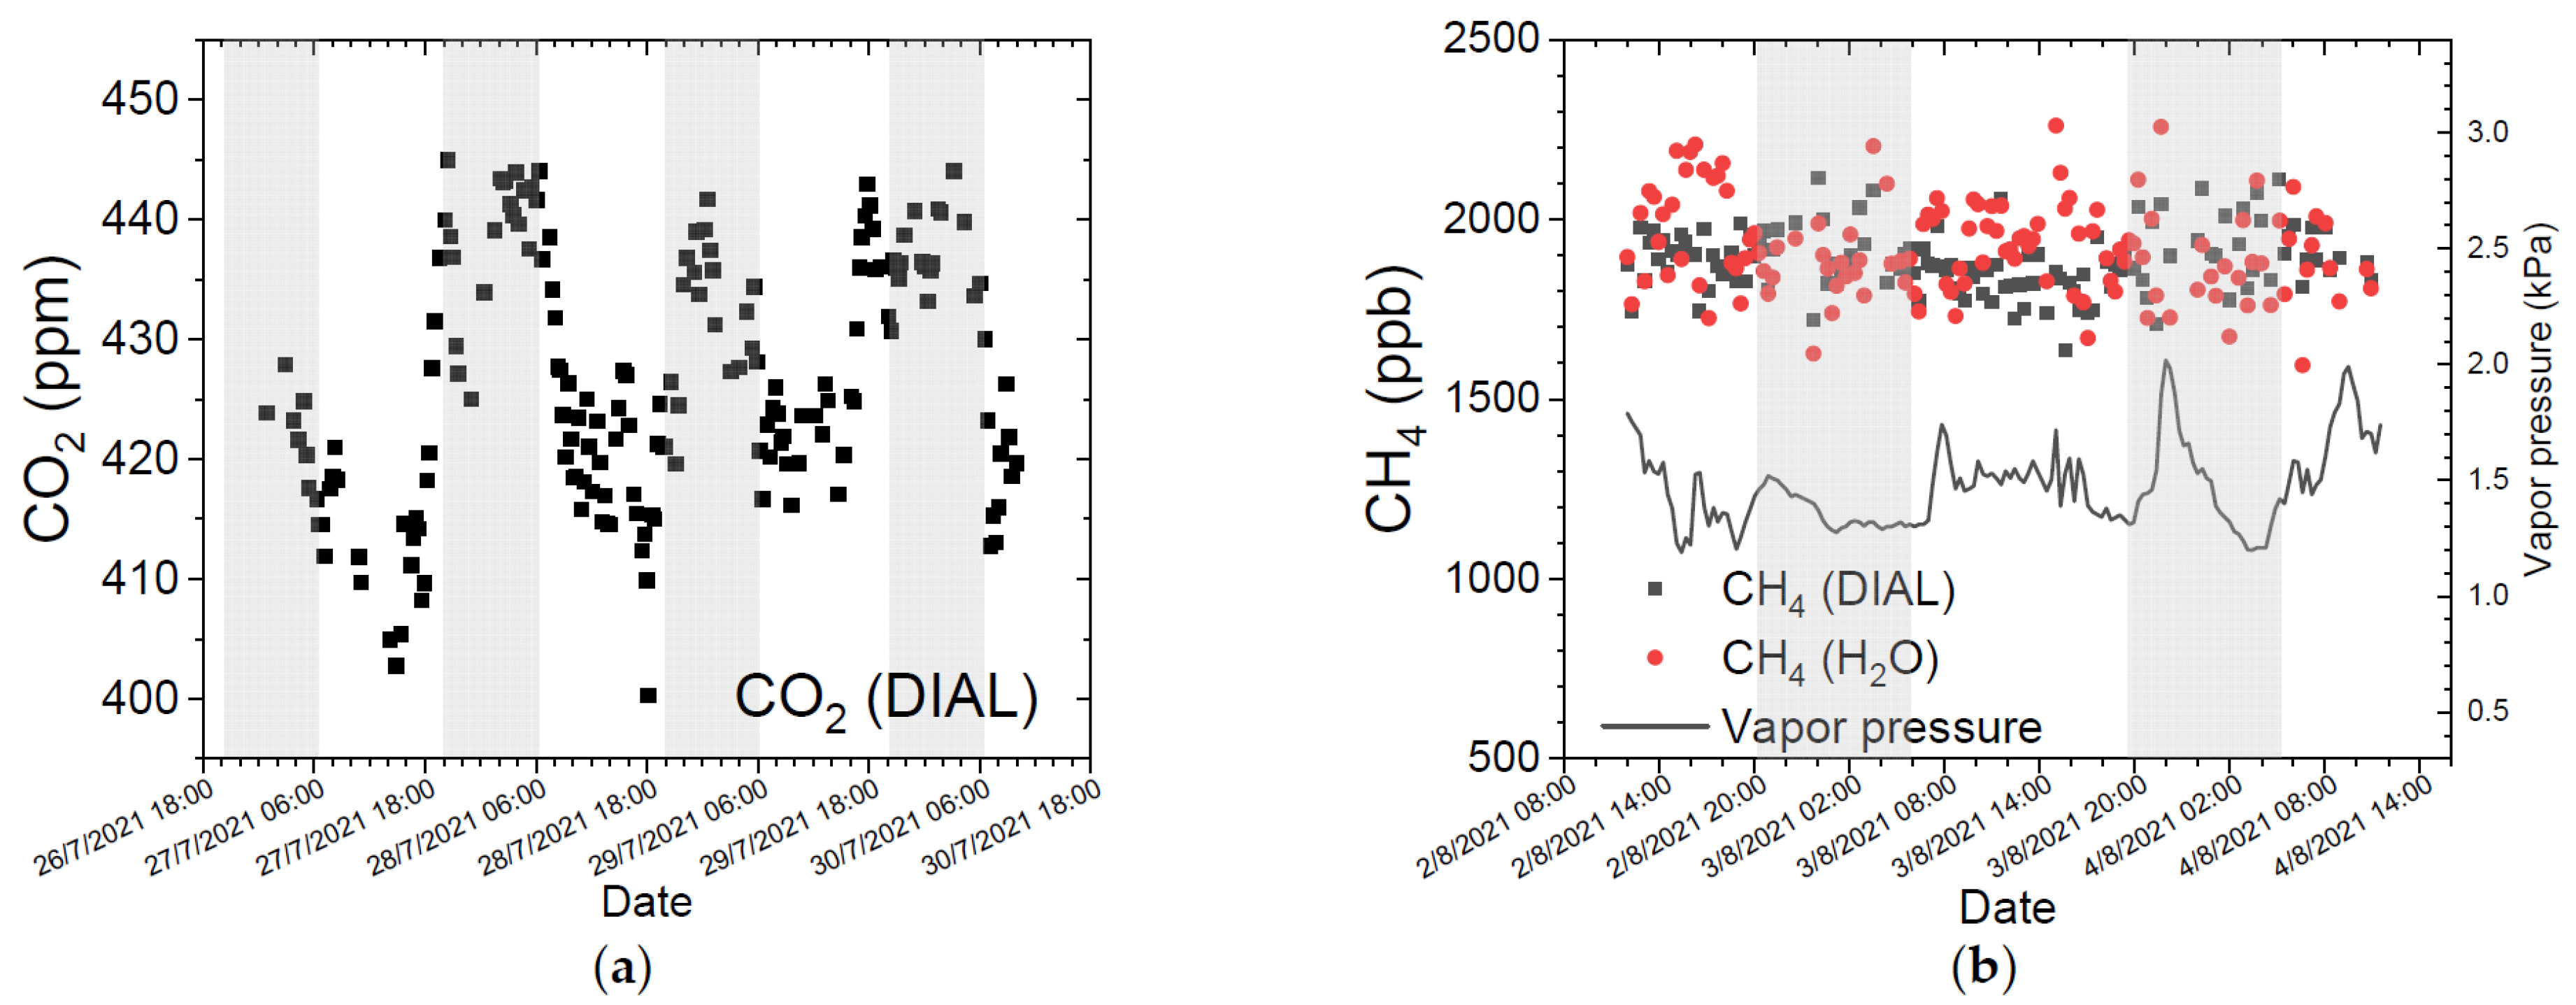
The performance of the system and the capabilities of the methodology to measure GHG concentrations in the atmosphere were evaluated based on the results of two experiments that estimated the atmospheric CO2 and CH4 path concentration changes over a period. The first one took place from 26 July 2021 until 30 July 2021 to monitor the CO2 variations and the second one took place from 2 August 2021 until 4 August 2021 to monitor CH4 variations in the atmosphere. The device was directed to an object that was 750 m away and a single measurement was taken automatically every 30 min. The recorded concentrations of the CO2 and the CH4 in the atmosphere are presented in Figure 7a,b, respectively. The mean reduced chi-square () value for CO2 fitting is 1.010 and for CH4 fitting is 1.045. Therefore, the fitting process produces statistically reliable ln(P(λon)/P(λoff)) values since the is sufficiently small. The calculated mean value of the CO2 concentration in the atmosphere for this period is 426 ± 5 ppm with a maximum variation of 20 to 30 ppm, higher than the accuracy of the device.
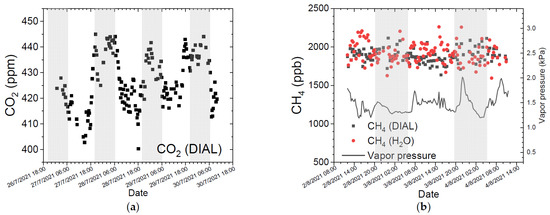
Figure 7.
Concentration variation of (a) CO2 from 26 July until 30 July 2021 (b), and of CH4 during 2 August until 4 August 2021 in the atmosphere. Shaded areas refer to night periods.
This value is compared with the value reported from the Finokalia Atmospheric Observatory (FKL) which is located 50 km east of the monitoring location, for the same period. The FKL is operated by the Environmental Chemical Processes Laboratory (ECPL) at the University of Crete, is part of the European Research Infrastructure for the observation of Aerosol, Clouds, and Trace gases (ACTRIS) and it is a core observatory for monitoring atmospheric composition and climate change for Greece but also for southern Europe and the eastern Mediterranean [48,49,50]. There is a 4.4% deviation of IPDA device value compared with the value reported from the FKL station (407.9 ± 2.5 ppm). The monitoring area is located 6.4 km from the center of Heraklion city, Crete, with an urban population of 140,000 people, and 5 km from the Linoperamata power plant with a total power of 193 MW [51]. Therefore, a higher CO2 concentration in the atmosphere compared with the FKL control station is expected. Clear diurnal variation of the CO2 content with higher values during the night and lower during the day is observed. This difference is attributed to the day and night variations due to local vegetation since the monitoring area is intensively cultivated with olive oil trees and vineyards. Furthermore, similar variations and absolute concentration values have been reported in the city of Athens by Dimitriou et al. [13]. However, in their work, the variation is attributed to traffic/heating emissions.
The CH4 concentration measurement does not present any significant variations (Figure 7b). The mean value was calculated to be 1880 ± 90 ppm. The measurement error is double that of the error derived from Equation (3) for the CH4 (50 ppb). Furthermore, the measured CH4 concertation is 0.3% smaller than the global value provided by NOAA (1886.6 ppb, July 2021) [52], 0.7% smaller than the value provided by TROPOMI instrument [53,54] of Sentinel5P satellite (1893 ppb), and 3.5% smaller than the value provided from the FKL station (1948.7 ± 8.7 ppb). Furthermore, the deviation of the measurement from the monitoring area compared with the reference values is smaller than the error of the measurement (4.8%). Therefore, the accuracy of the IPDA device is probably even better than those derived by the error calculations. These field measurements demonstrate the feasibility of the IPDA device for measuring the CO2 and CH4 path concentration and monitoring carbon emission over large areas.
3.3. GHG Concentration Calculation Using the H2O Absorption Line
The DIAL Equation (2) requires accurate measurement of the range, z, of the laser beam to obtain the absolute value of the GHG concentration in the atmosphere. However, laser range measurement requires an additional method that introduces significant uncertainties in the calculations of GHG concentration values. The range z measurement can be excluded from the calculation of the GHG concentration if the signal of the H2O line present in the vicinity of the CH4 spectral line is reclaimed. The weather conditions are monitored simultaneously with GHG measurement using a local weather station [55]. The atmospheric pressure, the temperature, and the vapor pressure are used to calculate the concentration of H2O vapors in the atmosphere of the monitoring area. Furthermore, Equation (2) is modified accordingly to:
where, NH2O are the water vapor concentration, PH2O(λon) and PH2O(λoff) are the signals at λon and λoff for the H2O line, PGHG(λon) and PGHG(λoff) are the signals at λon and λoff for the GHG. σH2O and σGHG are the absorption cross section for the GHG (CO2 or CH4) line, respectively, and NGHG is the gas concentration [43,44]. The weather conditions may have significant variation at long distances. However, in the range of a few hundred meters, we can assume that they are relatively constant and the calculated mean H2O concentration in the atmosphere is accurate.
The error in the calculation of the GHG concentration using the H2O absorption line is produced from the uncertainty of the NH2O value and the error in the measurement of the peak highs of the CH4 and H2O peaks. The NH2O error is determined from the error of the vapor pressure, the error of the temperature, and the error of the atmospheric pressure. It is calculated that the error of the NH2O is approximately 5% of the actual value. Finally, the error of the GHG concentration measurement is calculated from the equation:
where, s(NGHG) and s(NH2O) are the errors of the calculated averaged gas concentration and the vapor concentration, respectively. AGHG is equal to the ln(PGHG (λon)/PGHG (λoff)) that is calculated from the fitted function. AH2O is equal to the ln(PH2O (λon)/PH2O (λoff)) that is also calculated from the fitted function. s(AGHG) and s(AH2O) are the errors of AGHG and AH2O, respectively, and σ(λ) is the gas absorption cross section (Figure 6). The s(AGHG) and s(AH2O) values are calculated from the square root of the diagonal of the parameters’ covariance matrix. The CH4 atmospheric concentration based on the measurement of Figure 7b is found to be 1930 ± 90 ppb compared with 1910 ± 50 ppb calculated using the DIAL Equation (2). The calculated error is almost double compared with the DIAL equation due to the high uncertainty of the vapor pressure measurement that produces high uncertainty in the calculation of the water vapor concertation in the atmosphere.
The atmospheric CH4 path concentration over the same period (2 April until 4 August 2021) is calculated using the H2O absorption line. The results are presented in Figure 7b where once more the CH4 concentration measurements do not present any significant variations. The mean value is calculated to be 1930 ± 130 ppm. The experimental error is higher than the one calculated using the DIAL equation due to higher uncertainty on the calculation of the NH2O. Furthermore, the measured CH4 concertation is 2.3% greater than the global value provided by NOAA (1886.6 ppb, July 2021), is 2.0% greater than the value provided by TROPOMI instrument [53,54] of Sentinel5P satellite (1893 ppb), and 1.0% smaller than the value provided from the FKL station (1948.7 ± 8.7 ppb). Improvement in the accuracy of atmospheric measurements from the weather station will reduce the uncertainty of the NH2O and consequently the uncertainty of the CH4 concentration. These field measurements demonstrate the feasibility of the H2O methodology to measure the concertation of GHGs in the atmosphere.
4. Conclusions
Greenhouse gas emissions locally produced by human activities and natural phenomena require continuous monitoring. The development of robust, reliable, and simple to maintain and operate instruments is vital for sufficient and accurate GHGs emission monitoring. In this work, a ground-based, integrated path, differential absorption (IPDA) monitoring system is developed and tested. The device is equipped with two low optical power DFB diode lasers for the detection of CO2, CH4. The atmospheric background concentration of these two GHGs was measured with an accuracy of 5 ppm and 50 ppb, respectively.
The calculation of the GHG concentrations using the DIAL equation in IPDA methodology requires measuring the range of the laser beam by applying an additional method. The required range of detection value makes the GHG measurement complicated and increases the uncertainty. An alternative methodology to calculate the GHG concentrations has been proposed based on the H2O absorption line and atmospheric measurements from a local weather station. It was concluded that the gases concentrations based on the H2O peak provide similar values with those of the DIAL equation but with a higher error as it was calculated for the CH4 (90 ppb). The error can be reduced by improving the accuracy of the atmospheric parameters measured by the weather station.
The results demonstrate that the method is well suited for environmental conditions where the water vapor content is constant over the propagation path of the laser beam. However, the application of the method in locations with high humidity will probably induce a bias in the measurement since the water vapor might vary at relatively short distances. Measuring the absorption lines of other species with known concentrations in the atmosphere can provide more reliable GHG concentrations than water vapor absorption. Riris et al. [56] proposed the measurement of O2 absorption to infer the dry air number of molecules. The calculated number of molecules afterwards was used to determine CO2 concentration by applying the DIAL methodology. Therefore, molecular oxygen lines measurements can be used directly to determine the GHG concentration in the atmosphere instead of the water vapor lines. The O2 lines will provide more reliable results than H2O lines since the O2 is a stable and uniformly mixed gas in the atmosphere.
A full profile of the absorption peak is recorded by wavelength scanning of the laser beam, instead of the two-wavelength (on-line and off-line) approach, followed by most IPDA systems. Future work will focus on devising modifications for concentration measurements using the two wavelengths approach. In this way, shorter acquisition times are expected compared with the wavelength scan method.
The sensitivity of the device that is presented here is lower than the one required to measure GHG global concentration variations. However, there are continuous advances in laser technology and detection devices. Therefore, we expect that the GHG detection sensitivity of the proposed methodology and other laser-based methodologies will increase significantly in the upcoming years.
Finally, due to the simplicity of the design, the device can be modified accordingly to detect and monitor various gases in the atmosphere by replacing the existing or installing extra DFB diode lasers emitting light in the near-infrared range in resonance with an absorption band of the gases of interest. The device currently undergoes 18 months of testing. After the testing period ends, the data will be publicly available.
Author Contributions
Conceptualization, P.S. and M.V.; methodology, P.S.; data curation, G.P.; software, G.P.; writing—original draft preparation, P.S.; writing—review and editing, G.P., P.C.S. and M.V.; supervision, M.V. All authors have read and agreed to the published version of the manuscript.
Funding
This study was co-funded by the European Commission in the framework of the LIFE17 CCM/GR/000087 project “Innovative technologies for climate change mitigation by Mediterranean agricultural sector (LIFE ClimaMed)”.
Institutional Review Board Statement
Not applicable.
Informed Consent Statement
Not applicable.
Data Availability Statement
Not applicable.
Acknowledgments
We would like to express our gratitude to Wolf von Klitzing for his valuable advice related to near-infrared laser technology. Moreover, we thank Stelios Tzortzakis, Anastasios Koulouklidis, George Katsoprinakis, Xristina Daskalaki, and Michalis Loulakis for essential technical support and useful discussion. We thank Nikos Mihalopoulos, Maria Kanakidou, and George Kouvarakis at Environmental Chemical Processes Laboratory of the University of Crete, Michel Ramonet at Laboratoire des Sciences du Climat et de l’Environnement (LSCE), and the SNO ICOS-France-Atmosphere for providing CO2 and CH4 data from Finokalia Observatory. Finally, we thank Nektarios Chrysoulakis and Konstantinos Politakos for providing the weather data.
Conflicts of Interest
The authors declare no conflict of interest.
References
- The Global Observing System for Climate: Implementation Needs; World Meteorological Organization: Geneva, Switzerland, 2016.
- Duren, R.M.; Miller, C.E. Measuring the carbon emissions of megacities. Nat. Clim. Chang. 2012, 2, 560–562. [Google Scholar] [CrossRef]
- Velazco, V.A.; Buchwitz, M.; Bovensmann, H.; Reuter, M.; Schneising, O.; Heymann, J.; Krings, T.; Gerilowski, K.; Burrows, J.P. Towards space based verification of CO2 emissions from strong localized sources: Fossil fuel power plant emissions as seen by a CarbonSat constellation. Atmos. Meas. Tech. 2011, 4, 5147–5182. [Google Scholar] [CrossRef] [Green Version]
- Marland, G. Uncertainties in Accounting for CO2 From Fossil Fuels. J. Ind. Ecol. 2008, 12, 136–139. [Google Scholar] [CrossRef]
- Le Quéré, C.; Andrew, R.M.; Friedlingstein, P.; Sitch, S.; Hauck, J.; Pongratz, J.; Pickers, P.A.; Korsbakken, J.I.; Peters, G.P.; Canadell, J.G.; et al. Global Carbon Budget 2018. Earth Syst. Sci. Data 2018, 10, 2141–2194. [Google Scholar] [CrossRef] [Green Version]
- Verifying Greenhouse Gas Emissions: Methods to Support International Climate Agreements; National Research Council (U.S.) (Ed.) National Academies Press: Washington, DC, USA, 2010; p. 63. ISBN 9780309152112. [Google Scholar]
- Zahar, A.; Peel, J.; Godden, L. Australian Climate Law in Global Context; Cambridge University Press: Cambridge UK; New York, NY, USA, 2013; p. 123. ISBN 9780521142106. [Google Scholar]
- Lloyd, C.R.; Rebelo, L.-M.; Max Finlayson, C. Providing low-budget estimations of carbon sequestration and greenhouse gas emissions in agricultural wetlands. Environ. Res. Lett. 2013, 8, 015010. [Google Scholar] [CrossRef] [Green Version]
- Wunch, D.; Toon, G.C.; Blavier, J.-F.L.; Washenfelder, R.A.; Notholt, J.; Connor, B.J.; Griffith, D.W.T.; Sherlock, V.; Wennberg, P.O. The Total Carbon Column Observing Network. Philos. Trans. R. Soc. A 2011, 369, 2087–2112. [Google Scholar] [CrossRef] [Green Version]
- Frey, M.; Sha, M.K.; Hase, F.; Kiel, M.; Blumenstock, T.; Harig, R.; Surawicz, G.; Deutscher, N.M.; Shiomi, K.; Franklin, J.E.; et al. Building the Collaborative Carbon Column Observing Network (COCCON): Long-term stability and ensemble performance of the EM27/SUN Fourier transform spectrometer. Atmos. Meas. Tech. 2019, 12, 1513–1530. [Google Scholar] [CrossRef] [Green Version]
- Mitchell, L.E.; Crosman, E.T.; Jacques, A.A.; Fasoli, B.; Leclair-Marzolf, L.; Horel, J.; Bowling, D.R.; Ehleringer, J.R.; Lin, J.C. Monitoring of greenhouse gases and pollutants across an urban area using a light-rail public transit platform. Atmos. Environ. 2018, 187, 9–23. [Google Scholar] [CrossRef]
- Abdul-Wahab, S.; Al-Rawas, G.; Ali, S.; Fadlallah, S.; Al-Dhamri, H. Atmospheric dispersion modeling of CO2 emissions from a cement plant’s sources. Clean Technol. Environ. Policy 2017, 19, 1621–1638. [Google Scholar] [CrossRef]
- Dimitriou, K.; Bougiatioti, A.; Ramonet, M.; Pierros, F.; Michalopoulos, P.; Liakakou, E.; Solomos, S.; Quehe, P.-Y.; Delmotte, M.; Gerasopoulos, E.; et al. Greenhouse gases (CO2 and CH4) at an urban background site in Athens, Greece: Levels, sources and impact of atmospheric circulation. Atmos. Environ. 2021, 253, 118372. [Google Scholar] [CrossRef]
- Boothroyd, I.M.; Almond, S.; Worrall, F.; Davies, R.K.; Davies, R.J. Assessing fugitive emissions of CH4 from high-pressure gas pipelines in the UK. Sci. Total Environ. 2018, 631–632, 1638–1648. [Google Scholar] [CrossRef]
- Nara, H.; Tanimoto, H.; Tohjima, Y.; Mukai, H.; Nojiri, Y.; Machida, T. Emissions of methane from offshore oil and gas platforms in Southeast Asia. Sci. Rep. 2015, 4, 6503. [Google Scholar] [CrossRef] [PubMed] [Green Version]
- Machida, T.; Matsueda, H.; Sawa, Y.; Nakagawa, Y.; Hirotani, K.; Kondo, N.; Goto, K.; Nakazawa, T.; Ishikawa, K.; Ogawa, T. Worldwide Measurements of Atmospheric CO2 and Other Trace Gas Species Using Commercial Airlines. J. Atmos. Ocean. Technol. 2008, 25, 1744–1754. [Google Scholar] [CrossRef]
- Sun, W.; Deng, L.; Wu, G.; Wu, L.; Han, P.; Miao, Y.; Yao, B. Atmospheric Monitoring of Methane in Beijing Using a Mobile Observatory. Atmosphere 2019, 10, 554. [Google Scholar] [CrossRef] [Green Version]
- Herman, D.I.; Weerasekara, C.; Hutcherson, L.C.; Giorgetta, F.R.; Cossel, K.C.; Waxman, E.M.; Colacion, G.M.; Newbury, N.R.; Welch, S.M.; DePaola, B.D.; et al. Precise multispecies agricultural gas flux determined using broadband open-path dual-comb spectroscopy. Sci. Adv. 2021, 7, eabe9765. [Google Scholar] [CrossRef]
- Li, J.; Yu, Z.; Du, Z.; Ji, Y.; Liu, C. Standoff Chemical Detection Using Laser Absorption Spectroscopy: A Review. Remote Sens. 2020, 12, 2771. [Google Scholar] [CrossRef]
- Wagner, G.A.; Plusquellic, D.F. Multi-frequency differential absorption LIDAR system for remote sensing of CO2 and H2O near 16 µm. Opt. Express 2018, 26, 19420. [Google Scholar] [CrossRef]
- Innocenti, F.; Robinson, R.; Gardiner, T.; Finlayson, A.; Connor, A. Differential Absorption Lidar (DIAL) Measurements of Landfill Methane Emissions. Remote Sens. 2017, 9, 953. [Google Scholar] [CrossRef] [Green Version]
- Refaat, T.F.; Ismail, S.; Koch, G.J.; Rubio, M.; Mack, T.L.; Notari, A.; Collins, J.E.; Lewis, J.; De Young, R.; Choi, Y.; et al. Backscatter 2μm Lidar Validation for Atmospheric CO2 Differential Absorption Lidar Applications. IEEE Trans. Geosci. Remote Sens. 2011, 49, 572–580. [Google Scholar] [CrossRef]
- Yakovlev, S.; Sadovnikov, S.; Kharchenko, O.; Kravtsova, N. Remote Sensing of Atmospheric Methane with IR OPO Lidar System. Atmosphere 2020, 11, 70. [Google Scholar] [CrossRef] [Green Version]
- Meng, L.; Fix, A.; Wirth, M.; Høgstedt, L.; Tidemand-Lichtenberg, P.; Pedersen, C.; Rodrigo, P.J. Upconversion detector for range-resolved DIAL measurement of atmospheric CH4. Opt. Express 2018, 26, 3850. [Google Scholar] [CrossRef] [Green Version]
- Larsson, J.; Bood, J.; Xu, C.T.; Yang, X.; Lindberg, R.; Laurell, F.; Brydegaard, M. Atmospheric CO2 sensing using Scheimpflug-lidar based on a 157-µm fiber source. Opt. Express 2019, 27, 17348. [Google Scholar] [CrossRef] [PubMed]
- Yang, X.; Lindberg, R.; Larsson, J.; Bood, J.; Brydegaard, M.; Laurell, F. 1.57 µm fiber source for atmospheric CO2 continuous-wave differential absorption lidar. Opt. Express 2019, 27, 10304. [Google Scholar] [CrossRef] [PubMed]
- Babchenko, S.V.; Matvienko, G.G.; Sukhanov, A.Y. Assessing the possibilities of sensing CH4 and CO2 greenhouse gases above the underlying surface with satellite-based IPDA lidar. Atmos. Ocean. Opt. 2015, 28, 245–253. [Google Scholar] [CrossRef]
- Ehret, G.; Kiemle, C.; Wirth, M.; Amediek, A.; Fix, A.; Houweling, S. Space-borne remote sensing of CO2, CH4, and N2O by integrated path differential absorption lidar: A sensitivity analysis. Appl. Phys. B 2008, 90, 593–608. [Google Scholar] [CrossRef] [Green Version]
- Fix, A.; Büdenbender, C.; Wirth, M.; Quatrevalet, M.; Amediek, A.; Kiemle, C.; Ehret, G. Optical Parametric Oscillators and Amplifiers for Airborne and Spaceborne Active Remote Sensing of CO2 and CH4; Singh, U.N., Pappalardo, G., Eds.; SPIE: Prague, Czech Republic, 2011; p. 818206. [Google Scholar]
- Cezard, N.; Dolfi-Bouteyre, A.; Durécu, A.; Faure, B.; Goular, D.; Gustave, F.; Hébert, P.-J.; Lahyani, J.; Le Gouët, J.; Lemaître, F.; et al. Recent advances on fiber-based laser and Lidar systems for future space-borne monitoring of greenhouse gas. In Proceedings of the International Conference on Space Optics—ICSO 2020, Virtual, 30 March–2 April 2021; p. 67. [Google Scholar]
- Fix, A.; Amediek, A.; Büdenbender, C.; Ehret, G.; Quatrevalet, M.; Wirth, M.; Löhring, J.; Kasemann, R.; Klein, J.; Hoffmann, H.-D.; et al. Development and First Results of a new Near-IR Airborne Greenhouse Gas Lidar. In Proceedings of the Advanced Solid State Lasers 2015, Berlin, Germany, 4–9 October 2015; p. EM3A.3. [Google Scholar]
- Fix, A.; Amediek, A.; Bovensmann, H.; Ehret, G.; Gerbig, C.; Gerilowski, K.; Pfeilsticker, K.; Roiger, A.; Zöger, M. CoMet: An airborne mission to simultaneously measure CO2 and CH4 using lidar, passive remote sensing, and in-situ techniques. EPJ Web Conf. 2018, 176, 02003. [Google Scholar] [CrossRef] [Green Version]
- Wagner, G.A.; Plusquellic, D.F. Ground-based, integrated path differential absorption LIDAR measurement of CO2, CH4, and H2O near 1.6 μm. Appl. Opt. 2016, 55, 6292. [Google Scholar] [CrossRef]
- Barrientos Barria, J.; Dobroc, A.; Coudert-Alteirac, H.; Raybaut, M.; Cézard, N.; Dherbecourt, J.-B.; Schmid, T.; Faure, B.; Souhaité, G.; Pelon, J.; et al. Simultaneous remote monitoring of atmospheric methane and water vapor using an integrated path DIAL instrument based on a widely tunable optical parametric source. Appl. Phys. B 2014, 117, 509–518. [Google Scholar] [CrossRef]
- Numata, K.; Riris, H.; Li, S.; Wu, S.; Kawa, S.R.; Krainak, M.; Abshire, J. Ground demonstration of trace gas lidar based on optical parametric amplifier. J. Appl. Remote Sens. 2012, 6, 063561-1. [Google Scholar] [CrossRef]
- Peng, W.Y.; Goldenstein, C.S.; Mitchell Spearrin, R.; Jeffries, J.B.; Hanson, R.K. Single-ended mid-infrared laser-absorption sensor for simultaneous in situ measurements of H2O, CO2, CO, and temperature in combustion flows. Appl. Opt. 2016, 55, 9347. [Google Scholar] [CrossRef] [PubMed]
- Diaz, A.; Thomas, B.; Castillo, P.; Gross, B.; Moshary, F. Active standoff detection of CH4 and N2O leaks using hard-target backscattered light using an open-path quantum cascade laser sensor. Appl. Phys. B 2016, 122, 121. [Google Scholar] [CrossRef]
- Frish, M.B.; Wainner, R.T.; Laderer, M.C.; Allen, M.G.; Rutherford, J.; Wehnert, P.; Dey, S.; Gilchrist, J.; Corbi, R.; Picciaia, D.; et al. Low-Cost Lightweight Airborne Laser-Based Sensors for Pipeline Leak Detection and Reporting; Druy, M.A., Crocombe, R.A., Eds.; SPIE: Baltimore, MD, USA, 2013; p. 87260C. [Google Scholar]
- Frish, M.B.; Wainner, R.T.; Laderer, M.C.; Green, B.D.; Allen, M.G. Standoff and Miniature Chemical Vapor Detectors Based on Tunable Diode Laser Absorption Spectroscopy. IEEE Sens. J. 2010, 10, 639–646. [Google Scholar] [CrossRef]
- Ismail, S.; Browell, E.V. LIDAR|Differential Absorption Lidar. In Encyclopedia of Atmospheric Sciences; North, G.R., Pyle, J., Zhang, F., Eds.; Elsevier: Amsterdam, The Netherlands, 2015; pp. 277–288. ISBN 9780123822253. [Google Scholar]
- Climate Change 1995: The Science of Climate Change; Houghton, J.T.; Intergovernmental Panel on Climate Change (Eds.) Cambridge University Press: Cambridge, UK, 1996; ISBN 9780521564335. [Google Scholar]
- Royer, S.-J.; Ferrón, S.; Wilson, S.T.; Karl, D.M. Production of methane and ethylene from plastic in the environment. PLoS ONE 2018, 13, e0200574. [Google Scholar] [CrossRef] [PubMed]
- Gordon, I.E.; Rothman, L.S.; Hill, C.; Kochanov, R.V.; Tan, Y.; Bernath, P.F.; Birk, M.; Boudon, V.; Campargue, A.; Chance, K.V.; et al. The HITRAN2016 molecular spectroscopic database. J. Quant. Spectrosc. Radiat. Transf. 2017, 203, 3–69. [Google Scholar] [CrossRef]
- HITRAN on the Web. Available online: https://hitran.iao.ru/home (accessed on 3 August 2021).
- Differential Absorption Lidar Technique (DIAL). In Elastic Lidar: Theory, Practice, and Analysis Methods; Vladimir, A.; Kovalev; Eichinger, W.E. (Eds.) John Wiley: Hoboken, NJ, USA, 2004; ISBN 9780471201717. [Google Scholar]
- Hellenic Land Registry. Available online: http://gis.ktimanet.gr/ (accessed on 1 September 2021).
- Liou, K.-N. An Introduction to Atmospheric Radiation, 2nd ed.; International Geophysics Series; Academic Press: Amsterdam, The Netherlands; Boston, MA, USA, 2002; ISBN 9780124514515. [Google Scholar]
- Mihalopoulos, N.; Stephanou, E.; Kanakidou, M.; Pilitsidis, S.; Bousquet, P. Tropospheric aerosol ionic composition in the Eastern Mediterranean region. Tellus B Chem. Phys. Meteorol. 1997, 49, 314–326. [Google Scholar] [CrossRef]
- El Yazidi, A.; Ramonet, M.; Ciais, P.; Broquet, G.; Pison, I.; Abbaris, A.; Brunner, D.; Conil, S.; Delmotte, M.; Gheusi, F.; et al. Identification of spikes associated with local sources in continuous time series of atmospheric CO, CO2 and CH4. Atmos. Meas. Tech. 2018, 11, 1599–1614. [Google Scholar] [CrossRef] [Green Version]
- Gialesakis, N.; Kouvarakis, G.; Kalivitis, N.; Ramonet, M.; Mihalopoulos, N.; Delmotte, M.; Lett, C.; Legendre, V.; Kanakidou, M. Interannual and seasonal variability of greenhouse gases at Finokalia station in the East Mediterranean. In Proceedings of the 15th International Conference on Meteorology, Climatology and Atmospheric Physics COMECAP 2021, Ioannina, Greece, 26–29 September 2021; Bartzokas, A., Nastos, P., Eds.; 2021; pp. 58–63. [Google Scholar]
- Koroneos, C.; Haritakis, I.; Michaloglou, K.; Moussiopoulos, N. Energy Analysis for Power Plant Alternative Designs, Part I. Energy Sources 2004, 26, 1277–1285. [Google Scholar] [CrossRef]
- Dlugokencky, NOAA/GML. Available online: http://gml.noaa.gov/ccgg/trends_ch4/ (accessed on 1 September 2021).
- Sheng, J.-X.; Jacob, D.J.; Maasakkers, J.D.; Zhang, Y.; Sulprizio, M.P. Comparative analysis of low-Earth orbit (TROPOMI) and geostationary (GeoCARB, GEO-CAPE) satellite instruments for constraining methane emissions on fine regional scales: Application to the Southeast US. Atmos. Meas. Tech. 2018, 11, 6379–6388. [Google Scholar] [CrossRef] [Green Version]
- Hu, H.; Landgraf, J.; Detmers, R.; Borsdorff, T.; Aan de Brugh, J.; Aben, I.; Butz, A.; Hasekamp, O. Toward Global Mapping of Methane With TROPOMI: First Results and Intersatellite Comparison to GOSAT. Geophys. Res. Lett. 2018, 45, 3682–3689. [Google Scholar] [CrossRef]
- Urban Heat and CO2 Fluxes-RSLab. Available online: http://rslab.gr/heraklion_eddy.html (accessed on 1 September 2021).
- Riris, H.; Rodriguez, M.D.; Allan, G.R.; Hasselbrack, W.E.; Stephen, M.A.; Abshire, J.B. Airborne lidar measurements of atmospheric pressure made using the oxygen A-band. In Proceedings of the Laser Applications to Chemical, Security and Environmental Analysis 2012, San Diego, CA, USA, 29 January–1 February 2012; p. LT2B.5. [Google Scholar]

Publisher’s Note: MDPI stays neutral with regard to jurisdictional claims in published maps and institutional affiliations. |
© 2022 by the authors. Licensee MDPI, Basel, Switzerland. This article is an open access article distributed under the terms and conditions of the Creative Commons Attribution (CC BY) license (https://creativecommons.org/licenses/by/4.0/).