Abstract
In the field of maritime surveillance with satellite imagery, ship detection with Synthetic Aperture Radar (SAR) is largely successful with the exception of those cases where the target Radar Cross Section (RCS) results very low and hard to detect. The paper presents an automatic algorithm that tackles the problem of ship detection in situations where the ship’s RCS is not measurable but its wake is. At this purpose, the algorithm proposed uses a combination of image processing techniques in order to identify ships exclusively by detecting the wakes they leave behind. Once a ship is identified through its wake, its position in the image, its heading and its speed are determined. The algorithm was developed, tested and validated on SAR imagery from the European Space Agency mission Sentinel-1; the results are here presented and discussed. The algorithm was validated on a total of 43 images and resulted in a ship detection rate of 93% with wakes’ components recognized in more than 80% of the cases analysed.
1. Introduction
Efficient ship detection constitutes an important element of marine surveillance since it improves the supervision of activities such as illegal fishing, oil spillage, marine traffic management, smuggling and drug trafficking [1,2]. Standard ship detectors use Synthetic-Aperture Radar (SAR) imagery to find vessels by identifying the energy backscattered from the ship (Radar Cross Section, RCS) in the image [3,4]. In some cases however such a method fails due to the fact that the ships may not be clearly visible. The technique of direct vessel identification has several limitations that depend on the ship and radar characteristics, the sea state conditions and the image quality and resolution. Moreover, the ship’s signature may appear displaced with respect to the actual position of the ship, this phenomenon occurs when the sailing direction presents a component perpendicular to the radar’s direction of flight [5].
Furthermore in some cases ships may be made of non-conducting materials such as fiberglass or wood which are transparent to microwaves leading to a poor or null signature in a radar image. Examples of fiberglass ships are the so-called go-fast ships. Go-fast ships are small, between 10 and 12 m, and very light. These characteristics allow them to reach very high speeds (up to 80 knots) which create characteristic wakes [6]. The transparency of such kind of ships to radars has made them the preferred mean for illegal activities [7].
An alternative methodology for ship detection is the identification of slicks on the ocean surface due to the release of engine or fish oils. However, specific conditions must occur for these ship-related slicks to be visible, in particular there must be a sufficient amount of oil spilled and moderate wind conditions. Finally, a ship may be identified through the detection of its wake. This paper describes and validates a new methodological approach to detecting ships by exclusively identifying their wakes.
Ship detection is a vastly researched topic due to the wide range of possible applications, from maritime security to traffic planning and illegal activity monitoring such as drug trafficking and illegal fishing. The studies of possible ship detection algorithms use a wide spectrum of radar imagery types, such as optical, infrared and SAR [8]. References Elvidge et al. [9] and Lebona et al. [10] present methods for ship detection through optical imagery. Optical imagery’s advantages include the possibility of vessel identification and feature extraction regardless of their size, shape and material composition thanks to the high spatial resolution provided by optical sensors. The performance of these sensors is however limited due to the dependence on light to illuminate the scene under observation precluding the possibility of analysing the scene at night. Moreover, optical sensors cannot see through clouds therefore the weather conditions must be optimal, i.e., no clouds must cover the scene [8].
Thermal infrared spectrum has also been studied for the application of vessel detection since such sensors do not depend on solar illumination. These sensors detect the emissions from the objects in the imaged area allowing the analysis of the area at nighttime. Thermal infrared sensors are however still affected by the weather not allowing visibility with the presence of clouds and of high moisture [8]. References Mirghasemi et al. [11] and Wu et al. [12] amongst others, studied the use of thermal infrared imagery for vessel detection.
SAR imagery allows for the imaging of wide areas at relatively high spatial resolution, in all weather conditions and at all times. It presents however high levels of noise, moreover it does not allow for ship type identification and is more highly prone to false detections [8]. The use of SAR imagery for vessel detection has a vast body of research, using single, double and fully polarimetric products. The approach of target detection using SAR imagery is varied. Papers such as Kouroupis et al. [13], Allard et al. [14] and Ringrose et al. [15] use coherent decompositions of fully polarimetric SAR scattering matrices, such as Cameron’s coherent target decomposition (CTD) and the Odd-Even basis decomposition or use spectral analysis, such as the subaperture coherence, ref. [14], to detect the targets.
When using single polarization SAR data, the most common method of ship target detection consists in determining a threshold that allows distinguishing between the visible target and the sea. The most common of such methods is the constant false alarm rate (CFAR) method. The CFAR method consists in creating an adaptive threshold within a certain area and analysing the pdf of such area [16]. In particular, three windows are selected, one with a size that allows containing a ship, depending on the image’s resolution, a buffer window and a background window that contains the first two. These windows move along the image analysing the pdf within the windows and for each scan, a threshold is applied [17]. The use of the CFAR method has also been used as a starting point to create algorithms that would take into account more factors. Leng et al. [18] propose an improved CFAR algorithm that takes into account not only the pixels’ intensity but also their spatial distribution, allowing to achieve better overall results. Deng et al. [19] have used the CFAR in combination with deep learning which increased the detection speed and its recognition rate. Other algorithms that use single polarization SAR imagery for target detection are also developed [20]. Arnaud et al. [21] uses SAR interferometry and coherency techniques, Liu et al. [16] uses information from polarimetric SAR data in combination with the CFAR. More recently, the GLRT ship detector [22] has gained attention for its better performance with respect to the state of the art, though the inclusion and consideration of a scattering model for the ship leads to an increase of the processing time; on the other hand Yang et al. [23] have introduced a GPU based CFAR method that has significantly improved the computational time with respect to standard CFAR detectors.
Finally, deep learning models are used on SAR imagery for ship detection by adapting object detectors to the situation at hand [16,24]. The main hurdles of this method are, firstly, the presence of geometric distortions that generally present themselves in SAR imagery in the forms of shadowing, foreshortening and layover, which cause a high number of false positives along the coastal areas, consequently, sea-land segmentation must always be performed, and secondly, the lack of large, diversified and labelled datasets, necessary for these types of models to produce high quality performances [2].
Overall the majority of the studies overviewed, whether using double or fully polarimetric SAR products, detect vessels solely through the identification of their signature. Hence the majority of the research focuses on the detection of ships with a clearly visible RCS.
The field of SAR imagery usage for vessel detection through wake identification is instead a less studied one. References [4,25,26] are the few studies presenting an algorithm for wake detection through SAR imagery. The algorithm presented by M.D. Graziano et al. [25] presents a novel approach for the wakes’ pattern recognition within an image section. The algorithm scans the section pixel by pixel and assigns a confidence index of wake presence in such pixel. The confidence index increases if the neighboring pixels’ index is also high as it increases the possibility of the image indeed containing a wake. The Radon transform is used to convert straight lines in the image domain into dots in a transformed domain. The detection algorithm was applied to SAR imagery from TerraSAR-X mission, which is characterised by geometric resolutions of 1.2 m in slant range and 6.6 m in azimuth. The data used was acquired in VV polarisation and at varying incidence angles. Only the turbulent wake and the narrow-V wake’s components were looked for. The presence of a wake is confirmed if both the narrow-V and the turbulent wake are imaged, therefore Ref. [27] proposed an index that took into account the contribution of both wakes to the final identification of the wake. The results presented are at the preliminary stage, in fact results regarding only one image containing three wakes are presented. While within these results only one out of the three wakes is identified, the proposed method is very promising and easily applicable to methods such as ML algorithms and CNNs [27].
The Radon transform however faces a problem when there is some speckle noise affecting the image since it uses the collinearity of points without analysing how these points are distributed. Therefore G. Yang et al. [4] used the Parallel Coordinate Transform (PCT) for noisy images. Moreover in Ref. [4] the original image was not binarised but was instead left in grayscale in order to lose as little information as possible. These elements have led to an improvement in performance. Reference [4] however applies as a first step the detection of the ship’s signature and only then it proceeds to identify the wake, making the method not useful for go-fast ship detections.
Patents regarding the subject are also present. Yang L. et al. [28] propose an algorithm in which the identification of the vessel’s signature followed the application of a series of image processing functions and the subsequent application of the Radon Transform. A few older studies and patents on the topic can be found in the literature [29,30,31]. Apart from Graziano et al. [27], in general the algorithms proposed consist of a three steps approach in which the first step is the detection of the ship’s signature, the second step looks into the processing of the image through various techniques, and finally the third step consists of the detection of the lines composing the wakes. Finally, Karakus et al. [26] propose an inverse approach to the wake detection problem by enhancing the information in the Radon transform and improving the linear features. The solution involves a Bayesian methodology which leads to a maximum a posteriori (MAP) estimator and generalised minimax concave (GMC) penalty of Selesnick for the cost function. This approach provides promising results while simultaneously avoiding ad hoc thresholding for the enhancement of the image.
The following paper seeks to contribute to the field of SAR ship detection by tackling the problem of the identification of ship wakes through a novel approach consisting of image processing and computer vision techniques applied to C-band imagery. The paper is organized as follows: in Section 2 the theory behind the wake detection algorithm is explained and the dataset used for the development and testing of the algorithm is presented. Section 3 describes the methodology of the algorithm proposed. In Section 4 and Section 5 the results are, respectively, presented and discussed. In Section 6, the ship’s speed and heading results are validated and certain particular cases are presented. Finally in Section 7 conclusions are drawn.
2. Theory & Dataset
Ships of small-to-medium sized dimensions, including go-fast ships, create a wake that is a combination of two V-shaped wakes and a turbulent wake. The latter appears as a dark line behind the ship that follows its direction of movement [5]. The two V-shaped wakes are characterised by different possible angle values; one of the V-shaped wakes has a varying half-angle, i.e., angle between one of its arms and the turbulent wake, that can reach a maximum value of ∼19.45°. The second V-shaped wake is characterized by a varying half-angle that can reach a maximum value of 3°. In the paper the wake with the wider angle will be referred to as a V-shaped wake, while that with the narrowest angle will be referred to as a narrow-V wake. The two V-shaped wake components, i.e., their arms, usually appear brighter compared to the background. In most cases only one of the arms of each of the two V-shaped wakes and/or the turbulent wake are visible. Moreover, V-shaped wakes are hardly detectable when the ship is travelling at speeds below 15 knots [3,5] when imaging the area with Sentinel-1 imagery (the products used in this study) due to the characteristics of the sensor, i.e., the frequency band used and its spatial resolution. Figure 1 portrays the various components of the wake just described.
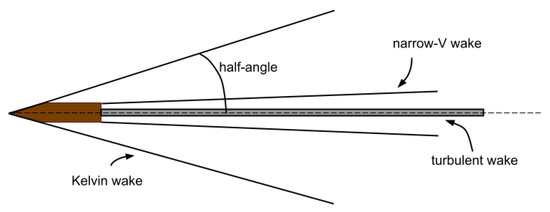
Figure 1.
Diagram of the main components of a wake expected to be visible in SAR imagery.
The V-shaped wake’s angle range depends on the ship’s characteristics, in particular its travelling speed and its length. Darmon et al. [32] describe the link between the half-angle of the V-shaped wake and the Froude number. The Froude number is defined as:
where U is the relative flow velocity between the sea and the vessel, g is the acceleration of gravity and L is the length of the vessel at waterline level. References [32,33] demonstrate that for values of the Froude number bigger than 0.7 the V-shaped wake’s half-angle () can be approximated by:
Due to their small size, light weight and high speed capabilities go-fast ships tend to fall within the higher spectrum of the Froude number and as such, their V-shaped wakes’ half angle can be expected to be approximated with Equation (2). Relationships (1) and (2) are used in the following sections to retrieve the relative velocity of the identified ship when the V-shaped half angle leads to a Froude number greater than 0.7.
Dataset
Sentinel-1 is a mission carried out by the European Space Agency (ESA) within the Copernicus program. The mission images the Earth in 6 days. The sensors operate in C-band [34] and offer data both in single and double polarization mode. The whole dataset used in this research consists of data acquired in Interferometric Wide Swath (IWS) mode and HH polarisation, processed at GRDH level [35]. Part of the dataset is used for the development of the algorithm, part for its testing and validation.
The dataset used for the development comprises a total of 13 images, 10 representing non-go-fast ships and 3 representing go-fast ships. In the context of this paper, for go-fast ships the authors mean ships visible in the image only by means of their wakes.
The testing dataset comprises a total of 43 images, 28 representing non-go-fast ships and 15 representing go-fast ships. Out of the testing dataset images, five were used for the speed and heading validation later described. The data was acquired between July 2018 and May 2019 in the area of the Gulf of Naples (Italy), Singapore and Genoa (Italy). Figure 2 shows an example of a non-go-fast ship and a go-fast ship signatures in SAR images taken from the dataset. For the validation of the results, two preparatory tasks were performed. Firstly, to determine the visibility of the ship, a standard ship detector available from the SNAP toolbox [36] was applied to each image in the dataset. The parameters used were:
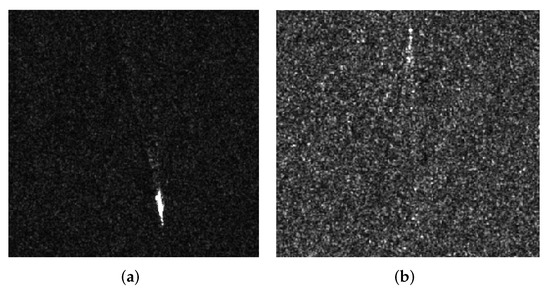
Figure 2.
Examples of a non-go-fast ship wake’s (a) and a go-fast ship wake’s (b) signature in SAR imagery [37].
- Target Window Size: 50
- Guard Window Size: 500
- Background Window Size: 800
- PFA: 12.5
- Minimum Target Size: 30
- Maximum Target Size: 600
The ships not detected, hence visible only through the presence of their wake, were classified as go-fast, while those detected were classified as non-go-fast. Secondly, for the validation of the ships’ speed and direction of movement, data from the Marine Traffic Portal was used. The Marine Traffic Portal provides the AIS (Automatic Identification System) data that each ship passing within a specific geographical area of choice provides to the local authorities The data in the portal is updated every two seconds to three minutes depending on the vessel’s type and moving status [38]. Table 1 and Table 2 present the complete dataset, distinguishing between the elements used during the development and those used during the testing and validation phases.

Table 1.
Development Dataset.
Table 2.
Testing Dataset.
3. Method Description
The scope of the algorithm is to efficiently detect small to medium sized ships and go-fast ships exclusively through the identification of their wakes. Moreover, the algorithm must evaluate the RCS of the ship, if present, in order to distinguish between go-fast and non-go-fast ships. Finally, it must evaluate the backscattering of the wake in order to determine the position, speed and direction of movement of the vessel. Figure 3 presents the flow chart of the wake detector algorithm developed. As described in Section 2 the dataset used consisted in Sentinel-1 C-band imagery, however, the algorithm can be used with any type of SAR imagery. After a preliminary image processing phase, the algorithm is based on two main functions described in the following, a line detection and an error check function. Depending on whether a ship was found or not it finally determines the ship’s characteristics, namely its type, speed and direction of movement.The input image is divided into smaller sections each independently analysed. Each section goes through up to three steps depending on whether a wake is found or not. The dimension of the section was chosen based on the average dimension of a wake, and was such that, when present, it would contain the wake.
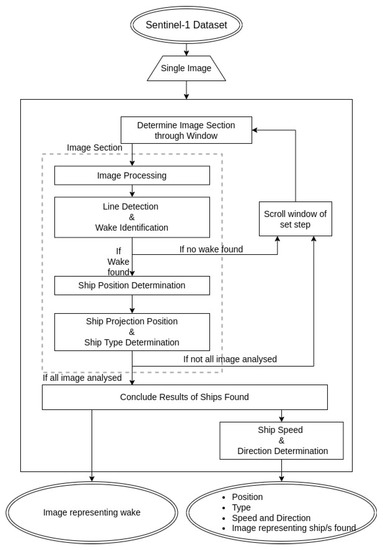
Figure 3.
Block diagram of the wake detection algorithm [37].
3.1. Image Processing
The main focus of the image processing step is to emphasize the particular features withing the image’s section under analysis whilst decreasing the effects of the sensor’s noise. This is done in order to highlight a possible wake within the section under analysis. The step includes a combination of global and adaptive histogram equalization and enhancement. Overall this first step of the algorithm is divided in four sub-steps:
- Brightness Equalization
- Despeckling using a Gaussian filter
- Features enhancement since wakes appear as a particularity in an assumed uniform background, i.e., the sea. This step comprises the execution of three sub-steps:
- (a)
- Adaptive Histogram Equalization: The function used is the Contrast Limited Adaptive Histogram Equalization. In this function contrast limiting is applied, i.e., if any histogram bin is above a certain contrast limit (defined by the user), those pixels are clipped and distributed uniformly to other bins before applying histogram equalization [39]. The tile dimension has been set to pixels and the contrast limit to 20. Such values were chosen after a period of testing on the testing dataset.
- (b)
- Impose to pixel a non-linearly proportional value: Since an important feature will be characterized by a value of pixel different with respect to the background, this difference is wanted to be emphasized. The function used was customed for the specific problem at hand, each pixel value is used as an exponent to a base-two power. The pixel value is first divided by 31 in order to have a resulting value within the range (0–255).
- (c)
- Global Histogram Equalization
- Image Binarization
3.2. Line Detection
The Hough Transform [39] is used for the detection of the lines. The wakes’ arms are expected to be brighter in the image compared to the background, while the turbulent wake is expected to be darker. Hence the algorithm looks for two bright lines and a dark line. The transform accepts a binary image in input. Two binary images are computed, one for the identification of bright lines (emphasizing the brightest pixels in the image) and another for the identification of dark lines (emphasizing the darkest pixels in the image).
For each line found, the Hough transform function returns the characteristics of the line and a score as output. If more than one line is found the line with the highest score is considered one of the arms of the wake. The following lines are then compared with such line in terms of angle aperture, i.e., the second arm must create an angle in the range 8°–40° (40° °, where 19.45° is the maximum possible half-angle of a wake). The angle of 8° on the lower end of the spectrum leads to a half-angle of 4°. As explained in Section 2 a narrow-V wake’s angle creates a maximum half-angle of 3° therefore an angle greater than 3° was chosen in order to avoid the possible identification of the two narrow-V wakes arms as that would lead to a wrong result in the ship’s speed determination. Moreover, two lines are considered components of a wake if they are within a maximum set distance from one another. On the other hand, if only one bright line is found the algorithm will immediately proceed with looking for a dark line. Depending on the number of bright lines detected (one or two), the line detection algorithm will then proceed differently in search of the turbulent wake.
3.2.1. One Bright Line Found
The bright line is assumed to be the arm of the V-shaped wake, hence the algorithm looks for dark lines in the angle range of 6° to 20°. If no turbulent wake is found, no wake is determined to be found.
3.2.2. Two Bright Lines Found
The possibility of one of them being the arm of the narrow-V wake must be investigated. The turbulent wake is looked for in the proximity of each of the bright lines found in the angle range 0°–3°. If a dark line is found, such a line is classified as the turbulent wake; the bright line detected close to it is classified as the narrow-V wake’s arm, while the other is classified as the arm of the V-shaped wake. In case no turbulent wake is found, the two bright lines are classified differently depending on the angle they create. If such angle is in the range of 8°–12°, then the two lines are considered an arm of the narrow-V wake and one of the V-shaped wake, otherwise, the two lines found are considered the two arms of the V-shaped wake. The angle range was chosen based on the typical structure of a wake witnessed during the initial training phase. In the first case two possible turbulent wake’s positions are determined hence two headings of the ship are presented in output.
3.3. Error Check Function
The sea generally represents a uniform background to the wake. However, due to environmental conditions occurring during the acquisition of the image, this may not always be the case. To avoid false identifications due to sea artifacts, the Error Check function is implemented. If bright lines are found in the image, before looking for dark lines the algorithm checks that the lines detected are indeed visible lines in the original non-binary image. Analogously this is done for the detection of dark lines.
For each detected line, its pixels are compared with the surrounding area. The comparison is performed by calculating the absolute value of the difference between the average value of the pixels composing the line and that of the pixels of a window of the surrounding area. If such value is smaller than a set threshold determined during the training phase then the line is deemed as being a sea artifact otherwise it is confirmed as a line. The surrounding area was chosen in order to avoid the pixels in the closest proximity of the detected line since these could also constitute the wake, but also in order to avoid considering an area too far from the detected line, since a change in the sea texture and luminosity could cause an unwanted line confirmation. The surrounding window to analyse was defined as the area far from the detected line in the range of 4 to 8 pixels.
If no wake is found and part of the input image must still be analysed, the window is scrolled of a certain amount of resolution cells defined by considering one order of magnitude smaller than the dimension of the window, and the process is repeated from the first step on the new region. If a wake is found the algorithm proceeds with determining the ship’s position and type.
3.4. Ship Type Determination
Based on the wake’s shape the ship’s expected position is determined as the intersection point between the lines composing the wake. An area around such point is then searched in order to find any ship signature, the presence or absence of which would allow distinguishing between go-fast and non-go-fast ships.
3.5. Ship Direction Determination
The direction of the ship is characterised by two main components: the direction of movement i.e., North, South, East or West and the orientation i.e., the angle with respect to the North.The ship’s direction is determined by comparing the position of the turbulent wake with respect to the estimated position of the ship (not the position of its signature), taking in consideration that the turbulent wake is found behind the travelling vessel. On the other hand, the ship’s orientation is determined by getting the inclination of the turbulent wake since, by definition of turbulent wake, this appears as a straight line behind the travelling vessel. If the turbulent wake was not detected its expected orientation is computed.
When the step is concluded, if part of the image still has to be analysed, the window is scrolled again and the process is repeated on the new section. Once the entire image’s analysis is completed, the algorithm provides the position of the ships found, together with their type, direction and speed based on the characteristics of their related wake. For every ship/wake found the ship speed and direction of movement are evaluated based on Equations (1) and (2).
4. Results
The following testing results highlight the performance of the algorithm in regards to the overall ship detection, the detection of the ship’s signature in the image and the detection of the wake’s components.
4.1. Ship Detection Results
Results can be generally divided in four possible categories:
- True Positives: Ship present and correctly detected
- False Positives: Ship not present but detected
- True Negatives: Ship not present and correctly not detected
- False Negatives: Ship present but not detected
Results of True Negatives are not reported in this study since images without wakes were not tested. An image is analysed in sections of about 1/40 of the entire image based on the fact that an image shall contain the ship and the wake’s signature in their entirety; for every image, many sections containing only sea or masked land were tested, hence testing images not containing wakes would have been redundant.
Overall the algorithm correctly detected 40 out of the 43 wakes of the testing dataset resulting in a 93% correct performance. The validation of these results was performed by visual inspection. A particular case of False Positives was witnessed, i.e., in two cases a double detection of the same ship occurred. This case is discussed in Section 5.1.
4.2. Projection Identification Results
The signature identification process is necessary to classify the type of ship detected, i.e., go-fast or non-go-fast ship. The criteria for the results’ validation was based on the ship detection results provided by the SNAP ship detection toolbox when applied on each SAR image of the dataset, as anticipated in Section 2. The ships not detected by the detector have been classified as go-fast ships, the others as non-go-fast ships. The algorithm performed correctly in 100% of the cases.
4.3. Wake Components Identification Results
In the following, the performance of the algorithm in recognising all the visible wake components to be found is presented, while these results do not affect the outcome of the algorithm in terms of ship detection, they do affect it in terms of the ship’s speed and heading determination. The validation of the results was performed by visual inspection.
For each component of the wake the results are presented in Table 3; they are categorized into:
Table 3.
Results of wakes components’ identification.
- True Positives: Component visible and detected
- False Positives: Wake component wrongly positioned
- True Negatives: Component not visible and not detected
- False Negatives: Component visible but not detected
Overall the algorithm performed correctly over 80% of the times. It detected an element in the wrong position in one single case, later analysed.
5. Results Discussion
5.1. Ship Detection False Positives Analysis
False detections occurred twice. These are generally of two types:
- Sea elements erroneously detected as wakes: particular textures or areas of the sea are wrongly detected as elements of a wake
- Wake elements cause the ship position to be determined in the wrong place or cause a double detection, i.e., the same wake causes the ship to be detected in two difference positions, as if there were two ships
All the false positives recorded fall in the second category, in particular double detections were witnessed in which one of the two determined positions was the actual position of the ship. These cases occur, for example, when the ship changes heading during or just before the SAR image acquisition. In a situation like this the wake would be characterised by non-straight arms. Depending on the most evident part of the arm, a ship may be identified in the wrong place. An attempt has been made to minimize this effect by assuming that only one ship can be present (and detected) in a pixels area, but this method has not always been effective. Moreover, wakes’ arms may be several pixels wide, especially for bigger ships. This difference in nature may cause a false detection if the algorithm recognises one single arm as two separate lines at an acceptable angular difference; or the single arm is correctly recognised as one single entity but with the wrong inclination.
Figure 4 shows, for one of the cases of false detection, the wake identification that determined the correct ship’s position (Figure 4a), and the one that caused the error (Figure 4b).
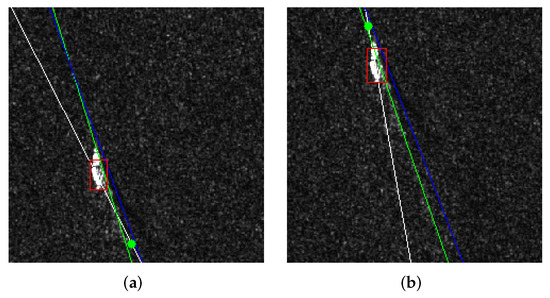
Figure 4.
Case of a components’ False Positive result (a) from a section of an image of the validation dataset compared to a True Positive result (b) from a different section of the same image. This result is due to the wake not being entirely portrayed in the section of case (a) and therefore the ship projection having a prevailing effect on the wake’s line [37].
The error was caused by the algorithm mistaking the inclination of one of the arms which affected the ship position (below the actual position). The fact that the False Positives were only of the second type demonstrates the effectiveness of the Error Check step (Section 3.3). Moreover, having false positives in the proximity of a ship is most certainly less problematic than a false detection in open sea.
5.2. Ship Detection False Negatives Analysis
In regards to the ship detection results, three out of the 43 ships tested were not found. Of these three, all of them were of type non-go-fast ships. One of these three cases is presented in Figure 5. The visible components of its wake were two: an arm of the V-shaped wake and an arm of the narrow-V wake (respectively white and green line in Figure 5a). It was found that the algorithm was capable of detecting only the V-shaped wake’s arm (Figure 5b). The narrow-V wake’s arm, while visible, is much less defined than the V-shaped wake arm, for this reason it was not detected by the algorithm. This situation occurs for wakes caused by medium to large sized ships (as is the case considered). The two other wakes not found by the algorithm are presented in Figure 6.
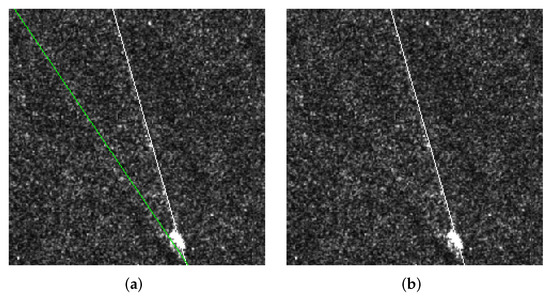
Figure 5.
(a) Two visible components of the wake. The white line indicates the V-shaped wake arm, the green line the narrow-V wake arm. (b) Highlight of the only component detected by the algorithm [37].
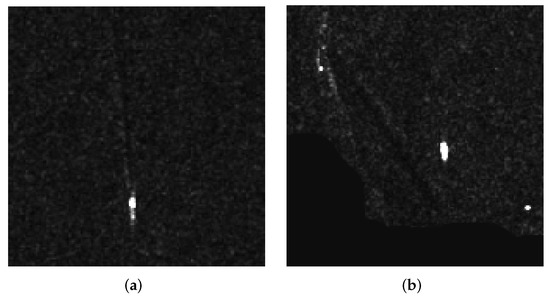
Figure 6.
Two of the three wakes not identified by the algorithm (a,b).
5.3. Wake Components False Positives
Ships may cause artifacts in SAR imagery which may be responsible for false detections. An exemplary case from the validation dataset is presented in Figure 7 where the outputs of the algorithm analysing two different sections of the same image are shown. In Figure 7a, the artifact is visible in the section and one of its components is detected as an arm, i.e., the most vertical line detected. On the other hand, in the section presented in Figure 7b, the artifact is not visible and the wake’s components are correctly identified, i.e., V-shaped wake’s arm (white line), narrow-V wake’s arm (green line) and the turbulent wake (blue line).
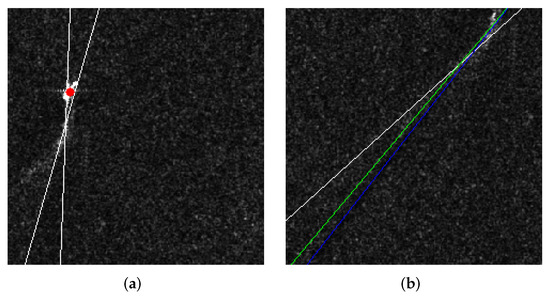
Figure 7.
Two different sections of the same image with an artifact (a) Wrongly identified wake due to the presence of the artifact (b) Correctly identified wake components due to the artifact not being visible [37].
The wake detection result of Figure 7b was the one selected by the algorithm since the case of all three components’ detection has priority in the definition of the wake’s components. This however has not always been the case, causing an error in 1.67% of the cases.
6. Speed and Heading Validation
Five of the cases from the testing dataset were used for the validation of the algorithm’s ship speed and heading determination performance. The ground-truth data used for the validation was acquired through the Marine Traffic portal. As explained, the ship’s heading was determined by analysing the orientation and the position of the turbulent wake in comparison with the ship’s position since such wake appears as a dark line behind the ship that follows the course of the ship. If a turbulent wake was not found, its expected position was determined. In certain cases, two possible headings were identified (see Section 3.2). Table 4 presents the results of the algorithm compared to the data from the Marine Traffic portal regarding the heading () of the ship and its speed (v) expressed in Bearings and in Azimuths.
Table 4.
Algorithm results of the heading () expressed in Azimuths and Bearings and of the speed (v), their relative ground-truth data from the Marine Traffic portal (with heading expressed in Aziumth) and their related error () for each of the five wakes analysed.
6.1. Validation Results Analysis
Figure 8 shows the ship and wake detection results of three out of the five images used for the ships’ speed and heading validation. The blue lines indicate the turbulent wakes found, the green lines the narrow-V shaped wakes’ arms and the white lines the V-shaped wakes’ arms; unless the distinction between the two arms’ types cannot be made, then both bright lines detected are indicated with white lines. It must be noted that the near-real-time Marine Portal does not provide the AIS information of the ships at the same rate with which the ships provide the information to the local authorities. Information are updated every several minutes therefore the Ground-Truth data is not exact but it is possible to perform an overall estimation of the speed and heading of the ship in the minutes in which the SAR image was acquired.
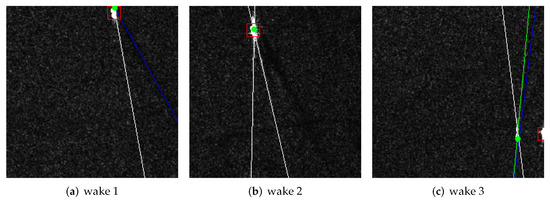
Figure 8.
Ship and wake detection results of three of the five images used for the ships’ speed and heading validation. The wake numbers correspond to those in Table 4. The blue line indicates the turbulent wake (a,c), the green the narrow-V wake’s arm (b) and the white line the V-shaped wake’s arm; unless these latter two could not be distinguished, in such case all the wake’s components are indicated with white lines (b).
6.1.1. Speed
The speed was not determined in two out of the five cases presented (cases 1 and 5). For case one, this was due to the half angle being 19°. Such angle causes the Froude number to be lower than 0.7 and therefore for it to be outside of the existence conditions of Equations (1) and (2).
As for case five, the calculated speed was above 80 knots, such speed is not possible for a ship to reach and was therefore deemed incorrect by the algorithm and not presented. The reasoning for such a high speed was that the algorithm identified the narrow-V-shaped wake’s arm as the arm of the V-shaped wake determining the half angle to be 3.71°. For the cases in which the ship’s speed was determined, the error varied between 1.5 knots and 5.7 knots (1 knot∼0.514 m/s [6]).
6.1.2. Heading
The algorithm always provides a result for the heading. The errors related to the heading vary between 0° and 13.7° and overall result in an average error of 4°. Except for the case of the error of 13.7°, all other errors are below 5° with three out of the four of them below 1°. The error of 13.7° resulted from a particular case in which one of the arms of the wake was darker than the background and therefore the algorithm recognised it as a turbulent wake (Figure 8a). Otherwise, the algorithm performed correctly, identifying the turbulent wake in the correct position, or in the case of no turbulent wake found, providing the correct possible intervals for the heading. The case of the 5° error is possibly due to the Marine Portal not providing the update of the heading at the exact moment of acquisition of the SAR imagery. This can be concluded by analysing the position of the identified wake components since the position of the wake’s components and specifically the turbulent wake determined by the algorithm is correct.
6.1.3. Particular Case
Wake two (Figure 8b) represents a case in which two bright lines were found at an angle higher than 8°, but no turbulent wake was detected. The algorithm considers the two lines to be an arm of the narrow-V wake and an arm of the V-shaped wake but cannot determine which one is which and therefore provides intervals of possible values both for the speed and for the heading. For the heading, two possible intervals are provided, one considering one of the bright lines as the narrow-V wake’s arm and one considering the other bright line as such. Since the angle between the narrow-V wake’s arm and the turbulent wake sees a possible amplitude variation between 0° and 3°, the heading intervals that result range in a spectrum of 3°, i.e., the ±1.5° seen in the algorithm results section of Table 4. Based on such intervals, the half-angle range of the wake is calculated, hence also the speed will result in a range of possible values.
6.2. Impact of Error Check Step
This step was not considered in the initial implementation of the algorithm due to the assumption that the sea is mostly uniform in terms of brightness and texture, at least in a small window; this was however not always the case. The lack of uniformity of the sea caused by a plethora of different environmental conditions caused unwanted errors due to the nature of the algorithm being implemented. Figure 9 shows the results on a particularly uneven sea area of the initial implementation of the algorithm (Figure 9a) and the results of the algorithm once the Error Check Step (Section 3.3) was included (Figure 9b).
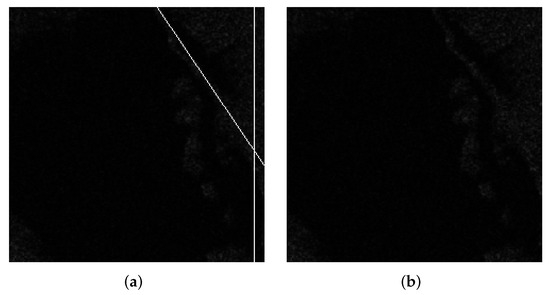
Figure 9.
Results example of a section processed with the algorithm without the Error Detection step (a) and with the Error Detection step (b).
6.3. Ship Artifacts
Ships in SAR imagery may present a signature shaped as a four-pointed-star, as shown in Figure 10a. These artifacts may cause false detections since their components may be identified as an arm of a wake.
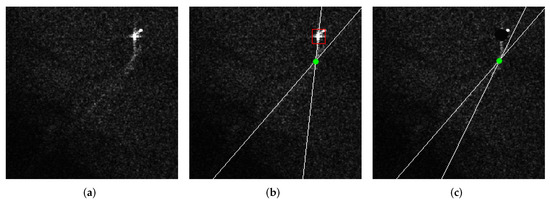
Figure 10.
(a) Section showing the wake and its ship’s projection artifact (b) Result of algorithm analysing the image with the artifact (c) Result of algorithm analysing the same image with masked artifact.
Figure 10 presents the section of an image from the validation dataset in which one of the detected components was misplaced (Figure 10b). The same image was then tested after having masked the signature of the ship. The image with the masked ship projection was then newly tested. Figure 10b portrays the results of the testing of the algorithm on the image with the visible artifact while Figure 10c shows the result of the algorithm on the same section with the masked ship signature. While in the first case the algorithm wrongly identified a component of the artifact as an arm, in the latter case the algorithm correctly identified the wake’s components.
7. Conclusions
In this paper, a novel algorithm able to detect ships exclusively from their wakes was presented. The application of a wake detector is of particular interest in situations where there is a good likelihood that wakes are visible even if the corresponding vessels are not. Contrary to similar previous state-of-the-art, the images analysed covered a widely extended area of ocean not allowing for a fair comparison to be made amongst different techniques. A total of 56 images portraying a wake and in thirty-eight of the cases the ship’s projection, taken from Sentinel-1 products, were used for the development and testing of the algorithm presented. The algorithm resulted in a 93% success rate, meaning that forty out of the forty-three ships composing the testing dataset were correctly identified. A wake is seen as composed of five elements, the arms of the three sub-wakes that compose a wake and that are imaged as either bright or dark lines in the sea. Out of these five elements, the algorithm looks for three, namely one of the arms of each sub-wake, and deems an object in the image to be a wake if at least two out of the three lines are detected at particular angle positions and below a set distance between one another. Out of the three wakes not found at least one of the arms was always found. In one case the wake corresponded to that of a medium to large sized ship, which caused the arms to be not well defined. Such ships and therefore wakes are not important for the scope of the study since they always present a very visible signature, however, this means that this algorithm cannot be considered a universal ship wake detector since certain indexes would have to be adjusted for this scenario.
Some further limitations in the algorithm have been discussed. The problem of the presence of ship signature artifacts and how they may cause problems in the detection of the wakes’ components has been presented. While this did not affect the detection of the ship itself, it did affect the identification of the wake’s components and hence of the ship’s heading and speed. It was then presented how the removal of the artifact from the image before the application of the wake detector eliminated the components’ false detection.
Based on the limitations just discussed, a future step could be to consider adopting the wake detector in combination with another ship detector which masks the ships’ signatures once detected. Considering the type of ships whose wakes were not found, this additional step may also help improve the algorithm’s overall ship detection performance and create a more universal ship detector.
A validation for the ship’s speed and heading determination was performed. Overall the ship’s velocity calculation resulted in a ∼3 knots error and the heading in a ∼4° error. While very limited in terms of the number of images used, this validation allowed to substantiate the methods used to assess such values.
The paper also presents the problem that sea artifacts may bring in causing False Positives. While the assumption of considering the sea surface uniform is valid, this is valid only in limited circumstances such as in open sea scenarios and in situations with low wind conditions as discussed also by Reference [25]. Sea artifacts were found in a dataset composed of only thirteen sea images and it is therefore believed that they should not be considered as a rare event but instead be included in any algorithm dealing with wake detection through line identifications. Finally, the algorithm presented uses low computationally expensive techniques allowing for potential real-time analysis of the area under investigation.
The results presented pave the way for further studies relating the application of the Hough transform to wake detectors and have identified soft spots that should be further addressed with any type of wake detector involving line identifications. Since the wake detector has been tested on Sentinel-1 SAR images only, further validation on additional SAR datasets from different missions or with different settings of the radar is required. In particular, it would be of great advantage using radar imagery with higher spacial resolution since the elements of the wake would appear more clearly and therefore facilitate the identification.
Author Contributions
Conceptualization, E.G. and R.G.; methodology, E.G.; software, E.G.; validation, E.G.; formal analysis, E.G.; data curation, E.G.; writing—original draft preparation, E.G.; writing—review and editing, E.G. and R.G.; supervision, R.G. All authors have read and agreed to the published version of the manuscript.
Funding
This research received no external funding.
Conflicts of Interest
The authors declare no conflict of interest.
References
- Maritime Surveillance—EU Science Hub. Available online: https://ec.europa.eu/jrc/en/research-topic/maritime-surveillance (accessed on 1 February 2019).
- Wang, Y.; Wang, C.; Zhang, H.; Dong, Y.; Wei, S. A SAR Dataset of Ship Detection for Deep Learning under Complex Backgrounds. Remote Sens. 2019, 11, 765. [Google Scholar] [CrossRef]
- Graziano, M.D.; Grasso, M.; D’Errico, M. Performance Analysis of Ship Wake Detection on Sentinel-1 SAR Images. Remote Sens. 2017, 9, 1107. [Google Scholar] [CrossRef]
- Yang, G.; Ma, H.; Sun, W. Detection of Ship Wakes in SAR Images Using Grayscale Parallel Coordinate Transform. In Proceedings of the International Conference on Remote Sensing, Environment and Transportation Engineering (RSETE), Nanjing, China, 26–28 July 2013. [Google Scholar]
- Pichel, W.G.; Clemente-Colòn, P.; Wackerman, C.C.; Friedman, K.S. SAR Imaging of Ocean Surface. In Synthetic Aperture Radar Marine User’s Manual; U.S. Department of Commerce: Washington, DC, USA, 2004. [Google Scholar]
- Tunaley, J. Smuggler and Pirate Go-Fast Boats. 2019. Available online: https://london-research-and-development.com/GOFAST.pdf (accessed on 1 March 2019).
- The Picuda: A Wave-Breaking Go-Fast Wonder that Defies Radar Detection. Available online: https://dialogo-americas.com/en/articles/picuda-wave-breaking-go-fast-wonder-defies-radar-detection (accessed on 1 March 2019).
- Kanjir, U.; Greidanus, H.; Oštir, K. Vessel detection and classification from spaceborne optical images: A literature survey. Remote Sens. Environ. 2018, 207, 1–26. [Google Scholar] [CrossRef]
- Elvidge, C.D.; Zhizhin, M.; Baugh, K.; Hsu, F.C. Automatic boat identification system for VIIRS low light imaging data. Remote Sens. 2015, 7, 3020–3036. [Google Scholar] [CrossRef]
- Lebona, B.; Kleynhans, W.; Celik, T.; Mdakane, L. Ship detection using VIIRS sensor specific data. In Proceedings of the IEEE International Geoscience and Remote Sensing Symposium (IGARSS), Beijing, China, 10–15 July 2016; pp. 1245–1247. [Google Scholar]
- Mirghasemi, S.; Yazdi, H.S.; Lotfizad, M. A target-based color space for sea target detection. Appl. Intell. 2012, 36, 960–978. [Google Scholar] [CrossRef]
- Wu, W.; Luo, J.; Qiao, C.; Shen, Z. Ship recognition from high resolution remote sensing imagery aided by spatial relationship. In Proceedings of the International Conference on Spatial Data Mining and Geographical Knowledge Services (ICSDM), Fuzhou, China, 29 June–1 July 2011. [Google Scholar]
- Kouroupis, G.; Anastassopoulos, V. A Markov chain model based on Cameron’s CTD ship detection scheme. In Proceedings of the IEEE International Conference on Imaging Systems and Techniques (IST), Chania, Greece, 4–6 October 2016; pp. 100–105. [Google Scholar]
- Allard, Y.; Germain, M.; Bonneau, O. Ship Detection and Characterization Using Polarimetric SAR Data. In Harbour Protection through Data Fusion Technologies; NATO Science for Peace and Security Series C: Environmental Security (NAPSC); Springer: Berlin/Heidelberg, Germany, 2009; pp. 243–250. [Google Scholar]
- Ringrose, R.; Harris, N. Ship detection using polarimetric SAR data. In Proceedings of the SAR Workshop: CEOS Committee on Earth Observation Satellites, Toulouse, France, 26–29 October 1999; pp. 687–691. [Google Scholar]
- Liu, G.; Zhang, X.; Meng, J. A Small Ship Target Detection Method Based on Polarimetric SAR. Remote Sens. 2019, 11, 2938. [Google Scholar] [CrossRef]
- Wackerman, C.; Friedman, K.; Pichel, W.; Clemente-Colón, P.; Li, X. Automatic Detection of Ships in RADARSAT-1 SAR Imagery. Can. J. Remote Sens. 2001, 27, 568–577. [Google Scholar] [CrossRef]
- Leng, X.; Ji, K.; Yang, K.; Zou, H. A Bilateral CFAR Algorithm for Ship Detection in SAR Images. IEEE Geosci. Remote Sens. Lett. 2015, 12, 1536–1540. [Google Scholar] [CrossRef]
- Deng, H.; Pi, D.; Zhao, Y. Ship Target Detection Based on CFAR and Deep Learning SAR Image. J. Coast. Res. 2019, 94, 161–164. [Google Scholar] [CrossRef]
- Iervolino, P.; Guida, R.; Lumsdon, P.; Janoth, J.; Clift, M.; Minchella, A.; Bianco, P. Ship detection in SAR imagery: A comparison study. In Proceedings of the International Geoscience and Remote Sensing Symposium (IGARSS), Fort Worth, TX, USA, 23–28 July 2017. [Google Scholar]
- Arnaud, A. Ship detection by SAR interferometry. In Proceedings of the IEEE 1999 International Geoscience and Remote Sensing Symposium. IGARSS’99, Hamburg, Germany, 28 June–2 July 1999; Volume 5, pp. 2616–2618. [Google Scholar] [CrossRef]
- Iervolino, P.; Guida, R. A Novel Ship Detector Based on the Generalized-Likelihood Ratio Test for SAR Imagery. IEEE J. Sel. Top. Appl. Earth Obs. Remote Sens. 2017, 10, 3616–3630. [Google Scholar] [CrossRef]
- Yang, H.; Zhang, T.; He, Y.; Dan, Y.; Yin, J.; Ma, B.; Yang, J. GPU-Oriented Designs of Constant False Alarm Rate Detectors for Fast Target Detection in Radar Images. IEEE Trans. Geosci. Remote Sens. 2022, 60, 5231214. [Google Scholar] [CrossRef]
- Li, Y.; Zhang, S.; Wang, W.Q. A Lightweight Faster R-CNN for Ship Detection in SAR Images. IEEE Geosci. Remote Sens. Lett. 2020, 19, 4006105. [Google Scholar] [CrossRef]
- Graziano, M.D.; Renga, A. Towards Automatic Recognition of Wakes Generated by Dark Vessels in Sentinel-1 Images. Remote Sens. 2021, 13, 1955. [Google Scholar] [CrossRef]
- Karakuş, O.; Rizaev, I.; Achim, A. Ship Wake Detection in SAR Images via Sparse Regularization. IEEE Trans. Geosci. Remote Sens. 2020, 58, 1665–1677. [Google Scholar] [CrossRef]
- Graziano, M.D. Preliminary Results of Ship Detection Technique by Wake Pattern Recognition in SAR Images. Remote Sens. 2020, 12, 2869. [Google Scholar] [CrossRef]
- Tsinghua University. Complicated Background SAR Image Naval Ship Tail Track Detection Method. Chinese Patent CN103985125B, 15 February 2017. [Google Scholar]
- Third Institute of Equipment Research. Method for Detecting Ship Trail of Ocean Synthetic Aperture Radar Image. Chinese Patent CN102542277B, 25 March 2015. [Google Scholar]
- Hitachi Metals Ltd. Device for Automatically Detecting Wake of Ship. European Patent EP3785824A4, 17 November 2021. [Google Scholar]
- Vishay Vitramon Inc. System for Detection of Objects with Given, Known Characteristics against a Background. Japanese Patent 4829306, 7 December 2011. [Google Scholar]
- Darmon, A.; Benzaquen, M.; Raphaël, E. Kelvin wake pattern at large Froude numbers. J. Fluid Mech. 2014, 738, R3. [Google Scholar] [CrossRef]
- Tunaley, J.K. Wakes from Go-Fast and Small Planing Boats; London Research and Development Centre: London, UK, 2014. [Google Scholar]
- Std. 521-2002; IEEE Standard Letter Designations for Radar-Frequency Bands. IEEE: Piscataway, NJ, USA, 2002.
- Sentinel-1 Datasheet, SP-1322/1, March 2012. Available online: https://sentinel.esa.int/documents/247904/349449/s1_sp-1322_1.pdf (accessed on 1 December 2018).
- SNAP Toolbox Details. Available online: http://step.esa.int/main/toolboxes/snap/ (accessed on 1 April 2019).
- Grosso, E.; Guida, R. A New Automatic Ship Wake Detection for Sentinel-1 Imagery. In Proceedings of the 2020 IEEE International Geoscience and Remote Sensing Symposium, IGARSS 2020, Waikoloa, HI, USA, 26 September–2 October 2020; pp. 1259–1262. [Google Scholar] [CrossRef]
- How Often Do the Positions of the Vessels Get Updated on MarineTraffic? Available online: https://help.marinetraffic.com/hc/en-us/articles/217631867-How-often-do-the-positions-of-the-vessels-get-updated-on-MarineTraffic- (accessed on 8 November 2022).
- Szeliski, R. Computer Vision: Algorithms and Applications; Springer: Berlin/Heidelberg, Germany, 2011. [Google Scholar]


Publisher’s Note: MDPI stays neutral with regard to jurisdictional claims in published maps and institutional affiliations. |
© 2022 by the authors. Licensee MDPI, Basel, Switzerland. This article is an open access article distributed under the terms and conditions of the Creative Commons Attribution (CC BY) license (https://creativecommons.org/licenses/by/4.0/).