1. Introduction
Astronomical observations in the millimeter/submillimeter (mm/submm) range of the electromagnetic spectrum are limited by the Earth’s atmosphere. In this spectral range, the Earth’s atmosphere causes a significant attenuation of radiation. One of the main atmospheric gases that is responsible for attenuating radiation in the atmosphere is water vapor. In particular, precipitable water vapor (PWV) is often used for the site characterization. The amount of precipitable water vapor corresponds to the height of the water layer (in mm or cm), which would be formed by complete condensation of the water vapor from a column of atmospheric air with the area of 1 . With a decrease in the content of water vapor, which is distributed along the telescope’s line of sight, transparency of the atmosphere increases.
A number of areas and sites with low water vapor content suitable for mm/submm astronomical observations are known in the world. For example, one of the areas with low water vapor content is the Chajnantor plateau in the Chilean Andes at ∼5000 m elevation above sea level, where the Atacama Large Millimeter/Submillimeter Array (ALMA) is located [
1].
Table 1 lists medians of precipitable water vapor at the sites with good astroclimatic conditions [
2,
3,
4,
5,
6]. In particular, the measurement data show that the medians of PWV at the Chajnantor Plateau are 2.56 mm and 0.72 mm in January and August, respectively. At the Chajnantor summit, the medians of PWV decrease significantly, to 1.08 mm in January and 0.54 mm in August.
A pronounced minimum of PWV is observed in Antarctica. Year-round median values of the PWV at the sites of Dome A, Dome C and the South Pole are listed in
Table 1. Due to low air temperatures, the sites of Dome A, Dome C [
7,
8] and the South Pole are characterized by very low content of water vapor. At these sites, annual medians of PWV do not exceed 0.30 mm.
For comparison,
Table 1 lists the medians of PWV for sites, such as Cerro Macon and Mauna Kea [
2], which are characterized by very high astroclimatic parameters. The medians at these sites are slightly higher than in Antarctica and equal to 1.02 mm and 1.44 mm at Cerro Macon and Mauna Kea, respectively.
In addition, one of the sites with low and moderate PWV is the Karakaya Hills in Erzurum city. An analysis of the radiosonde data at this site (located at 3170 m above sea level) showed that the median of PWV is 2.7 mm for the period 6 October 2016–15 January 2017. The median increased to 4.00 mm for 1 January 2016–26 September 2017 [
6].
In the northern hemisphere, the Tibet Plateau is an area suitable for millimeter and submillimeter observations [
9,
10]. In particular, Zhao et al. [
11] showed that the Lenghu site has very low PWV, ∼1 mm. Amplitudes of intraday PWV fluctuations do not exceed 0.5 mm. In addition, Shantikumar S. Ningombam et al. studied the driest locations in Tibet and compared them with well-known astronomical sites in the world [
12,
13]. The authors highlighted three sites with high astroclimatic characteristics, including Hanle, Merak and Ali sites within the Himalayan region. The year-round medians of PWV at the Himalayan sites varied from 2.16 mm (Merak) to 2.23 mm (Hanle). Another promising site is Muztag -Ata. Xu et al. found that the annual median of PWV was 2.28 mm and 2.37 mm in 2018 and 2019, respectively [
5]. At this site, the driest period with the median less than 2 mm is observed from October to March.
Although some sites with low water vapor content are known, further detailed astroclimatic studies are required for developing a ground-based network of mm/submm telescopes [
14,
15].
PWV is often estimated using radiosonde data [
16,
17,
18,
19,
20]. However, the rather sparse network of stations, especially in mountainous regions, as well as the rare frequency of launching radiosondes, do not allow for detailed studies. Other possibilities for estimation of PWV are based on use of GPS data, GNSS data or MODIS observations [
21,
22].
The most optimal approach for preliminary estimation of PWV within a large region is use of reanalysis data [
23,
24,
25]. The reanalysis data makes it possible to evaluate statistically representative atmospheric parameters including not only PWV, but also other characteristics relevant for astronomical observations (for example, total cloud cover, wind speed, air temperature, atmospheric boundary height, seeing, the Richardson parameter) [
26,
27,
28]. Comparison between PWV changes estimated with the help of satellite and ground-based instruments and reanalysis-derived PWV changes shows a close relationship. For example, Kumar et al. found that at the Varanasi the correlation coefficient between the GPS-derived PWV and the PWV estimated from the Era-Interium reanalysis is close to 0.86 [
29]. An analysis of the MODIS-PWV and the Era-5 derived PWV showed that the correlation coefficients are above 0.9 over most of China [
22]. The area-averaged correlation coefficient is ∼0.98. The low correlation coefficients are observed near the southwestern border of China (∼0.62).
Long-period changes in PWV show that the Mediterranean coasts, the Alps and northern and inland Europe are characterized by large correlation coefficients (more than 0.97) [
30]. The root mean square deviations estimated between changes in the Era-5 PWV and the GPS-PWV range from 1.0 to 1.6
for the Mediterranean coasts and the Alps and from 0.5 to 1.0
for northern and inland Europe. In addition, the studies over Russia showed that MODIS data overestimates the atmospheric optical depth associated with PWV compared to the data of ground-based actinometric observations [
31].
This paper is a continuation of our astroclimatic studies in the application of optical, millimeter and submillimeter astronomy [
32,
33,
34]. We discuss the results of a quantitative analysis of atmospheric characteristics, including mean values, medians, mean absolute error, root mean square deviation and correlation coefficient [
35,
36,
37,
38]. The study is being carried out to determine the best sites for ground-based mm/submm telescopes as part of the ESMT Submillimeter Teselscopes (ESMT) project [
34,
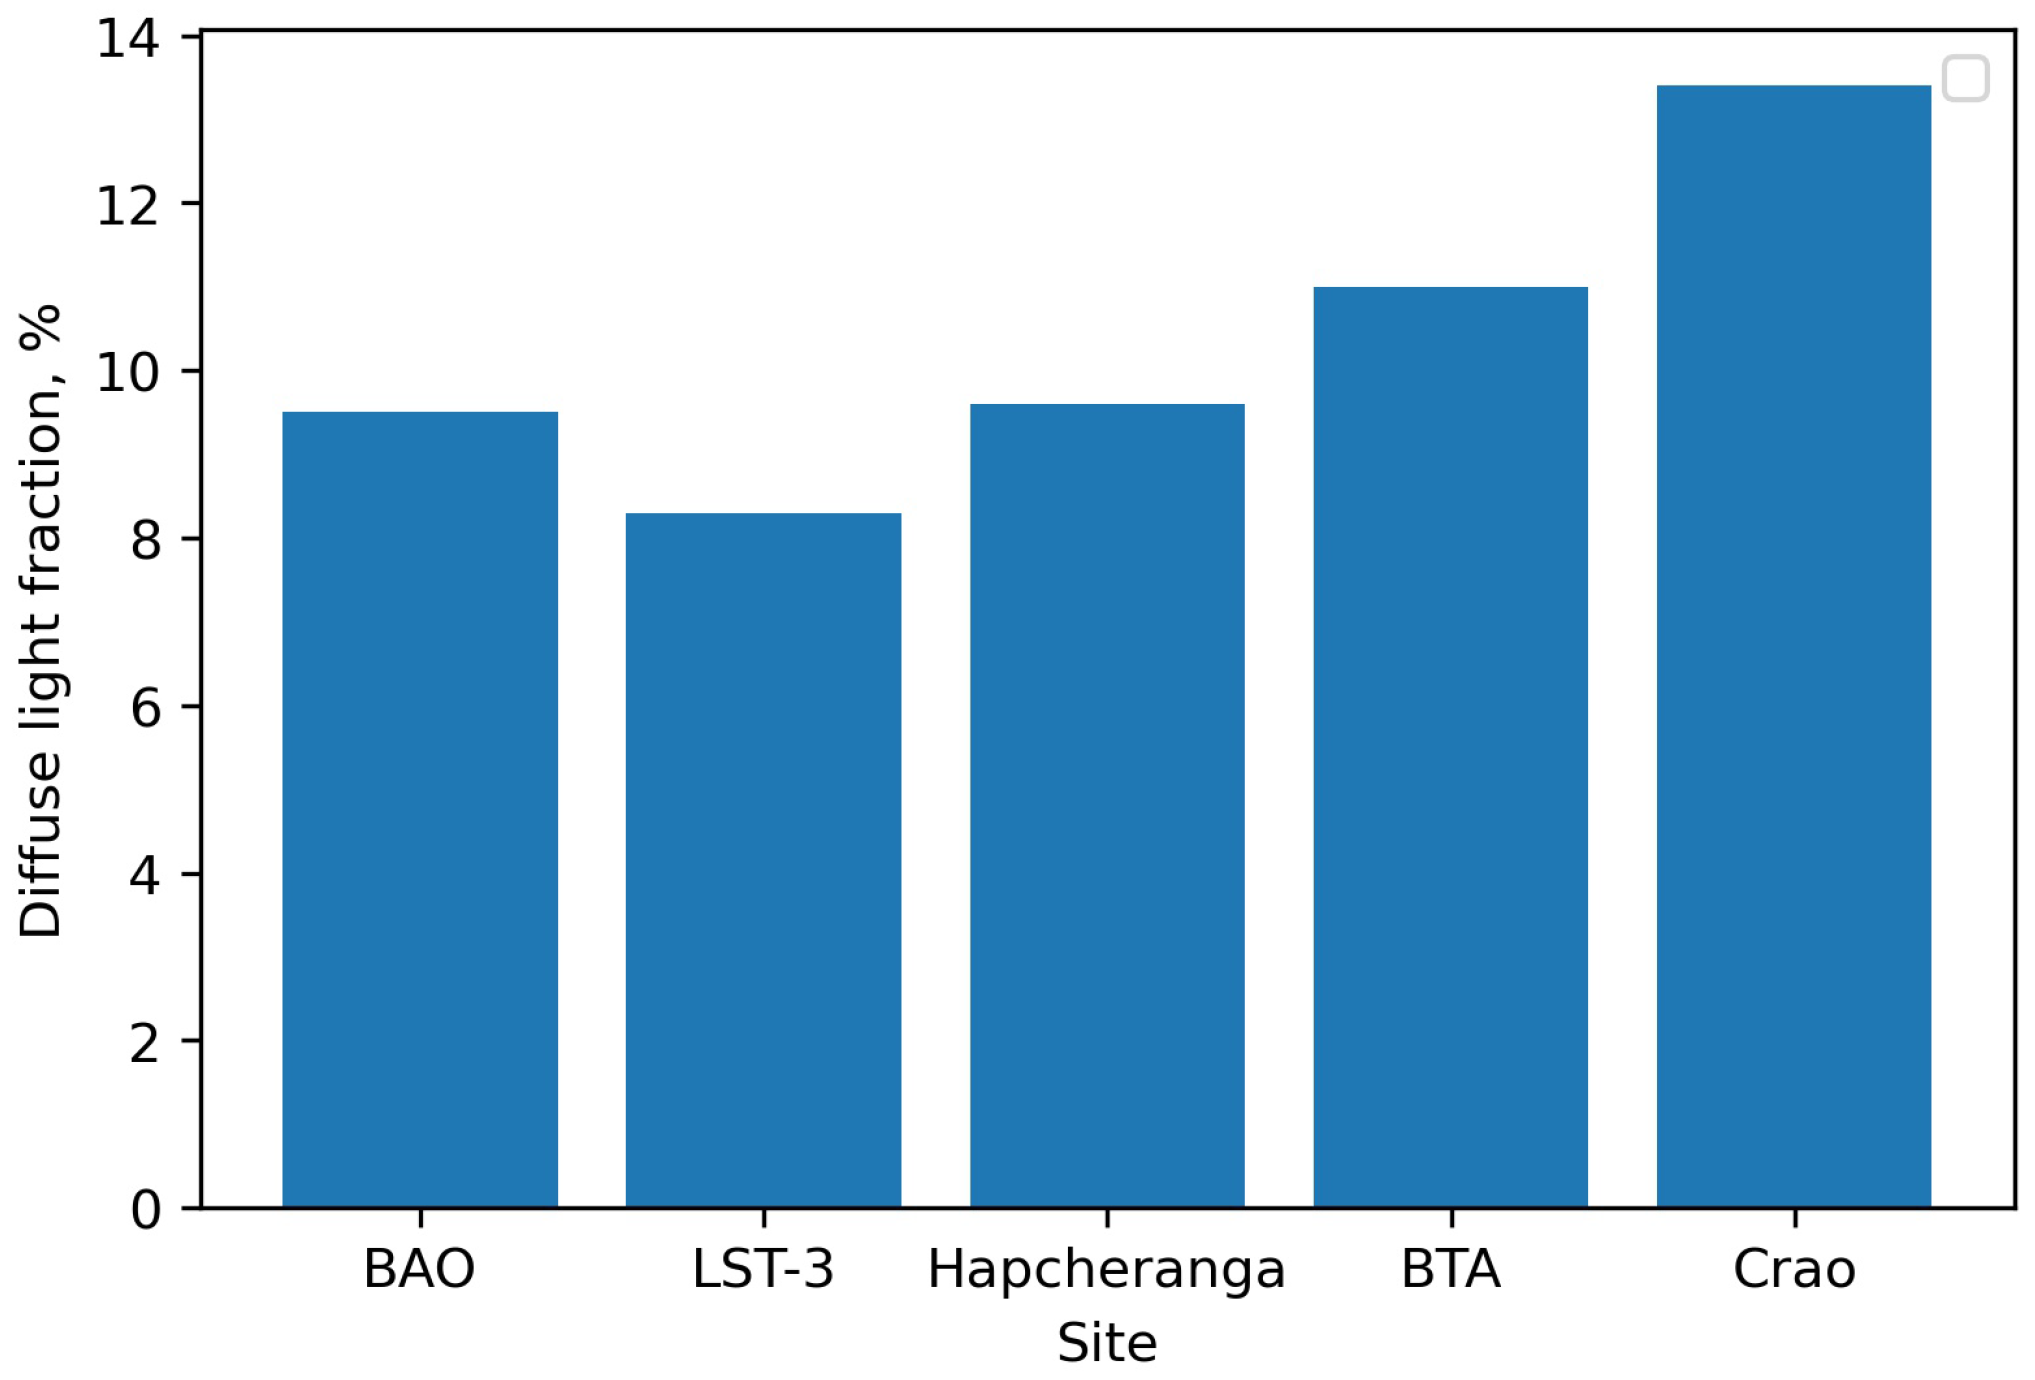
39]. Within this project, it is planned to design three mm/submm telescopes in Russia, Uzbekistan and China. We should also note that our studies cover locations with low values of atmospheric diffuse light ranging from 8.3 to 13% (
Figure 1). These locations are Baykal Astrophysical Observatory (BAO), Large Solar Telescope (LST-3), Big Telescope Alt-Azimuthal, Crimean Astrophysical Observatory and the Hapcheranga site [
34,
39].
2. Data Method to Correct Precipitable Water Vapor Values
In order to estimate spatial distributions of precipitable water vapor, we used the Era-5 reanalysis database [
40]. The Era-5 reanalysis data are available with hourly resolution. The horizontal resolution is 0.25
. In our study, we used isobaric levels from 1000 hPa to 30 hPa. Each isobaric level corresponds to a certain altitude in the atmosphere.
One of the approaches used for estimating PWV is integration of specific air humidity vertical profiles. In particular, the PWV is calculated using the formula:
where
is the water density (1000
), g is the gravitational acceleration (
),
is the air specific humidity (g/kg),
P is the atmospheric pressure (hPa),
is the air pressure near the Earth’s surface (hPa), which defines the lower integration limit, and
is the air pressure at the altitude corresponding to the upper integration limit (hPa). The upper integration limit is chosen quite arbitrarily. The arbitrary choice of the upper limit is due to low content of water vapor in the upper layers of the atmosphere. At an altitude of 1.5–2 km, the water vapor pressure is half that at the Earth’s surface, in average. The troposphere (atmospheric layer, from Earth’s surface up to 10–12 km) contains 99% of the atmospheric water vapor. In the calculations, we assumed that the upper limit of integration is 30 hPa.
A significant problem is choice of the lower integration limit, as the lower part of the atmosphere (so-called dynamic atmospheric boundary layer) makes the largest contribution to and, thereby, optical thickness. Radiosonde data and reanalysis make it possible to estimate separately by integrating the vertical profiles in air humidity, as well as to estimate the lower integration limit at the reference radiosounding station. For choosing the lower integration limit, we use either surface air pressure measurements or the approximation of the standard atmosphere.
Another approach applied for estimation of atmospheric water vapor statistics is based on the hourly values of
, which are available in the Era-5 reanalysis database. Direct use of the reanalysis data leads to overestimated values of
, especially for mountainous areas. The input data in the reanalysis corresponds to a certain volume box limited by grid node. In this case, we can note that
values must be corrected. The Era-5 reanalysis data, which include
values, profiles of meteorological values and modeled relief, have a limited spatial resolution.
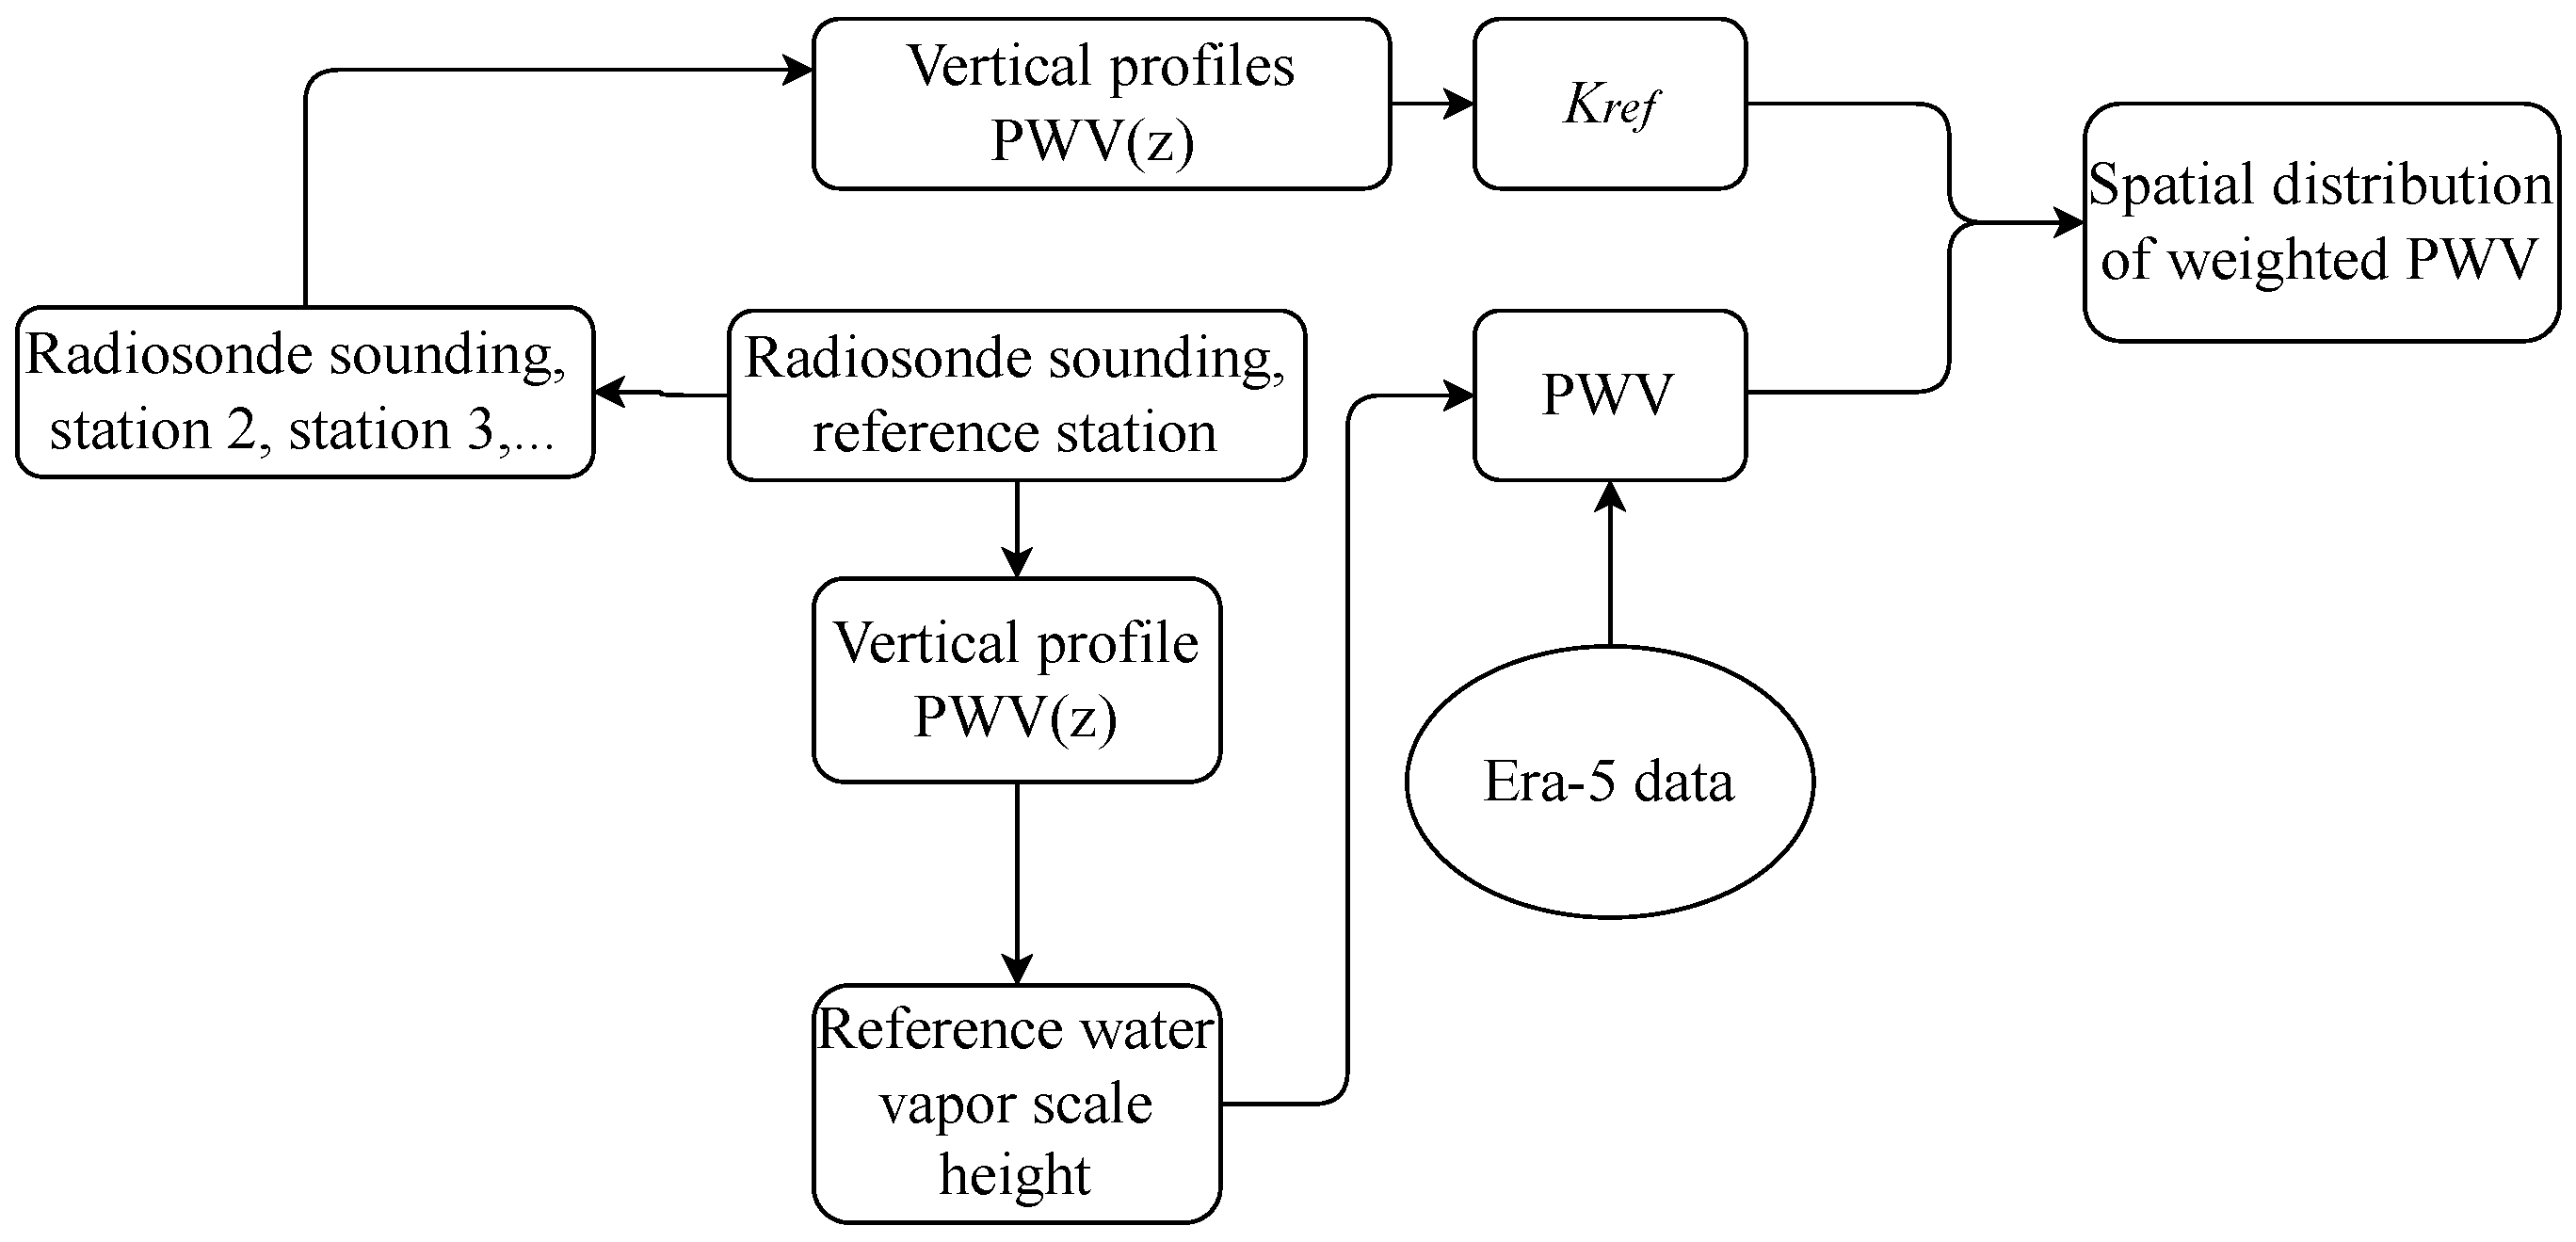
values are calculated for grid nodes that may not contain mountain peaks but include lower altitudes. A site suitable for millimeter and submillimeter observations can be remote from the nearest grid node. So, deviations in the PWV values may appear. To take into account the relief, we use a well-known Formula (
2) containing an exponential term and a relative altitude difference
:
where
is the non-dimensional proportionality coefficient,
is the water vapor scale height, and
= 1000 m. A flowchart of the method for correcting
is shown in
Figure 2.
The water vapor scale height and the proportionality coefficient are calculated from the best exponential fit to the water vapor content profile obtained from radiosonde soundings launched from the nearest station (Mineralny Vody). At a given site, the coefficient and vary over time. Under different atmospheric conditions, the scale height ranges from 1200 to 2700 m at the BTA. The mean value of is 2280 m. The non-dimensional coefficients are calculated for grid nodes by interpolation of estimated for a set of radiosonde stations within a given region. Adaptation of the method for the sites where the statistics of PWV are known shows that valid calculation of the value should take into account the limited area and depends on the relief model in the Era-5 reanalysis as well as the physical elevation of a given site. For a correct estimate of PWV at a given site, we calculate the relative altitude difference not for a single grid node but within the area around the site. In other words, PWV values are corrected using variable coefficients for different sites, taking into account the relief model and, in particular, the mean difference between the altitude of the mountain summit and the “surrounding terrain”.
3. Precipitable Water Vapor Statistics within the Chajnantor Area
In order to determine how well the Era-5 reanalysis data reproduces real changes in precipitable water vapor, we used the data gathered from radiometer measurements at the Chajnantor Plateau [
3]. Using Formula (
2), we estimated the mean hourly PWV values within the Chajnantor Plateau. The Era-5-derived precipitable water vapor values are overestimated in comparison with the measurement data. We used the mean absolute error (
) for estimation of the PWV deviations assessed between the calculated and measured PWV:
where
is the mean monthly PWV calculated from the Era-5 reanalysis data, and
is the mean monthly measured values of PWV. In average, the mean absolute error is 1.8 mm. The largest
falls in winter when water vapor content is the highest. The mean absolute error in winter is 3.1 mm. In summer,
decreases to 1.1 mm.
A correct estimation of statistical characteristics of precipitable water vapor, including hourly values, requires the use of a certain method, especially under conditions of low atmospheric moisture. Using Formula (
2), we calculated the PWV variations within the Chajnantor area.
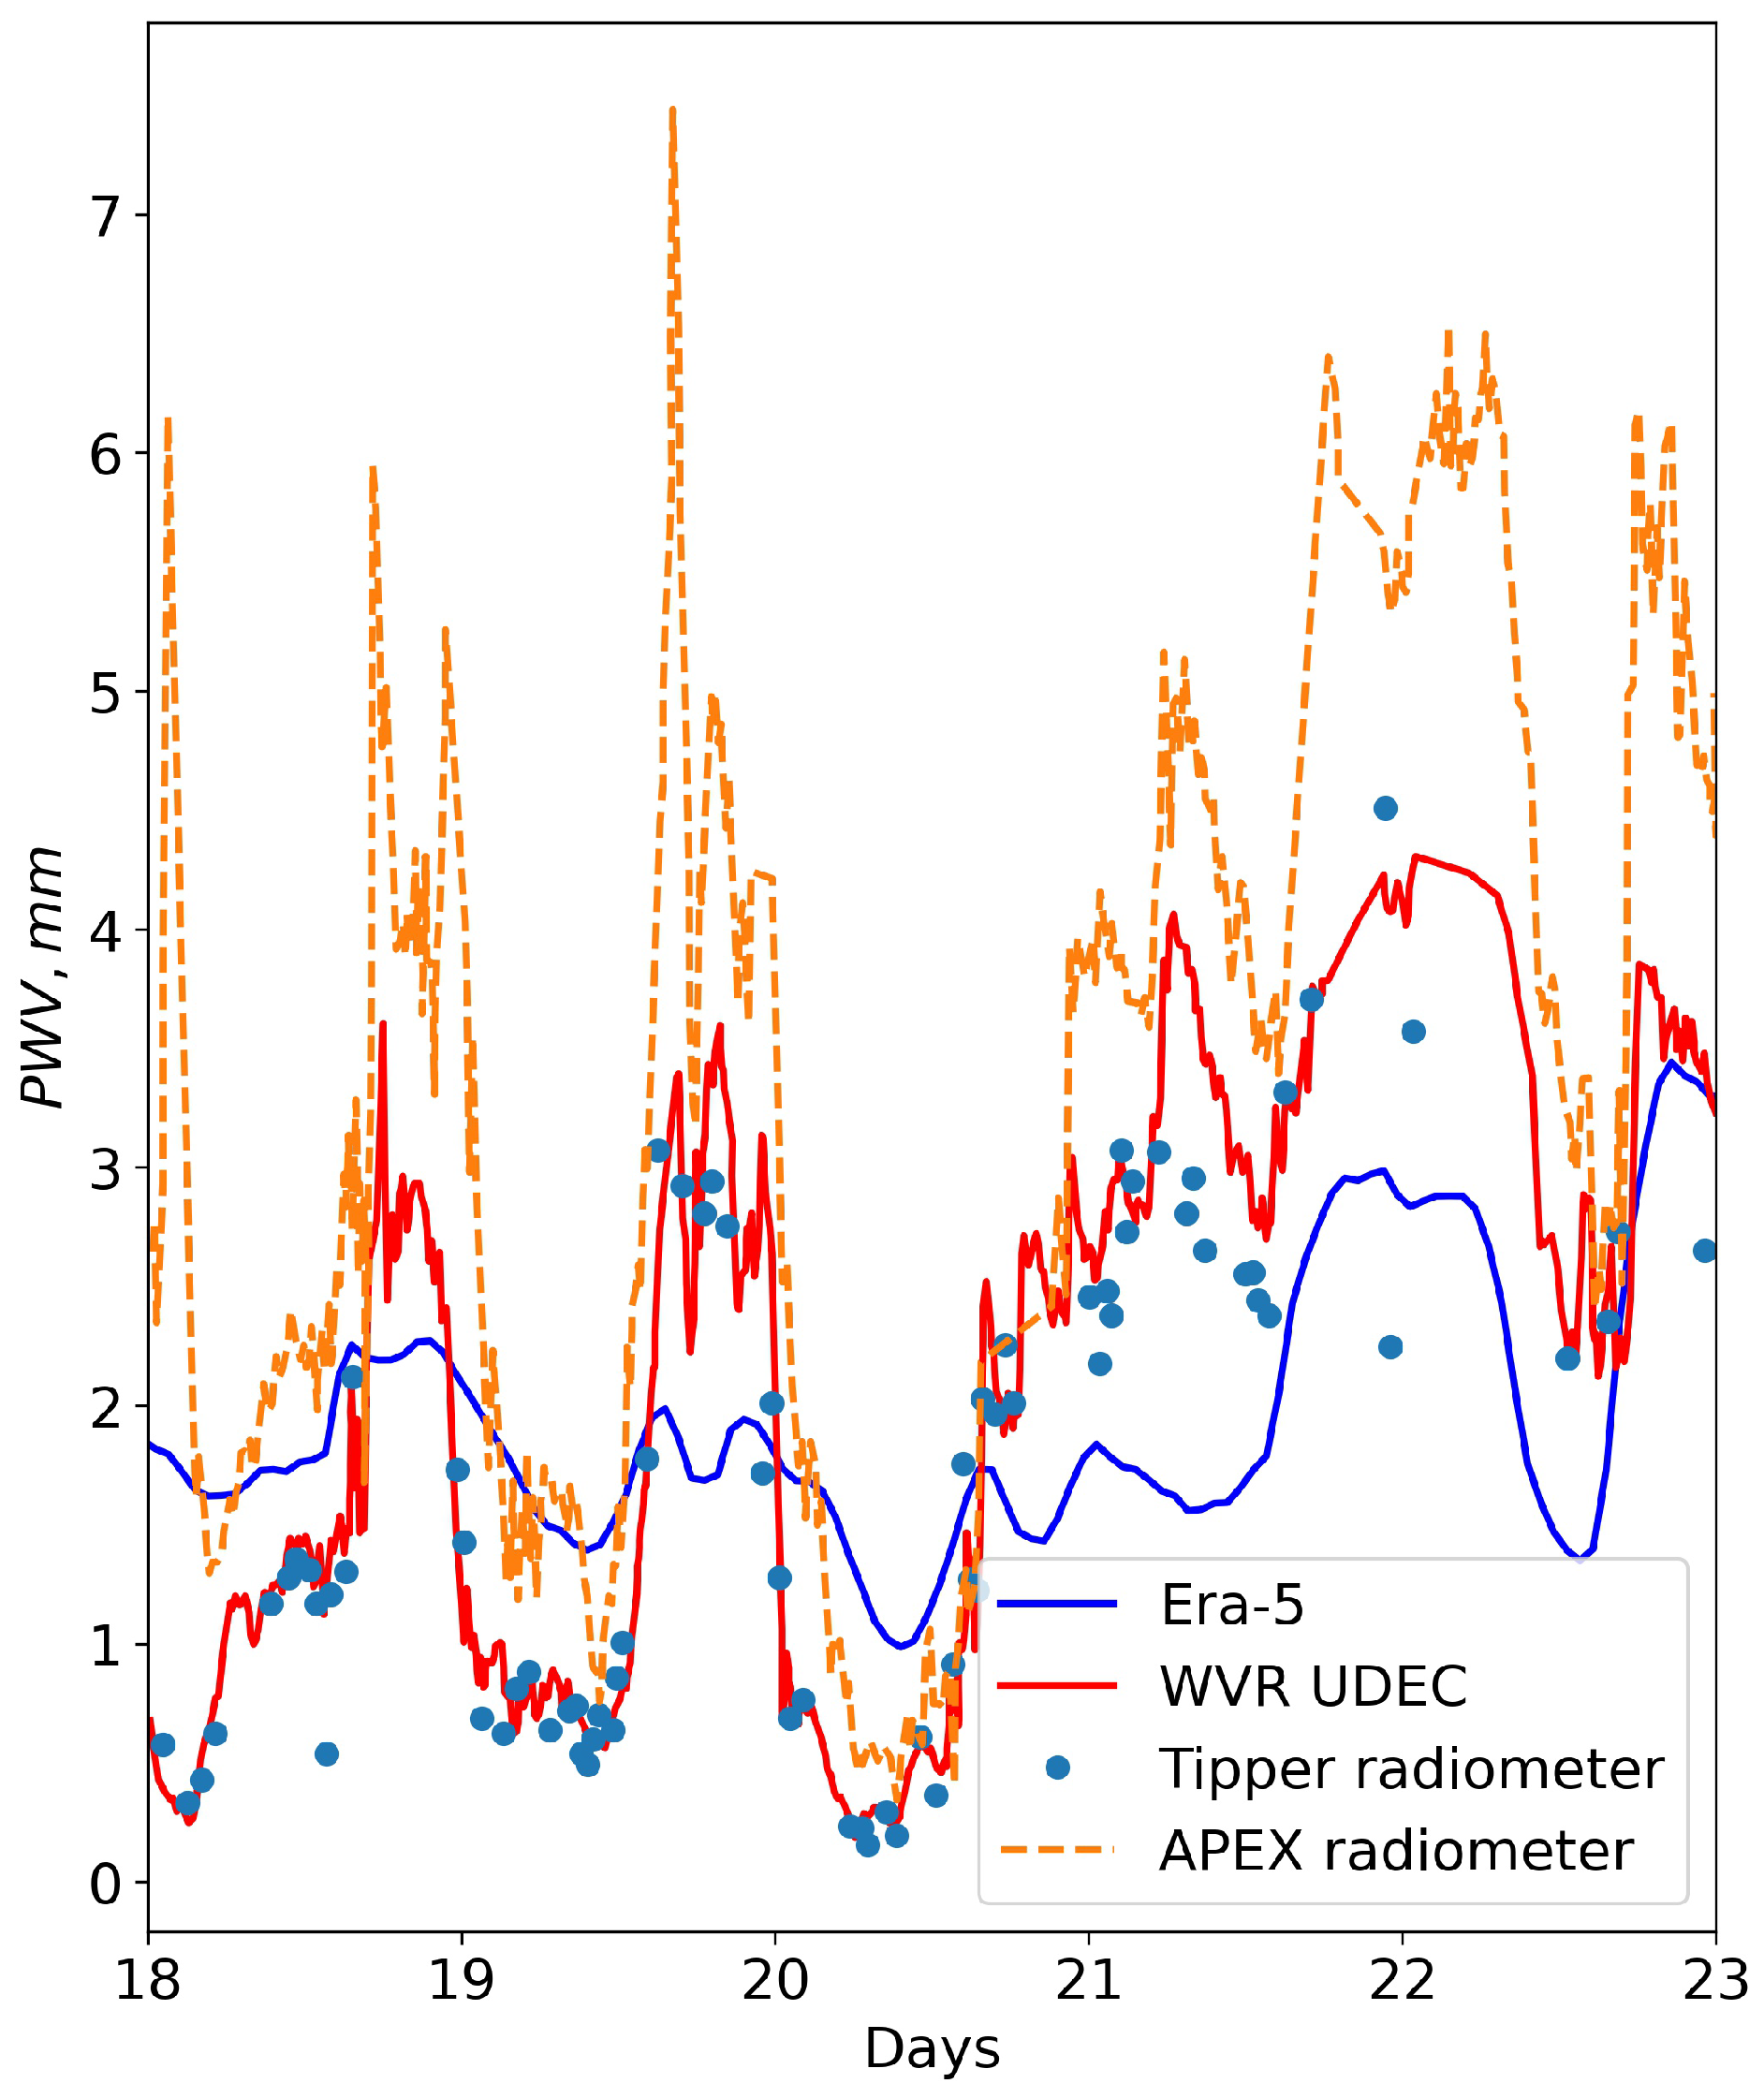
Figure 3 shows the PWV variations for a period of five days within the Chajnantor area.
At the Chajnantor Plateau, measurements were performed with an APEX radiometer operating at 183 GHz [
3]. At the Cerro Chajnantor summit, precipitable water vapor was measured by a water vapor radiometer (red line) at 183 GHz and the Tipper radiometer, which integrates radiation over a 103 GHz band, centered at 850 GHz. An analysis of intraday variations in the precipitable water vapor shows that the measured values of PWV significantly deviate from the hourly PWV values estimated from the Era-5 reanalysis data. The mean absolute error is 0.94 mm. We also estimated the root mean square deviation:
and the correlation coefficient:
where
and
are the Era-5 derived PWV and measured PWV, respectively, and
and
are the root mean square deviations.
The root mean square deviation of the PWV is 1.06 mm. The correlation coefficient between the PWV variations is 0.57. Thus, the Era-5 reanalysis data passably reflect atmospheric situations with low and high water vapor content in the atmosphere, which are of interest for mm/submm astronomical observations.
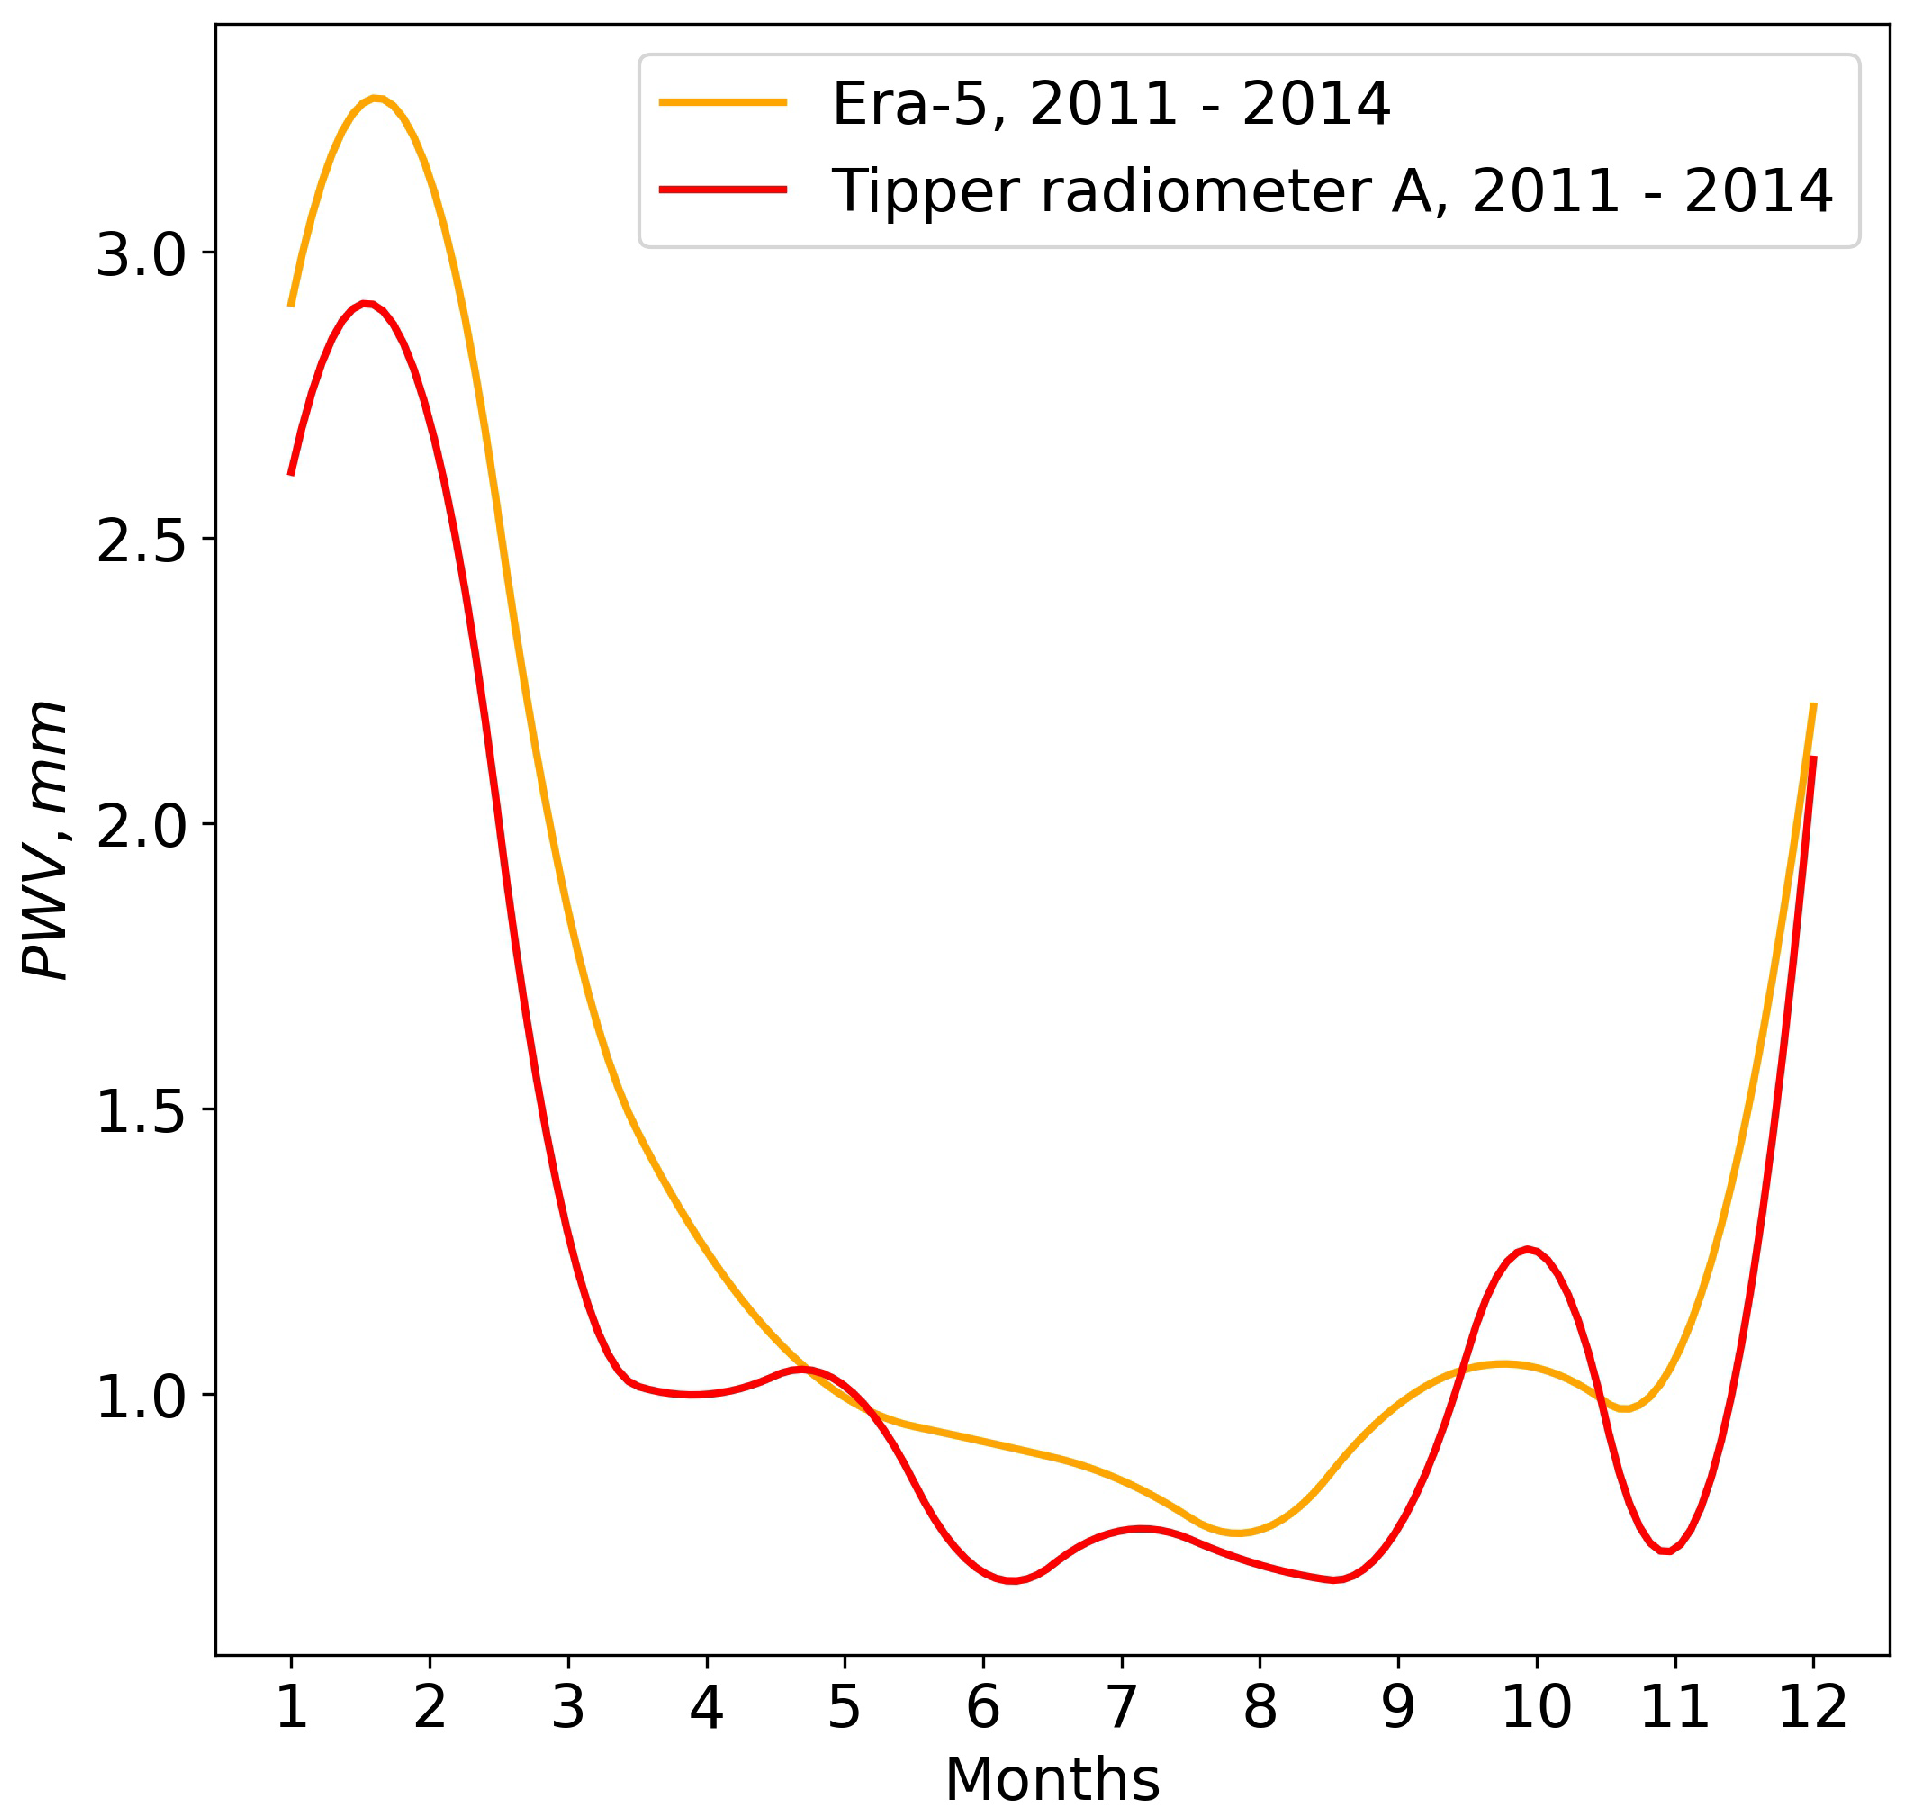
For longer averaging periods, consistency of PWV variations estimated from the Era-5 data and the data of the radiometric measurements improves.
Figure 4 shows the changes in the mean monthly PWV values estimated from Era-5 data and the changes in the mean monthly measured radiometric PWV values. PWV values are averaged from 2011 to 2014. Statistics of PWV variations estimated from the Era-5 reanalysis data and radiometric data are shown in
Table 2. In addition to the mean absolute error estimated for the hourly PWV values, we also estimated the RMS and the correlation coefficient between the PWV time series. Compared to intrahour variations, the mean absolute error of the mean monthly variations in PWV decreases to 0.23 mm, and the RMS decreases to 0.28 mm. The correlation coefficient is 0.97.
4. Atmospheric Parameter Statistics Relevant for the Millimeter/Submillimeter Observations within the BTA Region
Knowledge of statistics in air humidity and precipitable water vapor makes it possible to estimate absorption coefficients along the telescope’s line of sight. In this section, we estimate the spatial changes and seasonal variability in water vapor content in the atmosphere within the BTA region [
41]. Using the Era-5 reanalysis data, we obtained the statistically averaged spatial distributions of PWV for different seasons for the period 2010–2020.
4.1. Spatial Distributions of Precipitable Water Vapor within the BTA Region
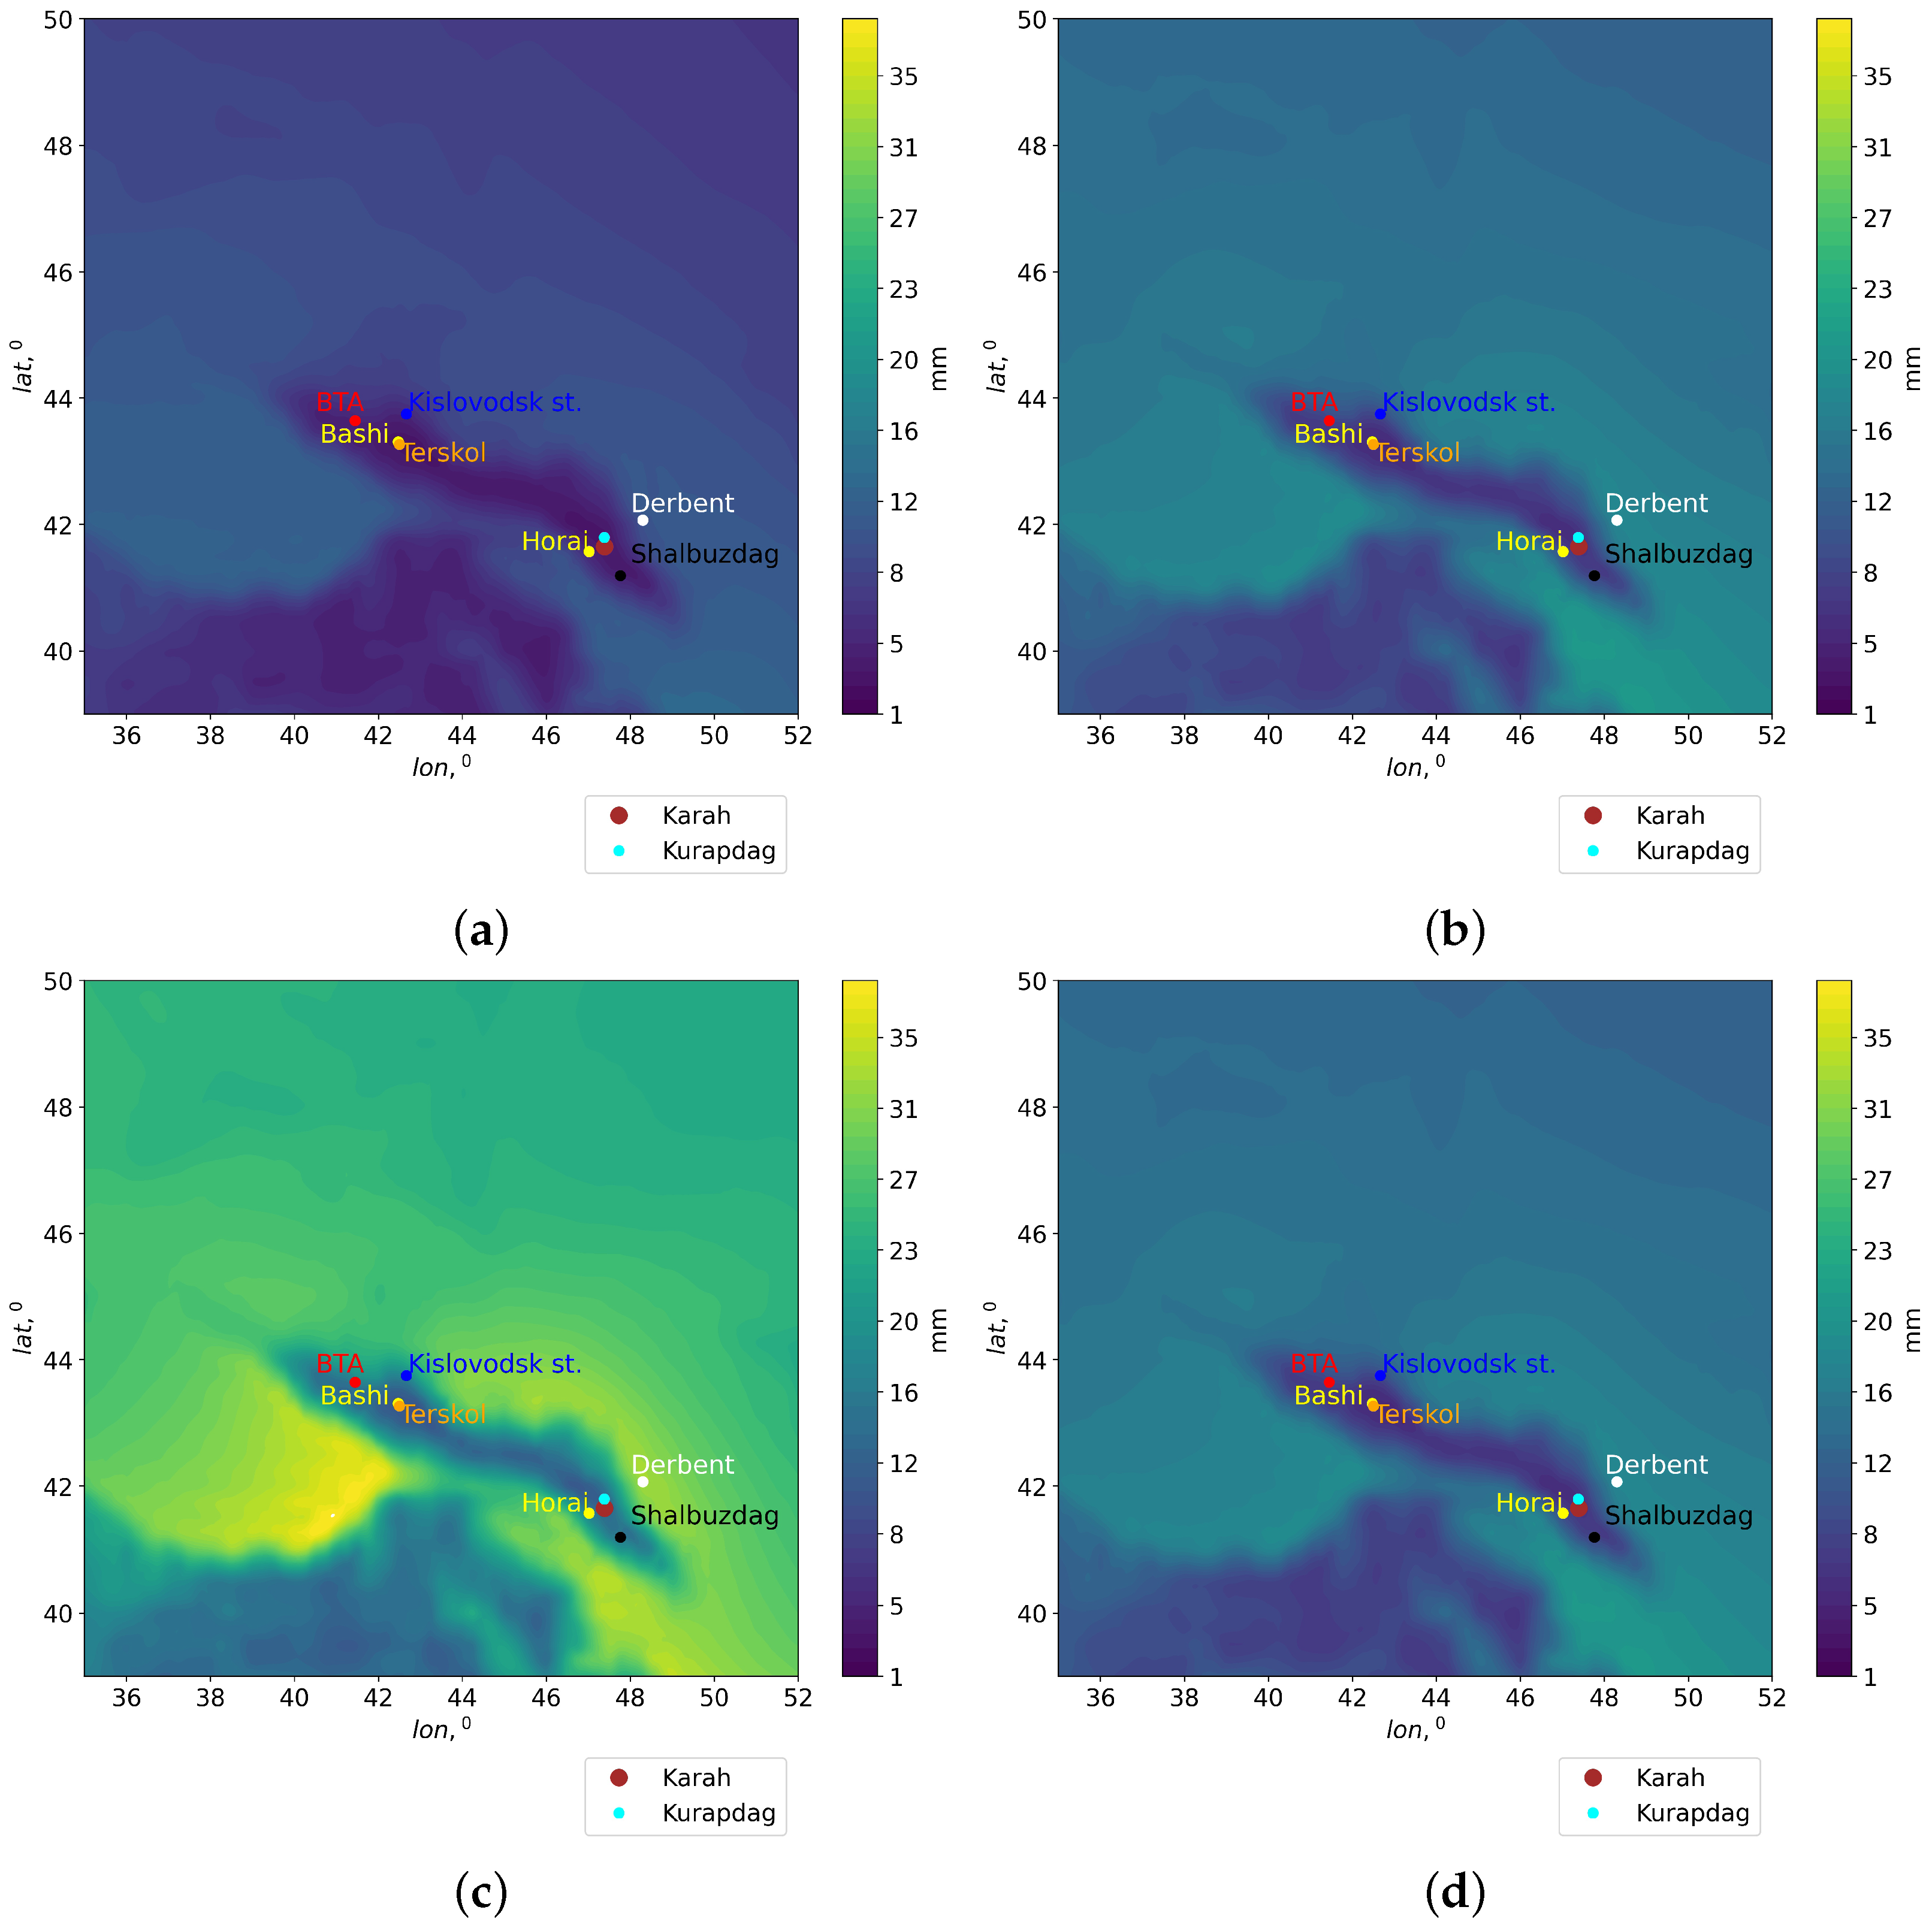
With the aim of identifying the sites suitable for astronomical observations in the mm/submm wavelength range, we obtained spatial distributions of PWV within the BTA region. We used the Era-5 reanalysis data for mapping. The spatial distributions of PWV averaged for the period 2010–2020 for different seasons are shown in
Figure 5. PWV averaging was performed using Formula (
7):
where
is the hourly mean PWV value, and
N is the total number of hours for the period 2010–2020. The analysis of
Figure 5 shows that there is a wide area of low PWV values within the BTA region. The average position of the area varies little during the year. However, the PWV values change significantly from season to season. The highest PWV values are observed in summer, while the lowest PWV values correspond to winter.
In our studies, in order to correct the PWV values, we compared the variations in precipitable water vapor estimated from the Era-5 data with the PWV obtained using the Global Navigation Satellite System in the BTA region [
39]. The data comparison showed that the correlation coefficients varied from 0.71 to 0.94. The best relation between PWV variations was observed at the sites with altitudes from 727 m to 2095 m, with high repeatability of clear sky. In particular, at the Khunzakh with an elevation of 1627 m above sea level, the correlation coefficient was 0.94. At the Kislovodsk mountain astronomical station with an elevation of 2095 m above sea level, the correlation coefficient is also high (∼0.91). The worst correlation coefficient was observed at the Peak Terskol, as the highest site of the analyzed (3121 m above sea level). At this site, the correlation coefficient was 0.71. It is also worth noting that, according to our estimates, the Chajnantor Plateau at an elevation of 5107 m has a correlation coefficient of 0.57.
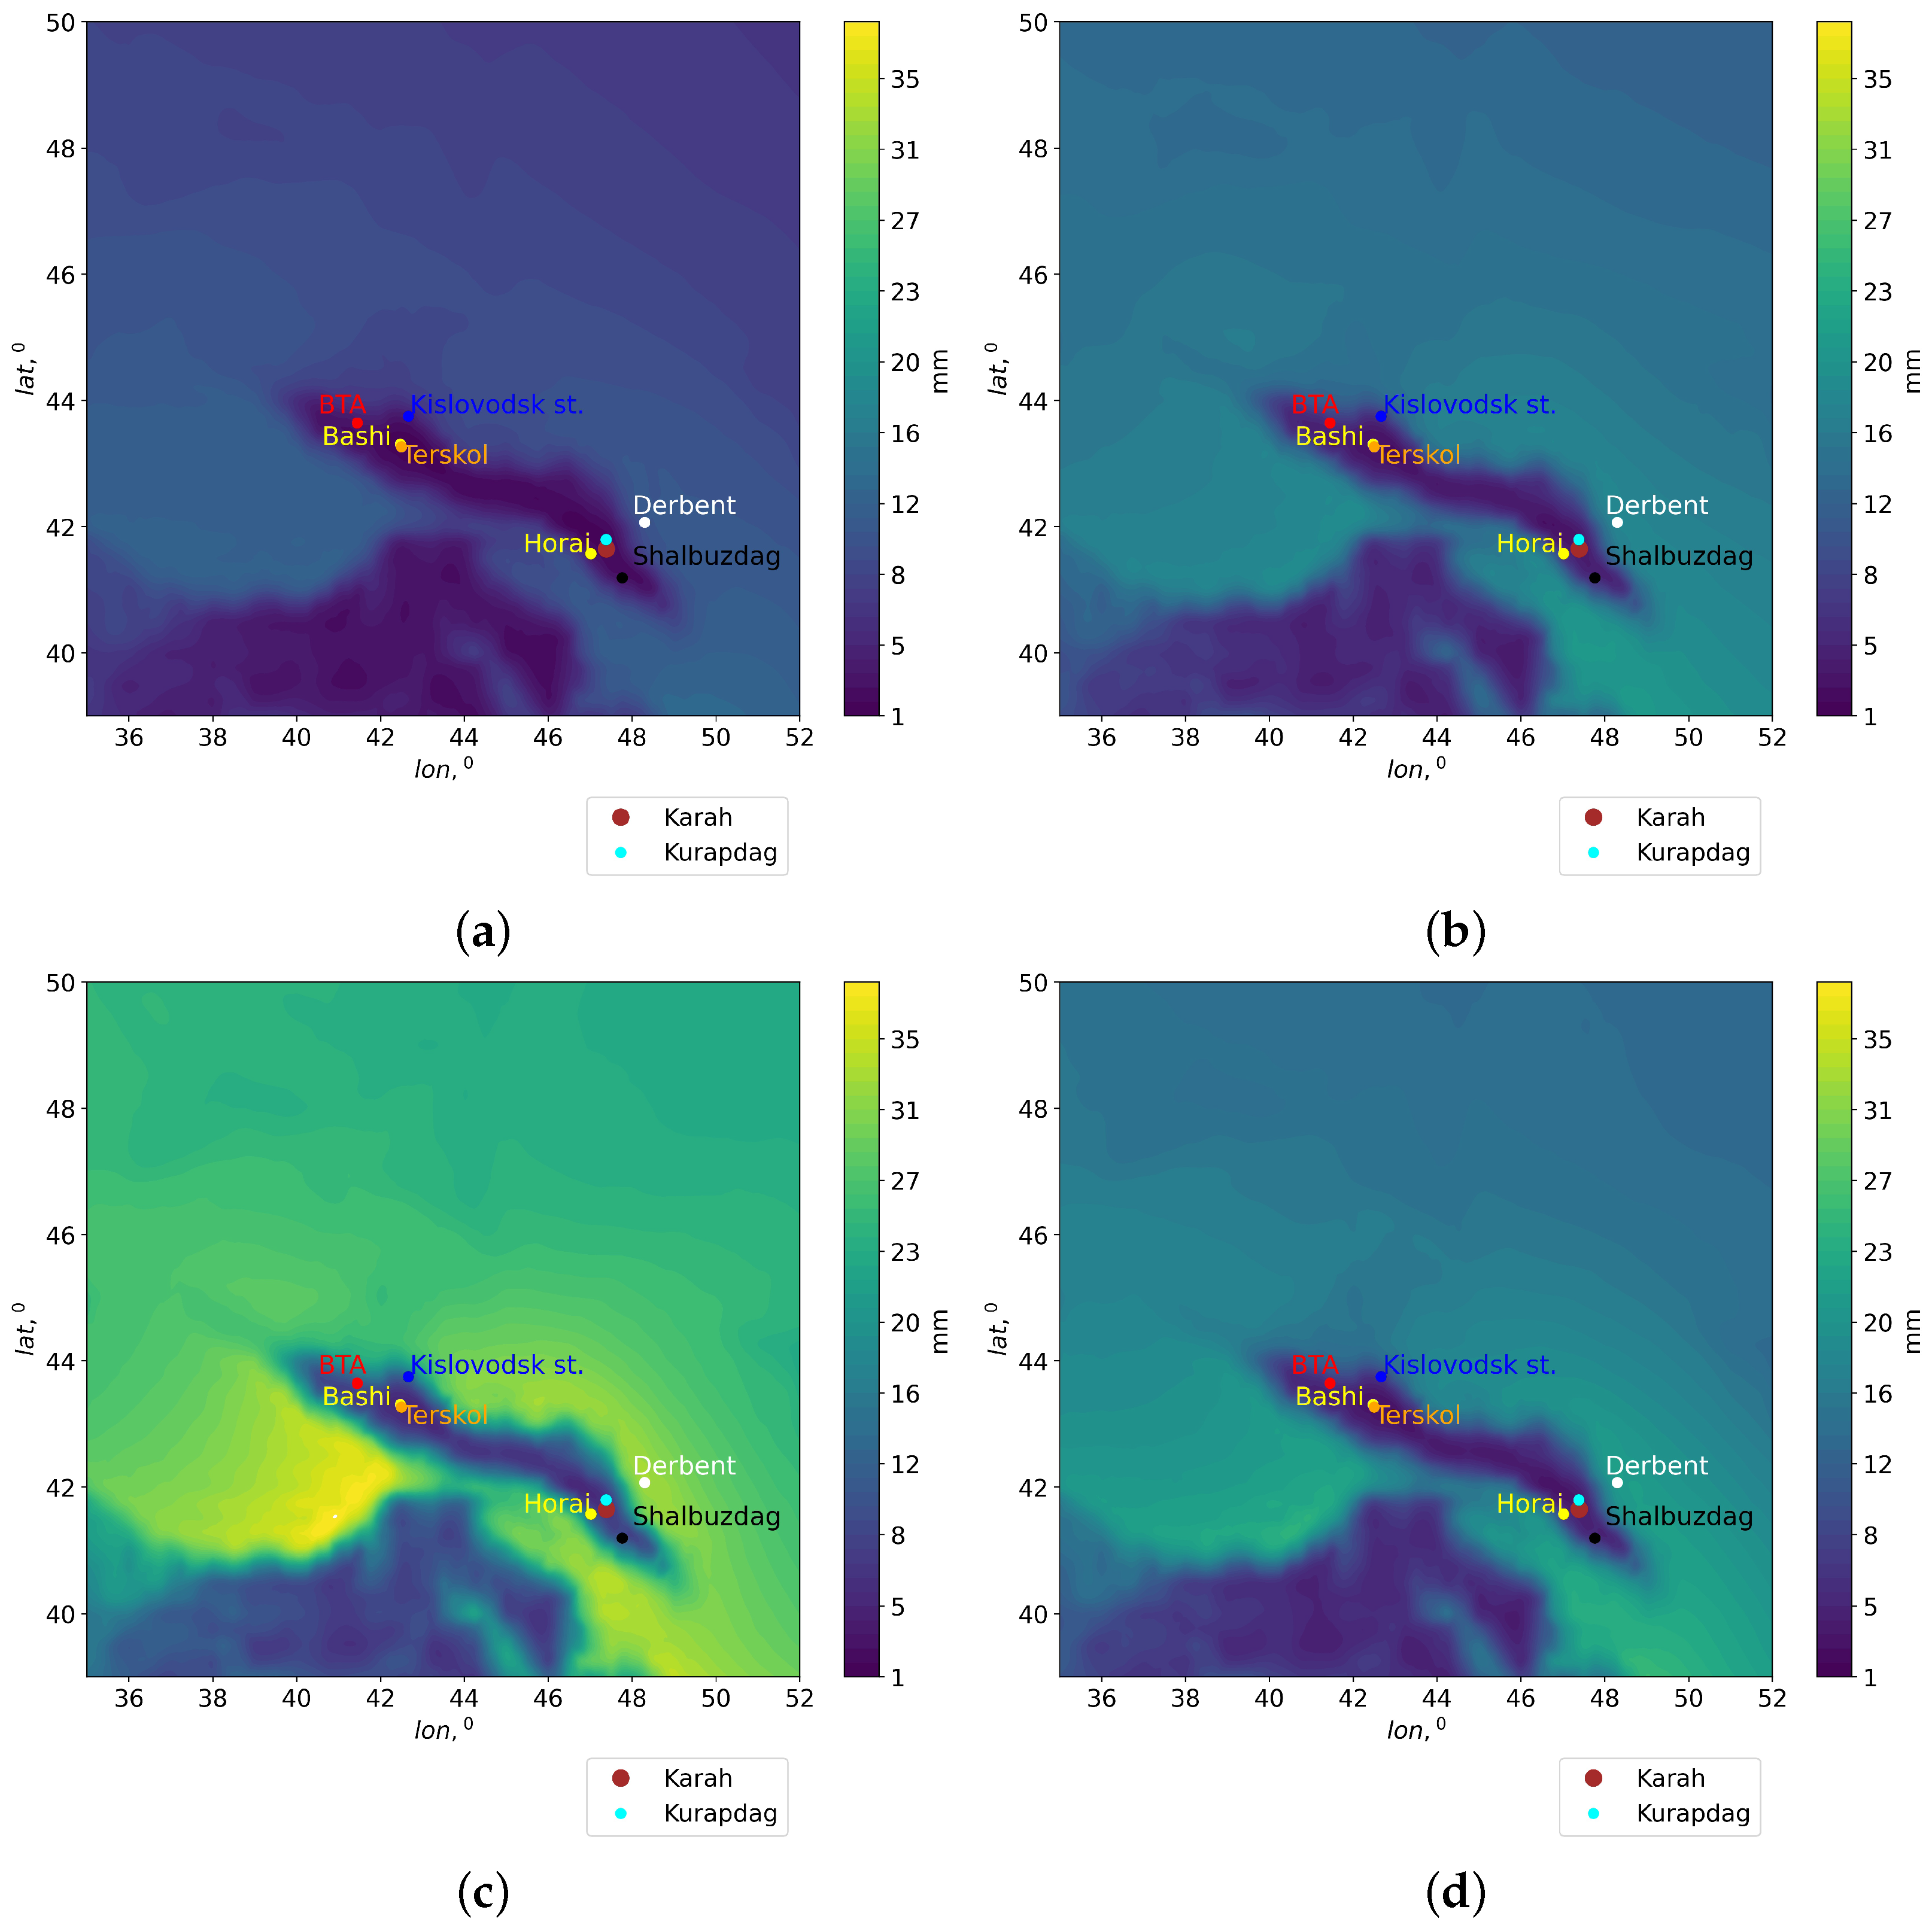
Using Formula (
2) and Era-5 reanalysis data, we estimated the spatial distributions of corrected PWV values for the period 2010–2020.
Figure 6 shows the spatial distributions of the corrected PWV values. The correction of PWV values, taking into account the relief, was carried out using the relative altitude difference determined over a large area within the region. In this case, in low landforms, PWV values were not corrected; PWV values for mountain peaks were corrected using Formula (
2). In the calculations, we used the Era-5 relief model.
The analysis of the corrected spatial distributions shows that PWV values for mountains decreased significantly. As a result of applying the correction method, PWV values at the summit and at the bottom of the mountain began to differ significantly. This is consistent with physical concepts and measurement data of precipitable water vapor.
4.2. Spatial Distributions of Total Cloud Cover within the BTA Region
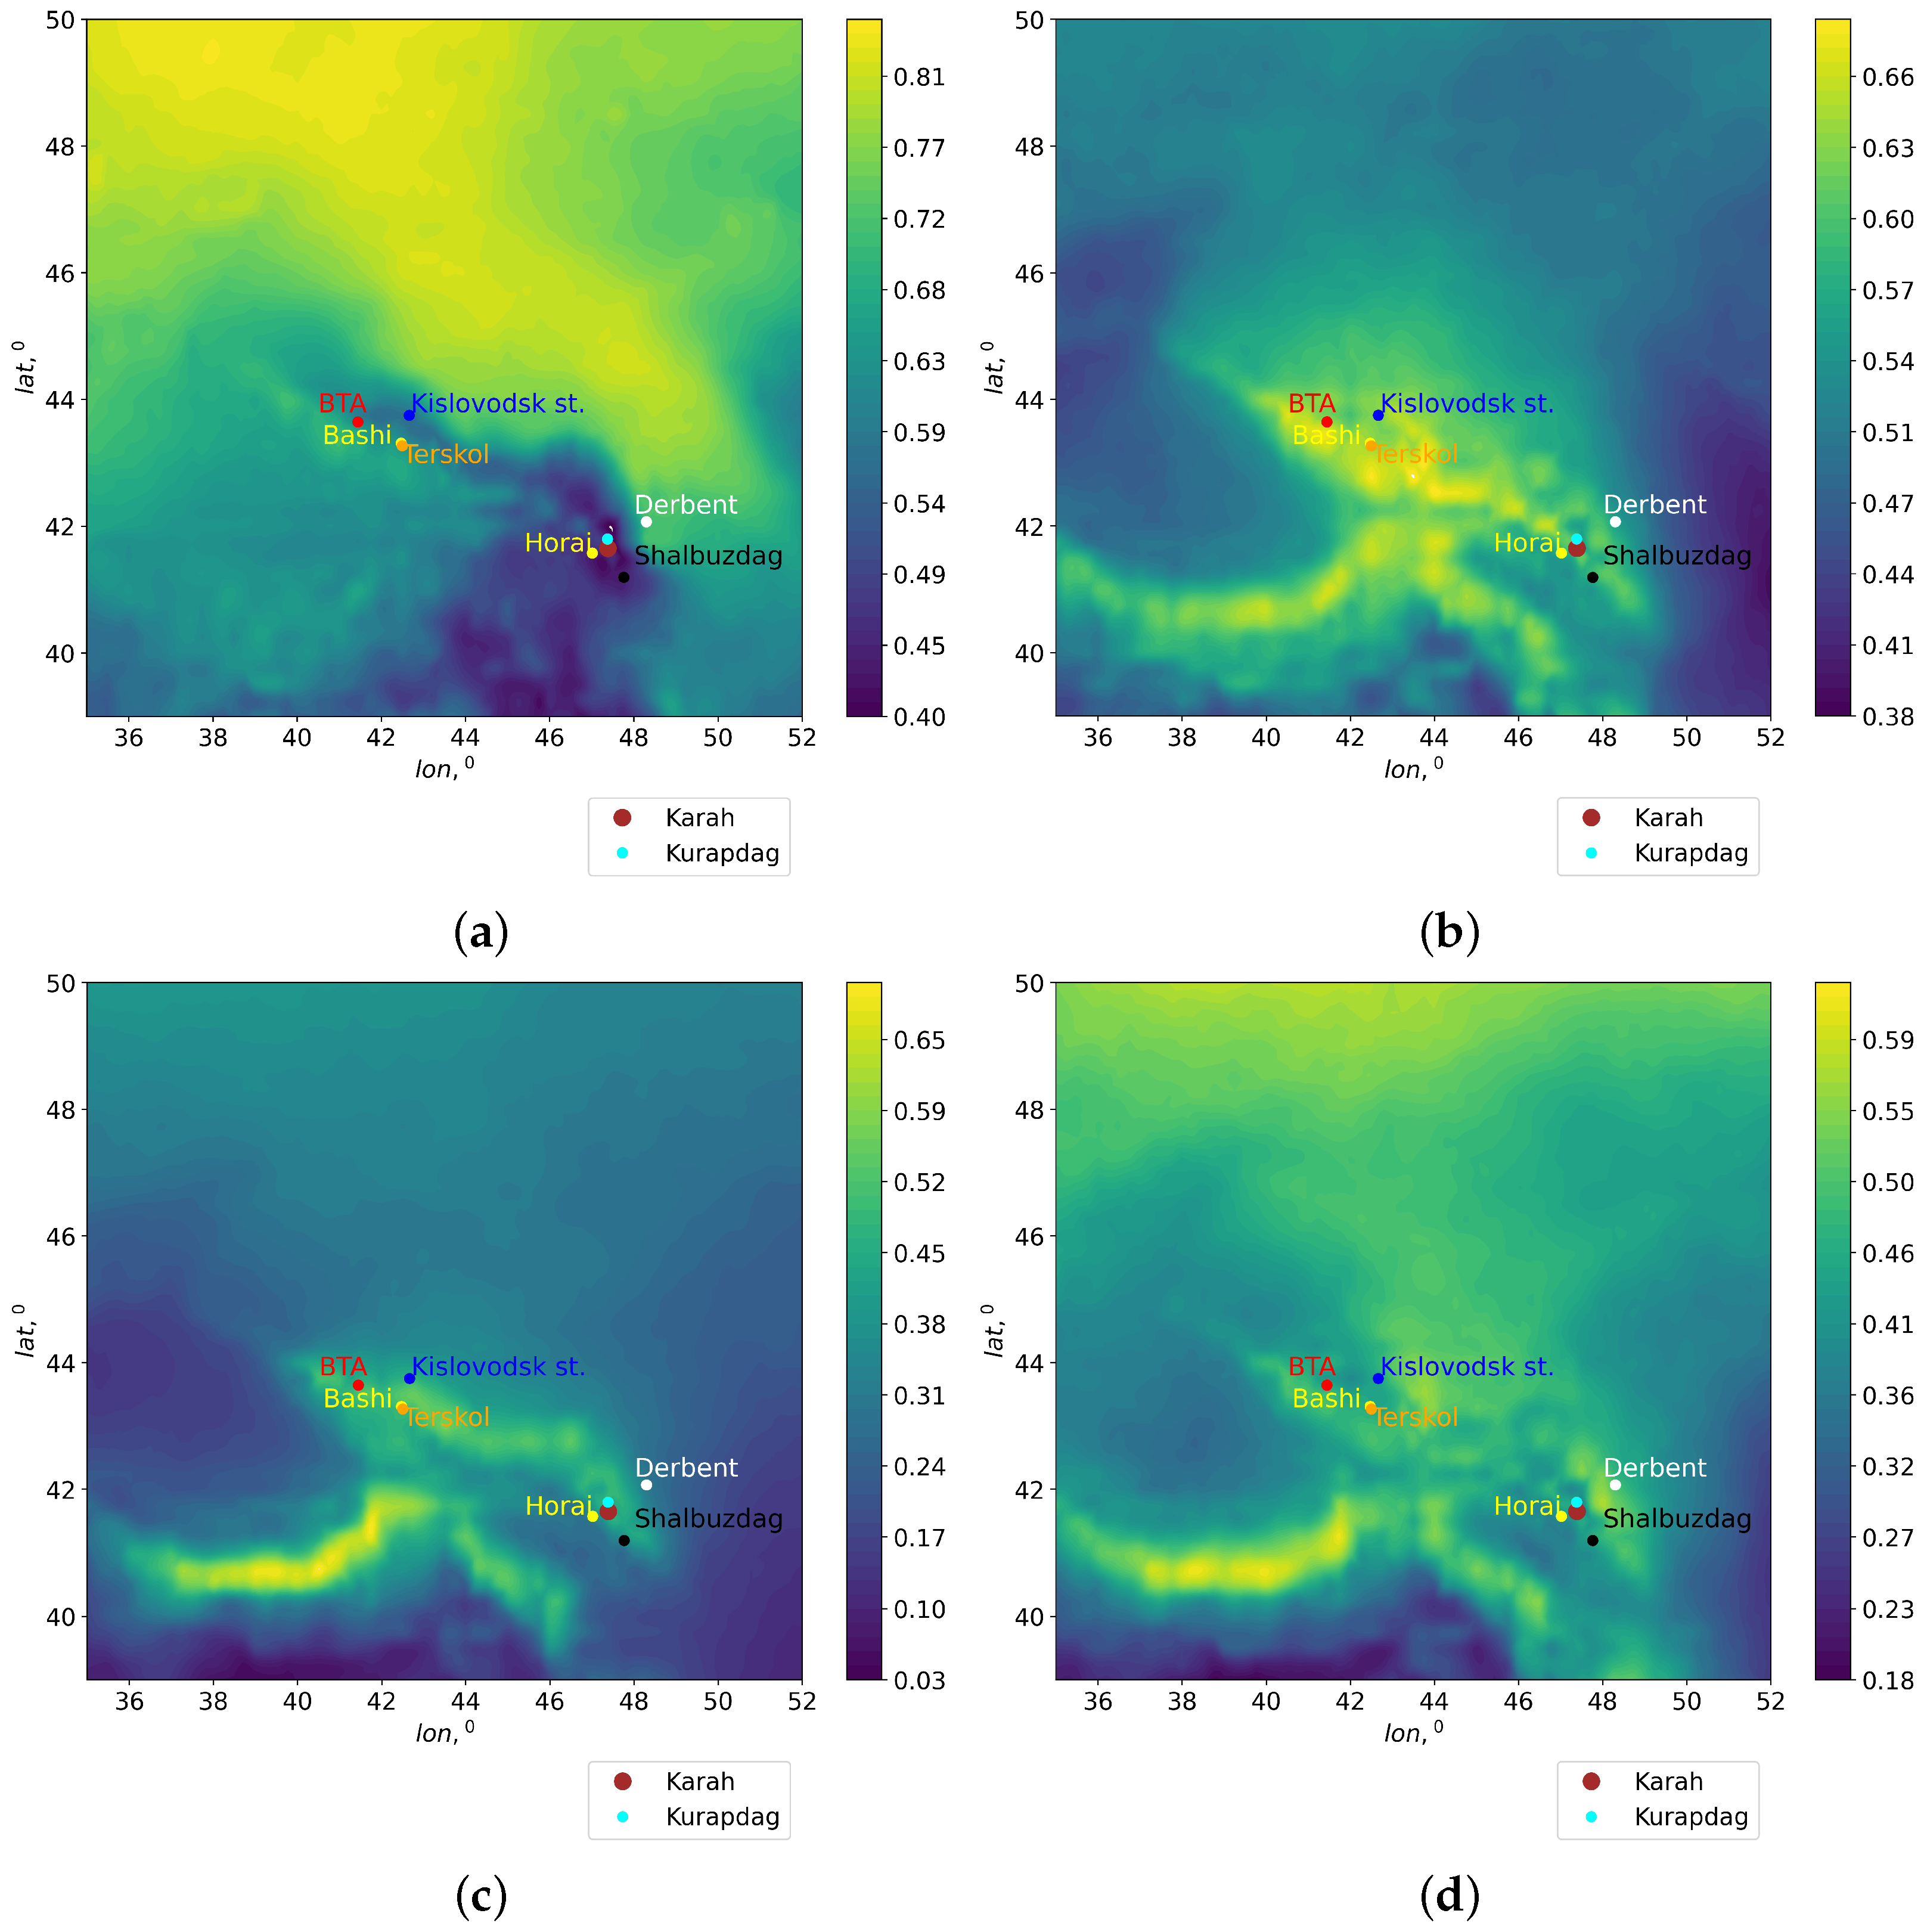
The duration of sunshine or total cloud cover determines the potential duration of astronomical observations. In order to reveal the sites with minimal total cloudiness, we obtained the spatial distributions of total cloud cover TCC (shown in
Figure 7). The TCC values in the Era-5 reanalysis were averaged for the period 2010–2020 for different seasons using Formula (
7):
where
is the hourly mean value of
, and
N is the total number of hours from 2010 to 2020.
The analysis of
Figure 7 shows that the TCC distributions are spatially inhomogeneous. Areas with low TCC are shown in dark blue. The best conditions in both TCC and PWV occur during winter. The sites with the best atmospheric conditions in TCC and PWV include the locations of mountainous Dagestan: Mt. Kurapdag and Mt. Horai.
Table 3 shows mean values of TCC at the sites suitable for mm/submm observations. The best conditions in terms of TCC are noted at the location of Mt. Horai and Mt. Kurapdag.
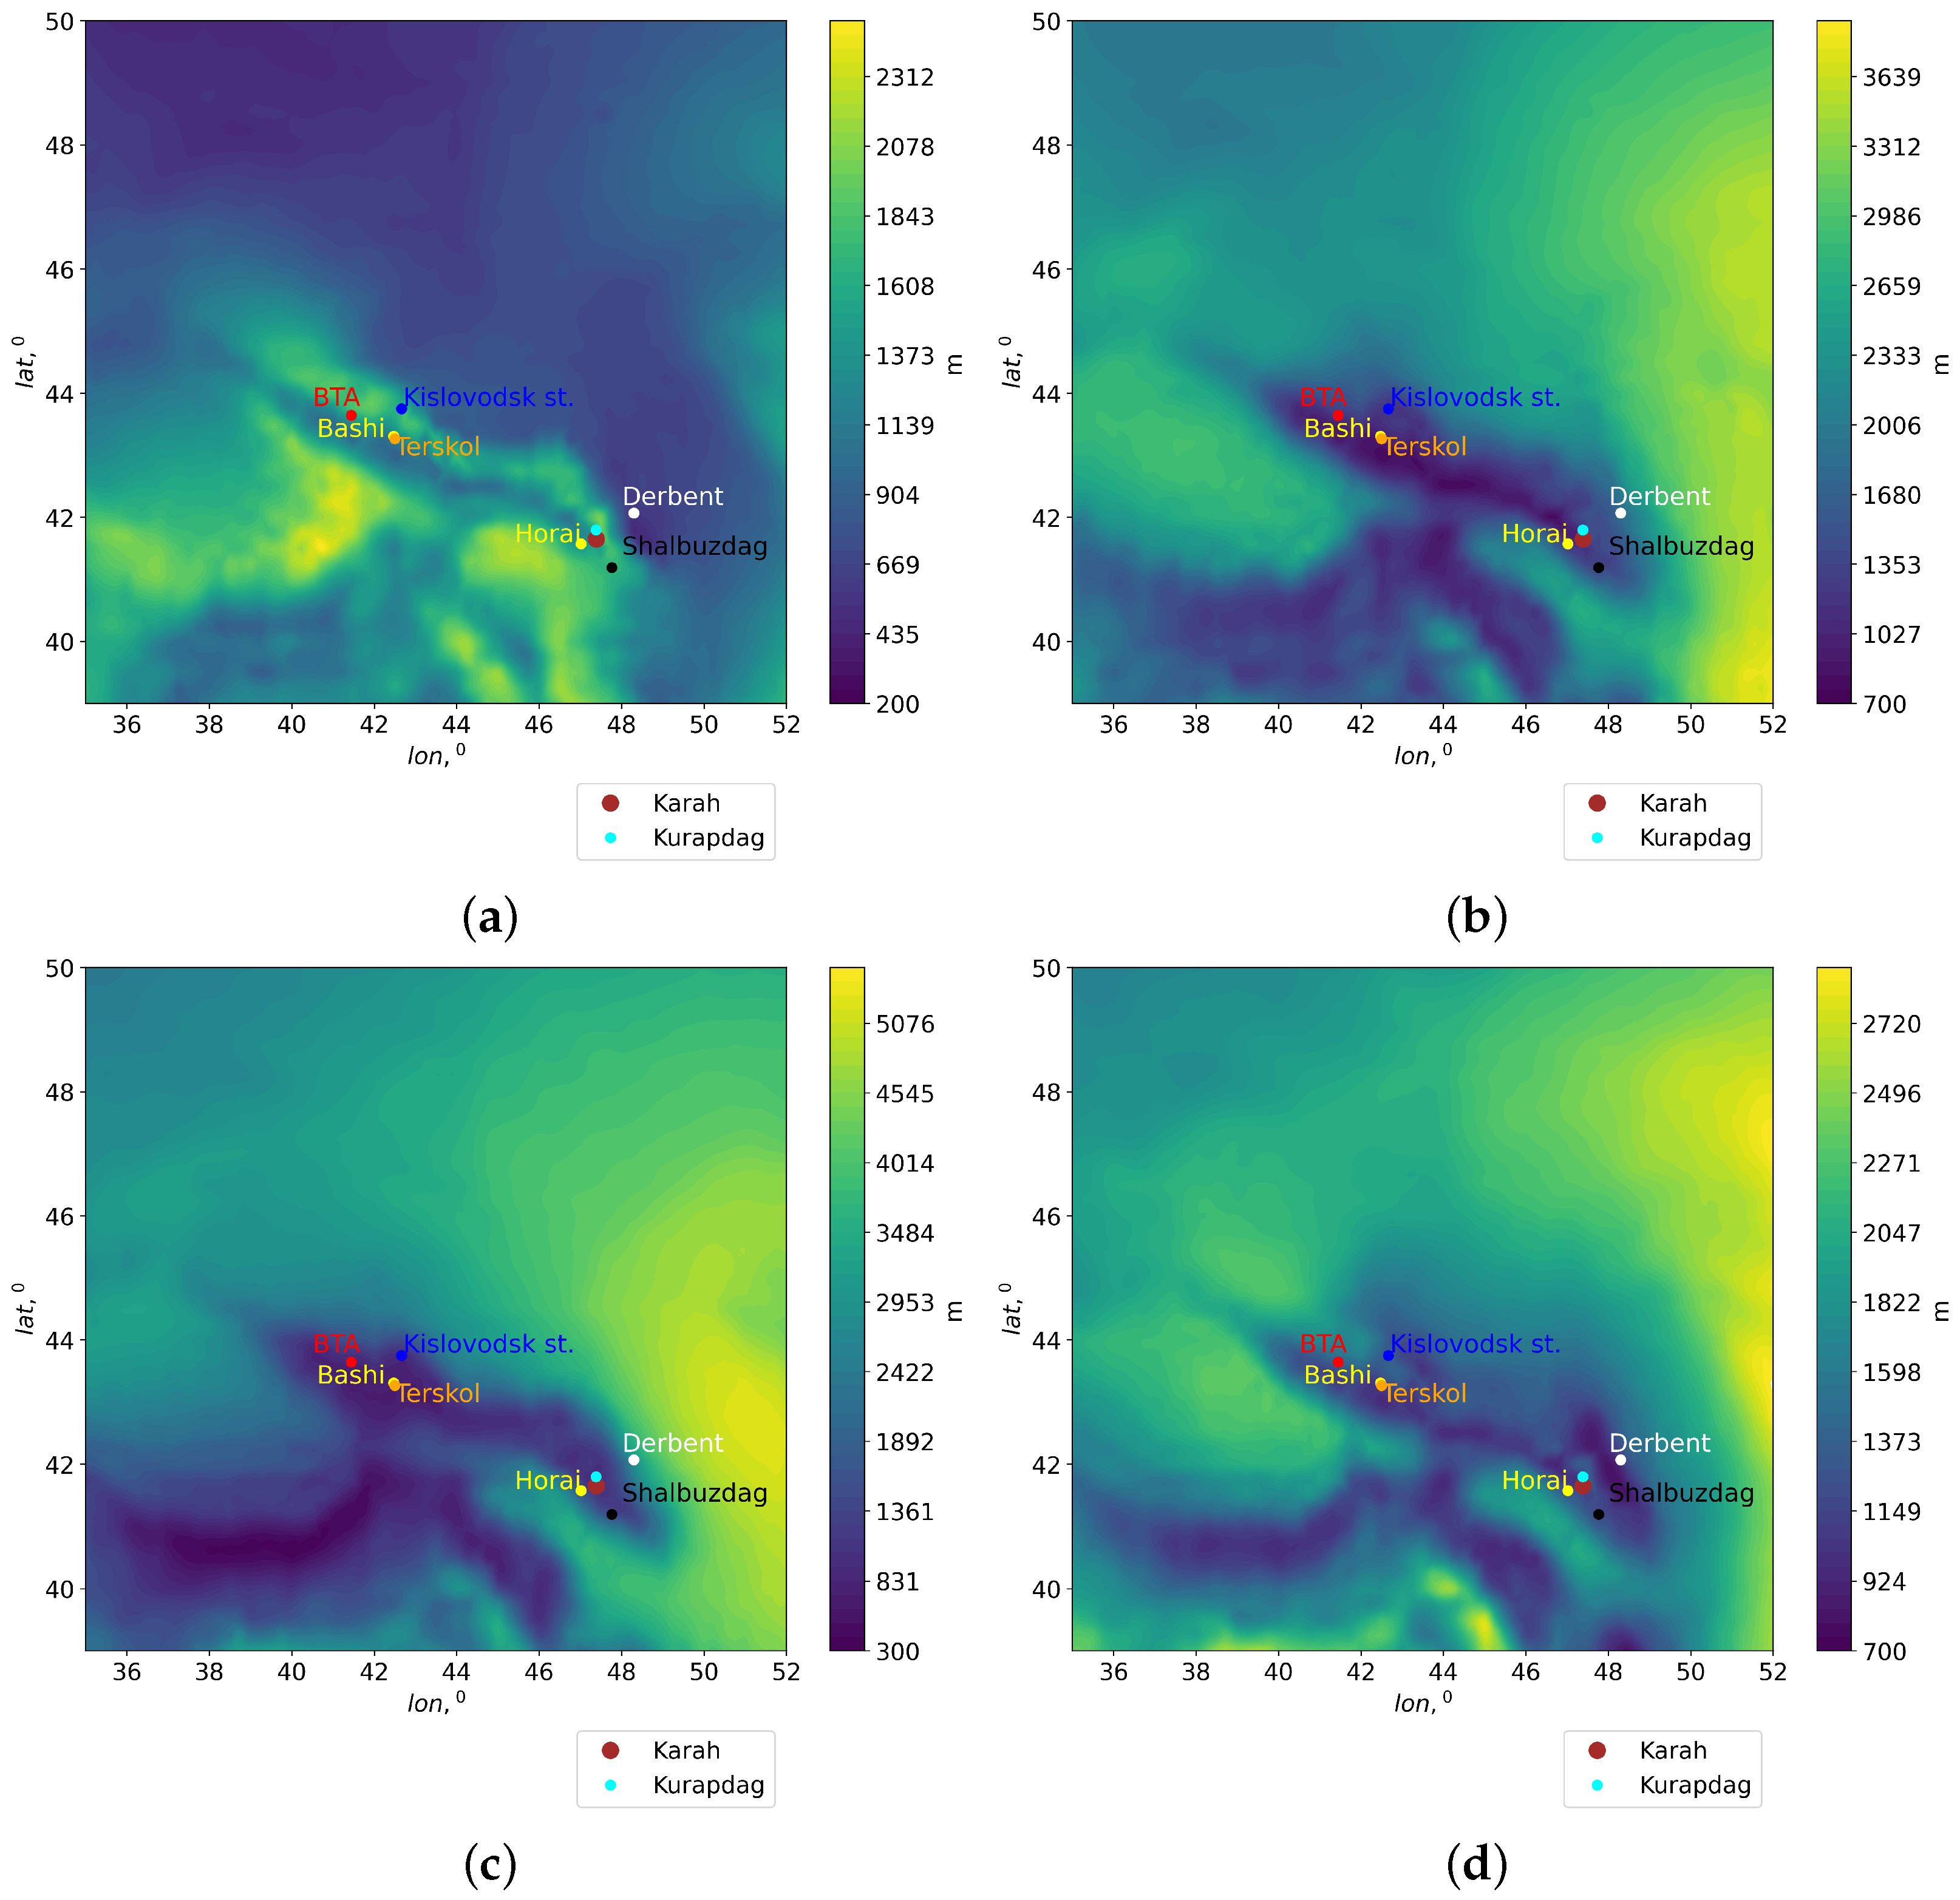
4.3. Spatial Distributions of Cloud Base Height within the BTA Region
For astroclimatic estimation of astronomical observing time within mountainous regions, an important parameter is the cloud base height (CBH). We attribute large values of cloud base height to a higher repeatability of high atmospheric mm/submm transparency. In this case, a high transparency of the atmosphere is due to low water content in the middle and upper troposphere compared to the lower layers of the atmosphere. Based on the Era-5 reanalysis data, we estimated CBH. Spatial distributions of cloud base height for different seasons are shown in
Figure 8.
The analysis of spatial distributions of cloud base height indicates the following features of cloud formation:
- (i)
In all seasons, an area with low values of cloud base heights is observed over the Caucasus. The “depth” of this area in terms of CBH horizontal gradients varies throughout the year.
- (ii)
Excluding winter, an extended area with large CBH values is formed in the eastern part of the BTA region. In this region, maximum CBH occurs in summer. Cloud base heights range from ∼3600 to ∼5300 m. In winter, cloud base heights range from ∼900 m to ∼1500 m.
Table 4 shows mean values of CBH at the sites suitable for mm/submm observations. Typical cloud base heights at the BTA site vary from 800 m (summer) to 1500 m (winter). Similar conditions are also observed at the Peak Terskol. The minimum cloud base height values are observed in summer (750 m), and the maximum values correspond to the autumn–winter period (1100–1200 m).
One of the promising sites, namely Mt. Horai, has intermediate values in cloud base height: 1600 m in summer and 1200 m in autumn and spring. In comparison with Mt.Horai, Mt. Kurapdag has lower cloudiness in summer (1050 m).
In winter, the Kislovodsk Observatory has a high CBH value, ∼1700 m. This value is close to the CBH at the BTA (1500 m).
Thus, Mt. Horai and Mt.Kurapdag are promising for mm/submm observations, not only in terms of PWV, but also in terms of total cloud cover and cloud base heights.
4.4. Nighttime Cloud Fraction Fraction
The estimation of the nighttime cloud fraction is one of the key parameters for evaluating the number of useful nights at an astronomical site [
42,
43,
44]. In order to estimate the number of useful nights at the BTA, we used a similar approach to that described in paper [
42]. We used the following methodology for classifying nights:
- (i)
Clear nights and partly clear nights: we supposed that cloud cover values range from 0 to 20% for the entire night. Clouds may be observed at night, but the total cloud cover ranges from 0 to 20% for 4 or more hours continuously.
- (ii)
Partly cloudy night: cloud coverage is less than or equal to 40% for 4 or more h.
- (iii)
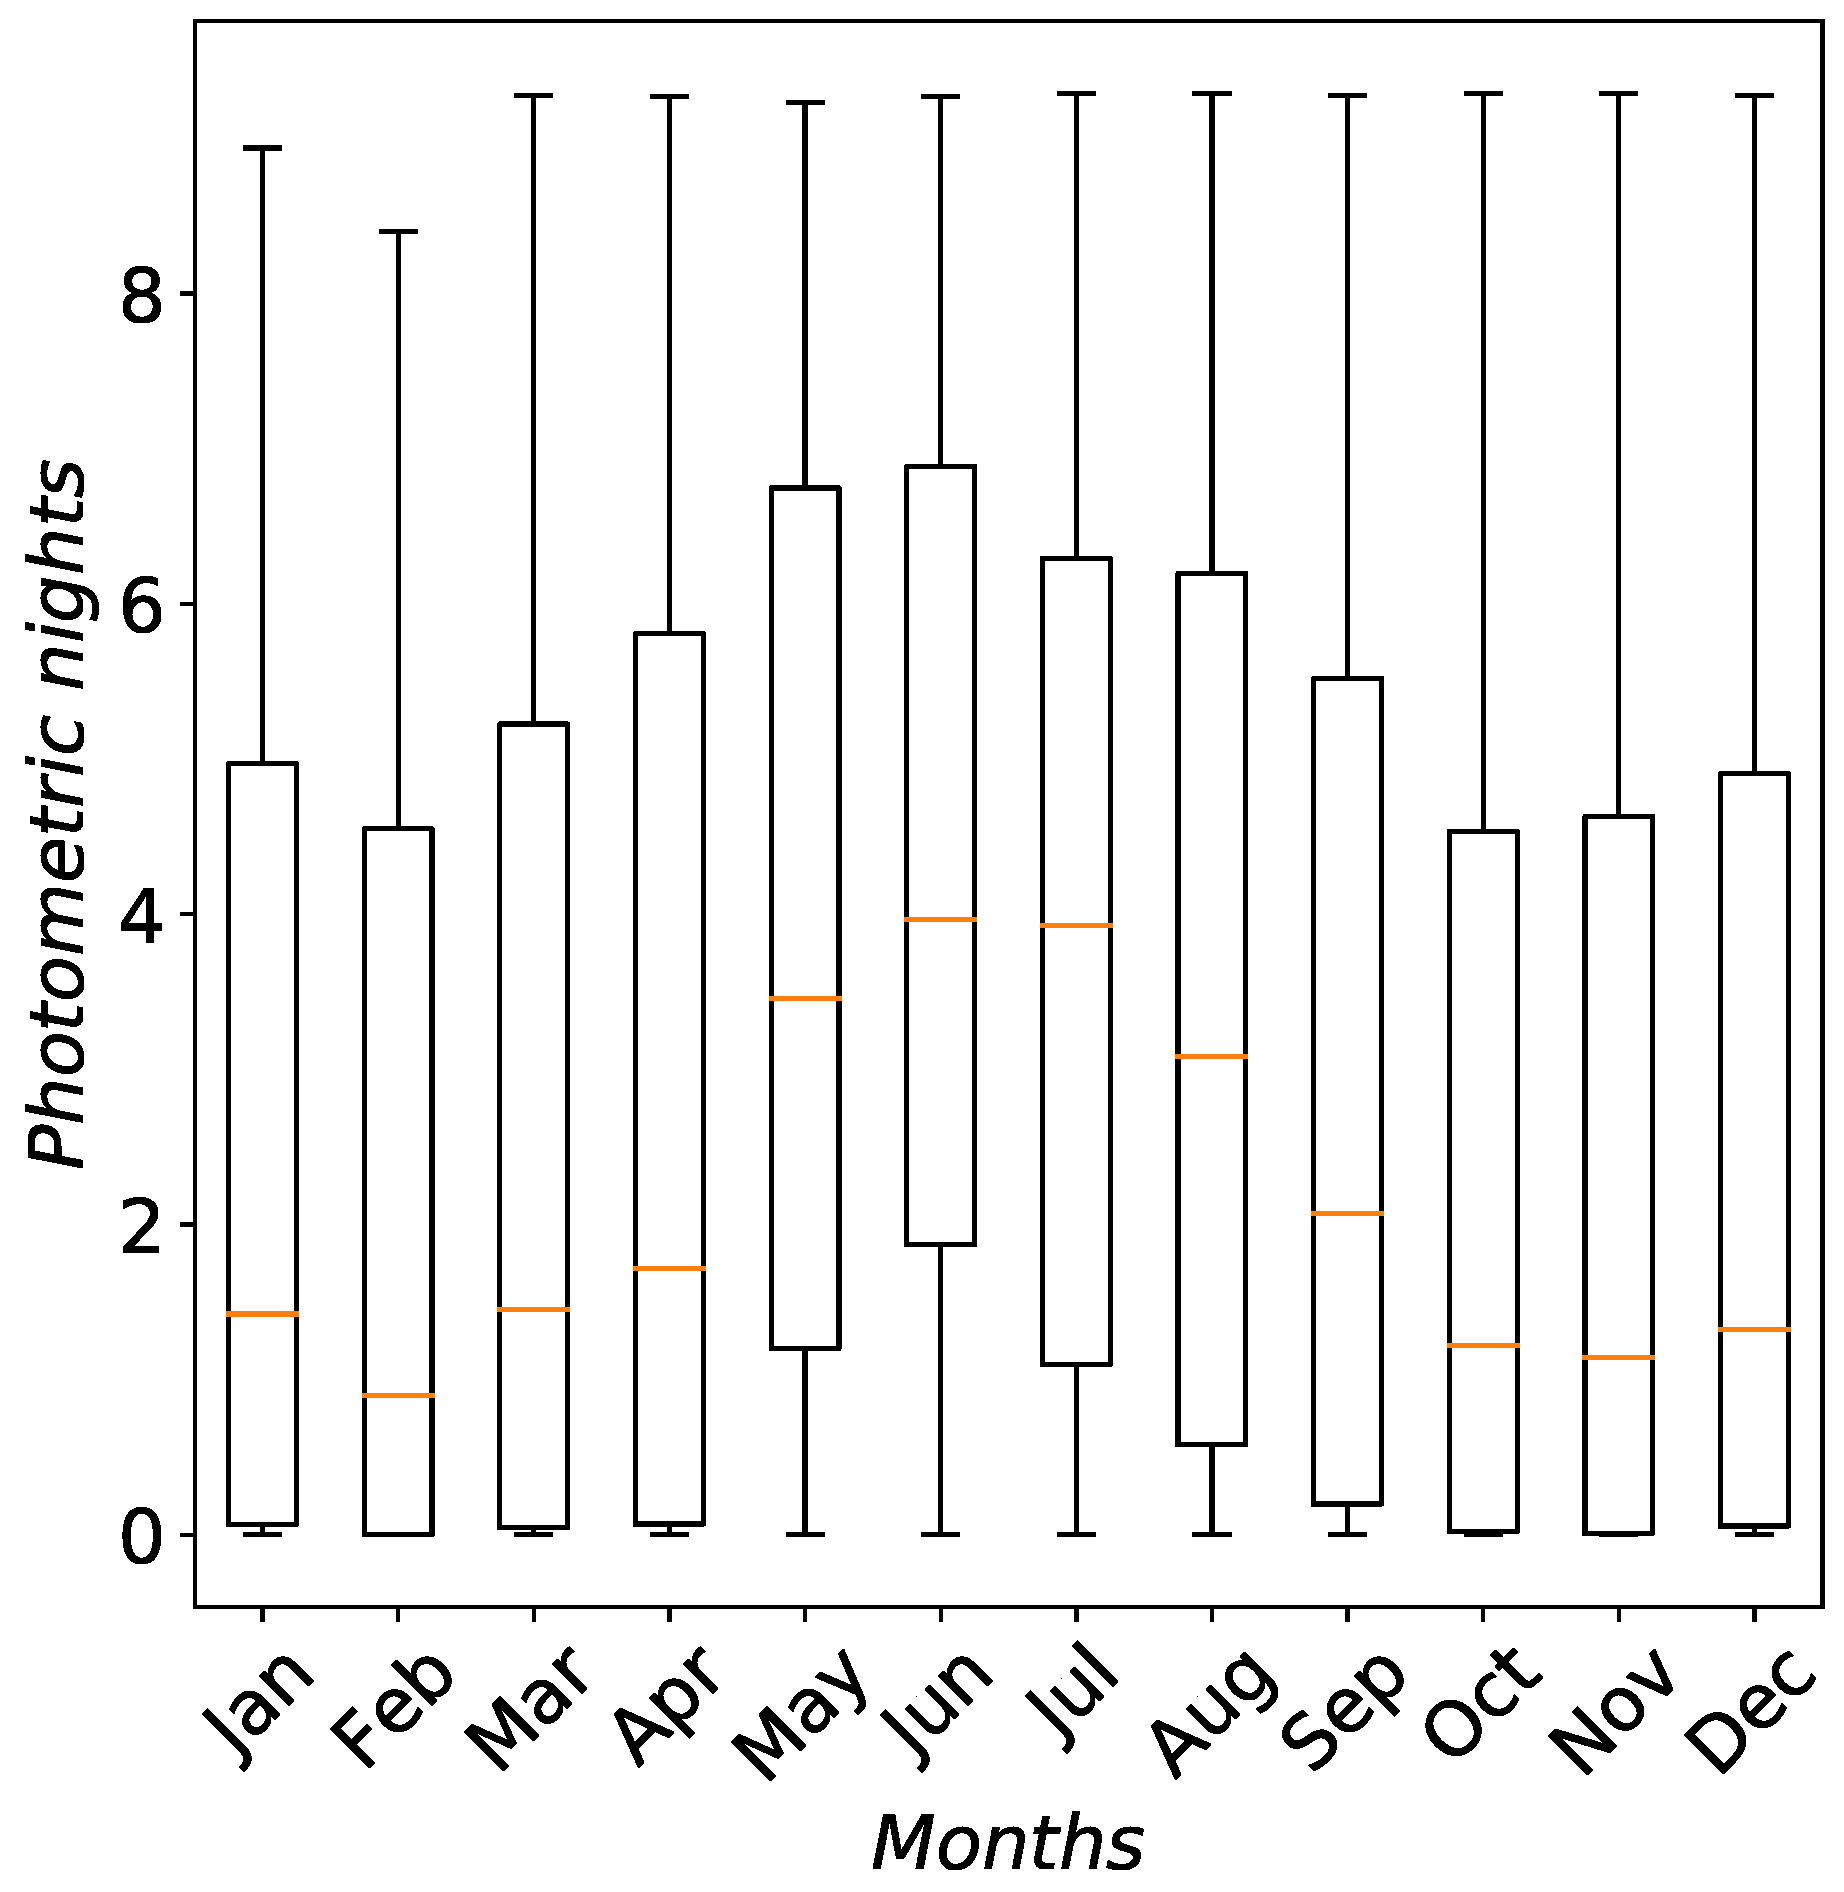
Photometric night: a night is termed photometric if it satisfies (i).
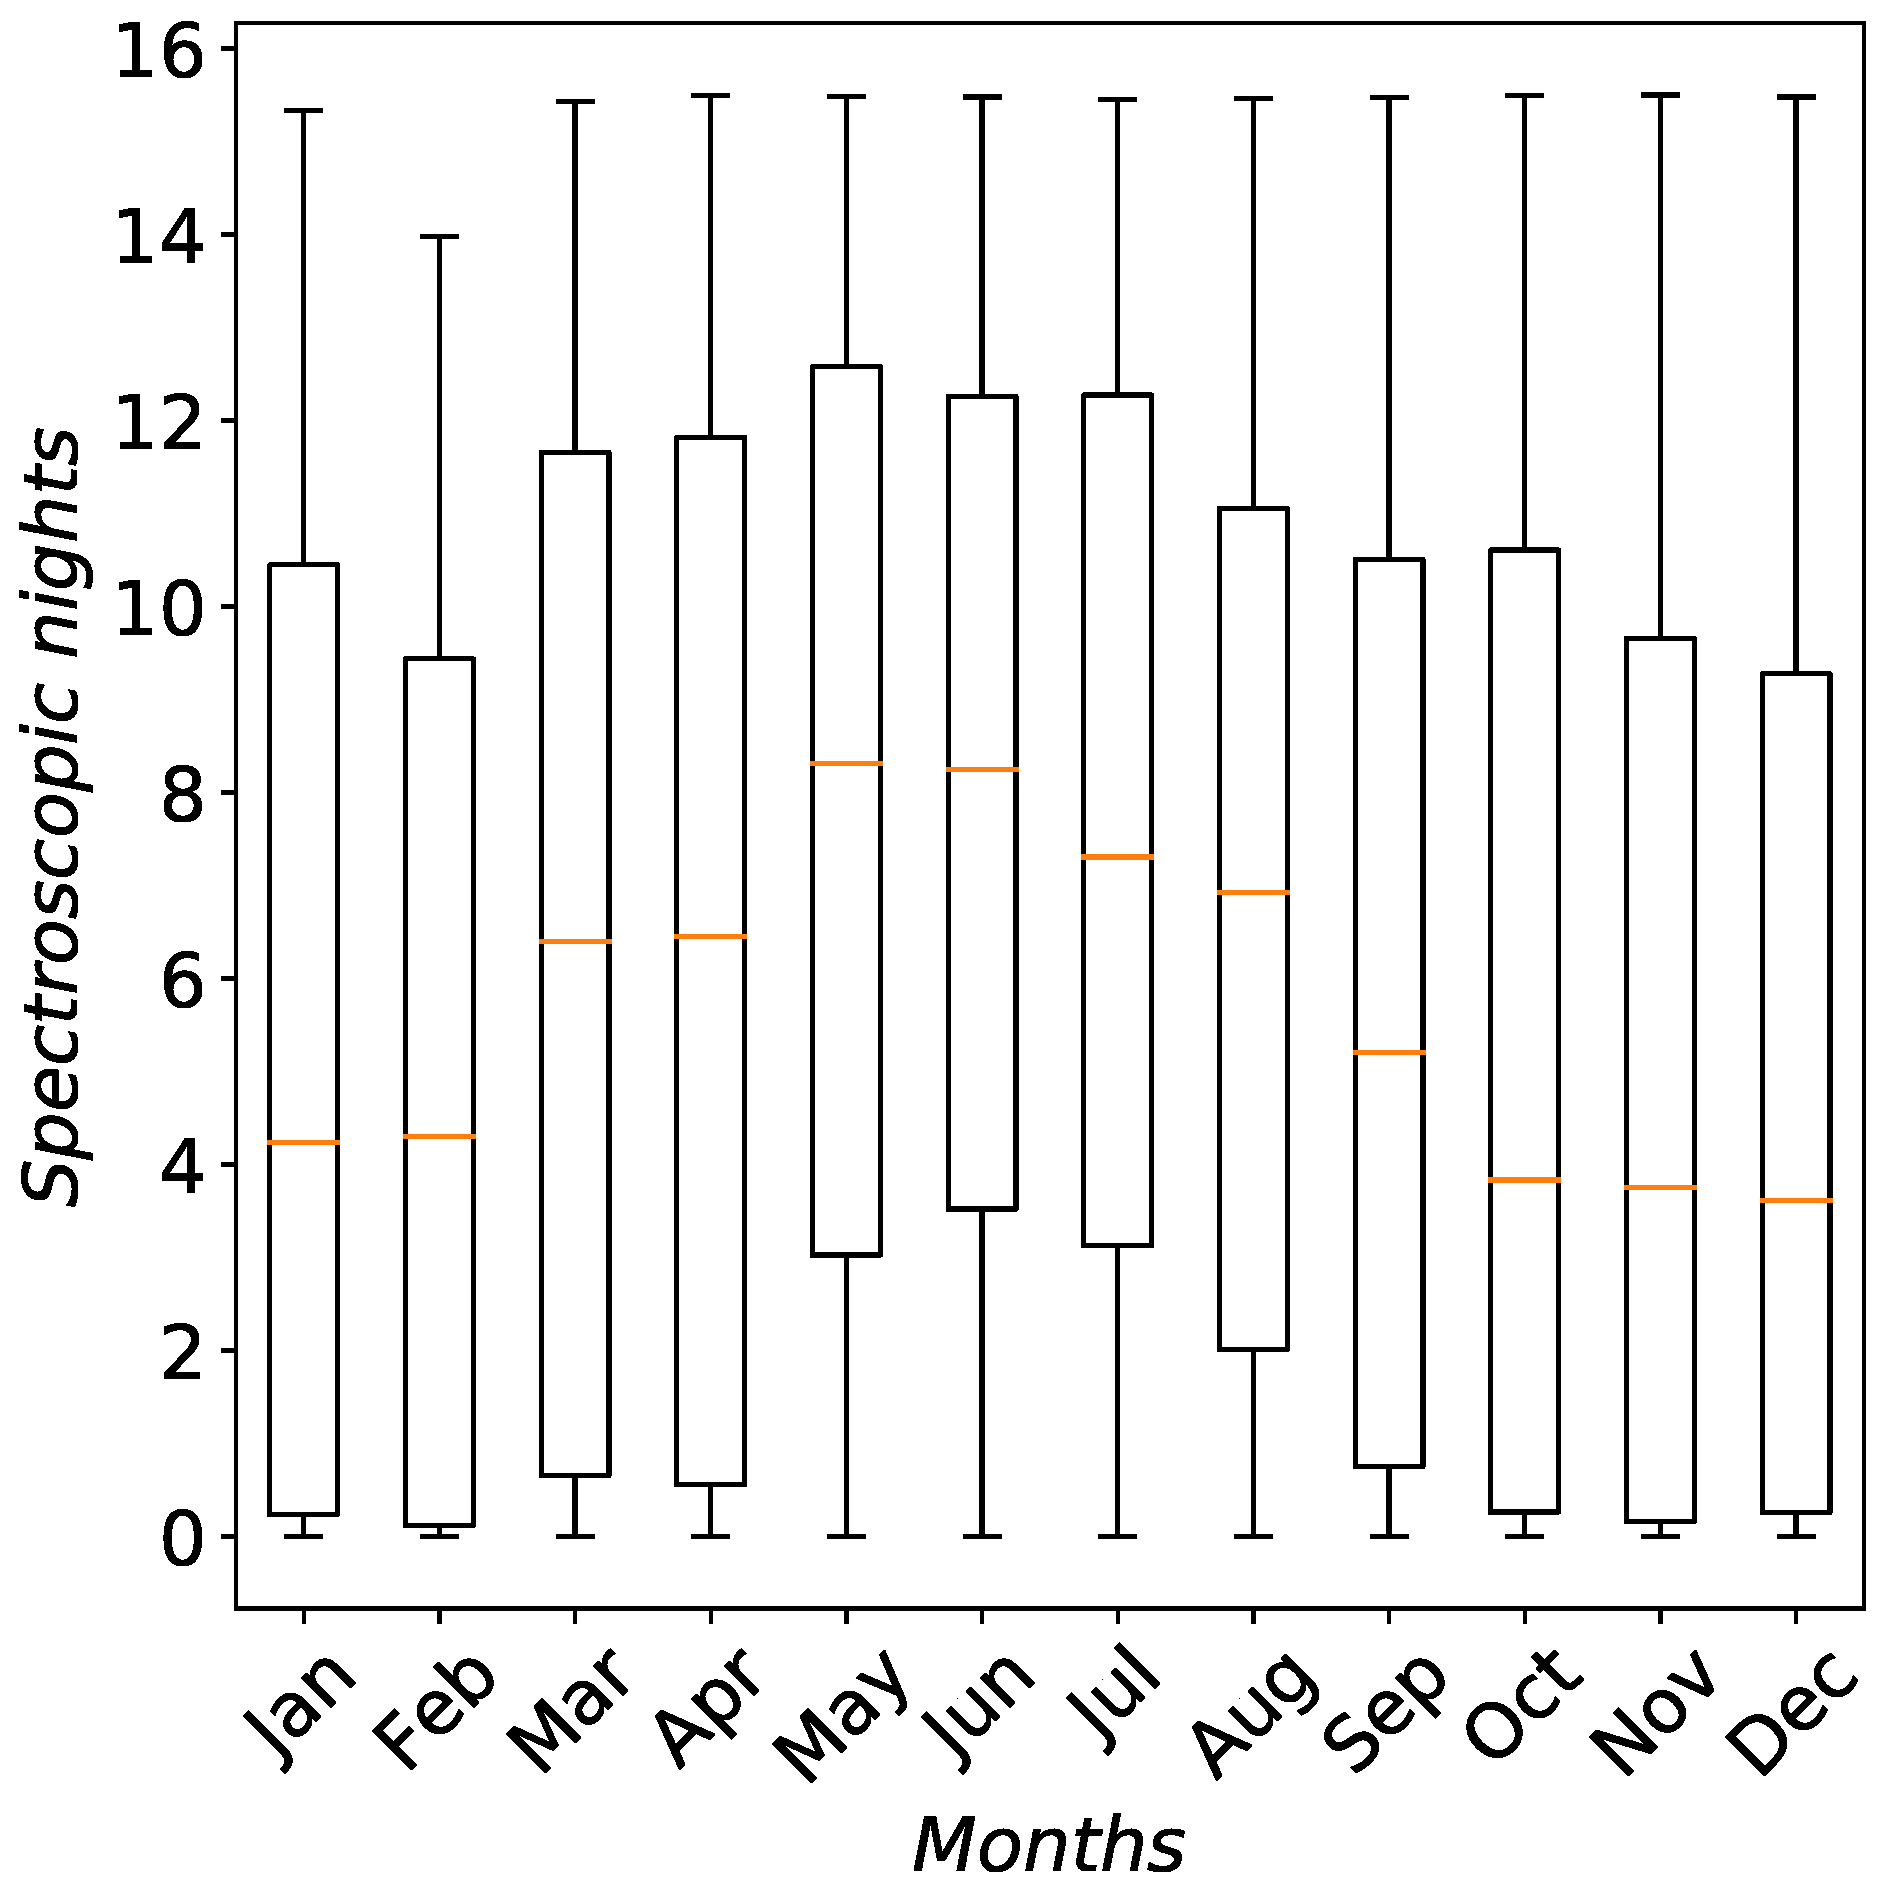
- (iv)
Spectroscopic nights: a night is termed spectroscopic if it satisfies (i) and (ii).
In order to estimate the number of photometric and spectroscopic nights as well as nights with cloud coverage lower than or equal to 50% at the BTA site, we used hourly Era-5 data from 2010 to 2022. The duration of a night at a site is counted from an hour after sunset to an hour before sunrise.
Figure 9 and
Figure 10 show box and whisker plots for photometric spectroscopic nights for 2010–2021.
Table 5 summarizes the number of nights estimated with different thresholds for the cloud coverage at the BTA site. At the BTA site, the averaged number of spectroscopic nights per year estimated from long-term reanalysis data is 67.8 (71.2 for nights with cloud coverage lower than or equal to 50%). The number of photometric nights is less (it is equal to 25.3 per year).
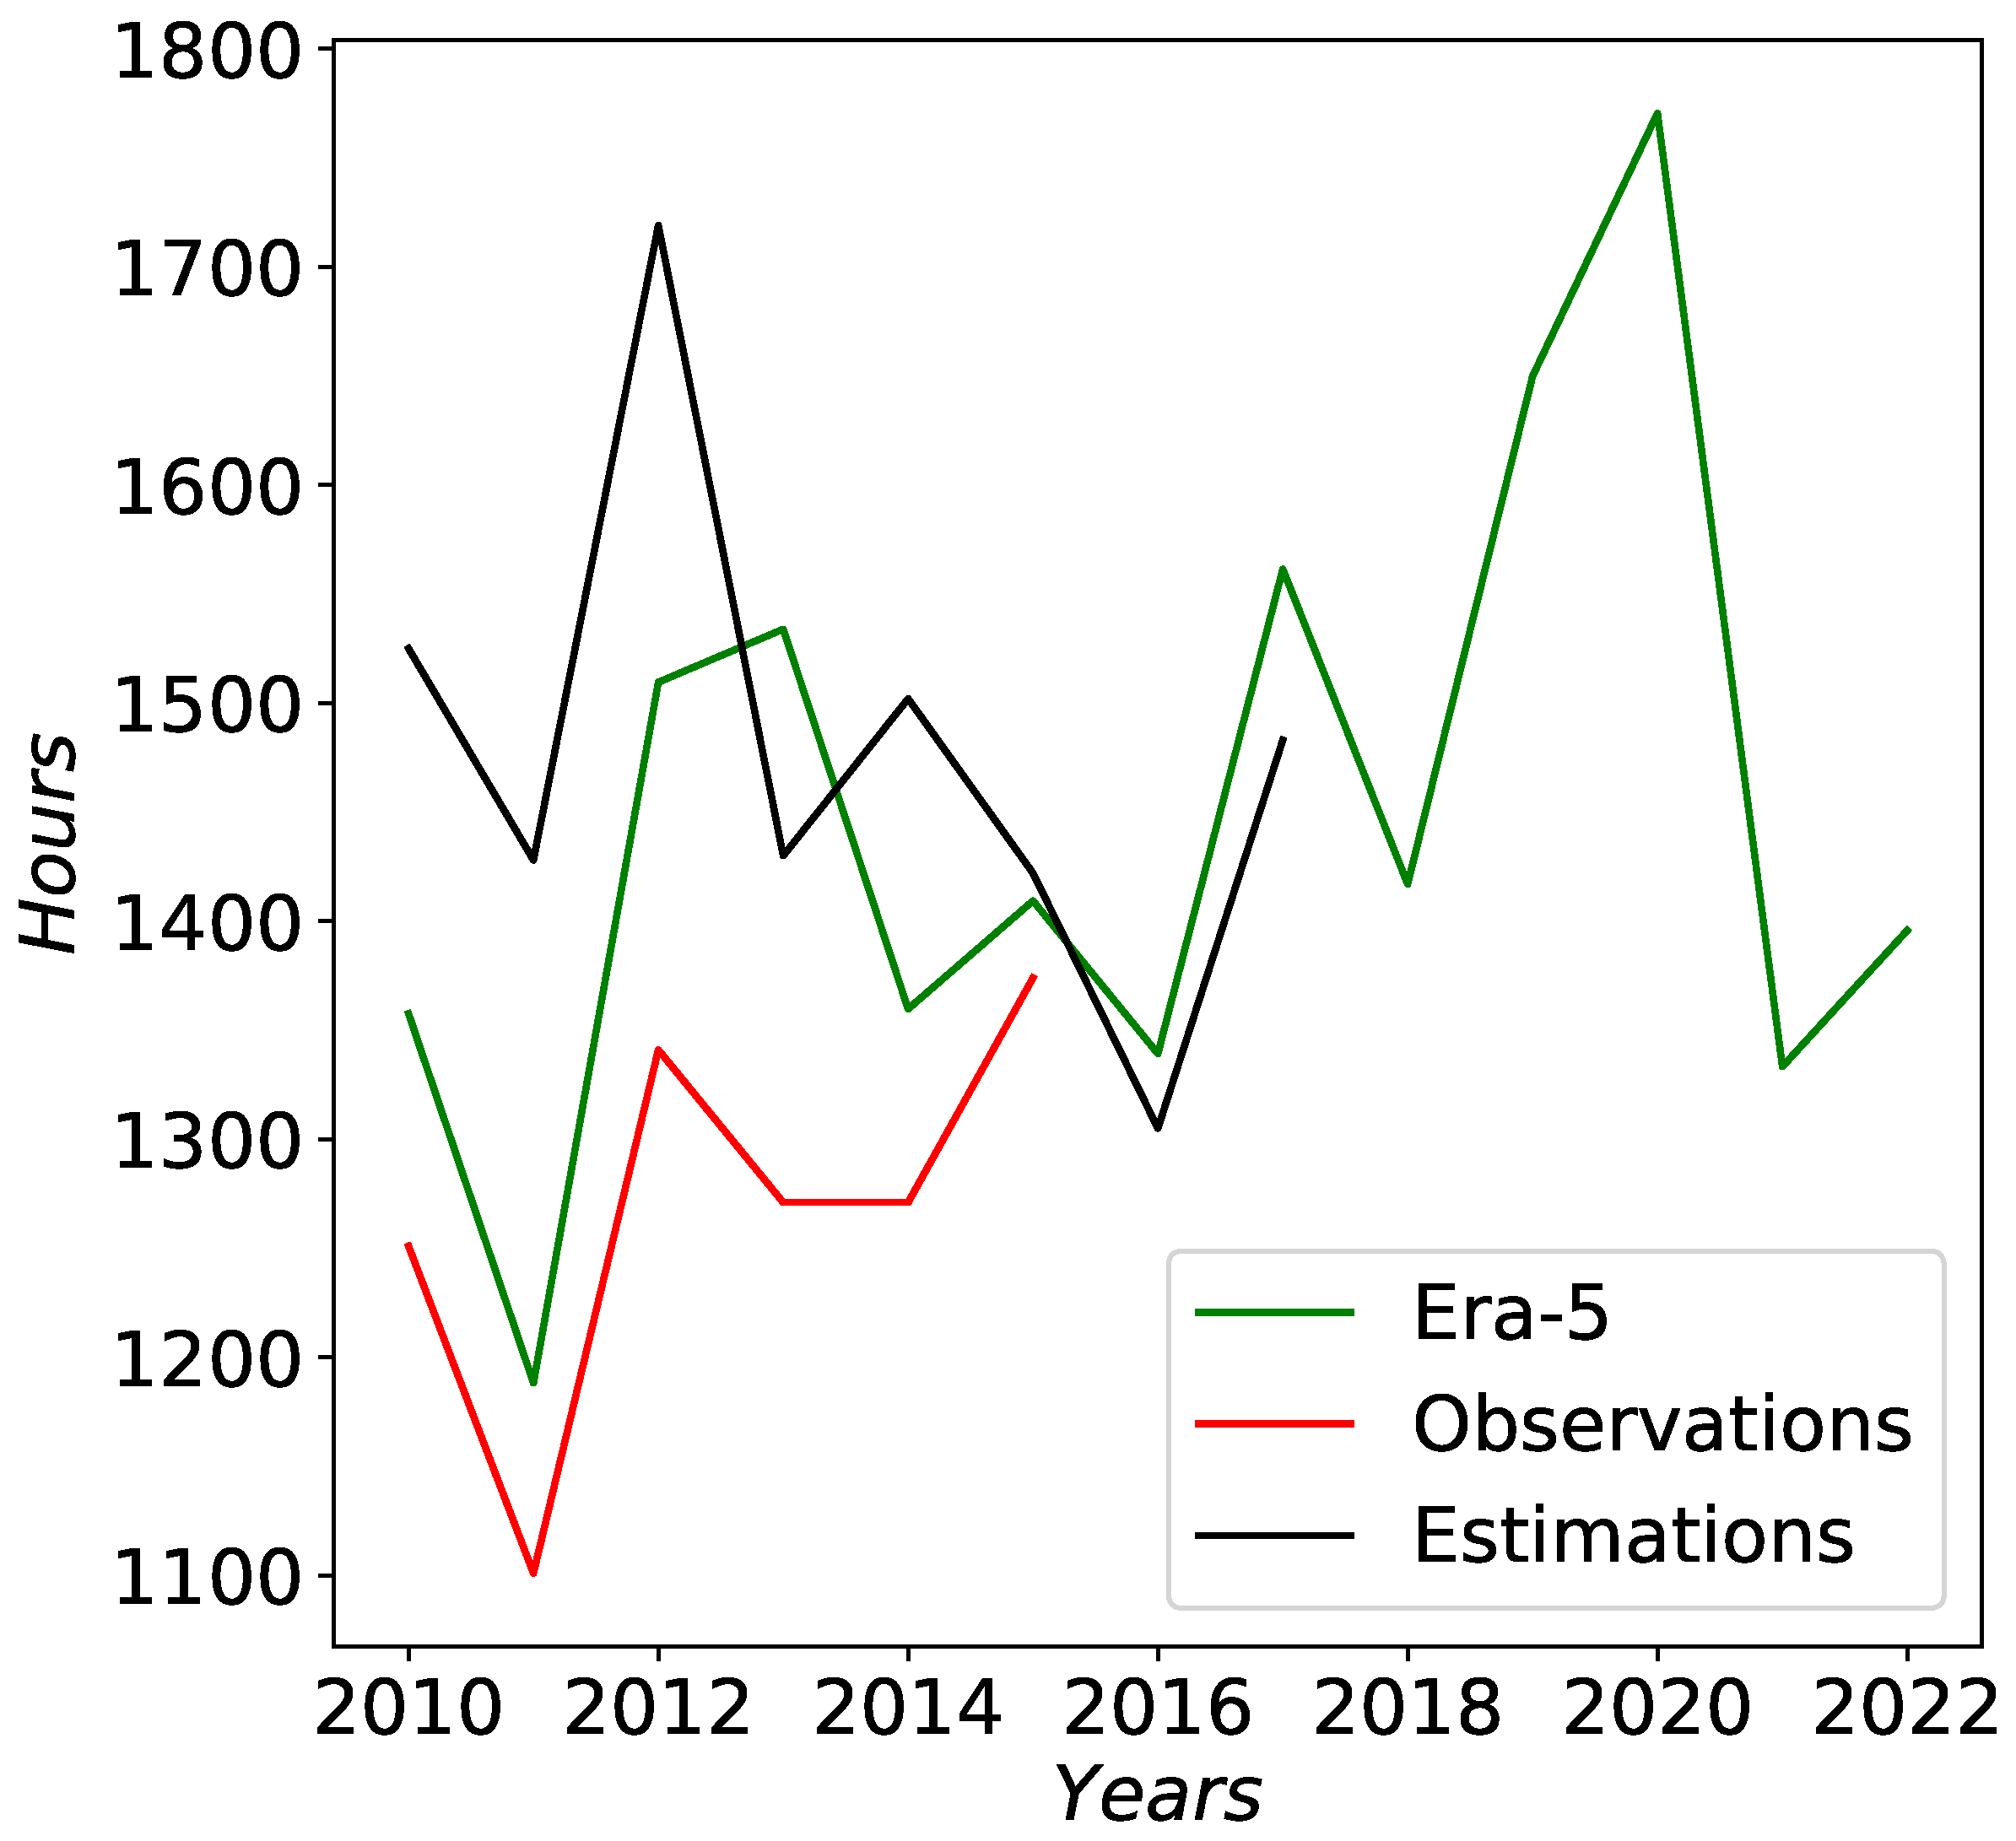
In addition, we compared the annual changes in amount of hours from visual observations at the BTA [
45] with the hours estimated from Era-5 reanalysis data.
Figure 11 shows annual changes in the amount of hours from visual observations at the BTA with the hours estimated from Era-5 reanalysis data. For spectral nights, the Era-5 data have the best agreement with visual observations at a threshold of 0.5. The total observing time at the BTA is 1453 h per year (
Table 6). As
Table 6 shows, one of the best sites in Dagestan, namely Mt. Kurapdag, is characterized by a large number of observation hours. The mean number of hours for the period from 2010 to 2021 was 1971 h.
5. Seasonal Variations of PWV at the Ali, Muztag-Ata, Suffa, Bta and Peak Terskol
For estimation of water vapor content within the BTA region, we corrected PWV values for a number of sites. Using Formula (
2), we estimated the proportionality coefficients at different sites, taking into account ratios between the altitudes of the mountain peak and the “surrounding terrain”.
Our method of PWV correction includes:
- (i)
The choice of area boundaries within which we should estimate the mean relative altitude difference. In particular, at the BTA, we used a limited area, which includes 4 × 5 grid nodes.
- (ii)
To calculate the relative altitude difference for an adjacent grid node, we shifted the selected area. Shifts are shown by the red box. The size of this area is fixed for each mesh node.
- (iii)
Knowing the relative altitude difference at a given site, we calculated the average ratios between precipitable water vapor at the mountain summit and the values corresponding to the “surrounding terrain”.
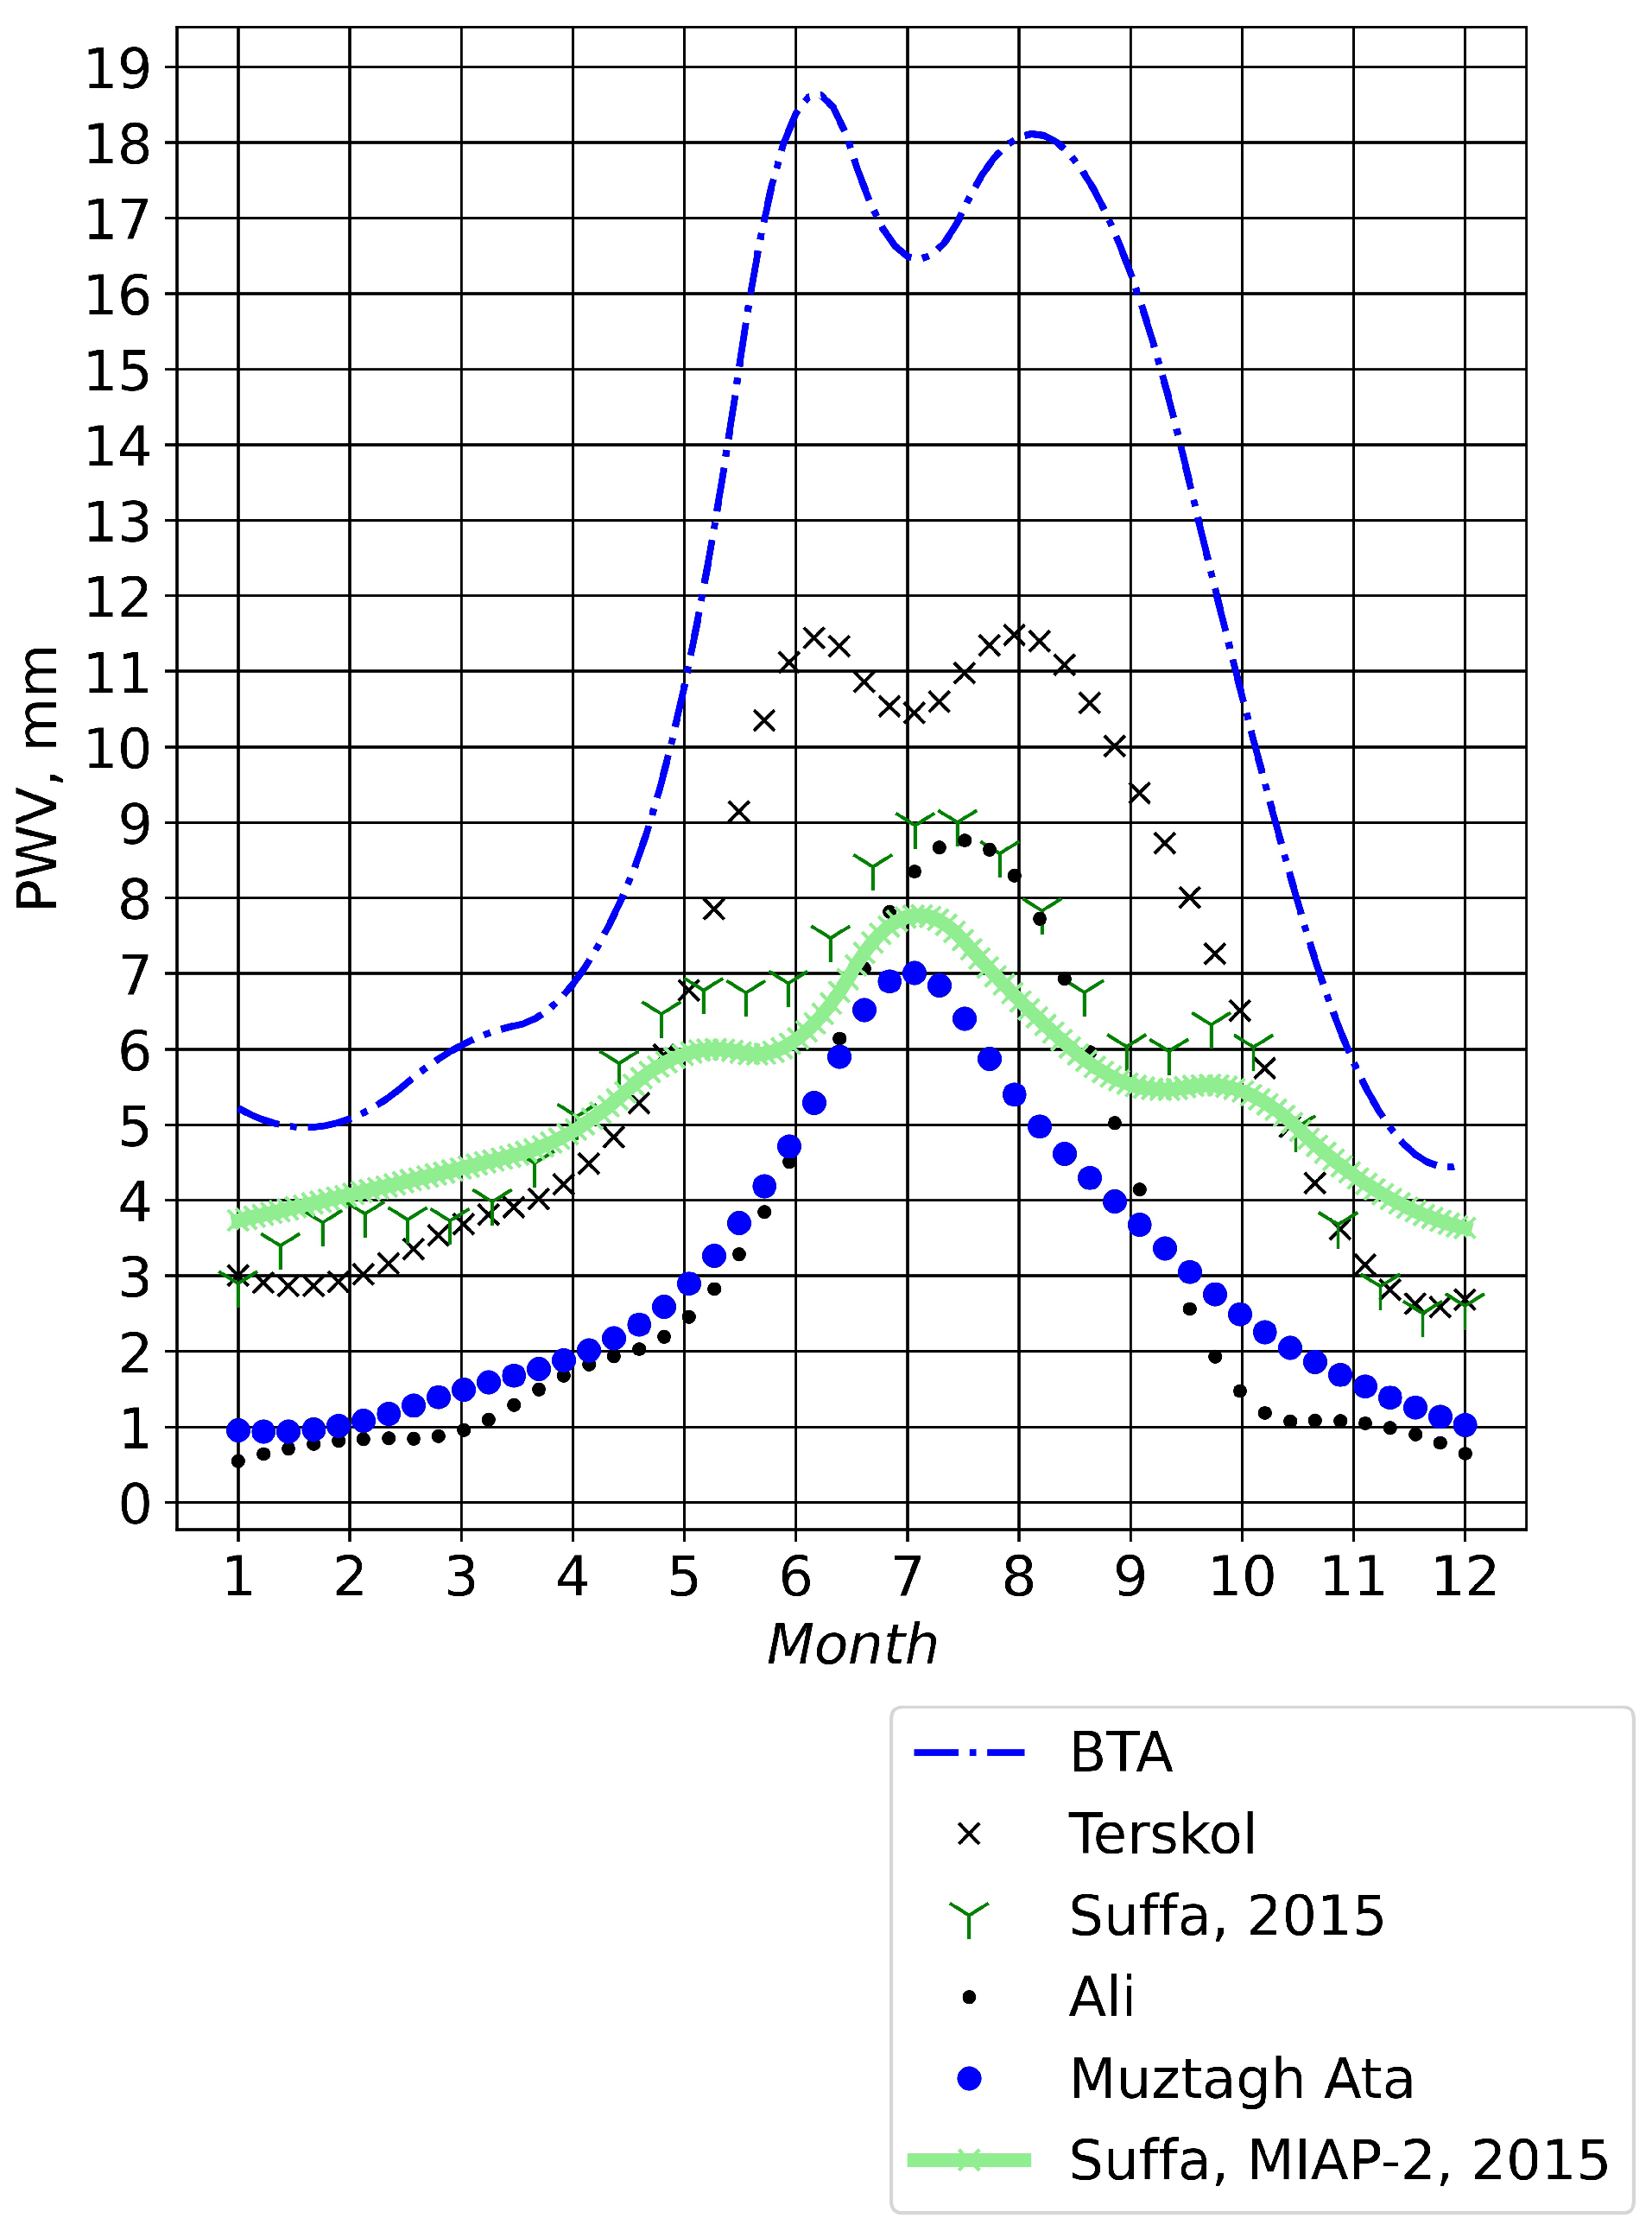
Figure 12 shows seasonal changes in corrected median PWV values estimated from the Era-5 data at the sites of Ali, Muztag-Ata, Suffa, Bta and Peak Terskol.
Table 7 shows the mean ratios
of the precipitable water vapor at the summit to the PWV values corresponding to the “surrounding terrain”.
Table 8 shows the mean values of PWV at the sites suitable for mm/submm observations.
At the Ali site, the median value of PWV calculated from the Era-5 data is about 2.9 mm. This value exceeds the median value of PWV by a factor of 1.44 estimated in [
10] (2.02 mm). The maximum PWV values are observed in summer. The median value is 7.0 mm. In winter, the median value is about 1 mm.
Similar astroclimatic conditions in terms of median PWV values are observed at Muztag-Ata. The median of PWV is 2.9 mm. In comparison with Ali, Muztag-Ata is characterized by a smaller intra-annual amplitude of PWV changes. In summer, the median is 5.7 mm; in winter, the median decreases to 1.0 mm.
At the Suffa International Observatory, medians in PWV are higher compared to Muztag-Ata and Ali. The annual median PWV derived from Era-5 reanalysis is 5.4 mm. The best conditions are observed in December–January when the median values are close to 2.6–2.9 mm. The worst conditions are in July with a median of 8.9 mm. Comparison of the calculated PWV with the PWV measured by MIAP-2 radiometer [
46,
47,
48] shows that MAE is 0.79 mm, and the root mean square deviation is close to 0.87 mm. The correlation coefficient between the measured and calculated monthly PWV values is 0.98.
Following the proposed approach, the medians of PWV were estimated at the Peak Terskol and the site of BTA. At the BTA, the annual median is 10.3 mm. In winter, the median is minimal and equal to 4.9 mm; in summer, the median increases to 17.4 mm. In comparison with the BTA, at the Peak Terskol, the annual median of PWV decreases 1.63 times (the median is 6.3 mm). In summer, at the Peak Terskol, the median varies from 10.5 to 11.5 mm. In winter, the median is 2.9 mm (the minimum of PWV is observed in December).
6. Discussion
The study is aimed at the description of astroclimatic conditions within the BTA region (from 35E to 55E, from 40N to 50N). For the first time, spatial distributions of PWV within the BTA region were obtained. We show that a stable vast area with low water vapor content is formed within the BTA region. We associate this area with high transparency of the atmosphere for mm/submm radiation. In order to estimate water vapor content most closely matched to the measured values, we proposed a method for correcting PWV values, taking into account the relief. The method is based on averaging the elevation of grid notes within a certain area. In calculations, this area contains a certain number of grid nodes (4 × 5 nodes). For each grid node, the relative altitude differences between the mountain top and the surrounding terrain, as well as the corresponding proportionality coefficients, were calculated.
Using the correction method, we estimated the medians of PWV at the Chajnantor Plateau, Ali, Muztag-Ata, Suffa, BTA, Peak Terskol, Mt. Horai and Mt. Kurapdag. We showed that the Era-5 reanalysis reproduces changes in hourly PWV values with a correlation coefficient of 0.57. The consistency of the reanalysis data improves with the measured variations in terms of mean monthly PWV values. The correlation coefficient increases to 0.97.
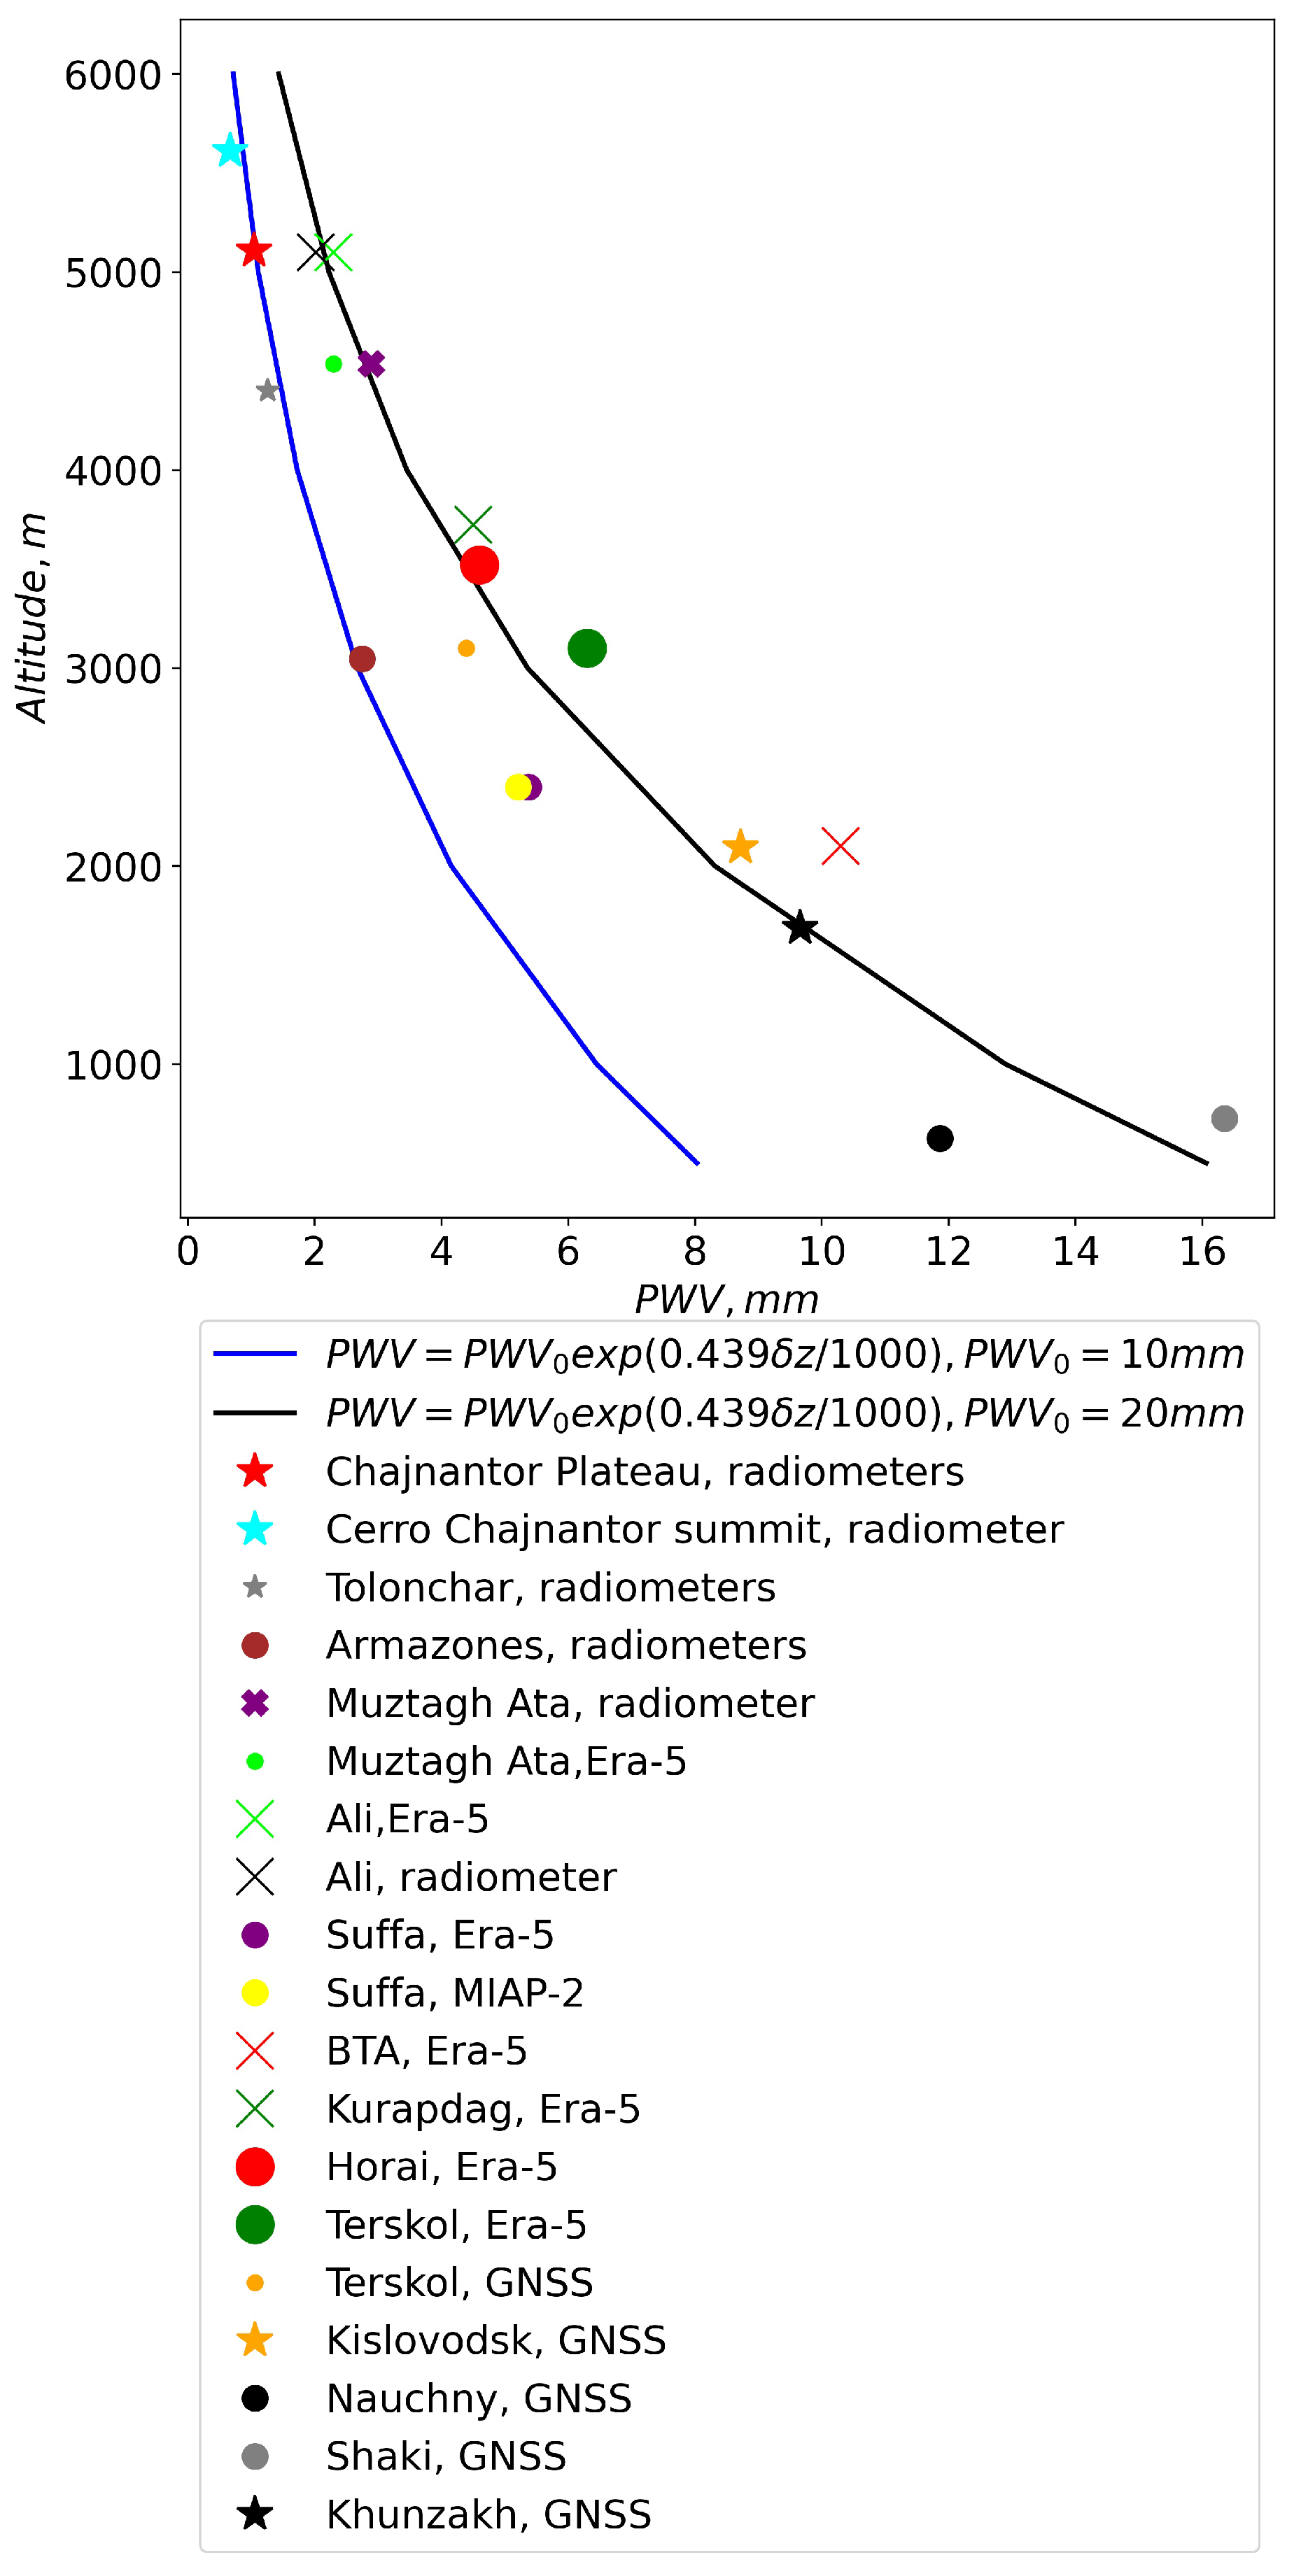
In the calculations, we used the exponential dependence of PWV on the altitude [
49].
Figure 13 shows the correspondence between medians of PWV and site elevation.
With the aim of comparing the PWV dependence, we estimated the medians of PWV at the Chajnantor Plateau, at the sites of Cerro Chajnantor Summit, Tolonchar and Armazones. It should be noted that the authors [
4] considered a limited range of altitudes (from 3000 to 5640 m). In this range of altitudes, the authors obtained the dependence:
However, if we consider a wider range of altitudes, we see that the Chajnantor Plateau, Cerro Chajnantor Summit, Tolonchar and Armazones are described well by the dependence:
The analysis of the figure shows that in comparison with the sites of South America, Ali and Muztag-Ata have higher PWV and are described by the dependence:
The PWV estimates obtained at these sites are in good agreement with theoretical dependencies of PWV on altitude. The mean absolute errors decrease with altitude and do not exceed 2.0 mm, on average. We can note that the reanalysis data somewhat overestimate the PWV medians by 1–2 mm compared to the measurement data. A small spread of PWV values indicates that using the reanalysis data and the proposed method, in general, we can estimate the medians of PWV reliably. Considering cases with low values of TCC as well as PWV, we can note that Mt. Kurupdag and Mt. Horai are located in an area suitable for mm/submm astronomical observations.


