Article

Outbreak of Moroccan Locust in Sardinia (Italy): A Remote Sensing Perspective

1
German Remote Sensing Data Center (DFD), German Aerospace Center (DLR), 82234 Wessling, Germany
2
Department of Agricultural Sciences, University of Sassari, 07100 Sassari, Italy
3
Department of Geography, Kiel University, 24118 Kiel, Germany
4
Institute of Geography and Geology, University of Wuerzburg, 97074 Wuerzburg, Germany
*
Author to whom correspondence should be addressed.
Remote Sens. 2022, 14(23), 6050; https://doi.org/10.3390/rs14236050
Submission received: 3 October 2022 / Revised: 24 November 2022 / Accepted: 25 November 2022 / Published: 29 November 2022

Abstract

:
The Moroccan locust has been considered one of the most dangerous agricultural pests in the Mediterranean region. The economic importance of its outbreaks diminished during the second half of the 20th century due to a high degree of agricultural industrialization and other human-caused transformations of its habitat. Nevertheless, in Sardinia (Italy) from 2019 on, a growing invasion of this locust species is ongoing, being the worst in over three decades. Locust swarms destroyed crops and pasture lands of approximately 60,000 ha in 2022. Drought, in combination with increasing uncultivated land, contributed to forming the perfect conditions for a Moroccan locust population upsurge. The specific aim of this paper is the quantification of land cover land use (LCLU) influence with regard to the recent locust outbreak in Sardinia using remote sensing data. In particular, the role of untilled, fallow, or abandoned land in the locust population upsurge is the focus of this case study. To address this objective, LCLU was derived from Sentinel-2A/B Multispectral Instrument (MSI) data between 2017 and 2021 using time-series composites and a random forest (RF) classification model. Coordinates of infested locations, altitude, and locust development stages were collected during field observation campaigns between March and July 2022 and used in this study to assess actual and previous land cover situation of these locations. Findings show that 43% of detected locust locations were found on untilled, fallow, or uncultivated land and another 23% within a radius of 100 m to such areas. Furthermore, oviposition and breeding sites are mostly found in sparse vegetation (97%). This study demonstrates that up-to-date remote sensing data and target-oriented analyses can provide valuable information to contribute to early warning systems and decision support and thus to minimize the risk concerning this agricultural pest. This is of particular interest for all agricultural pests that are strictly related to changing human activities within transformed habitats.

1. Introduction

The recent outbreak of the Moroccan locust (DMA), Dociostaurus maroccanus (Thunberg), in Sardinia (Italy) is the worst in over 30 years [1]. The outbreak had already begun in 2019 and multiplied from year to year, with growing locust population and affected areas, which have increased from about 2500 ha in 2019 to 30,000 ha in 2021 and an estimated 60,000 ha in 2022 [1,2]. Historically, the Moroccan locust has been considered one of the most dangerous agricultural pests in the Mediterranean region [3], and the first report of DMA outbreaks goes back to about 2000 years ago, when Pliny reported mandatory campaigns against locusts in Cyrene [4]. In Central Asia, Caucasus, and North Africa, DMA is still a major threat for crop and pasture land, requiring regular monitoring and control activities by phytosanitary organizations. The habitat of this locust species is heavily fragmented [5] and distributed from the Canary Islands in the west to Afghanistan in the east, with occurrences within the Mediterranean zone, central Europe, the Middle East, Caucasus, and Central Asia (Figure 1). DMA breeding sites are usually found in foothill zones and valleys approximately 400–800 m above sea level in semi-arid steppes and semi-arid deserts with a presence of abundant spring ephemeral vegetation and annual precipitation of 300–500 mm [3,6]. However, spring precipitation with an optimum of 100 mm is the most critical factor affecting the population dynamics. Unusual dry spring periods in consecutive years stimulate population increase and can lead to DMA outbreaks, causing economic losses and affecting rural livelihoods [3].
Larger-scale damages caused by DMA in the European zone have become rare due to anthropogenic activities, such as the conversion of grassland into agricultural land. On the other hand, deforestation and overgrazing can promote the population dynamics of DMA [3]. Overall, it is well-known that land management is one of the most important driving factors for DMA population dynamics [3,5,7,8], especially economic or political constraints, which result in increasing abandoned, fallow, and untilled areas [3,9]. Therefore, small-scale outbreaks in Spain, France, Hungary, and Italy have been documented and can occur when ecological conditions are favorable. Furthermore, climate change is expected to have significant impacts on its distribution area and population dynamics, being particularly exacerbated by several consecutive drought years (especially during spring and summer) and temperatures higher than average, as reported for Sardinia over the past years [10,11]. In this context, outbreaks of locust pests in Sardinia are not uncommon and can be related to drought periods in combination with changing land management activities. For example, about 81,000 ha in 1988/1989, 75,000 ha in 1951, 1,500,000 ha in 1946, and 400,000 ha in 1933 were infested by DMA in Sardinia [10].
In this context, remote sensing applications are an important asset contributing to locust preventive management strategies that includes mapping and monitoring vast areas of locust habitats [11,12,13,14]. Preventive locust management [14,15,16] is proactive and aims to detect the hazard of a locust population upsurge and control it at a smaller scale before it evolves to a large-scale plague [11]. It includes a better understanding of the species biology and ecology, more effective monitoring, early warning systems, and different control strategies. The monitoring of vast areas, which provide favorable conditions for successful breeding and potential for locust population increase, is of especially high importance for preventive locust management. This kind of geospatial risk assessment benefits highly from the availability and quality of geospatial and remote sensing datasets. Therefore, the role of remote sensing data for locust management has been growing over the past decades [11,12]. The first remote sensing applications based on Landsat data were introduced by [17,18]. Later, Advanced Very-High-Resolution Radiometer (AVHHR), Moderate-Resolution Imaging Spectroradiometer (MODIS), and Satellite Pour l’Observation de la Terre VEGETATION (SPOT–VGT) were applied to detect vegetation development at a higher temporal frequency, as well as Meteosat cloud imagery to estimate intense rainfall over desert locust habitats [19,20,21,22,23]. In addition, soil moisture acquired from remote sensing data has been an important input for different habitat modelling and forecast efforts [24,25,26,27].
In this paper, the recent outbreak in Sardinia was analyzed with the application of remote sensing data to provide additional information that can contribute to support monitoring, risk assessment, and forecast efforts. The relation between recent DMA records from 2022 and abandoned/fallow or unplowed lands was quantified to demonstrate the value of up-to-date information on the actual state of the land surface derived from open-source remote sensing data. For this purpose, we applied time-series analyses of the Sentinel-2 data archives (2017–2021) with a specific focus on deriving relevant land cover and land use (LCLU) classes as well as their evolution over time.

2. Materials and Methods
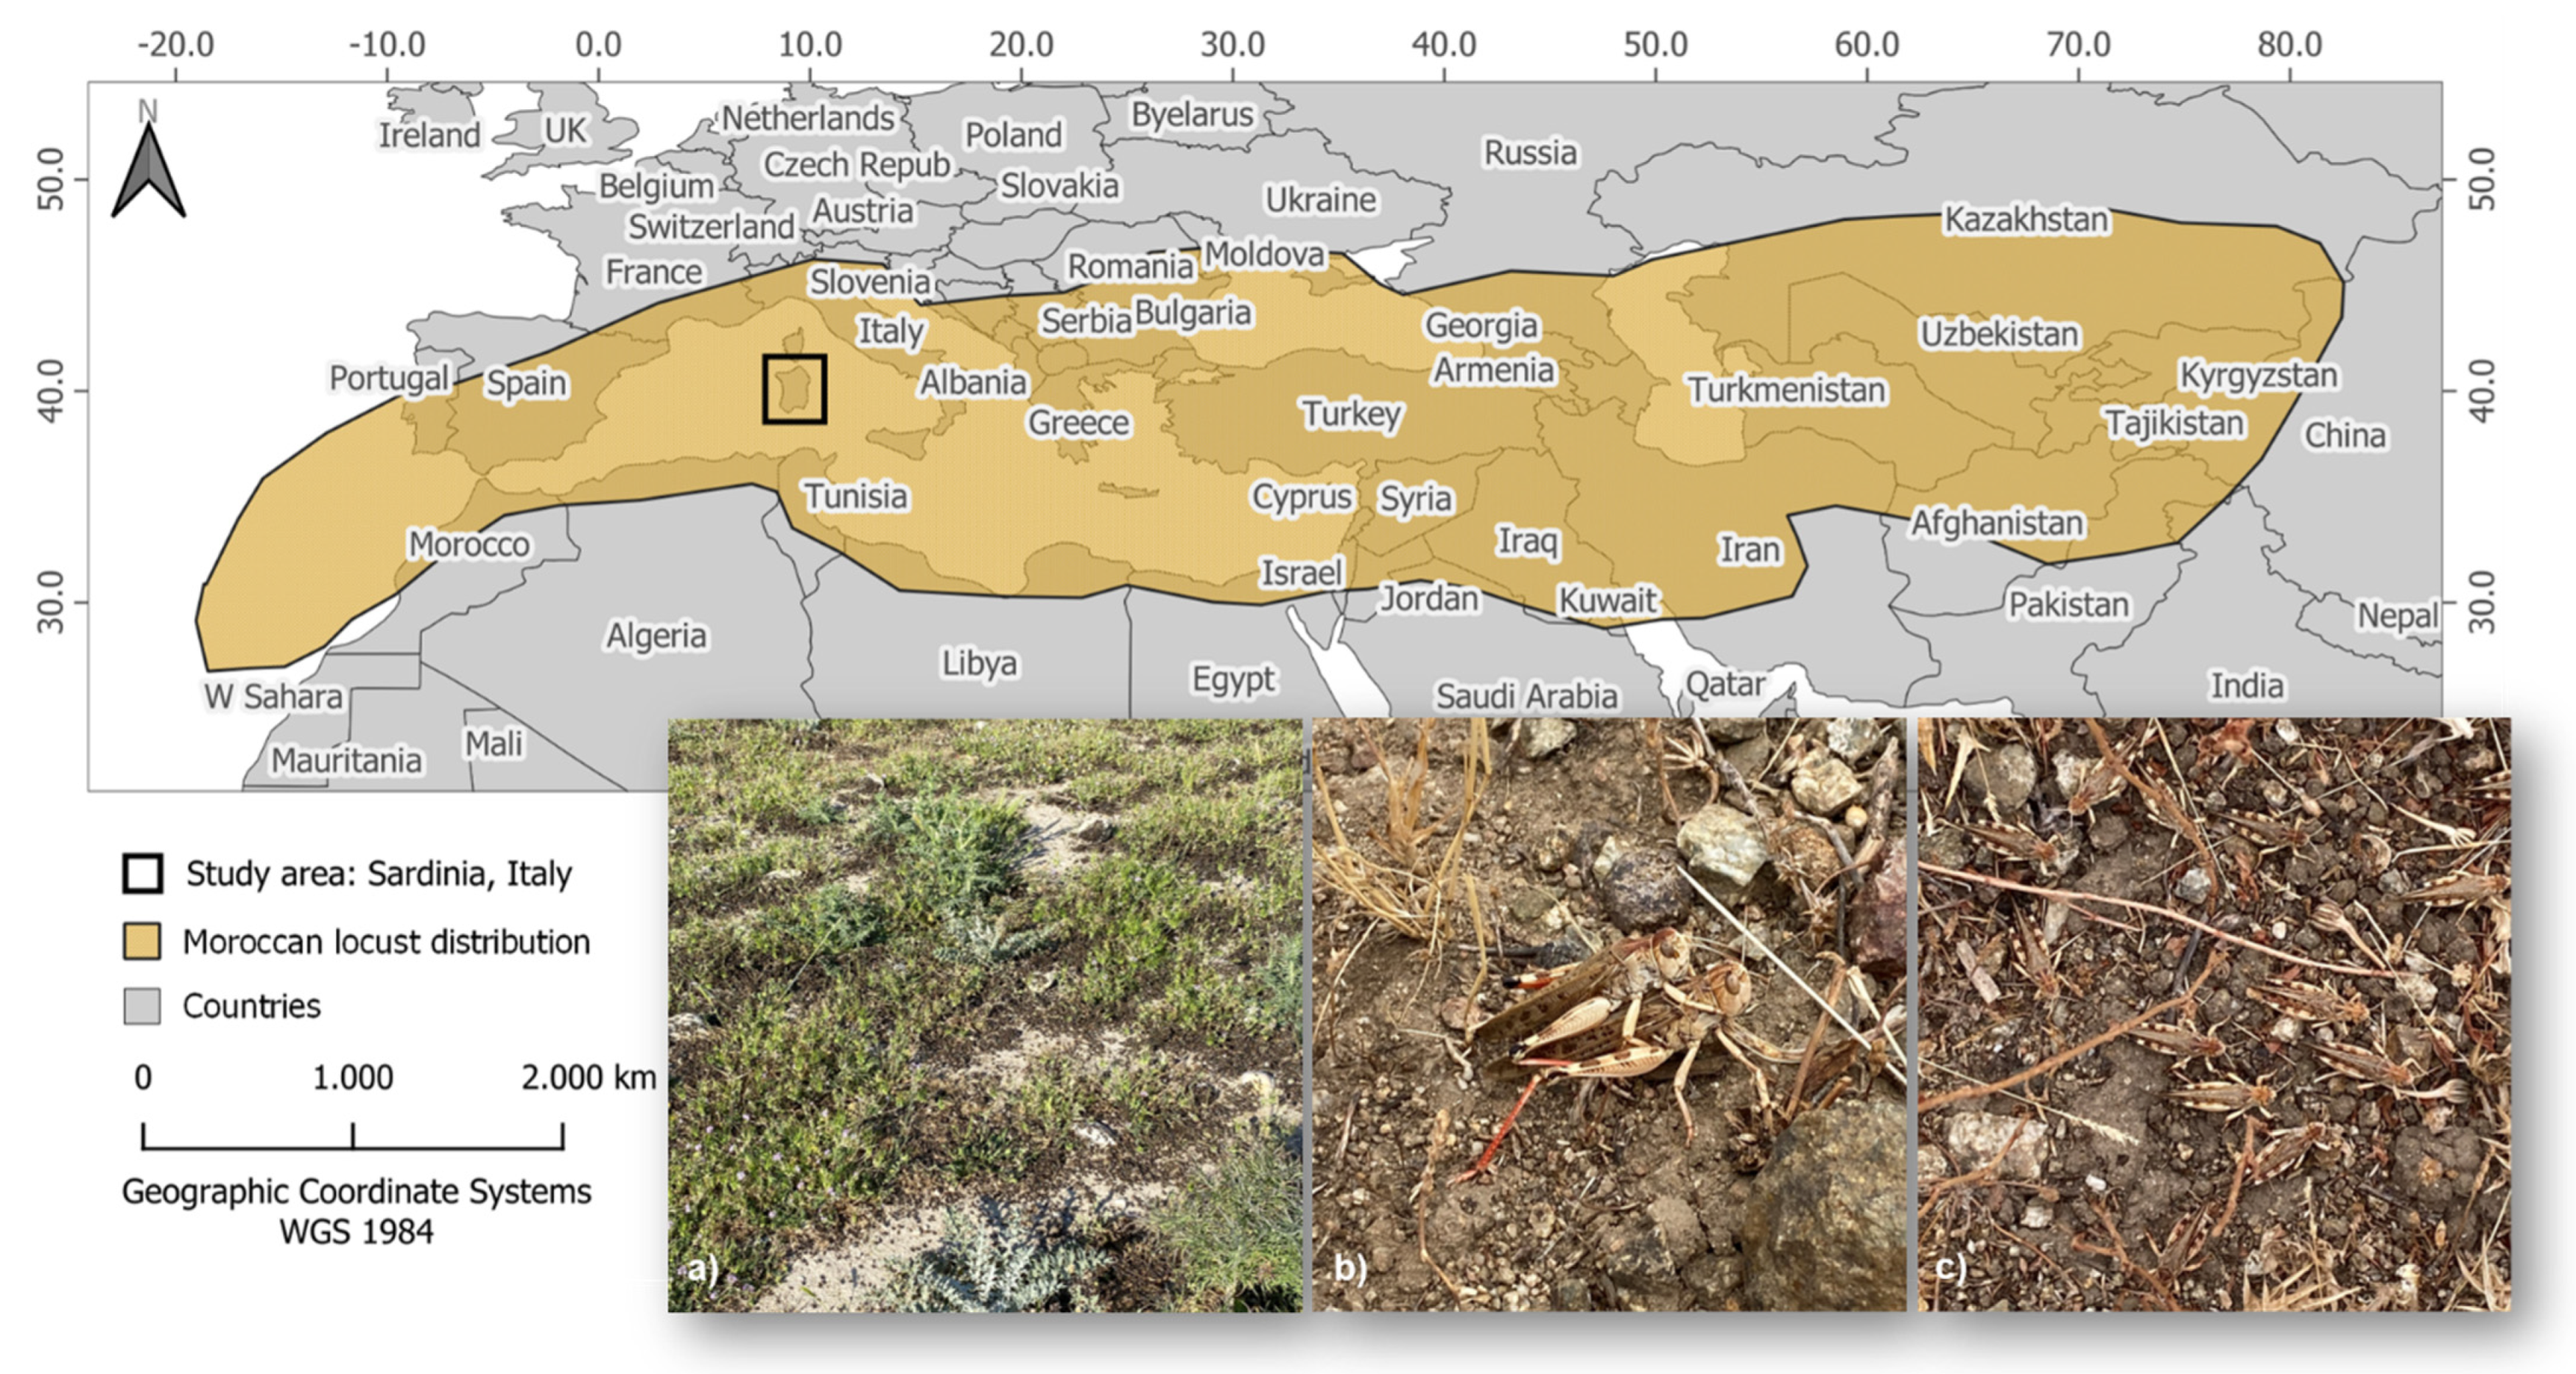
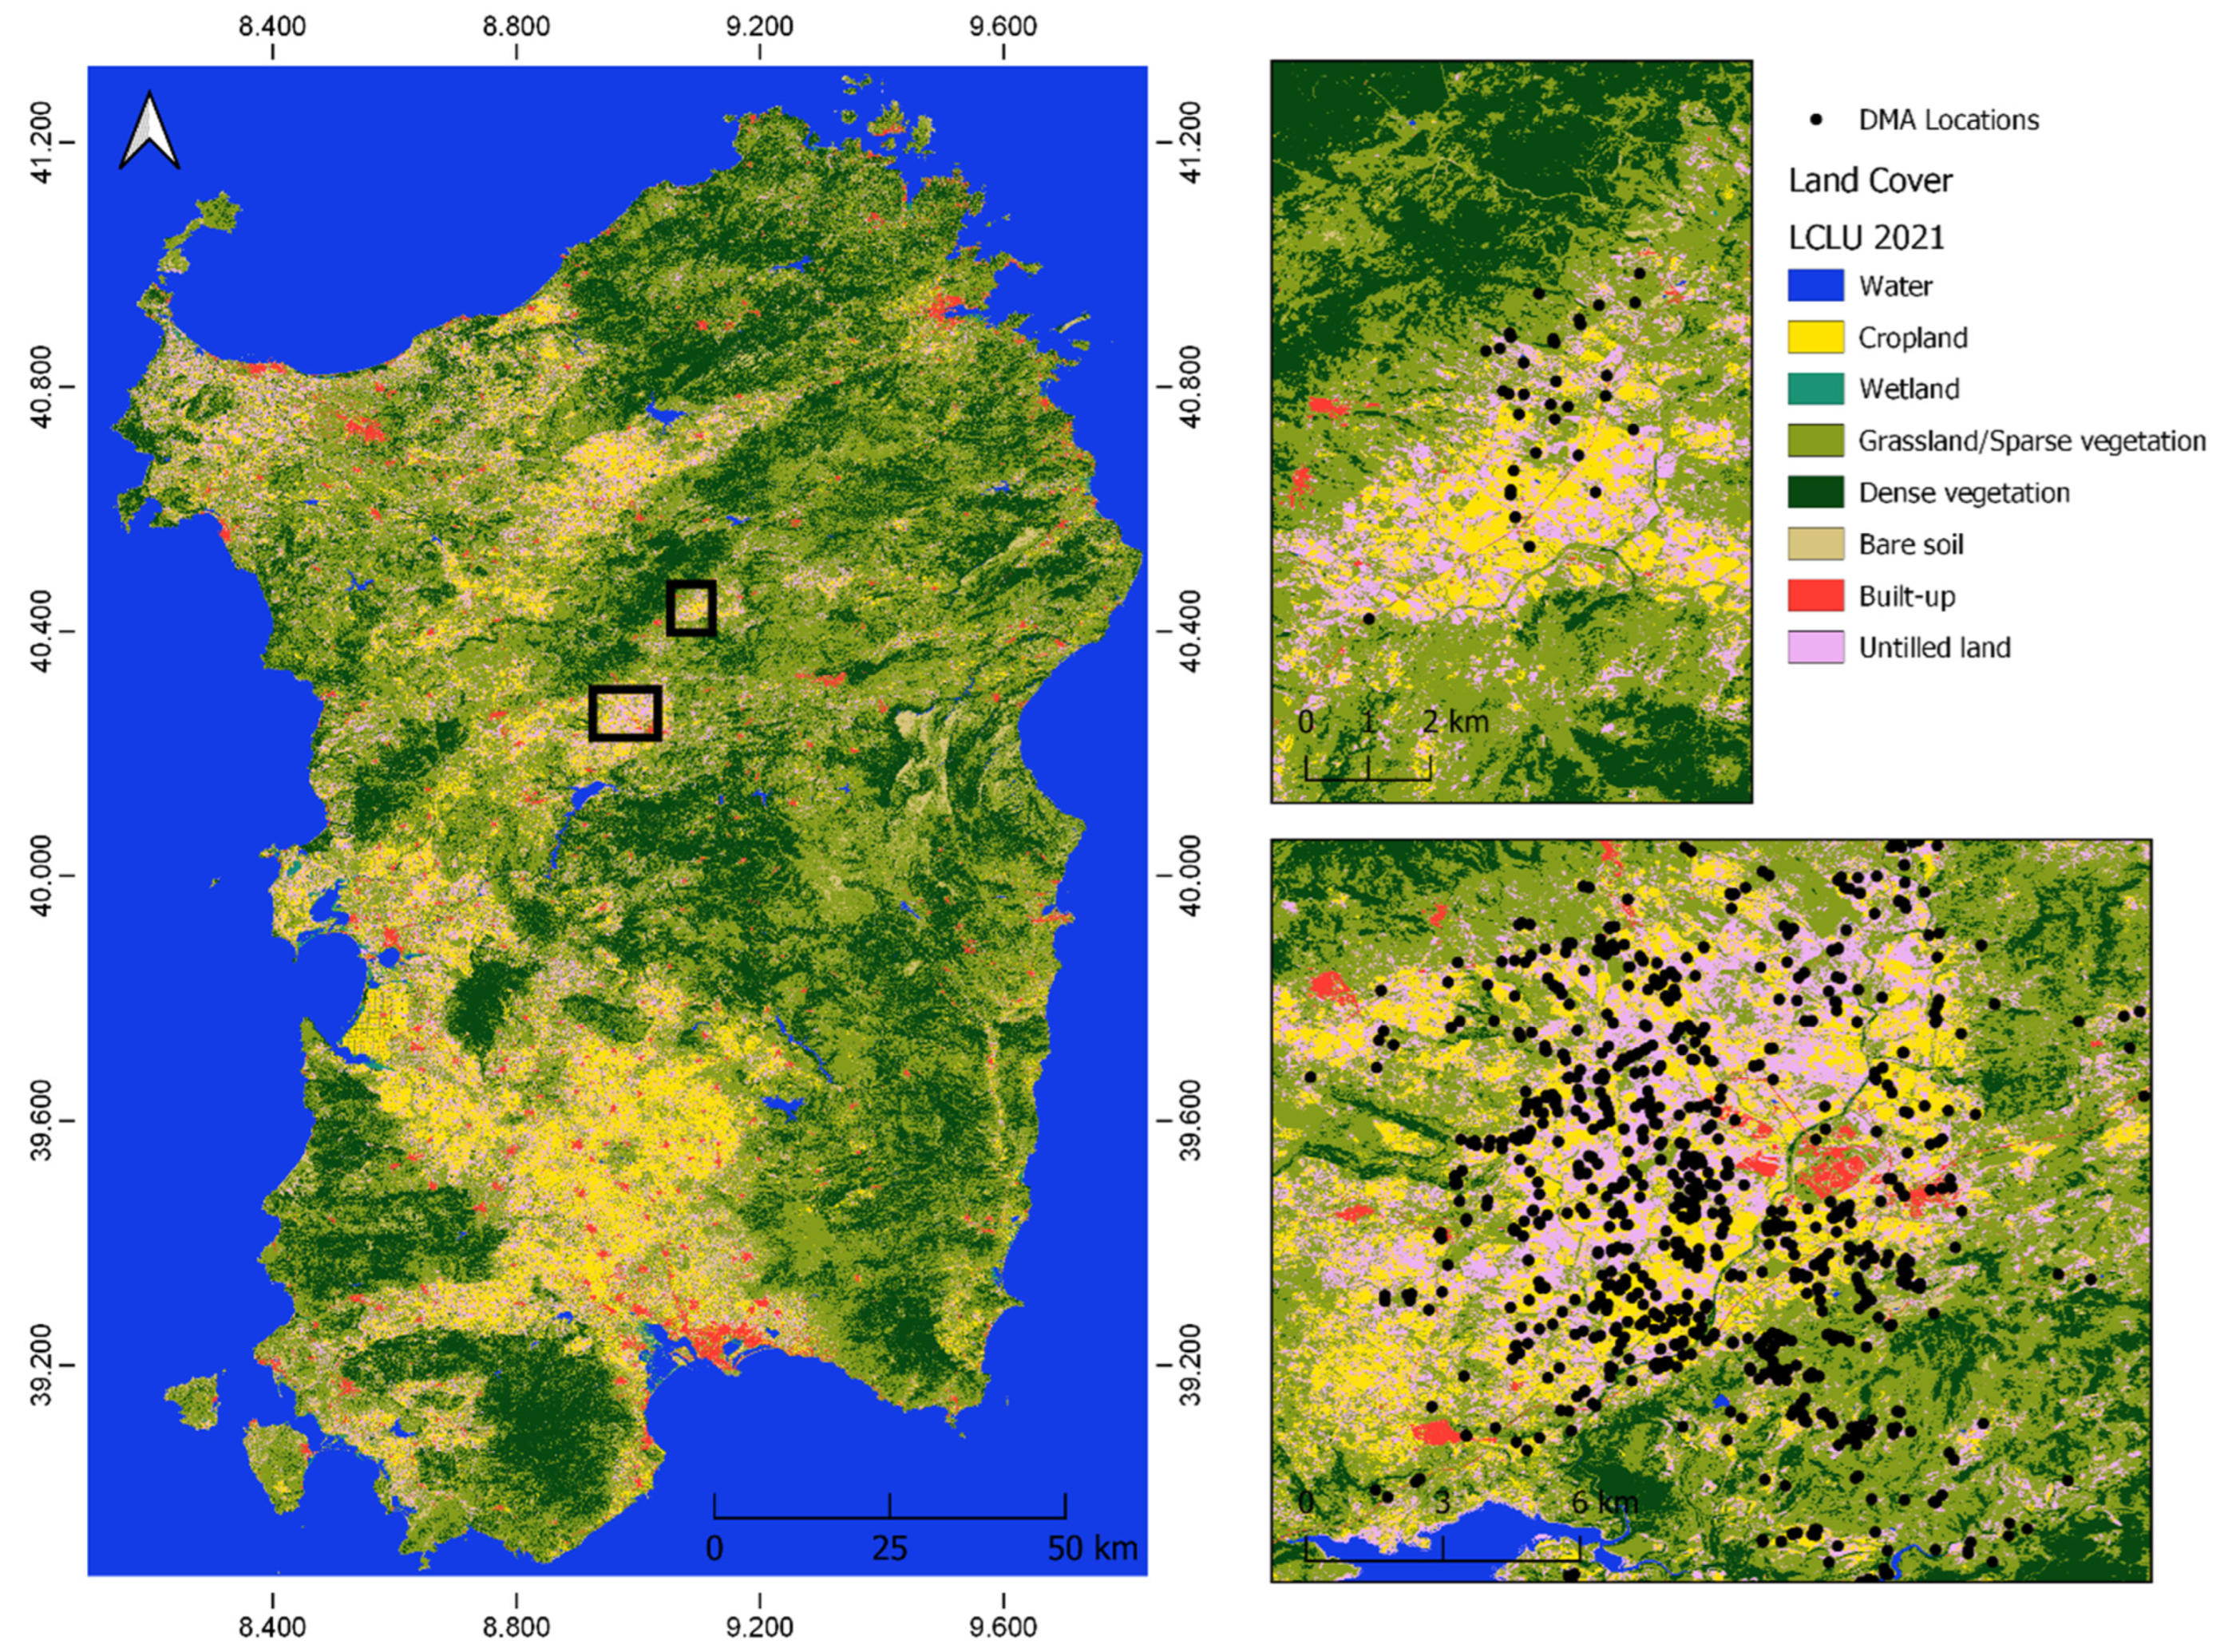
2.1. Study Area

The study area is the island of Sardinia (40.000556°N, 9.115833°E), in the middle of the western Mediterranean Sea, with a total area of about 24,000 km2 (Figure 1). Sardinia is characterized by a typical Mediterranean climate, with mild winters and hot and dry summers. Most of the island falls into the Mediterranean pluviseasonal oceanic macrobioclimate, whereas the inner mountain areas above 800–1000 m a.s.l. are best described by temperate oceanic macrobioclimate [28,29]. Generally, rainfalls are concentrated from October to May, whereas the dry season spans from June to September. However, the dry season can last from July to September at higher altitudes and from May to October in dryer southern areas. Mean annual precipitation is highly variable, depending on latitude, altitude, and local conditions, and ranges from 381 mm in south-eastern Sardinia to 1343 mm in north-eastern mountains [30].

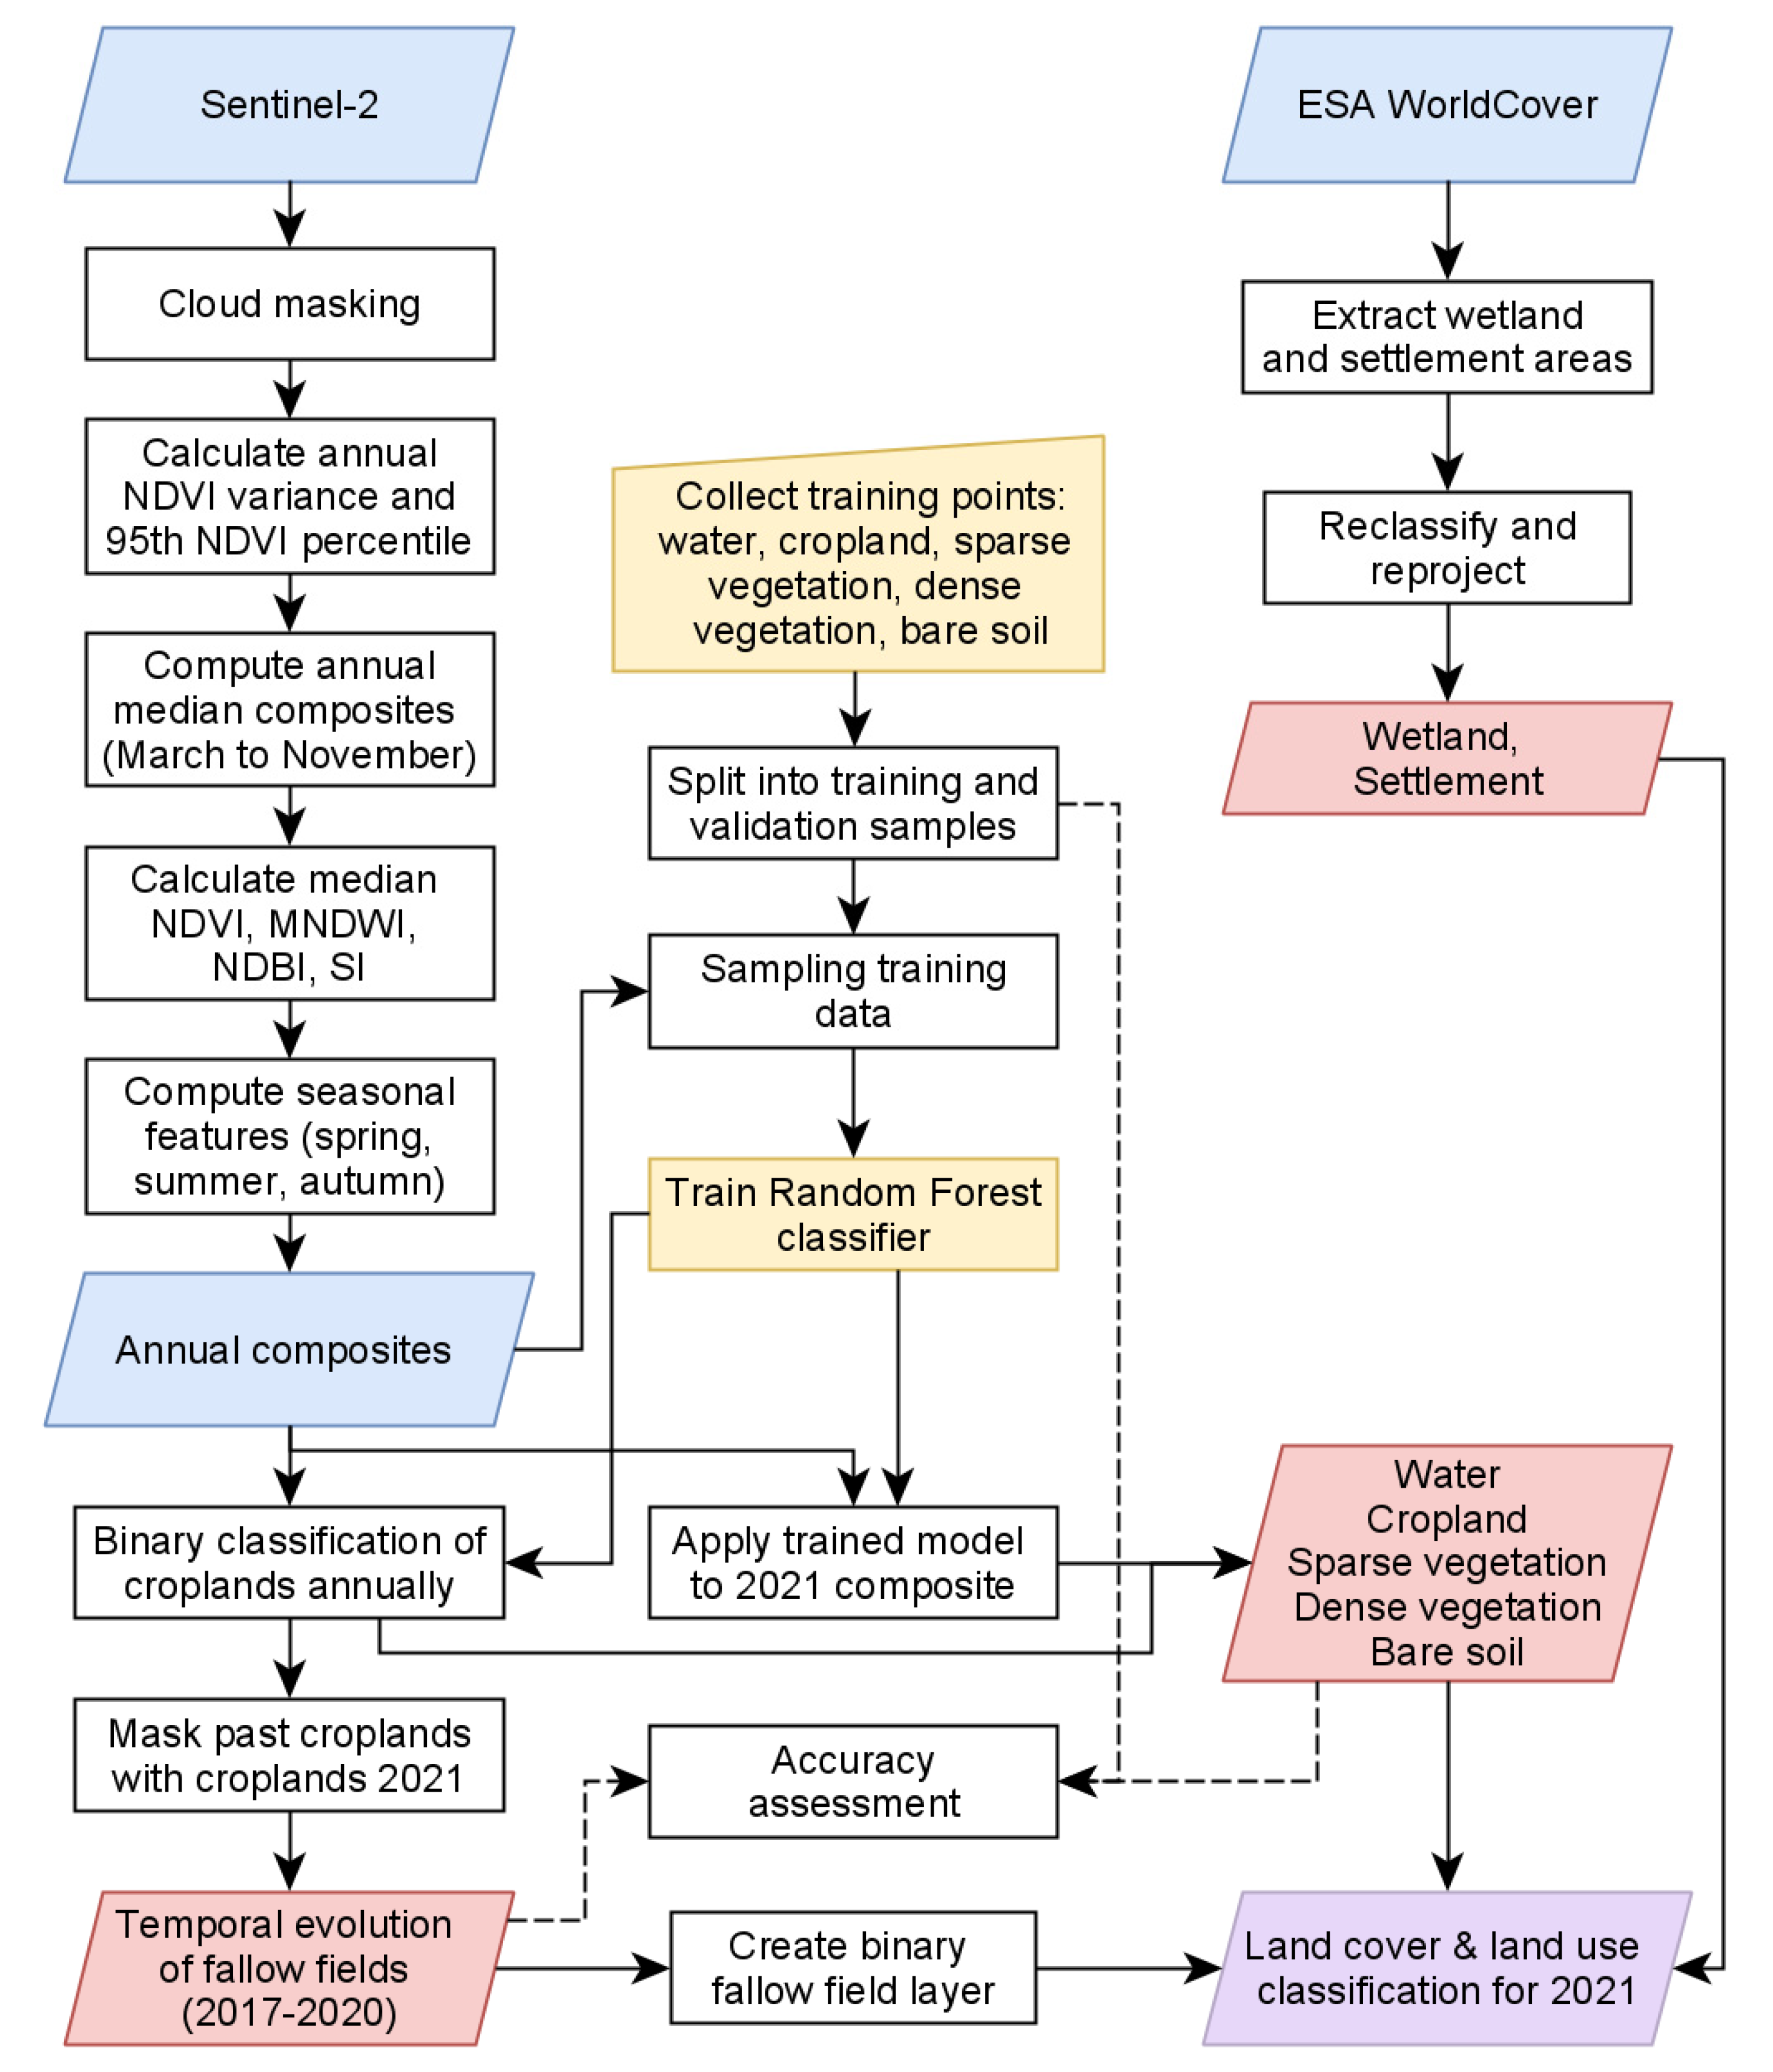
2.2. Classification of Actual State of LCLU with Focus on DMA Relevant Land Characteristics

LCLU information on the actual state of the land surface and its changes derived from satellite-based Earth observation (EO) data has played and continues to play an important role for different applications and disciplines (e.g., modelling, assessment of environmental changes, deforestation, desertification, etc.). Various global LCLU products are available at a medium spatial resolution, representing the state of the land surface at a certain time period [31,32,33]. The technological progress and availability of open-source satellite data at high temporal and spatial resolution has enabled improvement of LCLU accuracy as well as the level of detail by utilizing time-series analysis in combination with machine learning approaches [34,35]. Nevertheless, available global products sometimes do not include the required information for specific use cases. Therefore, there are many regional LCLU products and adaptations that account for user-specific class discrimination or target explicit land cover classes of interest [36,37,38,39]. In the context of locust outbreaks, it is well known that the current and previous land management plays an essential role [3,11,40,41]. The characterization of the land surface, specifically focusing on habitats of different locust pests, has been part of research efforts to support preventive locust management [42,43,44,45,46,47,48,49]. Abandoned and fallow fields or untilled land can provide ideal breeding habitats for some locust species, thus increasing the possibility of a population upsurge and outbreaks [3,11,41,50,51,52]. On the contrary, regular mechanical treatment of fields and pasture (plowing) usually destroys locust eggs and hence contributes to population decrease [53].
To quantify the relation between the current DMA outbreak in Sardinia and land management and abandonment, we derive LCLU information with specific requirements. First, the required LCLU has to include the class “abandoned land, fallow fields, or not tilled land” to provide information on whether land has previously been plowed or not. This requirement can be fulfilled by applying time-series analyses of satellite data archives. Due to the unique phenology of agricultural land (plow, sow, growing, harvest), it is possible to distinguish between cropland and natural rangeland vegetation [54,55,56,57,58]. Using such seasonal characteristics and comparing years of interest with each other, the evolution of agricultural land or fallow fields can be derived. Furthermore, it is also very important to identify the time since the land was last plowed. Therefore, the second requirement is that the derived “abandoned land, fallow fields, or not tilled land” class should contain a “time-stamp” indicating when it was last tilled. This information can provide an indication of the vegetation composition and succession of the area [59], which is also important for locust habitats. Finally, the actual state of abandoned/fallow/untilled areas is also of high interest to assess whether it fulfills the habitat requirements of the locust species. Ephemeral grasslands with patches of bare soil are ideal for the egg laying and breeding of DMA [3]. On the other hand, dense vegetation (e.g., forest) or saline soils are avoided. Therefore, the third requirement is to provide the up-to-date land cover state of formerly tilled land to assess where DMA has laid eggs over the past upsurge years.
Figure 2 illustrates the entire workflow to achieve the discussed requirements. Since recent mapping efforts, such as the ESA WorldCover [35], already provide a high level of detail and accuracy at a reasonable spatial resolution, we implement certain land cover classes that are not the focus of the presented use case (settlements, wetlands) to avoid confusion and improve the accuracy of the classes of interest. For detection of all other land cover classes and their evolution, training points were collected according to the class specifications. The assignment of sampling points was based on the visual interpretation from very high-resolution data within Google Earth Engine (GEE) in combination with time-series composites of vegetative seasons. To ensure temporal transferability of the classification model, we collected training samples for a meteorologically dry year (2017), a wet year (2018), and a normal year (2021) [60]. In total, 200 training points were collected per class and year. As depicted in Figure 2, training points were gathered for the classes water, cropland, sparse vegetation, dense vegetation, and bare soil. The sampling database was partly used to train (75%) the random forest model that was applied on different time-steps as well as for the validation of the results (25%). Moreover, the annual Sentinel-2 composites between 2017 and 2021 were calculated on GEE platform. To mask clouds, the cloud probability data on GEE was applied. Next, the variance and 95th percentile of the normalized difference vegetation index (NDVI) was calculated at an annual scale covering the months from March to November. The annual image composites were calculated using the median value of a year, and afterwards, the median of the additional spectral indices NDVI, modified normalized difference water index (MNDWI), normalized difference built-up index (NDBI), and salinity index (SI) were derived. Seasonal images for spring, summer, and autumn were included as additional features as well. The seasonal features include the median values and the variance and 95th percentile of the NDVI.
Based on all features and training points, a random forest (RF) classification model was trained for the year 2021. Here, RF [61] was selected as classifier as it is widely applied for land cover classifications and reported to be one the superior machine learning algorithms [62,63,64]. Next, an additional classification model was trained to retrieve binary cropland layers for the annual composites between 2017 and 2021. Finally, based on these annual layers, spatio-temporal information on the development of fallow fields was extracted based on an intersection with the cropland class in 2021. This spatio-temporal layer includes the information of which year an area was plowed for the last time.
As illustrated in Figure 2, an accuracy assessment was conducted by means of the collected point samples. To this aim, a confusion matrix was calculated for the classes water, sparse vegetation, dense vegetation, and bare soil. Due to the binary classification of croplands, this class was validated separately. In order to assess the accuracy of the classifications, the overall accuracy and Cohen’s kappa coefficient [65] were calculated based on the confusion matrix.
Apart from the described process and used datasets for classification, 15-day NDVI median composites were calculated for the period between March and July 2022 to analyze the relation between temporal vegetation development and different locust nymphs’ states. Furthermore, we used a 30 m spatial resolution digital elevation model dataset (DEM GLO-30) for additional interpretation of the role of elevation for breeding conditions within the study region [66].

2.3. Moroccan Locust Record Locations

DMA infestation in 2022 included two separate areas in central Sardinia and spanned overall from north (40.4821623°N, 9.1214687°E) to south (40.1067563°N, 8.9625105°E) and from east (40.2966785°N, 9.181988°E) to west (40.2488991°N, 8.8236914°E). The two infested areas extended for about 100,000 ha and 12,000 ha, respectively. Within the largest area, an abandoned industrial area and a photovoltaic solar power plant rise over about 400 ha. The majority of record locations were distributed within a plain area with small hills on hard soil (untilled) and exposed south, being an area well known to have been a hotspot and ideal habitat of previous DMA outbreaks in Sardinia [10,67]. The University of Sassari (Italy) together with LAORE (Regional Agency for Agriculture Development) have been closely observing the ongoing outbreak and collecting different information on the DMA infestation, including coordinates of infested locations, altitude, and DMA developmental stage. For locust management purposes and preventive control measurements, it is important to detect locations where locust has hatched successfully and is present at high density. A total of 814 locations with different DMA development stages were recorded between March and July 2022 and classified into the following categories: young nymphs (1st–2nd instars) (113 locations), mature nymphs (3rd–5th instars) (435 locations), feeding/moving adults (181 locations), and breeding sites (85 locations). Infested locations were detected by field surveys carried out by LAORE extension agents and researchers of the University of Sassari in the areas infested by DMA in the previous year. The DMA developmental stage was determined by visual observations of specimens by a sweep net. Locations were defined as breeding sites when adults were observed breeding or female’s oviposition.
Sites characterized by young nymph bands can be also considered as locations where breeding was successful in the previous year because young locust insects cannot move far at this stage. Nevertheless, locust nymphs at early-stage development are capable of moving up to 100 m or even 150 m per day depending on species, weather conditions, and green vegetation availability [6,68]. In order to account for possible daily displacement from original breeding locations and uncertainties, a 100 m buffer was created around young nymph and breeding record locations.

2.4. Combination of Nymph Locations with Data from Remote Sensing

The geographic coordinates and dates of detected DMA locations from 2022 were utilized for further analysis in terms of land cover situation and ongoing DMA outbreak. The data was intersected with the results of LCLU mapping results from 2021 as well as with 15-day composites of NDVI. In this way, this analysis provides a quantitative and qualitative assessment of DMA locations with regard to actual land surface conditions, the vegetation development during instar stages, and possible previous land management activities. Finally, differences in the distribution of DMA development stages among LCLU were evaluated using a χ2 test for independence (p < 0.05), followed by the calculation of Pearson’s standardized residuals.

3. Results

3.1. Relation of DMA Locations with Previous and Actual Land Cover

Out of 814 detected DMA records from 2022, 43% (347) were found on land classified as “abandoned, fallow, or not tilled” in the year 2021 (Figure 3). A further 29% (236) were located on sparse vegetation/grassland. A total of 5% were located in other classes (2, 16, and 26 in the dense vegetation, built-up, or bare soil land cover classes, respectively). Finally, 23% (187) were found on land classified as cropland. At this point, it is important to consider two facts. First, classification from remote sensing comes along with some uncertainty and misclassifications (compare Section 3.3), which depend mainly on the accuracy and definition of the training data, input data quality (e.g., data gaps, clouds, viewing angles), input data characteristics (e.g., temporal, spatial, and spectral resolution), and applied methodology. Secondly, the detection of nymph locations also differs from the actual origin where egg pods where laid and nymphs actually hatched (compare Section 2.2). Both factors are of relevance for the interpretation of derived information from Sentinel-2 data at a spatial resolution of 10 m. Therefore, we also considered the buffered area to examine whether abandoned/fallow land is found in the direct vicinity of reported locations. This assessment shows that 23% of breeding spots located in classified active agriculture are within 100 m of untilled land. Therefore, two conclusions can be made. Either locust nymphs have dislocated to cropland areas and were detected there by the ground teams, or cropland was misclassified, because mechanical plowing of soil would usually lead to the destruction of eggs.
Statistical differences in the distribution of DMA development stages among LCLU were found (χ2 = 43.46, df = 12, p < 0.05). In particular, the occurrence of younger DMA nymphs was significantly higher than expected in locations identified as untilled lands. Moreover, the occurrence of feeding/moving adults was significantly higher than expected in areas with sparse vegetation and grassland and lower than expected in untilled lands (Table 1).
A more detailed consideration and distribution of locations with regard to different detected DMA life stages is provided in Table 1. In the following, we assume that young nymphs of the first and second stages are found close to their breeding sites and consider them as one group. Therefore, the total of 113 (young instar) and 85 (oviposition) represent precise locations where egg pods were actually laid. Out of these locations, 73% (144) were located within the class “sparse vegetation/grassland”. In addition, 53% (104) of these breeding locations were also classified as formerly active agriculture or pasture land (Figure 4). A total of 48 records (24% out of the total breeding sites) were found on active agriculture land. Only four records were found on bare soil, and two on other land cover classes (3% in total).
The older instar stages and adults, which have a higher capacity to move and have had a longer time period to dislocate from their origin of breeding, show only a slightly different picture. Out of a total of 616 locations, 71% (437) were located within the class sparse vegetation/grassland, whereas 39% (241) were also classified as formerly active agriculture or pasture land. Another 23% (139) of the total older instar stages and adult records were found on active agriculture land.
Besides the identification of land that has been used for active agriculture, we also derived the time when this land was last tilled or actively used. This evolution of abandoned, fallow, or not tilled/plowed land is presented in Figure 4 and Figure 5 and Table 1. The majority (88%, 307) of the 347 positions are found on land that has been fallow or untilled since 2020. This suggests that DMA has found perfect conditions on this relatively “young” untilled land, which is in line with observations and documentations of previous DMA upsurges [3,51]. Compared to the years 2017, 2018, 2019, and 2020, the year 2021 is characterized by less agricultural activity (Figure 4). Among all locations that were found to be fallow or untilled since 2020, 97% (338) were classified as sparse vegetation/grassland in 2021 (Figure 6, Table 1).

3.2. Accuracy Assessment

The generated LULC map for the year 2021 resulted in an overall accuracy of 96.4% and a kappa coefficient of 0.951. As listed in Table 2, the binary cropland layers have an overall accuracy and kappa coefficient of 96.75% and 0.898 for 2021, 92.37% and 0.747 for 2018, and 96.34% and 0.867 for 2017.

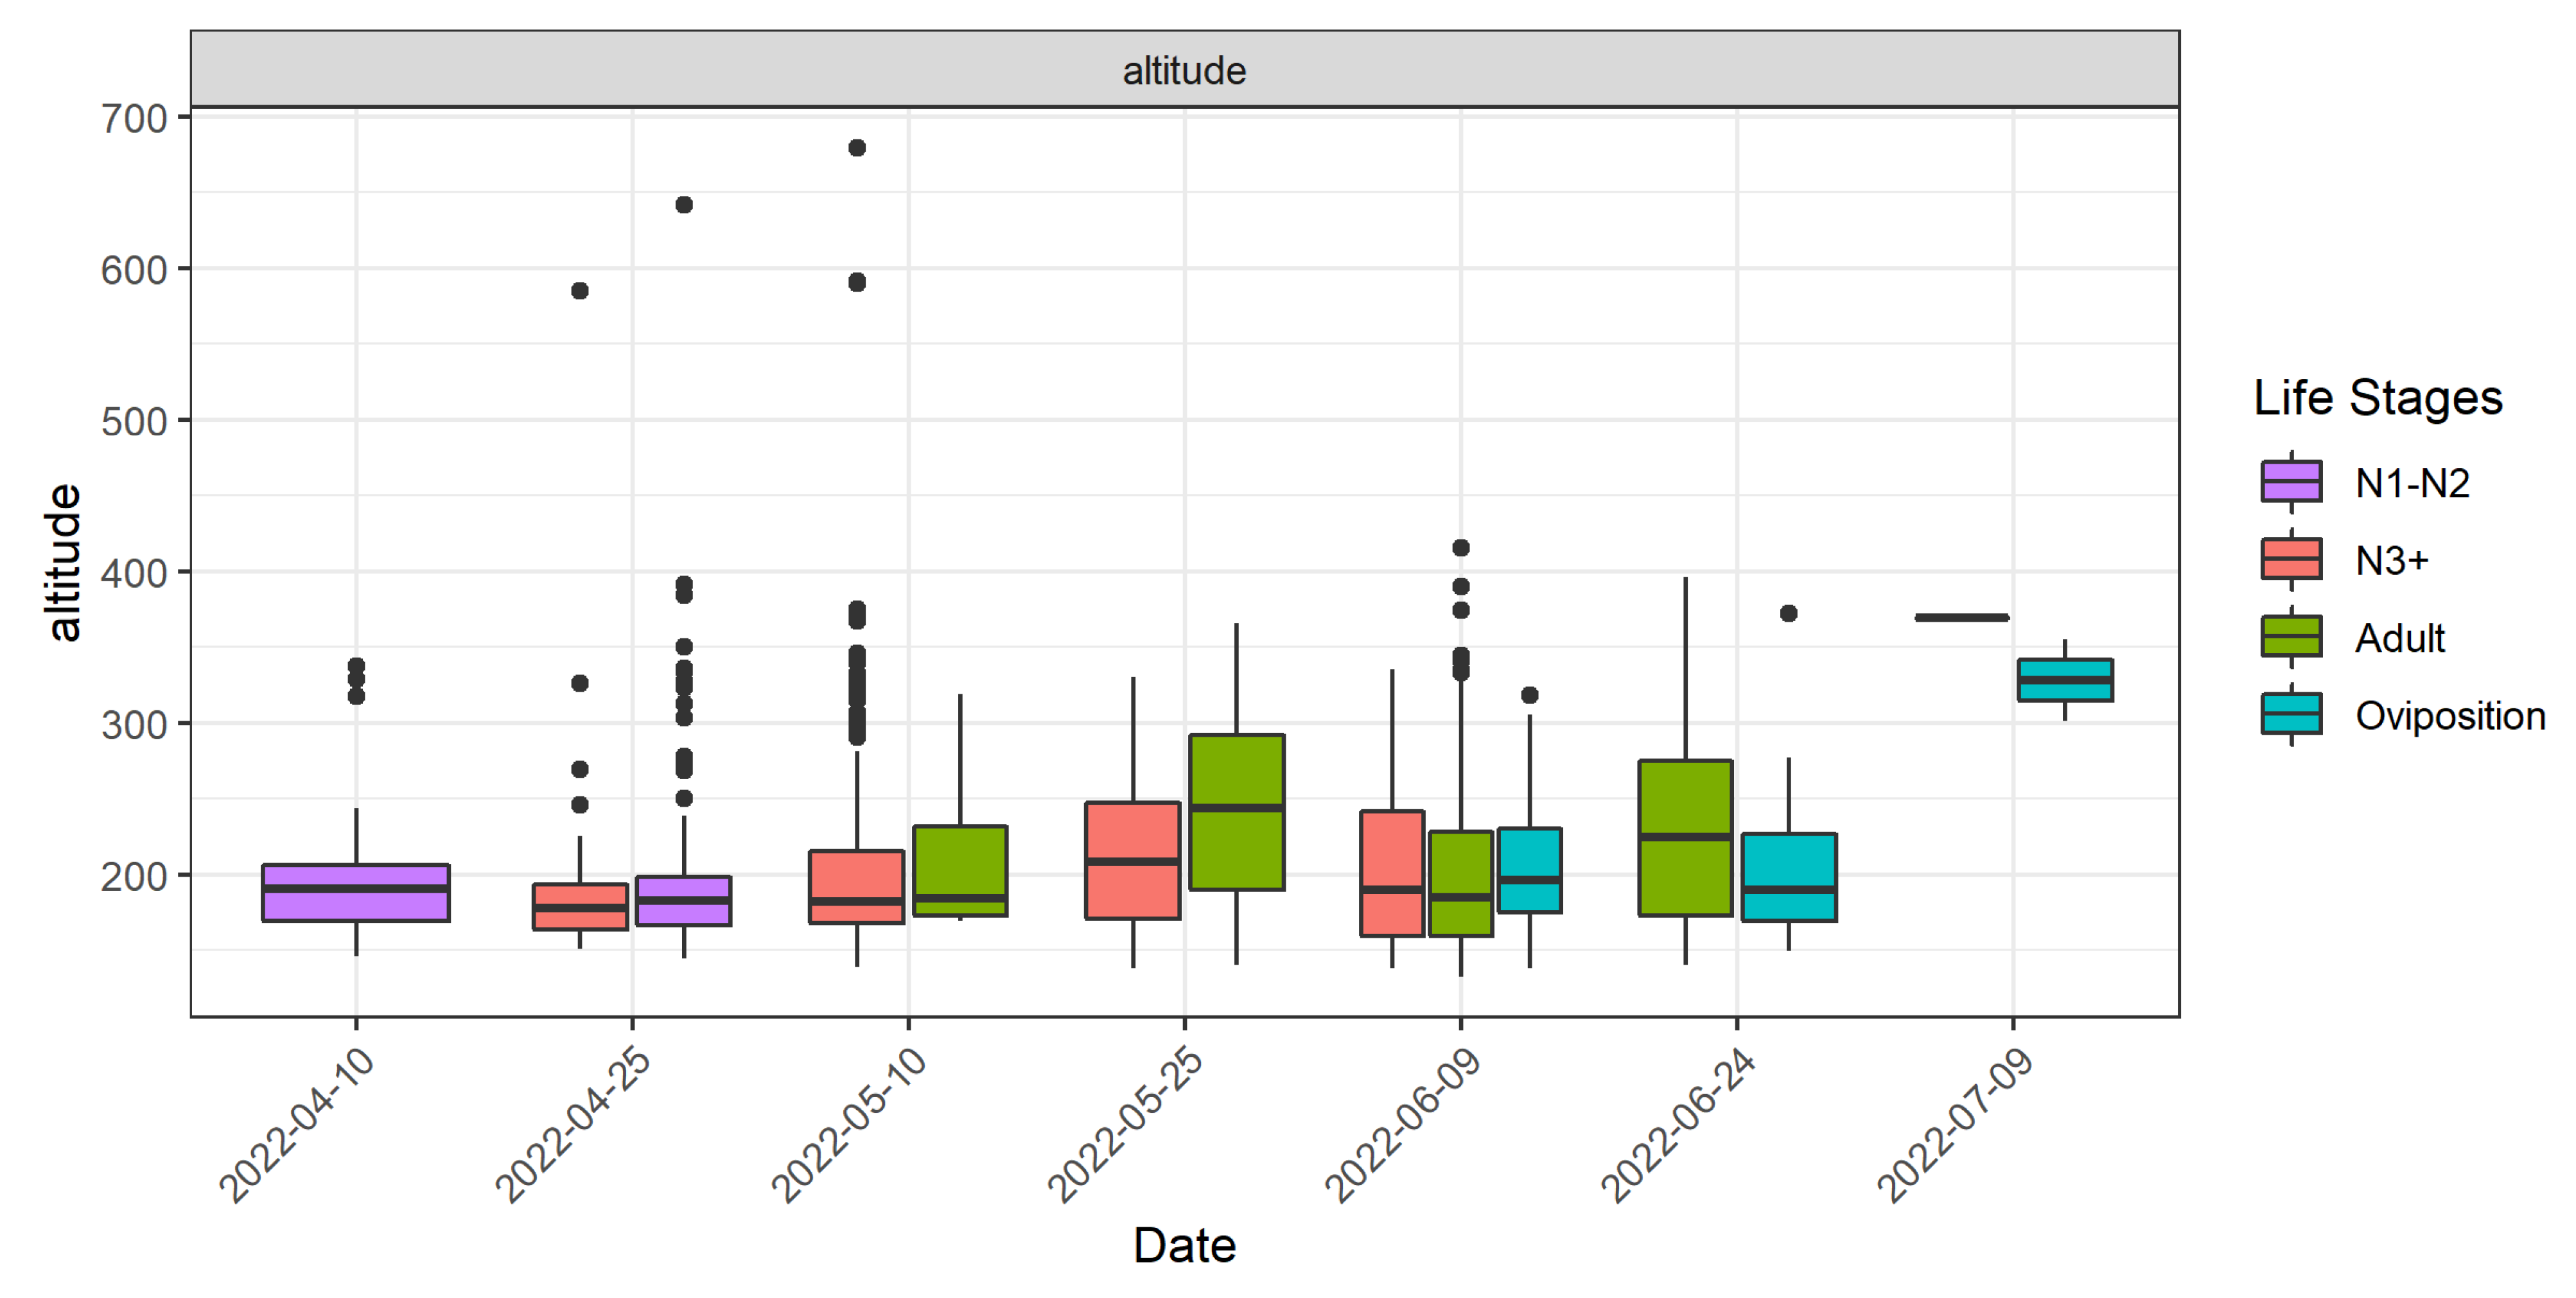
3.3. Relation of DMA Locations with Vegetation Development and Elevation

Besides the outcome of actual land cover as a discrete classification, remote sensing data can provide more detailed temporal information that is of higher relevance to assessing and understanding locust outbreaks and life cycles. In general, locust development and population dynamics depend highly on vegetation cover and its development over time [21,23,69,70,71,72,73]. Therefore, we also performed NDVI of biweekly and monthly composites to present the relation in this regard for the outbreak of 2022.
The results demonstrated a clear pattern between NDVI development and detected DMA life stages (Figure 7). The young nymphs (N1-N2) were detected in April within the peak of the vegetative period. In May and June, when older nymph stages (N3+) and adults were detected, the NDVI around these locations has already decreased. Oviposition took place in July and June, when vegetation subsidence has already occurred. In general, it seems that there is no implication that older nymphs or mature insects were moving towards greener areas. However, it should be considered that untilled, fallow, and abandoned land, as well as pasture and grassland, are not irrigated, and plants tend to dry out from the end of May onward due to rain scarcity and high temperature.
Additionally, we also extracted the elevation from a DEM to provide any indication related to relief as described by Ortu and Prota (1989) [10] (Figure 8 and Figure 9). The relation between elevation and detected locations for different Moroccan locust life stages shows a slight increase in height with proceeding time until the end of May. DMA was reported between 137 and 680 m above sea level (a.s.l.), with the majority of records (647 records, 79%) between 137 and 250 m, although preferred habitats are restricted to foothills and valleys at a range of 400 and 1200 m a.s.l. [3,13]. This difference could be due to peculiar microclimatic conditions characterized by wide temperature excursions in spring that could promote optimal DMA development at lower altitudes.

4. Discussion

Land cover classification and potential habitat mapping in the context of locust outbreaks have been mainly performed based on Landsat and MODIS datasets for the migratory locust (Locusta migratoria, LMI), whose habitats are associated with reed vegetation in temporarily inundated areas along rivers and within deltas [44,46,48,49,74,75]. Land cover transformation due to overgrazing, deforestation, flood plain drainage or agriculture abandonment plays an important role for other locust pests, such as Moroccan locust (Dociostaurus maroccanus, DMA) and Italian locust (Calliptamus italicus, CIT) [3,6]. Approaches utilizing modern open-source remote sensing datasets (e.g., Sentinel-1, Sentinel-2) with a specific focus on locust requirements concerning actual land cover situation and its evolution still have to be developed and optimized for different species. In this study, we demonstrated that specific land cover classification and its consideration over time can provide valuable information as to where potential areas are experiencing land cover transformation and, in this way, becoming favorable for further locust breeding. Sentinel-2A/B Multispectral Instrument (MSI) datasets provide an ideal foundation for monitoring potential territories and detecting habitat transitions. The recent DMA outbreak in Sardinia, as well as local outbreaks in other countries, emphasize that DMA is a serious agricultural pest in places where ecological conditions and human activities are changing. Concerning the European part of the DMA habitat, Latchininsky (1998) [3] reported that the economic importance of its outbreaks was vanishing during the second half of 20th century due to the high degree of agricultural industrialization and other human-caused habitat transformations. However, due to climate change causing recurrent drought periods, and in combination with less anthropogenic pressure [3], DMA outbreaks might become more serious again. Since Moroccan locust and other locust species outbreaks are also closely related to human activities, it has to be kept in mind that locust outbreaks might become a major threat in Europe and elsewhere again once conditions change [3,9,76]. Therefore, we consider the presented approach using Sentinel-2 data and adjustments on land cover classification and temporal analyses for specific locust pest to have a high potential to support future risk assessment and preventive locust management. First, this is because it can be done independently and comparably quickly, and in an economical way. Secondly, remote sensing provides information on a large scale and thus also for areas that have not suffered any locust outbreaks recently but might become important due to climate change, land management alterations caused by institutional changes, political programs, crises, and wars [33,77,78]. With regard to food security, it is crucial to monitor land cover and other relevant parameters more closely for the specific requirements of different agricultural pests.
Analysis of the distribution of different DMA development stages among different land uses showed that younger nymphs were mainly located in untilled lands (Table 1). Since locations where young nymph bands occurred were considered as sites in which breeding was successful in the previous year, our results confirmed that DMA breeding sites are mainly represented by abandoned and/or untilled lands, where the most favorable conditions for egg survival and development occur [10]. On the other hand, the occurrence of adults was recorded more often in areas with sparse vegetation and grassland, whereas the occurrence of adults was significantly lower in untilled lands (Table 1). In fact, adults feed more than those in the juvenile stages because they need to accumulate energy for flight and dispersion, so they move onto vegetation-covered land. However, these results should be interpreted with caution due to potential spatial autocorrelation among DMA records. Although younger nymphs have a low dispersion ability, so that their distribution over the area is more likely due to small-scale ecological processes, adults have a high dispersion ability. This makes it possible that locations where adults occurred were not spatially independent from each other [79]. Additional field data collection (including absence locations) and availability over several years would enable further analyses of the spatio-temporal dynamics of locust populations and also reduce possible impacts of spatial autocorrelation in the evaluation of the relation between locust locations and land surface conditions.
In the future, detailed analyses of different relief variables and more detailed plant and vegetation type discrimination derived from remote sensing data might contribute to additional improvements in terms of remote-sensing-based monitoring of locust population dynamics. Furthermore, post-locust-infestation damage assessment and the question of whether vegetation and crop loss can be quantified from remote sensing data can be explored. To address this objective, field data with specific information on ground detected vegetation damage and timely coupled satellite data at higher spatial, temporal, and spectral resolution are required. Previous investigations utilizing MODIS data showed that optical moderate-resolution sensors might be insufficient to detect vegetation damage related to locust infestation [80,81].

5. Conclusions

In this study, we quantified the relation between detected DMA locations from 2022 field campaigns with actual land cover situation and development over previous years. As stated by Ortu and Prota (1989) [10], DMA oviposition occurs mostly in compact (untilled) soil exposed to the south. The relation between recent DMA outbreak and land surface under human influence is as follows:
  • 43% were located on land that was previously used for agriculture purposes (fallow or previously tilled land);
  • 23% were located on cropland within a radius of 100 m to abandoned, fallow, or untilled land, due to possible displacement after hatching as well as possible inaccuracy of land cover classification;
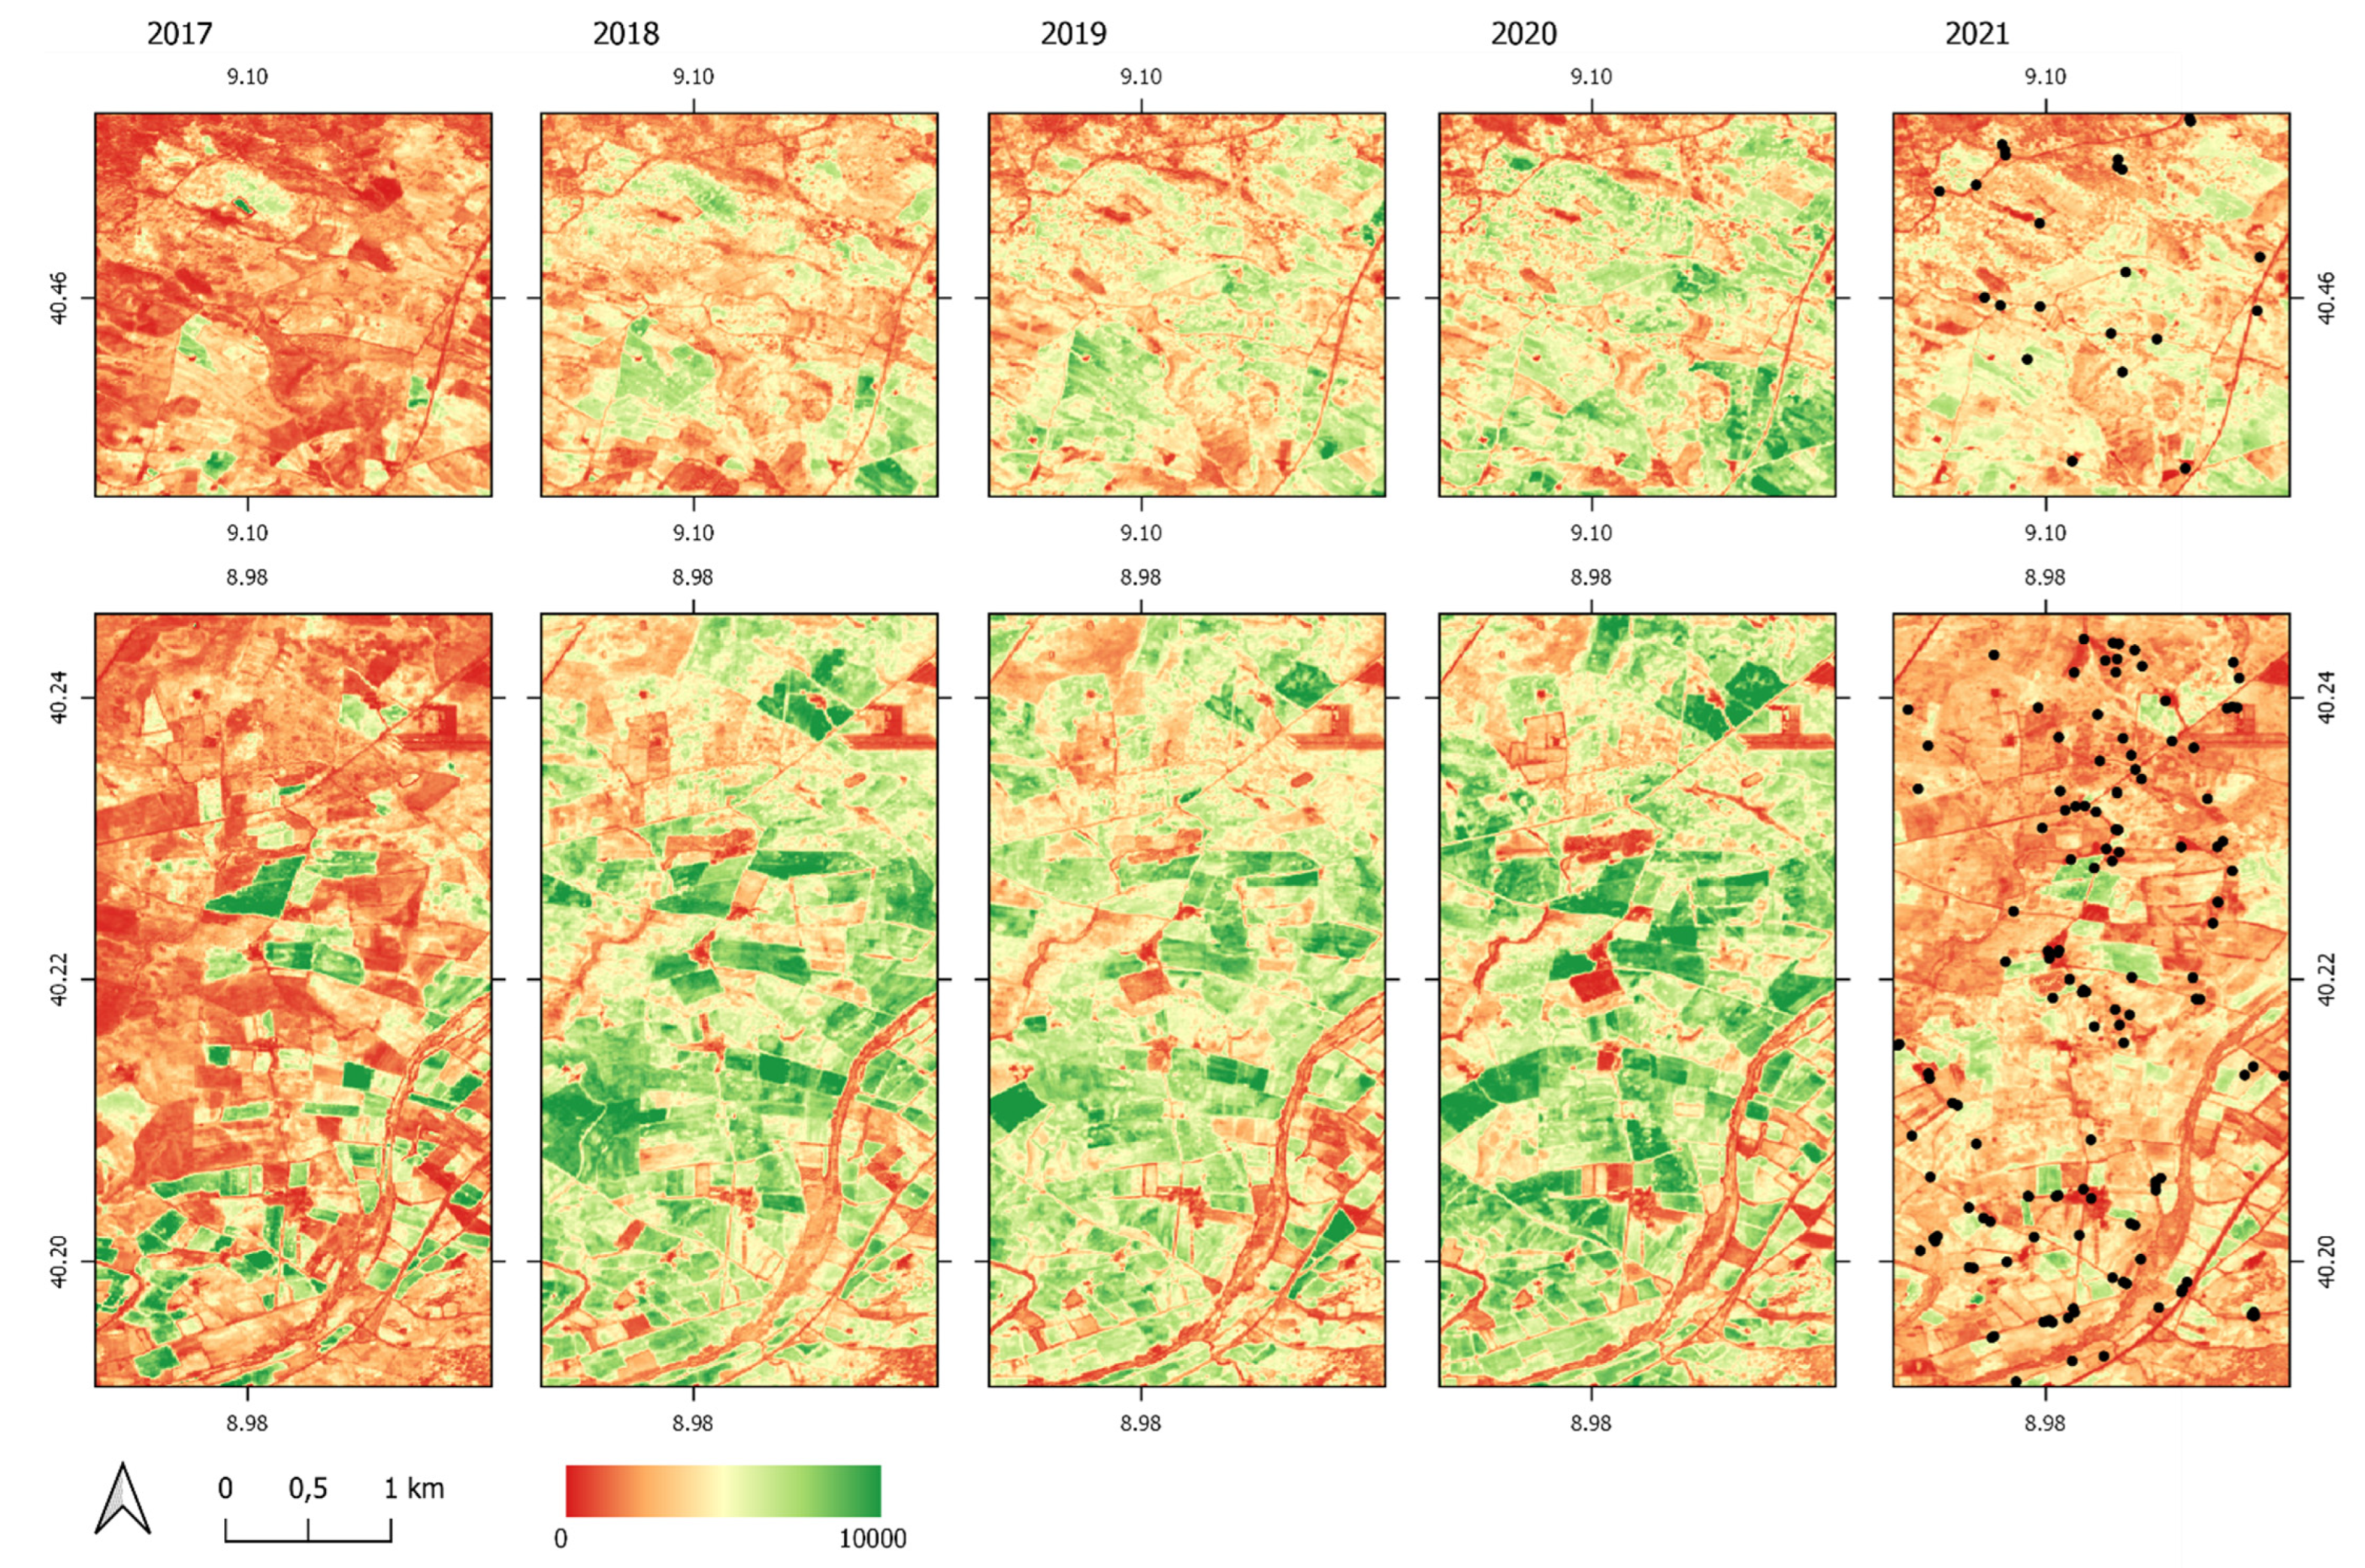
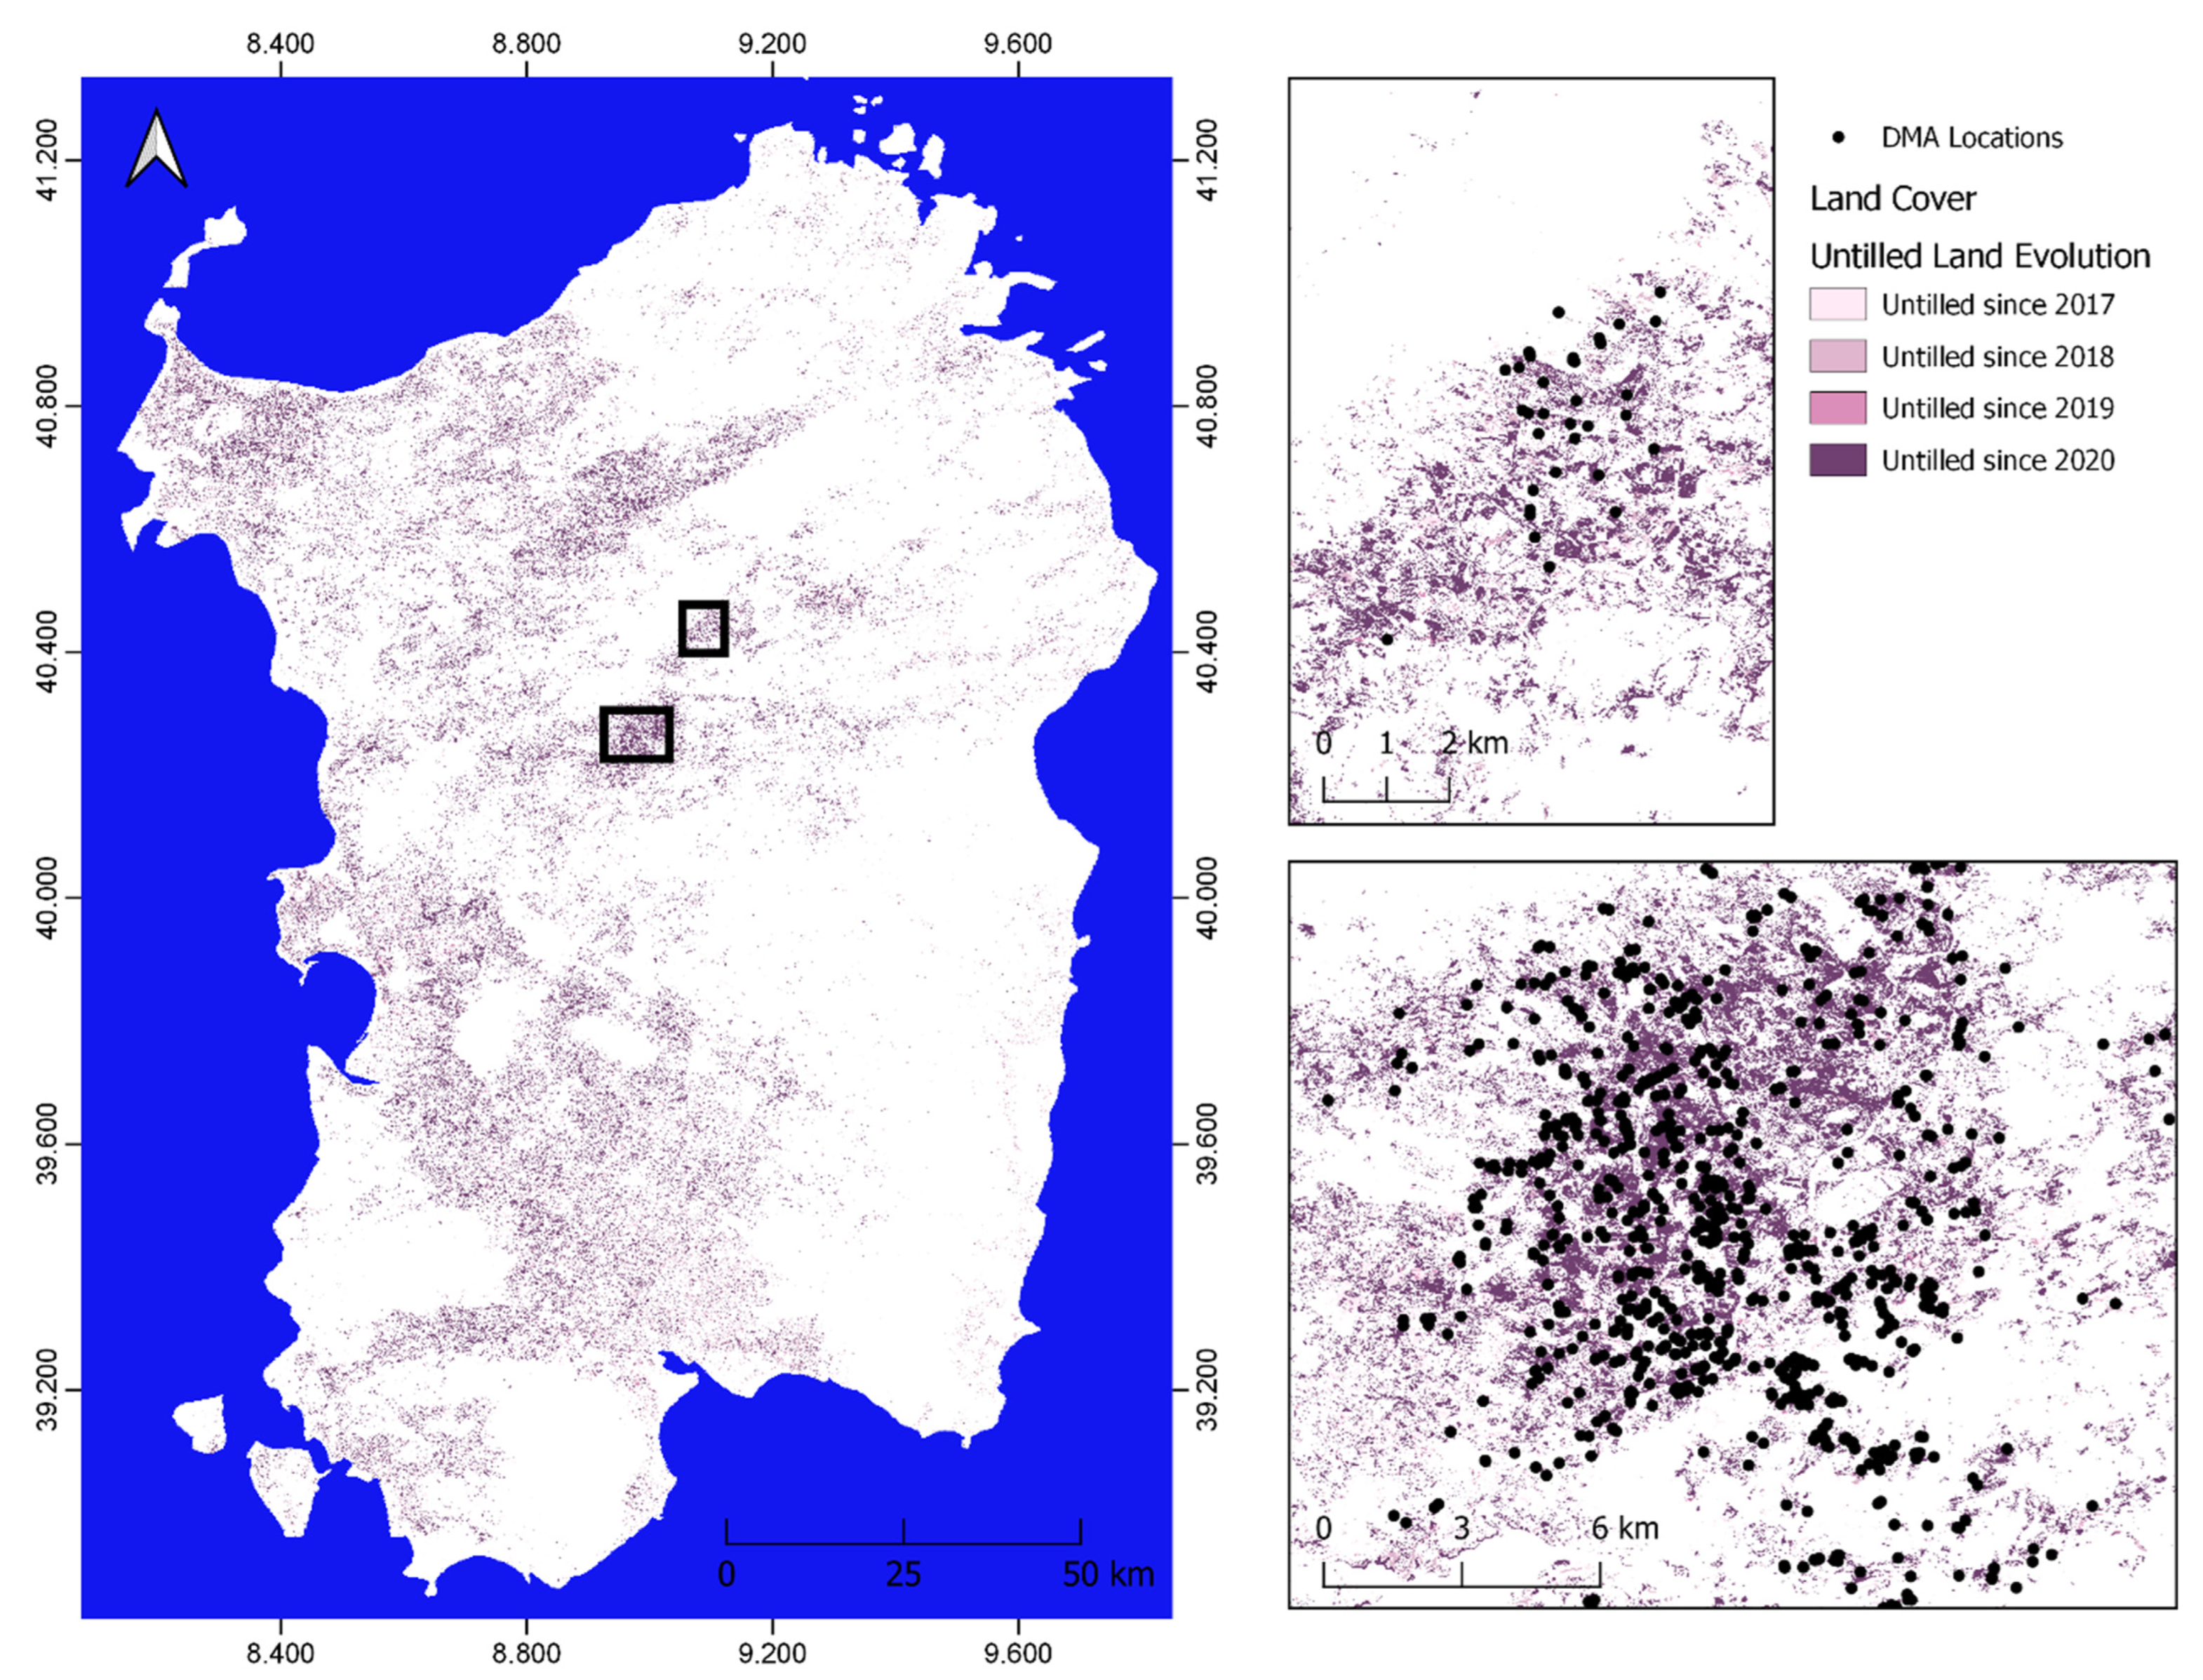
  • The majority of locations detected on abandoned, fallow, or untilled land were occupied by active agriculture until 2020, which indicates that DMA occupied this territory immediately;
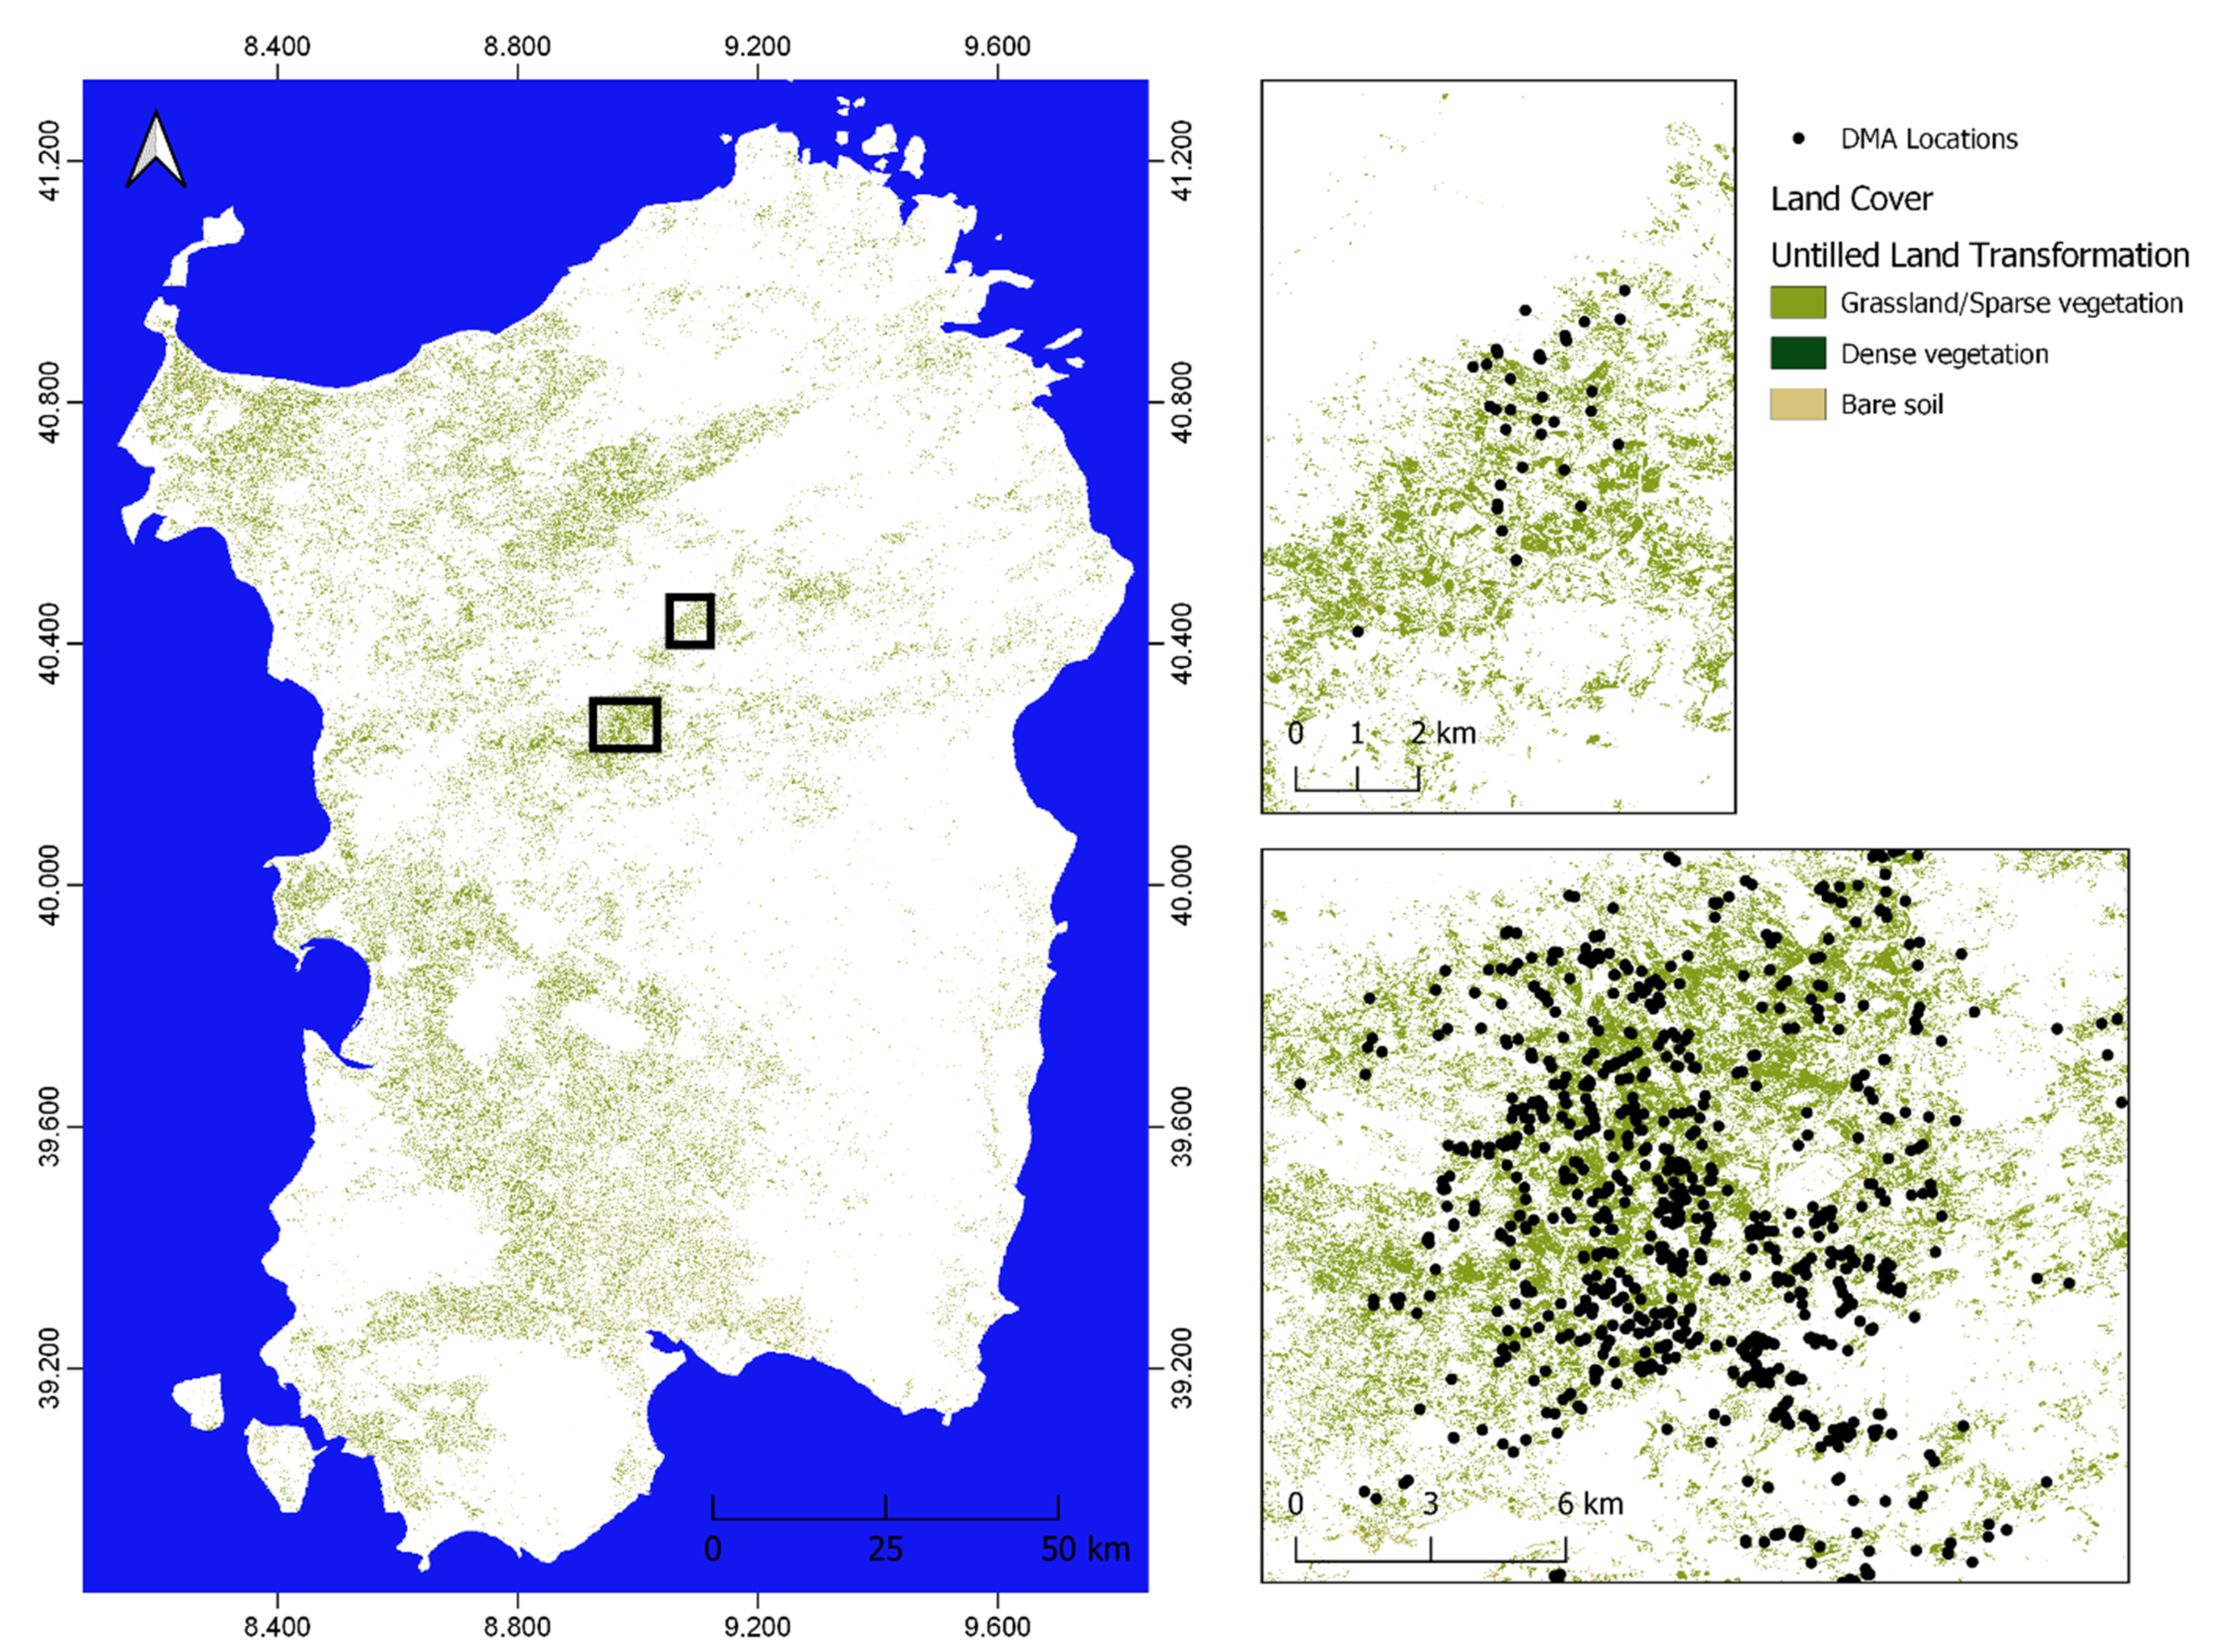
  • Considering the transformation of abandoned, fallow, or untilled land, the majority of locations are found on the sparse vegetation/grassland land cover class (97%).
Moreover, we quantified the hatching time and DMA life cycle development according to vegetation development and elevation. Based on those analyses, the following conclusions can be made:
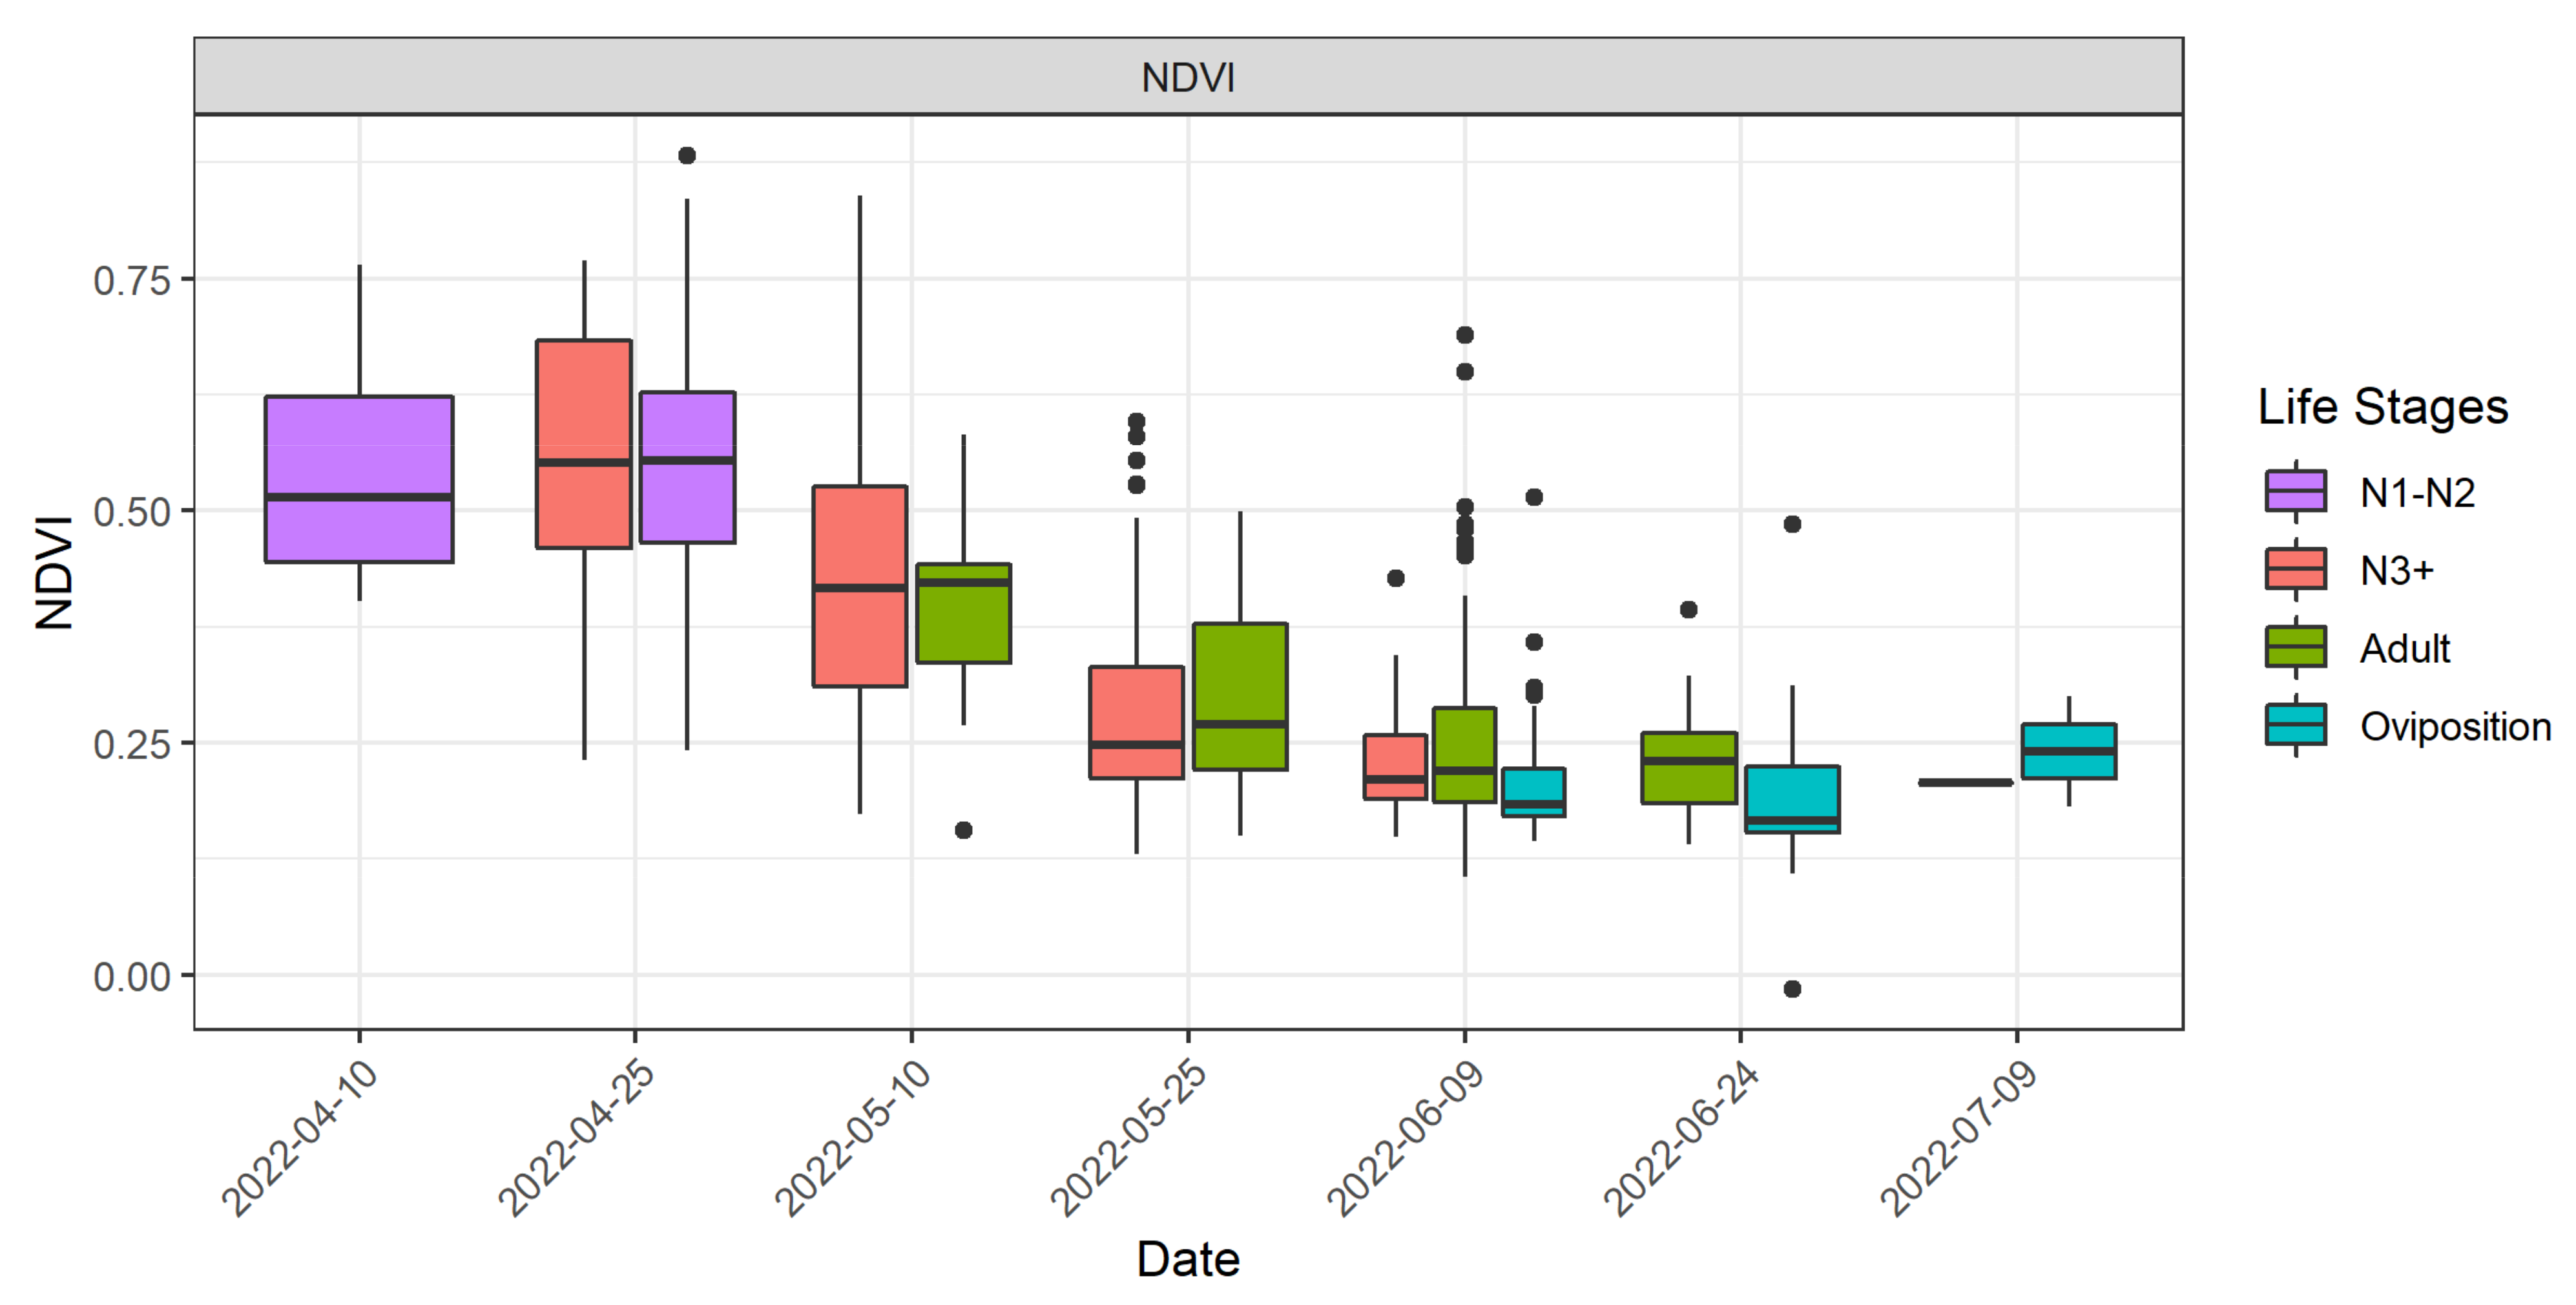
  • Young nymphs were detected in April within the peak of the vegetative period;
  • Older nymphs and adults were found in areas with significantly decreased vegetation greenness;
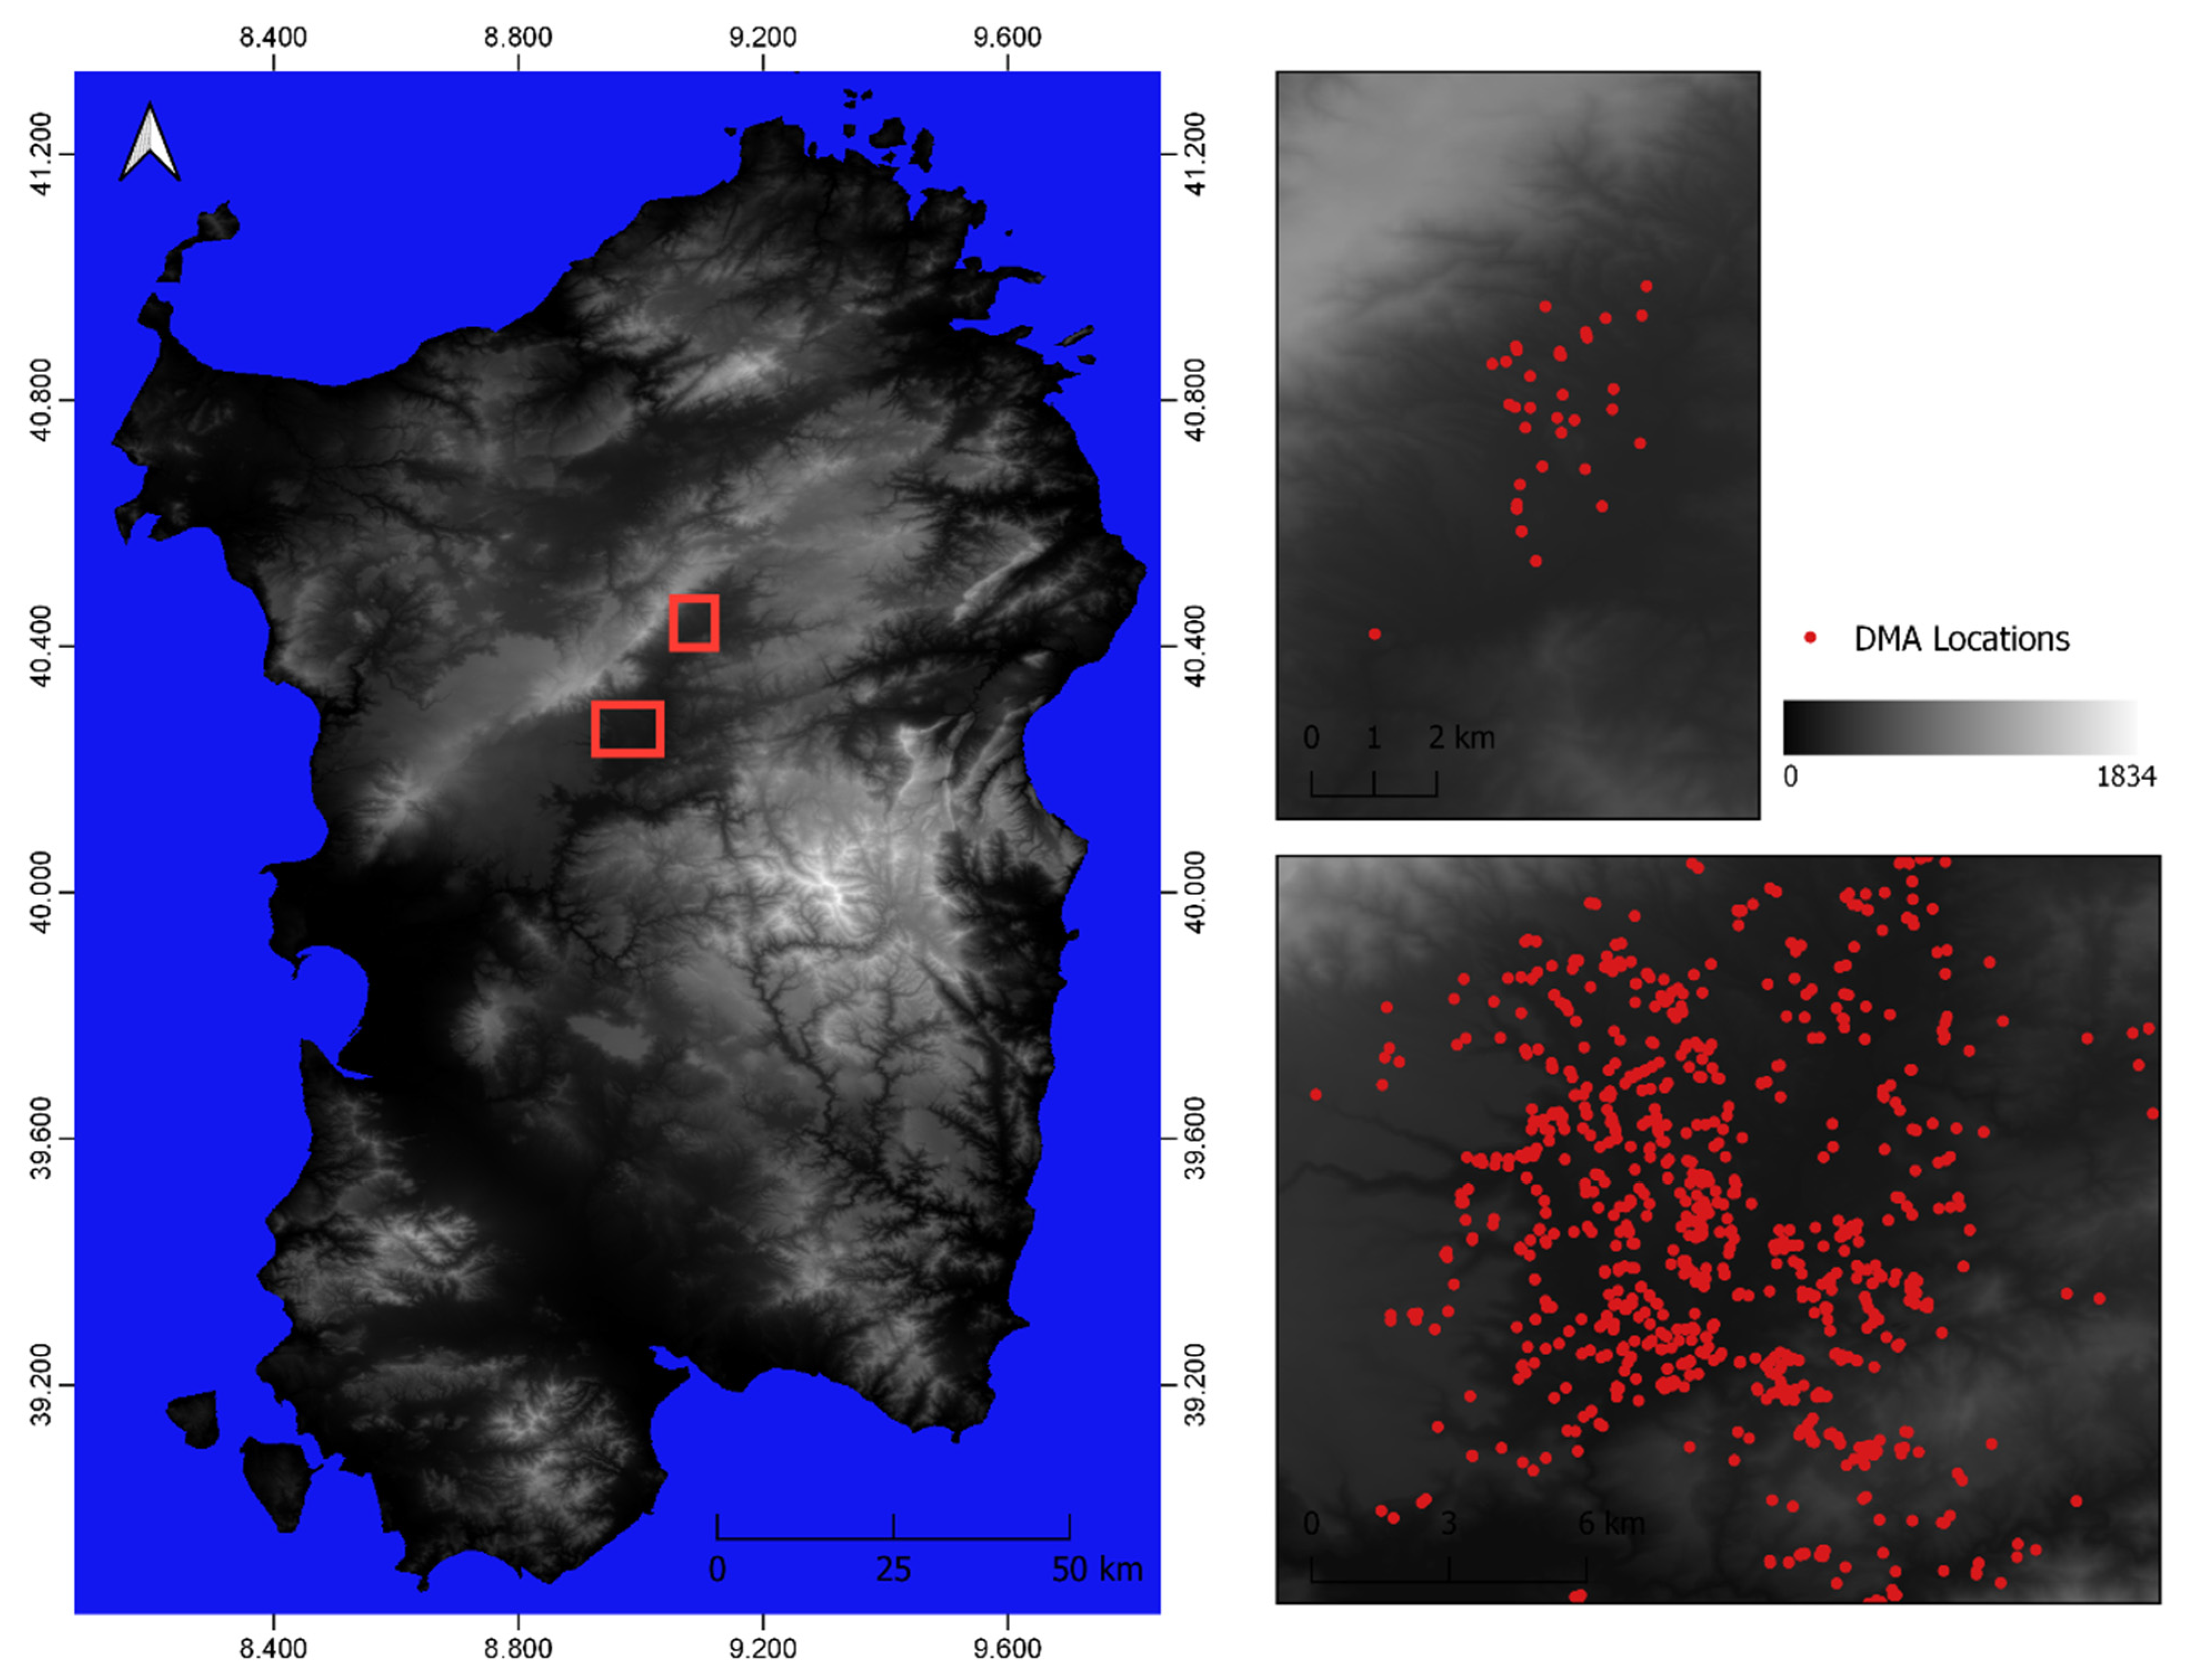
  • In terms of altitude, the majority (79%) of DMA locations were found between 137 and 250 m a.s.l.
This study demonstrates that valuable up-to-date information from remote sensing data can be derived for DMA upsurges. Such information can contribute to early warning systems and decision support to localize regions of high risk concerning different agricultural pests. Abandonment of agricultural land, overgrazing, reed drainage, and other land-changing activities have to be monitored and updated regularly and considered under the aspect of known habitats of dangerous locust types. Nowadays, open-source remote sensing data and cloud computing possibilities provide multiple opportunities for regular monitoring of vast affected regions. In combination with additional information about soil types, relief, and meteorological situation, experts could exploit the information provided by remote sensing data analyses as additional support for preventive management.

Author Contributions

Conceptualization, I.K.; methodology, I.K. and S.U.; formal analysis, I.K., A.C. and R.M.; investigation, I.K., A.C., R.M. and I.F.; writing—original draft preparation, I.K.; writing—review and editing, I.K., A.C., R.M., N.O. and C.K.; visualization, I.K.; field data acquisition, A.C., R.M. and I.F.; supervision, N.O. and C.K.; project administration, I.K.; funding acquisition, I.K. All authors have read and agreed to the published version of the manuscript.

Funding

This research has been performed within the Locust-Tec project (01LZ1702A, https://www.locust-tec.eoc.dlr.de, accessed on 3 October 2022) funded by BMBF in the framework of the CLIENT-II program (https://www.bmbf-client.de/en. Accessed on 3 October 2022). Furthermore, this research was also carried out within the scientific-technical collaboration agreement between the Department of Agricultural Sciences of Sassari University and LAORE Sardegna Agency, Project “Pianificazione di misure di contenimento e di contrasto alla diffusione del fenomeno delle infestazioni acridiche in Sardegna”, granted by Regione Autonoma della Sardegna—Deliberazione della Giunta regionale n. 49/46 del 17/12/2021.

Data Availability Statement

Data can be made available on request to the corresponding author.

Acknowledgments

First of all, we would like to thank Cyril Piou for supporting the authors with discussions and his extensive expert knowledge. We would also like to thank Nadiya Muratova, international consultant of FAO, for the recommendation of the Locust-Tec project. LAORE (Regional Agency for Agriculture Development) extension agents are kindly acknowledged for their extensive field work in reporting DMA locations. We would like to thank the anonymous reviewers for their constructive feedback, which has substantially improved this paper. RM was funded by MUR (Italian Ministry of University and Research) in the framework of the European Social Funding REACT-EU—National Program for Research and Innovation 2014–2020. AC received financial support from the RESTART-UNINUORO Project “Azioni per la valorizzazione delle risorse agroforestali della Sardegna centrale/Actions for the valorisation of agroforestry resources in central Sardinia” (Regione Autonoma della Sardegna, D.G.R. N. 29/1 of 7 June 2018—fondi FSC 2014–2020).

Conflicts of Interest

The authors declare no conflict of interest. The funders had no role in the design of the study; in the collection, analyses, or interpretation of data; in the writing of the manuscript, or in the decision to publish the results.

References

  1. Reuters. Sardinian Farmers Suffer Worst Locust Invasion in over 30 Years 2022. Available online: https://www.reuters.com/world/europe/sardinian-farmers-suffer-worst-locust-invasion-over-30-years-2022-07-13/ (accessed on 25 July 2022).
  2. Reuters. Sardinia Hit by Worst Locust Invasion for 70 Years 2019. Available online: https://www.reuters.com/article/us-italy-locusts-idUSKCN1TC1BY (accessed on 14 August 2020).
  3. Latchininsky, A.V. Moroccan Locust Dociostaurus maroccanus (Thunberg, 1815): A Faunistic Rarity or an Important Economic Pest? J. Insect Conserv. 1998, 2, 167–178. [Google Scholar] [CrossRef]
  4. Pantaleoni, R.A.; Molinu, A.; Cesaroni, C. Some Aspects of Locust Control in Sardinia in the First Half of the Twentieth Century. In Arsenic Locusts—The Control of Locusts in Sardinia in the First Half of Twentieth Century; Molinu, A., Cesaroni, C., Pantaleoni, R.A., Eds.; Composita: Sassari, Italy, 2004; pp. 17–50. [Google Scholar]
  5. Malakhov, D.V.; Zlatanov, B.V. An Ecological Niche Model for Dociostaurus maroccanus, Thunberg, 1815 (Orthoptera, Acrididae): The Nesting Environment and Survival of Egg-Pods. Biosis Biol. Syst. 2020, 1, 8–24. [Google Scholar] [CrossRef]
  6. FAO Locust Watch—Locusts in Caucasus and Central Asia. Food and Agriculture Organization of the United Nations (FAO). 2021. Available online: https://www.fao.org/locusts-cca/bioecology/moroccan-locust-dma/en/ (accessed on 29 September 2022).
  7. Aragón, P.; Coca-Abia, M.M.; Llorente, V.; Lobo, J.M. Estimation of Climatic Favourable Areas for Locust Outbreaks in Spain: Integrating Species’ Presence Records and Spatial Information on Outbreaks. J. Appl. Entomol. 2013, 137, 610–623. [Google Scholar] [CrossRef]
  8. Kambulin, V.E. Locust—Methods of Assessing Harm, Forecasting the Number and Technologies for Identifying Populated Areas. Kazakh Research Institute of Plant Protection and Quarantine: Almaty, Kazakhstan, 2018; ISBN 978-601-7416-92-8. [Google Scholar]
  9. Showler, A.T.; Lecoq, M. Incidence and Ramifications of Armed Conflict in Countries with Major Desert Locust Breeding Areas. Agronomy 2021, 11, 114. [Google Scholar] [CrossRef]
  10. Ortu, S.; Prota, R. Possibilità di Lotta Biologica Contro le Cavallette: Il Caso del Dociostaurus maroccanus Thunb. (Osservazioni Preliminari). Proc. S.I.T.E. 1989, 8, 89–97. [Google Scholar]
  11. Latchininsky, A.V. Locusts and Remote Sensing: A Review. J. Appl. Remote Sens 2013, 7, 075099. [Google Scholar] [CrossRef] [Green Version]
  12. Cressman, K. Role of Remote Sensing in Desert Locust Early Warning. J. Appl. Remote Sens 2013, 7, 075098. [Google Scholar] [CrossRef]
  13. Zhang, L.; Lecoq, M.; Latchininsky, A.; Hunter, D. Locust and Grasshopper Management. Annu. Rev. Entomol. 2019, 64, 15–34. [Google Scholar] [CrossRef] [PubMed]
  14. Klein, I.; Oppelt, N.; Kuenzer, C. Application of Remote Sensing Data for Locust Research and Management—A Review. Insects 2021, 12, 233. [Google Scholar] [CrossRef] [PubMed]
  15. Hunter, D.M. Advances in the Control of Locusts (Orthoptera: Acrididae) in Eastern Australia: From Crop Protection to Preventive Control. Aust J. Entomol. 2004, 43, 293–303. [Google Scholar] [CrossRef]
  16. Magor, J.I.; Lecoq, M.; Hunter, D.M. Preventive Control and Desert Locust Plagues. Crop Prot. 2008, 27, 1527–1533. [Google Scholar] [CrossRef]
  17. Pedgley, D.E. ERTS Surveys a 500 Km2 Locust Breeding Site in Saudi Arabia. In Third Earth Resources Technology Satellite—Symposium; Frieden, S.C., Mercanti, E.P., Becker, M.A., Eds.; NASA: Washington, DC, USA; Volume 1, pp. 233–246.
  18. Hielkema, J.U. Application of Landsat Data in Desert Locust Survey and Control; Report of the Desert Locust satellite Applications Projects, Stage II; FAO: Rome, Italy, 1977. [Google Scholar]
  19. Hielkema, J.U.; Snijders, F.L. Operational Use of Environmental Satellite Remote Sensing and Satellite Communications Technology for Global Food Security and Locust Control by FAO: The ARTEMIS and DIANA Systems. Acta Astronaut. 1994, 32, 603–616. [Google Scholar] [CrossRef]
  20. Ceccato, P.; Bell, M.; Blumenthal, M.; Connor, S.; Dinku, T.; Grover-Kopec, E.; Ropelewski, C.; Thomson, M. Use of Remote Sensing for Monitoring Climate Variability for Integrated Early Warning Systems: Applications for Human Diseases and Desert Locust Management. In Proceedings of the 2006 IEEE International Symposium on Geoscience and Remote Sensing, Denver, CO, USA, 31 July–4 August 2006; IEEE: Denver, CO, USA, 2006; pp. 270–274. [Google Scholar]
  21. Pekel, J.-F.; Ceccato, P.; Vancutsem, C.; Cressman, K.; Vanbogaert, E.; Defourny, P. Development and Application of Multi-Temporal Colorimetric Transformation to Monitor Vegetation in the Desert Locust Habitat. IEEE J. Sel. Top. Appl. Earth Obs. Remote Sens. 2011, 4, 318–326. [Google Scholar] [CrossRef]
  22. Bryceson, K.P.; Hunter, D.M.; Hamilton, G.L. Use of Remotely Sensed Data in the Australian Plague Locust Commission. In Proceedings of the Pest Control & Sustainable Agriculture; 5th Australian Applied Entomological Research Conf: Canberra, Australia, 1993; pp. 435–439. [Google Scholar]
  23. Piou, C.; Lebourgeois, V.; Benahi, A.S.; Bonnal, V.; el Hacen Jaavar, M.; Lecoq, M.; Vassal, J.-M. Coupling Historical Prospection Data and a Remotely-Sensed Vegetation Index for the Preventative Control of Desert Locusts. Basic Appl. Ecol. 2013, 14, 593–604. [Google Scholar] [CrossRef]
  24. Piou, C.; Gay, P.; Benahi, A.S.; Babah Ebbe, M.A.O.; Chihrane, J.; Ghaout, S.; Cisse, S.; Diakite, F.; Lazar, M.; Cressman, K.; et al. Soil Moisture from Remote Sensing to Forecast Desert Locust Presence. J. Appl. Ecol. 2019, 56, 966–975. [Google Scholar] [CrossRef]
  25. Crooks, W.T.S.; Cheke, R.A. Soil Moisture Assessments for Brown Locust Locustana pardalina Breeding Potential Using Synthetic Aperture Radar. J. Appl. Remote Sens 2014, 8, 084898. [Google Scholar] [CrossRef] [Green Version]
  26. Escorihuela, M.J.; Merlin, O.; Stefan, V.; Moyano, G.; Eweys, O.A.; Zribi, M.; Kamara, S.; Benahi, A.S.; Ebbe, M.A.B.; Chihrane, J.; et al. SMOS Based High Resolution Soil Moisture Estimates for Desert Locust Preventive Management. Remote Sens. Appl. Soc. Environ. 2018, 11, 140–150. [Google Scholar] [CrossRef]
  27. Gómez, D.; Salvador, P.; Sanz, J.; Casanova, C.; Taratiel, D.; Casanova, J.L. Machine Learning Approach to Locate Desert Locust Breeding Areas Based on ESA CCI Soil Moisture. J. Appl. Remote Sens. 2018, 12, 036011. [Google Scholar] [CrossRef] [Green Version]
  28. Rivas-Martínez, S.; Rivas-Sáenz, S.; Penas, A.S. Worldwide Bioclimatic Classification System. Glob. Geobot. 2011, 1, 634. [Google Scholar]
  29. Canu, S.; Rosati, L.; Fiori, M.; Motroni, A.; Filigheddu, R.; Farris, E. Bioclimate Map of Sardinia (Italy). J. Maps 2015, 11, 711–718. [Google Scholar] [CrossRef] [Green Version]
  30. Secci, D.; Patriche, C.V.; Ursu, A.; Sfica, L. Spatial Interpolation of Mean Annual Precipitations in Sardinia. A Comparative Analysis of Several Methods. Geogr. Tech. 2010, 9, 67–75. [Google Scholar]
  31. Bartholomé, E.; Belward, A.S. GLC2000: A New Approach to Global Land Cover Mapping from Earth Observation Data. Int. J. Remote Sens. 2005, 26, 1959–1977. [Google Scholar] [CrossRef]
  32. Friedl, M.A.; Sulla-Menashe, D.; Tan, B.; Schneider, A.; Ramankutty, N.; Sibley, A.; Huang, X. MODIS Collection 5 Global Land Cover: Algorithm Refinements and Characterization of New Datasets. Remote Sens. Environ. 2010, 114, 168–182. [Google Scholar] [CrossRef]
  33. Winkler, K.; Fuchs, R.; Rounsevell, M.; Herold, M. Global Land Use Changes Are Four Times Greater than Previously Estimated. Nat Commun 2021, 12, 2501. [Google Scholar] [CrossRef] [PubMed]
  34. Pekel, J.-F.; Cottam, A.; Gorelick, N.; Belward, A.S. High-Resolution Mapping of Global Surface Water and Its Long-Term Changes. Nature 2016, 540, 418–422. [Google Scholar] [CrossRef] [PubMed]
  35. Zanaga, D.; Van De Kerchove, R.; De Keersmaecker, W.; Souverijns, N.; Brockmann, C.; Quast, R.; Wevers, J.; Grosu, A.; Paccini, A.; Vergnaud, S.; et al. ESA WorldCover 10 m 2020 V100 2021. Available online: https://pure.iiasa.ac.at/id/eprint/18398/ (accessed on 25 July 2022).
  36. Gessner, U.; Machwitz, M.; Esch, T.; Tillack, A.; Naeimi, V.; Kuenzer, C.; Dech, S. Multi-Sensor Mapping of West African Land Cover Using MODIS, ASAR and TanDEM-X/TerraSAR-X Data. Remote Sens. Environ. 2015, 164, 282–297. [Google Scholar] [CrossRef]
  37. Klein, I.; Gessner, U.; Kuenzer, C. Regional Land Cover Mapping and Change Detection in Central Asia Using MODIS Time-Series. Appl. Geogr. 2012, 35, 219–234. [Google Scholar] [CrossRef]
  38. Leinenkugel, P.; Kuenzer, C.; Oppelt, N.; Dech, S. Characterisation of Land Surface Phenology and Land Cover Based on Moderate Resolution Satellite Data in Cloud Prone Areas—A Novel Product for the Mekong Basin. Remote Sens. Environ. 2013, 136, 180–198. [Google Scholar] [CrossRef]
  39. Pickens, A.H.; Hansen, M.C.; Hancher, M.; Stehman, S.V.; Tyukavina, A.; Potapov, P.; Marroquin, B.; Sherani, Z. Mapping and Sampling to Characterize Global Inland Water Dynamics from 1999 to 2018 with Full Landsat Time-Series. Remote Sens. Environ. 2020, 243, 111792. [Google Scholar] [CrossRef]
  40. Le Gall, M.; Overson, R.; Cease, A. A Global Review on Locusts (Orthoptera: Acrididae) and Their Interactions with Livestock Grazing Practices. Front. Ecol. Evol. 2019, 7, 263. [Google Scholar] [CrossRef] [Green Version]
  41. Sivanpillai, R.; Latchininsky, A.V.; Peveling, R.; Pankov, V.I.; Diagnosis, P. Utility of the IRS-AWiFS Data to Map the Potential Italian Locust (Calliptamus italicus) Habitats in Northern Kazakhstan; ASPRS: Baltimore, MD, USA, 2009. [Google Scholar]
  42. Bryceson, K.P. The Use of Landsat MSS Data to Determine the Locust Eggbeds of Locust Eggbeds in the Riverina Region of New South Wales, Australia. Int. J. Remote Sens. 1989, 10, 1749–1762. [Google Scholar] [CrossRef]
  43. de Miranda, E.E.; Duranton, J.-F.; Lecoq, M. Static and Dynamic Cartographies of the Biotopes of the Grasshopper Rhammatocerus Schistocercoides (Rehn, 1906) in the State of Mato Grosso, Brazil; Anais do International Symposium on Resource and Environmental Monitoring – ECO RIO´94: Rio de Janeiro, Brazil, 1994; pp. 67–72. [Google Scholar]
  44. Latchininsky, A.V.; Sivanpillai, R.; Driese, K.L.; Wilps, H. Can Early Season Landsat Images Improve Locust Habitat Monitoring in the Amudarya River Delta of Uzbekistan. J. Orthoptera Res. 2007, 16, 167–173. [Google Scholar] [CrossRef]
  45. Lazar, M.; Aliou, D.; Jeng-Tze, Y.; Doumandji-Mitiche, B.; Lecoq, M. Location and Characterization of Breeding Sites of Solitary Desert Locust Using Satellite Images Landsat 7 ETM+ and Terra MODIS. Adv. Entomol. 2015, 3, 6–15. [Google Scholar] [CrossRef]
  46. Löw, F.; Waldner, F.; Latchininsky, A.; Biradar, C.; Bolkart, M.; Colditz, R.R. Timely Monitoring of Asian Migratory Locust Habitats in the Amudarya Delta, Uzbekistan Using Time Series of Satellite Remote Sensing Vegetation Index. J. Environ. Manag. 2016, 183, 562–575. [Google Scholar] [CrossRef]
  47. McCulloch, L.; Hunter, D.M. Identification and Monitoring of Australian Plague Locust Habitats from Landsat. Remote Sens. Environ. 1983, 13, 95–102. [Google Scholar] [CrossRef]
  48. Shi, Y.; Huang, W.; Dong, Y.; Peng, D.; Zheng, Q.; Yang, P. The Influence of Landscape’s Dynamics on the Oriental Migratory Locust Habitat Change Based on the Time-Series Satellite Data. J. Environ. Manag. 2018, 218, 280–290. [Google Scholar] [CrossRef] [PubMed]
  49. Zhao, L.; Huang, W.; Chen, J.; Dong, Y.; Ren, B.; Geng, Y. Land Use/Cover Changes in the Oriental Migratory Locust Area of China: Implications for Ecological Control and Monitoring of Locust Area. Agric. Ecosyst. Environ. 2020, 303, 107110. [Google Scholar] [CrossRef]
  50. Latchininsky, A.; Sword, G.; Sergeev, M.; Cigliano, M.M.; Lecoq, M. Locusts and Grasshoppers: Behavior, Ecology, and Biogeography. Psyche A J. Entomol. 2011, 2011, 578327. [Google Scholar] [CrossRef] [Green Version]
  51. Monard, A.; Chiris, M.; Latchininsky, A.V. Analytical Report on Locust Situations and Management in Caucasus and Central Asia (Cca); FAO: Rome, Italy, 2009. [Google Scholar]
  52. Sergeev, M.G. Ups and Downs of the Italian Locust (Calliptamus italicus L.) Populations in the Siberian Steppes: On the Horns of Dilemmas. Agronomy 2021, 11, 746. [Google Scholar] [CrossRef]
  53. Sergeev, M.G.; Childebaev, M.K.; Vankova, I.A.; Gapparov, F.A.; Kambulin, V.E.; Kokanova, E.O.; Latchininsky, A.V.; Pshenitsyna, L.B.; Temreshev, I.I.; Chernyakhovsky, M.E.; et al. Italian Locust Calliptamus italicus (Linnaeus, 1758). Morphology, Distribution, Ecology, Population Management; FAO: Rome, Italy, 2022; ISBN 978-92-5-135438-4. [Google Scholar]
  54. Estel, S.; Kuemmerle, T.; Alcántara, C.; Levers, C.; Prishchepov, A.; Hostert, P. Mapping Farmland Abandonment and Recultivation across Europe Using MODIS NDVI Time Series. Remote Sens. Environ. 2015, 163, 312–325. [Google Scholar] [CrossRef]
  55. Orynbaikyzy, A.; Gessner, U.; Mack, B.; Conrad, C. Crop Type Classification Using Fusion of Sentinel-1 and Sentinel-2 Data: Assessing the Impact of Feature Selection, Optical Data Availability, and Parcel Sizes on the Accuracies. Remote Sens. 2020, 12, 2779. [Google Scholar] [CrossRef]
  56. Prishchepov, A.V.; Müller, D.; Dubinin, M.; Baumann, M.; Radeloff, V.C. Determinants of Agricultural Land Abandonment in Post-Soviet European Russia. Land Use Policy 2013, 30, 873–884. [Google Scholar] [CrossRef] [Green Version]
  57. Verbesselt, J.; Hyndman, R.; Newnham, G.; Culvenor, D. Detecting Trend and Seasonal Changes in Satellite Image Time Series. Remote Sens. Environ. 2010, 114, 106–115. [Google Scholar] [CrossRef]
  58. Zeng, L.; Wardlow, B.D.; Xiang, D.; Hu, S.; Li, D. A Review of Vegetation Phenological Metrics Extraction Using Time-Series, Multispectral Satellite Data. Remote Sens. Environ. 2020, 237, 111511. [Google Scholar] [CrossRef]
  59. Benjamin, K.; Domon, G.; Bouchard, A. Vegetation Composition and Succession of Abandoned Farmland: Effects of Ecological, Historical and Spatial Factors. Landsc. Ecol 2005, 20, 627–647. [Google Scholar] [CrossRef]
  60. ARPAS. Analisi Agrometeorologica e Climatologica Della Sardegna Analisi Delle Condizioni Meteorologiche e Conseguenze Sul Territorio Regionale Nel Periodo Ottobre 2020–Settembre 2021; ARPAS (Agenzia Regionale per la Protezione dell’Ambiente della Sardegna): Cagliari, Italy, 2021. [Google Scholar]
  61. Breiman, L. Random Forests. Mach. Learn. 2001, 45, 5–32. [Google Scholar] [CrossRef] [Green Version]
  62. Dirscherl, M.; Dietz, A.J.; Kneisel, C.; Kuenzer, C. Automated Mapping of Antarctic Supraglacial Lakes Using a Machine Learning Approach. Remote Sens. 2020, 12, 1203. [Google Scholar] [CrossRef] [Green Version]
  63. Dubertret, F.; Le Tourneau, F.-M.; Villarreal, M.L.; Norman, L.M. Monitoring Annual Land Use/Land Cover Change in the Tucson Metropolitan Area with Google Earth Engine (1986–2020). Remote Sens. 2022, 14, 2127. [Google Scholar] [CrossRef]
  64. Phan, T.N.; Kuch, V.; Lehnert, L.W. Land Cover Classification Using Google Earth Engine and Random Forest Classifier—The Role of Image Composition. Remote Sens. 2020, 12, 2411. [Google Scholar] [CrossRef]
  65. Cohen, J. A Coefficient of Agreement for Nominal Scales. Educ. Psychol. Meas. 1960, 20, 37–46. [Google Scholar] [CrossRef]
  66. Copernicus DEM GLO-30 © DLR, e.V. (2014–2018) and © Airbus Defence and Space GmbH 2022 Provided under COPERNICUS by the European Union and ESA; All Rights Reserved 2022. Available online: https://spacedata.copernicus.eu/web/cscda (accessed on 25 July 2022).
  67. Molinu, A.; Cesaroni, C.; Pantaleoni, R.A. Arsenic Locusts—The Control of Locusts in Sardinia in the First Half of Twentieth Century; Composita: Sassari, Italy, 2004. [Google Scholar]
  68. Symmons, P.M.; Cressman, K. Desert Locust Guidelines—1. Biology and Behaviour, 2nd ed.; FAO: Rome, Italy, 2001. [Google Scholar]
  69. Cisse, S.; Ghaout, S.; Mazih, A.; Babah Ebbe, M.A.O.; Benahi, A.S.; Piou, C. Effect of Vegetation on Density Thresholds of Adult Desert Locust Gregarization from Survey Data in Mauritania. Entomol. Exp. Et Appl. 2013, 149, 159–165. [Google Scholar] [CrossRef]
  70. Despland, E. Fractal Index Captures the Role of Vegetation Clumping in Locust Swarming. Funct Ecol. 2003, 17, 315–322. [Google Scholar] [CrossRef]
  71. Deveson, E.D. Satellite Normalized Difference Vegetation Index Data Used in Managing Australian Plague Locusts. J. Appl. Remote Sens 2013, 7, 075096. [Google Scholar] [CrossRef]
  72. Renier, C.; Waldner, F.; Jacques, D.; Babah Ebbe, M.; Cressman, K.; Defourny, P. A Dynamic Vegetation Senescence Indicator for Near-Real-Time Desert Locust Habitat Monitoring with MODIS. Remote Sens. 2015, 7, 7545–7570. [Google Scholar] [CrossRef] [Green Version]
  73. Waldner, F.; Ebbe, M.; Cressman, K.; Defourny, P. Operational Monitoring of the Desert Locust Habitat with Earth Observation: An Assessment. ISPRS Int. J. Geo-Inf. 2015, 4, 2379–2400. [Google Scholar] [CrossRef] [Green Version]
  74. Sivanpillai, R.; Latchininsky, A.V. Mapping Locust Habitats in the Amudarya River Delta, Uzbekistan with Multi-Temporal MODIS Imagery. Environ. Manag. 2007, 39, 876–886. [Google Scholar] [CrossRef] [PubMed]
  75. Geng, Y.; Zhao, L.; Dong, Y.; Huang, W.; Shi, Y.; Ren, Y.; Ren, B. Migratory Locust Habitat Analysis With PB-AHP Model Using Time-Series Satellite Images. IEEE Access 2020, 8, 166813–166823. [Google Scholar] [CrossRef]
  76. Lecoq, M.; Cease, A. What Have We Learned after Millennia of Locust Invasions? Agronomy 2022, 12, 472. [Google Scholar] [CrossRef]
  77. Kraemer, R.; Prishchepov, A.V.; Müller, D.; Kuemmerle, T.; Radeloff, V.C.; Dara, A.; Terekhov, A.; Frühauf, M. Long-Term Agricultural Land-Cover Change and Potential for Cropland Expansion in the Former Virgin Lands Area of Kazakhstan. Environ. Res. Lett. 2015, 10, 054012. [Google Scholar] [CrossRef]
  78. Prishchepov, A.V.; Radeloff, V.C.; Baumann, M.; Kuemmerle, T.; Müller, D. Effects of Institutional Changes on Land Use: Agricultural Land Abandonment during the Transition from State-Command to Market-Driven Economies in Post-Soviet Eastern Europe. Environ. Res. Lett. 2012, 7, 024021. [Google Scholar] [CrossRef]
  79. Legendre, P. Spatial Autocorrelation: Trouble or New Paradigm? Ecology 1993, 74, 1659–1673. [Google Scholar] [CrossRef]
  80. Adams, E.C.; Parache, H.B.; Cherrington, E.; Ellenburg, W.L.; Mishra, V.; Lucey, R.; Nakalembe, C. Limitations of Remote Sensing in Assessing Vegetation Damage Due to the 2019–2021 Desert Locust Upsurge. Front. Clim. 2021, 3, 714273. [Google Scholar] [CrossRef]
  81. Weiss, J.E.R. Do Locusts Seek Greener Pastures? An Evaluation of MODIS Vegetation Indices to Predict Presence, Abundance and Impact of the Australian Plague Locust in South–Eastern Australia. Ph.D. Thesis, University of Melbourne, Melbourne, Australia, 2016. [Google Scholar]
Figure 1. Overview of Moroccan locust distribution (adapted from FAO, 2021): (a) band of 1st and 2nd nymph stages of DMA on 26.04.2022 (40.252103°N, 8.960806°E); (b,c) mating and oviposition on 02.05.2022 (40.244172°N, 8.983378°E). Photos © Arturo Cocco.
Remotesensing 14 06050 g001
Figure 2. Workflow for regional land cover classification with regards to land cover classes of interest and specification of detected abandoned land.
Remotesensing 14 06050 g002
Figure 3. Land cover land use classification for 2021. Zoom areas for region of interest with majority of detected DMA locations.
Remotesensing 14 06050 g003
Figure 4. NDVI variance for vegetative period (Mar–Nov) for 2017–2021 as an indicator for agricultural activities. Zoom in to both regions with high density of DMA locations in 2022 (compare 2.2). Black dots = recorded DMA locations in 2022.
Remotesensing 14 06050 g004
Figure 5. Abandoned land evolution 2017–2020. Zoom areas for region of interest with majority of detected DMA locations.
Remotesensing 14 06050 g005
Figure 6. Abandoned land transformation and state in 2021. Zoom areas for region of interest with majority of detected DMA locations.
Remotesensing 14 06050 g006
Figure 7. Biweekly NDVI development for different stages of detected DMA locations between April and July 2022.
Remotesensing 14 06050 g007
Figure 8. DEM at 30 m spatial resolution (source: Copernicus-DEM derived from Tandem-X DEM). Zoom areas for region of interest with majority of detected DMA locations.
Remotesensing 14 06050 g008
Figure 9. Relation between elevation and time for different stages of detected DMA locations between April and July 2022.
Remotesensing 14 06050 g009
Table 1. Distribution of DMA locations among different classes of 2021 and untilled land evolution 1. Pearson standardized residuals measuring the deviation from expected values are reported in brackets (+ = positive deviation; − = negative deviation).
LCLU 2021Untilled SinceUntilled LC 2021
DMA StageCSBOU2017201820192020SB
N1-N2 (113)23250164 (+)12061622
N3+ (435)10311921918352011571785
Feeding/moving adults (181)3677 (+)3758 (2212)17347562
Oviposition (85)2515214200042420
Total (814)187236261834772943073389
1 First and second nymph stages (N1-N2), third or older nymph stages (N3+), cropland (C), sparse vegetation and grassland (S), bare soil (B), other classes (O), untilled land (U).
Table 2. Results of the accuracy assessment for the binary cropland classification in 2017, 2018, and 2021 1.
ClassesCroplandNon-CroplandBoth
Accuracy MeasureEO (%)UA (%)EC (%)PA
(%)
EO (%)UA (%)EC (%)PA
(%)
OA (%)K
201714.2985.717.6992.311.4798.532.9097.1096.340.867
201834.5565.450.00100.000.00100.008.9291.0892.370.747
202115.0984.910.00100.000.00100.003.9896.0296.750.898
Average21.3178.692.5697.440.4999.515.2394.7395.150.837
1 For each year, the accuracy measure error of omission (EO), user’s accuracy (UA), error of commission (EC), producer’s accuracy (PA), overall accuracy (OA), and kappa coefficient (K) are provided.
Publisher’s Note: MDPI stays neutral with regard to jurisdictional claims in published maps and institutional affiliations.

