Communication

Traffic-Induced Vibration Monitoring Using Laser Vibrometry: Preliminary Experiments

1
DLR (German Aerospace Center), Institute of Flight Systems, 38108 Braunschweig, Germany
2
TU Clausthal, Institut für Elektrische Informationstechnik, 38678 Clausthal-Zellerfeld, Germany
3
DLR (German Aerospace Center), Institute of Transportation Systems, 38108 Braunschweig, Germany
4
Ibeo Automotive Systems GmbH, 22143 Hamburg, Germany
*
Author to whom correspondence should be addressed.
Remote Sens. 2022, 14(23), 6034; https://doi.org/10.3390/rs14236034
Submission received: 18 October 2022 / Revised: 25 November 2022 / Accepted: 27 November 2022 / Published: 28 November 2022

Abstract

:
Traffic monitoring technologies have become crucial for modern manned and autonomous vehicles. They aim to ensure the maximum level of safety and dependability. The commonly used monitoring technologies based on conventional LIDAR (laser imaging, detection, and ranging), vision and ultrasound sensors are effective if there is a clear line of sight for the surrounding traffic field. However, some potential accidents and traffic hazards beyond the line of sight cannot be detected by the aforementioned sensors. Thus, dedicated sensors require means to detect other traffic participants even if they are not visible due to obstacles. In this paper, a new traffic monitoring concept for detecting nearby traffic activities occurring beyond the line of sight is introduced. The principle is based on a portable laser Doppler vibrometer (LDV), which is mounted on the vehicle to measure the roadway’s vibration noise induced by nearby traffic activities. First proof-of-concept field tests were conducted using a commercial LDV and realistic public traffic conditions. A statistical classification method based on the frequency features of pavement vibration measurements showed quite good performance for identifying traffic conditions.

1. Introduction

Line of sight-related traffic challenges, such as curved roadways, unsignalized intersections, and tree branches, frequently occur. According to the US Federal Highway Administration, 28% of the more than 36,096 traffic fatalities in 2019 occurred at intersections and were related to line-of-sight difficulties [1]. Furthermore, 80% of intersection fatalities occur at unsignalized intersections [2]. Modern vehicles are equipped with an on-board intelligent traffic monitoring system that may be based on LIDAR (laser imaging, detection, and ranging), ultrasound, or radio frequency radars [3] as in Figure 1.
Although these sensing technologies can provide an early warning for many safety-critical traffic situations, they do not work in the presence of optical obstacles, as shown in Figure 1. Many approaches have been suggested to minimize the line of sight-related traffic hazards. One approach is based on ensuring intelligent collaboration between infrastructure and vehicles, such as vehicle-to-vehicle and vehicle-to-infrastructure communication [4]. However, this approach is more realistic in urban areas as it is economically hard to extend to most non-urban and rural roadways. A second approach is based on the propagation characteristics of radio waves at blind areas such as in [4]. However, these techniques assumed that radio waves reach blind areas through multiple reflections by walls on a side of the road. Here, we discuss the principle of using traffic-induced vibration on the roadway to monitor traffic activities. This principle has been previously discussed and tested in [5,6,7] using accelerometers mounted on the roadway. Vehicle noise consists of propulsion noise from the engine, aerodynamic noise, and tire-pavement noise. Tire-pavement noise is the dominant noise when the vehicle speed exceeds 50 km/h [8]. It is caused by the interaction between the tire and the pavement surface and involves sound noise transmitted by the air and ground vibration noise through the roadway.
Due to its omnidirectional propagation, the roadway’s vibration can be detected without a clear line of sight. It also includes information regarding the vehicle position, speed, and size. Previous studies have used vibration sensors fixed on the roadway and have shown that traffic-induced vibrations are effective for identifying vehicle position, speed, and type [5,6]. However, this information is detected by fixed vibration sensors and is not available to the driver. In addition, large amounts of vibration sensors and communication networks need to be installed along roadways as a part of vehicle-to-infrastructure communication systems.
We extended the principle of using traffic-induced vibration by employing a portable laser vibration sensor mounted on a vehicle [9]. In this case, there is no need to change the roadway infrastructure. The concept is illustrated in Figure 2 for an unsignalized intersection in the urban area. The blue car (on the right side) carries a laser vibration sensor for detecting the roadway vibration waves induced by a second car before reaching the intersection to prevent a possible crash hazard. In this case, there is no physical line of sight between the two cars, but there are omnidirectional traffic-induced vibrations from both cars that may be recognized early. There are many signal processing challenges for upgrading this concept to a fully operational product: the vehicle’s self noise (the engine noise, suspension assembly vibration), the laser speckle noise due to the roadway’s rough surface, and the noise source identification from multiple vehicles, including the vehicle hosting the laser vibration sensor.
In this paper, we present the results of the first preliminary field tests for the following arrangement: a laser Doppler vibrometer (LDV) [10] mounted on a stationary vehicle for monitoring public traffic activities with direct and indirect line of sight. Section 2 describes the experiment setup for the field tests. The signal processing and traffic data inference results are discussed in Section 3. A summary of lessons learned is provided in Section 4.

2. Materials and Methods

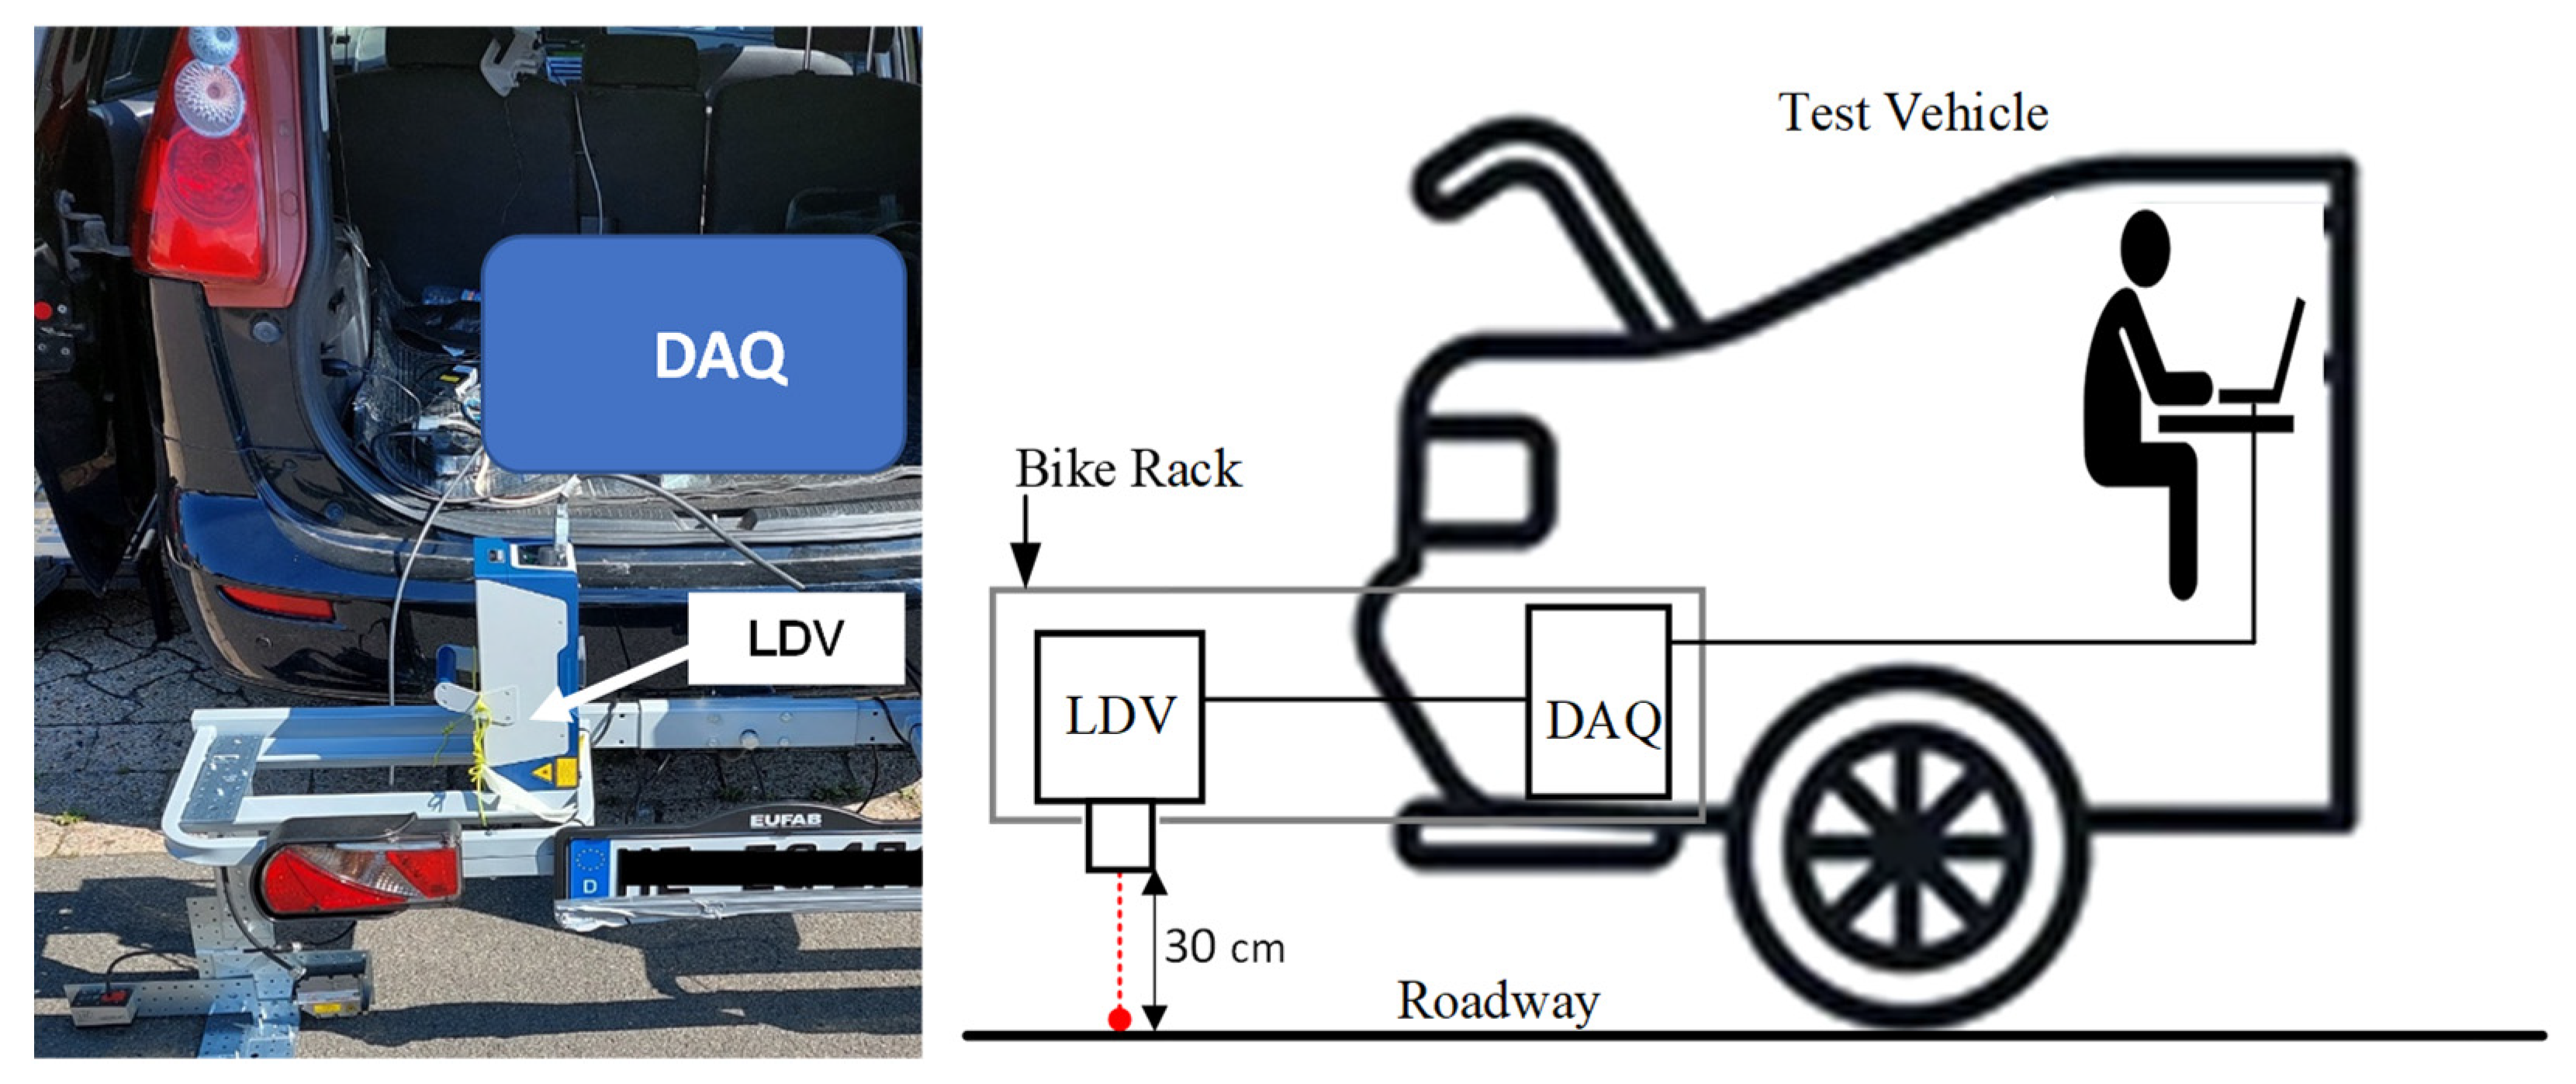
The portable vibration measuring unit is attached to a bike rack on a medium-sized car, as shown in Figure 3. The unit includes a commercial LDV model (VibroFlex QTec) from Polytec [11] and a data acquisition system (DAQ). The QTec LDV is designed for challenging surfaces (e.g., the rough dark surface of asphalt) in which laser speckle noises are strong. Thanks to an embedded signal diversity algorithm for a multi-detector, this LDV can achieve 80–90% reflective signal strength for all field tests at public roadways. The sampling rate is 250 kHz, and the bandwidth is 50 kHz.
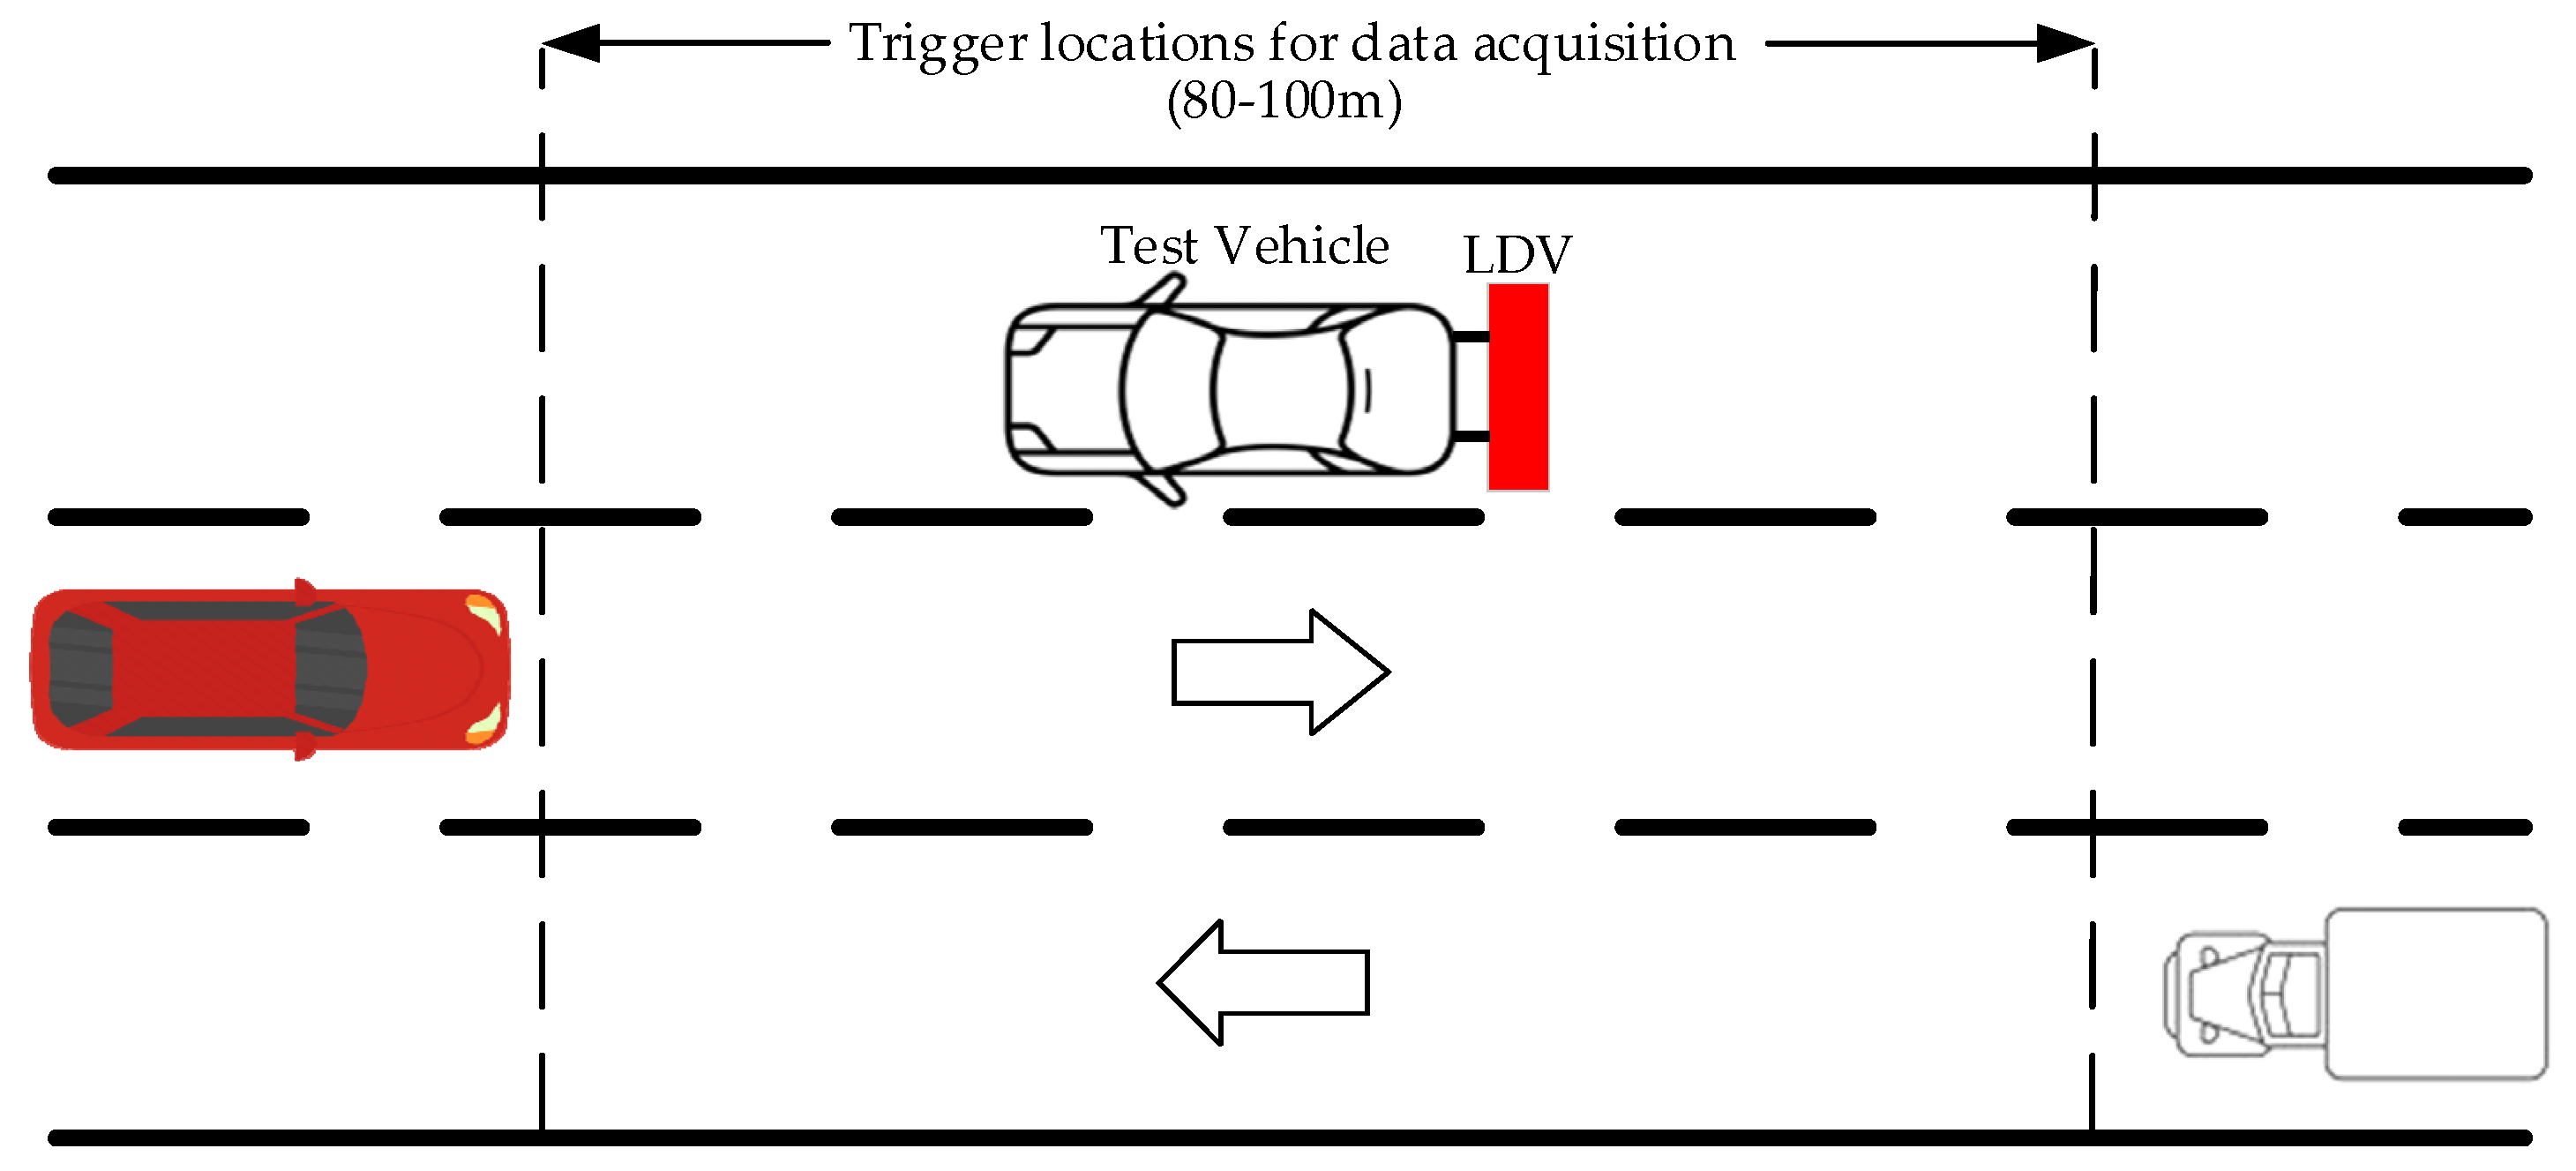
The field tests in the present study were conducted at Clausthal University of Technology. All the measurements were based on a stationary test vehicle with a switched-off engine. Follow-up articles will consider moving vehicles and active engine noise. The experimental conditions were grouped into traffic and no-traffic conditions. As shown in Figure 4, a traffic condition involved one or more public vehicles passing near the test vehicle with an average speed of 30 km/h. Both the traffic and no-traffic datasets had a fixed duration of 10 s.

3. Results and Discussion

3.1. Signal Feature Exploration

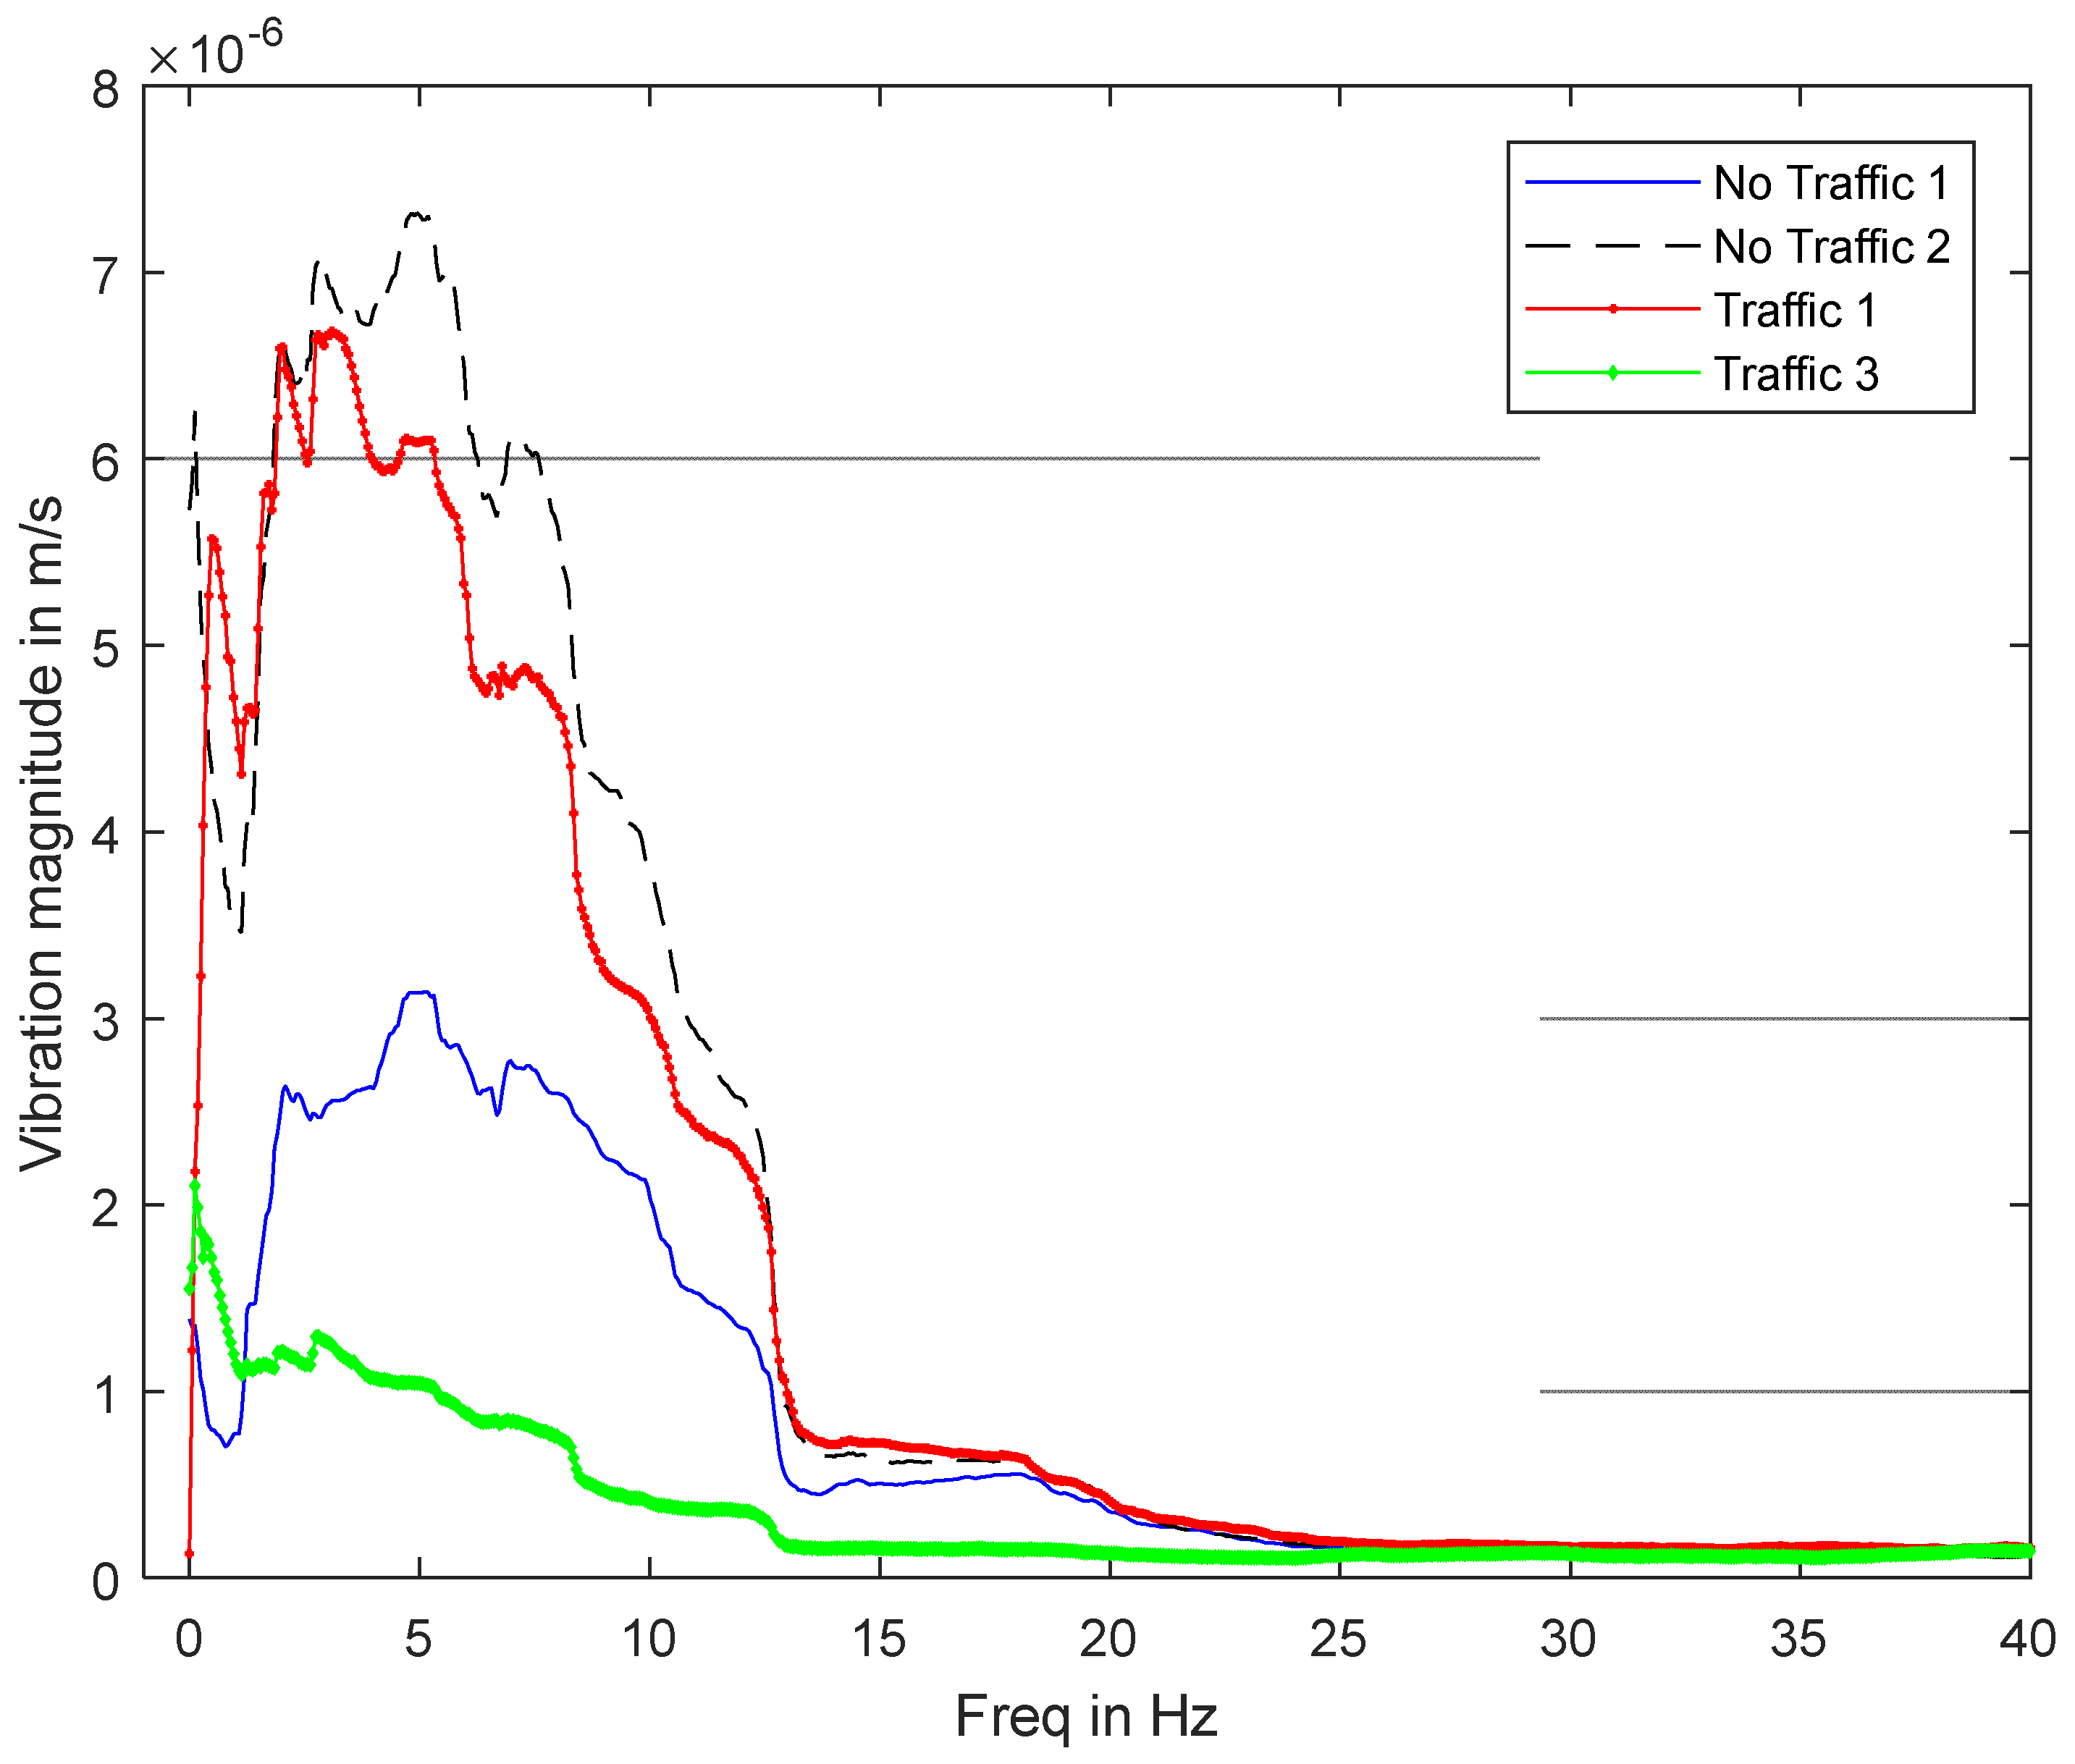
The measurements in the time and frequency domains were first examined to determine if there was a correlation between the traffic status and the signal time and frequency features. Examples of time waveforms are shown in Figure 5. There was a background low-frequency (around 3–5 Hz) noise for both the traffic and no-traffic datasets, as shown in Figure 6. The resolution bandwidth (RBW) is 0.1 Hz as all datasets are measured in a duration of 10 s. This noise was a result of vertical oscillations of the vehicle suspension assembly due to non-stationary wind forces. This low frequency range matches the numerical results of the vehicle suspension in [12]. At low wind disturbance, the presence of a traffic activity (if it exists) did not significantly increase the vibration level, as could be seen in the first 5 s in the traffic 1 and 2 conditions in Figure 5.
The time features for the vibration datasets are listed in Table 1. These features cannot be used to identify a traffic condition because time features are mainly biased by vehicle suspension vibration. However, the prior research for traffic-induced vibration, based on accelerometers, reported time features for detecting traffic activities [5,6].
Figure 7 shows the fast Fourier transform (FFT) spectra for the same datasets in Figure 6 in higher frequencies. The spectra for the traffic datasets had a higher noise floor than the no-traffic datasets for the frequency range above 1200 Hz. This frequency level was also observed for different vehicles using ground-mounted accelerometers in [5].

3.2. Signal Classification Scheme

In this section, we consider a classification scheme for all the datasets based on the frequency spectrum magnitude at a selected frequency level. Two z-tests [13] were used to estimate the z-scores ( z 1 , z 2 ) for each dataset to identify traffic and no traffic, respectively. The vibration datasets were grouped into two equal-sized batches: training and testing. The training datasets were used to estimate the average distributions for the traffic and no-traffic cases for the z-tests in Equation (1):
z 1 = | X ¯ ( f ) μ 1 ( f ) σ 1 ( f ) | ,   z 2 = | X ¯ ( f ) μ 2 ( f ) σ 2 ( f ) |
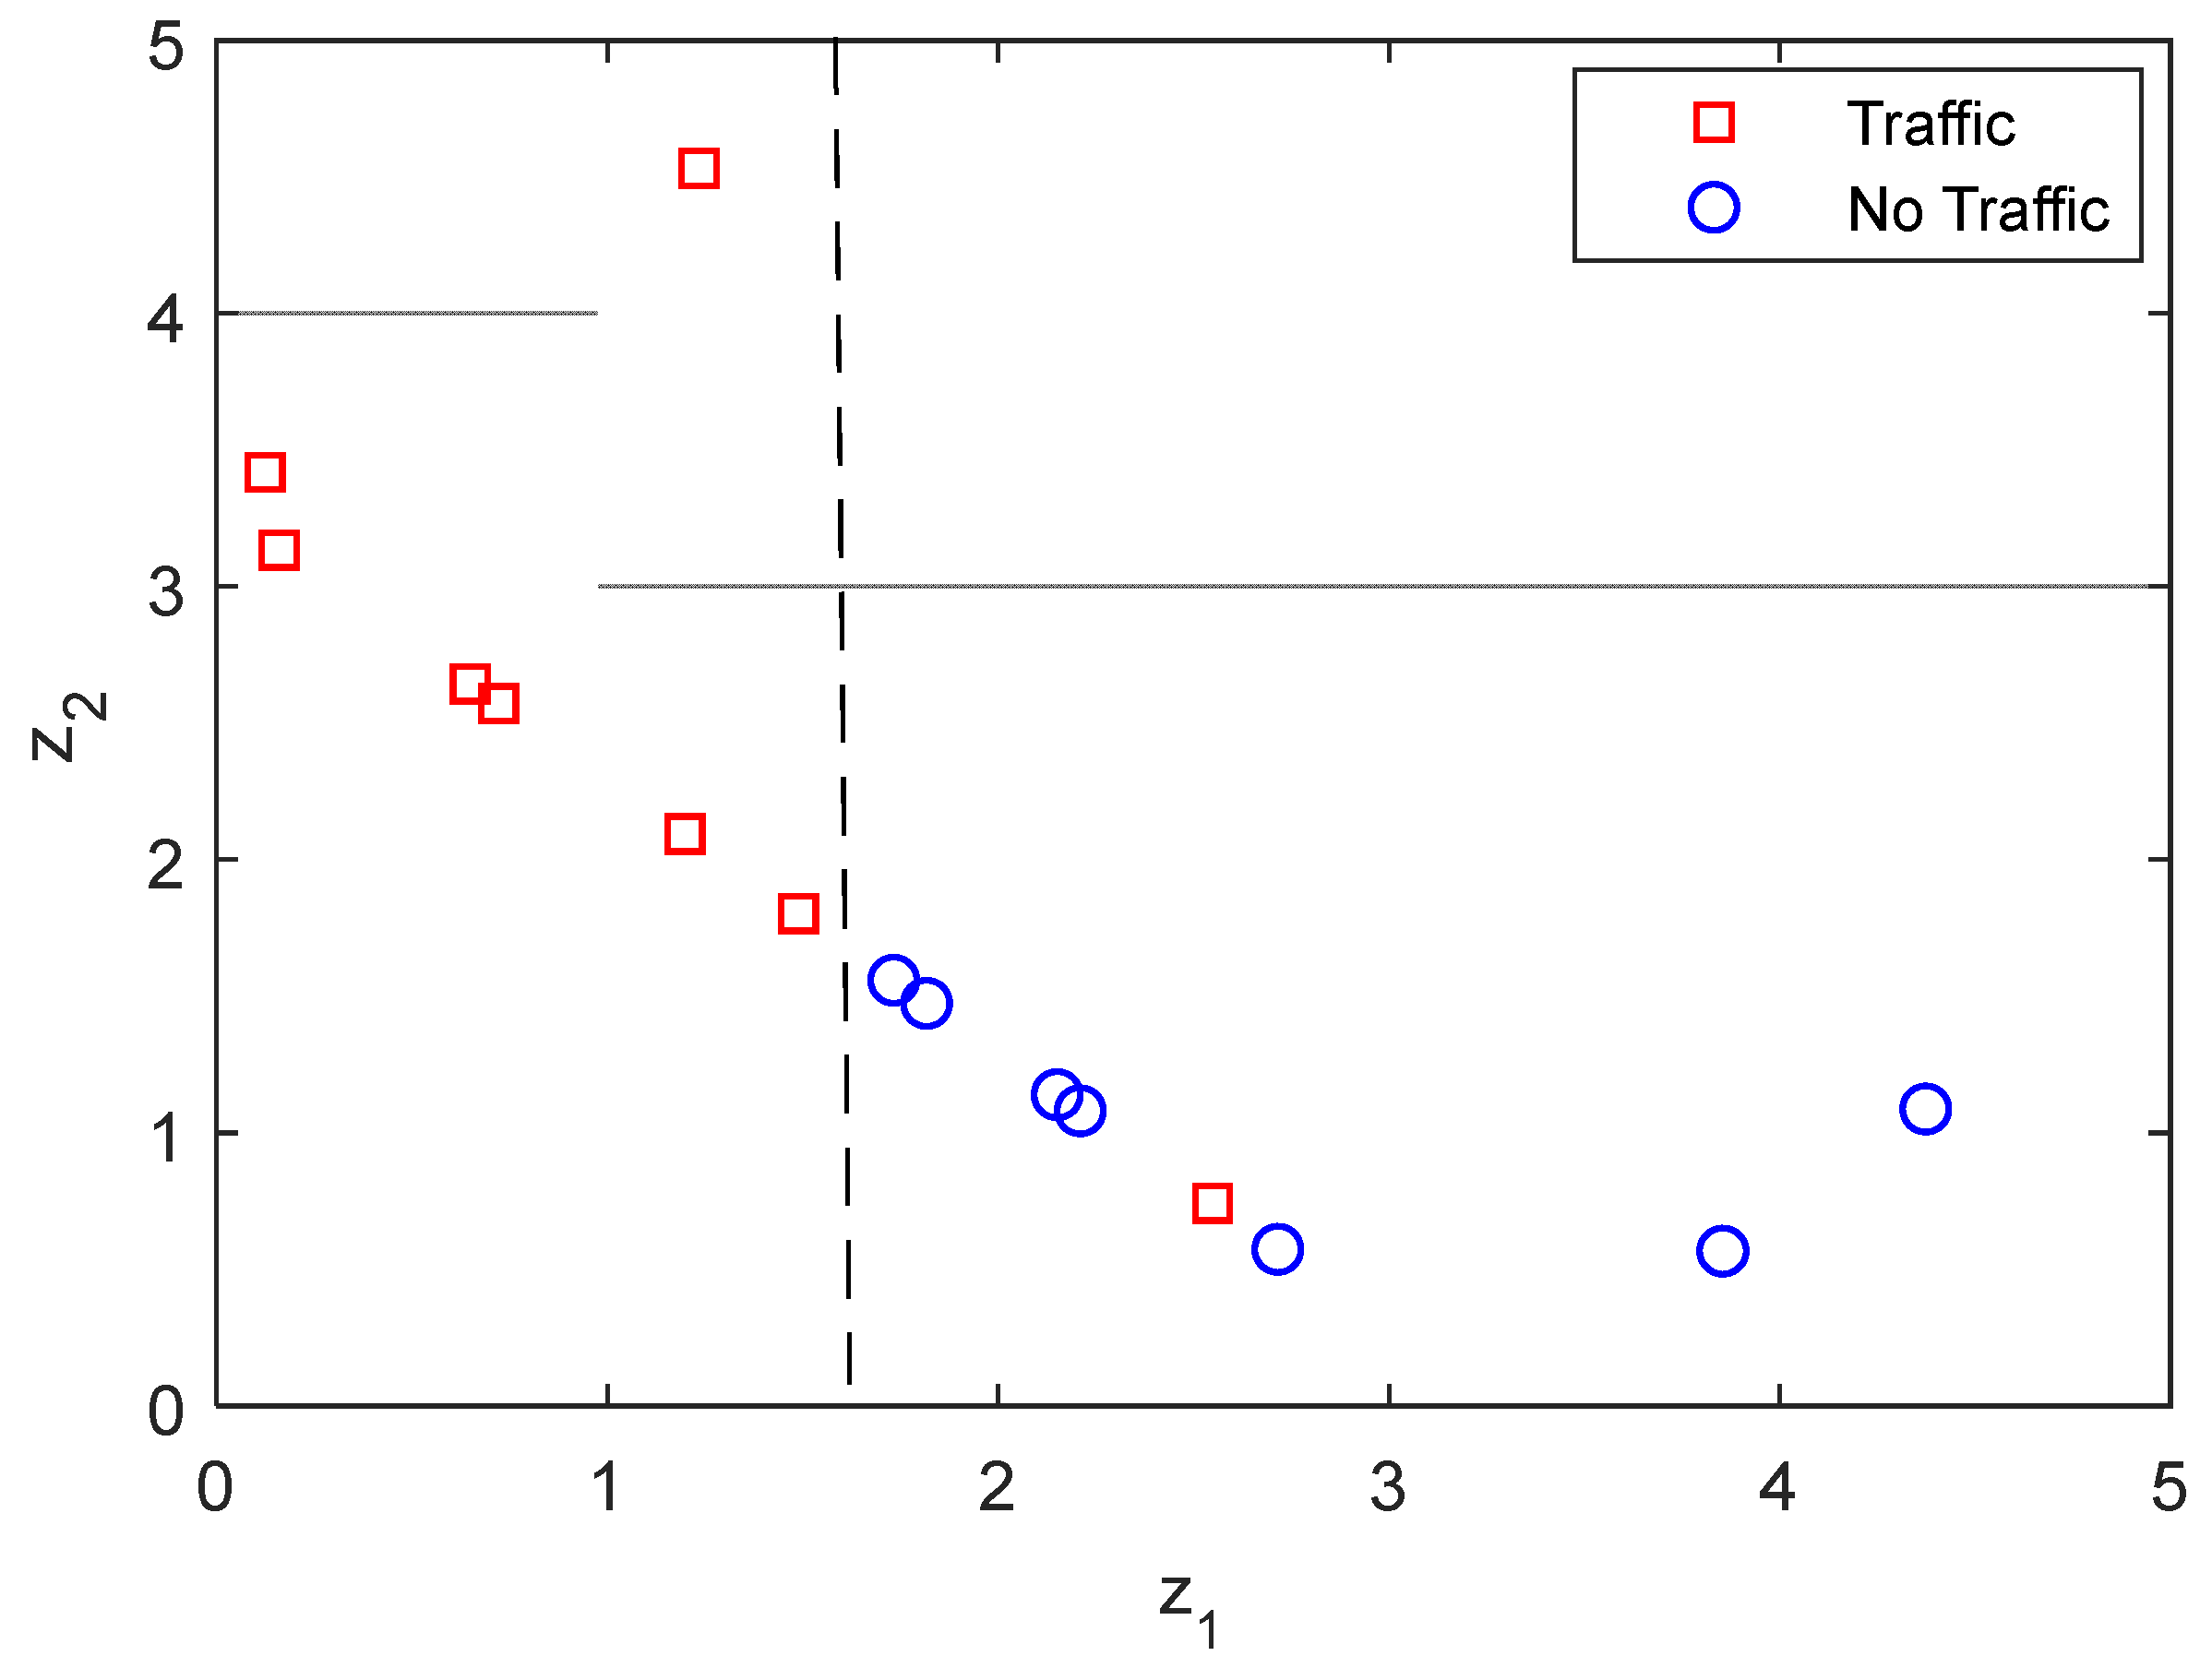
where X ¯ ( f ) is the FFT magnitude at a certain frequency f for the dataset under evaluation, i.e., the testing batch; ( μ 1 ( f ) ,   σ 1 ( f ) ) are the mean and standard deviation (SD) for the FFT magnitudes at frequency f for all the traffic datasets in the training batch; and ( μ 2 ( f ) ,   σ 2 ( f ) ) are the mean and SD for the FFT magnitudes at f for all the no-traffic datasets in the training batch. At f = 5000 Hz (selected according to the traffic class separation in Figure 7), the z-scores ( z 1 , z 2 ) shown in Figure 8 were obtained. The separation of the two traffic groups was indicated with a vertical dashed line. Based on a single frequency and Equation (1), all the datasets could be classified, except the traffic dataset located within the no-traffic zone as shown in Figure 8.
An enhanced classification could be further derived based on multiple frequencies to compensate for measurement disturbances. Equation (1) was expanded to multiple frequencies of n levels (i.e., f1, f2…, fn), then multiple frequency z-scores ( z m 1 , z m 2 ) could be estimated, as in Equation (2):
z m 1 = 1 n k = 1 n | X ¯ ( f k ) μ 1 ( f k ) σ 1 ( f k ) | ,   z m 2 = 1 n k = 1 n | X ¯ ( f k ) μ 2 ( f k ) σ 2 ( f k ) |
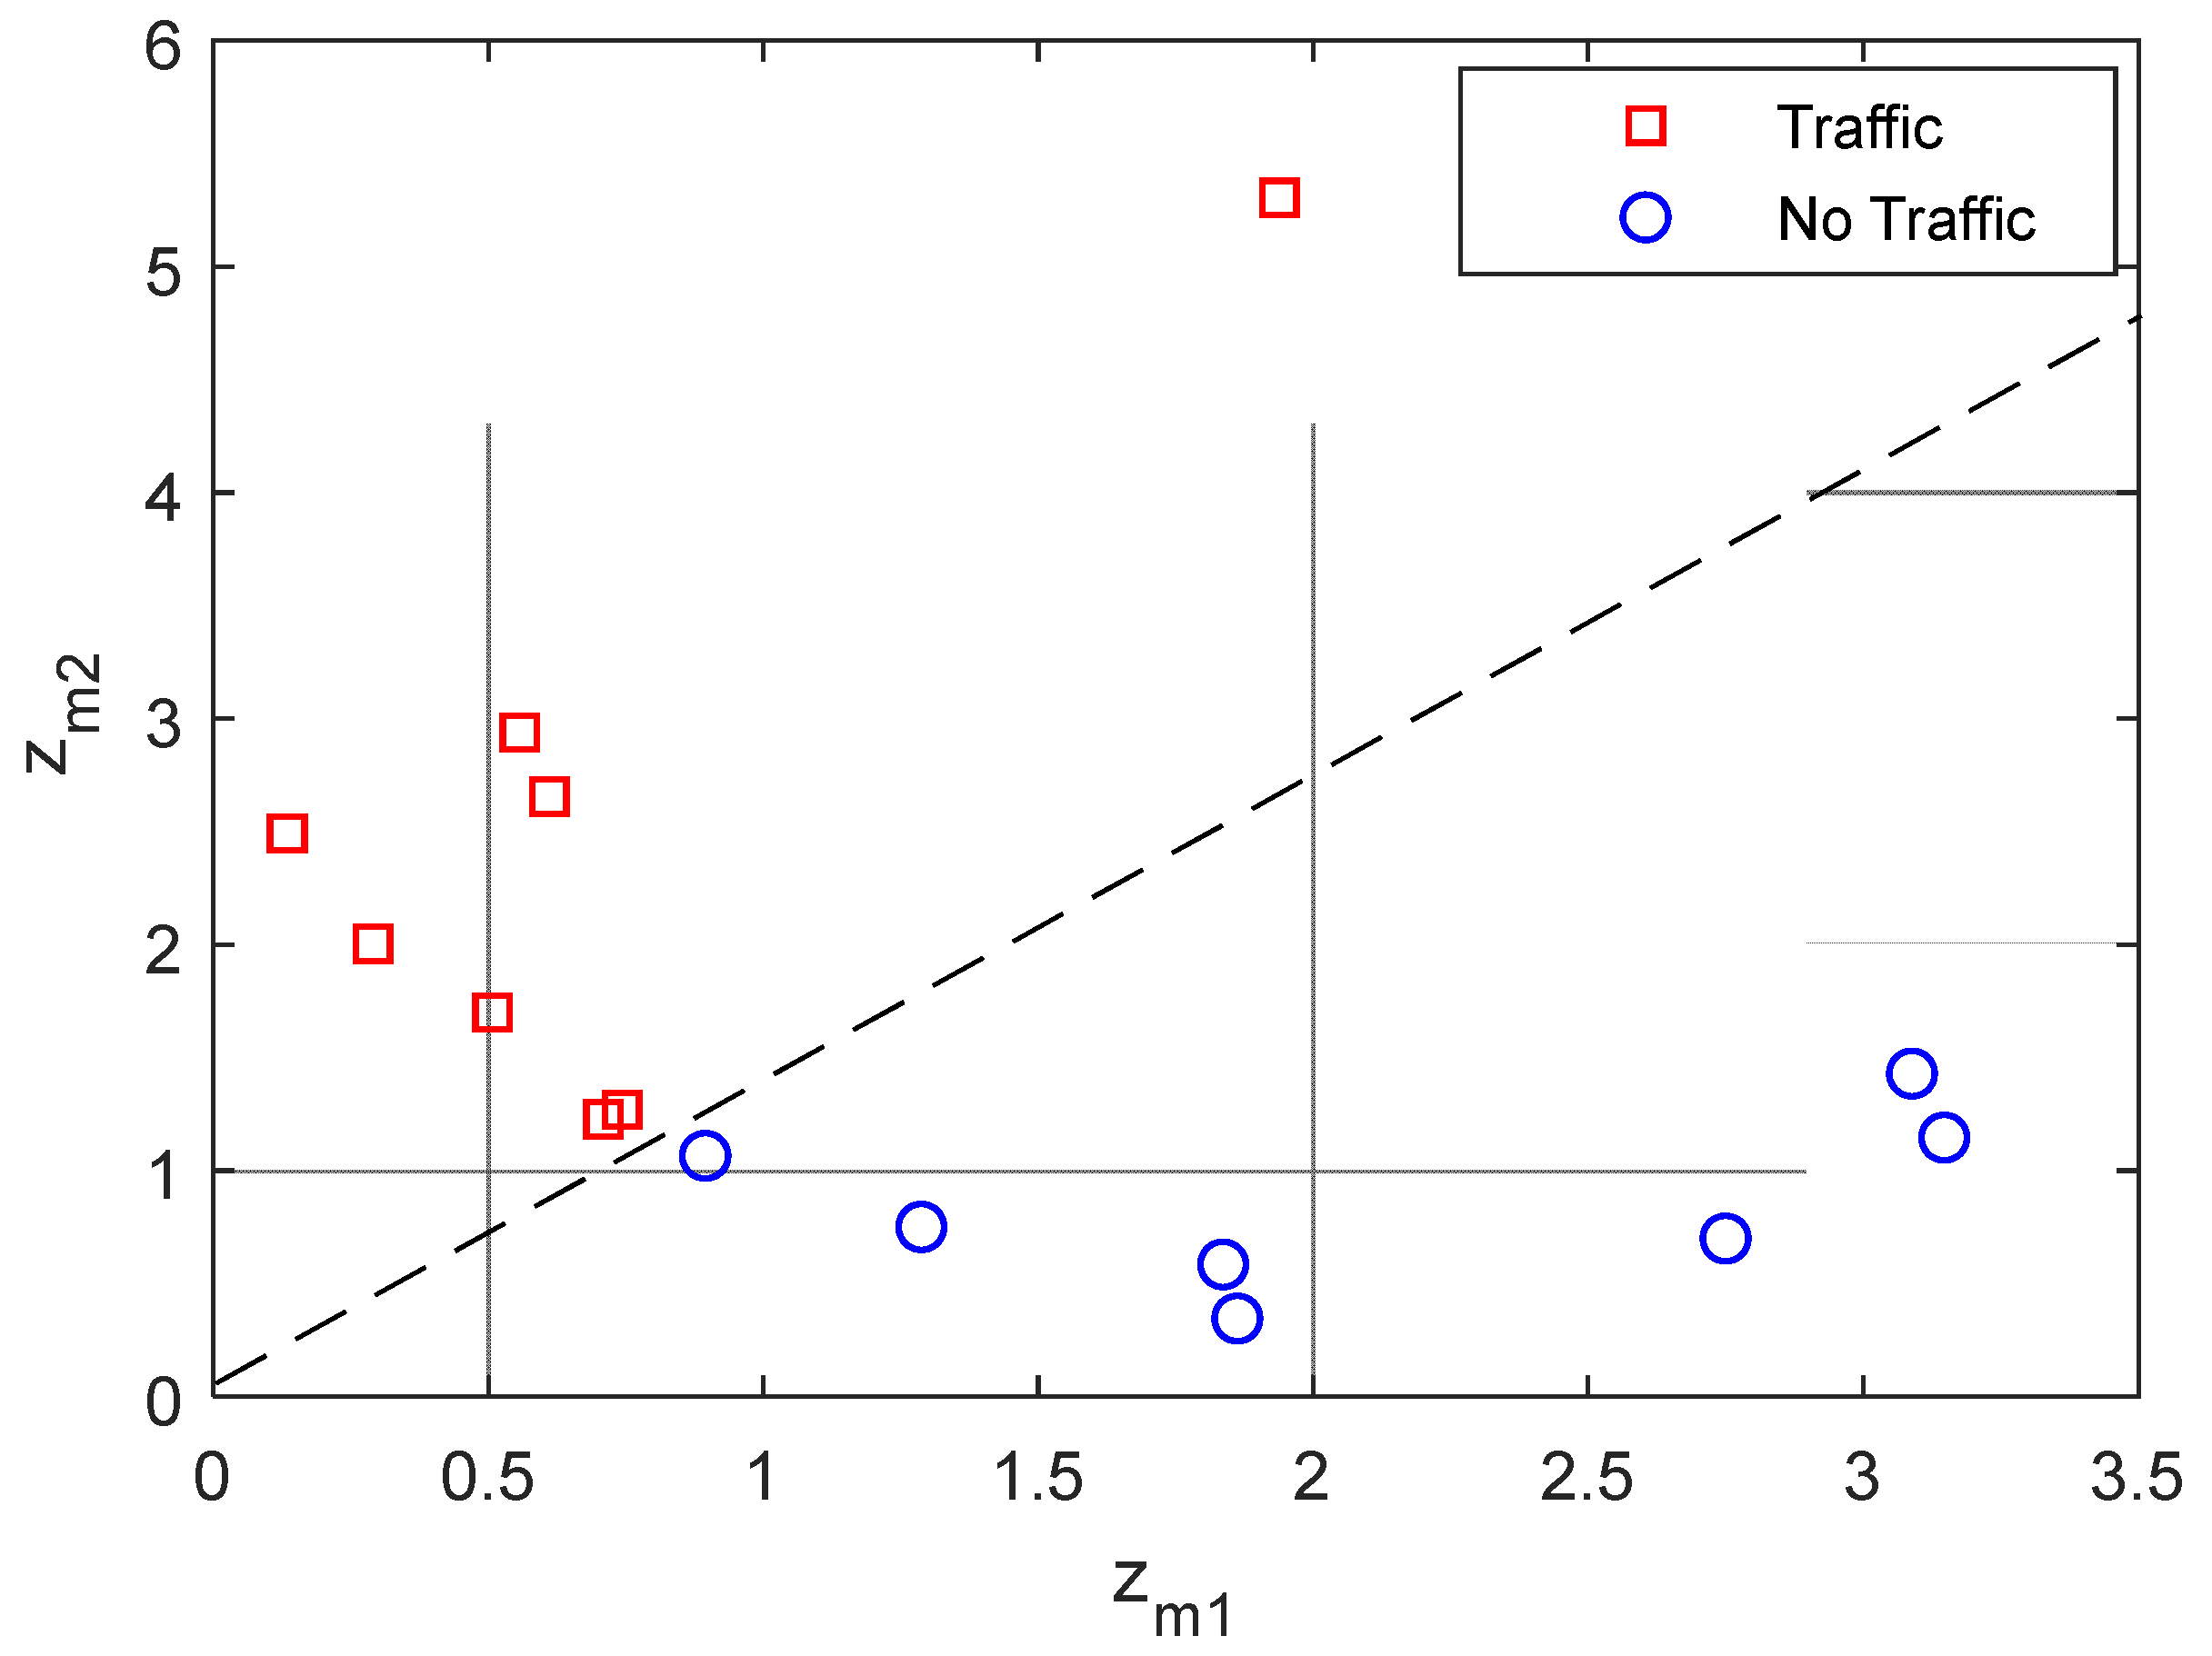
where X ¯ ( f k ) is the FFT magnitude at a frequency f k for the dataset under evaluation, i.e., the testing batch; ( μ 1 ( f k ) ,   σ 1 ( f k ) ) are the mean and SD for the FFT magnitudes at frequency f k for all the traffic datasets in the training batch; and ( μ 2 ( f k ) ,   σ 2 ( f k ) ) are the mean and SD for the FFT magnitudes at f k for all the no-traffic datasets in the training batch. At f k = 1200 ,   1500 ,   2000 ,   2500 ,   3000 ,   and   3500   Hz , the z-scores ( z m 1 , z m 2 ) shown in Figure 9 were obtained. The traffic groups are separated by an inclined dashed line. The multiple-frequency method achieved 100% accuracy for all the datasets, as well as better precision for the traffic datasets.

4. Conclusions

In this paper, we introduced a traffic monitoring concept that employs the roadway’s vibration for monitoring beyond-line-of-sight traffic activities. The roadway’s vibration was measured by an LDV mounted on a stationary test vehicle. The preliminary experiments involved 15 datasets for 8 traffic and 7 no-traffic conditions. The vibration measurements were analyzed in the time and frequency domains to find reliable classification features for different traffic conditions. Time domain data were mainly influenced by the low-frequency vibration from the vehicle suspension assembly. The frequency domain features above 1200 Hz showed quite feasible features for detecting traffic conditions. Two classification methods are presented in this paper based on the frequency magnitudes for measurements above 1200 Hz. The first method, based on a single frequency (5000 Hz), allowed all the datasets to be correctly classified, except a single case. For the second method, six frequencies (between 1200 and 3500 Hz) were used; it was able to correctly classify all the datasets. The future work will involve a wide variety of traffic conditions on different vehicle types and road conditions.

Author Contributions

Signal processing and traffic classification methods, M.A.A.I.; preparation and implementation of field tests, M.A.A.I., M.S. and M.M.; results analysis and review, M.A.A.I., M.S., C.R., M.K. and M.M.; funding acquisition, M.K. All authors have read and agreed to the published version of the manuscript.

Funding

This research was co-funded by DLR (German Aerospace Center) and Ibeo Automotive Systems GmbH within VibroEye project.

Data Availability Statement

Not applicable.

Conflicts of Interest

The authors declare that there is no conflict of interest.

References

  1. Unsignalized Intersection Crashes. Available online: https://safety.fhwa.dot.gov/intersection/about (accessed on 20 May 2022).
  2. Intersection Safety: A Manual for Local Rural Road Owners. Available online: https://safety.fhwa.dot.gov/local_rural/training/fhwasa1108/fhwasa1108.pdf (accessed on 20 May 2022).
  3. Li, Y.; Ibanez-Guzman, J. Lidar for autonomous driving: The principles, challenges, and trends for automotive lidar and perception systems. IEEE Signal Process. Mag. 2021, 37, 50–61. [Google Scholar] [CrossRef]
  4. Hayashi, S.; Saho, K.; Isobe, D.; Masugi, M. Pedestrian detection in blind area and motion classification based on rush-out risk using micro-doppler radar. Sensors 2021, 21, 3388. [Google Scholar] [CrossRef] [PubMed]
  5. Hostettler, R. Traffic counting using measurements of road surface vibrations. M.Sc. Thesis, Luleå University of Technology, Luleå, Seweden, 2009. [Google Scholar]
  6. Ye, Z.; Wang, L.; Xu, W.; Gao, Z.; Yan, G. Monitoring traffic information with a developed acceleration sensing node. Sensors 2017, 17, 2817–2833. [Google Scholar] [CrossRef] [PubMed] [Green Version]
  7. Ma, W.; Xing, D.; McKee, A.; Bajwa, R.; Flores, C.; Fuller, B.; Varaiya, P. A wireless accelerometer-based automatic vehicle classification prototype system. IEEE Trans. Intell. Transp. Syst. 2013, 15, 104–111. [Google Scholar] [CrossRef]
  8. Ling, S.; Yu, F.; Sun, D.; Sun, G.; Xu, L. A comprehensive review of tire-pavement noise: Generation mechanism, measurement methods, and quiet asphalt pavement. J. Clean. Prod. 2021, 287, 125056. [Google Scholar] [CrossRef]
  9. Ismail, M.A.A.; Mahmod, M.; Rembe, C. Verfahren und Vorrichtung zur Verkehrsüberwachung Mittels Fahrbahnschwingungen und Laservibrometrie. Deutsche Patent DE102020124526, 21 September 2020. [Google Scholar]
  10. Castellini, P.; Martarelli, M.; Tomasini, E.P. Laser Doppler Vibrometry: Development of advanced solutions answering to technology’s needs. Mech. Syst. Signal Process. 2002, 20, 1265–1285. [Google Scholar] [CrossRef]
  11. QTec®—Reinventing Vibrometry. Available online: https://www.polytec.com/eu/vibrometry/technology/qtec (accessed on 10 February 2022).
  12. Sun, L.; Kennedy, T.W. Spectral analysis and parametric study of stochastic pavement loads. J. Eng. Mech. 2002, 128, 318–327. [Google Scholar] [CrossRef]
  13. Wu, B.; Saxena, A.; Khawaja, T.S.; Patrick, R.; Vachtsevanos, G.; Sparis, P. An approach to fault diagnosis of helicopter planetary gears. In Proceedings of the AUTOTESTCON, San Antonio, TX, USA, 20–23 September 2004; pp. 475–481. [Google Scholar]
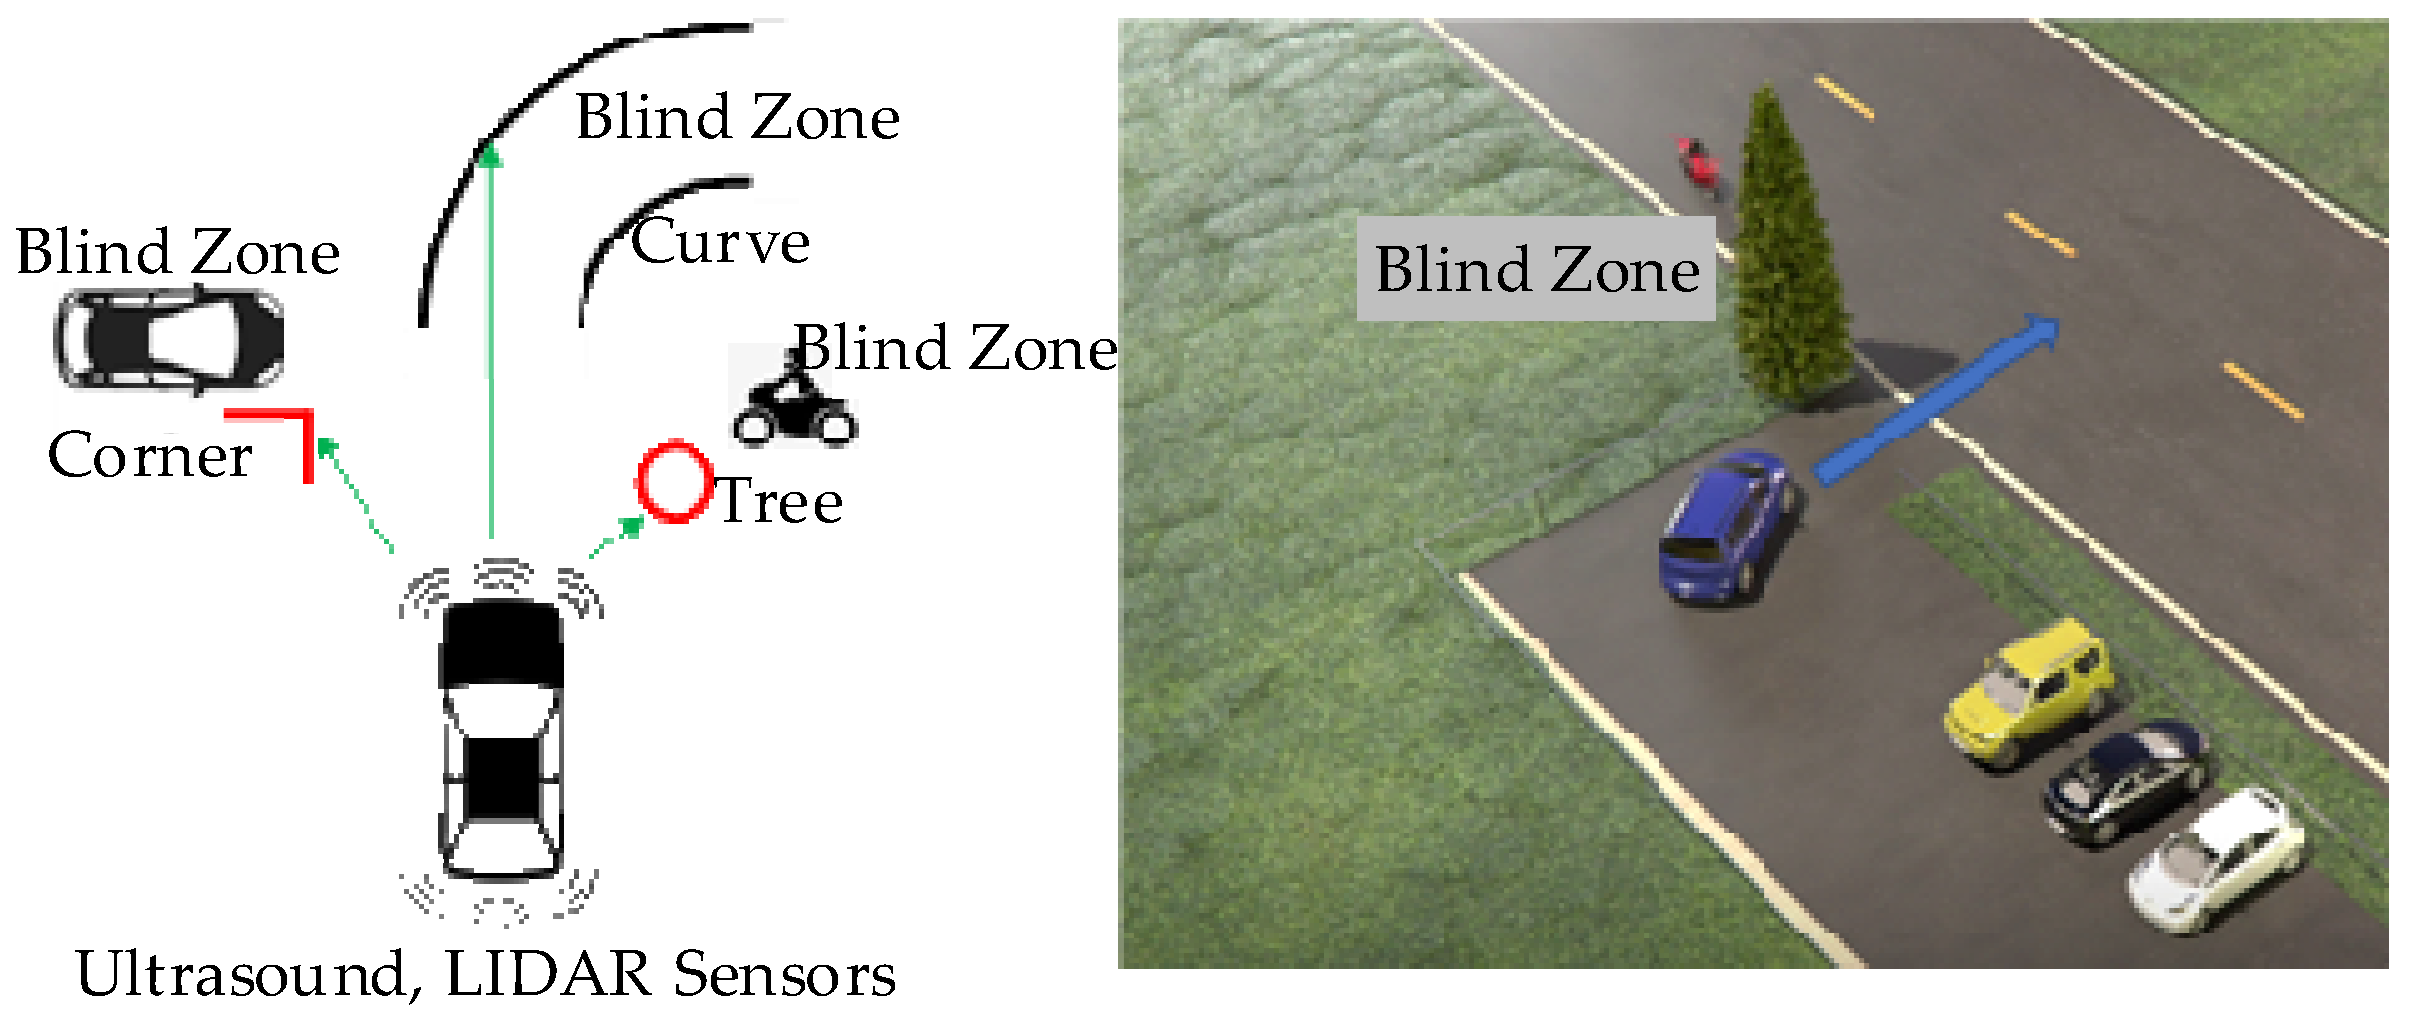
Figure 1. Example of a traffic hazard due to restricted visibility at a parking area (right) and the limitation of the existing sensing technologies due to obstacles (left).
Remotesensing 14 06034 g001
Figure 2. The concept of using portable laser vibrometers for traffic monitoring beyond obstacles.
Remotesensing 14 06034 g002
Figure 3. Setup for measuring traffic-induced vibrations using laser Doppler vibrometer (LDV) mounted on the bike rack of a test vehicle and a data acquisition system (DAQ).
Remotesensing 14 06034 g003
Figure 4. The test arrangement for monitoring public traffic activities.
Remotesensing 14 06034 g004
Figure 5. Examples of time waveforms for the four traffic and no-traffic datasets in the present study.
Remotesensing 14 06034 g005
Figure 6. Examples of fast Fourier transform spectra (low frequency range) for traffic and no-traffic conditions. The spectra in Figure 6 are smoothed by a moving average filter of 6 Hz resolution.
Remotesensing 14 06034 g006
Figure 7. Examples of fast Fourier transform spectra for the traffic and no-traffic conditions in the present study. At above 1200 Hz, there was no overlap (i.e., a nearly steady boundary) between the different traffic conditions. The spectra in Figure 7 are smoothed by a moving average filter of 6 Hz resolution.
Remotesensing 14 06034 g007
Figure 8. Traffic classification using a single frequency of 5000 Hz.
Remotesensing 14 06034 g008
Figure 9. Traffic classification using multiple frequencies (1200, 1500, 2000, 2500, 3000, and 3500 Hz).
Remotesensing 14 06034 g009
Table 1. Time domain statistics for the traffic and no-traffic vibration datasets.
IDVehicleMaximum
(×10−4 m/s)
Minimum
(×10−4 m/s)
RMS
(×10−4 m/s)
Variance
(×10−8)
Traffic 1A medium car2.03−2.170.560.32
Traffic 2A medium car1.40−1.740.320.10
Traffic 3Two medium cars0.45−0.290.100.01
Traffic 4A medium car2.94−2.511.041.09
Traffic 5A medium car1.34−1.720.420.18
Traffic 6Two medium cars6.12−5.081.632.68
Traffic 7A medium car1.24−1.020.290.08
Traffic 8A heavy car1.65−1.810.400.16
No traffic 1-1.36−1.110.270.07
No traffic 2-1.62−2.110.600.36
No traffic 3-3.27−3.990.900.81
No traffic 4-0.52−0.310.100.01
No traffic 5-2.02−2.080.710.50
No traffic 6-1.28−1.300.360.13
No traffic 7 3.21−3.810.860.74
Publisher’s Note: MDPI stays neutral with regard to jurisdictional claims in published maps and institutional affiliations.