Article

Snowfall Microphysics Characterized by PARSIVEL Disdrometer Observations in Beijing from 2020 to 2022

1
Key Laboratory of Middle Atmosphere and Global Environment Observation (LAGEO), Institute of Atmospheric Physics, Chinese Academy of Sciences, Beijing 100029, China
2
University of Chinese Academy of Sciences, Beijing 100049, China
3
Beijing Weather Modification Center, Beijing 100089, China
4
Beijing Key Laboratory of Cloud, Precipitation and Atmospheric Water Resources (LCPW), Beijing Meteorological Bureau, Beijing 100089, China
*
Author to whom correspondence should be addressed.
Remote Sens. 2022, 14(23), 6025; https://doi.org/10.3390/rs14236025
Submission received: 30 September 2022 / Revised: 12 November 2022 / Accepted: 21 November 2022 / Published: 28 November 2022
(This article belongs to the Special Issue Synergetic Remote Sensing of Clouds and Precipitation)

Abstract

:
Accurate snowfall forecasting and quantitative snowfall estimation remain challenging due to the complexity and variability of snow microphysical properties. In this paper, the microphysical characteristics of snowfall in the Yanqing mountainous area of Beijing are investigated by using a Particle Size and Velocity (PARSIVEL) disdrometer. Results show that the high snowfall intensity process has large particle-size distribution (PSD) peak concentration, but the distribution of its spectrum width is much smaller than that of moderate or low snowfall intensity. When the snowfall intensity is high, the corresponding D m value is smaller and the N w value is larger. Comparison between the fitted μ Λ relationship and the relationships of different locations show that there are regional differences. Based on dry snow samples, the Z e S R relationship fitted in this paper is more consistent with the Z e S R relationship of dry snow in Nanjing, China. The fitted ρ s D m relationship of dry snow is close to the relationship in Pyeongchang, Republic of Korea, but the relationship of wet snow shows greatly difference. At last, the paper analyzes the statistics on velocity and diameter distribution of snow particles according to different snowfall intensities.

1. Introduction

Snow is the main form of winter precipitation in the Northern Hemisphere [1,2]. The improvement of snowfall forecast services requires finer meteorological detection. The complex and changeable microphysical characteristics of snowfall are comprehensively affected by snowfall pattern, terrain, region and other factors. Therefore, a series of comprehensive observation experiments carried out for winter snowfall include the campaign of BAECC in Finland, the campaign of OLYMPEX in America, the TOSCA project, and the ARM West Antarctic Radiation Experiment, etc. [3,4,5,6,7,8,9,10]. The microphysical characteristics of snowfall mainly include snow PSD, falling velocity, particle diameter, shape, etc. Li et al. [11] used the combination of ground-based snowfall and dual-polarization radar measurements to quantify a connection between snowflake shape and rime mass fraction. Recent studies have obtained high temporal and spatial resolution observations from dual-polarization and multifrequency radar to advance the understanding of snow and ice microphysical processes in the cloud [12,13,14,15,16,17,18,19,20]. Therefore, in-depth understanding of the snowfall formation and evolution mechanism from the perspective of microphysics plays an important role in improving the microphysical parameterization of numerical weather prediction [21,22,23,24,25].
The study on the microphysical process of snowfall is mostly based on the analysis of snow PSD. Similar to the numerous studies of raindrop size distribution (DSD) worldwide [26,27,28,29,30,31,32,33,34,35,36,37,38,39,40,41,42,43], the study of snowflake PSD is of great significance for remote sensing and microphysical characterization of snowfall. Disdrometers are devices designed to measure the PSD of falling hydrometeors. Recent disdrometers are more based on optical principles. For example, the particle size and velocity disdrometers PARSIVEL and PARSIVEL2 by OTT Hydromet, and the laser precipitation monitor (LPM) by Thies Clima [44]. An improvement over laser disdrometers is the two-dimensional video disdrometer (2DVD, Joanneum Research) [31,45]. Brandes et al. [46] observed the particle size distribution of snowfall in eastern Colorado, USA, based on the ground two-dimensional video disdrometer (2DVD) and inverted the relationship between the snow density and the particle volume-weighted diameter. Battaglia et al. [47] used one 2DVD and two PARSIVEL2 laser disdrometers to carry out a comparative observation of two kinds of disdrometer and to analyze the performance of the PARSIVEL2 disdrometer in measuring snow particles. Zhang et al. [48] used 2DVD winter precipitation observation data to calculate the radar parameters and compared them with the radar measurements at the KOUN station. Huang et al. [49] deduced the relationship between the average density and the particle size as well as the relationship between the radar equivalent reflectivity factor Z e and the snowfall rate S R by using the falling velocity and PSD measured by the disdrometer. Lee et al. [50] carried out the snow particle classification based on the particle-falling velocity and diameter data measured for winter snowfall by 2DVD. Wen et al. [51] carried out the DSD observation of summer and winter precipitations in Beijing urban areas and estimated the quantitative precipitation by the micro rain radar (MRR). Jia et al. [52] compared and analyzed the PSD and falling velocity characteristics of supercooled raindrops, graupel particles, snowflakes and mixed precipitation in Haituo Mountain, Beijing in winter by combining the data from the disdrometer, ground microscope photography and cloud radar. Yu et al. [53] analyzed the microphysical characteristics of snowfall in Pyeongchang, South Korea using three-year snow PSD observed by the PARSIVEL2 disdrometer in this area. Pu et al. [54] classified winter precipitation in Nanjing from 2014 to 2019 by rain, graupel, wet snow and dry snow using the PARSIVEL disdrometer and analyzed the microphysical characteristics of various particles. Tao et al. [55] conducted a study on snow particle size distribution and snow estimation in the Nanjing area based on the ground 2DVD and the weather radar data. However, the microphysical properties of snowfall in North China remain largely unknown due to a lack of in situ measurements. Moreover, studies performing microphysical properties and quantitative estimation of snowfall remain relatively rare, especially in North China.
The above studies on the snowfall in specific regions indicate that the microphysical characteristics of snowfall in different climatic regions have different manifestations. In order to quantitatively describe the microphysical characteristics of snowfall, the Beijing Weather Modification Center, the Institute of Atmospheric Physics, the Chinese Academy of Sciences, and other organizations carried out joint snowfall observation experiments in the Yanqing mountainous area of Beijing from 2020 to 2022.
In this paper, the observed disdrometer data are used to analyze the microphysical characteristics of the snowfall in Beijing mountainous areas during the winter of 2020–2022, to further improve the parameterization and estimation of winter precipitation in this area. The rest of this manuscript is organized as follows. Section 2 introduces the main instruments and data processing methods used in this paper. Section 3 statistically analyzes the microphysical characteristics of the snowfall. The discussion and summary are provided in Section 4 and Section 5.

2. Data and Methods

2.1. Observation Experiment and Instrumentation

From October 2020 to March 2021 and from November 2021 to March 2022, the joint winter snowfall observation experiments in Beijing mountainous areas were carried out at Zhangshanying Station in Yanqing, Beijing. Figure 1a shows the location of the observation station (the red point in the map), with latitude and longitude of 40.49N and 115.86E. Snowfall observation equipment mainly includes the PARSIVEL2 disdrometer, triple-frequency (X/Ka/W) weather radar and a weighing rain gauge.
The PARSIVEL2 disdrometer was used for ground snow PSD observation, and its measuring principles are as follows: The transmitter transmits a horizontal laser beam (with wavelength of 780 nm, beam length × width of 180 mm × 30 mm, and an effective measurement surface of 54 cm2). When a particle passes through the sampling space, the width and passing time of the obstruction are recorded, and the size and falling velocity of the particle are calculated accordingly. The instrument has 32 precipitation size classes, ranging from 0.2 mm to 25 mm for solid precipitation, and 32 velocity classes, ranging from 0.2 m/s to 20 m/s. The measured particles are subdivided into size and velocity classes in a two-dimensional field, wherein there are 32 different size and velocity classes, resulting in a total of 32 × 32 = 1024 classes. Considering the signal-to-noise ratio of the instrument, the data of the first two particle size channels must be excluded.
The measurements and status values are output from the PARSIVEL2 disdrometer in the form of a telegram. The disdrometer takes the number of particles measured per minute as samples, calculates and outputs particle concentration N ( D ) , precipitation intensity R (in mm/h of an equivalent amount of water), precipitation (mm), radar reflectivity factor (dBZ) and other parameters. The rain rate and snowfall measurement accuracies of the disdrometer were ±5% and ±20%, respectively [56]. The type of precipitation is based on the number of particles within the measurement range, and the precipitation code is determined from the precipitation intensity. Specifically, the definitions of the precipitation code are listed according to the METAR/SPECI w′w′ Table 4678 [56]: drizzle (−DZ, DZ, +DZ), drizzle with rain (−RADZ, RADZ, +RADZ), rain (−RA, RA, +RA), rain, drizzle with snow (−RASN, RASN, +RASN), snow −SN, SN, +SN), snow grains (−SG, SG, +SG), ice pellets (−GS, GS, +GS) and hail (GR). The snowfall is graded by the snowfall rate (SR); for example, it is light (−SN) when SR ≤ 0.5 mm/h, it is moderate (SN) when 0.5 < SR < 2.5 mm/h, and it is heavy (+SN) when SR ≥ 2.5 mm/h.
The weighing rain gauge was installed close to the PARSIVEL2 disdrometer at the top of the cabin. The gauge has an orifice diameter of 20 cm and records the liquid-equivalent accumulated height of snow at 1-min intervals with 0.1 mm resolution.

2.2. Data Set

During the two years of winter observation, data from a total of eight snowfall events were obtained at a sampling interval of one minute. The number of samples obtained according to the categorization of precipitation type by precipitation codes is shown in Table 1.
Analyzing the characteristics of weather systems and disdrometer data of eight snowfalls observed in 2021 and 2022 yields a total of five snowfalls in 2021, three of them (corresponding to cases 3, 4 and 5) being rain-snow transition events.
The three snowfalls observed during the observation period in 2022 were pure snowfall cases, and the cumulative snowfall of the two processes on 13 February and 18 March in 2022 reached the magnitude of heavy snow.

2.3. Calculation of Microphysical Properties of Snowfall Particles

2.3.1. Snow PSD

Snow PSD is the distribution of snowfall particles of different sizes in a unit volume along with the diameter. Through the analysis of PSD, not only can the microphysical characteristics of snowfall particles be obtained, but also the development and evolution of PSD during the snowfall process can be understood.
Based on the observed snowfall data, the normalized PSD can be obtained by accumulating the particles in each range and considering the actual sampling space size and the particle spacing, namely:
N ( D i ) = j = 1 32 C i j V j · A · t · Δ D i
where D i (mm) and N ( D i ) (mm−1·m−3) are the volume equivalent diameter and mean number concentration of particles in size class i ; t (s) is the sampling interval time ( t = 60 s in this paper); C i j is the total number of particles corresponding to the size class i and the speed class j during the sampling time; V j (m/s) is the falling velocity of the velocity class j ; A (mm2) is the effective sampling area of the instrument; and Δ D i (mm) is the particle size class width between i and i + 1 .
For the ease of application, the PSD is usually represented by functional distribution models, such as exponential distribution and Gamma distribution, etc. The three-parameter Gamma distribution has been widely used to characterize the size distribution of raindrops, ice particles and cloud droplets and snow particles [34,48,55], as follows:
N ( D ) = N 0   D μ   exp ( Λ D )
where D (mm) is the equivalent volume diameter and N 0 (mm−μ−1 m−3), μ (dimensionless), and Λ (mm−1) are the intercept, shape, and slope parameters, respectively.
The moment method is commonly used in radar meteorology to solve the parameters of the particle distribution, because the radar observed value is similar to the moment of the DSD spectrum. The nth moment of the DSD spectrum, namely the integral of the product of nth power of particle diameter D and particle number concentration N ( D ) , can be expressed by:
M n = i = 1 32 D i n N ( D i ) Δ D i
The total number concentration of particles N t (m−3) is given by:
N t = 0 D m a x N ( D ) d D = M 0
which is the zeroth moment of the DSD spectrum.
The M246 (the second moment M 2 , fourth moment M 4 and sixth moment M 6 of the observed PSD) truncated-moment method is recommended to calculate the three parameters of Gamma distribution [37]. The specific calculation process is as follows:
η = M 4 2 M 2 M 6
μ = ( 7 11 η ) ( η 2 + 14 η + 1 ) 0.5 2 ( η 1 )
Λ = [ M 2 M 4 ( μ + 3 ) ( μ + 4 ) ] 0.5
N 0 = M 2 Λ ( μ + 3 )   Γ ( μ + 3 )
The characteristic diameter of particles is usually expressed by the median volume diameter D 0 (mm) and the mass-weighted diameter D m (mm). The D 0 is defined such that particles less than D 0 contribute to half the total water content ( W ). Moreover, W is calculated from the third moment as:
W = π 6 ρ w 0 D m a x D 3 N ( D ) d D
D 0 is expressed by
π 6 ρ w 0 D 0 D 3 N ( D ) d D = 1 2 π 6 ρ w 0 D m a x D 3 N ( D ) d D
D m is expressed by
D m = 0 D m a x D 4 N ( D ) d D 0 D m a x D 3 N ( D ) d D
D m is closely related to D 0 , for gamma DSD,
Λ   D 0 = 3.67 + μ
Λ   D m = 4 + μ
In addition, the normalized intercept parameter N w (mm−1 m−3) can be computed from W and D m :
N w = 4 4 π ρ w ( 10 3 W D m 4 ) = 4 4 0 D m a x D 3 N ( D ) d D 6 D m 4
The normalized gamma distribution of DSD is expressed as the function of N w , D m , and μ of the gamma DSD:
N ( D ) = N w   f ( μ ) ( D D m ) μ   exp [ ( 4 + μ ) D D m ]
with
  f ( μ ) = 6 4 4   ( 4 + μ ) μ + 4 Γ ( μ + 4 )

2.3.2. Snow Density and Intensity

The snowfall intensity gives the liquid water equivalent snow rate S R (mm h−1) corresponding to snowfall and is defined as:
S R = 6 π × 10 4 0 D m a x ρ s D 3 v ( D ) N ( D ) d D
where ρ s is the density of snow in g cm−3, v ( D ) is the terminal falling velocity in m s−1, D is the particle size observed by PARSIVEL2 in mm, and S R is in mm h−1.
Snow density was calculated using a gravimetric measurement method, as follows:
ρ s = M s n o w V s n o w
where M s n o w and V s n o w represent the mass and volume of snow collected during the sampling time. The weighing precipitation gauge gave the liquid-equivalent accumulated height   h (mm) of snow. Then, snow mass per unit area can be expressed as:
M s n o w = ρ w   h  
where ρ w (g cm−3) is the density of water.
The snow volume per unit area can be calculated from disdrometer DSD as:
V s n o w = π 6 0 D m a x D 3 v ( D ) N ( D ) d D
In this study, we used D m   to derive the power-law ρ s D m relationship, similar to the method used by Brandes et al. [46].

2.3.3. Quantitative Estimation of Snow

The equivalent radar reflectivity factor Z e of snowflakes can be calculated using the following formula [55,57]:
Z e = | K i | 2 ρ i 2 | K w | 2 D m i n D m a x ρ s 2 D 6 N ( D ) d D
where | K i | is the relative dielectric constant of ice, | K w | is the relative dielectric constant of water, and ρ i ( ρ i = 0.9167 g / c m 3 ) is the density of ice.
Based on measured snow PSD for all the events analyzed in this paper, the Z e S R power exponent relationship [49,55,58,59,60] ( Z e = α S R β )   can be derived from (17) and (21).

3. Results

3.1. Characteristics of Snow PSD

According to the observed data of each sample during the snowfall, the particle number concentration N ( D ) is calculated based on Formula (1). Figure 2a shows the spectrum distribution of the particle corresponding to eight snowfall events, most of which show the characteristics of single peak distribution. Case 8 has the largest particle number concentration peak (4210 mm−1 m−3), and the corresponding diameter is 0.812 mm. The snow PSD width of case 7 is the largest and reaches 19 mm; for cases 6 and 8, both are 13 mm. However, the snow PSD spectrum width of cases 1–5 are less than 10 mm.
In addition, the three types of samples and all the snow samples are averaged according to the snowfall intensity scale (+SN, SN, −SN) to obtain the mean spectrum distribution of the three types of snow particles, as shown in Figure 2b. It can be seen that the diameters D m corresponding to the peak value of the mean spectrum for the three snow types were 0.812 mm, 0.687 mm and 0.312 mm, respectively. When the diameter is less than 3.25 mm, the N ( D ) of +SN particles is significantly higher than the other two types of snow particles, indicating that the snowflake number concentration with small particle size contributes the most to snowfall intensity. The mean PSD of all snow types (black dashed line in the figure) is basically consistent with the mean PSD of the moderate snow type with S R of 0.5–2.5 mm/h.

3.2. Time Series Characteristics of Snow PSD

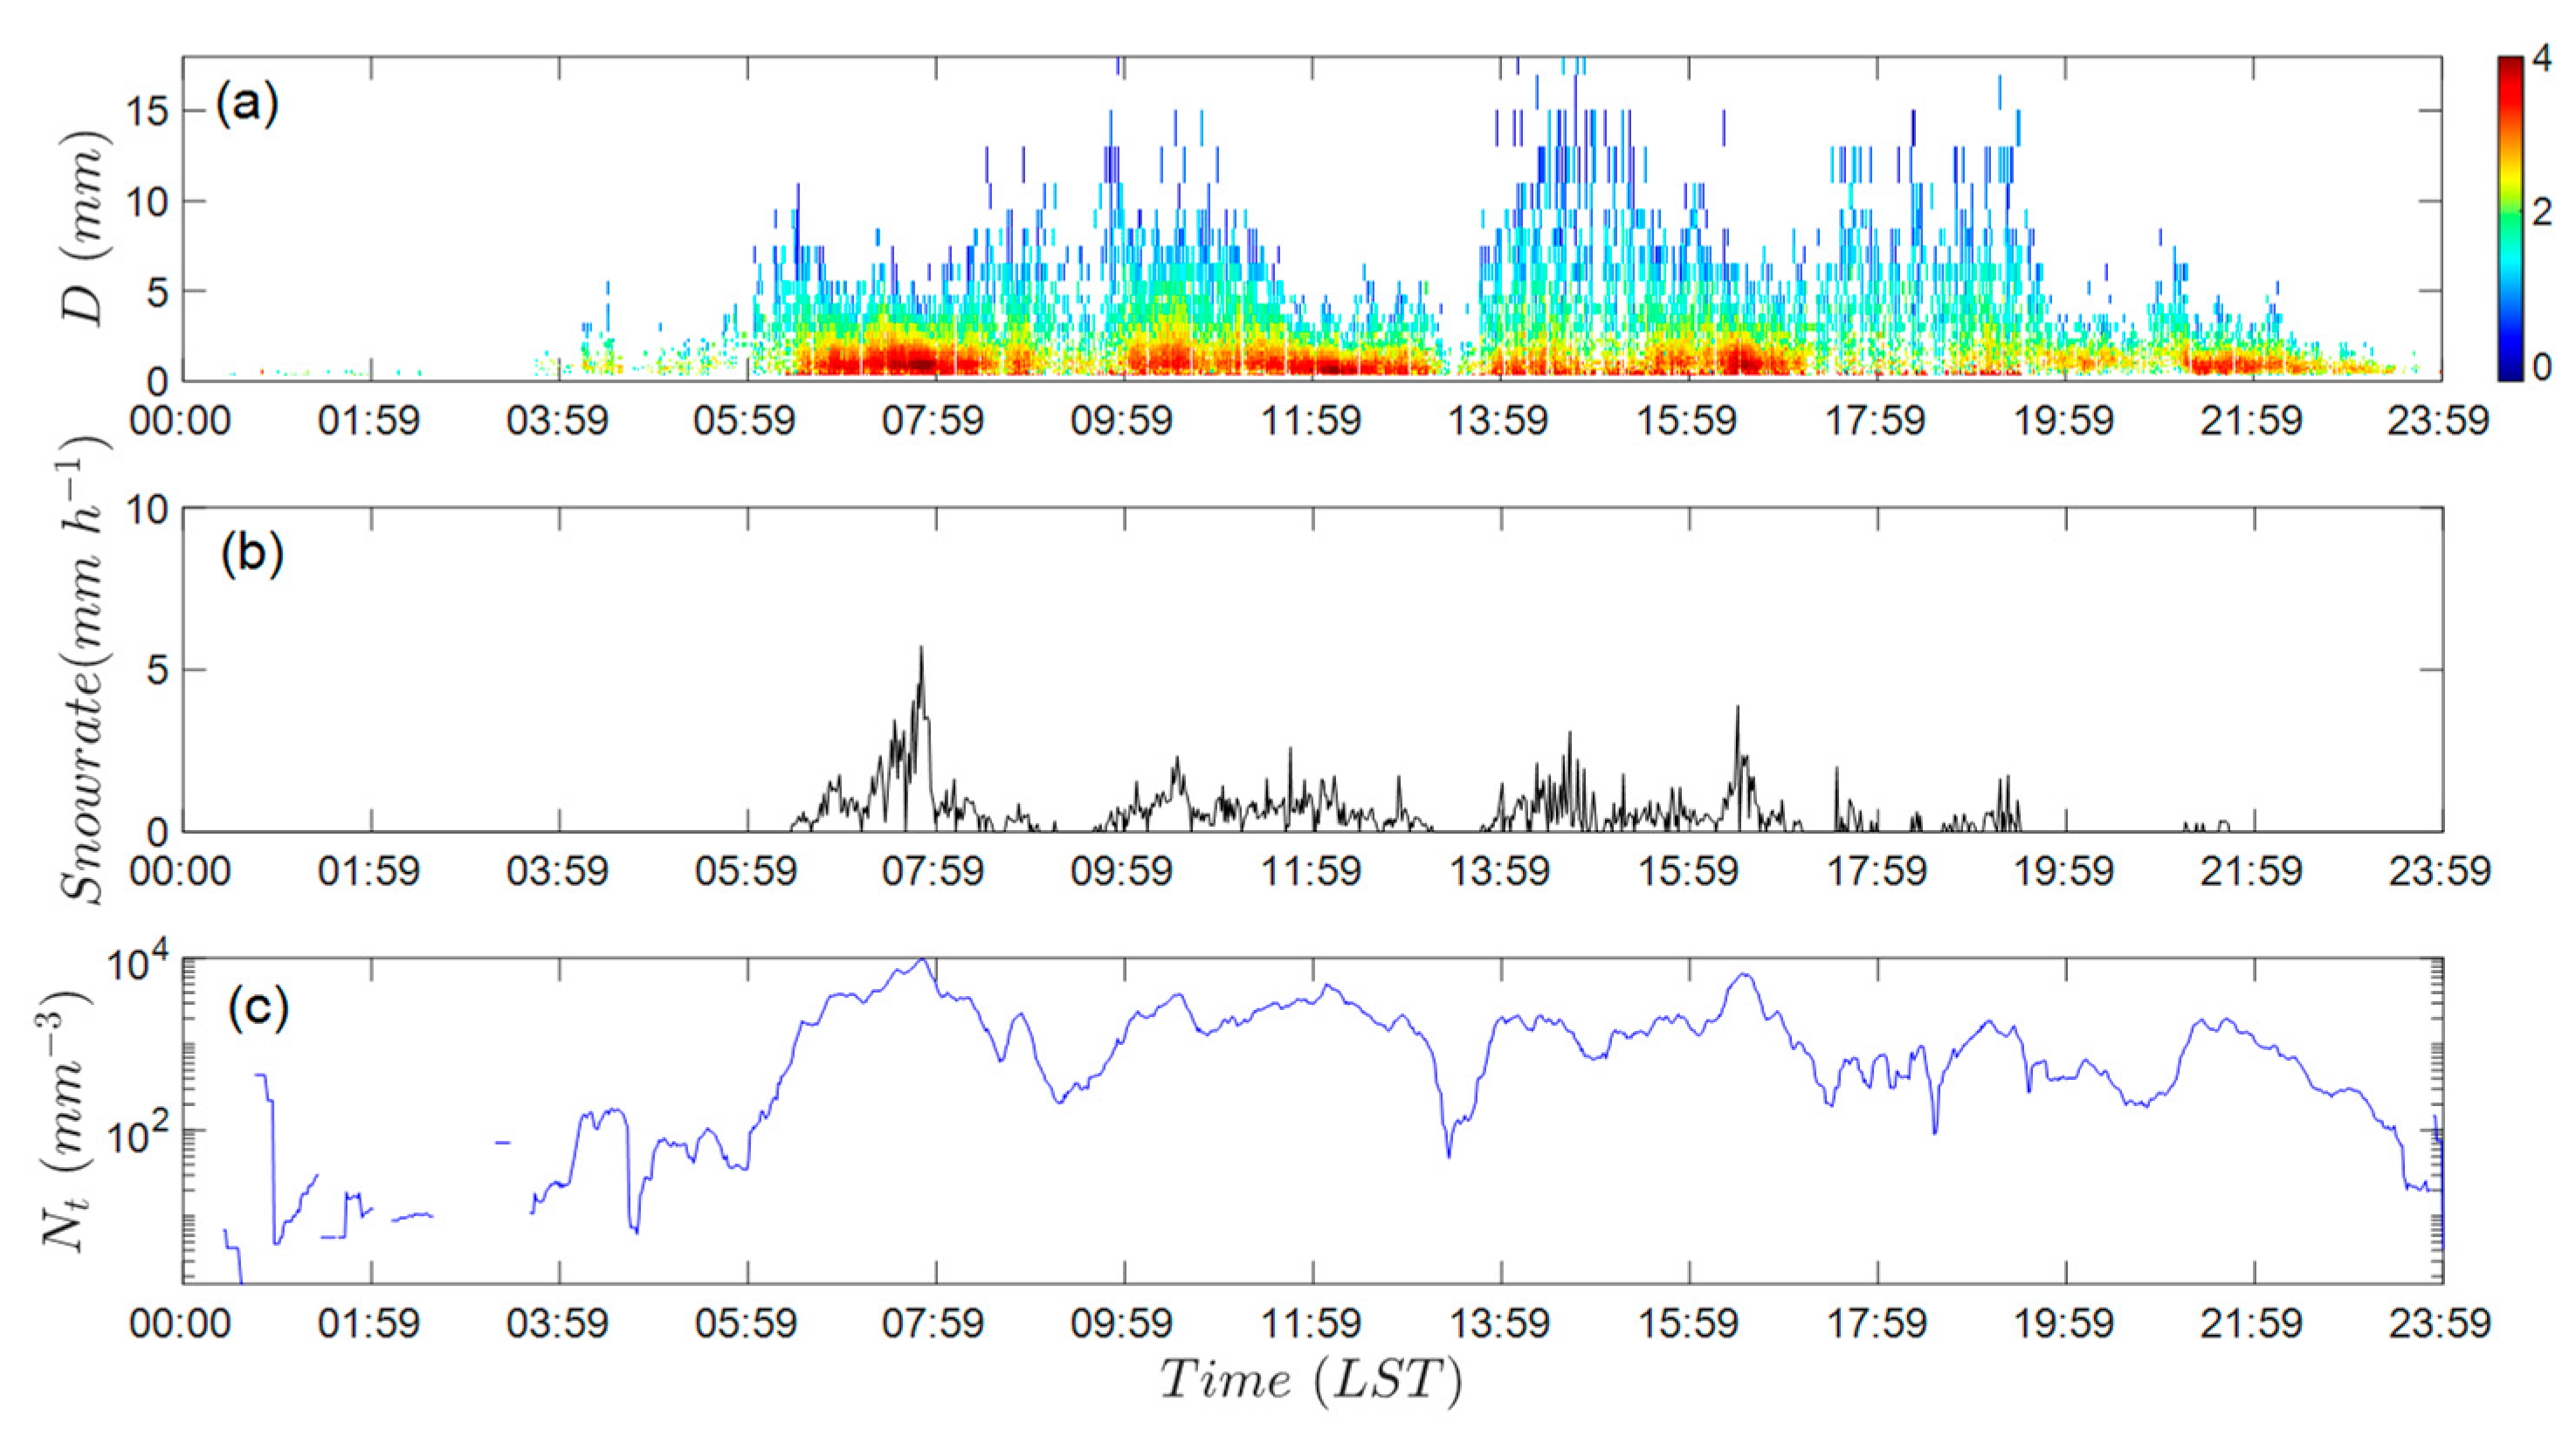
The amounts and sizes of snow particles change with time, which reflects the evolution in microphysical characteristics of snowfall. The two most significant snowfalls among all snowfall cases were 13 February 2022 and 18 March 2022. Figure 3 and Figure 4, respectively, show the time-series distribution of N ( D ) , S R and N t of these two cases. Figure 3a shows that the snowfall lasted from 6 a.m. to 7 p.m. Both the maximum S R shown in Figure 3b and the peak N ( D ) shown in Figure 3c occur around 7:55 am. However, the maximum diameter of snow particles at 7:55 am shown in Figure 3a is small, indicating that the snowfall in this period is also dominated by small-size snow. The maximum diameter of the snowfall in the following period (13:59–15:59) is larger than 15 mm.
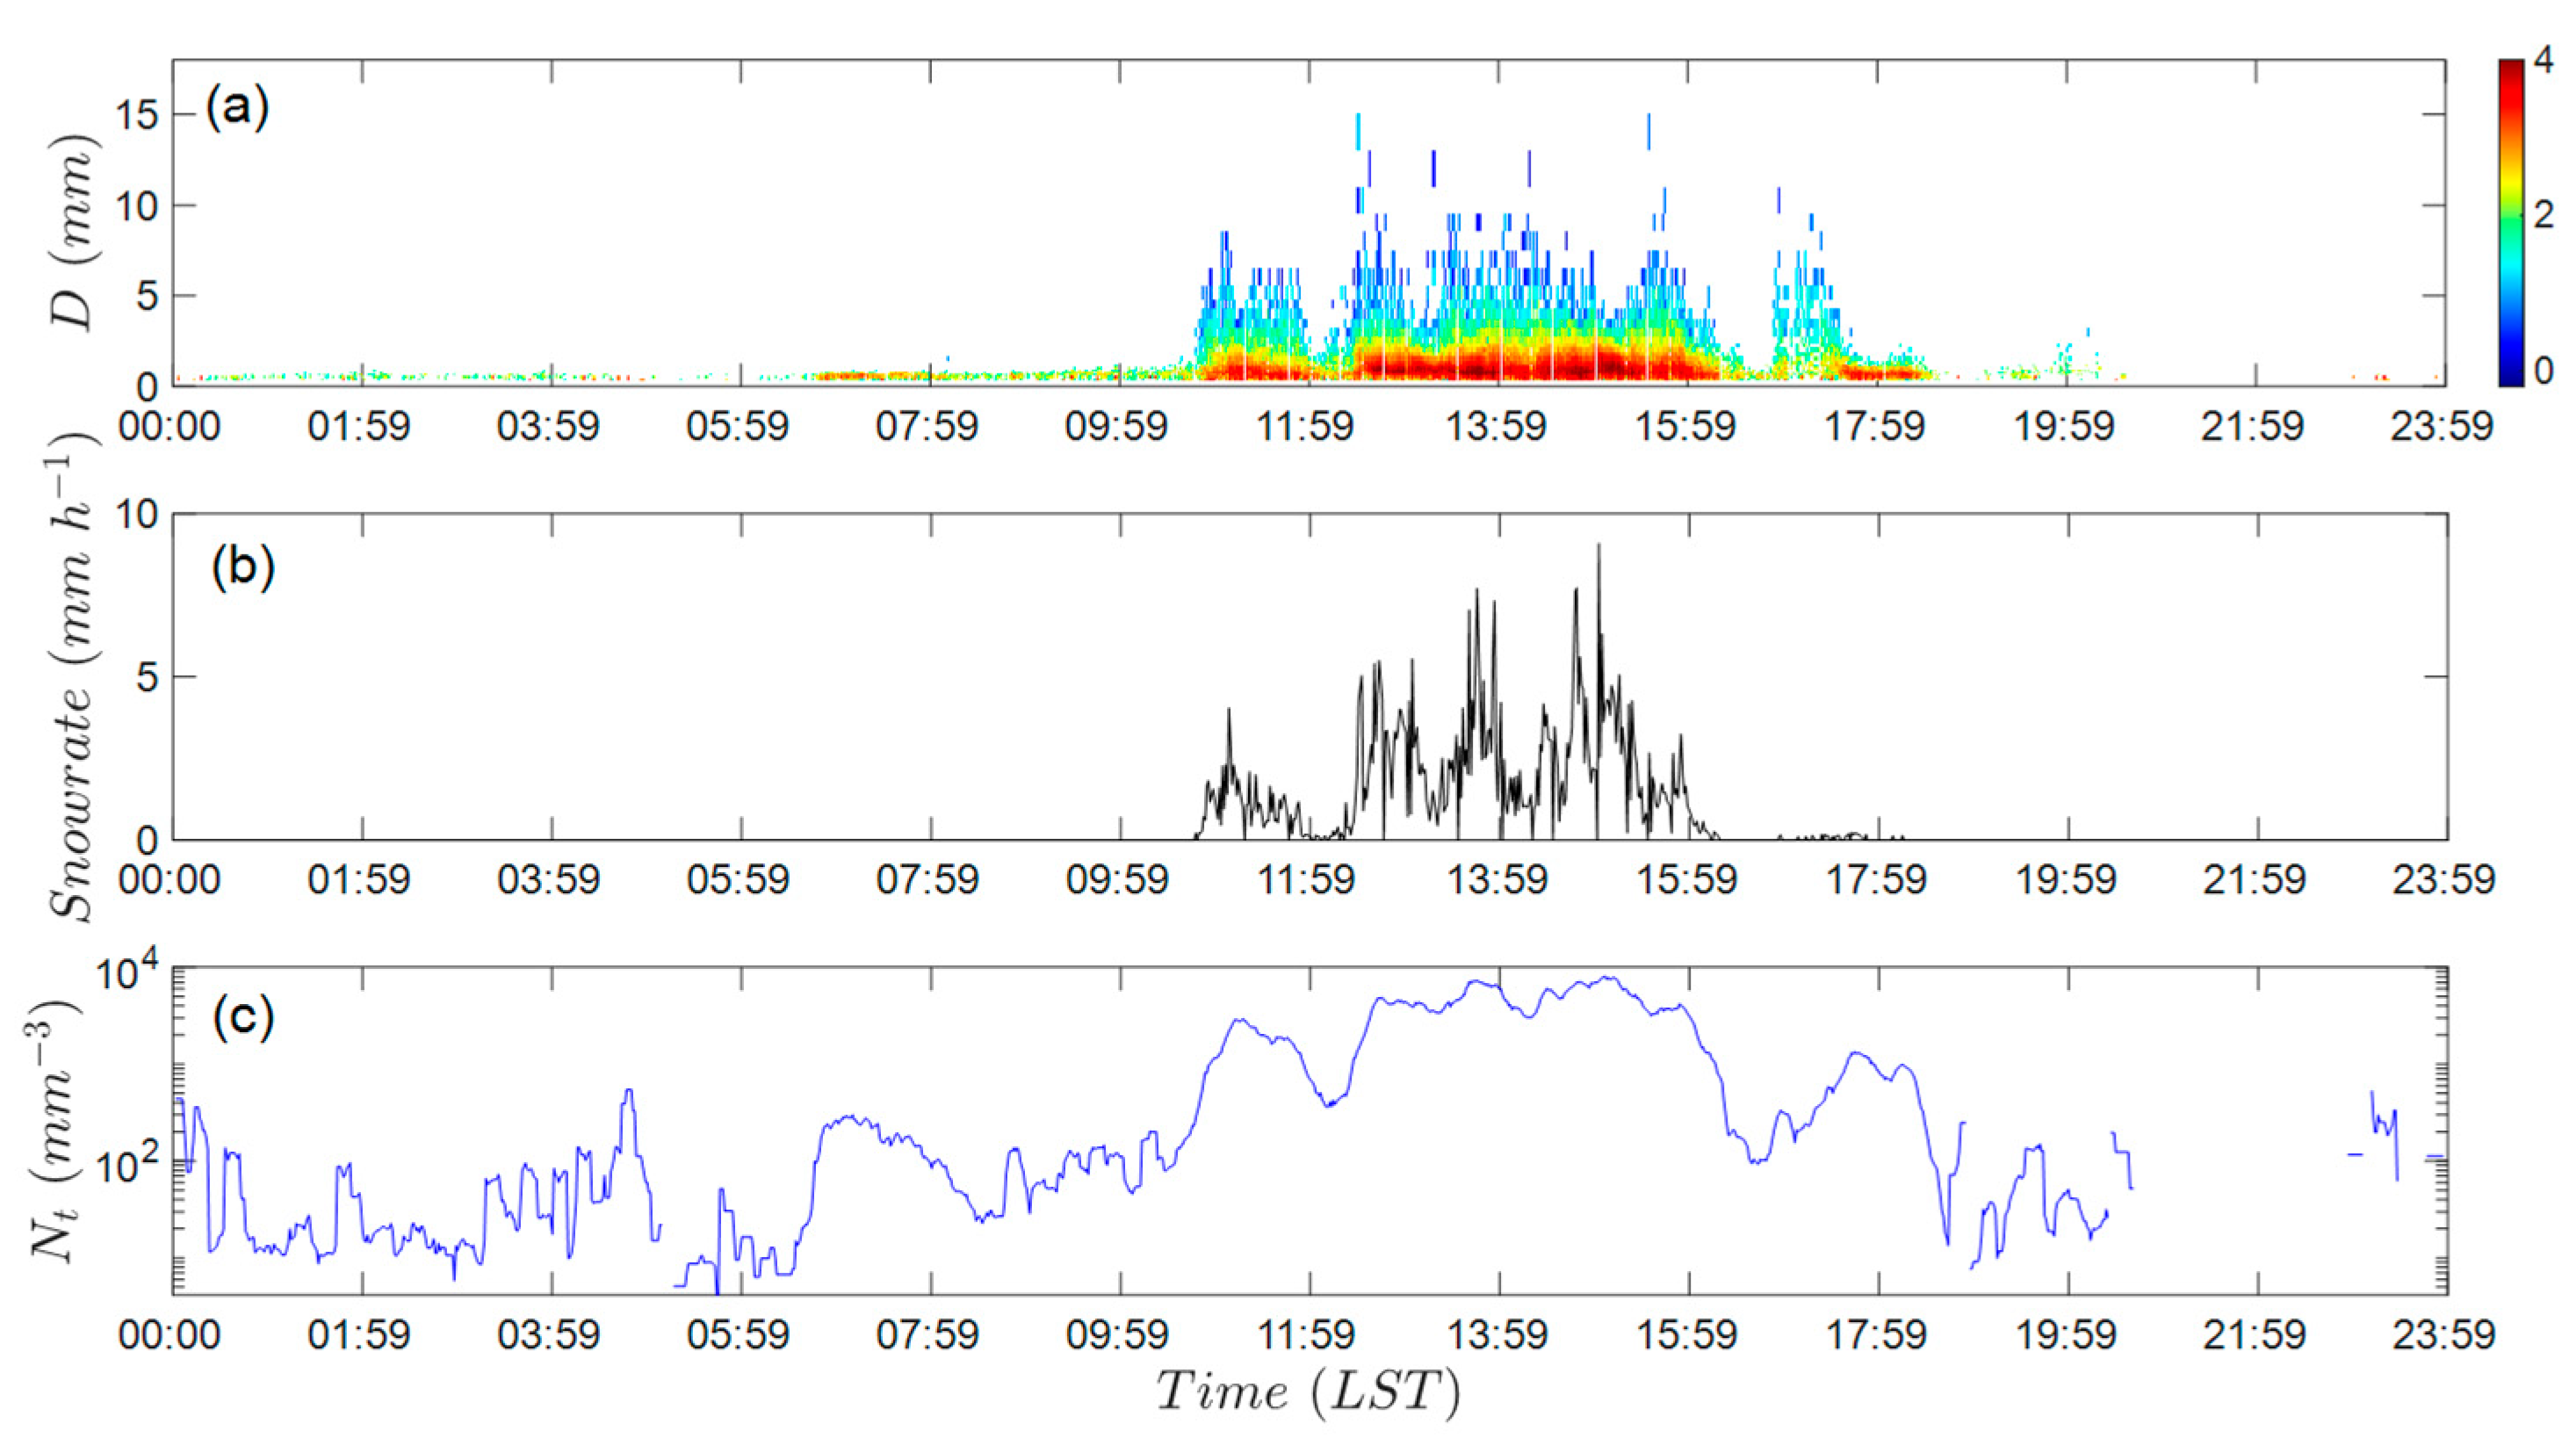
It can be seen from Figure 4a that the duration of the snowfall process on March 18 is significantly shorter than that on February 13. Additionally, the variation trend of the S R shown in Figure 4b is consistent with that of the N t shown in Figure 4c.

3.3. Relationship between l o g 10 N w and D m of Different S R

Three Gamma parameters ( N 0 , μ and Λ ) are fitted for the PSD of each sample, and the normalized parameter N w is calculated. The relationship between l o g 10 N w and D m directly reflects the particle number concentration and size characteristics, and its distribution characteristics have important reference values for particle classification. Based on the conclusion by Bringi et al. [36], the cloud formation corresponding to smaller l o g 10 N w value and larger D m value is mainly composed of large-size dry snow, and the cloud formation corresponding to larger l o g 10 N w value and smaller D m value is mainly composed of small-size graupel particles and rimmed particles. Figure 5 shows the distribution of l o g 10 N w and D m of three S R . The black, blue and red blocks in Figure 5 correspond to the mean values of l o g 10 N w and D m of three SR samples in this paper. The mean (ME) and standard deviations (SD) of l o g 10 N w and D m for different types of snow are listed in Table 2. When the S R is less than 2.5 mm/h, the mean D m value is larger and the mean l o g 10 N w value is smaller, and the snow size of these samples should be larger. However, when the S R is more than or equal to 2.5 mm/h, the corresponding mean D m value is smaller and the mean value of l o g 10 N w is larger, indicating that the snow particles are mainly small-size graupel particles.
The green and cyan blocks in Figure 5 are the mean values of wet snow and dry snow analyzed by Pu et al. [54] in Nanjing. According to Pu et al. [54], local 1-h ground temperature data for precipitation days are used to distinguish between dry snow and wet snow. If the temperature t ≥ 0 °C, the sample is considered to be wet snow; otherwise, it is considered to be dry snow. In this study, cases 3, 4 and 5 were classified as wet snow based on the ground temperature. By comparison, it can be seen that the mean value of l o g 10 N w of dry and wet snowfall in Beijing is larger than that in Nanjing, and the mean value of D m is smaller than that in Nanjing. The pink dashed line in Figure 5 is the fitting line of l o g 10 N w and D m of stratiform precipitation in Bringi et al. [36]. There are two dashed boxes of convective precipitation on the right side of the dashed line, where the upper dashed box corresponds to the range of oceanic convection and the lower dashed box corresponds to the range of continental convection.

3.4. μ−Λ Relationship of Different S R

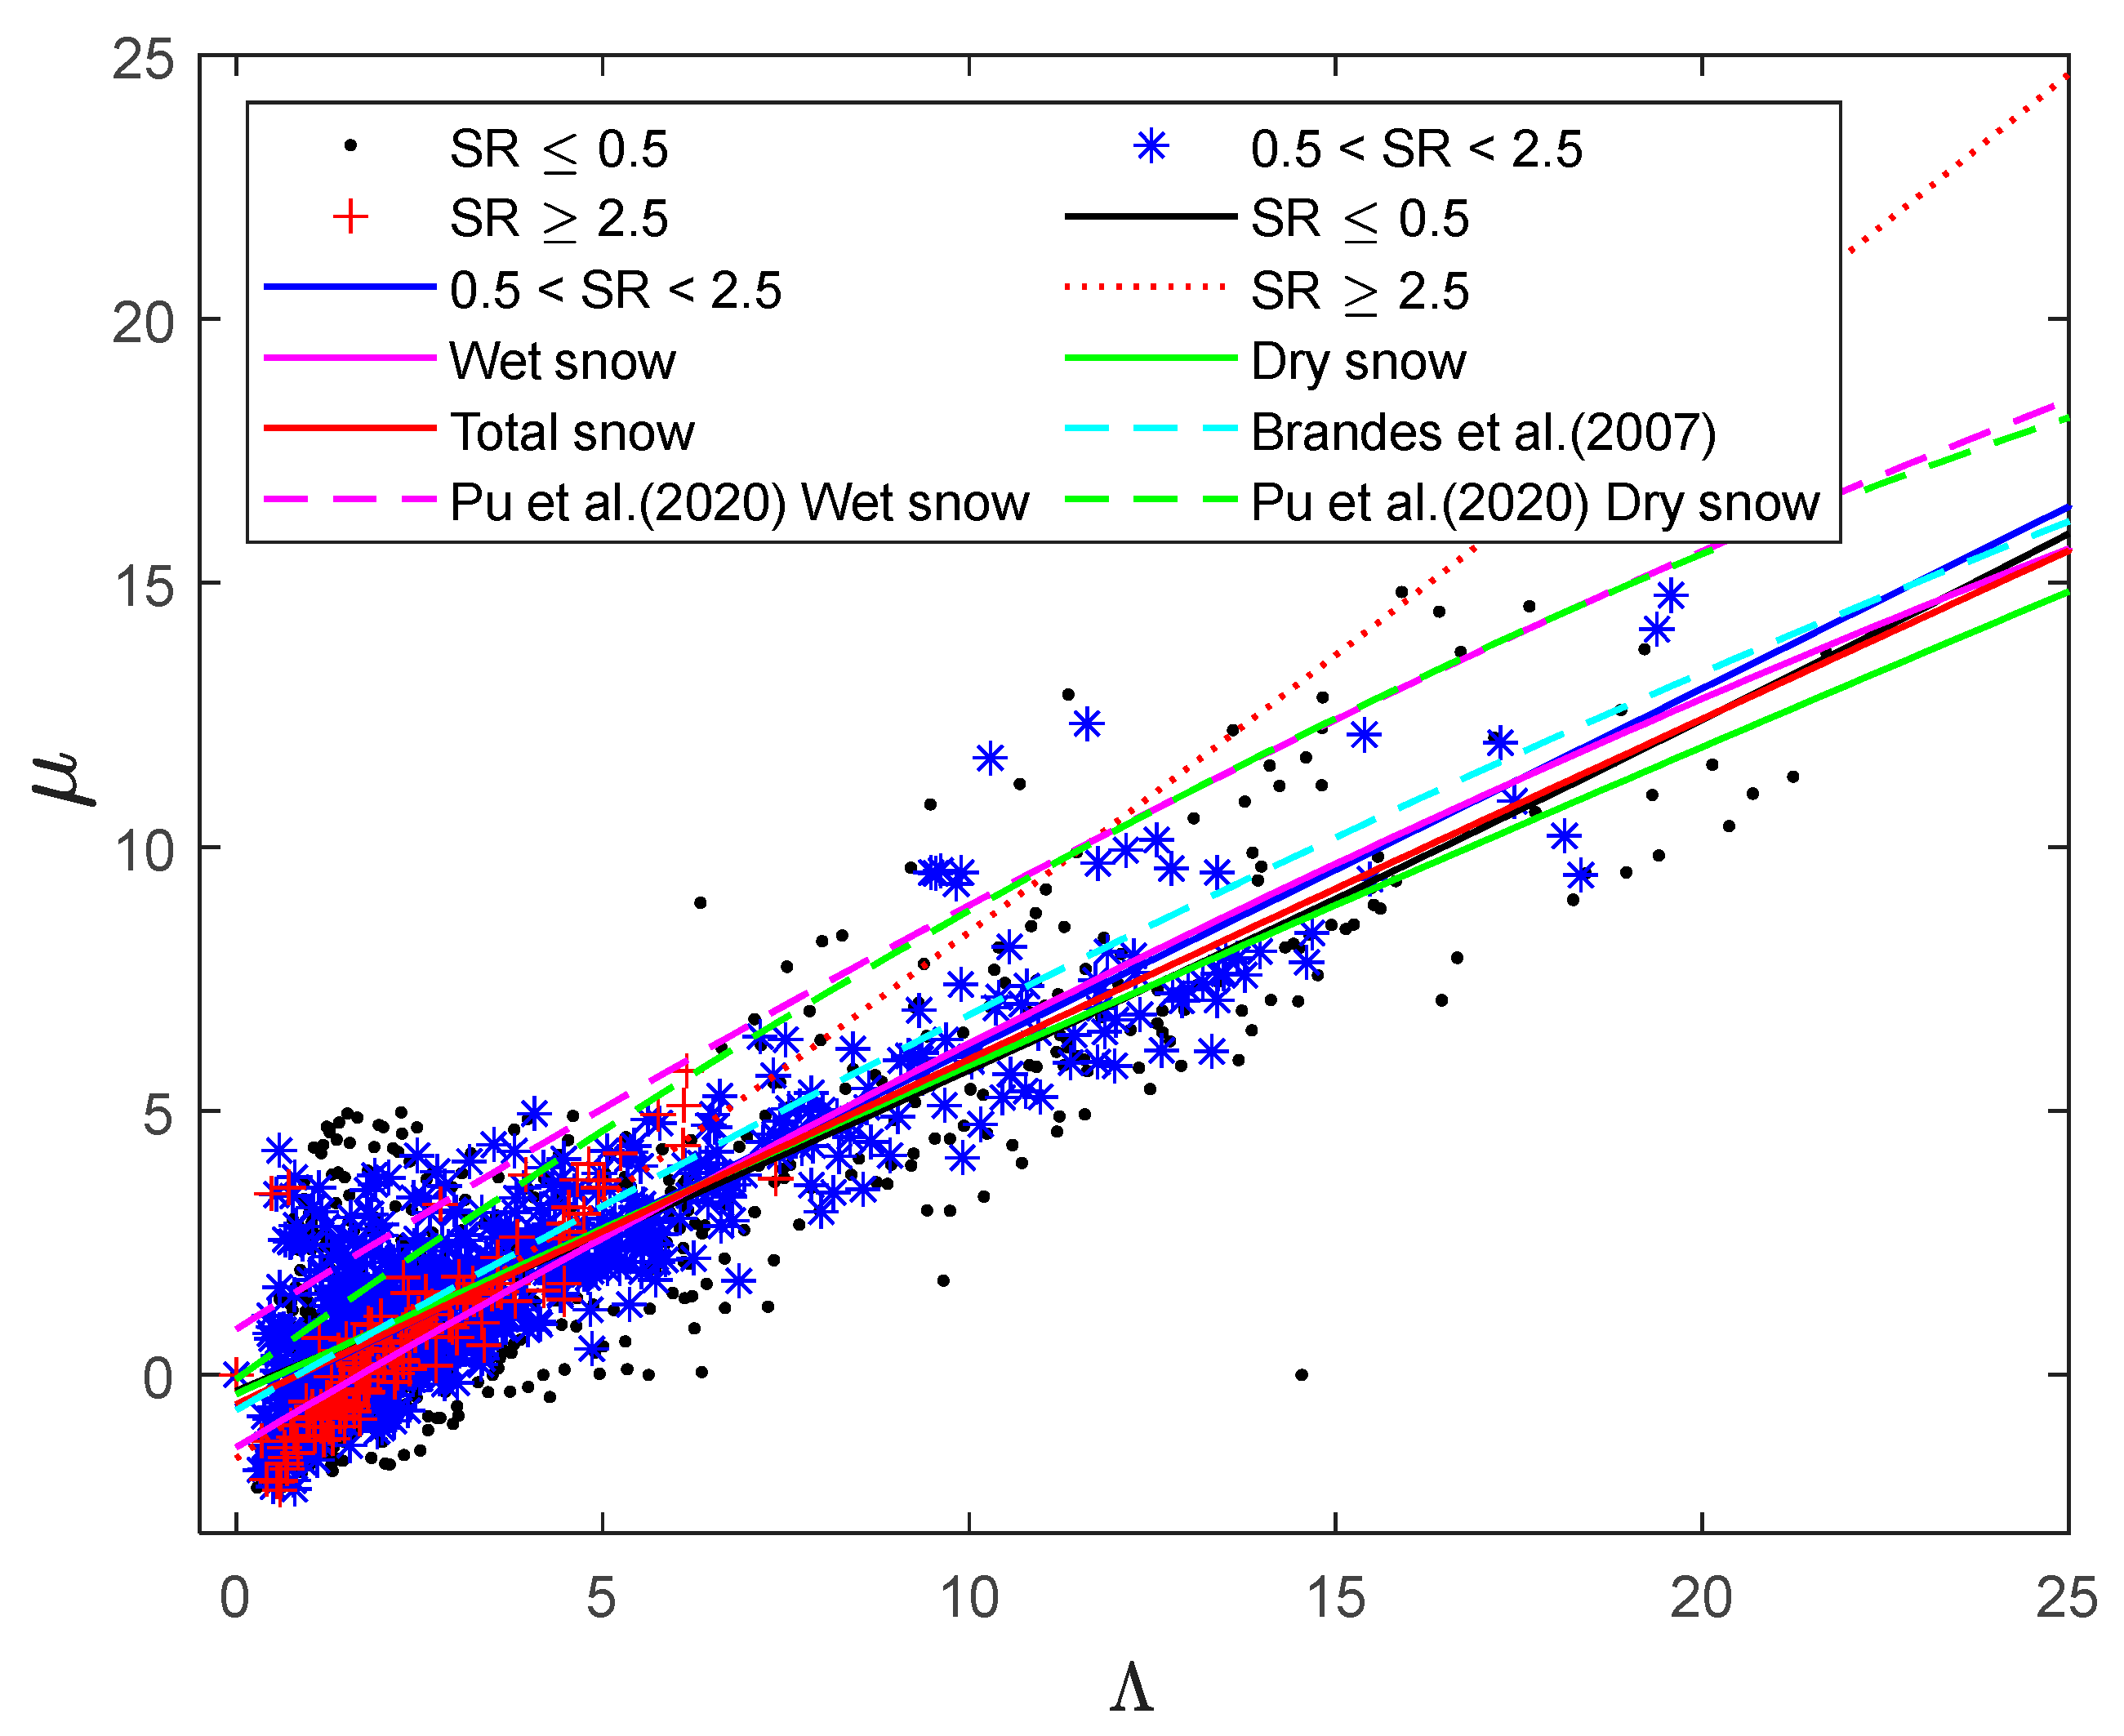
Studies show that that there is a binomial relationship between μ and Λ , which contains useful meteorological information [46]. For example, when the dual-frequency radar is used to retrieve the precipitation PSD parameters and certain constraints are required to convert three parameters into two parameters, the μ Λ relationship will play a role. The red and other color lines in Figure 6 show the binomial fitting of the μ Λ relationship for eight snowfall cases, different SR, and dry and wet snowfall cases. Figure 6 and Table 3 also show the μ Λ relationship of snowfall in Brandes et al. [46] and Pu et al. [54]. By comparison, it is found that the μ value of snowfall in Beijing is smaller than that observed by Pu et al. [54] in Nanjing under the same Λ value. The μ Λ relationship of snowfall in Beijing is closer to that observed by Brandes et al. [46] in Colorado, USA.

3.5. Snowfall and Snow Density

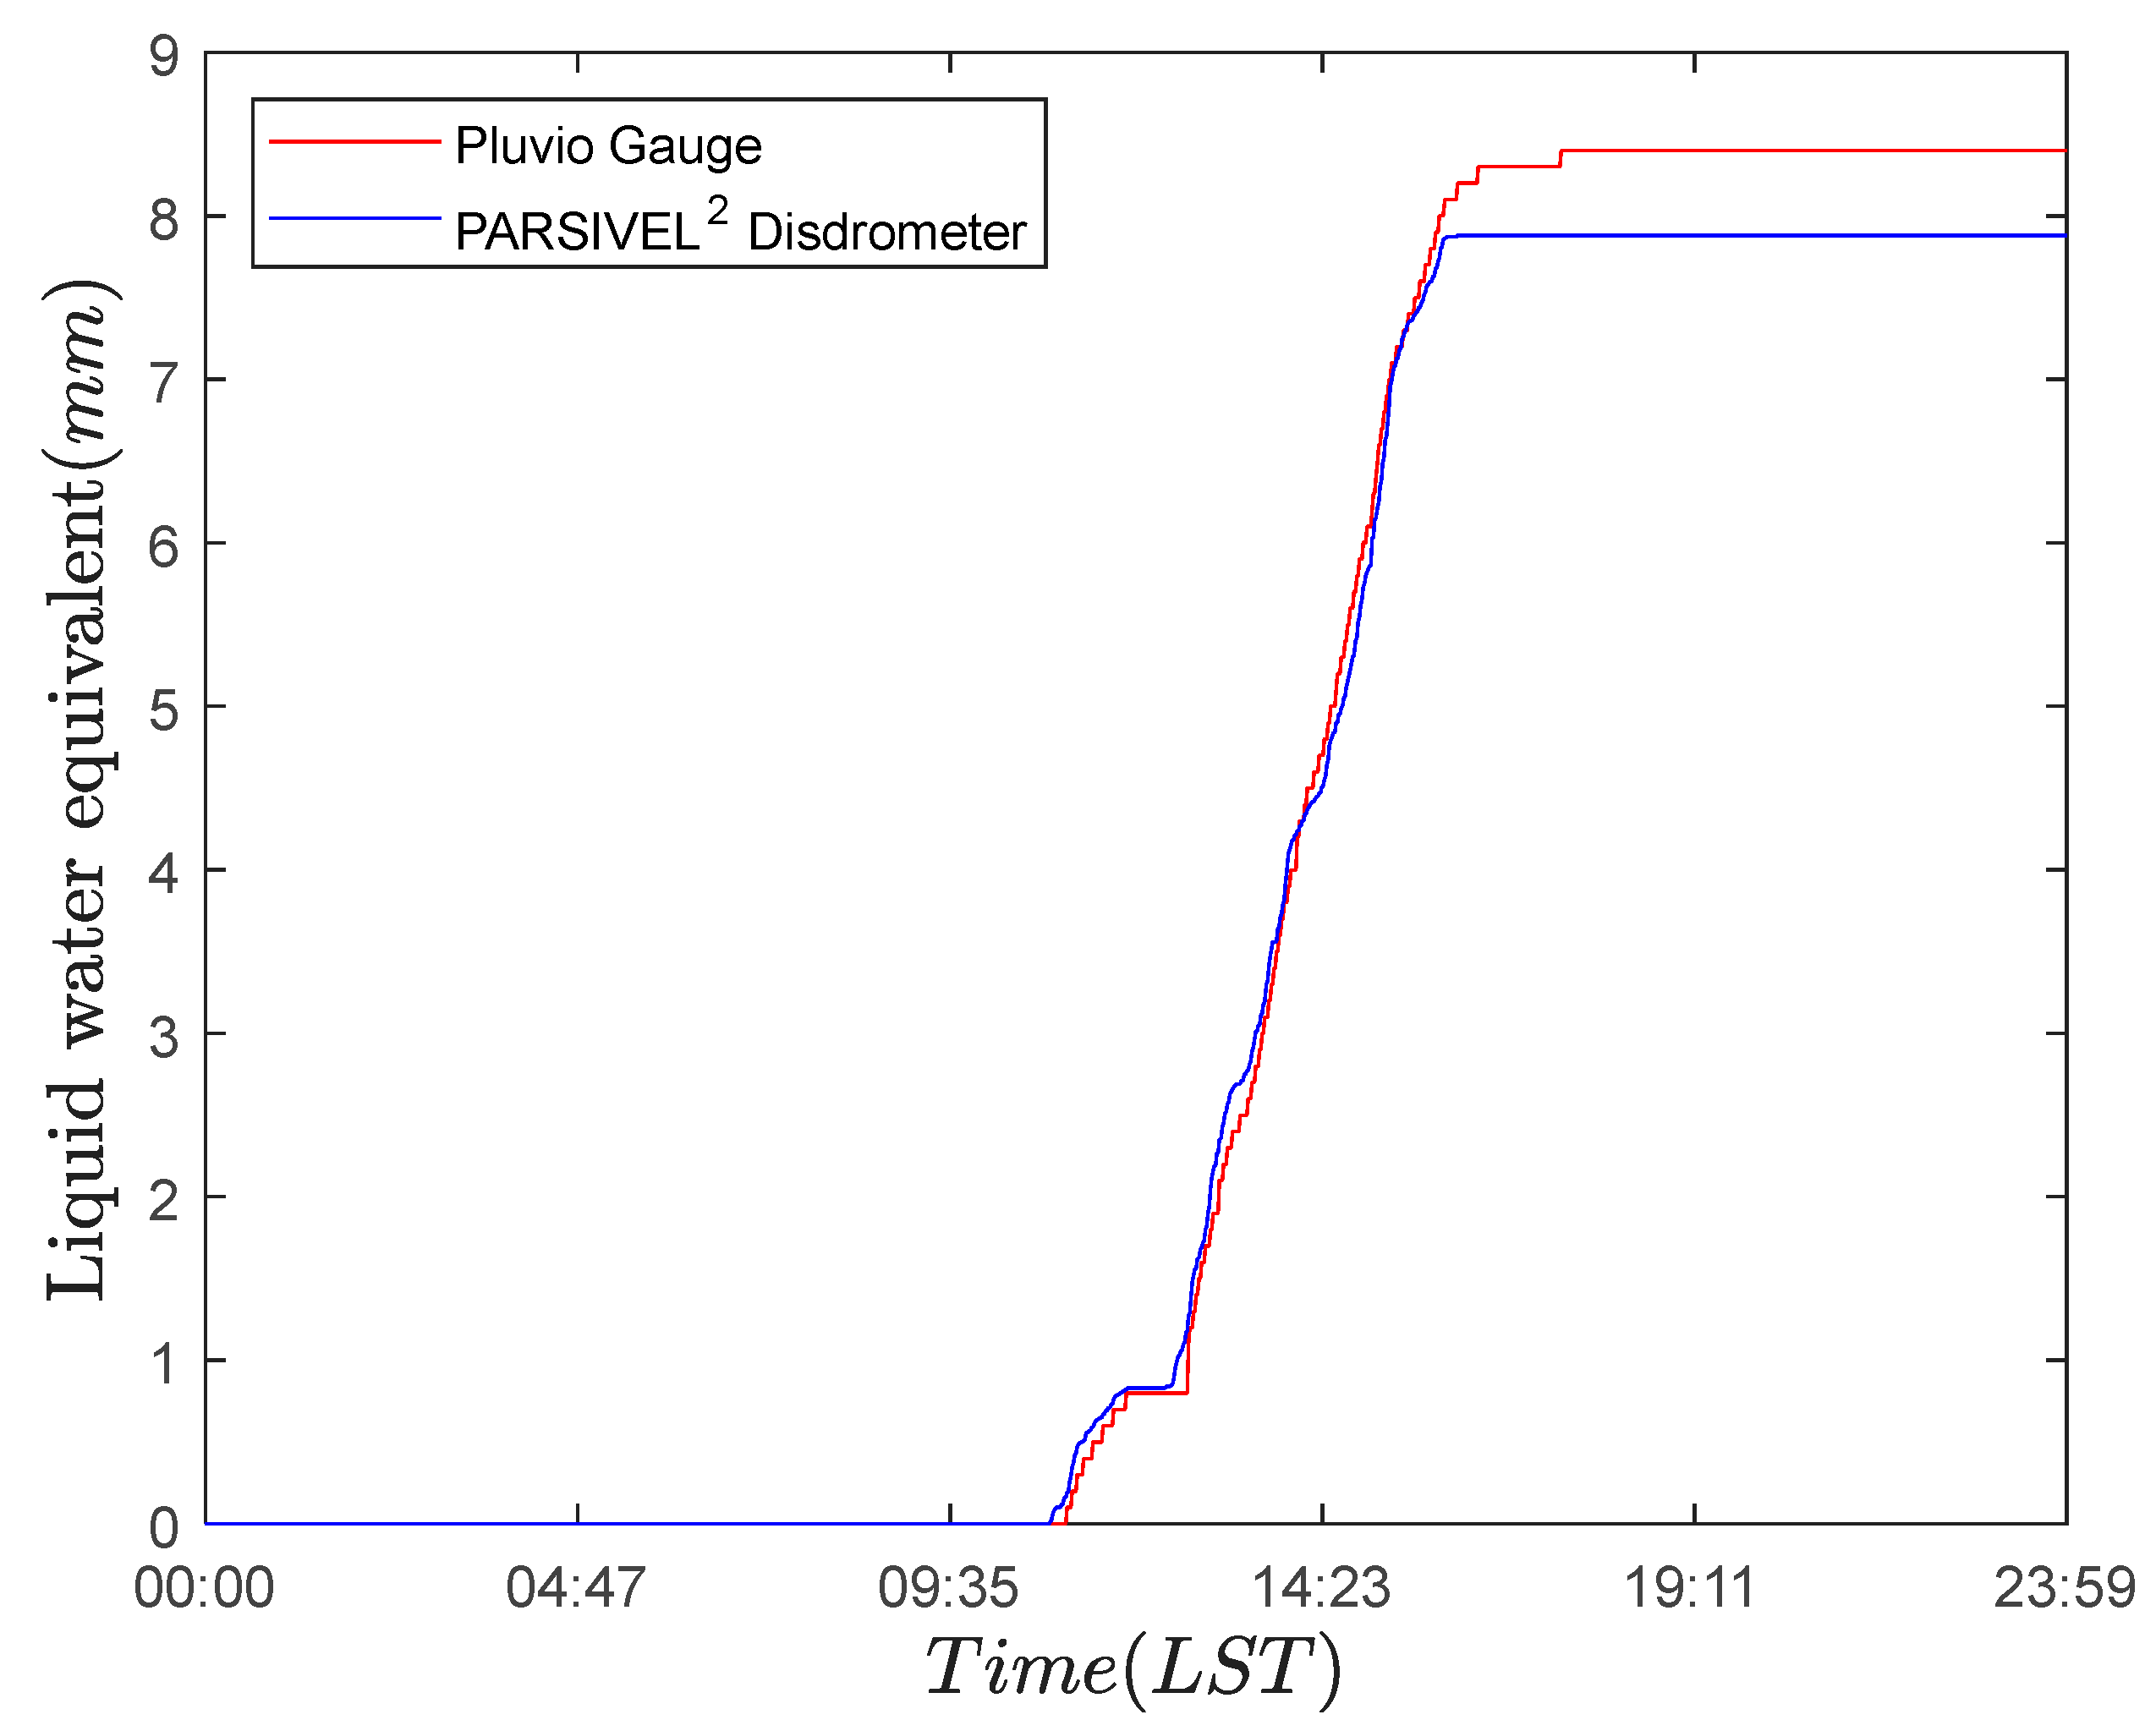
The snow cumulation on 18 March 2022 is the largest among all snowfall cases. In Figure 7, the cumulative snowfall data from the weighing precipitation gauge and the disdrometer in this process are compared. The cumulative snowfalls of the weighing precipitation gauge and the disdrometer were 8.3 mm and 7.88 mm, respectively, in the whole process. The two types of apparatus show good consistency in the gradual accumulation of snowfalls.
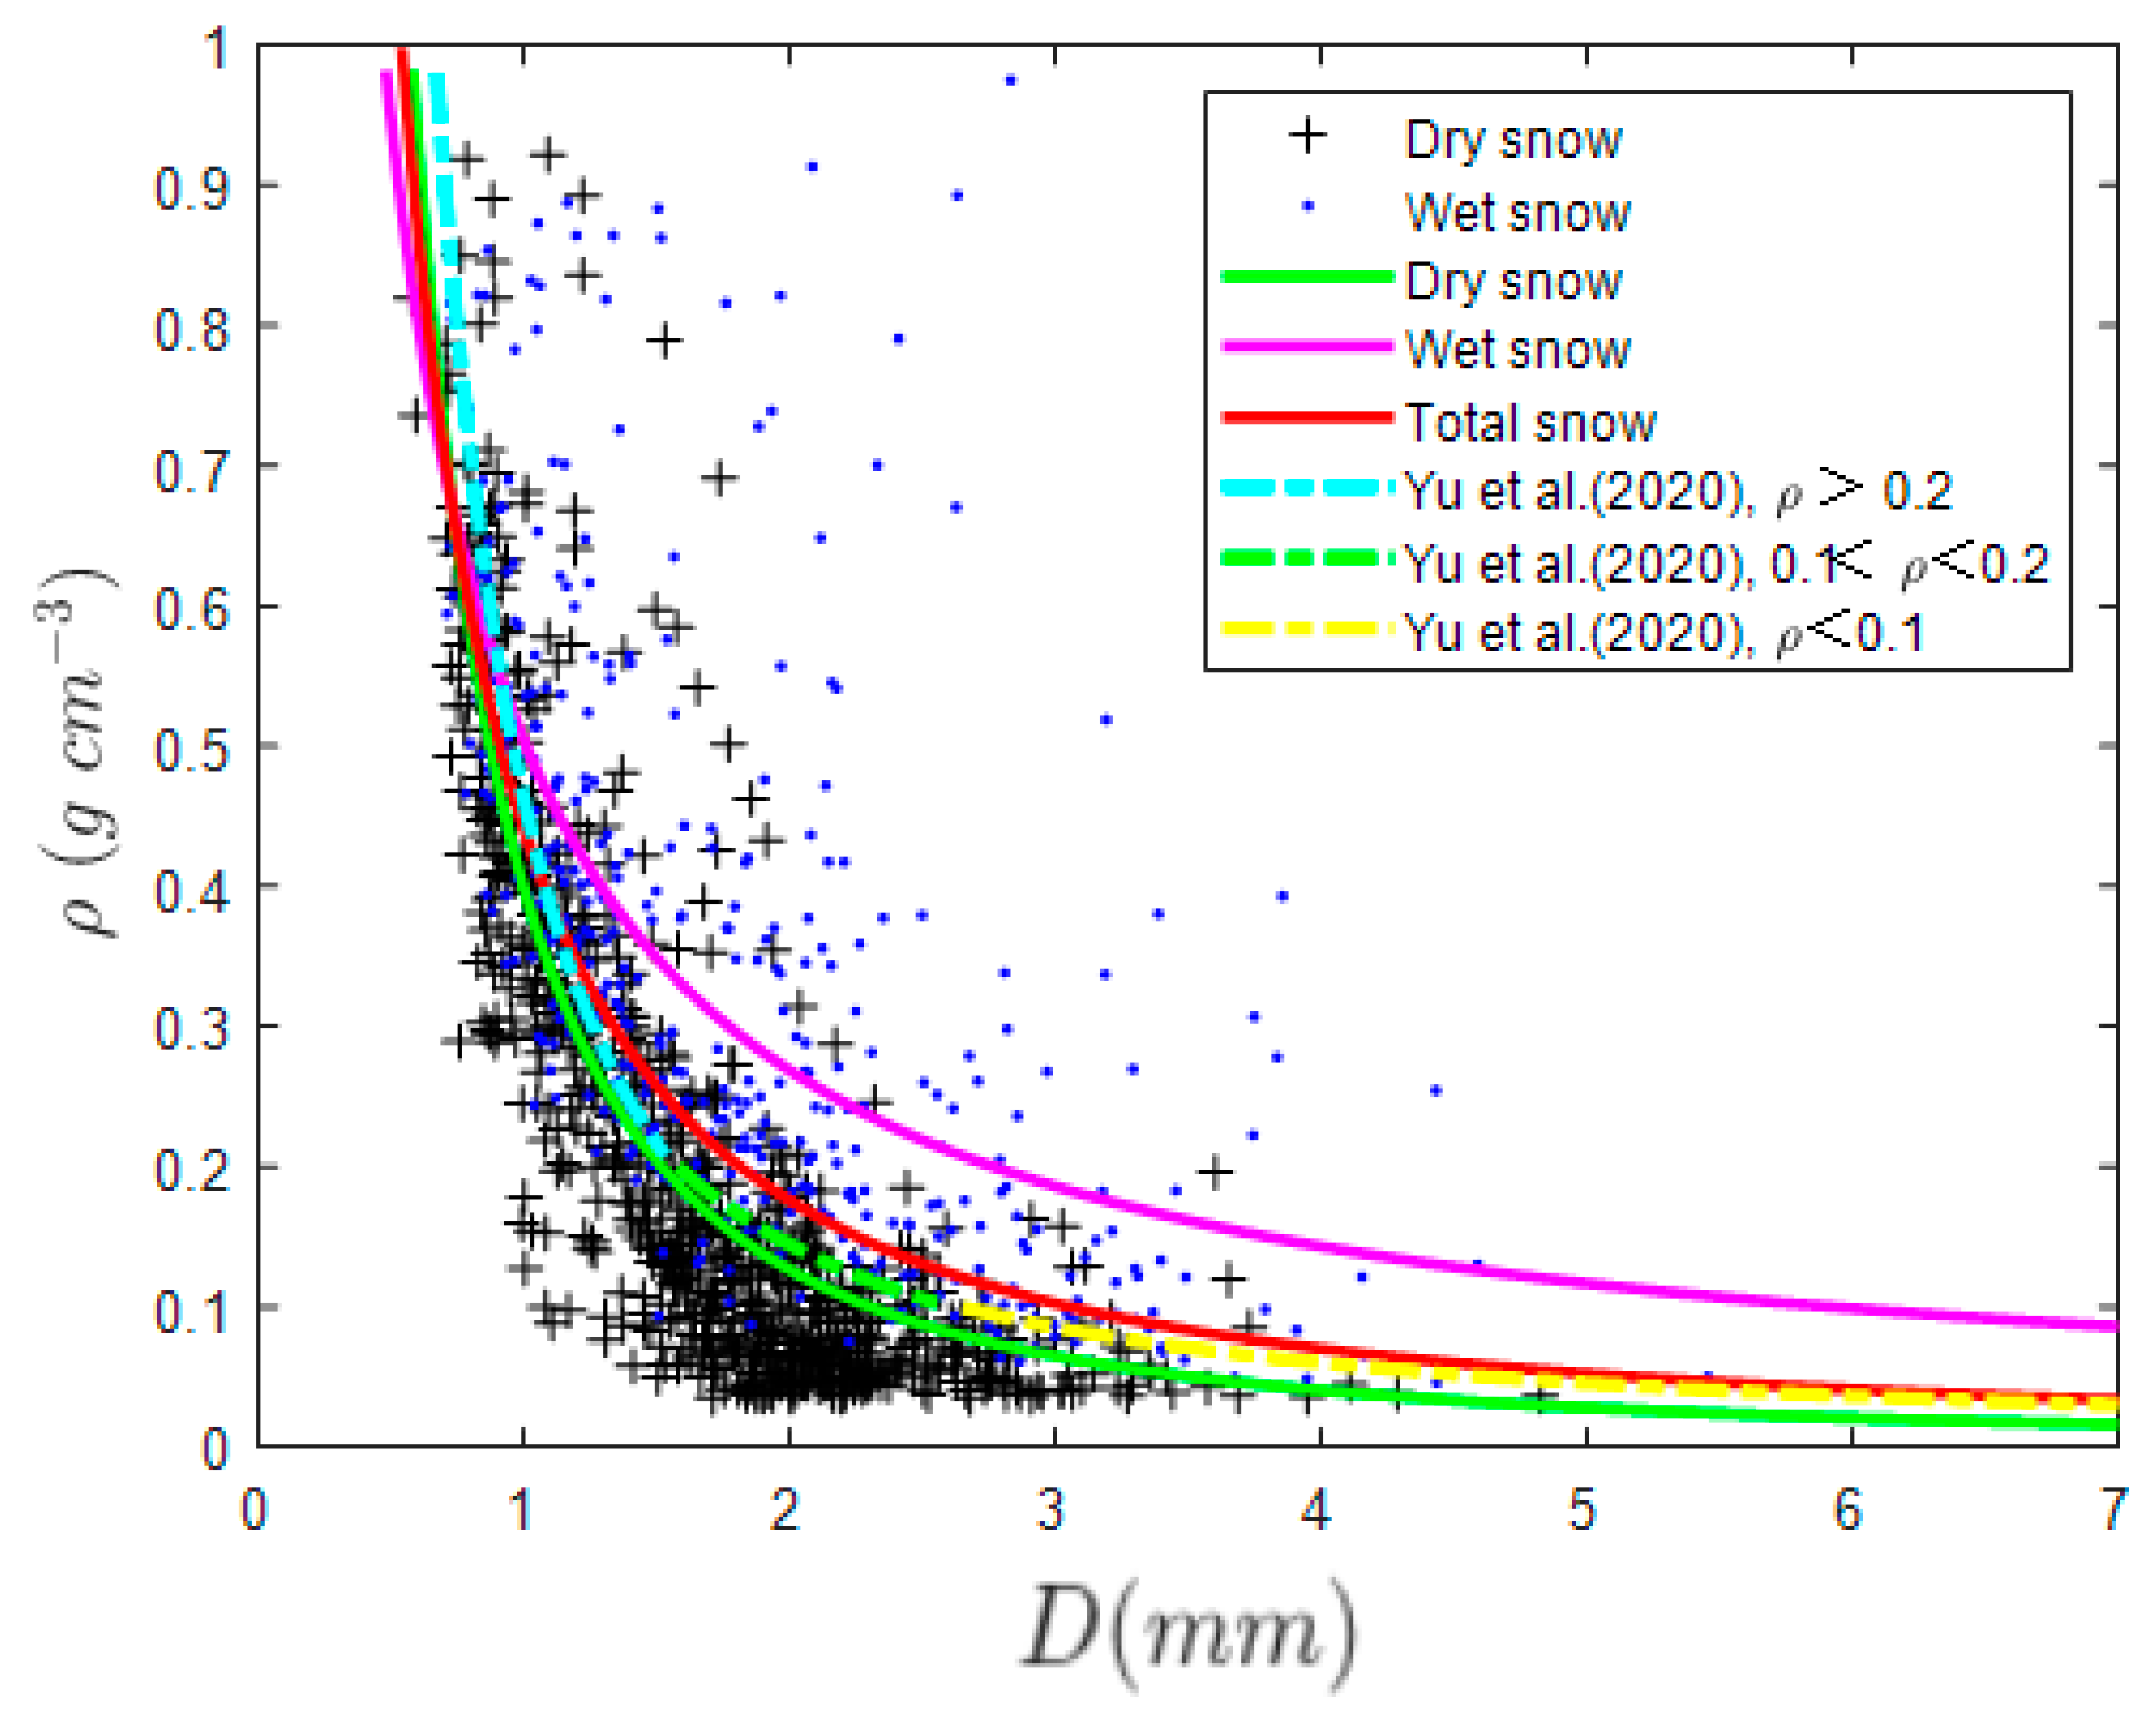
According to Formula (18), the snow density ρ s (g cm−3) can be calculated, given that the snow mass, particle diameter, falling velocity and number concentration are known. Figure 8 shows the scatterplot of D m and ρ s during the snowfall, and the ρ s D m relationship is fitted. Figure 8 also gives the fitted relationships of the literature [53] in other regions. The specific relationships of the dry, wet and total cases in this study are shown in Table 4. The same type of disdrometer and weighing precipitation gauge were used by Yu et al. [53], who used the aerodynamic relationship to get the density of snow. It can be seen from Figure 8 that the curve of dry snow fitted in this paper is close the curves of Yu et al. [53], and the relationship of wet snow is quite different. Due to the different climatic regions and different snowfall types, the densities of different snowfalls are greatly different, and the fitted density diameter relationships are also different. Therefore, the ρ s D m relationship established in this paper is of certain reference significance for improving the accuracy of radar and snowfall retrievals in this area.

3.6. Ze−SR Relationship

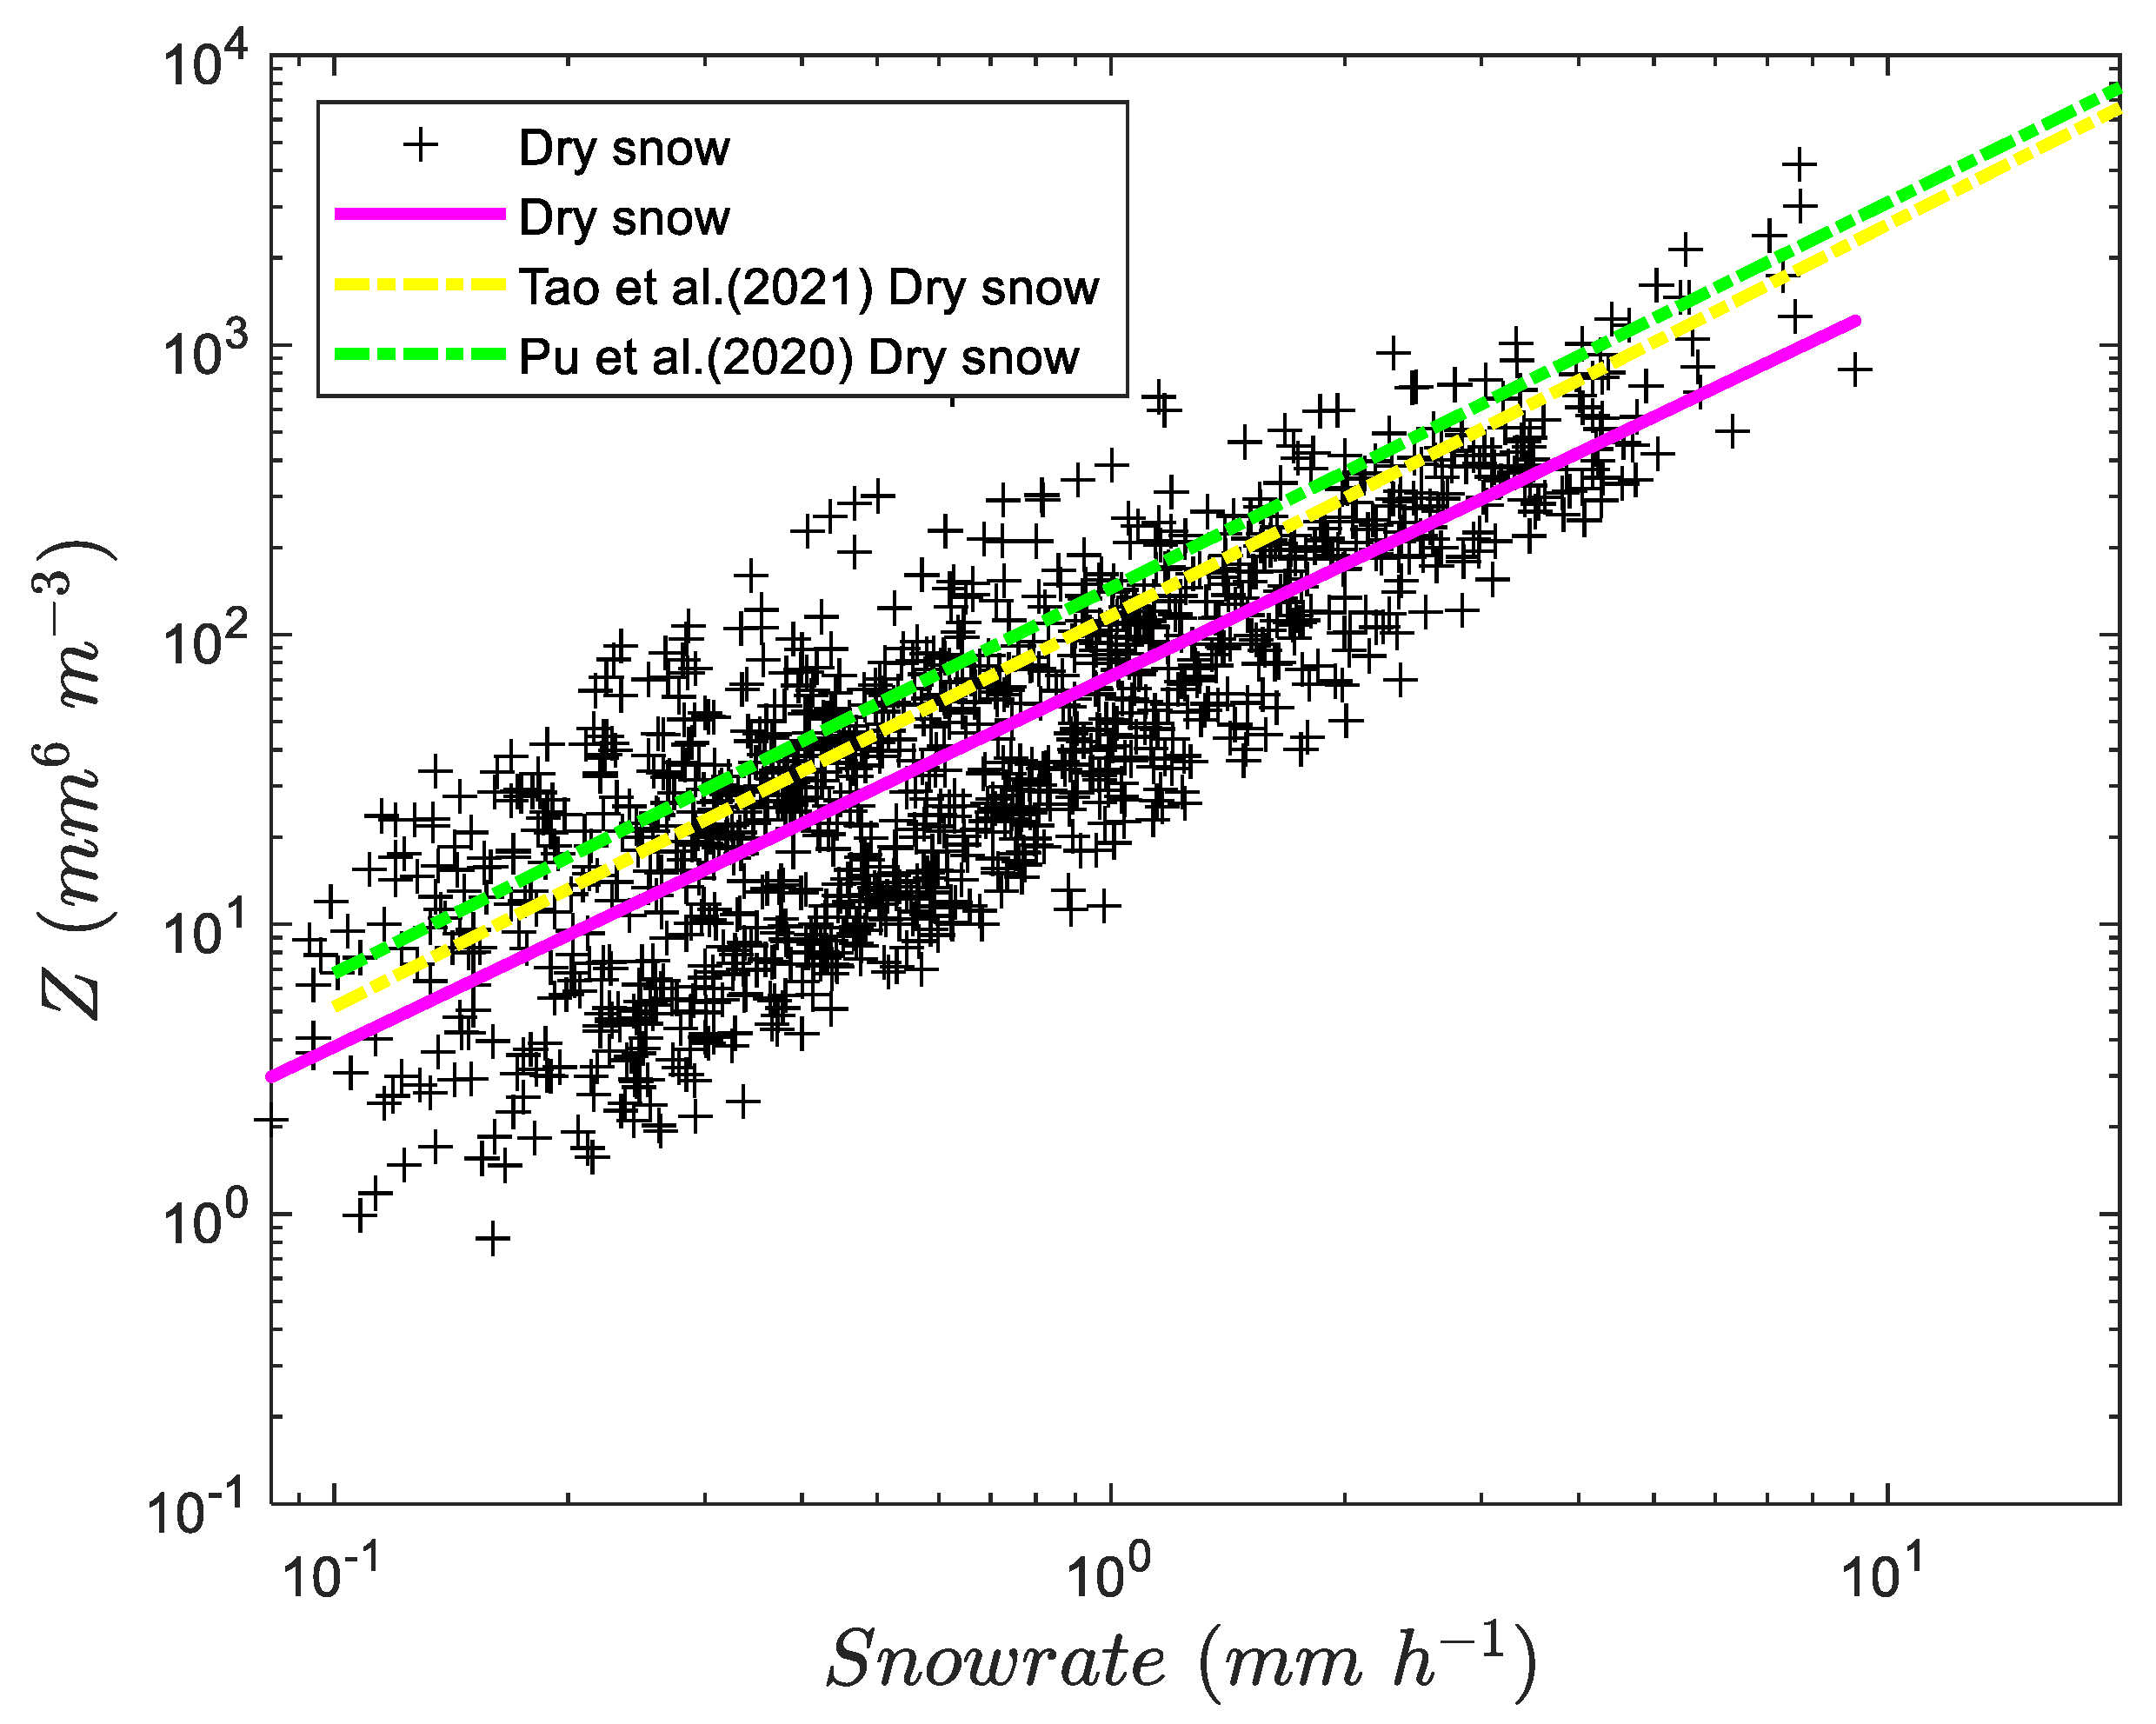
Figure 9 shows the scatterplot of the Z e and S R in dry snowfalls, and the pink line in the figure show the fitted Z e S R relationship of dry snow. In the figure, the yellow dashed line is the Z e S R relationship fitted by Tao et al. [55] based on the data of dry snowfalls observed by the 2DVD disdrometer in Nanjing. And the green dashed line is the Z e S R relationships of dry snow fitted by Pu et al. [54] based on data from six winter snowfalls observed by the PARSIVEL disdrometer in Nanjing. Table 5 shows the specific relationship of the above fitting. It can be seen that the fitted Z e S R relationship of dry snow in Beijing is consistent with the Z e S R relationship of dry snow in Nanjing. And in the same Z e , the S R in Beijing is little large than the S R in Nanjing. However, the wet snowfalls were not fitted in this study, because the dielectric constant of wet snow is significantly larger than that of dry snow due to water-coating [14,61]. Therefore, in the case study of quantitative estimation of snow, wet snow/dry snow should be classified in advance.

3.7. Terminal Velocity for Different S R

Because of the complex shape of solid snow particles, the calculation of their terminal falling velocity is more complicated. Locatelli and Hobbs [62] fitted an empirical equation for the final falling velocity of solid precipitation, which is still widely used in the model parameterization schemes. Yuter et al. [63] classified the particles of mixed precipitation (coexistence of rain and snow) according to the corresponding relationship between the particle falling velocity and diameter observed by the PARSIVEL disdrometer. The observed falling velocity of these particles are mostly consistent with the empirical equation of Locatelli and Hobbs [62]. Tao et al. [55] classified the falling velocity of snow particles into low and high falling velocities and fitted the corresponding relationship between the falling velocity and the diameter, respectively.
In this paper, the classified statistics on the distribution of falling velocity and diameter is made according to three S R and the samples of eight snowfall cases. Figure 10a, b and c correspond to S R   ≤ 0.5 mm/h, 0.5 <   S R   < 2.5 mm/h and S R   ≥ 2.5 mm/h, respectively. Table 6 has the relationships between the falling velocity and diameter of four precipitation types, namely rain, graupel, melting, and snow [62,64,65,66]. As for the classification standard in 1 min, rain is considered dominant if more than 70% of the particles are classified as rain, whereas snow and/or graupel are considered dominant if more than 80% of the particles are classified as snow, melting snow, or graupel [66].
Figure 10a corresponds to S R   ≤ 0.5 mm/h, indicating that the distribution of falling velocity and diameter of particles coincides with the distribution curve of snow particles. Figure 10b corresponds to 0.5 <   S R   < 2.5 mm/h, indicating that the distribution of falling velocity and diameter of particles has the distribution characteristics of both snow and graupel particles. Figure 10c corresponds to S R   ≥ 2.5 mm/h, indicating that the distribution of falling velocity and diameter of particles is closer to the distribution characteristics of graupel particles.

4. Discussion

In this study, we analyzed snowfall microphysical characteristics based on disdrometer measurements obtained in Beijing to further improve the parameterization and estimation of winter precipitation in north China.
Snow PSDs were fitted to the gamma model with the moment method to calculate the three parameters of Gamma distribution. Compared to the result reported by Brandes et al. [46], the fitted relations for snow are similar, and most values of μ and Λ are in small regions. The μ Λ relationship of wet and dry snow obtained in this study and Pu et al. [54] indicate that wet and dry snow show little difference between them, but in different locations show the different relationships. Thus, the relationships of μ Λ for snow in some sites are important because they effectively reduce the three-parameter gamma distribution to two parameters.
The normalized intercept parameter l o g 10 N w and the mass-weighted mean diameter D m directly reflect the concentration and size characteristics of snow particles. In this paper, dry and wet snow are distinguished and snowfalls are classified by S R parameters. Dry snow and wet snow have similar concentrations (mean value of   l o g 10 N w ), but the particle size (mean value of D m ) of dry snow is larger than that of wet snow. The distribution of mean D m value of the dry and wet snow in this study is much more widespread than Pu et al. [54] in Nanjing regions.
The ρ s D m relationship also need to be discussed. Particle diameter definitions vary in the references. Brandes et al. [46] and Tao et al. [55] defined the diameter as median volume diameter D 0 based on the 2-DVD disdrometer data. Huang et al. [49] assumed that the particle is an ellipsoid and defined the apparent diameter as D a p p . The Magono and Nakamura [67] relation is for dry and wet snow. We derived the ρ s D m relationships into dry and wet snow. The differences in the ρ s D m relationships between two types of snow may be explained by differences in snowflake types.
The PARSIVEL disdrometer is widely used for studying the microphysical properties of precipitations. Battaglia et al. [47] evaluated the performance of the PARSIVEL disdrometer to determine the characteristics of falling snow. PARSIVEL seems to overestimate the number of small snowflakes and to underestimate the number of large particles when compared to 2-DVD. From November 2021 to March 2022, the joint winter snowfall observation experimental was equipment one 2-DVD disdrometer. Therefore, the next step is to compare these two types of disdrometer data, which will allow more detailed observation of snowflakes.
The ρ s D m and v D relationships should be used in future research for hydrometeor classification of snowfall events. Adding the triple-frequency radar observations will resolve the vertical structure of snowfall processes and further improve the performance of snowfall estimators with Z e S R relationships.
This study analyzes the microphysical characteristics of snowfall in Beijing, which improves our understanding of snowfall microphysics in this area and also provides useful data for evaluating and verifying numerical simulations.

5. Conclusions

In this paper, the microphysical characteristics of eight snowfall cases obtained in the Yanqing mountainous area of Beijing from 2020 to 2022 are analyzed to draw the following main conclusions:
(1) The microphysical characteristics of different snowfalls are quite different due to different S R . In this paper, the S R are classified into S R   ≤ 0.5 mm/h, 0.5 <   S R   < 2.5 mm/h and S R   ≥ 2.5 mm/h, and the mean PSD of these three S R are statistically analyzed. The statistical results show that the diameters corresponding to the peak values of the particle mean PSD for the three S R are 0.812 mm, 0.687 mm and 0.312 mm, respectively. When the S R ≥ 2.5 mm/h and the particle diameter D < 3.25 mm, the PSD is significantly more than that of the other two types; these results indicate that the snow particle concentration increased as SR increased. However, the distribution width of the particle mean spectrum is significantly smaller than that of the other two types.
(2) The parameters l o g 10 N w and D m are calculated for all the snowfall samples, and the classified statistics of three S R show that when the S R is high, the snow particles are mainly small-size graupel particles, and the corresponding the D m value of the snow particles is small and the l o g 10 N w values is large; when the S R is moderate or small, the D m value of the snow particles is large, and the l o g 10 N w value is small. When snow is divided into wet and dry, the mean value of D m of wet snow is small than that of dry snow.
(3) The μ and Λ values of all snowfall samples are calculated using Gamma three-parameter distribution; the fitted μ Λ relationships of dry, wet or total snow cases are close to that of the snowfall observations at a similar latitude in the United States, but obviously different from the fitted relationship in southern China. Therefore, the relationship between μ and Λ values of snowfall samples and observations at different latitudes will be verified by observations at more locations.
(4) Based on dry snowfall samples, the relationship between Z e and S R fitted in this paper is Z e = 72 × S R   1.28 , and the fitted ρ s D m relationship of dry snowfall is ρ s = 0.3987 × D m 1.656 .
(5) The three S R are different in this paper. The velocity and diameter distribution of snow particles show that the particles coincide with the snow distribution curve when S R < 0.5 mm/h; the particles have distribution characteristics closer to those of graupel particles when the S R ≥ 2.5 mm/h; the particles have the distribution characteristics of snow and graupel particles when the snowfall intensity is 0.5 < S R < 2.5 mm/h.
Although the microphysical characteristics of the eight snowfalls from 2020 to 2022 are analyzed in this paper, detailed analysis should be made for specific cases according to other observation data (such as X, KA, W triple-frequency radar, 2-DVD, microwave radiometer, etc.).

Author Contributions

Conceptualization, Y.S. and D.L.; methodology, Y.S.; software, Y.S.; validation, Y.B. and Y.C.; formal analysis, Y.S.; investigation, Y.B.; resources, Y.C.; data curation, H.C.; writing—original draft preparation, Y.S.; writing—review and editing, Y.S.; visualization, Y.C.; supervision, D.L.; project administration, S.D.; funding acquisition, D.L. All authors have read and agreed to the published version of the manuscript.

Funding

This research was funded by the National Natural Science Foundation of China (Grant Nos.42075092).

Data Availability Statement

Not applicable.

Acknowledgments

We thank the staff of Zhangshanying station for their contributions to equipment support and data collection in this study.

Conflicts of Interest

The authors declare no conflict of interest.

References

  1. Tang, Z.; Deng, G.; Hu, G.; Zhang, H.; Pan, H.; Sang, G. Satellite Observed Spatiotemporal Variability of Snow Cover and Snow Phenology over High Mountain Asia from 2002 to 2021. J. Hydrol. 2022, 613, 128438. [Google Scholar] [CrossRef]
  2. Tang, Z.; Wang, X.; Deng, G.; Wang, X.; Jiang, Z.; Sang, G. Spatiotemporal Variation of Snowline Altitude at the End of Melting Season across High Mountain Asia, Using MODIS Snow Cover Product. Adv. Sp. Res. 2020, 66, 2629–2645. [Google Scholar] [CrossRef]
  3. Skofronick-Jackson, G.; Hudak, D.; Petersen, W.; Nesbitt, S.W.; Chandrasekar, V.; Durden, S.; Gleicher, K.J.; Huang, G.J.; Joe, P.; Kollias, P.; et al. Global Precipitation Measurement Cold Season Precipitation Experiment (GCPEX): For Measurement’s Sake, Let It Snow. Bull. Am. Meteorol. Soc. 2015, 96, 1719–1741. [Google Scholar] [CrossRef]
  4. Kulie, M.S.; Pettersen, C.; Merrelli, A.J.; Wagner, T.J.; Wood, N.B.; Dutter, M.; Beachler, D.; Kluber, T.; Turner, R.; Mateling, M.; et al. Snowfall in the Northern Great Lakes: Lessons Learned from a Multisensor Observatory. Bull. Am. Meteorol. Soc. 2021, 102, E1317–E1339. [Google Scholar] [CrossRef]
  5. Schirle, C.E.; Cooper, S.J.; Wolff, M.A.; Pettersen, C.; Wood, N.B.; L’ecuyer, T.S.; Ilmo, T.; Nygård, K. Estimation of Snowfall Properties at a Mountainous Site in Norway Using Combined Radar and in Situ Microphysical Observations. J. Appl. Meteorol. Climatol. 2019, 58, 1337–1352. [Google Scholar] [CrossRef]
  6. Bracci, A.; Baldini, L.; Roberto, N.; Adirosi, E.; Montopoli, M.; Scarchilli, C.; Grigioni, P.; Ciardini, V.; Levizzani, V.; Porcù, F. Quantitative Precipitation Estimation over Antarctica Using Different Ze-Sr Relationships Based on Snowfall Classification Combining Ground Observations. Remote Sens. 2022, 14, 82. [Google Scholar] [CrossRef]
  7. Lubin, D.; Zhang, D.; Silber, I.; Scott, R.C.; Kalogeras, P.; Battaglia, A.; Bromwich, D.H.; Cadeddu, M.; Eloranta, E.; Fridlind, A.; et al. The Atmospheric Radiation Measurement (ARM) West Antarctic Radiation Experiment. Bull. Am. Meteorol. Soc. 2020, 101, E1069–E1091. [Google Scholar] [CrossRef] [Green Version]
  8. Houze, R.A.; McMurdie, L.A.; Petersen, W.A.; Schwall Er, M.R.; Baccus, W.; Lundquist, J.D.; Mass, C.F.; Nijssen, B.; Rutledge, S.A.; Hudak, D.R.; et al. The Olympic Mountains Experiment (Olympex). Bull. Am. Meteorol. Soc. 2017, 98, 2167–2188. [Google Scholar] [CrossRef]
  9. Petäjä, T.; O’Connor, E.J.; Moisseev, D.; Sinclair, V.A.; Manninen, A.J.; Väänänen, R.; Von Lerber, A.; Thornton, J.A.; Nicoll, K.; Petersen, W.; et al. A Field Campaign to Elucidate the Impact of Biogenic Aerosols on Clouds and Climate. Bull. Am. Meteorol. Soc. 2016, 97, 1909–1928. [Google Scholar] [CrossRef]
  10. Löhnert, U.; Kneifel, S.; Battaglia, A.; Hagen, M.; Hirsch, L.; Crewell, S. A Multisensor Approach toward a Better Understanding of Snowfall Microphysics the Tosca Project. Bull. Am. Meteorol. Soc. 2011, 92, 613–628. [Google Scholar] [CrossRef]
  11. Li, H.; Moisseev, D.; von Lerber, A. How Does Riming Affect Dual-Polarization Radar Observations and Snowflake Shape? J. Geophys. Res. Atmos. 2018, 123, 6070–6081. [Google Scholar] [CrossRef] [Green Version]
  12. Li, H.; Korolev, A.; Moisseev, D. Supercooled Liquid Water and Secondary Ice Production in Kelvin-Helmholtz Instability as Revealed by Radar Doppler Spectra Observations. Atmos. Chem. Phys. 2021, 21, 13593–13608. [Google Scholar] [CrossRef]
  13. Li, H.; Möhler, O.; Petäjä, T.; Moisseev, D. Two-Year Statistics of Columnar-Ice Production in Stratiform Clouds over Hyytiälä, Finland: Environmental Conditions and the Relevance to Secondary Ice Production. Atmos. Chem. Phys. 2021, 21, 14671–14686. [Google Scholar] [CrossRef]
  14. Li, H.; Moisseev, D. Melting Layer Attenuation at Ka- and W-Bands as Derived From Multifrequency Radar Doppler Spectra Observations. J. Geophys. Res. Atmos. 2019, 124, 9520–9533. [Google Scholar] [CrossRef] [Green Version]
  15. Li, H.; Moisseev, D. Two Layers of Melting Ice Particles Within a Single Radar Bright Band: Interpretation and Implications. Geophys. Res. Lett. 2020, 47, 1–10. [Google Scholar] [CrossRef]
  16. Li, H.; Tiira, J.; Von Lerber, A.; Moisseev, D. Towards the Connection between Snow Microphysics and Melting Layer: Insights from Multifrequency and Dual-Polarization Radar Observations during BAECC. Atmos. Chem. Phys. 2020, 20, 9547–9562. [Google Scholar] [CrossRef]
  17. Mason, S.L.; Chiu, C.J.; Hogan, R.J.; Moisseev, D.; Kneifel, S. Retrievals of Riming and Snow Density From Vertically Pointing Doppler Radars. J. Geophys. Res. Atmos. 2018, 123, 13807–13834. [Google Scholar] [CrossRef] [Green Version]
  18. Mason, S.; Hogan, R.; Westbrook, C.; Kneifel, S.; Moisseev, D. The Importance of Particle Size Distribution Shape for Triple-Frequency Radar Retrievals of the Morphology of Snow. Atmos. Meas. Tech. 2019, 12, 4993–5018. [Google Scholar] [CrossRef] [Green Version]
  19. Kneifel, S.; Von Lerber, A.; Tiira, J.; Moisseev, D.; Kollias, P.; Leinonen, J. Observed Relations between Snowfall Microphysics and Triple-Frequency Radar Measurements. J. Geophys. Res. 2015, 120, 6034–6055. [Google Scholar] [CrossRef] [Green Version]
  20. Leinonen, J.; Moisseev, D. What Do Triple-Frequency Radar Signatures Reveal about Aggregate Snowflakes? J. Geophys. Res. 2015, 120, 229–239. [Google Scholar] [CrossRef]
  21. Thompson, G.; Field, P.R.; Rasmussen, R.M.; Hall, W.D. Explicit Forecasts of Winter Precipitation Using an Improved Bulk Microphysics Scheme. Part II: Implementation of a New Snow Parameterization. Mon. Weather Rev. 2008, 136, 5095–5115. [Google Scholar] [CrossRef]
  22. Engdahl, B.J.K.; Nygaard, B.E.K.; Losnedal, V.; Thompson, G.; Bengtsson, L. Effects of the ICE-T Microphysics Scheme in HARMONIE-AROME on Estimated Ice Loads on Transmission Lines. Cold Reg. Sci. Technol. 2020, 179, 103139. [Google Scholar] [CrossRef]
  23. Lin, Y.-L.; Farley, R.D.; Orville, H.D. Bulk Parameterization of the Snow Field in a Cloud Model. J. Appl. Meteorol. Climatol. 1983, 22, 1065–1092. [Google Scholar] [CrossRef]
  24. Morrison, H.; Thompson, G.; Tatarskii, V. Impact of Cloud Microphysics on the Development of Trailing Stratiform Precipitation in a Simulated Squall Line: Comparison of One- and Two-Moment Schemes. Mon. Weather Rev. 2009, 137, 991–1007. [Google Scholar] [CrossRef] [Green Version]
  25. Liu, C.; Ikeda, K.; Thompson, G.; Rasmussen, R.; Dudhia, J. High-Resolution Simulations of Wintertime Precipitation in the Colorado Headwaters Region: Sensitivity to Physics Parameterizations. Mon. Weather Rev. 2011, 139, 3533–3553. [Google Scholar] [CrossRef]
  26. Adirosi, E.; Baldini, L.; Roberto, N.; Gatlin, P.; Tokay, A. Improvement of Vertical Profiles of Raindrop Size Distribution from Micro Rain Radar Using 2D Video Disdrometer Measurements. Atmos. Res. 2016, 169, 404–415. [Google Scholar] [CrossRef]
  27. Brawn, D.; Upton, G. Estimation of an Atmospheric Gamma Drop Size Distribution Using Disdrometer Data. Atmos. Res. 2008, 87, 66–79. [Google Scholar] [CrossRef]
  28. Ma, L.; Zhao, L.; Yang, D.; Xiao, Y.; Zhang, L.; Qiao, Y. Analysis of Raindrop Size Distribution Characteristics in Permafrost Regions of the Qinghai-Tibet Plateau Based on New Quality Control Scheme. Water 2019, 11, 2265. [Google Scholar] [CrossRef] [Green Version]
  29. Marzano, F.S.; Cimini, D.; Montopoli, M. Investigating Precipitation Microphysics Using Ground-Based Microwave Remote Sensors and Disdrometer Data. Atmos. Res. 2010, 97, 583–600. [Google Scholar] [CrossRef]
  30. Park, S.G.; Kim, H.L.; Ham, Y.W.; Jung, S.H. Comparative Evaluation of the OTT PARSIVEL2 Using a Collocated Two-Dimensional Video Disdrometer. J. Atmos. Ocean. Technol. 2017, 34, 2059–2082. [Google Scholar] [CrossRef]
  31. Raupach, T.H.; Berne, A. Correction of Raindrop Size Distributions Measured by Parsivel Disdrometers, Using a Two-Dimensional Video Disdrometer as a Reference. Atmos. Meas. Tech. 2015, 8, 343–365. [Google Scholar] [CrossRef] [Green Version]
  32. Thurai, M.; Petersen, W.A.; Tokay, A.; Schultz, C.; Gatlin, P. Drop Size Distribution Comparisons between Parsivel and 2-D Video Disdrometers. Adv. Geosci. 2011, 30, 3–9. [Google Scholar] [CrossRef] [Green Version]
  33. Tokay, A.; Petersen, W.A.; Gatlin, P.; Wingo, M. Comparison of Raindrop Size Distribution Measurements by Collocated Disdrometers. J. Atmos. Ocean. Technol. 2013, 30, 1672–1690. [Google Scholar] [CrossRef]
  34. Ulbrich, C.W. Natural Variations in the Analytical Form of the Raindrop Size Distribution. J. Clim. Appl. Meteorol. 1983, 22, 1764–1775. [Google Scholar] [CrossRef]
  35. Zhang, G.; Sun, J.; Brandes, E.A. Improving Parameterization of Rain Microphysics with Disdrometer and Radar Observations. J. Atmos. Sci. 2006, 63, 1273–1290. [Google Scholar] [CrossRef] [Green Version]
  36. Bringi, V.N.; Chandrasekar, V.; Hubbert, J.; Gorgucci, E.; Randeu, W.L.; Schoenhuber, M. Raindrop Size Distribution in Different Climatic Regimes from Disdrometer and Dual-Polarized Radar Analysis. J. Atmos. Sci. 2003, 60, 354–365. [Google Scholar] [CrossRef]
  37. Cao, Q.; Zhang, G. Errors in Estimating Raindrop Size Distribution Parameters Employing Disdrometer and Simulated Raindrop Spectra. J. Appl. Meteorol. Climatol. 2009, 48, 406–425. [Google Scholar] [CrossRef]
  38. Chen, G.; Zhao, K.; Wen, L.; Wang, M.; Huang, H.; Wang, M.; Yang, Z.; Zhang, G.; Zhang, P.; Lee, W.C. Microphysical Characteristics of Three Convective Events with Intense Rainfall Observed by Polarimetric Radar and Disdrometer in Eastern China. Remote Sens. 2019, 11, 2004. [Google Scholar] [CrossRef] [Green Version]
  39. Ji, L.; Chen, H.; Li, L.; Chen, B.; Xiao, X.; Chen, M.; Zhang, G. Raindrop Size Distributions and Rain Characteristics Observed by a PARSIVEL Disdrometer in Beijing, Northern China. Remote Sens. 2019, 11, 1479. [Google Scholar] [CrossRef] [Green Version]
  40. Kim, H.-J.; Jung, W.; Suh, S.-H.; Lee, D.-I.; You, C.-H. The Characteristics of Raindrop Size Distribution at Windward and Leeward Side over Mountain Area. Remote Sens. 2022, 14, 2419. [Google Scholar] [CrossRef]
  41. Loh, J.L.; Lee, D.I.; Kang, M.Y.; You, C.H. Classification of Rainfall Types Using Parsivel Disdrometer and S-Band Polarimetric Radar in Central Korea. Remote Sens. 2020, 12, 642. [Google Scholar] [CrossRef] [Green Version]
  42. Luo, L.; Guo, J.; Chen, H.; Yang, M.; Chen, M.; Xiao, H.; Ma, J.; Li, S. Microphysical Characteristics of Rainfall Observed by a 2dvd Disdrometer during Different Seasons in Beijing, China. Remote Sens. 2021, 13, 2303. [Google Scholar] [CrossRef]
  43. Luo, L.; Xiao, H.; Yang, H.; Chen, H.; Guo, J.; Sun, Y.; Feng, L. Raindrop Size Distribution and Microphysical Characteristics of a Great Rainstorm in 2016 in Beijing, China. Atmos. Res. 2020, 239, 104895. [Google Scholar] [CrossRef]
  44. Angulo-Martínez, M.; Beguería, S.; Latorre, B.; Fernández-Raga, M. Comparison of Precipitation Measurements by OTT Parsivel2 and Thies LPM Optical Disdrometers. Hydrol. Earth Syst. Sci. 2018, 22, 2811–2837. [Google Scholar] [CrossRef] [Green Version]
  45. Kruger, A.; Krajewski, W.F. Two-Dimensional Video Disdrometer: A Description. J. Atmos. Ocean. Technol. 2002, 19, 602–617. [Google Scholar] [CrossRef]
  46. Brandes, E.A.; Ikeda, K.; Zhang, G.; Schönhuber, M.; Rasmussen, R.M. A Statistical and Physical Description of Hydrometeor Distributions in Colorado Snowstorms Using a Video Disdrometer. J. Appl. Meteorol. Climatol. 2007, 46, 634–650. [Google Scholar] [CrossRef]
  47. Battaglia, A.; Rustemeier, E.; Tokay, A.; Blahak, U.; Simmer, C. PARSIVEL Snow Observations: A Critical Assessment. J. Atmos. Ocean. Technol. 2010, 27, 333–344. [Google Scholar] [CrossRef]
  48. Zhang, G.; Luchs, S.; Ryzhkov, A.; Xue, M.; Ryzhkova, L.; Cao, Q. Winter Precipitation Microphysics Characterized by Polarimetric Radar and Video Disdrometer Observations in Central Oklahoma. J. Appl. Meteorol. Climatol. 2011, 50, 1558–1570. [Google Scholar] [CrossRef] [Green Version]
  49. Huang, G.J.; Bringi, V.N.; Moisseev, D.; Petersen, W.A.; Bliven, L.; Hudak, D. Use of 2D-Video Disdrometer to Derive Mean Density-Size and Ze-SR Relations: Four Snow Cases from the Light Precipitation Validation Experiment. Atmos. Res. 2015, 153, 34–48. [Google Scholar] [CrossRef]
  50. Lee, J.E.; Jung, S.H.; Park, H.M.; Kwon, S.; Lin, P.L.; Lee, G.W. Classification of Precipitation Types Using Fall Velocity-Diameter Relationships from 2D-Video Distrometer Measurements. Adv. Atmos. Sci. 2015, 32, 1277–1290. [Google Scholar] [CrossRef]
  51. Wen, G.; Xiao, H.; Yang, H.; Bi, Y.; Xu, W. Characteristics of Summer and Winter Precipitation over Northern China. Atmos. Res. 2017, 197, 390–406. [Google Scholar] [CrossRef]
  52. Jia, X.; Liu, Y.; Ding, D.; Ma, X.; Chen, Y.; Bi, K.; Tian, P.; Lu, C.; Quan, J. Combining Disdrometer, Microscopic Photography, and Cloud Radar to Study Distributions of Hydrometeor Types, Size and Fall Velocity. Atmos. Res. 2019, 228, 176–185. [Google Scholar] [CrossRef]
  53. Yu, T.; Chandrasekar, V.; Xiao, H.; Joshil, S.S. Characteristics of Snow Particle Size Distribution in the Pyeongchang Region of South Korea. Atmosphere 2020, 11, 1093. [Google Scholar] [CrossRef]
  54. Pu, K.; Liu, X.; He, H.; Sun, Y.; Hu, S.; Wu, Y. Microphysical Characteristics of Winter Precipitation in Eastern China from 2014 to 2019. Water 2020, 12, 920. [Google Scholar] [CrossRef] [Green Version]
  55. Tao, R.; Zhao, K.; Huang, H.; Wen, L.; Zhang, G.; Zhou, A.; Chen, H. Snow Particle Size Distribution from a 2-D Video Disdrometer and Radar Snowfall Estimation in East China. IEEE Trans. Geosci. Remote Sens. 2021, 59, 196–207. [Google Scholar] [CrossRef]
  56. OTT Hydromet GmbH. Operating Instructions Present Weather Sensor OTT Parsivel2. 2016, 52. Available online: https://www.ott.com/download/operating-instructions-present-weather-sensor-ott-parsivel2-with-screen-heating-1/ (accessed on 20 November 2022).
  57. Löffler-Mang, M.; Blahak, U. Estimation of the Equivalent Radar Reflectivity Factor from Measured Snow Size Spectra. J. Appl. Meteorol. 2001, 40, 843–849. [Google Scholar] [CrossRef]
  58. Sekhon, R.S.; Srivastava, R.C. Snow Size Spectra and Radar Reflectivity. J. Atmos. Sci. 1970, 27, 299–307. [Google Scholar] [CrossRef]
  59. Marshall, J.S.; Gunn, K.L.S. Measurement Of Snow Parameters By Radar. J. Atmos. Sci. 1952, 9, 322–327. [Google Scholar] [CrossRef]
  60. Fujiyoshi, Y.; Endoh, T.; Yamada, T.; Tsuboki, K.; Tachibana, Y.; Wakahama, G. Determination of a Z-R Relationship for Snowfall Using a Radar and High Sensitivity Snow Gauges. J. Appl. Meteorol. 1990, 29, 147–152. [Google Scholar] [CrossRef]
  61. Matrosov, S.Y. Assessment of Radar Signal Attenuation Caused by the Melting Hydrometeor Layer. IEEE Trans. Geosci. Remote Sens. 2008, 46, 1039–1047. [Google Scholar] [CrossRef]
  62. Locatelli, J.D.; Hobbs, P.V. Fall Speeds and Masses of Solid Precipitation Particles. J. Geophys. Res. 1974, 79, 2185–2197. [Google Scholar] [CrossRef]
  63. Yuter, S.E.; Kingsmill, D.E.; Nance, L.B.; Löffler-Mang, M. Observations of Precipitation Size and Fall Speed Characteristics within Coexisting Rain and Wet Snow. J. Appl. Meteorol. Climatol. 2006, 45, 1450–1464. [Google Scholar] [CrossRef] [Green Version]
  64. Gunn, R.; Kinzer, G.D. The Terminal Velocity of Fall for Water Droplets in Stagnant Air. J. Meteorol. 1949, 6, 243–248. [Google Scholar] [CrossRef]
  65. Mitchell, D.L. Use of Mass-and Area-Dimensional Power Laws for Determining Precipitation Particle Terminal Velocities. J. Atmos. Sci. 1996, 53, 1710–1723. [Google Scholar] [CrossRef]
  66. Fehlmann, M.; Rohrer, M.; Von Lerber, A.; Stoffel, M. Automated Precipitation Monitoring with the Thies Disdrometer: Biases and Ways for Improvement. Atmos. Meas. Tech. 2020, 13, 4683–4698. [Google Scholar] [CrossRef]
  67. Magono, C.; Nakamura, T. Aerodynamic Studies of Falling Snowflakes. J. Meteorol. Soc. Japan. Ser. II 1965, 43, 139–147. [Google Scholar] [CrossRef]
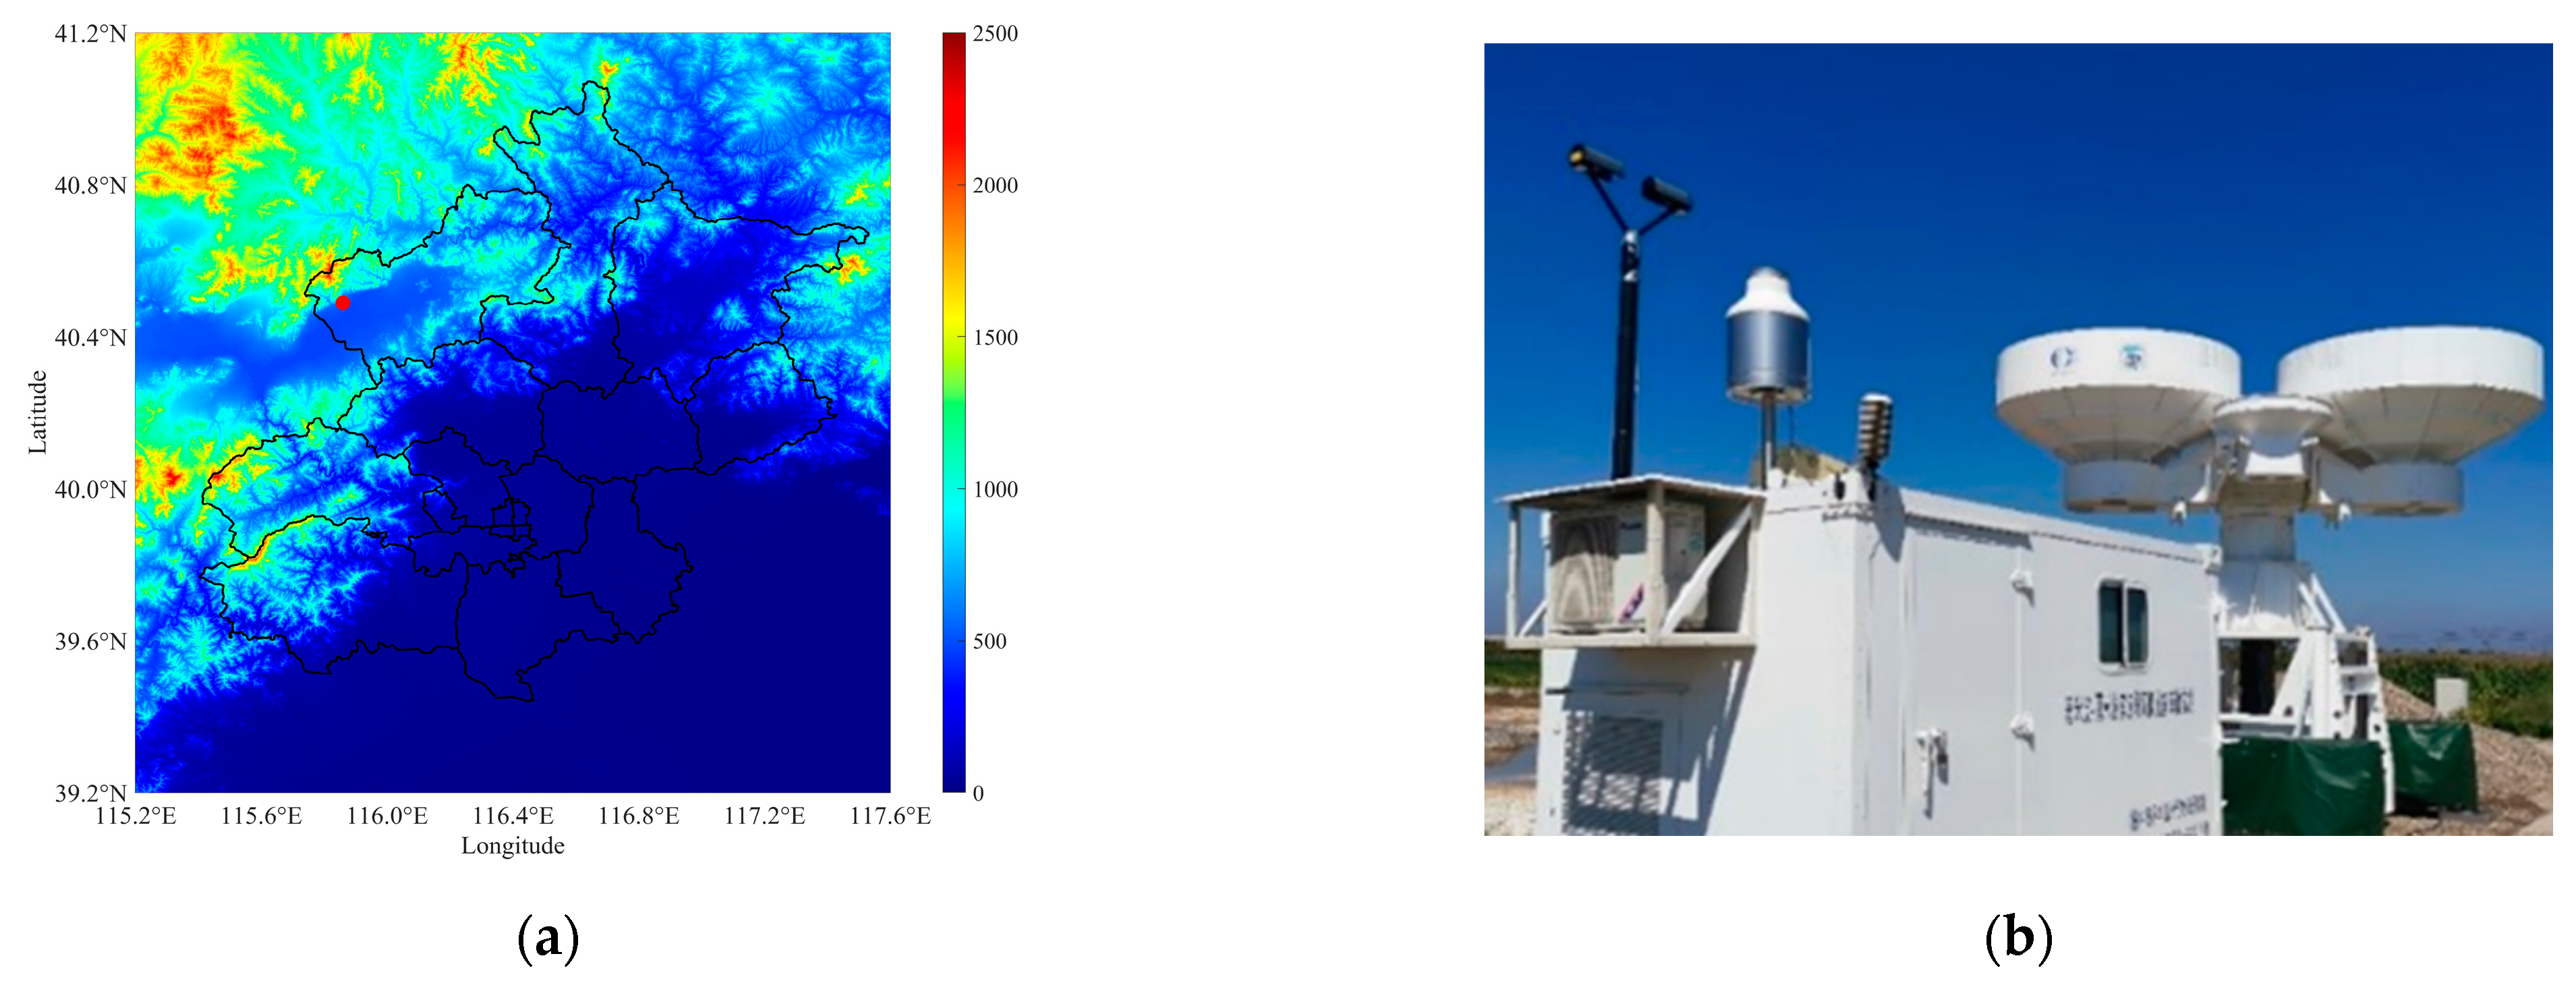
Figure 1. (a) Geographical location of Beijing joint winter snowfall observation experiment and (b) Snowfall observation apparatus.
Remotesensing 14 06025 g001
Figure 2. (a) PSDs of eight snowfall events, (b) Mean PSDs corresponding to three types of snow rate.
Remotesensing 14 06025 g002
Figure 3. Distribution of (a) PSD N ( D ) , (b) Snow rate S R and (c) Total number concentration N t   over time during the snowfall on 13 February 2022.
Remotesensing 14 06025 g003
Figure 4. Distribution of (a) PSD N ( D ) , (b) Snow rate S R and (c) Total number concentration N t   over time during the snowfall on 18 March 2022.
Remotesensing 14 06025 g004
Figure 5. The scatter distribution and mean values (the length of the error bar is the standard deviation) of l o g 10 N w and D m of different S R [36,54].
Remotesensing 14 06025 g005
Figure 6. Scatterplot and binomial relationship fitting of μ and Λ [46,54].
Remotesensing 14 06025 g006
Figure 7. Comparison of snow cumulation from weighing precipitation gauge and disdrometer on 18 March 2022.
Remotesensing 14 06025 g007
Figure 8. Diameter and density scatterplot of all snowfalls and the ρ s D m relationship fitting [53].
Remotesensing 14 06025 g008
Figure 9. Scatterplots of Z e and S R of all snowfalls and Z e S R relationship fitting [54,55].
Remotesensing 14 06025 g009
Figure 10. Distribution of particle falling velocity and diameter for three S R , where (ac) correspond to S R   ≤ 0.5 mm/h, 0.5 <   S R < 2.5 mm/h and S R   ≥ 2.5 mm/h, respectively.
Remotesensing 14 06025 g010
Table 1. The number of samples data for different types of precipitation.
Case No.DateWeather SystemDZRADZRARASN−SNSN+SNGS
12021.02.15Upper trough11---523--
22021.02.23Return flow and upper trough17---971075-
32021.02.28Return flow and low vortex946189493219363
42021.03.18Upper trough2486113183111263
52021.03.19Upper trough-12193517691050
62022.01.21Return flow and upper trough41--11830--
72022.02.13Return flow and low vortex----21327719-
82022.03.18Low vortex22--6514588-
Table 2. The mean (ME) and standard deviation (SD) of l o g 10 N w and D m of different types of snow.
Snow Types l o g 10 N w D m
MESDMESD
SR ≤ 0.53.550.762.531.90
0.5 < SR < 2.53.810.702.732.15
SR ≥ 2.54.200.672.491.75
Wet snow3.750.711.800.82
Dry snow3.730.752.942.23
Pu et al. (2020) [54] Wet snow 2.950.493.171.78
Pu et al. (2020) [54] Dry snow2.990.633.492.00
Table 3. The relationship of μ Λ for snow.
Snow TypesLocation μ Λ
SR ≤ 0.5Beijing, China μ = 0.0028 Λ 2 + 0.5804 Λ 0.3088
0.5 < SR < 2.5Beijing, China μ = 0.0004 Λ 2 + 0.6728 Λ 0.6080
SR ≥ 2.5Beijing, China μ = 0.0034 Λ 2 + 0.9628 Λ 1.5841
Wet snowBeijing, China μ = 0.0056 Λ 2 + 0.8206 Λ 1.3713
Dry snowBeijing, China μ = 0.0009 Λ 2 + 0.6316 Λ 0.3639
Total snowBeijing, China μ = 0.0005 Λ 2 + 0.6582 Λ 0.5576
Brandes et al. [46]Colorado, USA μ = 0.00499 Λ 2 + 0.798 Λ 0.666
Pu et al. [54] Wet snowNanjing, China μ = 0.0066 Λ 2 + 0.8688 Λ + 0.8648
Pu et al. [54] Dry snowNanjing, China μ = 0.0106 Λ 2 + 0.9936 Λ 0.0820
Table 4. The relationship of ρ s D m for snow.
Snow TypesLocation ρ s D m
Wet snowBeijing, China ρ s = 0.5041 × D m 0.909
Dry snowBeijing, China ρ s = 0.3987 × D m 1.656
Total snowBeijing, China ρ s = 0.4407 × D m 1.327
Yu et al. [53]Pyeongchang, Republic of Korean ρ s = 0.3358 × D m 1.243 ,   D m > 1.7 m m ρ s = 0.3774 × D m 1.386 ,   1.7 m m < D m < 2.7 m m ρ s = 0.462 × D m 1.879 ,   D m < 1.7 m m
Table 5. The relationship of Z e S R for snow.
Snow TypeLocation Z e S R
Dry snowBeijing, China Z e = 72 × S R   1.28
Tao, et al. [55] Dry snowNanjing, China Z e = 116.22 × S R   1.35
Pu et al. [54] Dry snowNanjing, China Z e = 145 × S R   1.33
Table 6. The relationship of v D for rain, melting, graupel and snow.
Precipitation Types v D
Rain v = 9.65 ( 10.3 × e 0.6 D )
Melting v = 4.65 ( 5 × e 0.95 D )
Graupel v = 1.3 × D 0.66
Snow v = 0.79 × D 0.24
Publisher’s Note: MDPI stays neutral with regard to jurisdictional claims in published maps and institutional affiliations.