Article

Comparison of the WRF-FDDA-Based Radar Reflectivity and Lightning Data Assimilation for Short-Term Precipitation and Lightning Forecasts of Severe Convection

1
Key Laboratory for Aerosol-Cloud-Precipitation of China Meteorological Administration, Nanjing University of Information Science and Technology, Nanjing 210044, China
2
Precision Regional Earth Modeling and Information Center (PREMIC), Nanjing University of Information Science and Technology, Nanjing 210044, China
3
Collaborative Innovation Center on Forecast and Evaluation of Meteorological Disasters (CIC-FEMD), Nanjing University of Information Science and Technology, Nanjing 210044, China
*
Author to whom correspondence should be addressed.
Remote Sens. 2022, 14(23), 5980; https://doi.org/10.3390/rs14235980
Submission received: 20 September 2022 / Revised: 29 October 2022 / Accepted: 23 November 2022 / Published: 25 November 2022
(This article belongs to the Section Atmospheric Remote Sensing)

Abstract

:
This work evaluates and compares the performance of the radar reflectivity and lightning data assimilation schemes implemented in weather research and forecasting-four-dimensional data assimilation (WRF-FDDA) for short-term precipitation and lightning forecasts. All six mesoscale convective systems (MCSs) with a duration greater than seven hours that occurred in the Guangdong Province of China during June 2020 were included in the experiments. The results show that both the radar reflectivity data assimilation and lightning data assimilation improved the analyses and short-term forecasts of the precipitation and lightning of the MCSs. On average, for precipitation forecasts, the experiments with radar reflectivity data assimilation performed better than those with lightning data assimilation; however, for lightning forecasts, the experiments with lightning data assimilation performed better in the analysis period and 1 h forecast, and for some cases, the superiority lasted to three forecast hours. This highlights the potential of lightning data assimilation in short-term lightning forecasting.

1. Introduction

Heavy precipitation and lightning accompanied by severe convective weather account for significant life and property losses worldwide. To mitigate their impact, the accurate and timely prediction of such events is of critical importance. Convection-allowing numerical weather prediction (NWP) models have become the main tools for forecasting the precipitation and lightning of severe convection [1,2,3,4,5,6,7]. Accurate model initial conditions are crucial for convection-allowing models to forecast convection as the errors in model initial conditions at small scales can grow rapidly and amplify to large scales during model integration [8].
Weather radar detects convective systems with a very high spatial and temporal resolution, and radar reflectivity data are one of the most important data sources for convective-scale data assimilation to improve the precipitation and lightning forecasts of convective systems. Currently, there are several techniques to assimilate radar data into convection-allowing NWP models, such as cloud-analysis-based methods [9,10,11,12], three-dimensional variational data assimilation (3DVAR) [13,14,15], four-dimensional variational data assimilation (4DVAR) [16,17], the ensemble Kalman filter (EnKF) [18,19,20,21,22,23,24], and hybrid 3DVAR and EnKF methods [25,26,27,28].
Lightning data are another type of data with high spatial and temporal resolution. Previous observational studies [29,30,31,32,33] have demonstrated that total lightning rates, i.e., the sum of intracloud (IC) and cloud-to-ground (CG) lightning rates, are strongly correlated with the graupel content and strong updrafts in severe convective systems. Encouraging results have been documented in previous studies using various methods to assimilate ground-based or geostationary-satellite-based lightning data at a convection-allowing scale. For example, several studies have employed the nudging method to incrementally add water vapor content, latent heat releases, and/or a graupel mixing ratio to the model columns where lightning flashes are observed [5,34,35,36,37]. The 3DVAR and ensemble-based methods have also been applied to assimilate lightning data and to improve the forecast of convective weather in recent years [38,39,40,41,42].
Although lightning and precipitation are both products of severe convective systems, they are produced by different mechanisms. Precipitation is closely related to the liquid and ice phase hydrometeors through the warm and cold rain processes [43,44,45,46], while rimed ice-phase particles and strong local updrafts are critical for the electrification and subsequent lightning discharge in severe convective systems [44,47,48,49,50]. Therefore, there are some differences in the determinants of precipitation and lightning forecast accuracy in severe convective systems. Since radar reflectivity data and lightning data reflect the different information of convective systems, the assimilation of these two kinds of data may differ in the performance of lightning forecasts and precipitation forecasts.
The weather research and forecasting-four-dimensional data assimilation (WRF-FDDA) is a nudging-based data assimilation system developed at the National Center for Atmospheric Research (NCAR), in which a radar reflectivity data assimilation scheme and a lightning data assimilation scheme have been implemented, respectively [5,12,51,52,53,54]. This study aims at evaluating and comparing the effects of assimilating radar reflectivity and lightning data with the WRF-FDDA on the short-term precipitation and lightning forecasts of severe convective systems over the Guangdong province, a sub-tropical coastal province in southern China. All six mesoscale convective systems (MCSs) with a duration greater than seven hours that occurred in the Guangdong Province of China during June 2020 were included in the study.

2. Methodology and Model Setups

2.1. Data for Assimilation and Verification

The radar reflectivity data used in this study are the three-dimensional gridded mosaic dataset merged from a regional network of S-Band radars. The radar datasets are updated at time intervals of 12-min. The mosaic radar reflectivity data were interpolated onto the innermost convection-allowing model grids for assimilation (3 km × 3 km in this study).
The lightning data employed in this study are from the lightning detection network in the Guangdong Province of China, which is under the operation of the Guangdong Meteorological Bureau and the Earth Networks Total Lightning Network (ENTLN). The lightning detection network consists of 16 ground sensors deployed over Guangdong Province with a location accuracy of about 600 m and a detection efficiency of about 77% [55]. The lightning detection network detects both cloud-ground lightning flashes and intracloud lightning flashes. The lightning data were interpolated onto the innermost model grids from the original longitude and latitude coordinates and accumulated over 12 min intervals by a method similar to [5].
The radar and lightning data were also used for the evaluation of the simulation results. Additionally, the hourly gridded precipitation data from the China meteorological administration multi-source merged precipitation analysis system (CMPAS) [56] were employed to evaluate the precipitation forecast results. The CMPAS analysis is based on the observations from radars, satellites, and rain gauges, with a spatial resolution of 0.01°. The CMPAS precipitation data were interpolated to the innermost model grids to establish direct comparisons with the simulation results.

2.2. Radar Reflectivity Data Assimilation Scheme

The radar reflectivity data assimilation scheme used in this study is a cloud-analysis-based nudging method implemented in the WRF-FDDA, as mentioned in Section 1 [12,54]. In this scheme, the hydrometeor mixing ratios of rain, graupel, and snow ( q r , q g , and q s ) are retrieved with radar reflectivity data and ambient temperatures on the basis of the algorithms proposed by [11,13,57,58]. The dominant hydrometeor type of each model grid point is first identified with radar reflectivity data and an ambient temperature. The ambient temperature fields are derived from the model background fields. For grid points with an ambient temperature above 0 °C and a reflectivity greater than 0 dBZ, the dominant hydrometeor type is identified as rain. For grid points with an ambient temperature below 0 °C, the dominant hydrometeor is identified as graupel when the reflectivity is greater than 32 dBZ and as snow when the reflectivity is between 0 and 32 dBZ. Retrieving multiple coexisting hydrometeor species within a grid point relies on empirical parameters in the cloud-analysis method. In this study, for the grid points identified as graupel-dominated, 5% of the observed total equivalent radar reflectivity factor is distributed to snow.
The q r , q g , and q s are then computed using the Z-q equation, respectively (Equation (1), [59]).
Z e x = 7.2 × 10 20   K x 2 K w 2 ρ q x 1.75 π 1.75 N 0 x 0.75 ρ x 1.75
Here, ρ is the air density (kg m−3), x represents different hydrometeor species, q x , N 0 x are the mixing ratio (kg kg−1), particle spectrum intercept parameter (m−4) for hydrometeor x, respectively. K x is the dielectric factor for hydrometeor x, and K w is the dielectric factor for water. For raindrops, K x 2 / K w 2 is equal to 1. For graupel and snow, K x 2 / K w 2 is equal to 0.224 ρ x 2 / ρ w 2 . The parameter values of N 0 r , N 0 g , N 0 s are 8 × 10 6 , 4 × 10 6 ,   2 × 10 7 (m−4), respectively, and ρ r , ρ g , ρ s are 1000, 400, 100 (kg m−3), respectively.
The temperature increments are derived from the empirically calculated latent heating rates, which are proportional to the hydrometeor mixing ratio increments (as in Equation (2)).
Δ T = Δ Q x · L x / C p
where Δ T and Δ Q x are the temperature increments and hydrometeor mixing ratio increments, respectively. L x is the specific latent heat of condensation or the deposition of water, and C p is the specific heat of air at a constant pressure.
The hydrometeor mixing ratio retrievals and temperature increments are then ingested into the model via the nudging terms, as expressed by Equation (3).
X ¯ t = P X ¯ t + G Χ · T Χ · Y Χ b
where X ¯   is the model state variable,   Χ b and Y are the background and the retrieved value of the variable, respectively. P X ¯ t stands for the original dynamical and physical terms of the WRF model prognostic equations, G Χ is the relaxation time scale, taken as the inverse of the assimilation time-interval (i.e., 12 min herein), and T Χ is a time weight which is a function of the time lags between the model state and observation.

2.3. Lightning Data Assimilation Scheme

The lightning data assimilation scheme implemented in the WRF-FDDA by Wang et al. [5] was utilized in this study. In this method, the three-dimensional graupel mixing ratio fields were retrieved from the observed lightning flash rates. Firstly, the column-integrated graupel mass fields (between −10 °C and −40 °C isotherms) were retrieved from the observed total lightning rates using a linear observation operator between the lightning rate and graupel mass (Equation (4), [60]).
F = 2.43 × 10 8 · M g  
where F is the total lightning rate (per min),and Mg is the integral graupel mass (kg) in the layer confined between the −10 °C and −40 °C isotherms.
The climatologically averaged profiles of qg for the different bins of the column-integrated graupel masses are then used to retrieve the three-dimensional qg fields. In this study, the climatologically averaged profiles of qg for different column-integrated graupel mass bins were obtained by the retrospective simulations of 10 individual summer severe convective systems over the Guangdong province. The domain setup and physics scheme employed in the retrospective simulations are the same as those used in the experiments of this study.
A distance-weighting function based on the spread method was applied to account for the graupel in the adjacent regions of observed lightning locations (Equations (5) and (6)):
q g x = i = 1 N q g x i · W i r i , R N
where qg(x) is the qg on the grid x with zero lightning observation, qg(xi) is the qg on the grid xi with non-zero lightning observation around the grid x, and within the influence radius R, N is the number of grids with non-zero lightning observations around the grid x within the influence radius R, and Wi is a spatial-weight function formulated by [61] defined as:
W i r i , R = R 2 r i 2 R 2 + r i 2 ,   0 < r i R 0 ,   r i > R
where ri is the horizontal distance between the grid points x and xi. In the previous lightning data assimilation studies, the horizontal spread length scales/horizontal decorrelation length scales are usually between 6 and 12 km [39,62]. We also tested several values of horizontal spread length scales; the value of 6 km appeared to produce better results. Therefore, the horizontal spread radius R was set to 6 km in this study.
The temperature increments are derived from the empirically calculated latent heating rates, which are proportional to the graupel mixing ratio increments (as in Equation (7)).
Δ T = Δ Q q · L x / C p
where Δ T and Δ Q q are the temperature increments and graupel mixing ratio increments, respectively, L x is the specific latent heat of the condensation or freezing water, and C p is the specific heat of air at a constant pressure. Below the 0 °C layer and above the lifting condensation level (LCL), Δ T was linearly produced from its value at the 0 °C layer to zero.
Similar to the radar reflectivity data assimilation scheme described above, the graupel mixing ratio retrievals and temperature increments are ingested into the model via the nudging terms, as expressed by Equation (3). For more details on the lightning data assimilation scheme employed in this study, the reader is invited to consult [5].

2.4. Lightning Forecast Scheme

The lightning flash rate diagnostic prediction scheme developed by [63] was used in this study, whereby the lightning flash rate is assumed to be proportional to the gridded vertical integral of the graupel mass based on the close relationship between the lightning flash rate and graupel content (Equation (8)).
F = h [ ρ q g   d z ]  
In Equation (8), F is the lightning flash rate, ρ is the local air density, q g is the simulated graupel mixing ratio, and h is a linear calibration parameter. The study in [63] has shown that this lightning flash rate diagnostic prediction scheme does a good job of depicting the areal coverage of lightning.

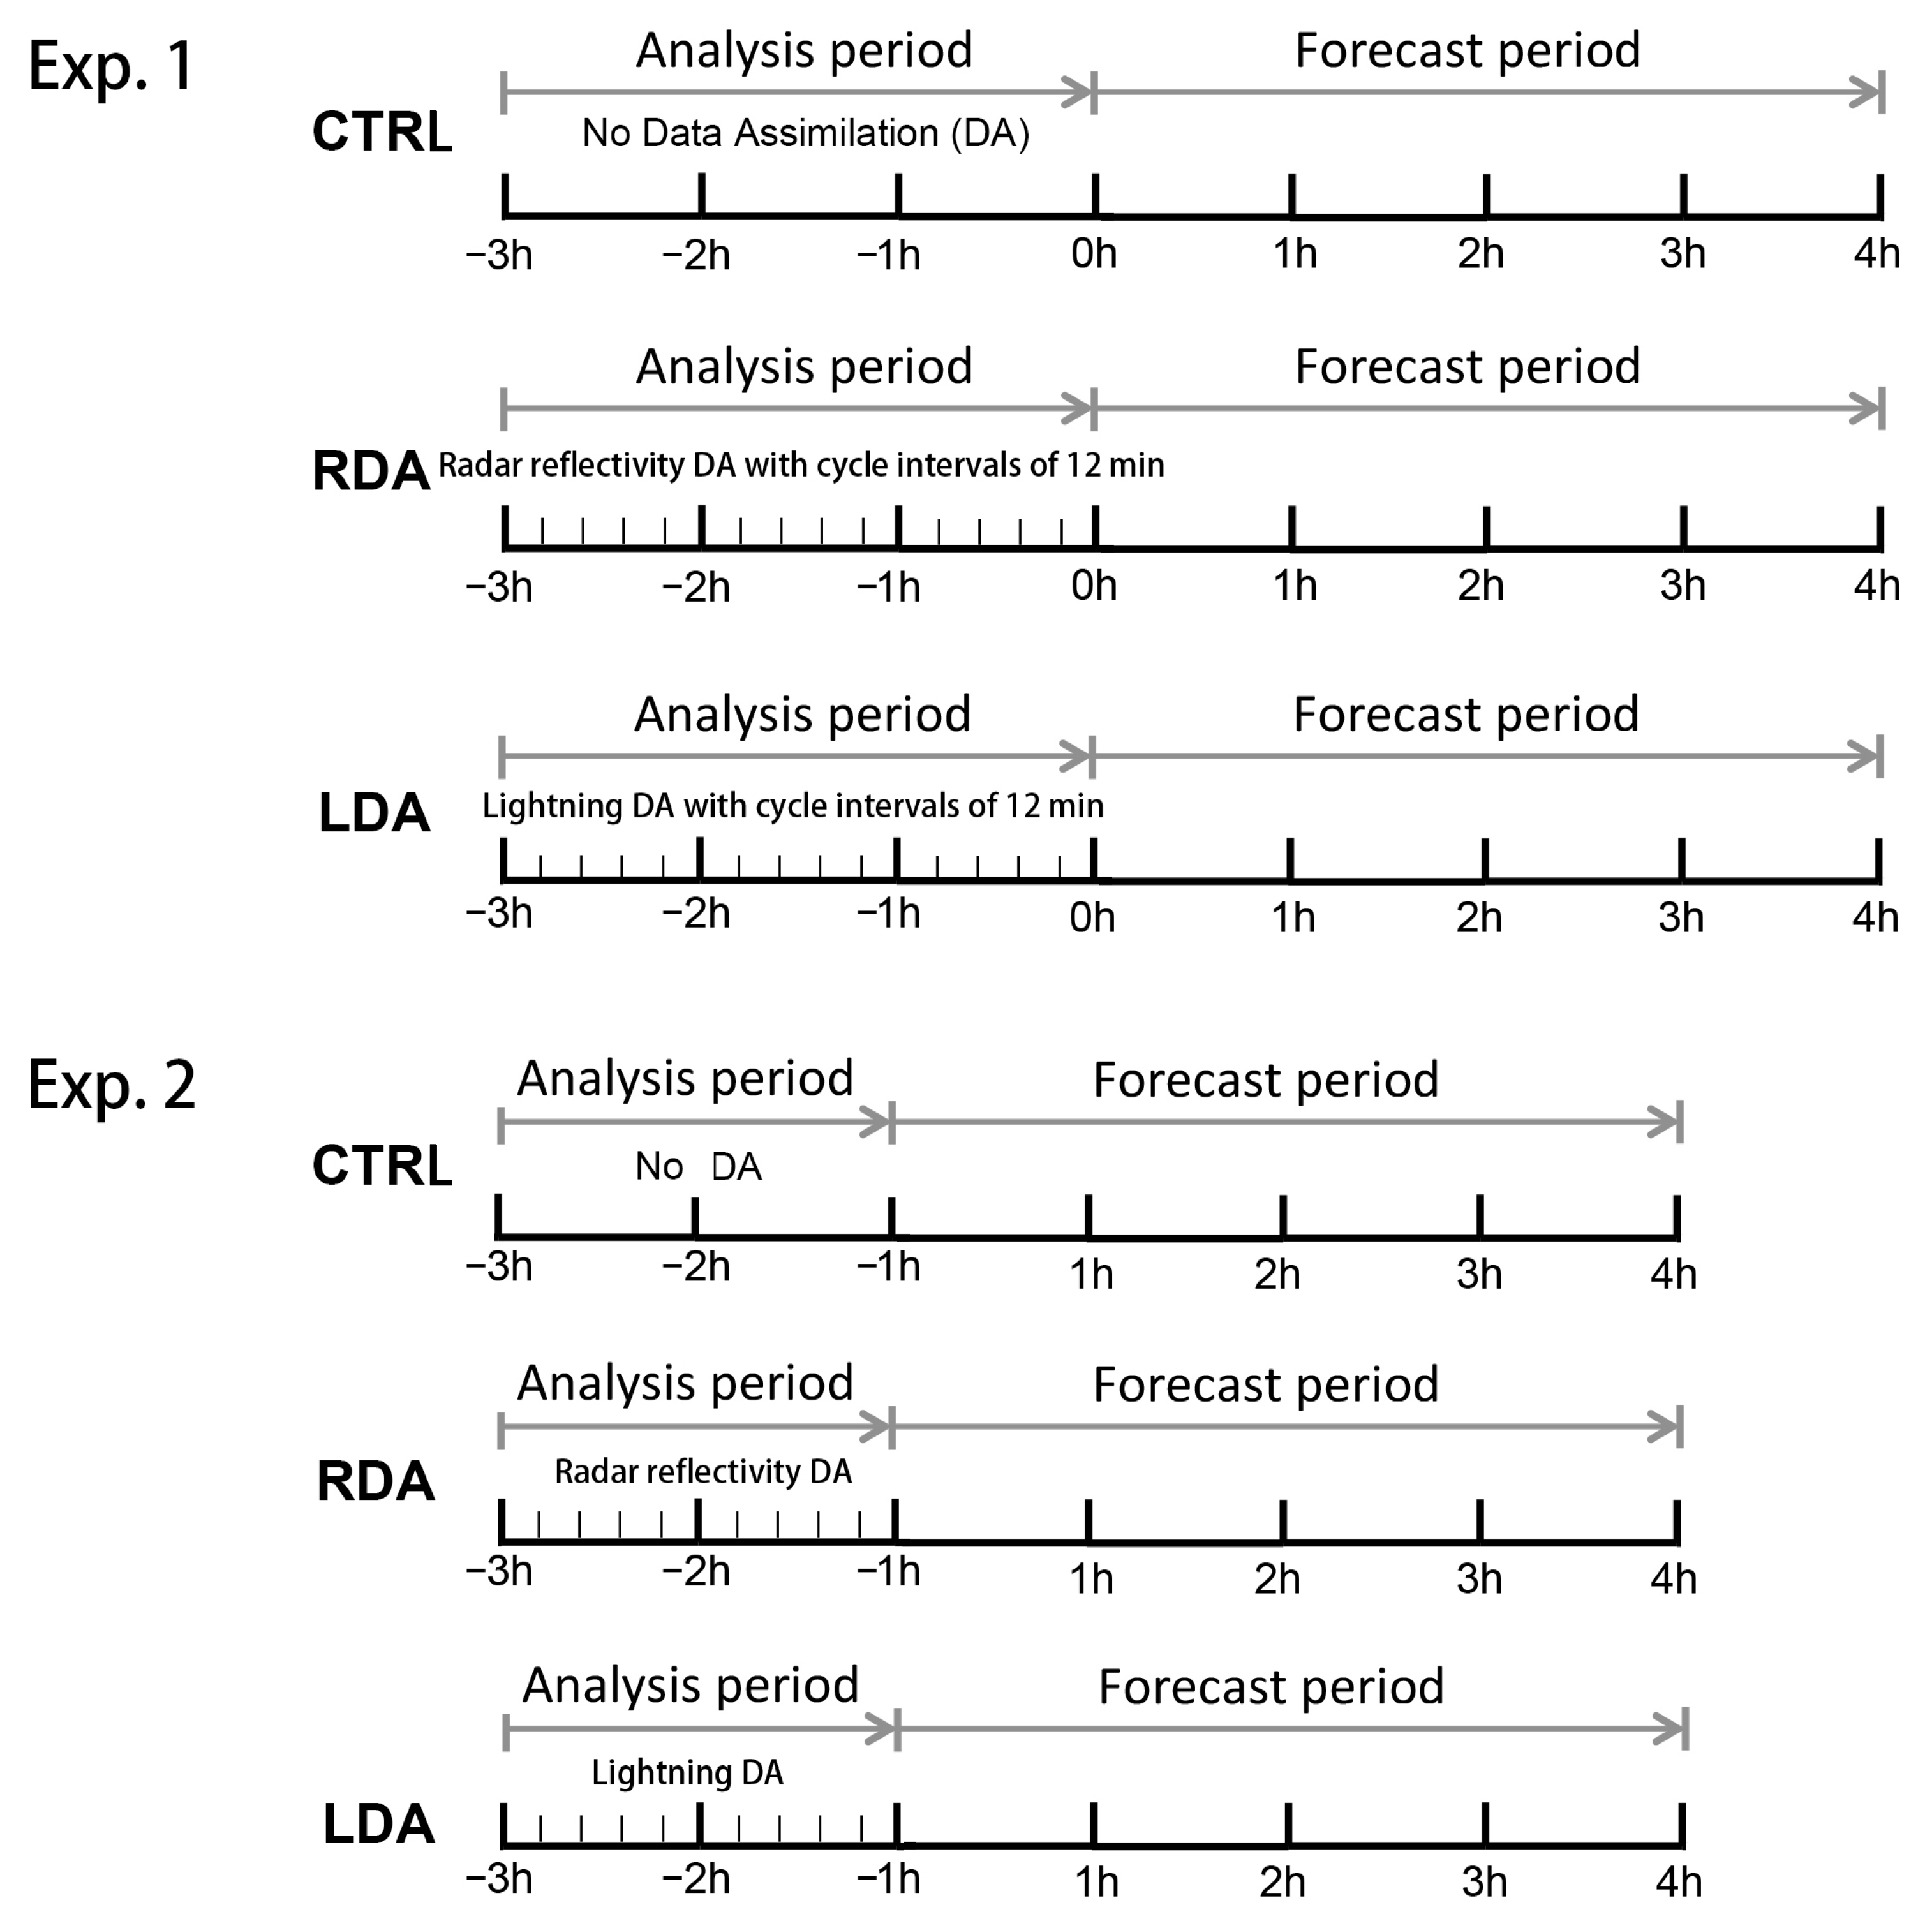
2.5. Model Configuration and Case Description

All six MCSs with a duration greater than seven hours that occurred in Guangdong during June 2020 were included in the study. Two sets of experiments with different data assimilation time windows were performed. For the first set of experiments, the data assimilation period was 3 h before a 4 h short-term forecast was made. For the second set of experiments, the data assimilation period was 2 h before a 4 h short-term forecast was made. The simulation periods for the six MCSs are given in Table 1.
For each set of experiments, three simulation runs were conducted: (1) using the WRF-FDDA-based radar reflectivity data assimilation (termed as RDA), (2) using the WRF-FDDA-based lightning data assimilation (termed as LDA), (3) without data assimilation (termed as CTRL). In RDA and LDA, radar reflectivity and lightning data were continuously assimilated into the model with cycle intervals of 12 min (i.e., the assimilated data were updated every 12 min). Figure 1 shows the schematic design of the two sets of simulation experiments.
The model used in this study is the three-dimensional compressible non-hydrostatic weather research and forecasting model (WRF version 4.1.2) [64]. The domain configuration includes three nested-grid domains (Figure 2) with a horizontal grid spacing of 27 km, 9 km, and 3 km, respectively. Radar reflectivity and lightning data were assimilated in the innermost model domain (Domain 3) with convection-allowing grid spacing (3 km). Two-way nesting between the parent and inner domains was activated, so the impact of the data assimilation could be feedback from the innermost convection-allowing domain to the outer domains. All model domains have 43 vertical (WRF eta) levels, and the model top was set at 50 hPa.
The physical parameterization schemes used in this study include the Mellor–Yamada–Janjic turbulence kinetic energy (TKE) scheme for the planetary boundary layer [65], the Thompson scheme [66] for the microphysics, the Noah land surface model [67] for the land surface processes, and the rapid radiative transfer model GCMs (RRTMG) for longwave and shortwave radiation transfer [68]. The Grell–Freitas cumulus parameterization scheme (CPS) [69] was employed in Domains 1 and 2, and no CPS was activated in Domain 3.

3. Results

In this section, detailed analyses of the results of the convective event of 8 June 2020 (CASE 4, Table 1) in the first set of experiments are first presented. The statistical evaluations of the precipitation and lightning forecasts for all six convective system events, in terms of the fractions skill score (FSS) as a metric [70], were then reported.

3.1. Case Study of 8 June 2020

Figure 3 shows the observed and simulated radar reflectivity fields at the end time of the data assimilation window at (2100 UTC), 1 h (2200 UTC), and 3 h (0000 UTC) forecast times, respectively. Both RDA and LDA produced more accurate spatial orientation and coverage of the convective system than CTRL for both the analysis and forecast fields. In RDA, the regions with a reflectivity greater than 35 dBZ were broader than those in the observations, and some spurious convective cells were presented in RDA.
Previous studies have shown that the latent heat released by the deposition of vapor onto ice particles dominates in the upper stratiform region, while the latent heat absorbed by melting and evaporation dominates in the lower stratiform region [71,72,73]. Thus, net heating is usually presented in the upper stratiform region, while net cooling is usually presented in the lower stratiform region [72]. However, in RDA, since the analysis increments of the temperature are proportional to the hydrometeor mixing ratios retrieved from the radar reflectivity observations, the analysis increments of the temperature were positive in both the convective and stratiform regions (not shown), which promoted wider updrafts (Figure 4c) and produced wider and high reflectivity regions (i.e., the regions with a reflectivity greater than 35 dbz, Figure 3j).
In LDA, the convective cores of the convective system were well simulated; however, some observed stratiform clouds far away from the convective cores were not well reproduced (e.g., the stratiform clouds indicated by the black arrows in Figure 3a,g. This is mainly because most of the lightning flashes are generated in the convective regions of convective systems [33,50,74], and lightning data mainly reflect the information of the convective regions.
The two experiments with data assimilation (RDA and LDA) evidently outperformed the experiment without data assimilation (CTRL) in precipitation forecasts (Figure 5), indicating that both radar reflectivity and lightning data assimilation could improve precipitation forecasts. Consistent with the radar reflectivity simulation, the precipitation regions forecasted in RDA were wider compared to those in the observations (Figure 5j–l), which was mainly a result of the wider updraft and high reflectivity regions in RDA (Figure 3 and Figure 4). For the LDA experiment, some of the observed heavy precipitation bands were well forecasted, but some other observed precipitation bands were missing, especially the stratiform precipitation far away from the convective cores (e.g., the stratiform precipitation indicated by the black arrows in Figure 5a,g). As mentioned above, this is mainly due to the fact that lightning data mainly reflect the information of convective regions, while radar reflectivity data can capture the information of hydrometeors in the convective and stratiform regions of convective systems.
Using the control experiment as a benchmark, both the radar reflectivity and lightning data assimilation improved the short-term lightning forecasts (Figure 6). RDA produced more spurious lightning forecasts compared to LDA, especially at a 1 h forecast (e.g., the regions indicated by the black arrow in Figure 6j). In RDA, a reflectivity threshold of 32 dBZ was used to distinguish the graupel-dominated and snow-dominated regions above the 0 °C layer. However, the reflectivity of snow and graupel is partially coincident [75]. For the regions where the graupel particles did not exist, the radar reflectivity could have been greater than 32 dBZ, which may have resulted in the misidentification of the dominant hydrometeor type. In the area indicated by the black arrow in Figure 6j, the observed radar reflectivity above the 0 °C layer and over a large area was greater than 32 dBZ; therefore, graupel particles were identified and retrieved (Figure 4c). In addition, since stronger updrafts enhance the formation of graupel [44,47,48,49,50], the wider updrafts in RDA (Figure 4c) also resulted in more regions with graupel being produced.
Observational and modeling studies have found that lightning flash rates are closely related to strong updrafts and graupel content [44,47,48,49,50]; therefore, wider updrafts and graupel regions in RDA led to more spurious lightning forecasts. For this convective event, the spatial coverage of lightning regions in LDA was slightly closer to the observations compared to RDA in the 1–3 h forecasts (Figure 6), indicating that lightning data better captured the strong updrafts and graupel regions of the convective systems compared to radar reflectivity data for this convective event.

3.2. Statistical Evaluation Results

To evaluate the precipitation and lightning forecasts of different experiments, a neighborhood-based verification method called the fractions skill score (FSS) [70] was employed. The advantage of FSS is that it can avoid the “double-penalty” issue caused by the small spatial displacement of the simulated convection from observations, which occurs frequently when simulating convective systems at fine-scale grid spaces. The FSS is computed with the equation as follows:
FSS = 1 1 N i = 1 N p f p o 2 1 N i = 1 N p f 2 + 1 N i = 1 N p o 2
where N is the number of grid points in the verification domain and p f and p o is the fractional coverage of the studied elementary area in the forecast and observation, respectively. The closer the value of FSS is to one, the closer the simulation and observation are. The FSS evaluation method has been widely used to quantify the performance of precipitation and lightning forecasts within the convection-allowing NWP models [3,5,76]. For more details of the FSS, the reader is invited to consult [70].
In this study, the FSSs of the hourly accumulated precipitation and lightning density of the simulation experiments were computed against the observations with a neighborhood radius of 24 km (i.e., eight model grid points) and at the thresholds of 2 and 10 mm (for precipitation forecasts) and one per grid cell (for lightning forecasts), respectively. An area with a lightning density of one per grid cell denotes a potential lightning threat in that area, so we used this threshold to compute the FSS for lightning forecasts. Additionally, since the areas with lightning flashes are relatively localized, using a larger threshold would result in a very small value of FSS.
The FSSs were calculated separately for each convective event, and the average, maximum, and minimum values of the calculated results for all the cases of the two sets of experiments are shown in Figure 7.
Compared to CTRL, the assimilation of the radar reflectivity data and lightning data both improved the FSSs for precipitation and lightning forecasts (Figure 7). For precipitation forecasts (Figure 7a–d), RDA achieved higher FSSs than LDA in both the analysis and forecast periods. As mentioned in Section 3.1, this is mainly because most of the lightning flashes are generated in the convective regions of the convective systems [33,50,74], which cannot reflect the information of stratiform regions appropriately, while radar reflectivity data can capture the information of hydrometeors in both the convective and stratiform regions of convective systems. For each experiment, the values of the FSSs decreased with an increasing threshold because the targeted precipitation areas were more localized with the increased threshold. However, the overall trends of the scores did not show much change.
For the lightning forecasts (Figure 7e,f), on average, LDA scored higher than RDA in the analysis period and at a 1 h forecast in the first set of experiments and scored higher in the analysis period at 1 h and 2 h forecasts in the second set of experiments, which suggests that lightning data better indicated the strong updrafts and graupel of severe convective systems compared to the radar reflectivity data. Although in some cases, LDA achieved higher FSSs than RDA in the 3 h and 4 h forecasts, on average, RDA scored higher than LDA except for the 3 h forecast in the second set of experiments. Previous studies have found that the stratiform region of the MCS could influence the local dynamic and thermodynamic environments of the MCS [72,77]. In our case, the role of the stratiform regions and associated cell-scale circulations on the development of the convective regions and the whole MCS gradually started to manifest in the subsequent free forecast window after the end of the data assimilation window. As a result, on average, the performance of LDA declined more quickly compared to RDA after the analysis period.
In RDA, the radar reflectivity retrieved hydrometeors by mixing ratios (i.e., qr, qg, and qs) and were nudged into the model, which could directly affect the surface precipitation through the sedimentation of rain, snow, and graupel and, thus, notably enhanced the simulation of precipitation in the analysis period and achieved higher scores (Figure 7a–d). In LDA, lightning retrieved qg, and the associated latent heat was nudged into the model, although the sedimentation of graupel could affect the surface precipitation; however, the information of the hydrometeors mixing ratios retrieved by the lightning data was not as comprehensive as that retrieved by the radar reflectivity data. Therefore, surface precipitation was gradually spun up in LDA (Figure 7a–d), and the shape of the FSSs curves for the precipitation forecasts of LDA and RDA were different. For lightning forecasts, since lightning flash rates are strongly correlated with the graupel content and strong updrafts of severe convective systems, LDA achieved relatively high FSSs in the analysis period (Figure 7e,f).

4. Conclusions and Discussion

This study evaluates and compares the performance of the radar reflectivity and lightning data assimilation schemes implemented in the WRF-FDDA for short-term precipitation and lightning forecasts, respectively. All six MCSs with a duration greater than seven hours that occurred in the Guangdong Province of China during June 2020 were included in the experiments. Both subjective comparisons and qualitative evaluations were performed against the observations. The results show that both the radar reflectivity data assimilation and lightning data assimilation can improve the analyses and short-term forecasts of precipitation and lightning.
The overall radar reflectivity structures of the MCSs modeled with the radar data assimilation were in better agreement with the observations; however, wider and high reflectivity regions (i.e., the regions with reflectivity greater than 35 dBZ) were simulated. The convective cores of the MCSs were well simulated when assimilating the lightning data, especially during the analysis period and the first two forecast hours, while the observed stratiform clouds far away from the convective cores were not properly reproduced. This is mainly because most of the lightning flashes are generated in the convective regions of the convective systems [33,50,74], and lightning data mainly reflect the information of convective regions but cannot reflect the information of stratiform regions appropriately.
With the statistical verification of six MCS cases for precipitation forecasts, the experiments with radar reflectivity data assimilation achieved higher FSSs than those with lightning data assimilation. However, for lightning forecasts, the experiments with lightning data assimilation scored higher on average in the analysis period and 1 h forecast, and for some cases, the superiority was present in the forecasts up to three hours ahead. This highlights the role of lightning data in short-term lightning forecasting.
Weather radars are one of the most important data sources for convective-scale data assimilation to improve the forecasts of severe convective weather. Lightning data are usually used only to improve forecasts of severe convective weather in areas without weather radar coverage. The results of this study highlight the potential added value of lightning data assimilation for short-term lightning forecasts for areas with weather radar coverage. To better leverage the indicative effect of lightning on updrafts and graupel, the combination of lightning data and other kinds of data (e.g., radar data or satellite data) for data assimilation will be the future focus of our work.

Author Contributions

Conceptualization, H.W. and Y.L. (Yubao Liu); methodology, H.W.; software, S.Y., Y.L. (Yang Li); validation, H.W. and Y.L. (Yubao Liu); formal analysis, H.W. and S.Y.; investigation, H.W. and S.Y.; resources, Y.L. (Yubao Liu); data curation, Y.L. (Yubao Liu); writing—original draft preparation, H.W.; writing—review and editing, Y.L. (Yubao Liu); visualization, S.Y.; supervision, Y.L. (Yubao Liu); project administration, H.W. and Y.L. (Yubao Liu); funding acquisition, H.W. and Y.L. (Yubao Liu). All authors have read and agreed to the published version of the manuscript.

Funding

This work was supported by the National Natural Science Foundation of China (Grant No. 41905097); the Foundation of Heavy Rain and Drought-Flood Disasters in Plateau and Basin Key Laboratory of Sichuan Province (Grant No. SZKT201801); the Key Laboratory of Cloud Physics of Chinese Meteorological Administration, and Northwest Weather Modification Capabilities Development Program (Grant No. ZQC-R19176).

Data Availability Statement

The precipitation data, lightning data, and radar reflectivity data used in this study are from the Guangdong Meteorological Bureau and Meteorological Bureau of Shenzhen Municipality (https://data.cma.cn/, accessed on 9 June 2021). The NCEP GFS analysis data are available from the NCAR Research Data Archive (RDA, DOI: 10.5065/D65D8PWK; https://rda.ucar.edu/datasets/ds084.1/, accessed on 9 June 2021).

Acknowledgments

We acknowledge the High-Performance Computing Center of Nanjing University of Information Science and Technology for their support of this work.

Conflicts of Interest

The authors declare no conflict of interest.

References

  1. Clark, A.J.; Gallus, W.A.; Xue, M.; Kong, F.Y. A Comparison of Precipitation Forecast Skill between Small Convection-Allowing and Large Convection-Parameterizing Ensembles. Weather Forecast. 2009, 24, 1121–1140. [Google Scholar] [CrossRef] [Green Version]
  2. Fierro, A.O.; Mansell, E.R.; MacGorman, D.R.; Ziegler, C.L. The Implementation of an Explicit Charging and Discharge Lightning Scheme within the WRF-ARW Model: Benchmark Simulations of a Continental Squall Line, a Tropical Cyclone, and a Winter Storm. Mon. Weather Rev. 2013, 141, 2390–2415. [Google Scholar] [CrossRef]
  3. Fierro, A.O.; Clark, A.J.; Mansell, E.R.; MacGorman, D.R.; Dembek, S.R.; Ziegler, C.L. Impact of Storm-Scale Lightning Data Assimilation on WRF-ARW Precipitation Forecasts during the 2013 Warm Season over the Contiguous United States. Mon. Weather Rev. 2015, 143, 757–777. [Google Scholar] [CrossRef]
  4. Lynn, B.H. The Usefulness and Economic Value of Total Lightning Forecasts Made with a Dynamic Lightning Scheme Coupled with Lightning Data Assimilation. Weather Forecast. 2017, 32, 645–663. [Google Scholar] [CrossRef]
  5. Wang, H.L.; Liu, Y.B.; Cheng, W.Y.Y.; Zhao, T.L.; Xu, M.; Liu, Y.W.; Shen, S.; Calhoun, K.M.; Fierro, A.O. Improving Lightning and Precipitation Prediction of Severe Convection Using Lightning Data Assimilation With NCAR WRF-RTFDDA. J. Geophys. Res.-Atmos. 2017, 122, 12296–12316. [Google Scholar] [CrossRef]
  6. Chen, Y.D.; Yu, Z.; Han, W.; He, J.; Chen, M. Case Study of a Retrieval Method of 3D Proxy Reflectivity from FY-4A Lightning Data and Its Impact on the Assimilation and Forecasting for Severe Rainfall Storms. Remote Sens. 2020, 12, 1165. [Google Scholar] [CrossRef] [Green Version]
  7. Feng, J.; Wang, X.G. Impact of increasing horizontal and vertical resolution during the HWRF hybrid EnVar data assimilation on the analysis and prediction of Hurricane Patricia. Mon. Weather Rev. 2021, 149, 419–441. [Google Scholar] [CrossRef]
  8. Zhang, F.Q.; Snyder, C.; Rotunno, R. Effects of Moist Convection on Mesoscale Predictability. J. Atmos. Sci. 2003, 60, 1173–1185. [Google Scholar] [CrossRef]
  9. Xue, M.; Wang, D.H.; Gao, J.D.; Brewster, K.; Droegemeier, K.K. The Advanced Regional Prediction System (ARPS), storm-scale numerical weather prediction and data assimilation. Meteorol. Atmos. Phys. 2003, 82, 139–170. [Google Scholar] [CrossRef]
  10. Dawson, D.T.; Xue, M. Numerical Forecasts of the 15–16 June 2002 Southern Plains Mesoscale Convective System: Impact of Mesoscale Data and Cloud Analysis. Mon. Weather Rev. 2006, 134, 1607–1629. [Google Scholar] [CrossRef]
  11. Hu, M.; Xue, M.; Keith, B. 3DVAR and cloud analysis with WSR-88D level-II data for the prediction of the Fort Worth, Texas, tornadic thunderstorms. Part I: Cloud analysis and its impact. Mon. Weather Rev. 2006, 134, 675–698. [Google Scholar] [CrossRef]
  12. Huang, Y.J.; Liu, Y.B.; Xu, M.; Liu, Y.W.; Pan, L.L.; Wang, H.L.; Cheng, W.Y.Y.; Jiang, Y.; Lan, H.P.; Yang, H.L.; et al. Forecasting severe convective storms with WRF-based RTFDDA radar data assimilation in Guangdong, China. Atmos. Res. 2018, 209, 131–143. [Google Scholar] [CrossRef]
  13. Gao, J.D.; Stensrud, D.J. Assimilation of Reflectivity Data in a Convective-Scale, Cycled 3DVAR Framework with Hydrometeor Classification. J. Atmos. Sci. 2012, 69, 1054–1065. [Google Scholar] [CrossRef]
  14. Liu, C.S.; Xue, M.; Kong, R. Direct Assimilation of Radar Reflectivity Data using 3DVAR: Treatment of Hydrometeor Background Errors and OSSE Tests. Mon. Weather Rev. 2019, 147, 17–29. [Google Scholar] [CrossRef]
  15. Xiao, Q.N.; Kuo, Y.H.; Sun, J.Z.; Lee, W.C.; Barker, D.M.; Lim, E. An Approach of Radar Reflectivity Data Assimilation and Its Assessment with the Inland QPF of Typhoon Rusa (2002) at Landfall. J. Appl. Meteorol. Clim. 2007, 46, 14–22. [Google Scholar] [CrossRef] [Green Version]
  16. Sun, J.Z.; Crook, N.A. Dynamical and microphysical retrieval from Doppler radar observations using a cloud model and its adjoint. Part I: Model development and simulated data experiments. J. Atmos. Sci. 1997, 54, 1642–1661. [Google Scholar] [CrossRef]
  17. Wang, H.L.; Sun, J.Z.; Zhang, X.; Huang, Y.X.; Thomas, A. Radar data assimilation with WRF 4D-Var. Part I: System development and preliminary testing. Mon. Weather Rev. 2013, 141, 2224–2244. [Google Scholar] [CrossRef]
  18. Aksoy, A.; David, C.D.; Chris, S. A multicase comparative assessment of the ensemble Kalman filter for assimilation of radar observations. Part I: Storm-scale analyses. Mon. Weather Rev. 2009, 137, 1805–1824. [Google Scholar] [CrossRef] [Green Version]
  19. Aksoy, A.; David, C.D.; Chris, S. A multicase comparative assessment of the ensemble Kalman filter for assimilation of radar observations. Part II: Short-range ensemble forecasts. Mon. Weather Rev. 2010, 138, 1273–1292. [Google Scholar] [CrossRef] [Green Version]
  20. Calhoun, K.; Edward, R.M.; Donald, R.M.; David, C.D. Numerical simulations of lightning and storm charge of the 29–30 May 2004 Geary, Oklahoma, supercell thunderstorm using EnKF mobile radar data assimilation. Mon. Weather Rev. 2014, 142, 3977–3997. [Google Scholar] [CrossRef]
  21. Dowell, D.C.; Wicker, L.J.; Snyder, C. Ensemble Kalman filter assimilation of radar observations of the 8 May 2003 Oklahoma City supercell: Influences of reflectivity observations on storm-scale analyses. Mon. Weather Rev. 2011, 139, 272–294. [Google Scholar] [CrossRef] [Green Version]
  22. Snyder, C.; Zhang, F.Q. Assimilation of Simulated Doppler Radar Observations with an Ensemble Kalman Filter. Mon. Weather Rev. 2003, 131, 1663–1677. [Google Scholar] [CrossRef] [Green Version]
  23. Tong, M.J.; Xue, M. Ensemble Kalman Filter Assimilation of Doppler Radar Data with a Compressible Nonhydrostatic Model: OSS Experiments. Mon. Weather Rev. 2005, 133, 1789–1807. [Google Scholar] [CrossRef] [Green Version]
  24. Wang, H.L.; Liu, Y.B.; Duan, J.; Shi, Y.Q.; Lou, X.F.; Li, J.M. Assimilation of Radar Reflectivity Using a Time-Lagged Ensemble Based Ensemble Kalman Filter With the “Cloud-Dependent” Background Error Covariances. J. Geophys. Res.-Atmos. 2022, 127. [Google Scholar] [CrossRef]
  25. Gao, J.D.; Fu, C.H.; Stensrud, D.J.; Kain, J.S. OSSEs for an Ensemble 3DVAR Data Assimilation System with Radar Observations of Convective Storms. J. Atmos. Sci. 2016, 73, 2403–2426. [Google Scholar] [CrossRef]
  26. Kong, R.; Xue, M.; Liu, C.S.; Jung, Y.S. Comparisons of Hybrid En3DVar with 3DVar and EnKF for Radar Data Assimilation: Tests with the 10 May 2010 Oklahoma Tornado Outbreak. Mon. Weather Rev. 2021, 149, 21–40. [Google Scholar] [CrossRef]
  27. Tong, C.C.; Jung, Y.S.; Xue, M.; Liu, C.S. Direct Assimilation of Radar Data with Ensemble Kalman Filter and Hybrid Ensemble-Variational Method in the National Weather Service Operational Data Assimilation System GSI for the Stand-Alone Regional FV3 Model at a Convection-Allowing Resolution. Geophys. Res. Lett. 2020, 47. [Google Scholar] [CrossRef]
  28. Wang, Y.M.; Wang, X.G. Development of convective-scale static background error covariance within GSI-based hybrid EnVar system for direct radar reflectivity data assimilation. Mon. Weather Rev. 2021, 149, 2713–2736. [Google Scholar] [CrossRef]
  29. Carey, L.D.; Rutledge, S.A. A multiparameter radar case study of the microphysical and kinematic evolution of a lightning producing storm. Meteorol. Atmos. Phys. 1996, 59, 33–64. [Google Scholar] [CrossRef]
  30. Deierling, W.; Petersen, W.A.; Latham, J.; Ellis, S.; Christian, H.J. The relationship between lightning activity and ice fluxes in thunderstorms. J. Geophys. Res. 2008, 113. [Google Scholar] [CrossRef]
  31. Deierling, W.; Petersen, W.A. Total lightning activity as an indicator of updraft characteristics. J. Geophys. Res. 2008, 113. [Google Scholar] [CrossRef] [Green Version]
  32. Petersen, W.A.; Christian, H.J.; Rutledge, S.A. TRMM observations of the global relationship between ice water content and lightning. Geophys. Res. Lett. 2005, 32. [Google Scholar] [CrossRef] [Green Version]
  33. Wiens, K.; Rutledge, S.; Tessendorf, S. The 29 June 2000 Supercell Observed during STEPS. Part II: Lightning and Charge Structure. J. Atmos. Sci. 2005, 62, 4151–4177. [Google Scholar] [CrossRef]
  34. Fierro, A.O.; Mansell, E.R.; Ziegler, C.L.; MacGorman, D.R. Application of a Lightning Data Assimilation Technique in the WRF-ARW Model at Cloud-Resolving Scales for the Tornado Outbreak of 24 May 2011. Mon. Weather Rev. 2012, 140, 2609–2627. [Google Scholar] [CrossRef]
  35. Marchand, M.R.; Fuelberg, H.E. Assimilation of Lightning Data Using a Nudging Method Involving Low-Level Warming. Mon. Weather Rev. 2014, 142, 4850–4871. [Google Scholar] [CrossRef]
  36. Qie, X.S.; Zhu, R.P.; Yuan, T.; Wu, X.K.; Li, W.; Liu, D.X. Application of total-lightning data assimilation in a mesoscale convective system based on the WRF model. Atmos. Res. 2014, 145–146, 255–266. [Google Scholar] [CrossRef]
  37. Sun, H.; Wang, H.L.; Yang, J.; Zeng, Y.T.; Zhang, Q.L.; Liu, Y.B.; Gu, J.Y.; Huang, S.Y. Improving Forecast of Severe Oceanic Mesoscale Convective Systems Using FY-4A Lightning Data Assimilation with WRF-FDDA. Remote Sens. 2022, 14, 1965. [Google Scholar] [CrossRef]
  38. Fierro, A.O.; Gao, J.D.; Ziegler, C.L.; Mansell, E.R.; MacGorman, D.R.; Dembek, S.R. Evaluation of a cloud-scale lightning data assimilation technique and a 3DVAR method for the analysis and short-term forecast of the 29 June 2012 derecho event. Mon. Weather Rev. 2014, 142, 183–202. [Google Scholar] [CrossRef] [Green Version]
  39. Mansell, E.R. Storm-Scale Ensemble Kalman Filter Assimilation of Total Lightning Flash-Extent Data. Mon. Weather Rev. 2014, 142, 3683–3695. [Google Scholar] [CrossRef]
  40. Allen, B.J.; Mansell, E.R.; Dowell, D.C.; Deierling, W. Assimilation of Pseudo-GLM Data Using the Ensemble Kalman Filter. Mon. Weather Rev. 2016, 144, 3465–3486. [Google Scholar] [CrossRef]
  41. Kong, R.; Xue, M.; Fierro, A.O.; Jung, Y.; Liu, C.; Mansell, E.R.; MacGorman, D.R. Assimilation of GOES-R Geostationary Lightning Mapper Flash Extent Density Data in GSI EnKF for the Analysis and Short-Term Forecast of a Mesoscale Convective System. Mon. Weather Rev. 2020, 148, 2111–2133. [Google Scholar] [CrossRef] [Green Version]
  42. Wang, H.L.; Liu, Y.B.; Zhao, T.L.; Liu, Y.W.; Xu, M.; Shen, S.; Jiang, Y.; Yang, H.L.; Feng, S.L. Continuous assimilation of lightning data using time-lagged ensembles for a convection-allowing numerical weather prediction model. J. Geophys. Res.-Atmos. 2018, 17, 9652–9673. [Google Scholar] [CrossRef]
  43. Carey, L.D.; Rutledge, S.A. The relationship between precipitation and lightning in tropical island convection: A C-band polarimetric radar study. Mon. Weather Rev. 2000, 128, 2687–2710. [Google Scholar] [CrossRef]
  44. Takahashi, T. Precipitation mechanisms in east Asian monsoon: Videosonde study. J. Geophys. Res.-Atmos. 2006, 111. [Google Scholar] [CrossRef]
  45. Hazra, A.; Chaudhari, H.S.; Saha, S.K.; Pokhrel, S. Effect of cloud microphysics on Indian summer monsoon precipitating clouds: A coupled climate modeling study. J. Geophys. Res.-Atmos. 2017, 122, 3786–3805. [Google Scholar] [CrossRef]
  46. Heiblum, R.H.; Koren, I.; Altaratz, O. Analyzing coastal precipitation using TRMM observations. Atmos. Chem. Phys. 2011, 11, 13201–13217. [Google Scholar] [CrossRef]
  47. Takahashi, T.; Soichiro, S.; Tetsuya, K.; Kenji, S. Riming electrification in Hokuriku winter clouds and comparison with laboratory observations. J. Atmos. Sci. 2017, 74, 431–447. [Google Scholar] [CrossRef]
  48. MacGorman, D.R.; Rust, W.D.; Schuur, T.J.; Biggerstaff, M.I.; Straka, J.M.; Ziegler, C.L.; Mansell, E.R.; Bruning, E.C.; Kuhlman, K.M.; Lund, N.R.; et al. TELEX the thunderstorm electrification and lightning experiment. Bull. Am. Meteorol. Soc. 2008, 89, 997–1014. [Google Scholar] [CrossRef]
  49. Saunders, C.P.R.; Norman, H.B.; Emersic, C.; Avila, E.E.; Castellano, N.E. Laboratory studies of the effect of cloud conditions on graupel/crystal charge transfer in thunderstorm electrification. Q. J. R. Meteor. Soc. 2010, 132, 2653–2673. [Google Scholar] [CrossRef] [Green Version]
  50. Lund, N.R.; MacGorman, D.R.; Schuur, T.J.; Biggerstaff, M.I.; Rust, W.D. Relationships between lightning location and polarimetric radar signatures in a small mesoscale convective system. Mon. Weather Rev. 2009, 137, 4151–4170. [Google Scholar] [CrossRef]
  51. Liu, Y.B.; Chen, F.; Warner, T.; Basara, J. Verification of a Mesoscale Data-Assimilation and Forecasting System for the Oklahoma City Area during the Joint Urban 2003 Field Project. J. Appl. Meteorol. Clim. 2006, 45, 912–929. [Google Scholar] [CrossRef]
  52. Liu, Y.B.; Warner, T.T.; Astling, E.G.; Bowers, J.F.; Davis, C.A.; Halvorson, S.F.; Rife, D.L.; Sheu, R.S.; Swerdlin, S.P.; Xu, M. The Operational Mesogamma-Scale Analysis and Forecast System of the U.S. Army Test and Evaluation Command. Part II: Interrange Comparison of the Accuracy of Model Analyses and Forecasts. J. Appl. Meteorol. Clim. 2008, 47, 1093–1104. [Google Scholar] [CrossRef] [Green Version]
  53. Roux, G.; Liu, Y.B.; Monache, L.D.; Sheu, R.S.; Warner, T.T. Verification of high resolution WRF-RTFDDA surface forecasts over mountains and plains. In Proceedings of the 10th WRF Users’ Workshop, Boulder, CO, USA, 23–26 June 2009; pp. 20–23. [Google Scholar]
  54. Xu, M.; Sun, J.; Liu, Y.; Tessendorf, S. Radar data assimilation for the prediction of front range convection. In Proceedings of the 36th Conference on Radar Meteorology/Use of Radar Data for NWP Models: Radar Data Assimilation for NWP Model Initialization, Breckenridge, CO, USA, 16–20 September 2013; American Meteorological Society: Boston, MA, USA, 2013. [Google Scholar]
  55. Zhang, Y.J.; Lü, W.T.; Chen, S.D.; Zheng, D.; Zhang, Y.; Yan, X.; Chen, L.W.; Dong, W.S.; Dan, J.R.; Pan, H.B. A review of advances in lightning observations during the past decade in Guangdong, China. J. Meteorol. Res. 2016, 30, 800–819. [Google Scholar] [CrossRef]
  56. Pang, Z.H.; Shi, C.X.; Gu, J.X.; Pan, Y.; Xu, B. Assessment of a Gauge-Radar-Satellite Merged Hourly Precipitation Product for Accurately Monitoring the Characteristics of the Super-Strong Meiyu Precipitation over the Yangtze River Basin in 2020. Remote Sens. 2021, 13, 3850. [Google Scholar] [CrossRef]
  57. Lerach, D.G.; Rutledge, S.A.; Williams, C.R.; Cifelli, R. Vertical structure of convective systems during NAME 2004. Mon. Weather Rev. 2010, 138, 1695–1714. [Google Scholar] [CrossRef] [Green Version]
  58. Pan, Y.; Xue, M.; Ge, G. Incorporating diagnosed intercept parameters and the graupel category within the ARPS cloud analysis system for the initialization of double-moment microphysics: Testing with a squall line over south China. Mon. Weather Rev. 2016, 144, 371–392. [Google Scholar] [CrossRef]
  59. Smith, P.L.; Myers, C.G.; Orville, H.D. Radar reflectivity factor calculations in numerical cloud models using bulk parameterization of precipitation. J. Appl. Meteorol. Clim. 1975, 14, 1156–1165. [Google Scholar] [CrossRef]
  60. Carey, L.D.; Bain, A.L.; Retha, M. Kinematic and microphysical control of lightning in multicell convection over Alabama during DC3. In Proceedings of the 23rd International Lightning Detection Conference, Tucson, AZ, USA, 18–19 March 2014; Vaisala: Vantaa, Finland, 2014; pp. 20–21. [Google Scholar]
  61. Cressman, G.P. An operational objective analysis system. Mon. Weather Rev. 1959, 87, 367–374. [Google Scholar] [CrossRef]
  62. Fierro, A.O.; Wang, Y.; Gao, J.; Mansell, E.R. Variational assimilation of radar data and GLM lightning-derived water vapor for the short-term forecasts of high-impact convective events. Mon. Weather Rev. 2019, 147, 4045–4069. [Google Scholar] [CrossRef]
  63. Qian, X.Y.; Wang, H.L. Evaluation of different storm parameters as the proxies for gridded total lightning flash rates: A convection-allowing model study. Atmosphere 2020, 12, 95. [Google Scholar] [CrossRef]
  64. Skamarock, C.; Klemp, B.; Dudhia, J.; Gill, O.; Liu, Z.Q.; Berner, J.; Wang, W.; Powers, G.; Duda, G.; Barker, D.; et al. A Description of the Advanced Research WRF Model Version 4; NCAR/TN-556+STR; NCAR: Boulder, CO, USA, 2019. [Google Scholar] [CrossRef]
  65. Janjić, Z.I. The Step-Mountain eta coordinate model: Further developments of the convection, viscous sublayer, and turbulence closure schemes. Mon. Weather Rev. 1994, 122, 927–945. [Google Scholar] [CrossRef]
  66. Thompson, G.; Field, P.R.; Rasmussen, R.M.; Hall, W.D. Explicit forecasts of winter precipitation using an improved bulk microphysics scheme. Part II: Implementation of a new snow parameterization. Mon. Weather Rev. 2008, 136, 5095–5115. [Google Scholar] [CrossRef]
  67. Chen, F.; Dudhia, J. Coupling an advanced land surface–hydrology model with the Penn State–NCAR MM5 modeling system, part I: Model implementation and sensitivity. Mon. Weather Rev. 2001, 129, 569–585. [Google Scholar] [CrossRef]
  68. Iacono, M.J.; Delamere, J.S.; Mlawer, E.J.; Shephard, M.W.; Clough, S.A.; Collins, W.D. Radiative forcing by long-lived greenhouse gases: Calculations with the AER radiative transfer models. J. Geophys. Res. 2008, 113. [Google Scholar] [CrossRef]
  69. Grell, G.A.; Freitas, S.R. A scale and aerosol aware stochastic convective parameterization for weather and air quality modeling. Atmos. Chem. Phys. 2013, 13, 23845–23893. [Google Scholar] [CrossRef] [Green Version]
  70. Roberts, N.M.; Lean, H.W. Scale-Selective Verification of Rainfall Accumulations from High-Resolution Forecasts of Convective Events. Mon. Weather Rev. 2008, 136, 78–97. [Google Scholar] [CrossRef] [Green Version]
  71. Parker, M.D.; Johnson, R.H. Organizational Modes of Midlatitude Mesoscale Convective Systems. Mon. Weather Rev. 2000, 128, 3413–3436. [Google Scholar] [CrossRef]
  72. Houze, R.A. Mesoscale convective systems. Rev. Geophys. 2004, 42. [Google Scholar] [CrossRef] [Green Version]
  73. Houze, R.A. 100 Years of Research on Mesoscale Convective Systems. Meteorol. Monogr. 2018, 58, 1–17. [Google Scholar] [CrossRef]
  74. Carey, L.D.; Murphy, L.J.; McCormick, T.L.; Demetriades, N.W.S. Lightning location relative to storm structure in a leading-line, trailing-stratiform mesoscale convective system. J. Geophys. Res. 2005, 110, D03105. [Google Scholar] [CrossRef]
  75. Cazenave, F.; Gosset, M.; Kacou, M.; Alcoba, M.; Fontaine, E.; Duroure, C.; Dolan, B. Characterization of Hydrometeors in Sahelian Convective Systems with an X-Band Radar and Comparison with In Situ Measurements. Part I: Sensitivity of Polarimetric Radar Particle Identification Retrieval and Case Study Evaluation. J. Appl. Meteorol. Clim. 2016, 55, 231–249. [Google Scholar] [CrossRef]
  76. Gao, S.B.; Min, J.Z.; Liu, L.M.; Ren, C.Y. The development of a hybrid EnSRF-En3DVar system for convective-scale data assimilation. Atmos. Res. 2019, 229, 208–223. [Google Scholar] [CrossRef]
  77. Peters, J.M.; Schumacher, R.S. Objective Categorization of Heavy-Rain-Producing MCS Synoptic Types by Rotated Principal Component Analysis. Mon. Weather Rev. 2014, 142, 1716–1737. [Google Scholar] [CrossRef]
Figure 1. The schematic design of the simulation experiments.
Remotesensing 14 05980 g001
Figure 2. Configuration of the WRF domain (D01, D02, and D03 are at the grid spacing of 27 km, 9 km, and 3 km, respectively). Terrain heights are shown in colored shades.
Remotesensing 14 05980 g002
Figure 3. Composite radar reflectivity (shading, dBZ) of (ac): observations (OBS), (df): CTRL, (gi): LDA, and (jl): RDA for CASE 4. The 35-dBZ reflectivity contours (in thick black) of OBS are shown in the panels of CTRL, LDA, and RDA. The valid time is indicated above each panel. The areas pointed to by the black arrows are specially discussed in the text.
Remotesensing 14 05980 g003
Figure 4. The simulated graupel mixing ratio (shading, g kg−1; the maximum values in vertical) and the maximum vertical updraft (black contours; contour of 3 m s−1) of (a): CTRL, (b): LDA, (c): RDA at the end of the analysis period for CASE 4.
Remotesensing 14 05980 g004
Figure 5. As in Figure 3, but for hourly accumulated precipitation fields (in mm). The 3 mm contours (in red) of the observed accumulated precipitation are shown in the panels of CTRL, LDA, and RDA. The valid time and forecast hour are indicated above each panel. The areas pointed to by the black arrows are specially discussed in the text.
Remotesensing 14 05980 g005
Figure 6. As in Figure 3, but for hourly accumulated lightning flash density (number per grid cell). The one per grid cell hourly accumulated lightning flash density contours (in black) of the observations are shown in the panels of CTRL, LDA, and RDA. The areas pointed to by the black arrows are specially discussed in the text.
Remotesensing 14 05980 g006
Figure 7. The fractions skill scores (FSSs) of the simulated hourly accumulated precipitation and lightning flash density of CTRL, LDA, and RDA, respectively. The neighborhood radius used to compute the FSSs is 24 km, the threshold for lightning flash density is one per grid cell, and the thresholds for precipitation are 2 mm and 10 mm, respectively. The colored lines present the average results for all convective events. For LDA and RDA, the upper and lower extremes of whiskers represent the maximum and minimum FSSs of all convective events. (a,c,e) show the results of the first set of experiments, (b,d,f) show the results of the second set of experiments.
Remotesensing 14 05980 g007
Table 1. The MCSs selected in the study and their simulation time periods; the times inside the brackets are the end times of simulation for the second set of experiment.
EventsSimulation Time Periods (UTC)
CASE 12020-06-03_06:00–06-03_13:00 (06-03_12:00)
CASE 22020-06-05_06:00–06-05_13:00 (06-05_12:00)
CASE 32020-06-06_06:00–06-06_13:00 (06-06_12:00)
CASE 42020-06-08_18:00–06-09_01:00 (06-09_00:00)
CASE 52020-06-13_06:00–06-13_13:00 (06-13_12:00)
CASE 62020-06-25_06:00–06-25_13:00 (06-25_12:00)
Publisher’s Note: MDPI stays neutral with regard to jurisdictional claims in published maps and institutional affiliations.

