Article

A 3D Space-Time Non-Local Mean Filter (NLMF) for Land Changes Retrieval with Synthetic Aperture Radar Images

Institute for Electromagnetic Sensing of the Environment (IREA), Italian National Research Council, 328, Diocleziano, 80124 Naples, Italy
Remote Sens. 2022, 14(23), 5933; https://doi.org/10.3390/rs14235933
Submission received: 19 October 2022 / Revised: 20 November 2022 / Accepted: 22 November 2022 / Published: 23 November 2022
(This article belongs to the Special Issue SAR in Big Data Era II)

Abstract

:
Sequences of multi-temporal synthetic aperture radar (SAR) images are routinely used for land-use land-change (LULC) applications, allowing the retrieval of accurate and up-to-date information on the state of the Earth’s surface and its temporal variations. Change detection (CD) methods that rely on the exploitation of SAR data are, generally, made of three distinctive steps: (1) pre-processing of the SAR images; (2) comparison of the pairs of SAR images; and (3) the automatic extraction of the “changed areas”, employing proper thresholding algorithms. Within this general framework, the reduction in speckle noise effects, which can be obtained by applying spatial multi-looking operations and ad hoc noise filters, is fundamental for the better detecting and classifying of changed regions. Usually, speckle noise filters are singularly and independently applied to every SAR image without the consideration of their inherent temporal relationships. In particular, most use local (spatial) approaches based on determining and averaging SAR backscattered signals related to neighboring SAR pixels. In this work, conversely, we explore the potential of a joint 3D space-time non-local mean filter (NLMF), which relies on the discrimination of similar features in a block of non-local SAR pixels extracted from the same or different SAR images. The theory behind non-local-mean filters is, first, shortly revised. Then, the developed space-time NLMF is applied to a real test case for the purposes of identifying flooded zones due to the massive inundations that hit the Kerala region, India, during the summer of 2018. To this aim, a set of 18 descending SAR images collected from the European (EU) Copernicus Sentinel-1 (S-1) sensor was exploited. The performance of the developed NLMF has also been assessed. It is worth remarking that the proposed method can be applied for the purposes of analyzing a heterogenous set of natural and/or artificial disastrous conditions. Further, it can also be helpful during the pre-processing stages of the sequences of SAR images for the purposes of CD applications.

1. Introduction

The last two decades have represented for the remote-sensing (RS) community a fructuous period characterized by the accelerated exploitation of synthetic aperture radar (SAR) methodologies for Earth’s surface monitoring [1,2,3,4,5,6,7,8,9,10,11,12,13]. In this context, a series of regularly acquired SAR data are typically used to track land changes at different spatial and temporal scales, using both interferometric SAR (InSAR) [14,15,16,17,18] and amplitude-based change detection (CD) approaches [19,20,21,22,23,24,25]. More specifically, over the recent eight years, a new stimulus for developing and applying new SAR-driven techniques has been delivered by the possibility of accessing extensive archives of SAR images collected by the European (EU) Copernicus mission through the twin Sentinel-1A/B radar instruments. The free and open access policy of Sentinel-1 [14,26,27,28,29,30,31] and the weekly repetition frequency of the SAR observations have been fostering the evolution of novel SAR/InSAR methods, thereby allowing suitable and up-to-date observations of the Earth’s surface. However, innovative technological developments have resulted in fundamental responses for the purposes of the adapting of existing processing codes, as well as of the handling of interferometric wide (IW) swath S-1 SAR data [32,33,34,35,36,37,38,39]. The IW SAR images are collected through the terrain observation with progressive scans (TOPS) mode [39], which is the principal acquisition mode of S-1 over lands. InSAR and CD methods can jointly be used to recover damage maps on a global scale after a natural or human-made hazard occurs. Many features can be extracted from the sets of SAR images; the most used factor for RS analyses is the radar backscattering coefficient, which is an essential indicator of ground conditions due to its sensitivity to surface roughness. Moreover, an alternative to the exclusive use of SAR backscattering signatures for the generation of land-use land-change (LULC) products [40,41,42,43,44] is found in the exploitation of interferometric SAR approaches, such as those based on tracking the InSAR coherence changes [45,46,47,48,49,50,51].
The performance of InSAR and CD methods are impaired by the level of noise that affects the used set of SAR images. Several approaches have been developed to discriminate the valuable signals from the noise and filter out artefacts from SAR/InSAR products [52,53,54,55,56,57,58,59,60,61,62,63,64]. Most operate independently on every SAR image product (i.e., a single SAR image or single SAR interferogram) by exploiting exclusively spatial information. For instance, multi-look processes [65,66,67,68] are typically used in order to reduce the variance of the speckle from amplitude SAR images by averaging local signals while degrading the spatial resolution of the filtered SAR images. Ad hoc (local) de-speckling and noise filtering methods operating on SAR interferograms have been developed and widely used by the scientific community [63,69,70,71,72,73]. It is worth noting that the role of SAR de-speckling methods, implemented explicitly for change detection purposes, has been widely addressed in the literature. Interested readers can refer to high-impact papers in [8,24,74,75,76,77,78,79,80] to discuss this interesting topic, comprehensively. Of course, on the one hand, de-noised SAR images emphasize significant changes and, on the other hand, tend to destroy those minor changes that are within the error bar of the noise artefacts.
Recently, non-local techniques have also been developed [2,81,82,83]. The key idea behind these more recent methods is that there are enough pixels over a scene that, though not necessarily located in nearby areas, could be used to suppress the noise while preserving the spatial resolution of the original (unfiltered) images, with a significant impact on the capability to discriminate features at finer spatial scales (even at the pixel-scale level). The original method proposed by Buades [83] was developed in order to discriminate and filter out noise signals that can be represented as additive Gaussian processes. The adaptations of NLMF methods to work with amplitude SAR signals, which are affected by multiplicative speckle noise, have subsequently been addressed in several papers (e.g., [64,84,85,86,87,88,89,90]). In particular, the extension of 2D (space) NLMF filters for de-speckling sequences of 3D multi-temporal SAR images was also recently proposed [91,92,93,94]. Other than the peculiarities of every single method, these approaches all conduct non-local mean filters in the separate spatial and time domains, using either the original or log-ratio SAR images.
In this work, we propose and analyze a non-local mean filter (NLMF) approach applied to the sequences of 3D multi-temporal SAR images, thus extending the use of NLMF to the space-time domain. Specifically, non-local information associated with pixels belonging to different multi-temporal SAR images is extracted and averaged in order to improve the NLMF performances further and to produce adaptive temporal multi-looking products for CD analyses. Moreover, the presented method can also be adapted to work with InSAR data. It will be shown how NLMF impacts the retrieval procedure of areas subjected to significant changes, which can be due to underlying natural and human-made phenomena using sequences of Sentinel-1 SAR images collected through the IW acquisition mode.
Experimental results have been carried out by processing a series of 18 SAR images collected by the S-1A sensor from March to October 2018 over an area in the Kerala region, India, affected by massive inundations in the summer of 2018. The selected case study area is significant for the purposes of evaluating the impact of the developed method for the analyses on the effects of hydro-geological disturbances on the Earth’s surface, which are more frequent now than in the past and are occurring worldwide, as triggered by present-day global climate change.

2. Method

This section first introduces the fundamentals of non-local mean filtering when applied to SAR images (Section 2.1). Subsequently, the developed space-time (3D) non-local mean filter is presented in Section 2.2. The theoretical performance of the proposed method is finally discussed in Section 2.3.

2.1. Spatial (2D) Non-Local Mean Filters for SAR Image De-Speckling

The “restoration quality” of a degraded SAR image may depend on a priori knowledge of the phenomena that caused such a degradation. Having said this, the knowledge of the noise characteristics is generally insufficient for the perfect retrieval of the suitable actual signals that are immersed within the noise; thus, the only possibility that remains is that of carrying out spatial or frequency-based filtering operations. Specifically, spatial filtering is a digital image processing operation that allows the modifying of the intensity of the involved imaged pixels. In the presence of speckle noise, SAR processing provides two distinctive approaches [95]: (i) the multi-look approach, which is applied during pre-processing, or (ii) the noise-filtering approach, which is applied during SAR processing. The conventional multi-look operation consists in computing the incoherent average of N-imaged SAR pixel estimates that can be extracted by considering local SAR pixels and/or splitting the image spectra into N-independent segments (looks). Subsequently, these N estimates, processed independently, are packed together in order to obtain an image where the standard deviation of the speckle is decreased by a factor N , but at the expense of the spatial resolution, which is degraded by a factor N.
This work explores the potential of NLMF. In 2005, Buades et al. [83] proposed a new method in order to better de-noise images corrupted by additive Gaussian noise. To introduce the problem, let us assume we have a noisy image v . Let v f be the corresponding (unknown) noise-free image. Further, NL means the estimates of the value of the filtered image at the pixel of coordinates s via the weighting of the averaging of the similar pixels as [55,96]:
v ^ f ( s ) = p Ω w ( s , p ) v ( p ) p Ω w ( s , p )
where Ω is the entire image, or a sector of the image, and w ( s , p ) is a weight that allows one to compute the grade of similarity between two patches, namely ϒ ( s ) and ϒ ( p ) of an image of adequate size, which are centered around the location of pixels s and p , respectively.
Figure 1 shows a pictorial representation of the functioning principles of NLMF. The red box identifies a patch centered on the reference pixel s; the yellow box represents a non-local window centered on the location of the generic pixel p, which can span the entire image or a portion of it (e.g., the area inside the dashed blue contour line in Figure 1).
While additive Gaussian noise is present, the weights are profitably set by considering the Euclidean distance between the two patches using a filter with a Gaussian kernel, as follows:
w ( s , p ) = exp [ d 2 ( ϒ ( s ) , ϒ ( p ) ) h 2 ]
where h is a parameter that represents the variance of the adopted Gaussian filter, permitting us to modulate the strength of the NL mean filtering operation.
Several adaptations of the original NLMF have been proposed. They have all looked to deploy that method in order to obtain amplitude SAR images and InSAR products [82,84,85,86,87,97,98,99]. The key point is that amplitude SAR images are characterized by multiplicative speckle noise. Accordingly, the original method cannot simply be applied to SAR images. To cope with this issue properly, a few modifications have been used in order to consider both SAR image heterogeneities and the multiplicative nature of the speckle noise [100]. For instance, in [101], the image ratio was employed in order to evaluate the distance metric between two SAR patches using adaptive filter weights based on computing the coefficient of variation (CV) of a SAR patch, which is defined as C V = σ / μ . Where σ and μ are the standard deviation and the average value of the image computed in an averaging window, respectively. Specifically, if v is a noisy SAR image with N × M (azimuth × range) elements, the filtered SAR image is given by Equations (1) and (2) where the distance metric is assigned by:
d ( ϒ ( s ) , ϒ ( p ) ) = k Ψ exp ( | C V ( s , k ) C V ( s ) | 2 ) | v s ( k ) v p ( k ) + v p ( k ) v s ( k ) | 2 k Ψ exp ( | C V ( s , k ) C V ( s ) | 2 )
with C V ( s , k ) as the local CV of the generic pixel k within the patch ϒ ( s ) , i.e., the set Ψ , and C V ( s ) is the local CV of the pixel s . In order to adapt the filtering strength moving from homogeneous to heterogeneous regions, the authors of [96] also proposed to use the following adaptatively chosen weighting parameter h instead of h :
h = h [ 1 1 1 + e ξ ( C V σ C V max ) ]
where ξ is a value in the range [20,50], C V is the local coefficient of variation of the image, and CVmax is the maximum CV value of the whole SAR image.

2.2. The Developed Space-Time (3D) NLMF

Let us now assume the availability of a stack of Q -independent SAR single-look-complex (SLC) images v i ,   i = 0 , , Q 1 that are collected at ordered times [ t 0 , t 1 , , t Q 1 ] , which have preliminarily been co-registered to one reference SLC image. While de-speckling the generic q-th SAR image, the basic idea of the developed method is to extract similar patches not only from the q-th image, but from the whole set of available SAR images, thus increasing the total number of looks and enhancing the quality of filtered SAR images. Mathematically, in this case, Equation (1) modifies as follows:
v ^ q , f ( s ) = i = 0 Q 1 p Ω w i ( s q , p ) v i ( p ) i = 0 Q 1 p Ω w i ( s q , p )
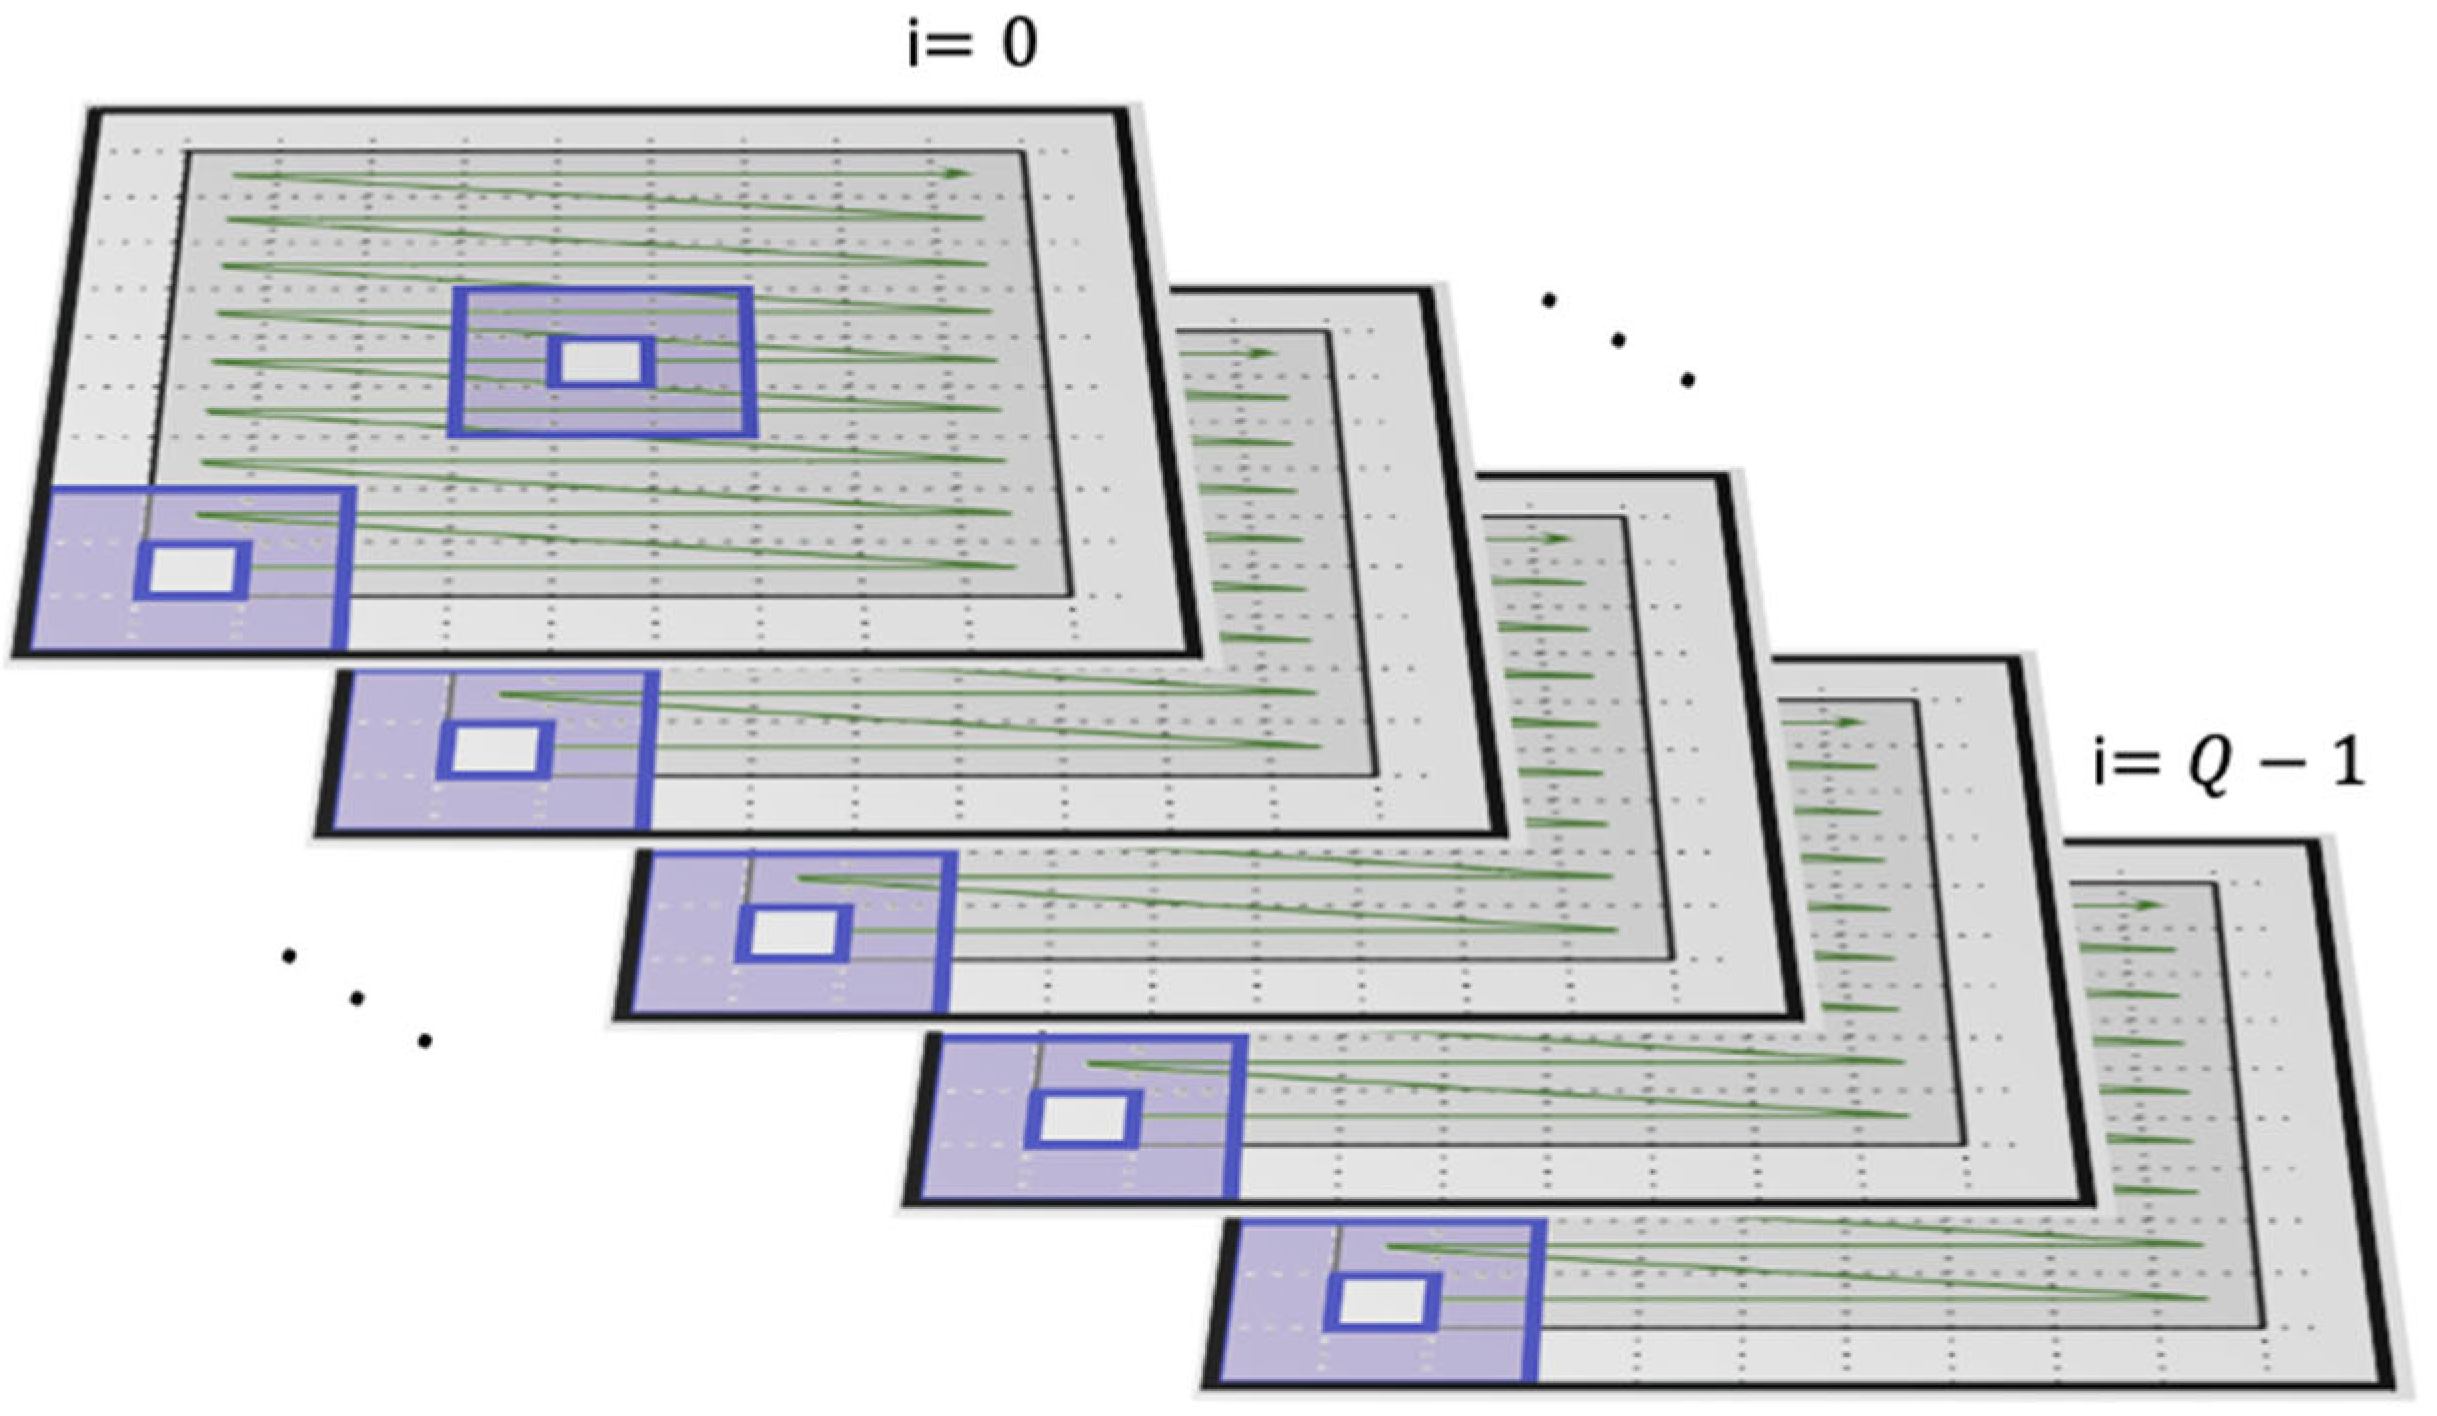
where the weights w i ( s q , p )   i = 0 , , Q 1 are computed by considering the pairs of SAR patches extracted from the same or a different SAR image, thus extending to the three-dimensional (3D) case that has already been developed for the two-dimensional (spatial) case. Figure 2 pictorially describes how the developed 3D NLMF method works. Further, the Q layers represent the available SAR images. When the noise in a single SAR image is filtered out, patches are extracted from the same (see the example of layer 0 in this picture) or from different SAR images. The green lines pictorially represent the moving windows that allow us to dynamically identify the reference and the adaptive patches that cover the whole picture or even a sector of every single layer into the stack of SAR images. The straightforward method proposed here was preliminarily tested on a selected test case, and the relevant results were first presented in a conference paper [102]. With respect to it, the present investigation: (i) further explores the validity of the developed 3D method when adaptatively chosen weights (Equations (3) and (4)) are used for the purposes of the analysis of heterogenous scenes; (ii) it adopts synthetic indicators to test the potential and the limitations of the method (see Section 2.3), and (iii) investigates implications for the temporal multi-looking.

2.3. Key Performance of the Developed 3D NLMF De-Speckling Method

In order to evaluate the de-noising performance of the developed NLMF method, different key estimators can be used, such as: the equivalent number of looks (ENL), the edge-preserving index (EPI), and the peak signal-to-noise ratio (PSNR), which are subsequently shortly summarized [103].
The ENL factor determines the grade of smoothness of an image; it is defined as:
E N L = ( μ σ ) 2
where μ and σ are the (local) mean and standard deviation of the filtered image.
Conversely, EPI is used to evaluate the capability of correct retention of the edges in an image; it is defined as:
E P I = P Ξ | v f x ( P ) | + | v f y ( P ) | P Ξ | v x ( P ) | + | v y ( P ) |
where v f and v are the filtered and the un-filtered images, respectively, Ξ is the entire image or a (local) sector of it and x an y are the generic 2D spatial dimensions of the considered image.
Finally, PSNR is defined over a patch of the image as follows:
P S N R = 10 log 10 [ ( max ( v ) ) 2 m s e ( v , v f ) ]
where m s e ( v , v f ) and max ( v ) are the mean square of the difference between the filtered and the unfiltered image and the maximum value of the unfiltered image, respectively: The larger the PSNR, the better the de-noising effect.

3. Material

A dataset consisting of 18 SLC SAR images collected from 6 March to 20 October 2018—through the terrain observation with progressive scans (TOPSAR) mode with Sentinel-1A sensor (VV polarization)—was used in order to test the performance of the developed 3D NLMF method. Table 1 lists the SAR images used for the experiments shown in Section 4.
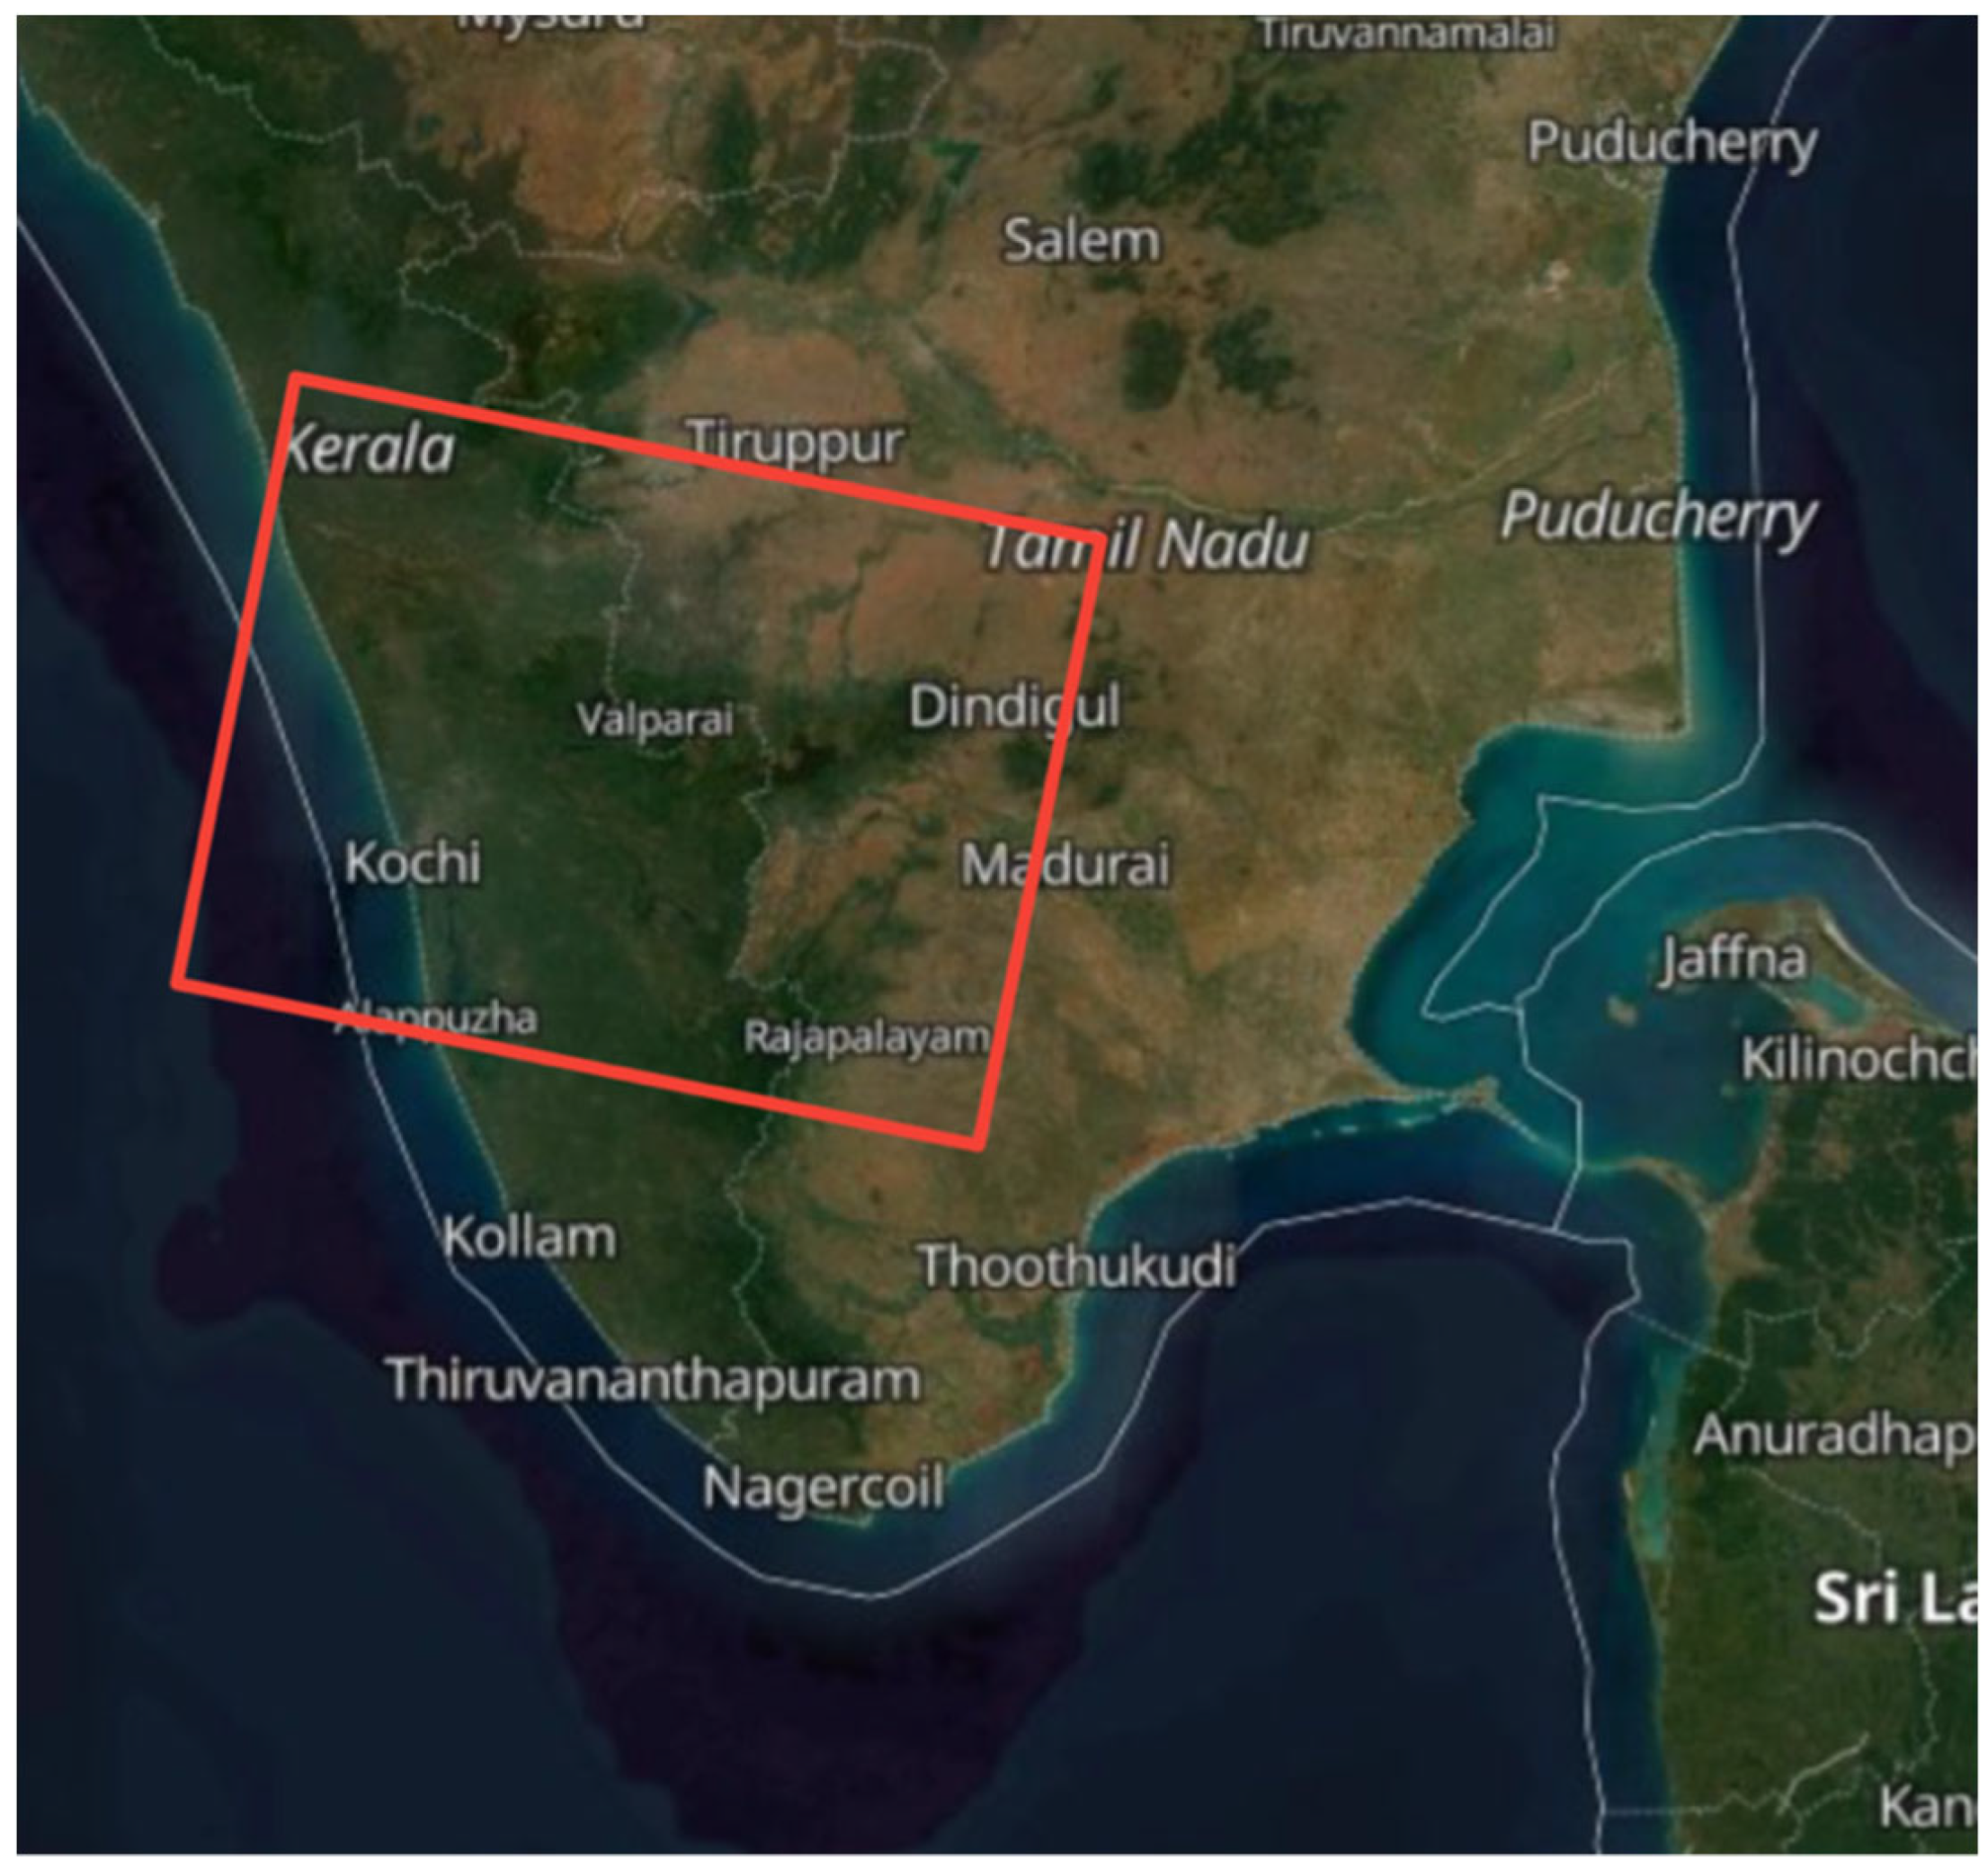
The selected case study is relevant to the Kerala region, India, as shown in Figure 3. The area was subjected to severe floods during the summer of 2018 [104,105]. Heavy monsoon rainfalls resulted in dams filling their operational capacity, causing the flood of low-lying regions, with over 500 dead people, hundreds of villages destroyed, and millions of USD in economic losses. In particular, the investigations presented in Section 4 refer to the inundations that occurred in the Thrissur District.

4. Experimental Results

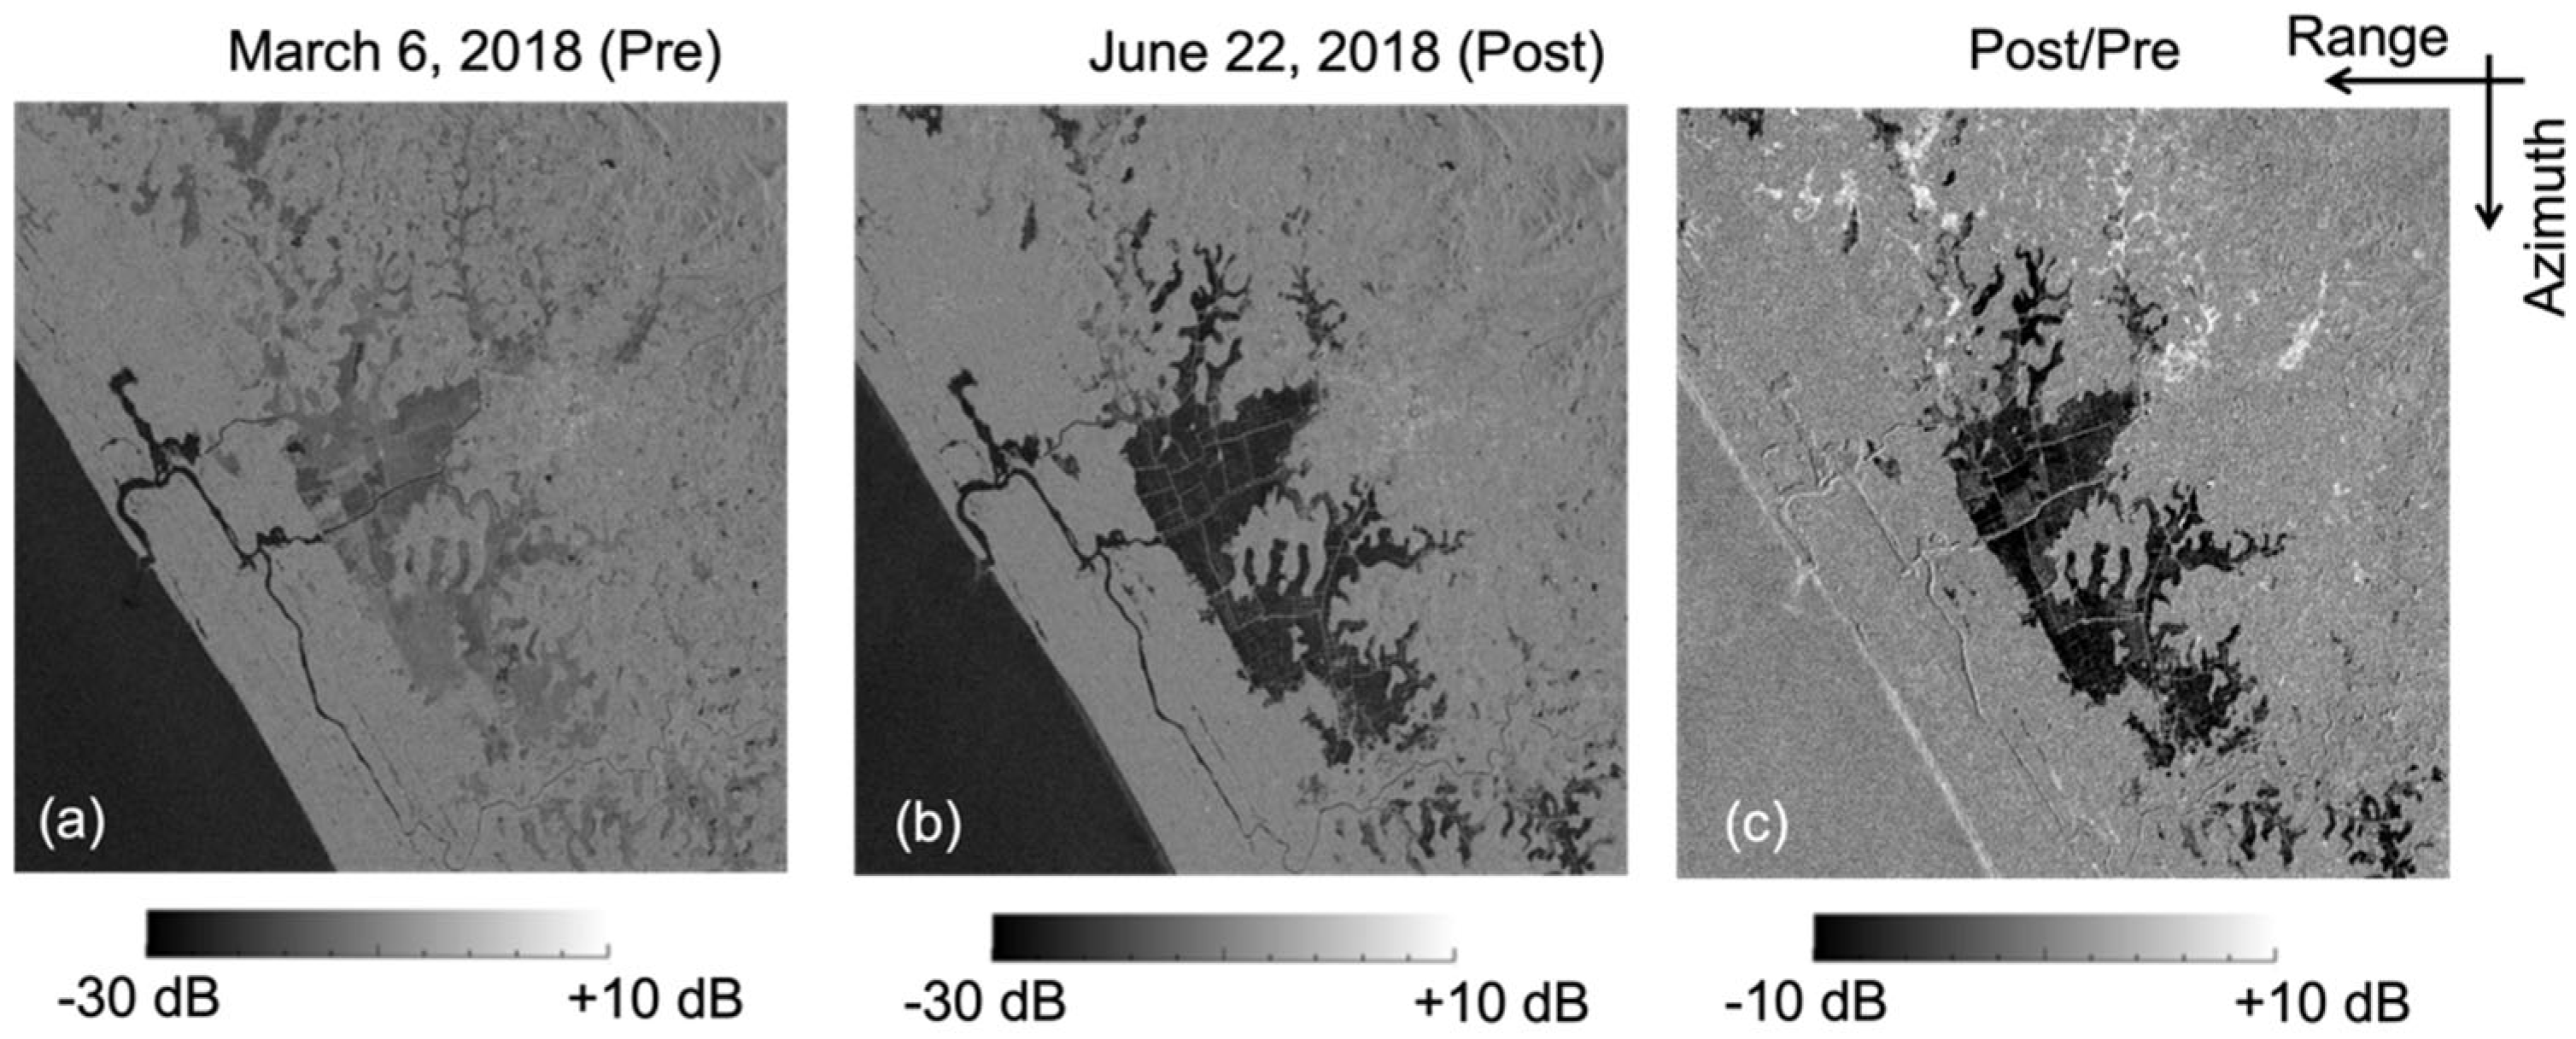
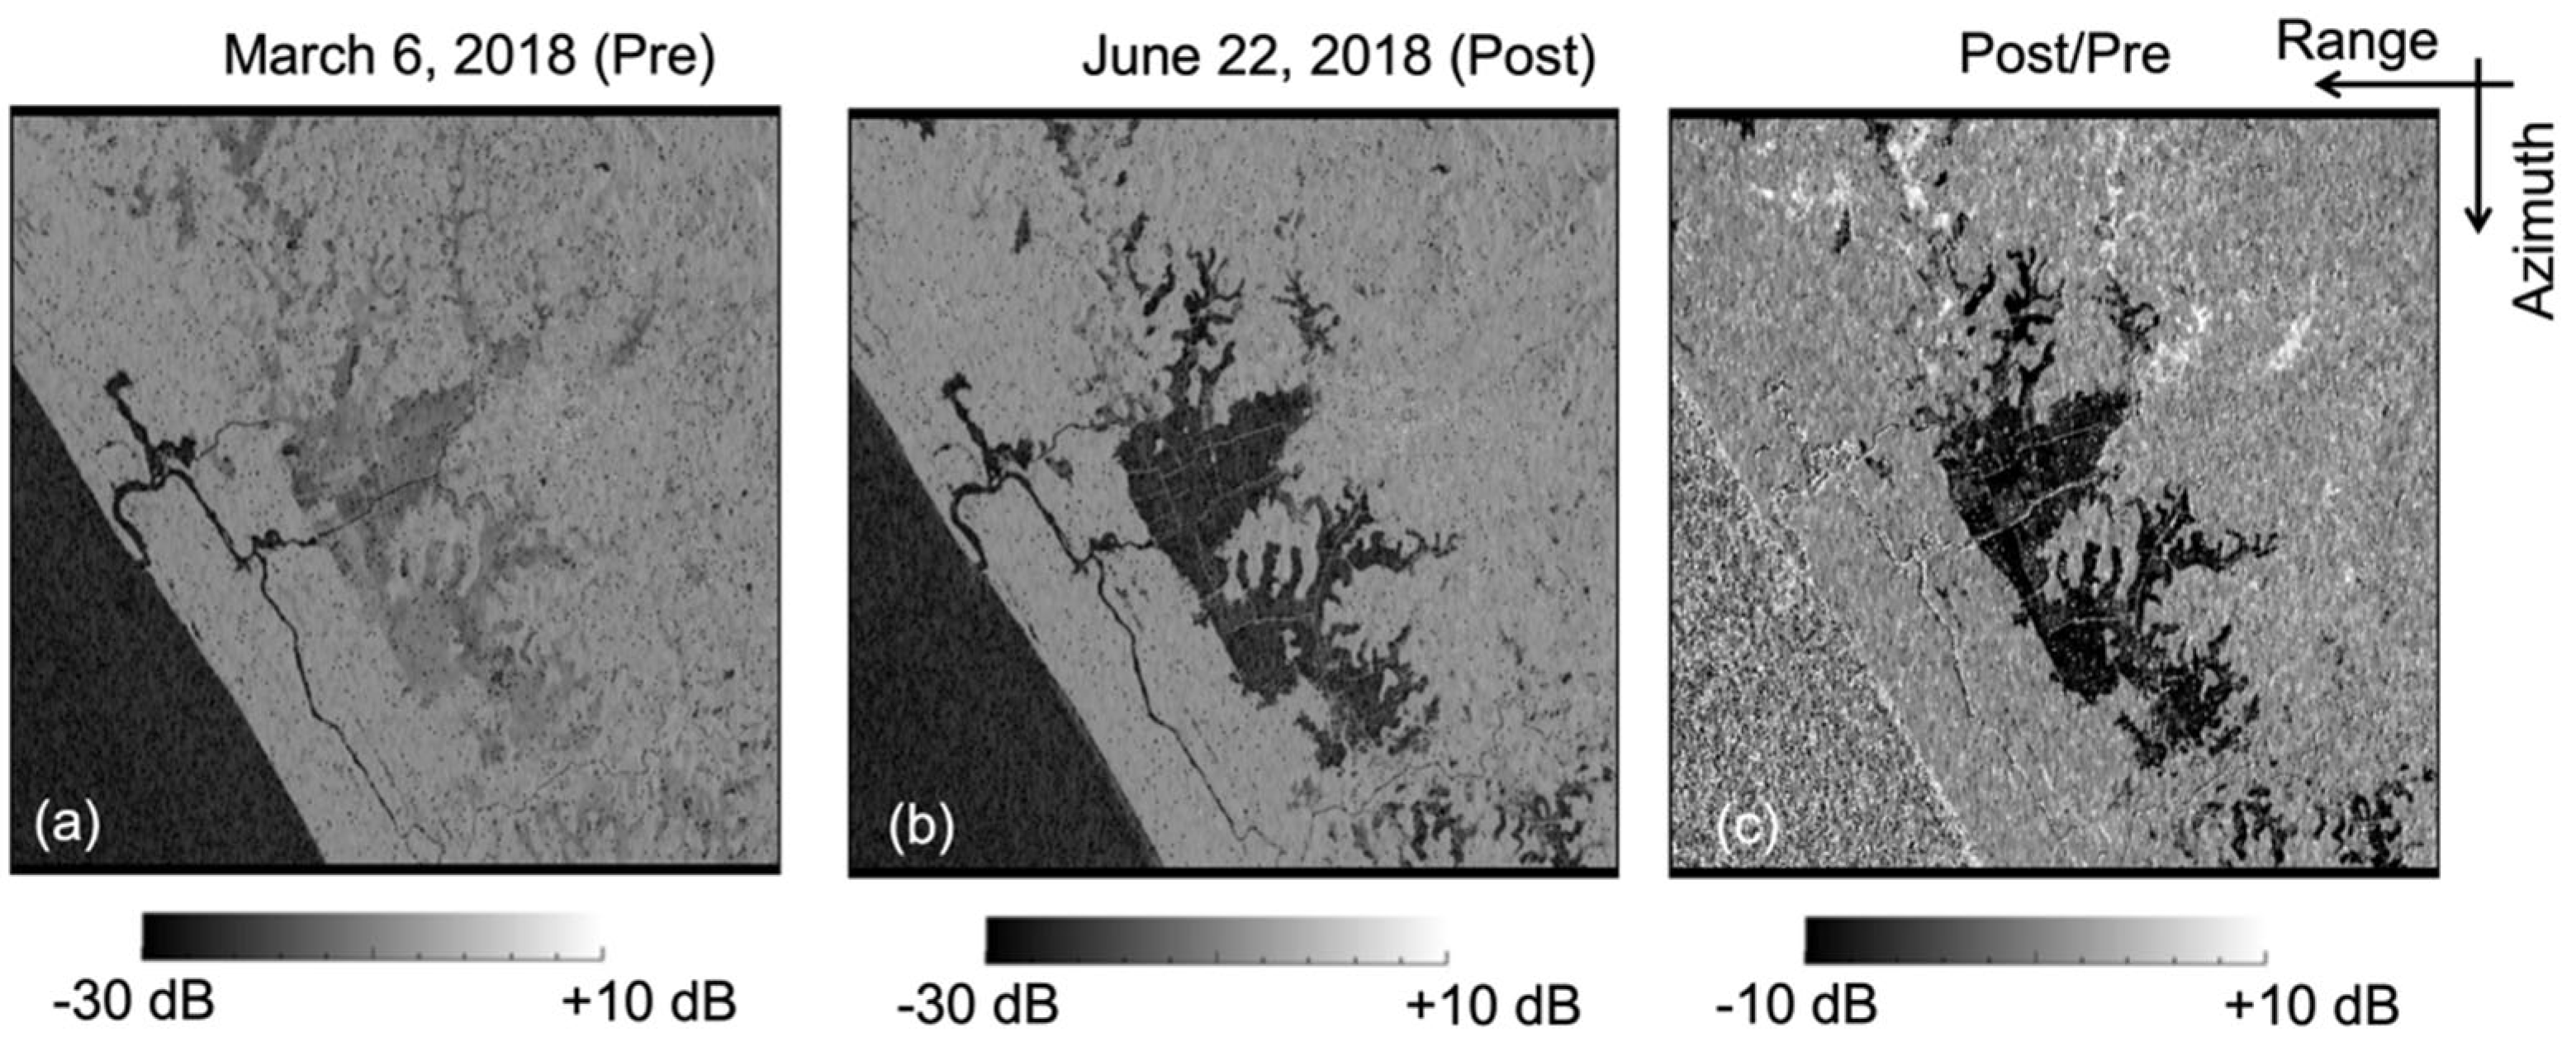
The available SAR images were preliminarily radiometrically calibrated through the Sentinel Application Platform (SNAP) [106] in order to extract, from the digital data maps of every single SAR image, the radar backscattering (sigma naught) values. It is worth remarking that, in order to evaluate the performance of the developed NLMF algorithm, the author of this investigation operated primarily in radar (azimuth × range) coordinates. Figure 4a,b show the maps of (unfiltered) sigma naught images computed over the Thrissur District on the two acquisition dates: 6 March 2018 (pre-) and 22 June 2018 (post-flood). The images were converted in log-scale (dB) for a suitable representation of the computed backscattered signal values. Figure 4c also shows the ratio image (post/pre), which corresponds to the difference between the images in Figure 4a,b. Maps are shown after a multi-look operation (with 20 pixels in range and 4 pixels in the azimuth directions, respectively) has been performed on the SAR images, thereby possessing images to show with almost squared pixels.
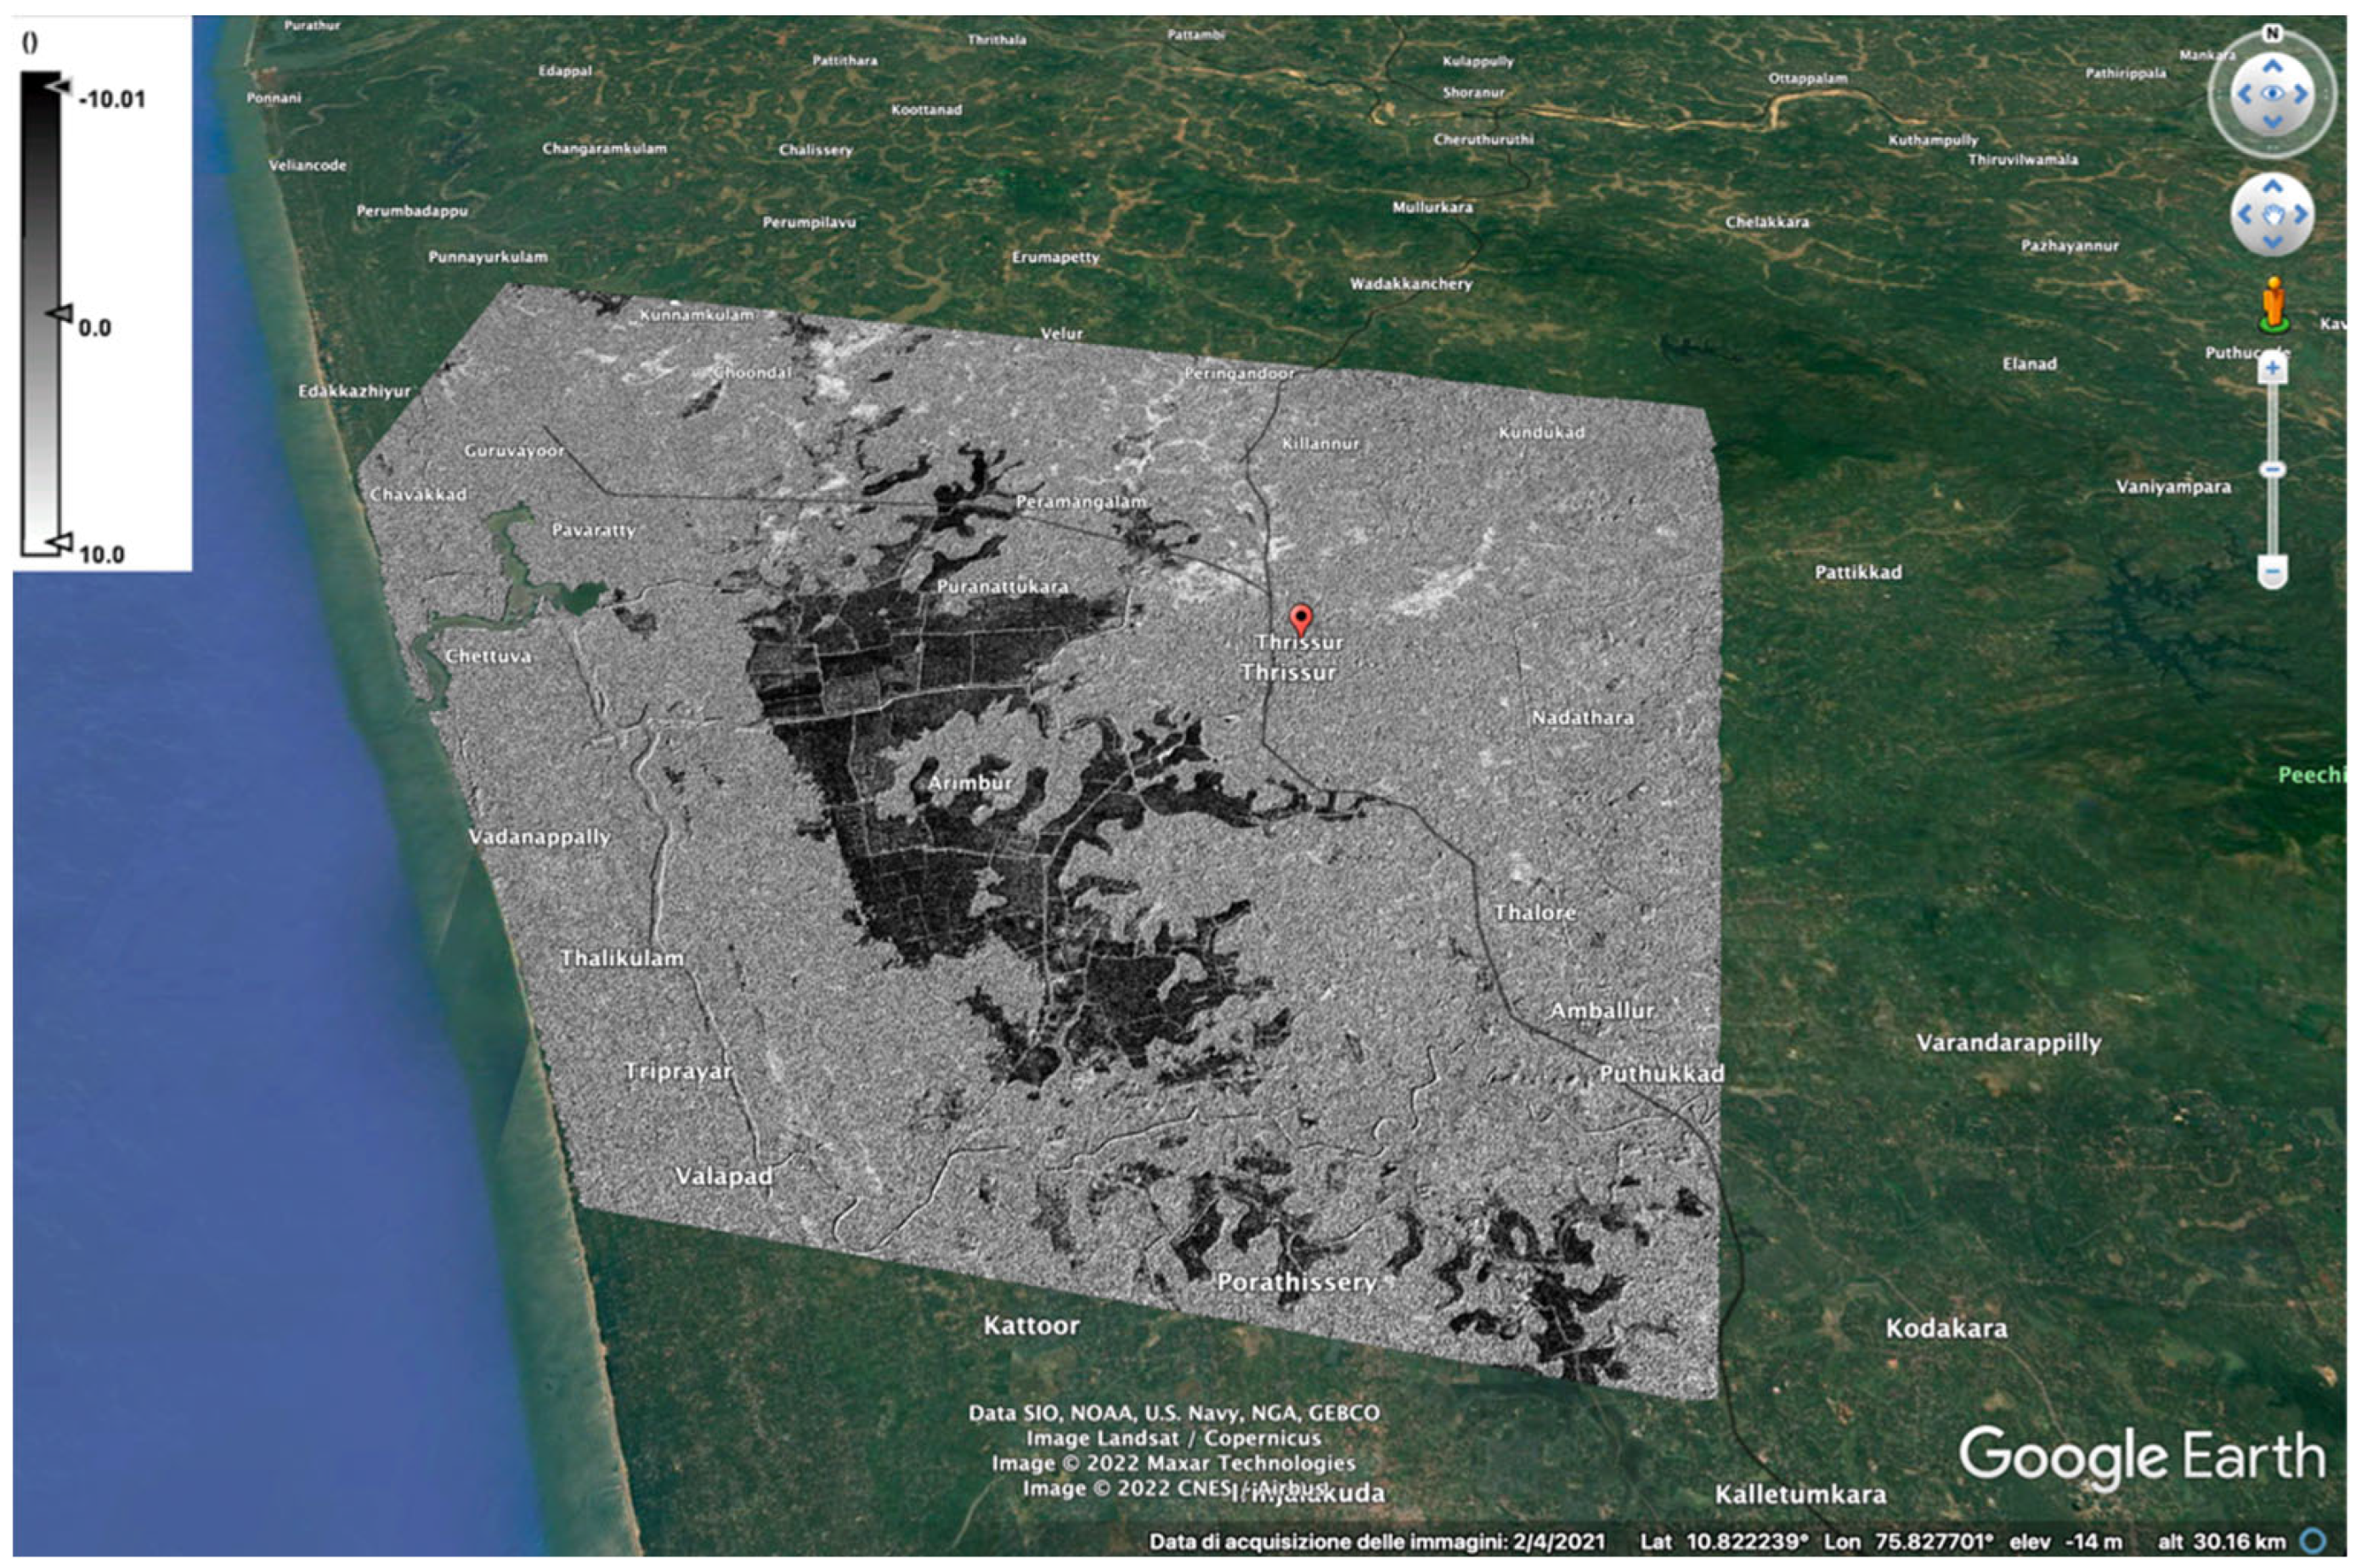
For the readers’ convenience, Figure 5 shows the ratio image map (dB scale) superimposed on Google Earth in order to better identify the geographical location of the investigated region.
The corresponding results obtained using the 2D NLMF method described in Section 2.1 are shown in Figure 6a–c.
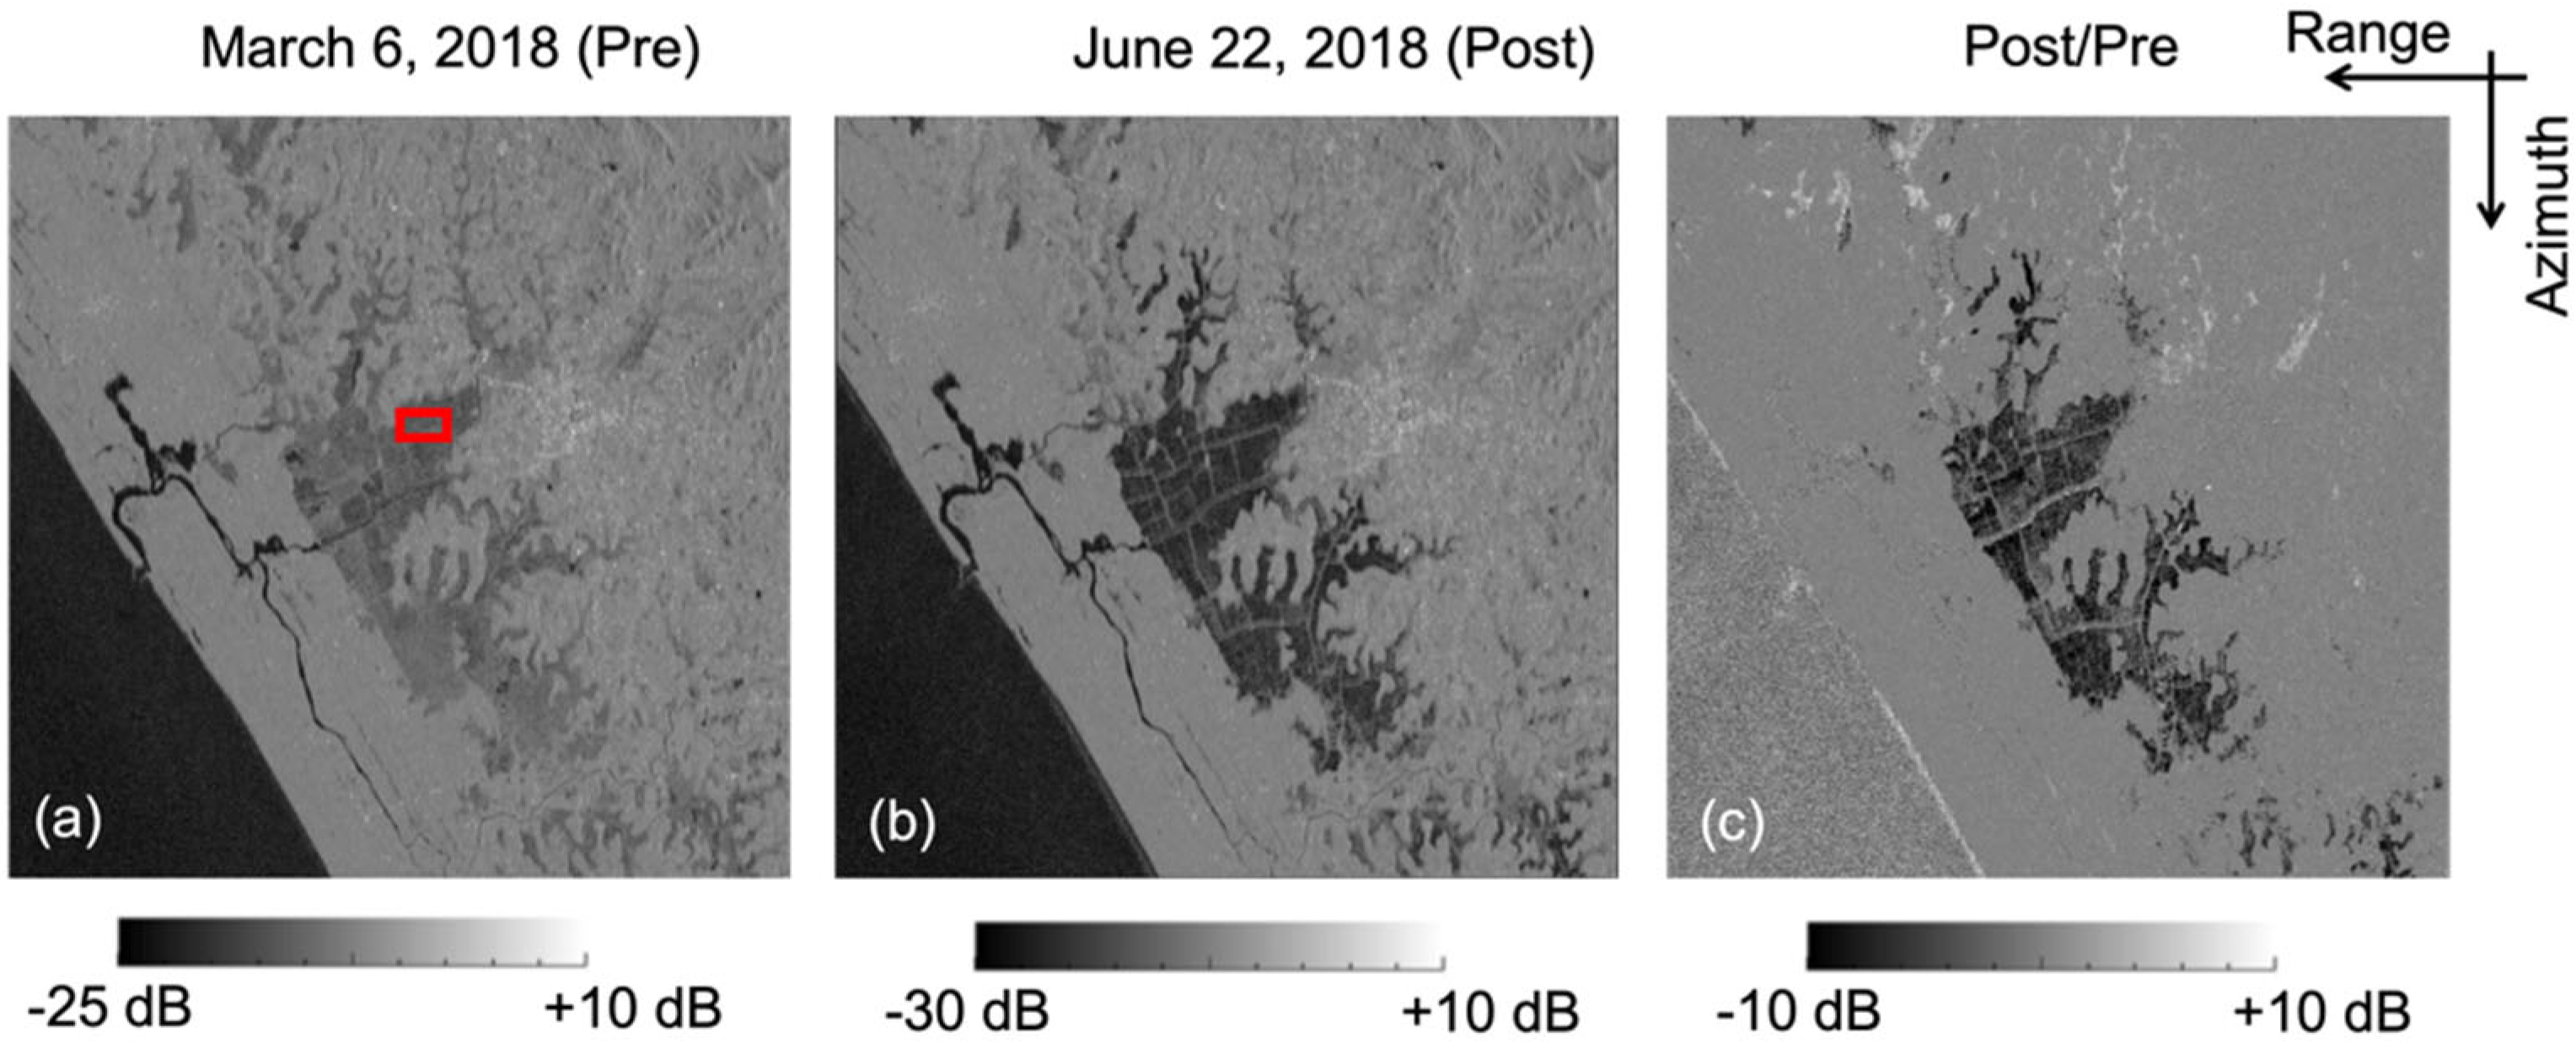
Figure 7 shows the equivalent results obtained by applying the developed 3D NLMF method described in Section 2.2.
Note that the maps shown in Figure 4, Figure 6 and Figure 7 were obtained after applying a multi-look operation (with 20 pixels in range and 4 pixels in the azimuth directions, respectively) on the single-look SAR images/products, thereby resulting in possessing images with almost squared pixels. It is also worth remarking that non-local mean filter operations had been carried out considering “similarity windows” with a dimension of (20 × 20 pixels). The “similar” patches were searched over the 100 × 100 pixels centered on the analyzed, generic SAR pixel in order to reduce the overall algorithm computation time. Of course, the proposed method is naturally prone to a parallel implementation on multi-core/multi-node computing architectures. As a further remark, it is worth highlighting that no other preliminarily or post-processing noise-filtering algorithms were applied to available SAR images. It was explicitly intended to elucidate the potential of the developed 3D noise-filtering method. Nonetheless, the joint application of additional pre-processing noise-filtering procedures were, for instance, using [69,70]. In addition, the subsequent application of the developed de-speckling method could enhance expected performance while preserving spatial details.

5. Key Performance of the Proposed Method

In order to quantify the performance of the 3D NLMF method, first, the NLMF method was applied to 2D images separately, as described in Section 2.1. Subsequently, the 3D method explored in Section 2.2 was used for the sequence of available SAR images.
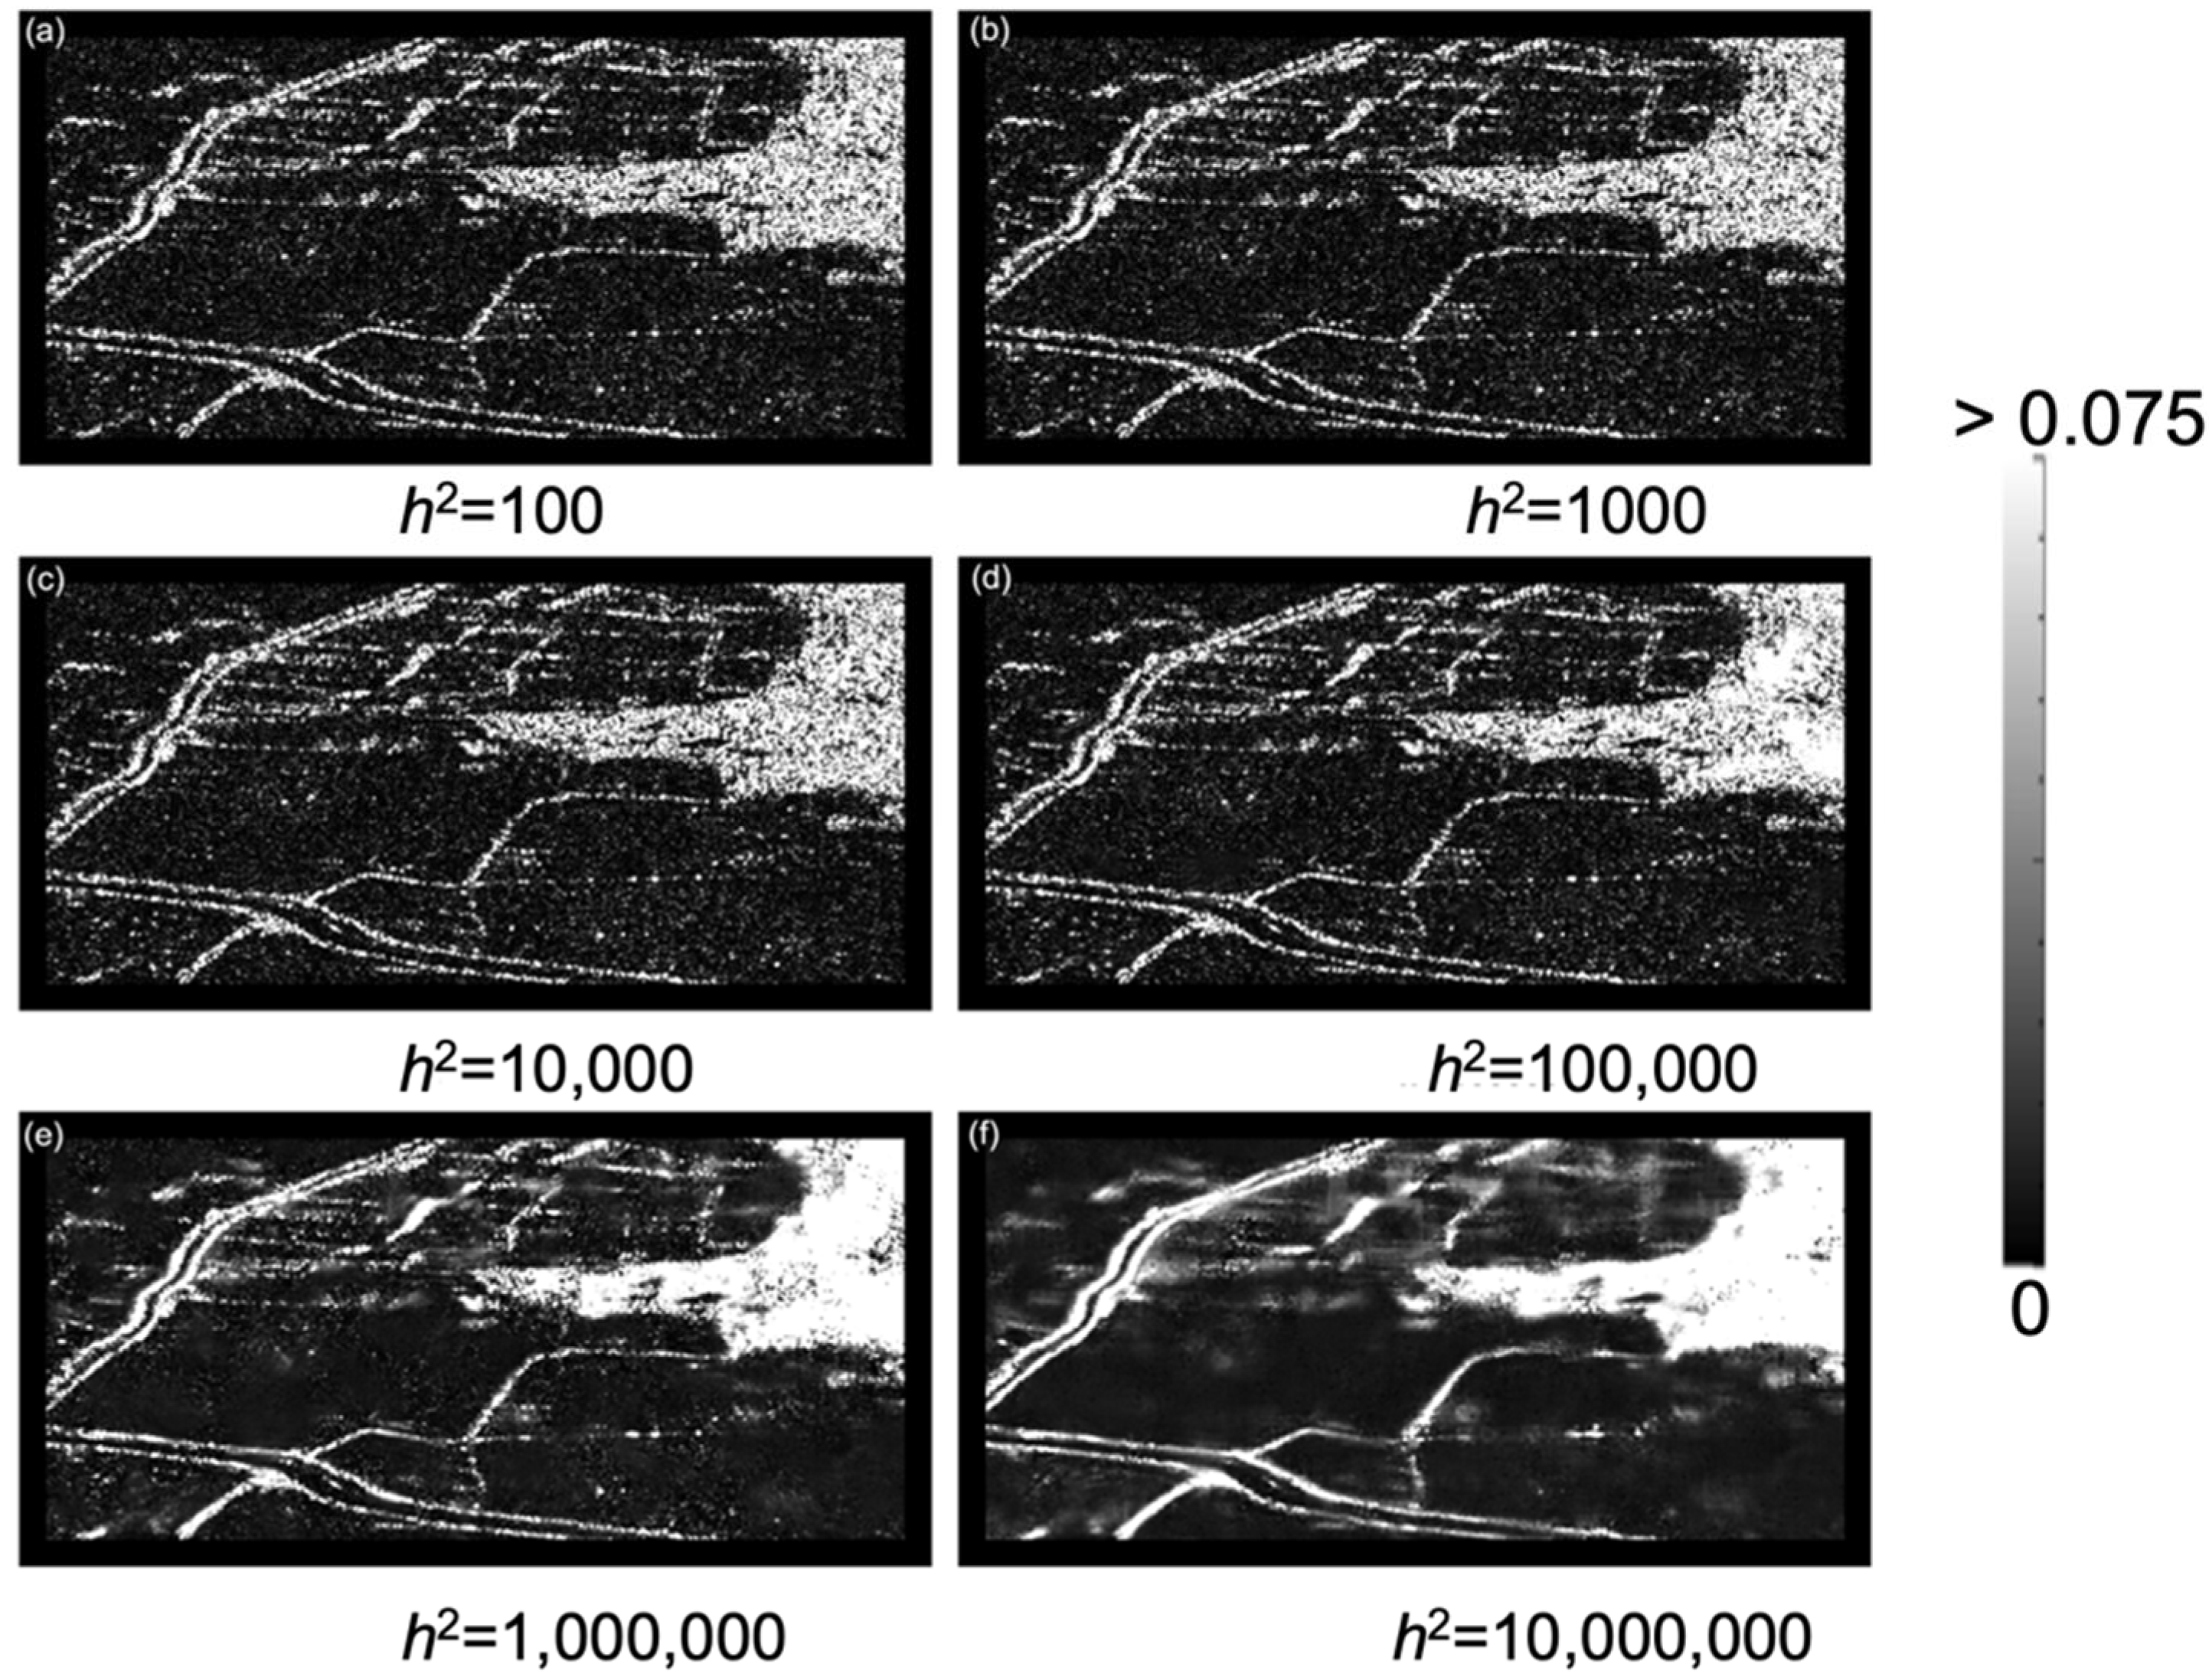
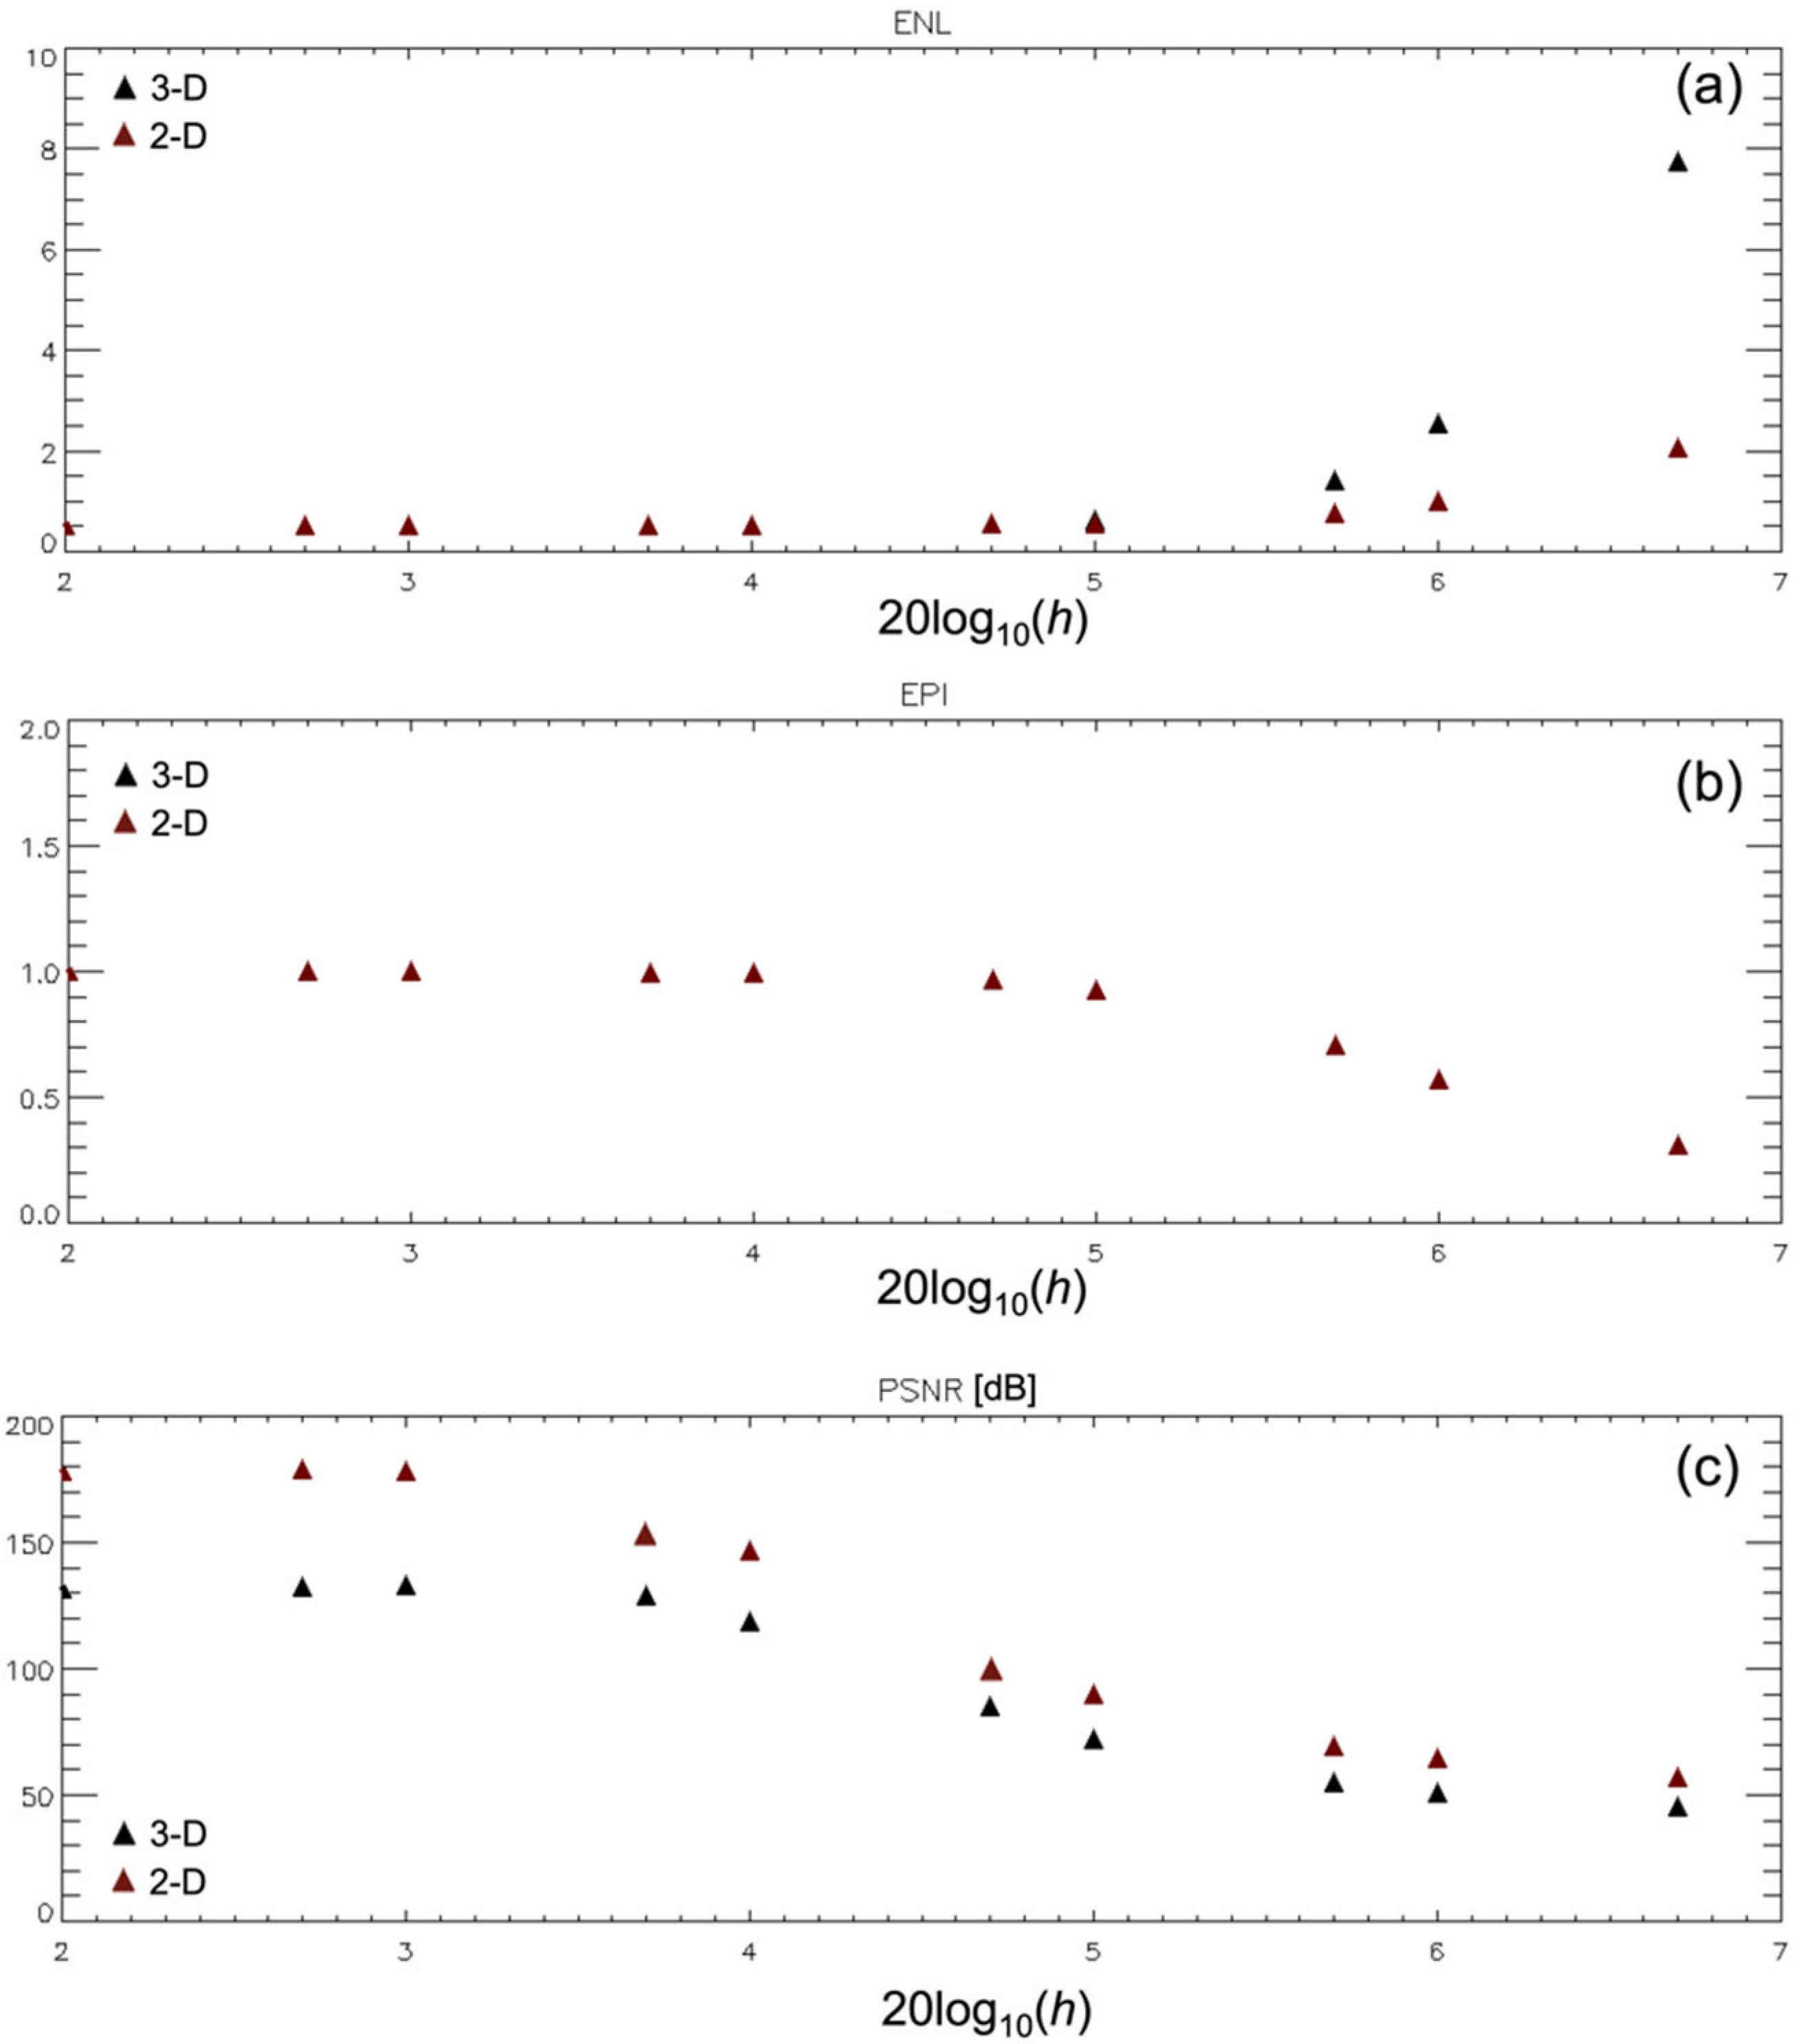
The selected case study area represents an excellent example of a heterogeneous scene. In order to evaluate the performance and limitations of the presented 3D filtering method, the subsequent analyses focus on the evaluation of crucial results obtained by considering different values for the standard deviation (i.e., h’) of the Gaussian kernel shown in Equations (3) and (4). Moreover, the selected value for the ξ parameter was set to ξ = 50 . Then, the value of the constant parameter h was varied accordingly. For every pool of parameters, the values of averaged ENL, EPI, and PSLR were calculated in the context of considering, as a test, the region highlighted with the red rectangle drawn in Figure 7a. Figure 8 shows the zoomed view of the 3D NLMF de-speckled SAR image (represented in a linear scale) relevant to the SAR acquisition data collected on 22 June 2018, as obtained considering different values of the parameter h. The ENL, EPI, and PSLR were initially computed using a moving averaging window of 20 × 20 pixels and then averaging them over the selected area.
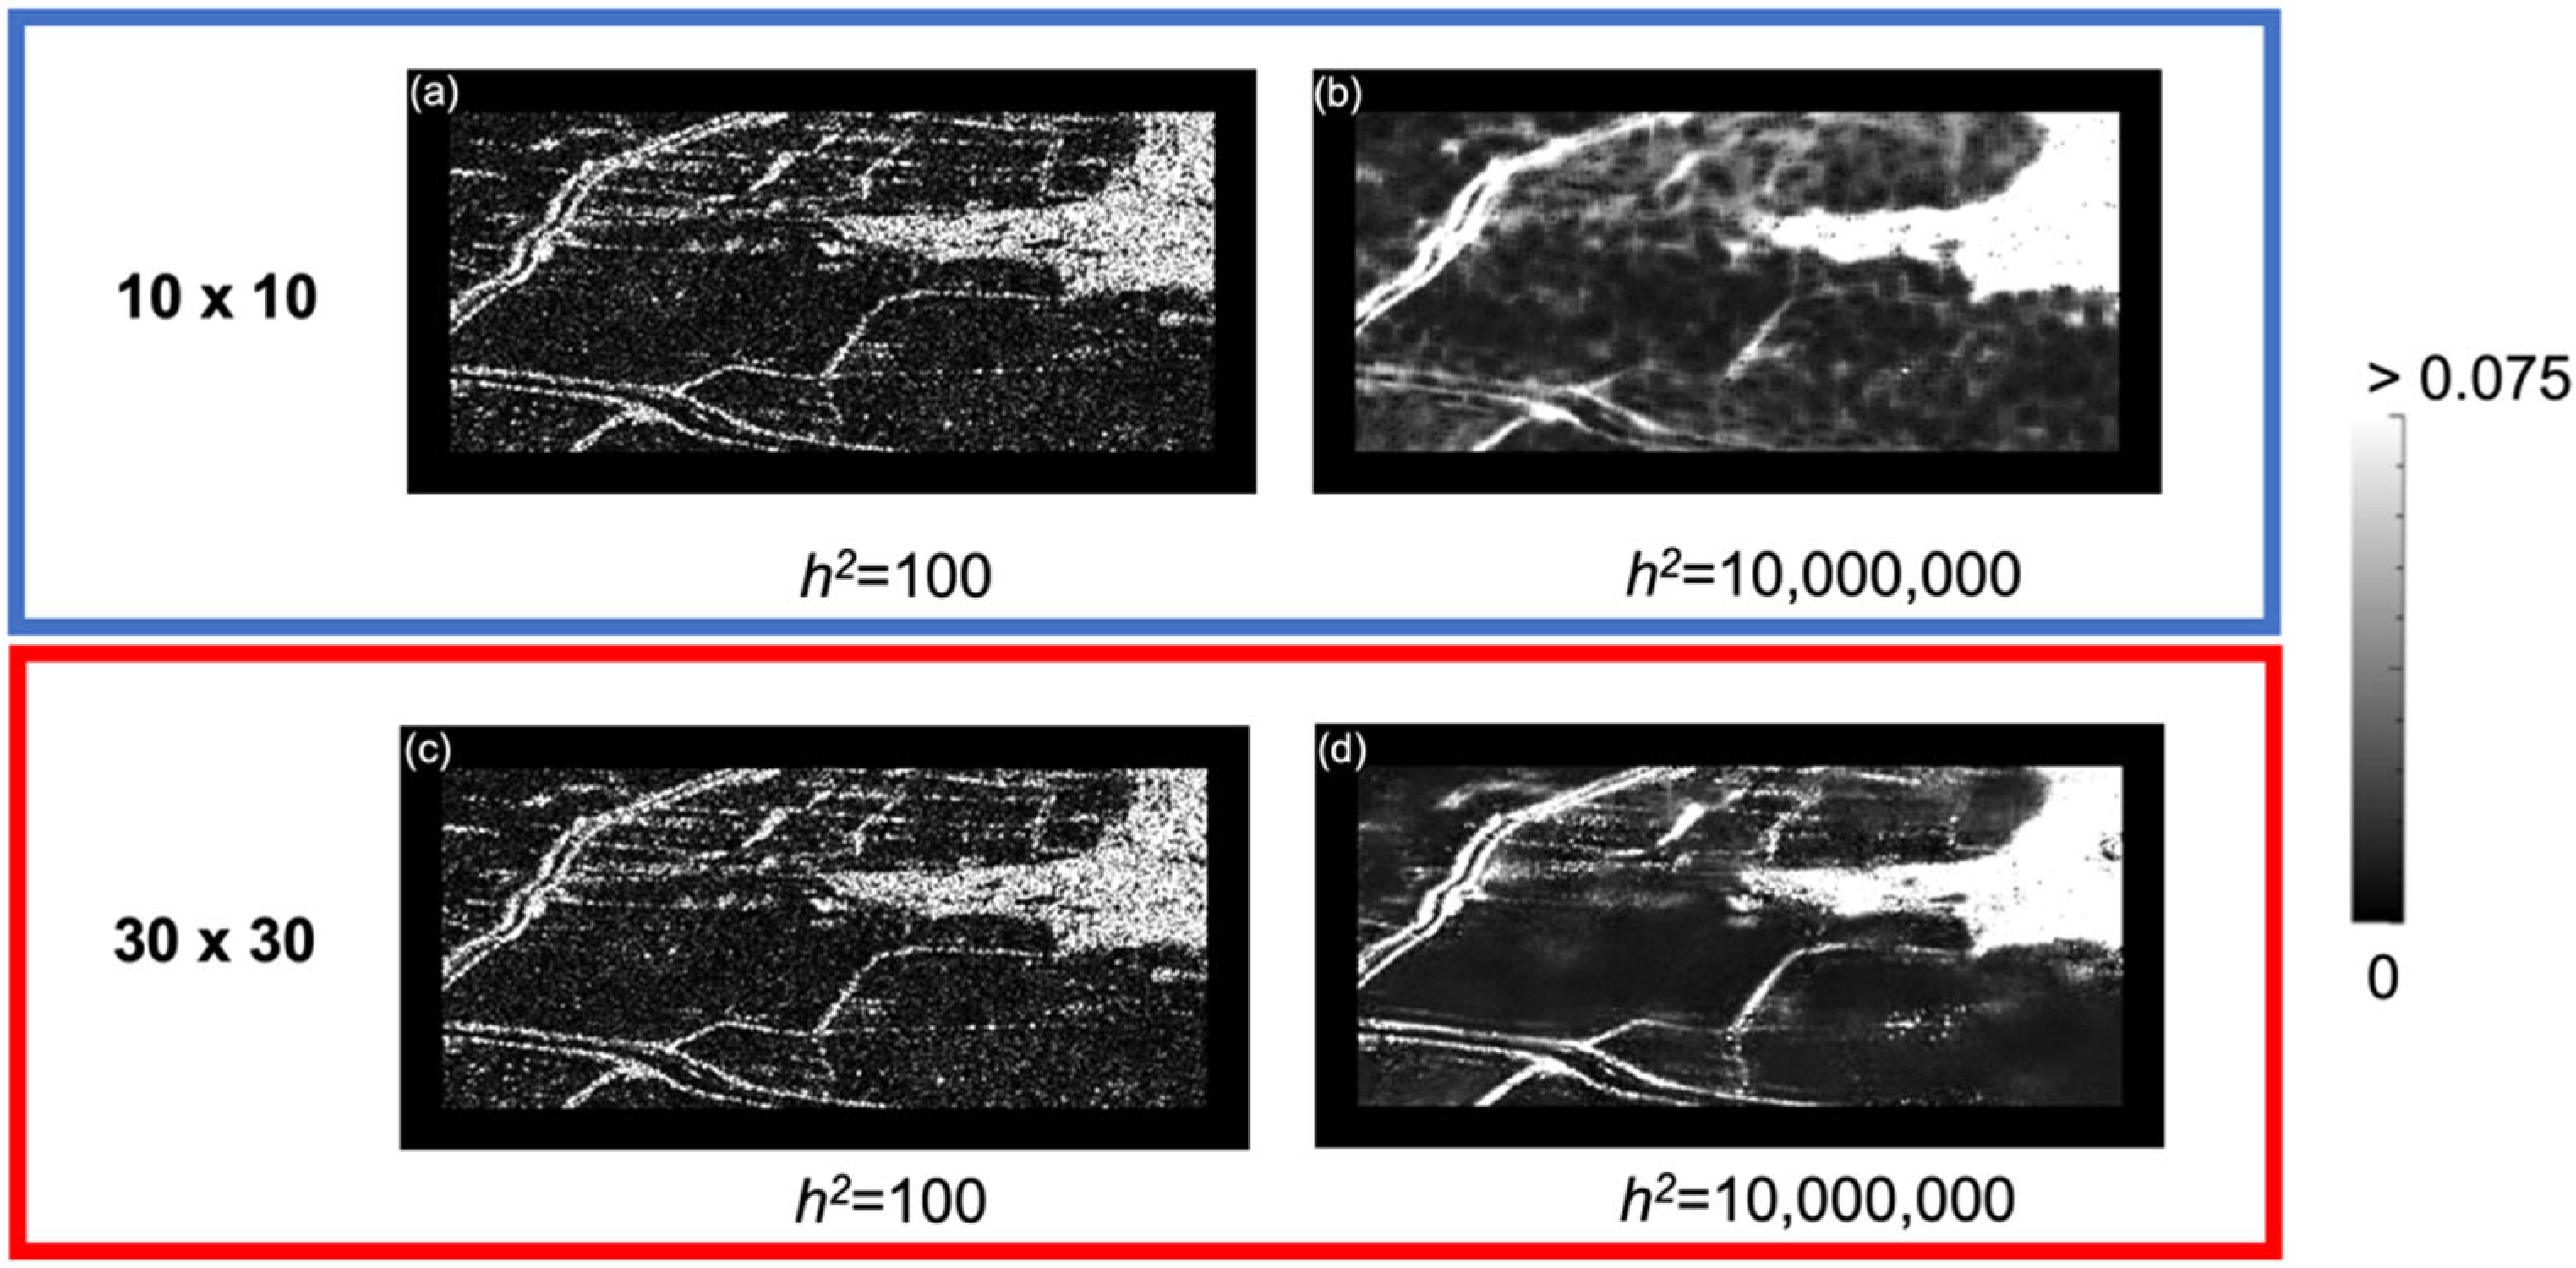
As a further experiment, the size of the “similar patches” was varied, considering the cases of the 10 × 10 and 30 × 30 SAR pixels. Figure 9 shows the 3D filtered maps of 22 June 2018, obtained with different patches sizes and Gaussian filter standard deviations. The results show that small patches sizes (i.e., 10 × 10) are responsible for a dramatic smoothing of the filtered SAR image, as shown in Figure 9b, due to lack of information in the estimation of the patches distance. Conversely, the noise-filtering performance improvements in terms of enhanced ENL values with larger patches sizes is paid in terms of higher computation times.
Figure 10 shows the plots of ENL, EPI, and PSLR vs. the variance of the Gaussian kernel (h2), in the logarithmic scale, which are for the two separate cases in which the 2D NLMF and 3D NLMF procedures are applied, when considering the patch sizes of the 20 × 20 SAR pixels.
The analysis of Figure 10 reveals that the correct choice of the Gaussian kernel must necessarily result from a compromise between noise reduction and feature extraction preservation. More specifically, small values of h correspond to high values of PSLR and EPI. In contrast, higher values of h significantly ameliorate ENL at the expense of a reduced capacity to identify small features and preserve edges. EPI is practically the same for both the 2D and 3D cases. ENL improvements of the 3D case with respect to the 2D one, using the same parameters of the Gaussian Filter in Equations (2)–(4), appear predominant with values of h2 larger than 5 × 10⁵. The results demonstrate a balance between the different aspects that must be adopted in order to tune the 3D NLMF. A strategy that may be assumed in order to identify the correct value of h2 to be used is, for instance, found in determining the elbow point of the curve, as shown in Figure 10a.
The obtained noise-filtered images can be beneficial for the purposes of applying conventional and multi-temporal change detection (CD) methods, considering several heterogeneous contexts and natural/anthropogenic risk conditions. This work only intends to provide readers with information concerning the newly developed 3D NMLF algorithm and its performance. However, further analyses of the identified CD maps are worth subsequent investigations. Moreover, exploiting extensive archives of processed SAR data is mandatory in order to access the potential of the developed method in a fully operational context.

6. Conclusions

This paper investigated the potential of 3D non-local mean filters (NLMF) for the purposes of de-speckling SAR images, particularly in change detection applications. The theory of NLMF was briefly introduced and a specific implementation was considered in order to translate the problem from the 2D to the 3D domain. The proposed methodology was initially tested on a region in Kerala, India, which was a region that was severely affected by disastrous flooding inundations in 2018. This method can be used to analyze several heterogenous catastrophic conditions by the improving of the spatial resolution of data products while profiting from the time redundancy of information gathered in a sequence of multi-temporal SAR images. The noise-filtering operation was conducted adaptatively in order to preserve the capability to recover even the tiny amplitude variations from one image to another. This method was implemented considering SAR applications involving sets of amplitude (and calibrated) SAR images. However, the same concept can also be adapted to better filter out the noise from a sequence of multi-temporal SAR interferograms, operating directly in the 3D space/time domain, in conjunction with other methods (see for instance [17,107,108,109]). Furthermore, it must be noted that this was recently proposed in the literature for ground deformation retrieval through InSAR technology [110,111].

Funding

This research received no external funding.

Data Availability Statement

The data presented in this study are available on request from the corresponding author.

Acknowledgments

The author thanks ESA, who provided the Sentinel-1 SAR data, and Vincenzo Sileo, who preliminarily contributed to the processing of the sigma naught maps within the framework of his master’s degree thesis. Additionally, the author would like to express his gratitude to Mariarosaria Manzo for the longest and happiest hours spent together in twenty years, and he hopes to see her again elsewhere.

Conflicts of Interest

The author declares no conflict of interest.

References

  1. Wasowski, J.; Bovenga, F. Investigating Landslides and Unstable Slopes with Satellite Multi Temporal Interferometry: Current Issues and Future Perspectives. Eng. Geol. 2014, 174, 103–138. [Google Scholar] [CrossRef]
  2. Deledalle, C.-A.; Denis, L.; Tupin, F.; Reigber, A.; Jager, M. NL-SAR: A Unified Nonlocal Framework for Resolution-Preserving (Pol)(In)SAR Denoising. IEEE Trans. Geosci. Remote Sens. 2015, 53, 2021–2038. [Google Scholar] [CrossRef] [Green Version]
  3. Zhu, X.X.; Bamler, R. Very High Resolution Spaceborne SAR Tomography in Urban Environment. IEEE Trans. Geosci. Remote Sens. 2010, 48, 4296–4308. [Google Scholar] [CrossRef] [Green Version]
  4. Gong, M.; Zhou, Z.; Ma, J. Change Detection in Synthetic Aperture Radar Images Based on Image Fusion and Fuzzy Clustering. IEEE Trans. Image Process. 2012, 21, 2141–2151. [Google Scholar] [CrossRef] [PubMed]
  5. Strozzi, T.; Luckman, A.; Murray, T.; Wegmuller, U.; Werner, C.L. Glacier Motion Estimation Using SAR Offset-Tracking Procedures. IEEE Trans. Geosci. Remote Sens. 2002, 40, 2384–2391. [Google Scholar] [CrossRef] [Green Version]
  6. Ding, J.; Chen, B.; Liu, H.; Huang, M. Convolutional Neural Network with Data Augmentation for SAR Target Recognition. IEEE Geosci. Remote Sens. Lett. 2016, 13, 364–368. [Google Scholar] [CrossRef]
  7. Hooper, A.; Bekaert, D.; Spaans, K.; Arıkan, M. Recent Advances in SAR Interferometry Time Series Analysis for Measuring Crustal Deformation. Tectonophysics 2012, 514–517, 1–13. [Google Scholar] [CrossRef]
  8. Bazi, Y.; Bruzzone, L.; Melgani, F. An Unsupervised Approach Based on the Generalized Gaussian Model to Automatic Change Detection in Multitemporal SAR Images. IEEE Trans. Geosci. Remote Sens. 2005, 43, 874–887. [Google Scholar] [CrossRef] [Green Version]
  9. Mora, O.; Mallorqui, J.J.; Broquetas, A. Linear and Nonlinear Terrain Deformation Maps from a Reduced Set of Interferometric Sar Images. IEEE Trans. Geosci. Remote Sens. 2003, 41, 2243–2253. [Google Scholar] [CrossRef]
  10. Hooper, A.; Segall, P.; Zebker, H. Persistent Scatterer Interferometric Synthetic Aperture Radar for Crustal Deformation Analysis, with Application to Volcán Alcedo, Galápagos. J. Geophys. Res. Solid Earth 2007, 112. [Google Scholar] [CrossRef]
  11. Hooper, A. A Multi-Temporal InSAR Method Incorporating Both Persistent Scatterer and Small Baseline Approaches. Geophys. Res. Lett. 2008, 35. [Google Scholar] [CrossRef] [Green Version]
  12. Yamaguchi, Y.; Moriyama, T.; Ishido, M.; Yamada, H. Four-Component Scattering Model for Polarimetric SAR Image Decomposition. IEEE Trans. Geosci. Remote Sens. 2005, 43, 1699–1706. [Google Scholar] [CrossRef]
  13. Berardino, P.; Fornaro, G.; Lanari, R.; Sansosti, E. A New Algorithm for Surface Deformation Monitoring Based on Small Baseline Differential SAR Interferograms. IEEE Trans. Geosci. Remote Sens. 2002, 40, 2375–2383. [Google Scholar] [CrossRef] [Green Version]
  14. Yagüe-Martínez, N.; Prats-Iraola, P.; Rodríguez González, F.; Brcic, R.; Shau, R.; Geudtner, D.; Eineder, M.; Bamler, R. Interferometric Processing of Sentinel-1 TOPS Data. IEEE Trans. Geosci. Remote Sens. 2016, 54, 2220–2234. [Google Scholar] [CrossRef] [Green Version]
  15. Galloway, D.L.; Hudnut, K.W.; Ingebritsen, S.E.; Phillips, S.P.; Peltzer, G.; Rogez, F.; Rosen, P.A. Detection of Aquifer System Compaction and Land Subsidence Using Interferometric Synthetic Aperture Radar, Antelope Valley, Mojave Desert, California. Water Resour. Res. 1998, 34, 2573–2585. [Google Scholar] [CrossRef]
  16. Crosetto, M.; Monserrat, O.; Cuevas-González, M.; Devanthéry, N.; Crippa, B. Persistent Scatterer Interferometry: A Review. ISPRS J. Photogramm. Remote Sens. 2016, 115, 78–89. [Google Scholar] [CrossRef] [Green Version]
  17. Ferretti, A.; Fumagalli, A.; Novali, F.; Prati, C.; Rocca, F.; Rucci, A. A New Algorithm for Processing Interferometric Data-Stacks: SqueeSAR. IEEE Trans. Geosci. Remote Sens. 2011, 49, 3460–3470. [Google Scholar] [CrossRef]
  18. Ferretti, A.; Prati, C.; Rocca, F. Nonlinear Subsidence Rate Estimation Using Permanent Scatterers in Differential SAR Interferometry. IEEE Trans. Geosci. Remote Sens. 2000, 38, 2202–2212. [Google Scholar] [CrossRef] [Green Version]
  19. Gong, M.; Cao, Y.; Wu, Q. A Neighborhood-Based Ratio Approach for Change Detection in SAR Images. IEEE Geosci. Remote Sens. Lett. 2012, 9, 307–311. [Google Scholar] [CrossRef]
  20. Gong, M.; Su, L.; Jia, M.; Chen, W. Fuzzy Clustering With a Modified MRF Energy Function for Change Detection in Synthetic Aperture Radar Images. IEEE Trans. Fuzzy Syst. 2014, 22, 98–109. [Google Scholar] [CrossRef]
  21. Giustarini, L.; Hostache, R.; Matgen, P.; Schumann, G.J.-P.; Bates, P.D.; Mason, D.C. A Change Detection Approach to Flood Mapping in Urban Areas Using TerraSAR-X. IEEE Trans. Geosci. Remote Sens. 2013, 51, 2417–2430. [Google Scholar] [CrossRef] [Green Version]
  22. Matgen, P.; Hostache, R.; Schumann, G.; Pfister, L.; Hoffmann, L.; Savenije, H.H.G. Towards an Automated SAR-Based Flood Monitoring System: Lessons Learned from Two Case Studies. Phys. Chem. Earth Parts ABC 2011, 36, 241–252. [Google Scholar] [CrossRef]
  23. Moser, G.; Serpico, S.B. Generalized Minimum-Error Thresholding for Unsupervised Change Detection from SAR Amplitude Imagery. IEEE Trans. Geosci. Remote Sens. 2006, 44, 2972–2982. [Google Scholar] [CrossRef]
  24. Bovolo, F.; Bruzzone, L. A Detail-Preserving Scale-Driven Approach to Change Detection in Multitemporal SAR Images. IEEE Trans. Geosci. Remote Sens. 2005, 43, 2963–2972. [Google Scholar] [CrossRef]
  25. Mastro, P.; Masiello, G.; Serio, C.; Pepe, A. Change Detection Techniques with Synthetic Aperture Radar Images: Experiments with Random Forests and Sentinel-1 Observations. Remote Sens. 2022, 14, 3323. [Google Scholar] [CrossRef]
  26. DeVries, B.; Huang, C.; Armston, J.; Huang, W.; Jones, J.W.; Lang, M.W. Rapid and Robust Monitoring of Flood Events Using Sentinel-1 and Landsat Data on the Google Earth Engine. Remote Sens. Environ. 2020, 240, 111664. [Google Scholar] [CrossRef]
  27. Sowter, A.; Amat, M.B.C.; Cigna, F.; Marsh, S.; Athab, A.; Alshammari, L. Mexico City Land Subsidence in 2014–2015 with Sentinel-1 IW TOPS: Results Using the Intermittent SBAS (ISBAS) Technique. Int. J. Appl. Earth Obs. Geoinform. 2016, 52, 230–242. [Google Scholar] [CrossRef]
  28. Dai, K.; Li, Z.; Tomás, R.; Liu, G.; Yu, B.; Wang, X.; Cheng, H.; Chen, J.; Stockamp, J. Monitoring Activity at the Daguangbao Mega-Landslide (China) Using Sentinel-1 TOPS Time Series Interferometry. Remote Sens. Environ. 2016, 186, 501–513. [Google Scholar] [CrossRef] [Green Version]
  29. Ndikumana, E.; Minh, D.H.T.; Baghdadi, N.; Courault, D.; Hossard, L. Deep Recurrent Neural Network for Agricultural Classification Using Multitemporal SAR Sentinel-1 for Camargue, France. Remote Sens. 2018, 10, 1217. [Google Scholar] [CrossRef] [Green Version]
  30. Nagler, T.; Rott, H.; Hetzenecker, M.; Wuite, J.; Potin, P. The Sentinel-1 Mission: New Opportunities for Ice Sheet Observations. Remote Sens. 2015, 7, 9371–9389. [Google Scholar] [CrossRef]
  31. Bauer-Marschallinger, B.; Freeman, V.; Cao, S.; Paulik, C.; Schaufler, S.; Stachl, T.; Modanesi, S.; Massari, C.; Ciabatta, L.; Brocca, L.; et al. Toward Global Soil Moisture Monitoring With Sentinel-1: Harnessing Assets and Overcoming Obstacles. IEEE Trans. Geosci. Remote Sens. 2019, 57, 520–539. [Google Scholar] [CrossRef]
  32. Tian, X.; Ma, Z.-F.; Jiang, M. A Modification to Time-Series Coregistration for Sentinel-1 TOPS Data. IEEE J. Sel. Top. Appl. Earth Obs. Remote Sens. 2020, 13, 1639–1648. [Google Scholar] [CrossRef]
  33. Ma, Z.-F.; Jiang, M.; Zhao, Y.; Malhotra, R.; Yong, B. Minimum Spanning Tree Co-Registration Approach for Time-Series Sentinel-1 TOPS Data. IEEE J. Sel. Top. Appl. Earth Obs. Remote Sens. 2019, 12, 3004–3013. [Google Scholar] [CrossRef]
  34. Ma, Z.-F.; Jiang, M.; Huang, T. A Sequential Approach for Sentinel-1 TOPS Time-Series Co-Registration Over Low Coherence Scenarios. IEEE Trans. Geosci. Remote Sens. 2021, 59, 4818–4826. [Google Scholar] [CrossRef]
  35. Mastro, P.; Serio, C.; Masiello, G.; Pepe, A. The Multiple Aperture SAR Interferometry (MAI) Technique for the Detection of Large Ground Displacement Dynamics: An Overview. Remote Sens. 2020, 12, 1189. [Google Scholar] [CrossRef] [Green Version]
  36. Fusco, A.; Pepe, A.; Berardino, P.; De Luca, C.; Buonanno, S.; Lanari, R. A Phase-Preserving Focusing Technique for TOPS Mode SAR Raw Data Based on Conventional Processing Methods. Sensors 2019, 19, 3321. [Google Scholar] [CrossRef] [Green Version]
  37. Prats, P.; Scheiber, R.; Mittermayer, J.; Meta, A.; Moreira, A. Processing of Sliding Spotlight and TOPS SAR Data Using Baseband Azimuth Scaling. IEEE Trans. Geosci. Remote Sens. 2010, 48, 770–780. [Google Scholar] [CrossRef] [Green Version]
  38. Prats-Iraola, P.; Scheiber, R.; Marotti, L.; Wollstadt, S.; Reigber, A. TOPS Interferometry with TerraSAR-X. IEEE Trans. Geosci. Remote Sens. 2012, 50, 3179–3188. [Google Scholar] [CrossRef] [Green Version]
  39. De Zan, F.; Monti Guarnieri, A. TOPSAR: Terrain Observation by Progressive Scans. IEEE Trans. Geosci. Remote Sens. 2006, 44, 2352–2360. [Google Scholar] [CrossRef]
  40. Hoang, T.T.; Truong, V.T.; Hayashi, M.; Tadono, T.; Nasahara, K.N. New JAXA High-Resolution Land Use/Land Cover Map for Vietnam Aiming for Natural Forest and Plantation Forest Monitoring. Remote Sens. 2020, 12, 2707. [Google Scholar] [CrossRef]
  41. Çolak, E.; Chandra, M.; Sunar, F. The use of multi-temporal sentinel satellites in the analysis of land cover/land use changes caused by the nuclear power plant construction. In Proceedings of the International Archives of the Photogrammetry, Remote Sensing and Spatial Information Sciences, 23 August 2019; Copernicus GmbH: Göttingen, Germany, 2019; Volume XLII-3-W8, pp. 491–495. [Google Scholar]
  42. Aydöner, C.; Maktav, D. The Role of the Integration of Remote Sensing and GIS in Land Use/Land Cover Analysis after an Earthquake. Int. J. Remote Sens. 2009, 30, 1697–1717. [Google Scholar] [CrossRef]
  43. Zhang, R.; Tang, X.; You, S.; Duan, K.; Xiang, H.; Luo, H. A Novel Feature-Level Fusion Framework Using Optical and SAR Remote Sensing Images for Land Use/Land Cover (LULC) Classification in Cloudy Mountainous Area. Appl. Sci. 2020, 10, 2928. [Google Scholar] [CrossRef]
  44. Ohki, M.; Shimada, M. Large-Area Land Use and Land Cover Classification with Quad, Compact, and Dual Polarization SAR Data by PALSAR-2. IEEE Trans. Geosci. Remote Sens. 2018, 56, 5550–5557. [Google Scholar] [CrossRef]
  45. Olen, S.; Bookhagen, B. Mapping Damage-Affected Areas after Natural Hazard Events Using Sentinel-1 Coherence Time Series. Remote Sens. 2018, 10, 1272. [Google Scholar] [CrossRef] [Green Version]
  46. Washaya, P.; Balz, T.; Mohamadi, B. Coherence Change-Detection with Sentinel-1 for Natural and Anthropogenic Disaster Monitoring in Urban Areas. Remote Sens. 2018, 10, 1026. [Google Scholar] [CrossRef] [Green Version]
  47. Liu, J.G.; Black, A.; Lee, H.; Hanaizumi, H.; Moore, J.M. Land surface change detection in a desert area in Algeria using multi-temporal ERS SAR coherence images. Int. J. Remote Sens. 2001, 22, 2463–2477. [Google Scholar] [CrossRef]
  48. Jung, J.; Kim, D.; Lavalle, M.; Yun, S.-H. Coherent Change Detection Using InSAR Temporal Decorrelation Model: A Case Study for Volcanic Ash Detection. IEEE Trans. Geosci. Remote Sens. 2016, 54, 5765–5775. [Google Scholar] [CrossRef]
  49. Atwood, D.K.; Meyer, F.; Arendt, A. Using L-band SAR coherence to delineate glacier extent. Can. J. Remote Sens. 2010, 36, S186–S195. [Google Scholar] [CrossRef]
  50. Kim, S.-W.; Wdowinski, S.; Amelung, F.; Dixon, T.H.; Won, J.-S. Interferometric Coherence Analysis of the Everglades Wetlands, South Florida. IEEE Trans. Geosci. Remote Sens. 2013, 51, 5210–5224. [Google Scholar] [CrossRef]
  51. Mohammadimanesh, F.; Salehi, B.; Mahdianpari, M.; Brisco, B.; Motagh, M. Multi-Temporal, Multi-Frequency, and Multi-Polarization Coherence and SAR Backscatter Analysis of Wetlands. ISPRS J. Photogramm. Remote Sens. 2018, 142, 78–93. [Google Scholar] [CrossRef]
  52. Dekker, R.J. Speckle filtering in satellite SAR change detection imagery. Int. J. Remote Sens. 1998, 19, 1133–1146. [Google Scholar] [CrossRef]
  53. Torres, L.; Sant’Anna, S.J.; da Costa Freitas, C.; Frery, A. Speckle reduction in polarimetric SAR imagery with stochastic distances and nonlocal means. Pattern Recognit. 2014, 47, 141–157. [Google Scholar] [CrossRef] [Green Version]
  54. López-Martínez, C.; Fabregas, X. Modeling and Reduction of SAR Interferometric Phase Noise in the Wavelet Domain. Geosci. Remote Sens. IEEE Trans. 2003, 40, 2553–2566. [Google Scholar] [CrossRef] [Green Version]
  55. Feng, H.; Hou, B.; Gong, M. SAR Image Despeckling Based on Local Homogeneous-Region Segmentation by Using Pixel-Relativity Measurement. IEEE Trans. Geosci. Remote Sens. 2011, 49, 2724–2737. [Google Scholar] [CrossRef]
  56. Sipos, D.; Gleich, D. Model-Based Information Extraction from SAR Images Using Deep Learning. IEEE Geosci. Remote Sens. Lett. 2020, 19, 4007005. [Google Scholar] [CrossRef]
  57. Wang, P.; Zhang, H.; Patel, V.M. SAR Image Despeckling Using a Convolutional Neural Network. IEEE Signal Process. Lett. 2017, 24, 1763–1767. [Google Scholar] [CrossRef] [Green Version]
  58. Baran, I.; Stewart, M.P.; Kampes, B.M.; Perski, Z.; Lilly, P. A Modification to the Goldstein Radar Interferogram Filter. IEEE Trans. Geosci. Remote Sens. 2003, 41, 2114–2118. [Google Scholar] [CrossRef] [Green Version]
  59. Geng, J.; Fan, J.; Wang, H.; Ma, X.; Li, B.; Chen, F. High-Resolution SAR Image Classification via Deep Convolutional Autoencoders. IEEE Geosci. Remote Sens. Lett. 2015, 12, 2351–2355. [Google Scholar] [CrossRef]
  60. Lee, J.-S.; Papathanassiou, K.; Ainsworth, T.; Grunes, M.; Reigber, A. A new technique for noise filtering of SAR interferometric phase images. IEEE Trans. Geosci. Remote Sens. 1998, 36, 1456–1465. [Google Scholar] [CrossRef]
  61. Touzi, R. A Review of Speckle Filtering in the Context of Estimation Theory. IEEE Trans. Geosci. Remote Sens. 2002, 40, 2392–2404. [Google Scholar] [CrossRef]
  62. Xie, H.; Pierce, L.E.; Ulaby, F.T. SAR Speckle Reduction Using Wavelet Denoising and Markov Random Field Modeling. IEEE Trans. Geosci. Remote Sens. 2002, 40, 2196–2212. [Google Scholar] [CrossRef] [Green Version]
  63. Lee, J.-S.; Wen, J.-H.; Ainsworth, T.L.; Chen, K.-S.; Chen, A.J. Improved Sigma Filter for Speckle Filtering of SAR Imagery. IEEE Trans. Geosci. Remote Sens. 2009, 47, 202–213. [Google Scholar] [CrossRef]
  64. Deledalle, C.-A.; Denis, L.; Tupin, F. Iterative Weighted Maximum Likelihood Denoising with Probabilistic Patch-Based Weights. IEEE Trans. Image Process. 2009, 18, 2661–2672. [Google Scholar] [CrossRef] [Green Version]
  65. Aiazzi, B.; Alparone, L.; Baronti, S.; Garzelli, A. Coherence estimation from multilook incoherent sar imagery. IEEE Trans. Geosci. Remote Sens. 2003, 41, 2531–2539. [Google Scholar] [CrossRef]
  66. Liu, M.; Zhang, H.; Wang, C.; Wu, F. Change Detection of Multilook Polarimetric SAR Images Using Heterogeneous Clutter Models. IEEE Trans. Geosci. Remote Sens. 2014, 52, 7483–7494. [Google Scholar] [CrossRef]
  67. Lee, J.-S.; Ainsworth, T.L.; Kelly, J.P.; Lopez-Martinez, C. Evaluation and Bias Removal of Multilook Effect on Entropy/Alpha/Anisotropy in Polarimetric SAR Decomposition. IEEE Trans. Geosci. Remote Sens. 2008, 46, 3039–3052. [Google Scholar] [CrossRef]
  68. Touzi, R.; Lopes, A. Statistics of the Stokes Parameters and of the Complex Coherence Parameters in One-Look and Multilook Speckle Fields. IEEE Trans. Geosci. Remote Sens. 1996, 34, 519–531. [Google Scholar] [CrossRef]
  69. Frost, V.S.; Stiles, J.A.; Shanmugan, K.S.; Holtzman, J.C. A Model for Radar Images and Its Application to Adaptive Digital Filtering of Multiplicative Noise. IEEE Trans. Pattern Anal. Mach. Intell. 1982, 4, 157–166. [Google Scholar] [CrossRef] [PubMed]
  70. Lee, J.-S. Speckle Analysis and Smoothing of Synthetic Aperture Radar Images. Comput. Graph. Image Process. 1981, 17, 24–32. [Google Scholar] [CrossRef]
  71. Kuan, D.; Sawchuk, A.; Strand, T.; Chavel, P. Adaptive Restoration of Images with Speckle. IEEE Trans. Acoust. Speech Signal Process. 1987, 35, 373–383. [Google Scholar] [CrossRef]
  72. Baraldi, A.; Parmiggiani, F. A Refined Gamma MAP SAR Speckle Filter with Improved Geometrical Adaptivity. IEEE Trans. Geosci. Remote Sens. 1995, 33, 1245–1257. [Google Scholar] [CrossRef]
  73. Lee, J.-S. Statistical Modelling and Suppression of Speckle in Synthetic Aperture Radar Images. In Proceedings of the IGARSS’87-International Geoscience and Remote Sensing Symposium 1987, Ann Arbor, MI, USA, 18–21 May 1987; Volume 2, pp. 1331–1339. [Google Scholar]
  74. Gao, F.; Dong, J.; Li, B.; Xu, Q. Automatic Change Detection in Synthetic Aperture Radar Images Based on PCANet. IEEE Geosci. Remote Sens. Lett. 2016, 13, 1792–1796. [Google Scholar] [CrossRef]
  75. Zheng, Y.; Zhang, X.; Hou, B.; Liu, G. Using Combined Difference Image and K-Means Clustering for SAR Image Change Detection. IEEE Geosci. Remote Sens. Lett. 2014, 11, 691–695. [Google Scholar] [CrossRef]
  76. Lee, J.S.; Jurkevich, I.; Dewaele, P.; Wambacq, P.; Oosterlinck, A. Speckle filtering of synthetic aperture radar images: A review. Remote Sens. Rev. 1994, 8, 313–340. [Google Scholar] [CrossRef]
  77. Ajadi, O.A.; Meyer, F.J.; Webley, P.W. Change Detection in Synthetic Aperture Radar Images Using a Multiscale-Driven Approach. Remote Sens. 2016, 8, 482. [Google Scholar] [CrossRef] [Green Version]
  78. Smith, D.M. Speckle Reduction and Segmentation of Synthetic Aperture Radar Images. Int. J. Remote Sens. 1996, 17, 2043–2057. [Google Scholar] [CrossRef]
  79. Liu, Z.; Li, G.; Mercier, G.; He, Y.; Pan, Q. Change Detection in Heterogenous Remote Sensing Images via Homogeneous Pixel Transformation. IEEE Trans. Image Process. 2018, 27, 1822–1834. [Google Scholar] [CrossRef] [PubMed]
  80. Shamsoddini, A.; Trinder, J. Image Texture Preservation in Speckle Noise Suppression; IAPRS: Vienna, Austria, 2010. [Google Scholar]
  81. Penna, P.A.A.; Mascarenhas, N.D.A. (Non-) Homomorphic Approaches to Denoise Intensity SAR Images with Non-Local Means and Stochastic Distances. Comput. Geosci. 2018, 111, 127–138. [Google Scholar] [CrossRef]
  82. Jia, M.; Wang, L. Novel Class-Relativity Non-Local Means with Principal Component Analysis for Multitemporal SAR Image Change Detection. Int. J. Remote Sens. 2018, 39, 1068–1091. [Google Scholar] [CrossRef]
  83. Buades, A.; Coll, B.; Morel, J.-M. A Non-Local Algorithm for Image Denoising. In Proceedings of the 2005 IEEE Computer Society Conference on Computer Vision and Pattern Recognition (CVPR’05), San Diego, CA, USA, 20–25 June 2005; Volume 2, pp. 60–65. [Google Scholar]
  84. Deledalle, C.-A.; Tupin, F.; Denis, L. Polarimetric SAR Estimation Based on Non-Local Means. In Proceedings of the 2010 IEEE International Geoscience and Remote Sensing Symposium, Honolulu, HI, USA, 25–30 July 2010; pp. 2515–2518. [Google Scholar]
  85. Jojy, C.; Nair, M.S.; Subrahmanyam, G.R.K.S.; Riji, R. Discontinuity Adaptive Non-Local Means with Importance Sampling Unscented Kalman Filter for De-Speckling SAR Images. IEEE J. Sel. Top. Appl. Earth Obs. Remote Sens. 2013, 6, 1964–1970. [Google Scholar] [CrossRef]
  86. A Novel Approach of Despeckling SAR Images Using Nonlocal Means Filtering|SpringerLink. Available online: https://link.springer.com/article/10.1007/s12524-016-0607-0 (accessed on 27 September 2022).
  87. Hu, J.; Guo, R.; Zhu, X.; Baier, G.; Wang, Y. Non-Local Means Filter For Polarimetric SAR Speckle Reuction Experiments Using TERRASAR-X Data. In Proceedings of the ISPRS Annals of the Photogrammetry, Remote Sensing and Spatial Information Sciences, 11 March 2015; Copernicus GmbH: Göttingen, Germany, 2015; Volume II-3-W4, pp. 71–77. [Google Scholar]
  88. Zhong, H.; Li, Y.; Jiao, L. SAR Image Despeckling Using Bayesian Nonlocal Means Filter with Sigma Preselection. IEEE Geosci. Remote Sens. Lett. 2011, 8, 809–813. [Google Scholar] [CrossRef]
  89. Parrilli, S.; Poderico, M.; Angelino, C.V.; Verdoliva, L. A Nonlocal SAR Image Denoising Algorithm Based on LLMMSE Wavelet Shrinkage. IEEE Trans. Geosci. Remote Sens. 2012, 50, 606–616. [Google Scholar] [CrossRef]
  90. MuraliMohanBabu, Y.; Subramanyam, M.; GiriPrasad, M. A Modified BM3D Algorithm for SAR Image Despeckling. Procedia Comput. Sci. 2015, 70, 69–75. [Google Scholar] [CrossRef] [Green Version]
  91. Su, X.; Deledalle, C.-A.; Tupin, F.; Sun, H. Two-Step Multitemporal Nonlocal Means for Synthetic Aperture Radar Images. IEEE Trans. Geosci. Remote Sens. 2014, 52, 6181–6196. [Google Scholar] [CrossRef]
  92. Zhao, W.; Deledalle, C.-A.; Denis, L.; Maitre, H.; Nicolas, J.-M.; Tupin, F. Ratio-Based Multitemporal SAR Images Denoising: RABASAR. IEEE Trans. Geosci. Remote Sens. 2019, 57, 3552–3565. [Google Scholar] [CrossRef] [Green Version]
  93. Trouve, E.; Chambenoit, Y.; Classeau, N.; Bolon, P. Statistical and Operational Performance Assessment of Multitemporal SAR Image Filtering. IEEE Trans. Geosci. Remote Sens. 2003, 41, 2519–2530. [Google Scholar] [CrossRef]
  94. Ma, X.; Wu, P. Multitemporal SAR Image Despeckling Based on a Scattering Covariance Matrix of Image Patch. Sensors 2019, 19, 3057. [Google Scholar] [CrossRef] [Green Version]
  95. Ulaby, F.T.; Moore, R.K.; Fung, A.K. Microwave Remote Sensing: Active and Passive/Volume II, Radar Remote Sensing and Surface Scattering and Emission Theory; Remote Sensing; Addison-Wesley: Reading, MA, USA, 1982; ISBN 978-0-201-10760-9. [Google Scholar]
  96. Chen, S.; Hou, J.; Zhang, H.; Da, B. De-Speckling Method Based on Non-Local Means and Coefficient Variation of SAR Image. Electron. Lett. 2014, 50, 1314–1316. [Google Scholar] [CrossRef]
  97. Wu, J.; Liu, F.; Hao, H.; Li, L.; Jiao, L.; Zhang, X. A Nonlocal Means for Speckle Reduction of SAR Image With Multiscale-Fusion-Based Steerable Kernel Function. IEEE Geosci. Remote Sens. Lett. 2016, 13, 1646–1650. [Google Scholar] [CrossRef]
  98. Su, L.; Gong, M.; Sun, B. Change detection in synthetic aperture radar images based on non-local means with ratio similarity measurement. Int. J. Remote Sens. 2014, 35, 7673–7690. [Google Scholar] [CrossRef]
  99. Deledalle, C.-A.; Tupin, F.; Denis, L. A Non-Local Approach for SAR and Interferometric SAR Denoising. In Proceedings of the 2010 IEEE International Geoscience and Remote Sensing Symposium, Honolulu, HI, USA, 25–30 July 2010; IEEE: Honolulu, HI, USA, 2010; pp. 714–717. [Google Scholar]
  100. Lee, J.S.; Hoppel, K. Noise Modeling and Estimation of Remotely-Sensed Images. In Proceedings of the 12th Canadian Symposium on Remote Sensing Geoscience and Remote Sensing Symposium, Vancouver, BC, Canada, 10–14 July 1989; Volume 2, pp. 1005–1008. [Google Scholar]
  101. Tong, D.; Yang, H.; Wu, J.; Yang, J. An Improved Non-Local Means Filter for Sar Image Despeckle Based on Heterogeneity Measurement. In Proceedings of the IGARSS 2018—2018 IEEE International Geoscience and Remote Sensing Symposium, Valencia, Spain, 22–27 July 2018; pp. 2801–2804. [Google Scholar]
  102. Pepe, A. Use of Multi-Temporal SAR Non-Local Mean Filtering Operations for Change Detection Analyses. In Proceedings of the 2022 IEEE 21st Mediterranean Electrotechnical Conference (MELECON), Palermo, Italy, 14–16 June 2022; pp. 616–620. [Google Scholar]
  103. Ma, W.; Xin, Z.; Liao, G.; Sun, Y.; Wang, Z.; Xuan, J. Sub-Region Non-Local Mean Denoising Algorithm of Synthetic Aperture Radar Images Based on Statistical Characteristics. IET Image Process. 2022, 16, 2665–2679. [Google Scholar] [CrossRef]
  104. Vanama, V.S.K.; Musthafa, M.; Khati, U.; Gowtham, R.; Singh, G.; Rao, Y.S. Inundation Mapping of Kerala Flood Event in 2018 Using ALOS-2 and Temporal Sentinel-1 SAR Images. Curr. Sci. 2021, 120, 11. [Google Scholar] [CrossRef]
  105. Vijaykumar, P.; Abhilash, S.; Sreenath, A.V.; Athira, U.N.; Mohanakumar, K.; Mapes, B.E.; Chakrapani, B.; Sahai, A.K.; Niyas, T.N.; Sreejith, O.P. Kerala Floods in Consecutive Years—Its Association with Mesoscale Cloudburst and Structural Changes in Monsoon Clouds over the West Coast of India. Weather Clim. Extrem. 2021, 33, 100339. [Google Scholar] [CrossRef]
  106. Sentinel Application Platform. Available online: https://eo4society.esa.int/resources/snap/ (accessed on 27 September 2022).
  107. Pepe, A.; Yang, Y.; Manzo, M.; Lanari, R. Improved EMCF-SBAS Processing Chain Based on Advanced Techniques for the Noise-Filtering and Selection of Small Baseline Multi-Look DInSAR Interferograms. IEEE Trans. Geosci. Remote Sens. 2015, 53, 4394–4417. [Google Scholar] [CrossRef]
  108. Pepe, A.; Mastro, P.; Jones, C.E. Adaptive Multilooking of Multitemporal Differential SAR Interferometric Data Stack Using Directional Statistics. IEEE Trans. Geosci. Remote Sens. 2021, 59, 6706–6721. [Google Scholar] [CrossRef]
  109. Ansari, H.; De Zan, F.; Bamler, R. Efficient Phase Estimation for Interferogram Stacks. IEEE Trans. Geosci. Remote Sens. 2018, 56, 4109–4125. [Google Scholar] [CrossRef]
  110. Massonnet, D.; Feigl, K.L. Radar Interferometry and Its Application to Changes in the Earth’s Surface. Rev. Geophys. 1998, 36, 441–500. [Google Scholar] [CrossRef] [Green Version]
  111. Rosen, P.A.; Hensley, S.; Joughin, I.R.; Li, F.K.; Madsen, S.N.; Rodriguez, E.; Goldstein, R.M. Synthetic Aperture Radar Interferometry. Proc. IEEE 2000, 88, 333–382. [Google Scholar] [CrossRef]
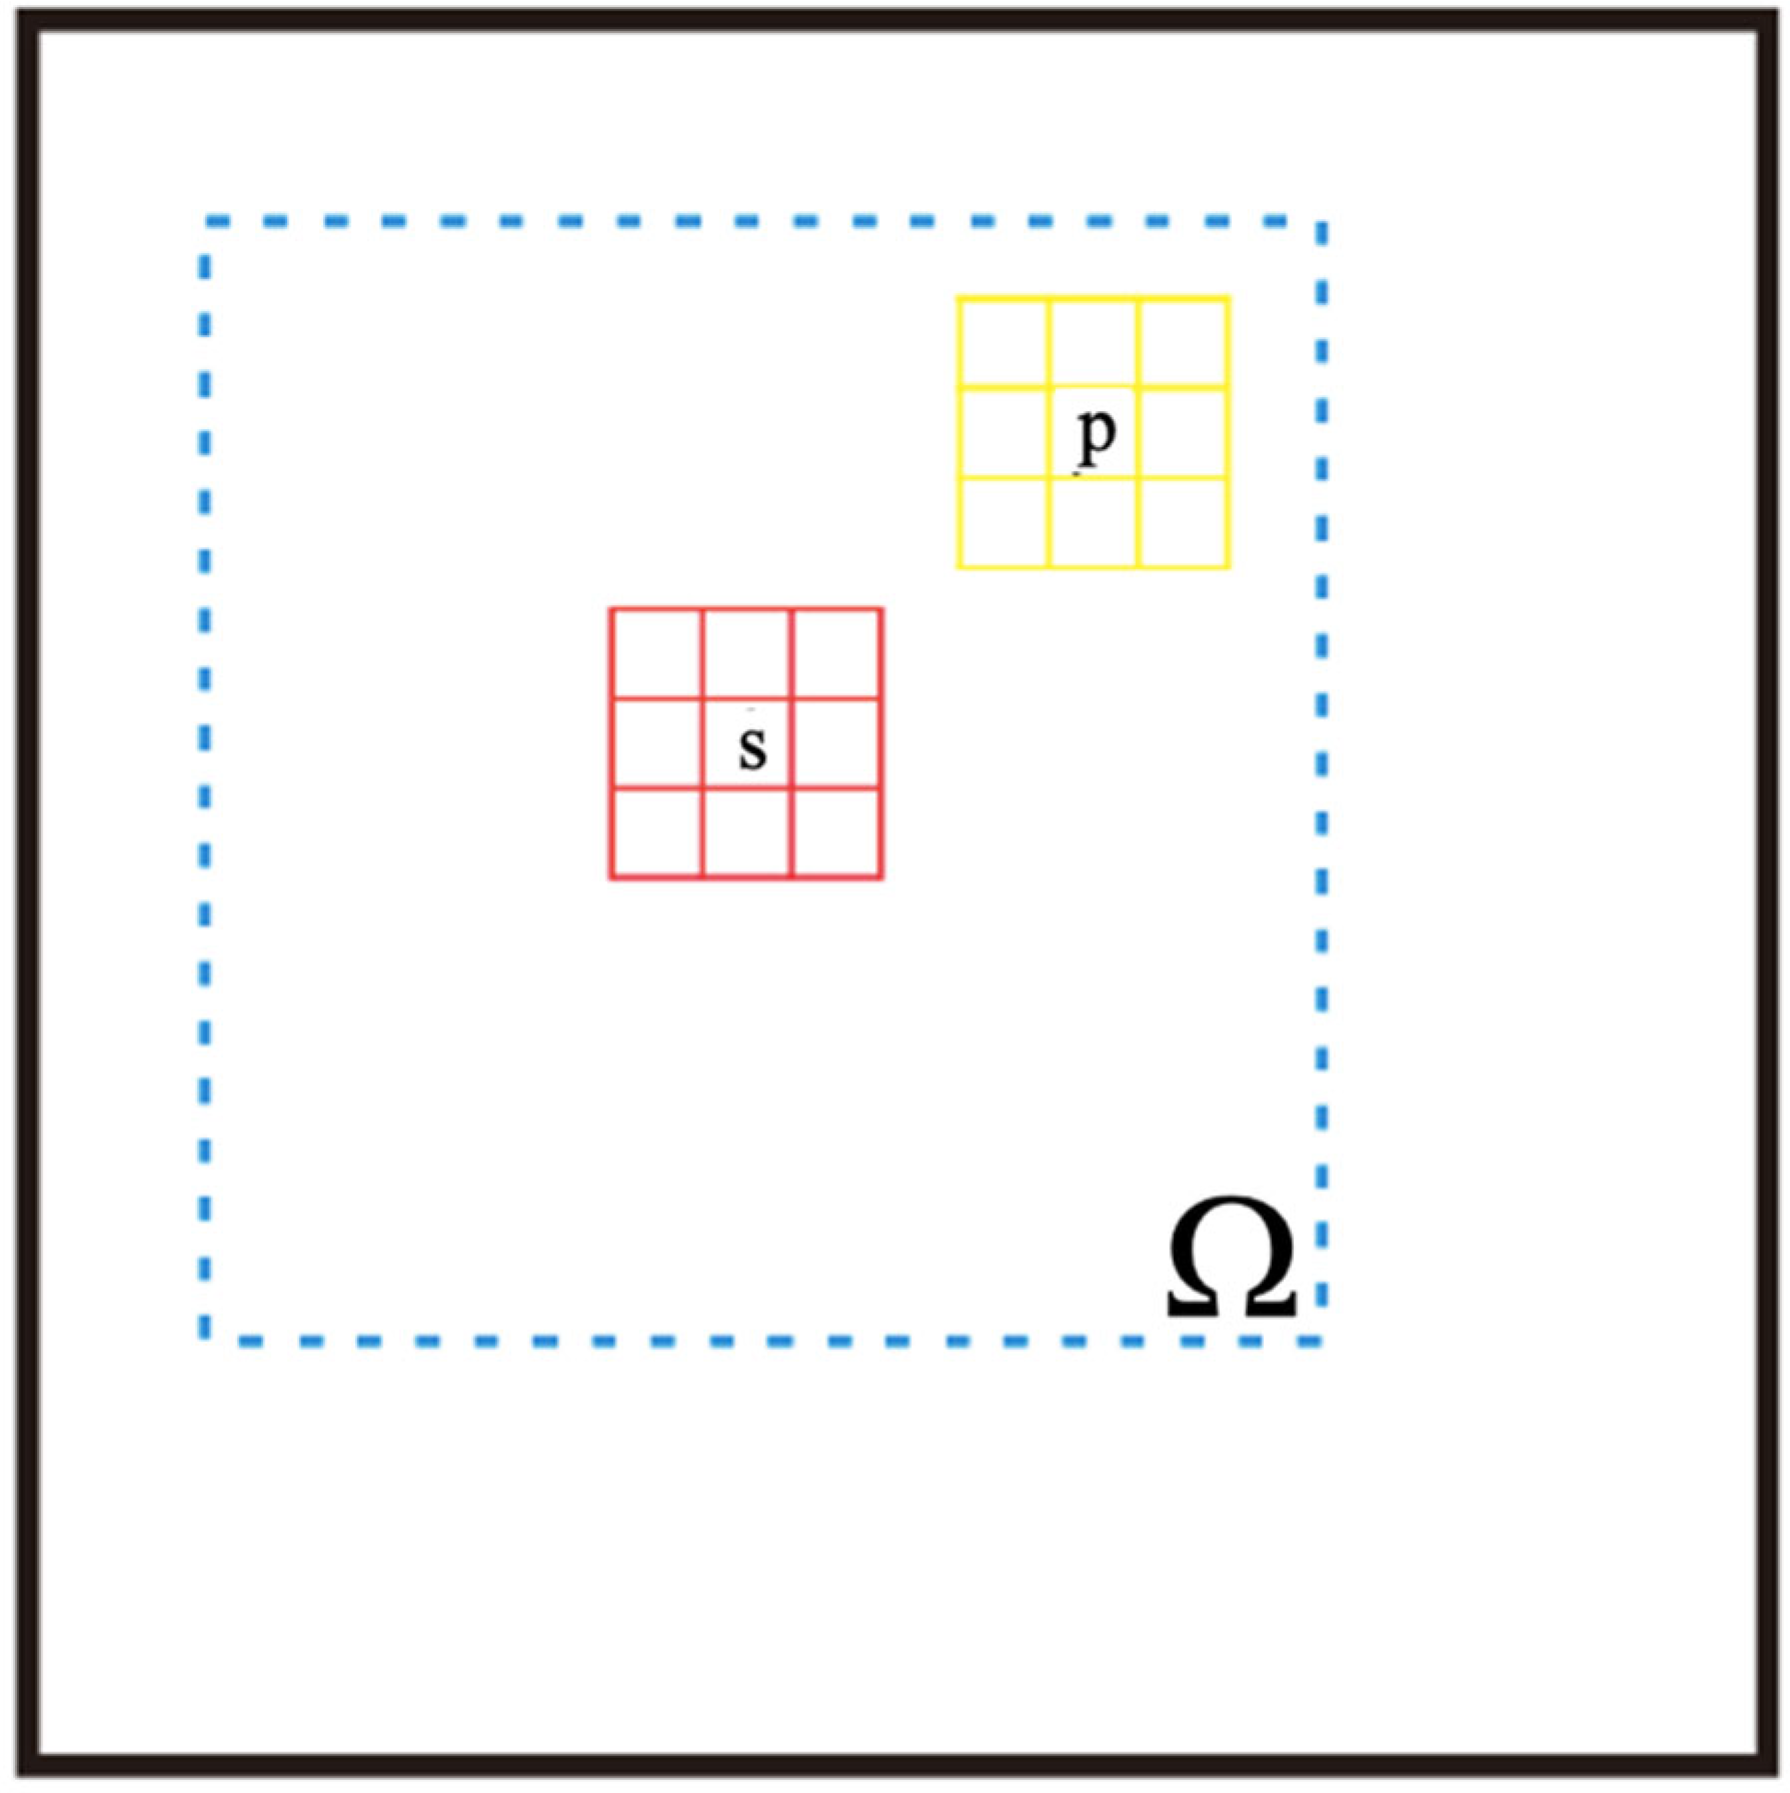
Figure 1. Pictorial representation of the windows used by NLMF.
Remotesensing 14 05933 g001
Figure 2. Pictorial representation of the windows used by the developed 3D NLMF method.
Remotesensing 14 05933 g002
Figure 3. Case study area of the Kerala region, India. The red square box identifies the footprint of the used IW S1-A data collected from the descending orbits (Path 165 and Frame 558).
Remotesensing 14 05933 g003
Figure 4. Maps of the sigma naught values (dB) computed on the unfiltered SAR images acquired before (a) and after (b) the occurrence of inundations in the Kerala region. The map in (c) shows the ratio image (i.e., the difference between (b) and (a)).
Remotesensing 14 05933 g004
Figure 5. Case study area of the Kerala region, India, superimposed on the map of flooded regions.
Remotesensing 14 05933 g005
Figure 6. These are the same graphs as shown in Figure 4 but using the filtered SAR images, computed by independently applying the non-local mean filter as described in Section 2.1 to every SAR image (2D case). (ab) Maps of the sigma naught values (dB) computed before and after the main flood events, and (c) is the ratio image between (a) and (b) in log scale.
Remotesensing 14 05933 g006
Figure 7. These are the same graphs as shown in Figure 4 but using the 3D NLMF filtered SAR images. (a,b) Maps of the sigma naught values (dB) computed before and after the main flood events, and (c) is the ratio image between (a) and (b) in log scale.
Remotesensing 14 05933 g007
Figure 8. The zoomed view of a selected area of the 3D NLMF images. (af) are the results obtained by considering h2 = 100 (a), h2 = 1000 (b), h2 = 10,000 (c), h2 = 100,000 (d), h2 = 1,000,000 (e) and h2 = 10,000,000 (f).
Remotesensing 14 05933 g008
Figure 9. The zoomed view of a selected area of the 3D NLMF images. (a,b) are the results obtained by considering h2 = 100 (a), h2 = 10,000,000 (b) using patches size of 10 × 10. (c,d) are same as (a,b) but with patch sizes of the 30 × 30 SAR pixels.
Remotesensing 14 05933 g009
Figure 10. A plot of the ENL (a), EPI (b), and PSLR (c) vs. the standard deviation of the used Gaussian filter. The 3D results are represented with red triangles and 2D with black triangles. The results refer to an averaging patch size of 20 × 20 pixels.
Remotesensing 14 05933 g010
Table 1. List of S-1 acquisitions (VV polarization, descending orbits, and Path 165) used for the experiments carried out over the Kerala (India) area.
YearMonthDay
20180306
20180318
20180330
20180411
20180423
20180505
20180517
20180529
20180610
20180622
20180704
20180716
20180728
20180809
20180821
20180902
20180914
20180926
20181008
Publisher’s Note: MDPI stays neutral with regard to jurisdictional claims in published maps and institutional affiliations.