Article

Comparing Different Light Use Efficiency Models to Estimate the Gross Primary Productivity of a Cork Oak Plantation in Northern China

1
Key Laboratory of Tree Breeding and Cultivation, National Forestry and Grassland Administration, Research Institute of Forestry, Chinese Academy of Forestry, Beijing 100091, China
2
Collaborative Innovation Center of Sustainable Forestry in Southern China, Nanjing Forestry University, Nanjing 210037, China
3
Henan Xiaolangdi Earth Critical Zone National Research Station on the Middle Yellow River, Jiyuan 454650, China
4
Yantai Coastal Zone Geological Survey Center, China Geological Survey, Yantai 264000, China
5
College of Forestry, Henan Agricultural University, Zhengzhou 450002, China
*
Author to whom correspondence should be addressed.
Remote Sens. 2022, 14(22), 5905; https://doi.org/10.3390/rs14225905
Submission received: 19 October 2022 / Revised: 7 November 2022 / Accepted: 19 November 2022 / Published: 21 November 2022

Abstract

:
Light use efficiency (LUE) models have been widely used to estimate terrestrial gross primary production (GPP). However, the estimation of GPP still has large uncertainties owing to an insufficient understanding of the complex relationship between water availability and photosynthesis. The plant water stress index (PWSI), which is based on canopy temperature, is very sensitive to the plant stomatal opening and has been regarded as a good indicator for monitoring plant water status at the regional scale. In this study, we selected a cork oak plantation in northern China with an obvious seasonal drought as the research object. Using the ground-observed data, we evaluated the applicability of the LUE models with typical water stress scalars (MOD17, MODTEM, EC-LUE, ECM-LUE, SM-LUE, GLO-PEM, and Wang) in a GPP simulation of the cork oak plantation and explored whether the model’s accuracy can be improved by applying PWSI to modify the above models. The results showed that among the seven LUE models, the water stress scalar had a greater impact on the model’s performance than the temperature stress scalar. On sunny days, the daily GPP simulated by the seven LUE models was poorly matched with the measured GPP, and all models explained only 23–52% of the GPP variation in the cork oak plantation. The modified LUE models can significantly improve the prediction accuracy of the GPP and explain 49–65% of the variation in the daily GPP. On cloudy days, the performance of the modified LUE models did not improve, and the evaporative fraction was more suitable for defining the water stress scalar in the LUE models. The ECM-LUE and the modified GLO-PEM based on PWSI had optimal model structures for simulating the GPP of the cork oak plantation under cloudy and sunny days, respectively. This study provides a reference for the accurate prediction of GPP in terrestrial ecosystems in the future.

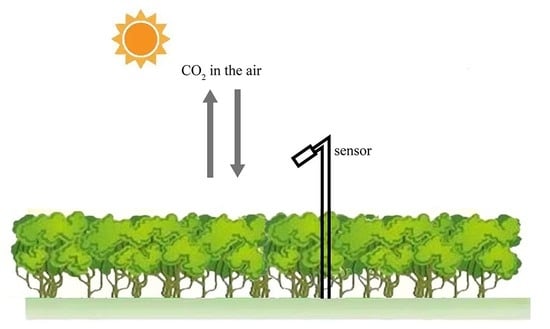
Graphical Abstract

1. Introduction

Forests comprise the main part of terrestrial ecosystems and play an important role in the terrestrial carbon cycle and in global climate change [1]. Gross primary production (GPP) is defined as the total amount of carbon dioxide (CO2) absorbed by plants through photosynthesis [2]. Accurate estimation of forest GPP is of great significance for evaluating the health status of ecosystems, understanding the carbon cycle mechanisms of terrestrial ecosystems, and revealing the response of terrestrial ecosystems to climate change [3,4].
The light use efficiency (LUE) model have been widely used to estimate GPP from local to global scales because of its theoretical soundness and practical convenience [5,6,7]. LUE models estimate GPP by multiplying the energy absorbed by plants by the actual LUE, which converts energy to the amount of carbon fixed during photosynthesis [8]. Currently, researchers have developed more than 20 LUE models [7]. Although these models have been developed based on the LUE logic, they have different model structures; that is, different quantification methods have been used for the fraction of incident photosynthetically active radiation absorbed by vegetation canopies (FPAR), water stress scalars (Ws), and temperature stress scalars (Ts), and different methods have been used to integrate multiple environmental stress scalars [9,10].
The usage of different quantification methods of the water stress scalar is the main reason for the performance divergence in LUE models [9,11]. Currently, the water stress indicators commonly used to define the water stress scalar in the LUE model include (classification based on the three interfaces along the soil–plant–atmosphere continuum): (1) atmospheric drought indicators (e.g., vapor pressure deficit (VPD)), (2) soil moisture indicators (e.g., soil water content (SWC)), and (3) plant moisture indicators (e.g., evaporative fraction (EF)) [7,12]. However, it has been reported that on a monthly scale, the above representative water stress indicators can only explain 20%, 6%, and 36% of the LUE variation when combining eight biomes [11]. Moreover, many studies have found that the performance of LUE models can be significantly degraded by a drought event in different ecosystem types due to the fact that the existing water stress indicators do not accurately indicate the complex relationship between water availability and actual LUE [9,13,14,15]. These studies suggest that a reliable water limitation equation should be developed to improve the accuracy of the LUE models. The plant water stress index (PWSI), based on canopy temperature, has long been regarded as a sensitive indicator for characterizing plant water status on a regional scale [16,17,18,19]. The principle of PWSI is that canopy temperature increases with stomatal closure and the transpiration rate decreases in response to water deficit in plants. PWSI can accurately detect the water status of crops, grasslands, and forests [20,21,22]. Meanwhile, PWSI is closely related to CO2 flux in wheat and maize [23]; Tong et al. [24] also found that PWSI can explain 88% of the variation in net ecosystem productivity in warm-temperate mixed plantations on sunny days. With the development of thermal infrared remote sensing technology, PWSI has been successfully applied to analyze the temporal and spatial distribution of plant water status on a scale from ecosystems (unmanned aerial vehicle platforms) to regions (satellite platforms) [25,26,27]. However, no study has evaluated the performance of GPP simulation using the LUE model, in which the water stress scalar is defined by the PWSI.
Weather conditions have a significant impact on the performance of the LUE model. Yuan et al. [9] pointed out that the LUE model underestimated GPP on cloudy days, because the effect of diffuse radiation on LUE was not considered. Many studies have also found that an increase in the proportion of diffuse radiation on cloudy days enhances photosynthesis in plants, resulting in differences in the maximum light use efficiency (LUEmax) under different weather conditions [28,29]. In addition, under cloudy conditions, the application of some stress indicators based on remote sensing (such as the Land Surface Water Index (LSWI)) is limited owing to cloud contamination [30,31], which will change the structure of the optimal LUE model. However, few studies have considered weather factors when simulating GPP using the LUE model.
Cork oak (Quercus variabilis) is the main tree species for afforestation and the main constructive tree species for degraded habitats in northern China. This tree not only maintains a stable ecosystem structure but also performs remarkable water and soil conservation functions, and the proportion of cork oak in China’s water and soil conservation projects can reach 80% [32]. Because of wide spread in China, the cork oak plantation also plays an important role in carbon sinks [29]. However, most of them are located in lithoid mountain regions with thin and barren soils. Seasonal drought is the most important factor affecting forest growth in this region; especially in spring and early autumn, plantations often suffer from moderate or severe water stress [24], which increases the uncertainty in estimating GPP based on the LUE models. Under the change in global warming, it is expected that rainfall in northern China will decrease, and the frequency, duration, and extent of drought will increase. Therefore, it is necessary to determine an optimal structure of the LUE model for cork oak plantations to accurately estimate changes in GPP. The specific research objectives were (1) to assess the importance of water and temperature stress scalars in LUE models in the cork oak plantation; (2) to evaluate the performance of seven LUE models with typical water stress scalars in simulating the GPP of cork oak plantations under different weather conditions; and (3) to evaluate the performance of seven LUE models modified by PWSI under different weather conditions.

2. Materials and Methods

2.1. Study Area

This study was conducted at Henan Xiaolangdi Earth Critical Zone National Research Station (35°01′N, 112°28′E, elevation: 410 m) (Figure 1). The station is located in a lithoid hilly area of North China, adjacent to the south of Taihang Mountain, and has a warm-temperate continental monsoon climate. The annual mean temperature is 13.40 °C, and the annual rainfall is 641.70 mm (the statistical data is from 1990 to 2020). The amount of rainfall in the summer accounts for 68% of that in the entire year. In this region, drought events frequently occur in late spring and early autumn [24]. The parent soil material is composed of limestone. The soil is mainly brown loam, and the deepest soil layer is approximately 40 cm deep.
The main tree species in the plantation area (7210 ha) were cork oak (Quercus variabilis), arborvitae (Platycladus orientalis), and locust (Robinia pseudoacacia), with cork oaks accounting for more than 80% of the forest area. The plantation forest was 48 years old, and the average canopy height was 10 m. The growing season for the plantation is April–October, and the canopy of the plantation remains closed in May–September (canopy closure period) each year. To prevent the thermal infrared camera from measuring tree trunk temperature rather than the desired canopy temperature, the required observations in this study were completed in June–September 2020, May–September 2021, and May–June 2022.

2.2. Measurements

An open-path eddy covariance system (EC) was installed on a flux tower platform at a height of 36 m to measure the latent heat flux (LE), sensible heat flux (H), and net ecosystem exchange (NEE) of the cork oak plantation. The entire system consisted of a three-dimensional sonic anemometer (CSAT3, Campbell Scientific Inc., Logan, UT, USA) and an open-path infrared CO2/H2O analyzer (LI-7500, Li-Cor Inc., Lincoln, NE, USA). Raw data were collected at 10 Hz and recorded using a data logger (CR1000, Campbell Scientific Inc., Logan, UT, USA).
A calibrated thermal infrared camera (FLIR A310F, FLIR Inc., Wilsonville, OR, USA) was used to automatically collect thermal infrared images of the cork oak plantation. The camera was equipped with an FLIR IR 18 mm lens (field of view: 25.00° × 18.80°) for image capture. The pixel resolution of the camera was 320 × 240 pixels, and each pixel corresponded to an effective temperature reading. An uncooled microbolometer was used in the camera to detect longwave radiation in the range of 7.50–13.00 µm. The accuracy was reported as ±4 °C or ±4% of the reading. To prevent the canopy-reflected sunlight from entering the thermal infrared camera, the camera was installed on the tower platform 15 m above the canopy and faced southeast with a sensor zenith angle of 45°. The thermal infrared images of the cork oak plantation were automatically collected every half hour. Detailed information on canopy temperature extraction from thermal infrared imagery and the measurement accuracy of canopy temperature in this plantation can be found in Liu et al. [33].
The meteorological gradient observation system included a seven-layer air temperature (Ta), relative humidity (RH) sensor (HMP155, Vaisala Inc., Vantaa, Finland), and anemometer (WindSonic, Gill Inc., Lymington, UK), which were installed at heights of 5, 8, 11, 14, 18, 26, and 32 m, respectively (in order to reduce the impact of the vertical temperature gradient on canopy-air temperature differences, the average air temperature measured at 8 m and 11 m was selected for this study). A net radiometer (CNR1, Kipp & Zonen B.V., Delft, Netherlands) was installed at a height of 17 m. Soil moisture probes (EC-5, METER Group Inc., Pullman, WA, USA) were installed at soil depths of 5, 10, and 20 cm (soil depth was only 20 cm in most areas of the plantation). The soil heat flux plates were placed 5 cm below the surface at four points around the flux tower (HFT-3, Campbell Scientific Inc., Logan, UT, USA). These instruments were connected to a datalogger (CR1000, Campbell Scientific Inc., Logan, UT, USA), and the mean data were stored at 10 min intervals. Photosynthetically active radiation (PAR) connected to a separate data logger (CR1000, Campbell Scientific Inc., Logan, UT, USA) was collected at 10 min intervals using a PAR sensor (LI190SB, Li-Cor Inc., Lincoln, NE, USA) at a standard meteorological station, 750 m from the tower. In addition, four linear light quantum sensors (RR-9753, RainRoot Inc., Beijing, China) were used to measure the reflected PAR (PARre) and transmitted PAR (PARtr) of the canopy, and the mean data were stored at 10 min intervals in the data logger (RR1016, RainRoot Inc., Beijing, China).
In order to calibrate the soil moisture probe, the ring knife sampling and drying method was used to measure the soil moisture at depths of 5, 10, and 20 cm in sixteen plots around the flux tower. The observation interval was 10 days, and an additional observation was added after the rain [34].
A plant canopy analyzer (LAI-2200C, Li-Cor Inc., Lincoln, NE, USA) was used to measure the leaf area index (LAI) once a month (measurements were conducted in the middle of each month). The normalized difference vegetation index (NDVI) was measured using a high-resolution spectrometer (QE65Pro, Ocean Optics Inc., Dunedin, FL, USA), which was installed on the tower platform at a height of 10 m above the canopy. The spectrometer had a spectral range of 650–805 nm.

2.3. Data Processing

2.3.1. Fluxes Data

The NEE, H, and LE data with 30 min time intervals were calculated from the raw data using Eddypro (7.0.7, Li-Cor Inc., Lincoln, NE, USA) software. The calculated fluxes data were quality controlled by deleting the data with a quality flag of “2”. Abnormal flux data resulting from instrument malfunction, unfavorable meteorological conditions, and values of more than three times the variance with the average were deleted. Moreover, NEE data were deleted when friction velocity was lower than the threshold (0.22 m s−1), which was calculated using the REddyProc R package based on the moving point test method (https://cran.rstudio.com/web/packages/REddyProc/index.html (accessed on 9 March 2022)). Both gap filling and NEE partitioning were conducted using the REddyProc R package, and GPP was calculated through NEE partitioning.

2.3.2. Clearness Index

The clearness index (CI) was defined as the ratio of the radiation received on the ground (Sr) to the extraterrestrial solar radiation at a plane parallel to the Earth’s surface (Se) [35]:
C I = S r S e
S e = S s c × 1 + 0.033 × cos 360 t d / 365 × sin ε
sin ε = sin φ × sin δ + cos φ × cos δ × cos ω
where Ssc is the solar constant (1370 W m−2), ε is the solar elevation angle, and td is the day of the year; φ is the local latitude, δ is the declination of the sun, and ω is the hour angle. When the daily mean CI was greater than 0.50, the day was defined as sunny; otherwise, the day was defined as cloudy [36].

2.3.3. PWSI

The PWSI was calculated as follows [17]:
P W S I = d T d T l l d T u l d T l l
where dT is the measured temperature difference between the canopy and the air (°C), dTll is the lower boundary representing non-water-stressed conditions (°C), and dTul is the upper boundary representing non-transpiring conditions (°C). Theoretically, the numerical value of the PWSI varies from zero to one, representing the water status from well-watered to non-transpiring conditions.
dTll and dTul were calculated as follows [17]:
d T l l = r a ( R n G ) ρ c p × γ 1 + r c p r a + γ 1 + r c p r a V P D + γ 1 + r c p r a
d T u l = r a R n ρ c p
where Rn is the net radiation (W m−2), G is the soil heat flux (W m−2), ra is the aerodynamic resistance (s m−1), ρ is the air density (kg m−3), cp is the heat capacity of air (1013 J kg−1 °C−1), Δ is the slope of the saturation vapor pressure–temperature relation (kPa °C−1), γ is the psychrometric constant (kPa °C−1), VPD is the vapor pressure deficit (kPa), and rcp is the canopy resistance at potential evapotranspiration (s m−1).
The rcp and ra were calculated as follows [24,37]:
r c p = r m i n L A I e
r a = 4.72 × l n z d z 0 2 / 1 + 0.54 u
L A I e = L A I L A I 2 2 + L A I 2 3 ( L A I > 2 )
where rmin is the minimum leaf stomatal resistance (90 s m−1), LAIe is the effective LAI, z is the reference height (m), d is the zero-plane displacement height (m) (d = 0.66 h), h is the tree height (m), z0 is the roughness length (m) (z0 = 0.075 h), and u is the wind speed (m s−1).

2.3.4. LUEmax

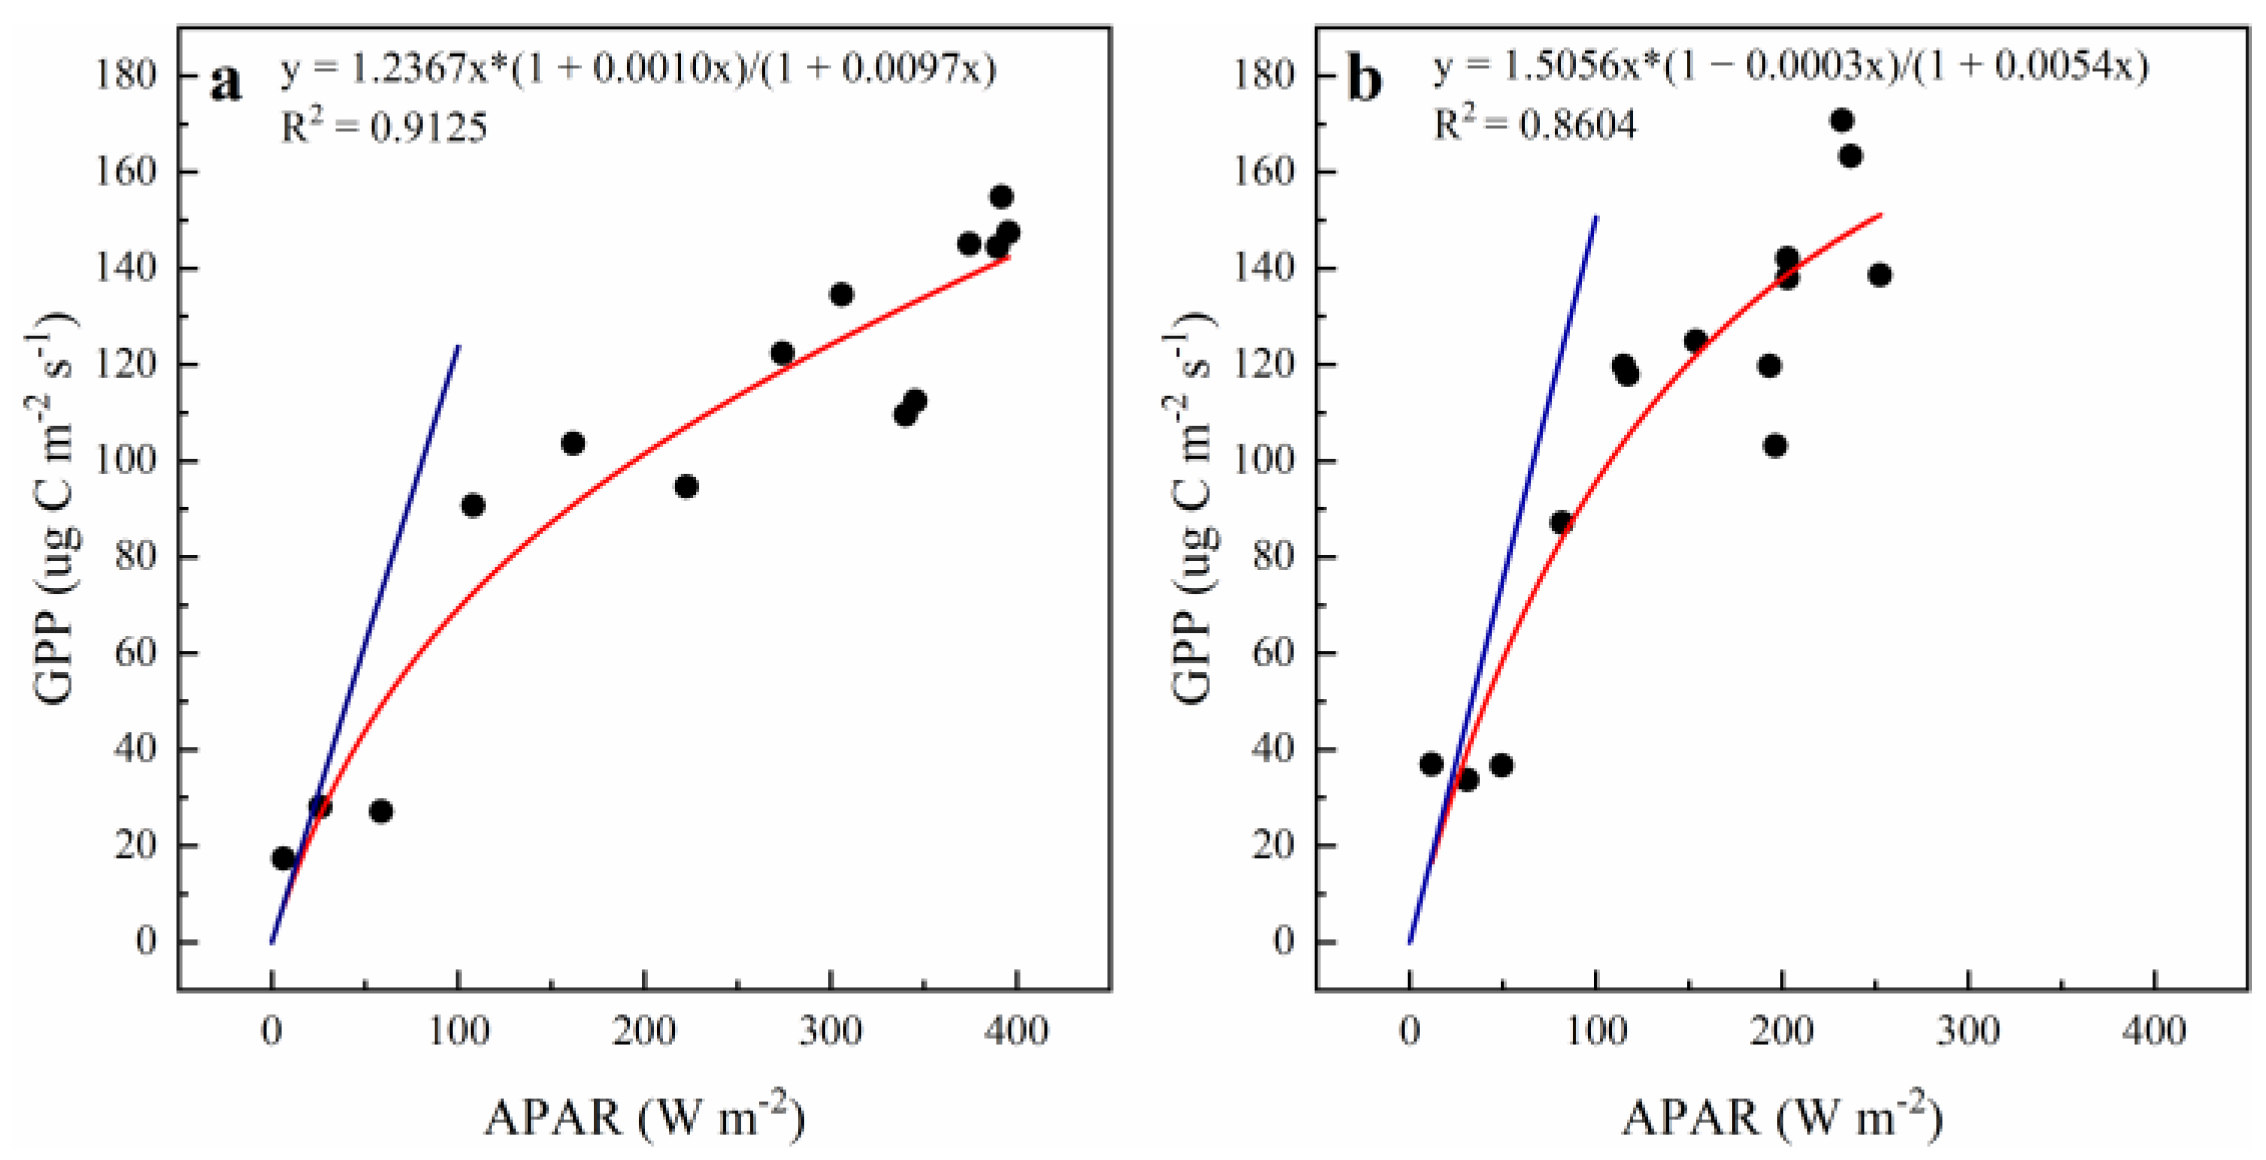
In the photosynthetic light-response curve, the initial quantum efficiency is the initial slope of the plant light-response curve, which is also the maximum light use efficiency of the plant. Therefore, in this study, the Ye model was used to simulate the photosynthesis light-response curve of the cork oak plantation to determine LUEmax [38]:
G P P = α × 1 β × A P A R 1 + r × A P A R × A P A R
A P A R = P A R P A R r e P A R t r
where GPP is the gross primary production (ug C m−2 s−1), α is the initial quantum efficiency, β and r are the coefficients of correction, APAR is the photosynthetically active radiation absorbed by the canopy (W m−2), PAR is the incident photosynthetically active radiation (W m−2), PARre is the photosynthetically active radiation reflected by the canopy (W m−2), and PARtr is the transmitted photosynthetically active radiation (W m−2).

2.3.5. LUE Models

The calculation of LUE models is based on the classical LUE logic [8]:
G P P = P A R × F P A R × L U E m a x × W s × T s
where FPAR is the fraction of incident photosynthetically active radiation absorbed by the canopy, LUEmax is the potential LUE without environmental stress (g C MJ−1), and Ws and Ts are the water stress scalar and the temperature stress scalar, respectively.
To compare the performance of different water stress indicators in defining the water availability on photosynthesis limitation, we selected 4 models with typical water stress scalars, including: a Moderate Resolution Imaging Spectroradiometer GPP product (MOD17) (using VPD-based atmospheric drought indicator), an Eddy Covariance-Light Use Efficiency model (EC-LUE) (using EF-based plant moisture indicator), a Global Production Efficiency model (GLO-PEM) (using specific humidity deficit (SHD)-based atmospheric drought indicator multiplied by the soil moisture indicator), and the Wang model (using the atmospheric drought, soil moisture, and plant moisture indicators). Then, the SM-LUE model was developed to test the performance of the SWC-based soil moisture indicator. In addition, since MOD17 only considers the limitation of cold temperature on plant photosynthesis and ignores the effect of high temperature on plant photosynthesis [10,38], we used the temperature stress scalar in the EC-LUE model to replace the temperature stress scalar in the MOD17 model and established the MODTEM model to better compare the performance of water availability on photosynthesis limitation defined by VPD-based atmospheric drought indicator. Finally, this study used the multiplication method to integrate the environmental stress scalars in the EC-LUE model and established the ECM-LUE model to better compare the performance of water availability on photosynthesis limitation defined by the EF-based plant moisture indicator. The specific calculation methods of each model are shown in Table 1.

2.4. Parameter Determination

In this study, the data from days without stress (SWC > 19% [41]; 20 °C < Ta < 30 °C [42]) during the canopy closure period were used to establish the photosynthesis light-response curves of cork oak plantations under cloudy and sunny conditions, respectively, and the LUEmax of the cork oak plantation on cloudy and sunny days was determined as 1.5056 and 1.2367 g C MJ−1, respectively (Figure 2). Through the measured data, we determined that the extinction coefficient of the cork oak plantation was 0.5052, and the slope and intercept of the FPAR and NDVI fitting curve were 1.2018 and −0.2583, respectively (Figure 3). SWCmax is the soil water content at field capacity, SWCmin is the soil water content at the wilting point, and the values were 0.32 and 0.08 m3 m−3 in the cork oak plantation [24]. Tmin, Tmax, and Topt are the minimum, maximum, and optimum air temperatures for photosynthetic activity, respectively (°C). Tmin was set to 0 [6,10]. Topt was set as the long-term mean temperature for the growing season over the past decade, based on the concept that plants grow efficiently at the prevailing temperature [43,44], and the value was 24.30 °C. Tmax was calculated as Topt + (Topt − Tmin) [10]. VPDmax is the daylight average VPD when the actual LUE equals 0 (kPa), and VPDmin is the daylight average VPD when the actual LUE equals LUEmax (kPa). VPDmax and VPDmin were determined through the optimization of the model parameters using the nonlinear regression procedure in the R programming language (data from June−September 2020 and May−June 2021), and the values were 3.50 and 0.52 kPa, respectively. In addition, we set the temperature stress scalar in MOD17 model as 1, because this model only considers the limitation of cold temperatures on plant photosynthesis [10,45], and there is no cold temperature stress during the canopy closure period (May−September).

2.5. Model Performance Assessment

The coefficient of determination (R2), root mean square error (RMSE), and index of agreement (IA) were used to assess the performance of the different LUE models. The model performance is optimum for an RMSE close to 0 and for an R2 and IA close to 1.
R 2 = i = 1 n o i o ¯ p i p ¯ i = 1 n o i o ¯ 2 i = 1 n p i p ¯ 2 2
R M S E = 1 n i = 1 n o i p i 2
I A = 1 i = 1 n P i O i 2 i = 1 n P i O ¯ + O i O ¯ 2
where pi and oi represent a pair of estimated and measured values, and p ¯ and o ¯ denote the mean estimated and measured values, respectively.

3. Results

3.1. The Dynamic of GPP and Biophysical Factors during the Period of Canopy Closure

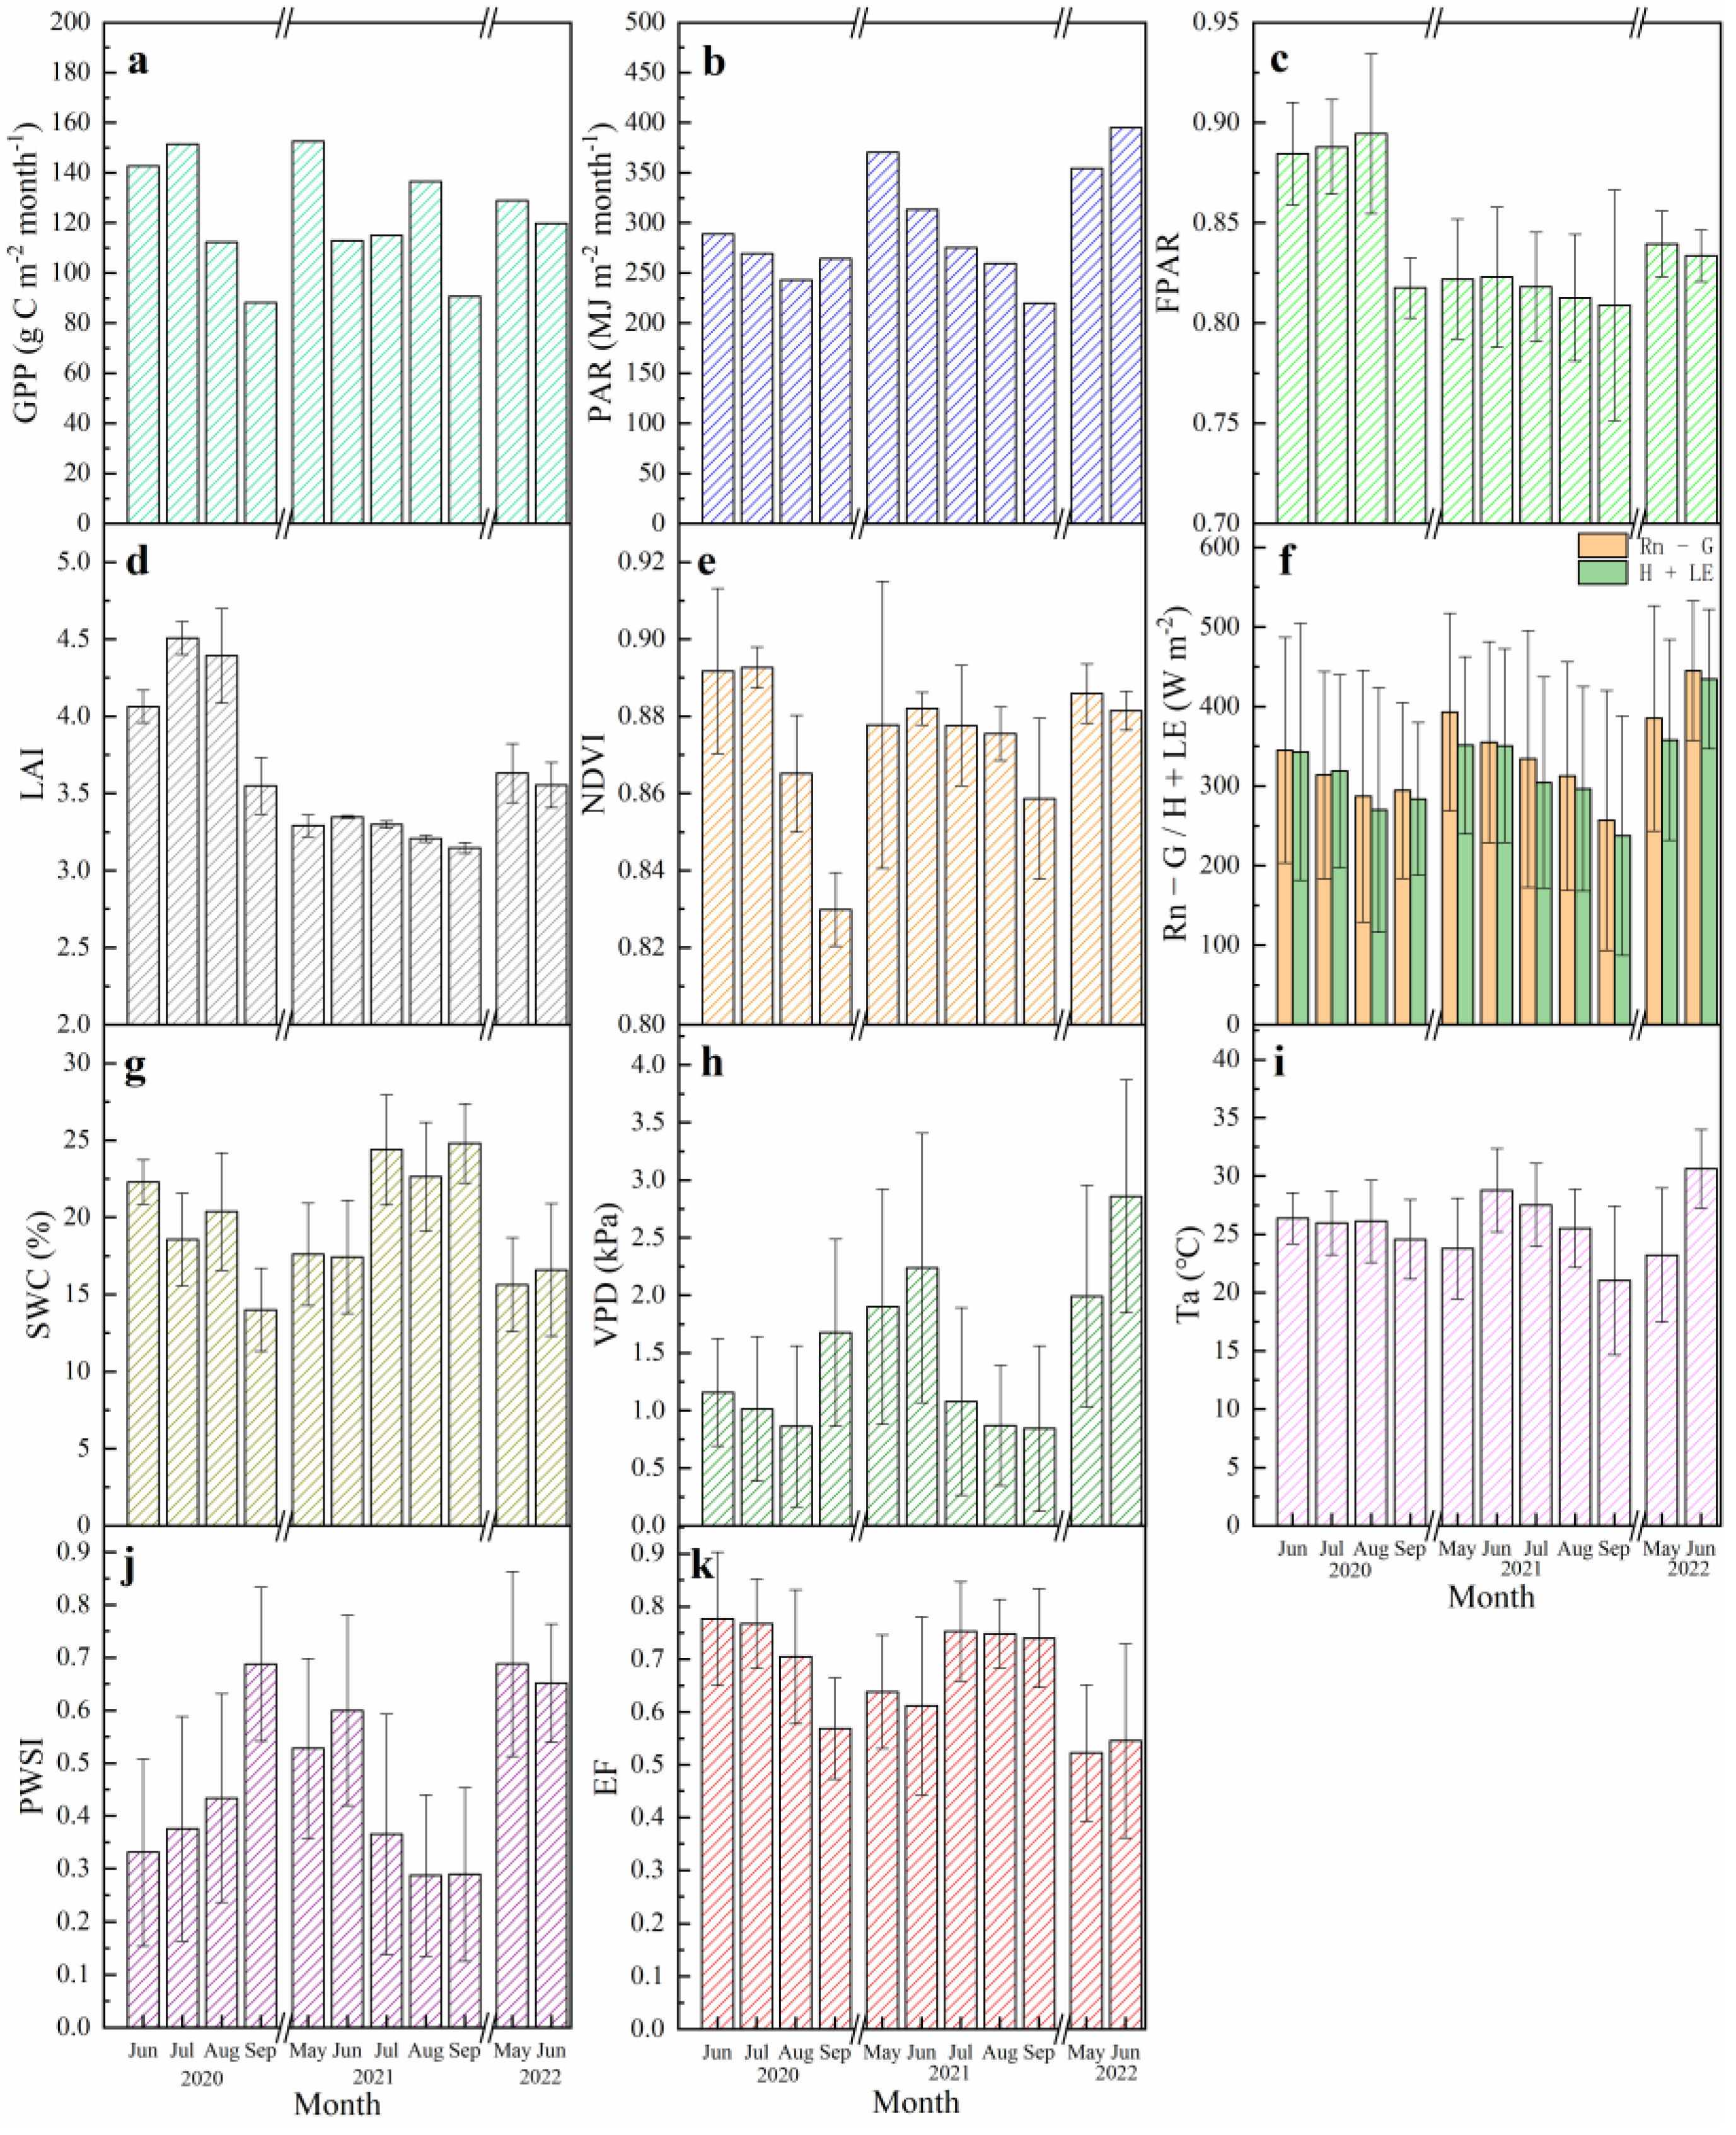
Because of the small size and small number of leaves in the leaf-expansion stage, the thermal infrared camera mainly measured the temperature of the trunk rather than the canopy. We conducted our study during the period of canopy closure. The seasonal patterns of biophysical factors and the monthly GPP are shown in Figure 4. During the two canopy closure periods, the GPP of the cork oak plantation varied between 88.17–152.60 g C m−2 month−1 and peaked in May due to its high PAR. The PWSI and VPD were higher, and the SWC and EF were lower in May and June 2021 and 2022, meaning that the plantation suffered severe water stress in spring, which can also be seen from the FPAR, LAI, and NDVI dynamic. Spring drought can lead to a decrease in photosynthesis, limiting canopy development and thereby also limiting LAI, FPAR, NDVI, and GPP in 2021 and 2022. The same phenomenon also occurred in September 2020 (autumn drought), which resulted in a higher PAR and lower GPP in September 2020 than in September 2021. The variations in monthly turbulent heat flux (H + LE) and available energy (Rn − G) were consistent with PAR. The monthly Ta was varied from 21.04 °C to 30.62 °C.

3.2. Analysis of Model Structure

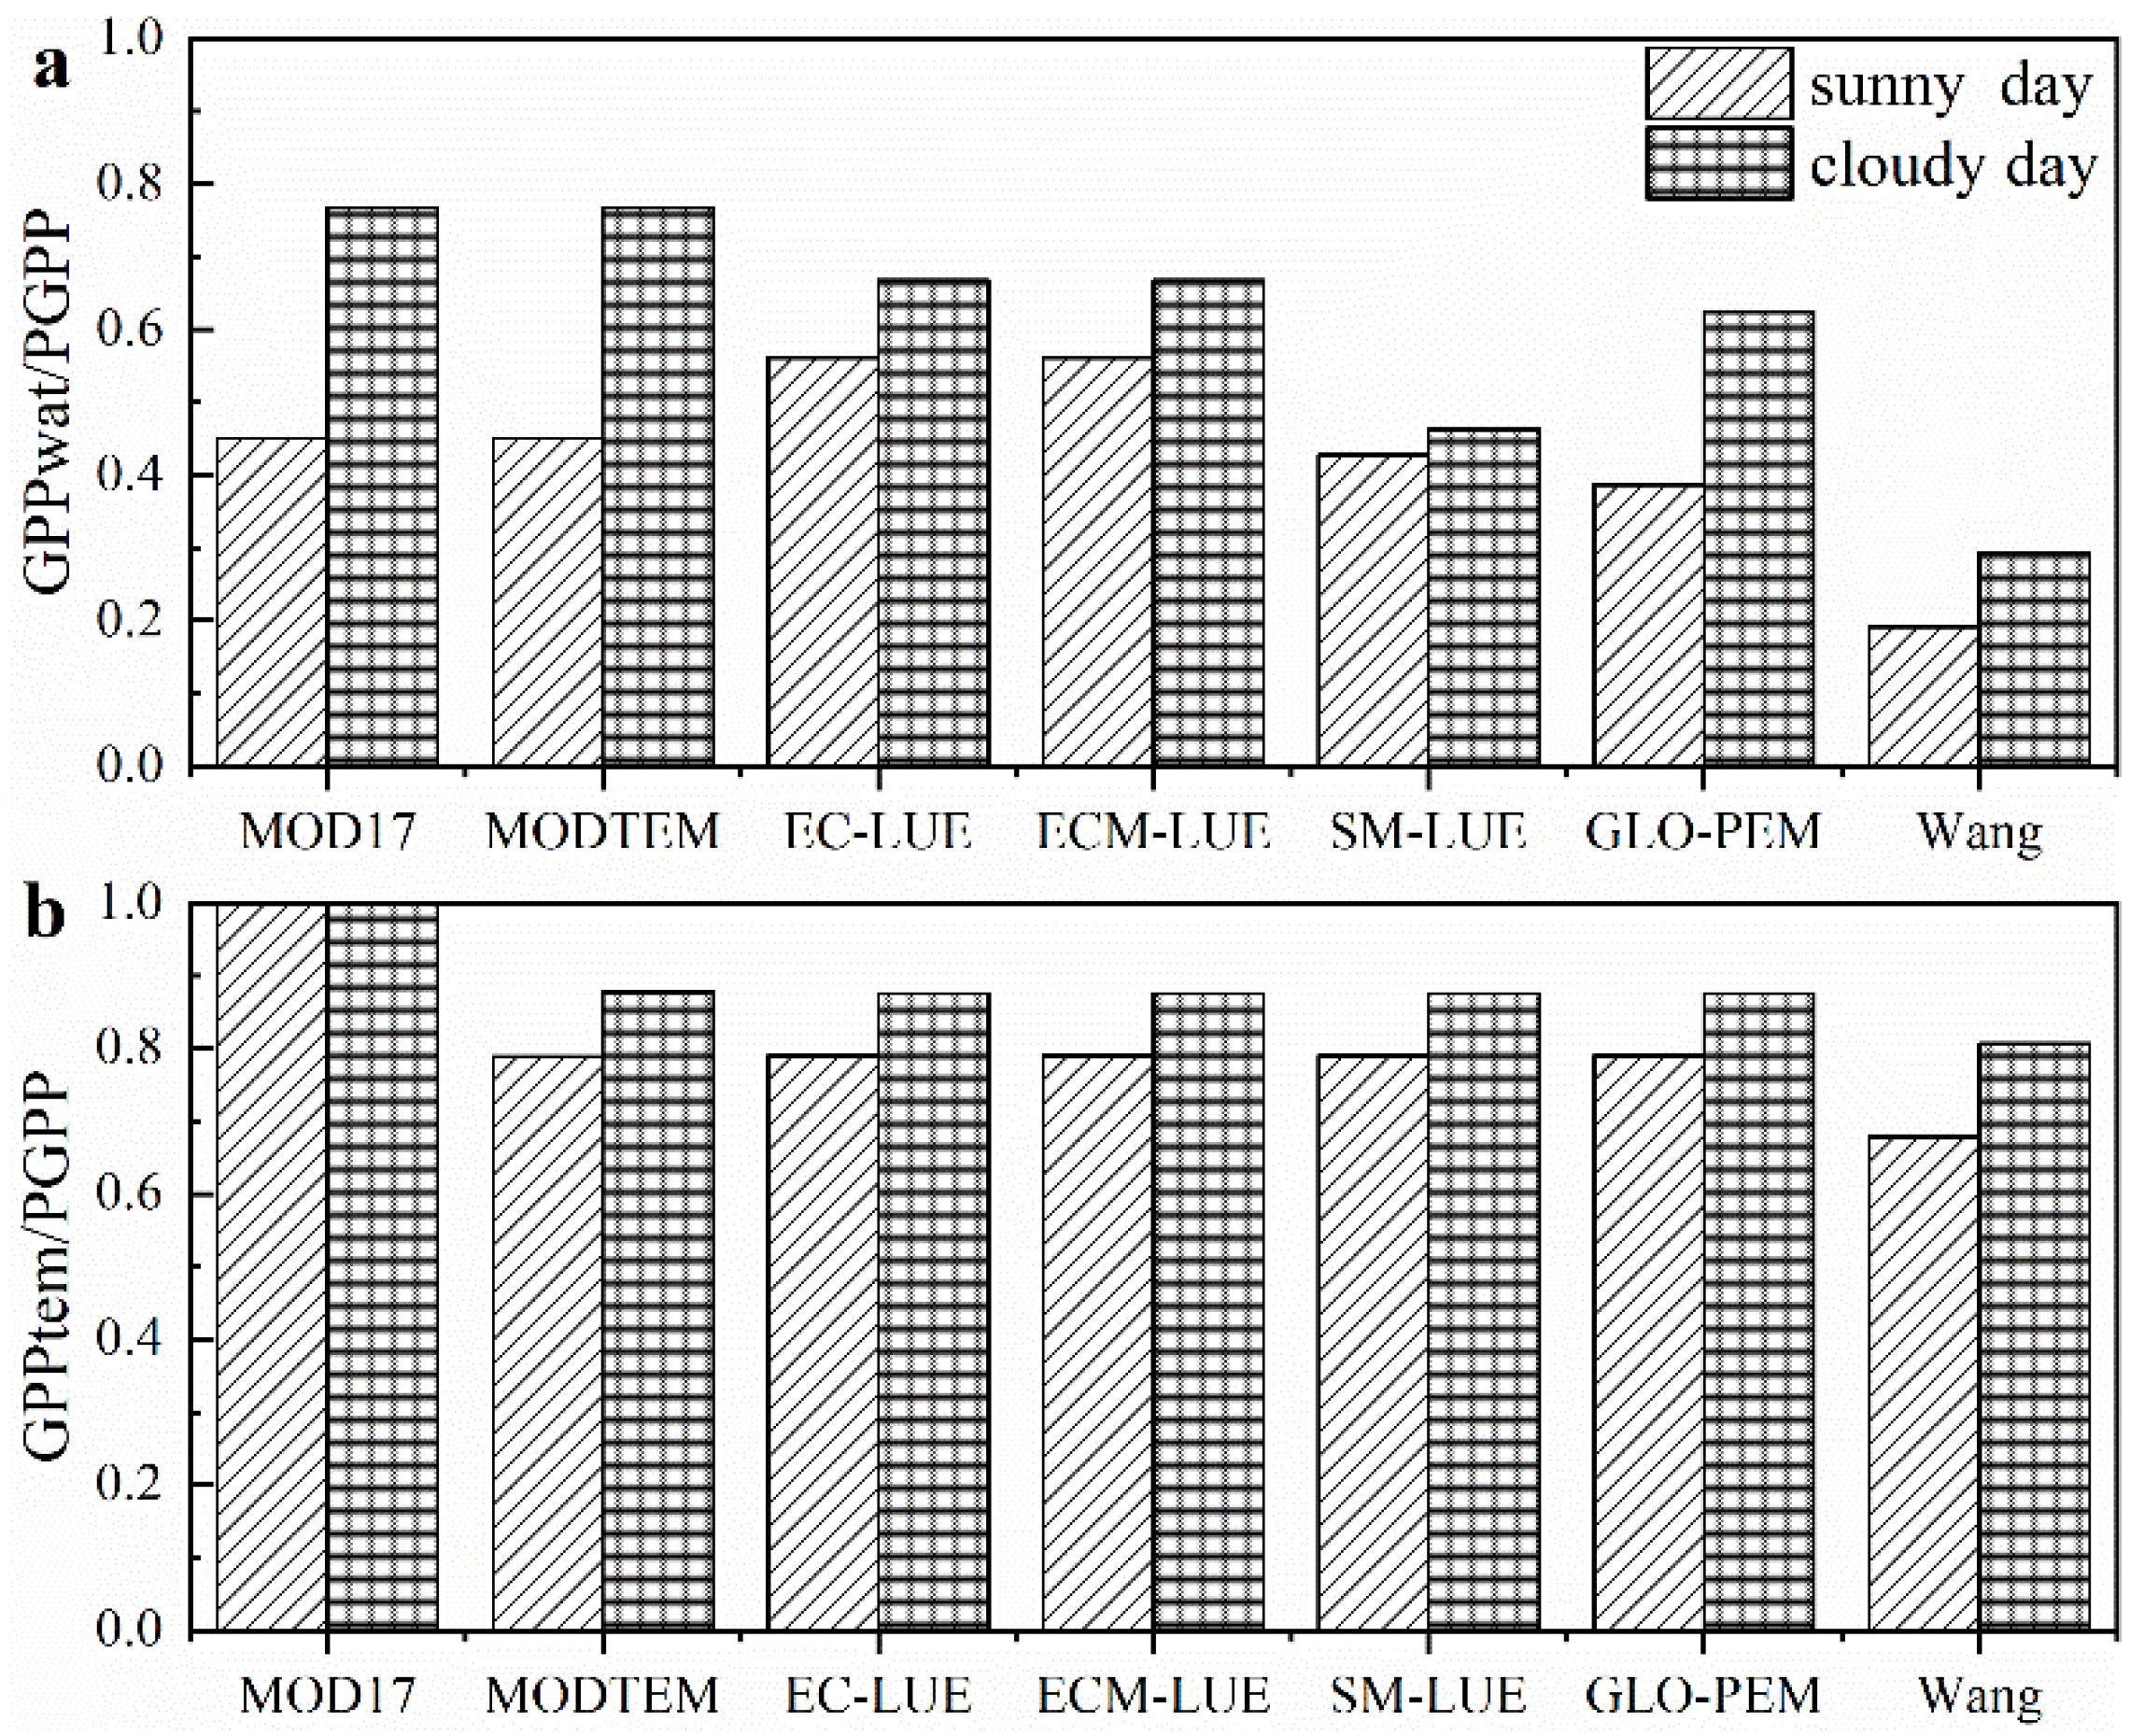
On sunny days, among the seven LUE models, the ratio of GPP that was simulated only by considering the water stress scalar in models (GPPwat) (i.e., PAR × FPAR × LUEmax × Ws) to the potential GPP (PGPP) (i.e., PAR × FPAR × LUEmax) varied from 0.19 to 0.56, with an average value of 0.43; on cloudy days, the ratio varied from 0.29 to 0.77, with an average value of 0.61 (Figure 5a). In addition, the ratio of GPP that was simulated by only considered the temperature stress scalar in the seven LUE models (GPPtem) (i.e., PAR × FPAR × LUEmax × Ts) to PGPP varied from 0.66 to 1.00 on sunny days and 0.81 to 1.00 on cloudy days, and the average value was 0.80 and 0.88, respectively (Figure 5b). The differences between GPPwat/PGPP and GPPtem/PGPP illustrate the contribution of environmental regulation scalars to the differences in the GPP simulations. The results further suggest that, in this study area, the differences in performance between LUE models were due more to the response of the models to water stress compared with the response of the models to temperature stress.

3.3. Accuracy Evaluation of Original Model

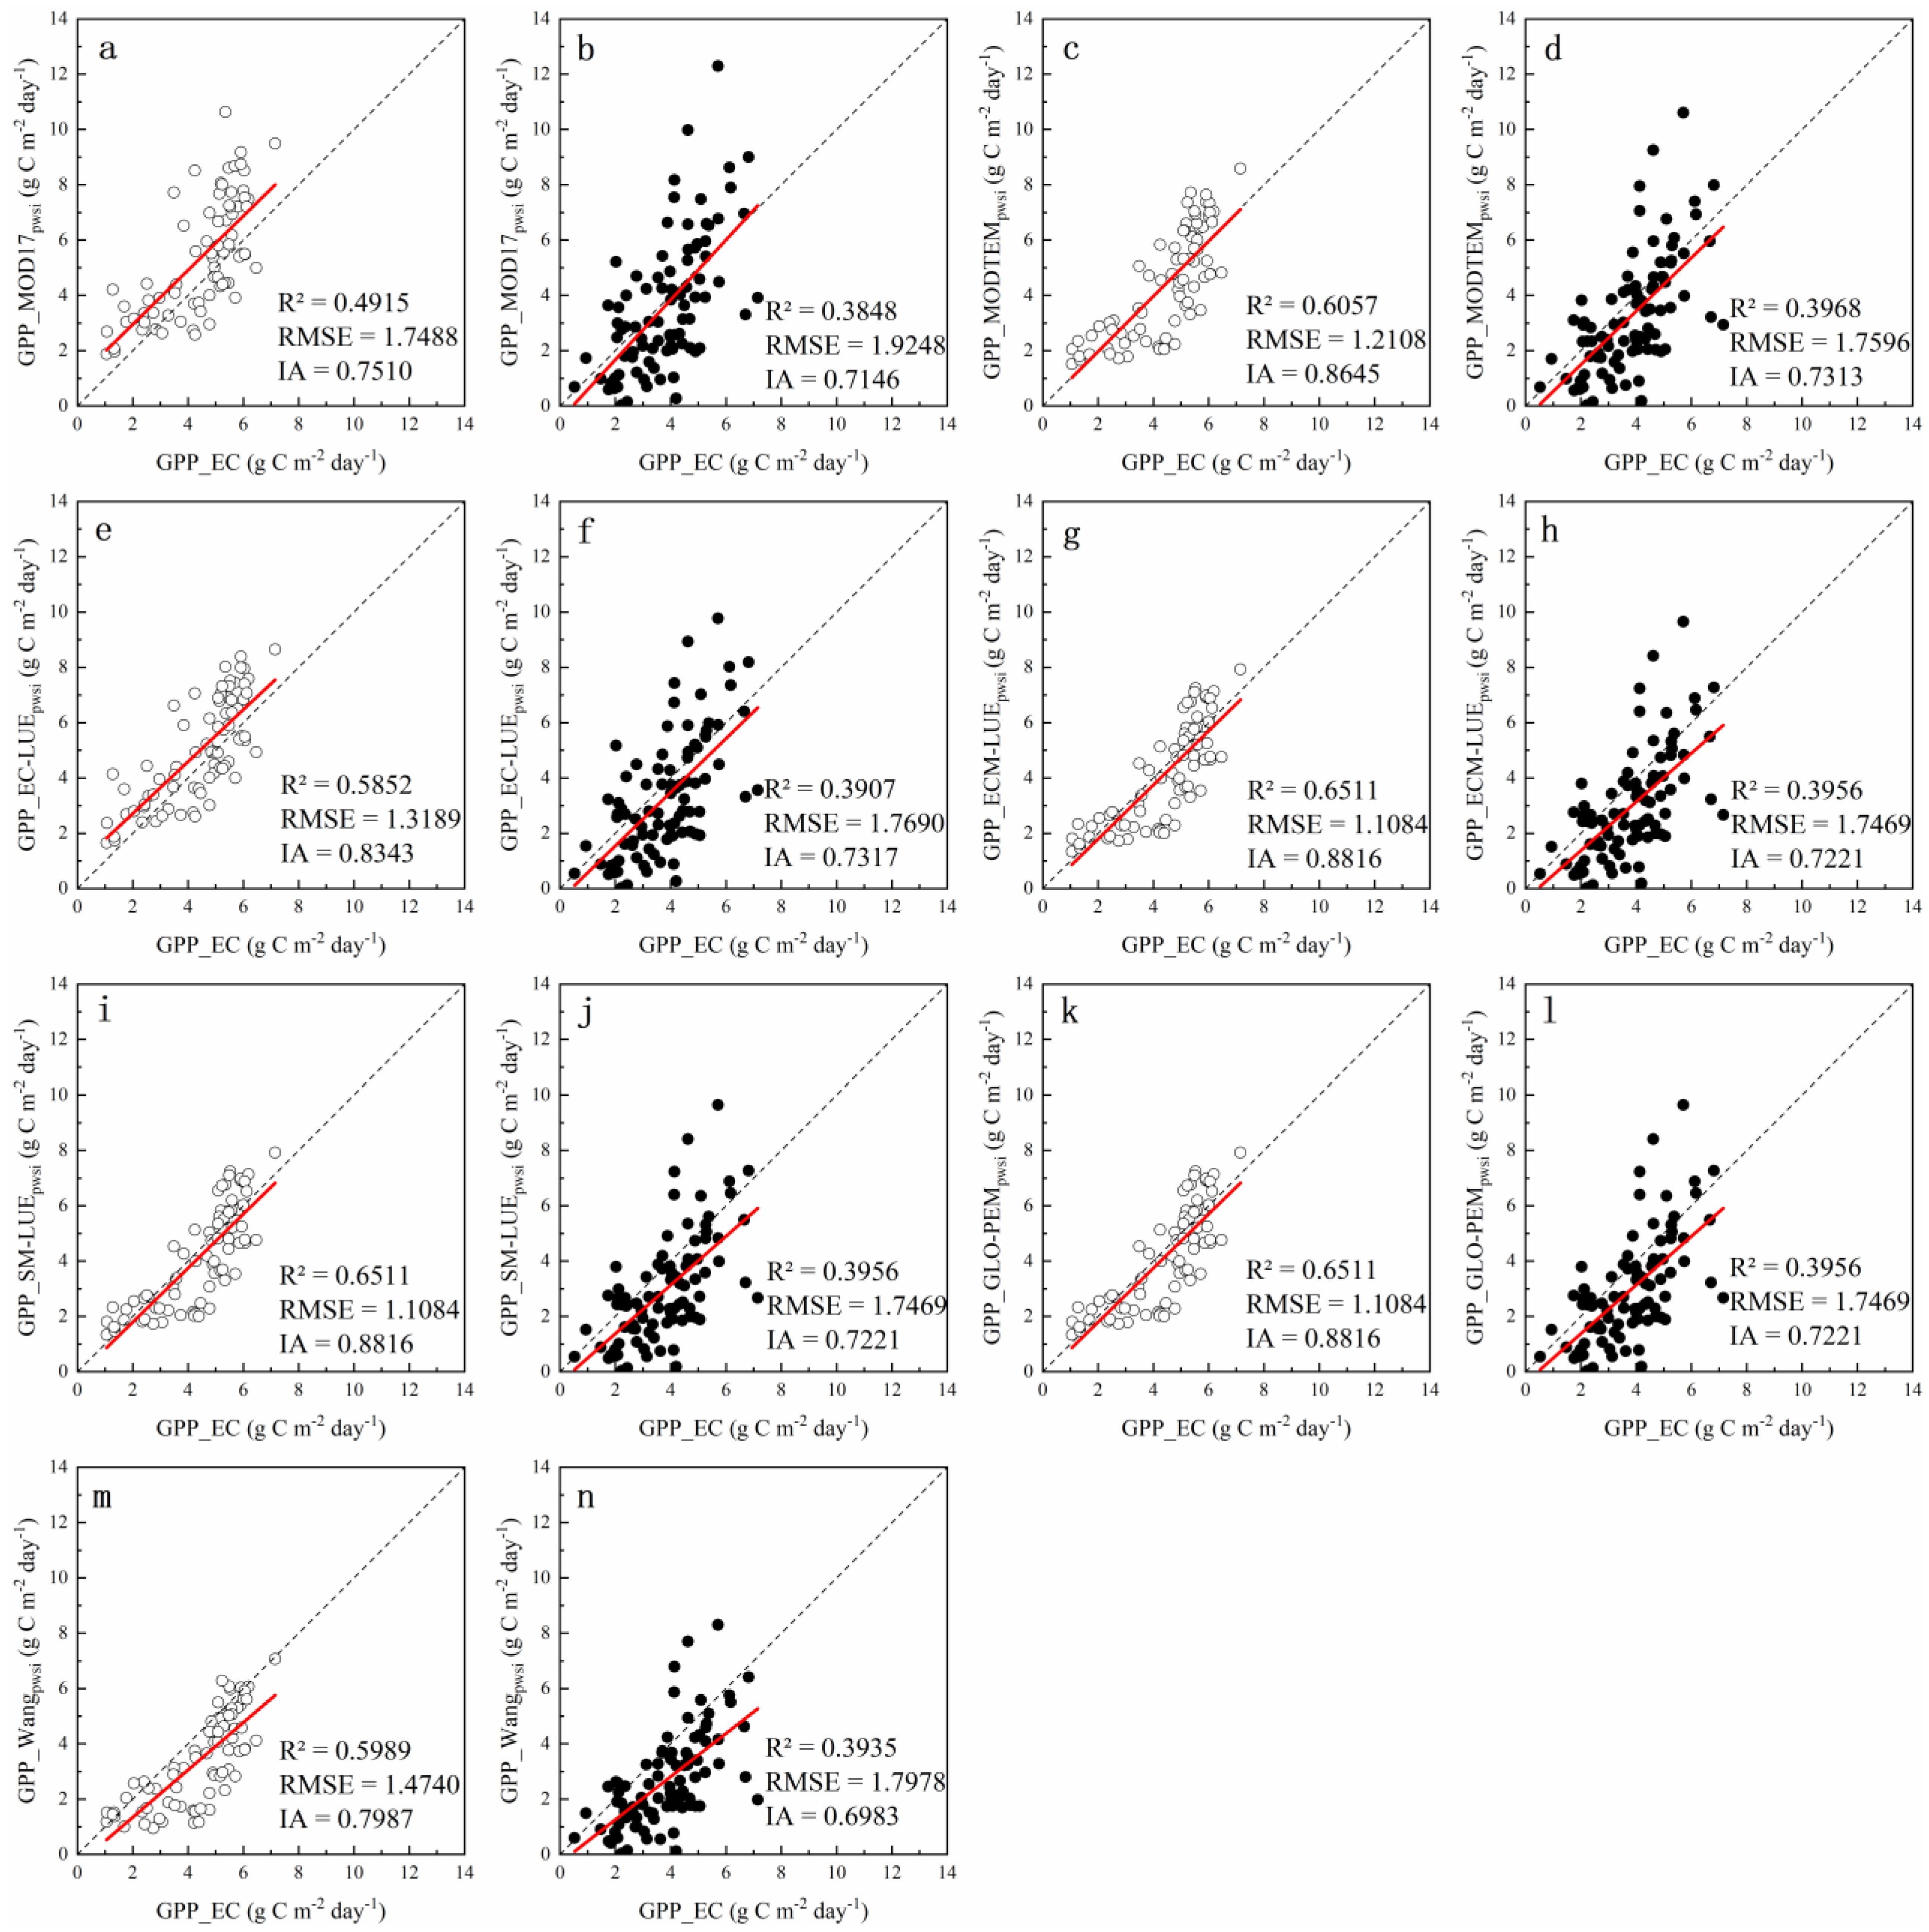
The performance of the original models was evaluated using data from June–September 2020 and May–June 2021. On sunny days, the daily GPP simulated by the seven LUE models was poorly matched with the measured GPP, with the RMSE and IA ranging from 1.4302 to 3.3002 g C m−2 day−1 and 0.4702 to 0.7871, respectively. Further, all models only explained 23–52% of the daily GPP variation in the cork oak plantation (Figure 6). Among the seven models, the GLO-PEM performed relatively well, with an R2 of 0.5192, RMSE of 1.4302 g C m−2 day−1, and IA of 0.7577 (Figure 6k and Figure A1, Appendix A). The MOD17 and MODTEM models had relatively high explanatory powers for daily GPP variations, followed by the GLO-PEM. However, when the environmental stress was severe (GPP values were low), some simulated values of the MOD17 and MODTEM models were smaller than the measured values, resulting in scattered points in the figure. Compared with the MOD17 model, the performance of the MODTEM model was better (Figure 6a,c, and Figure A1). This is because the actual LUE in the MOD17 model was only regulated by the water stress scalar, whereas it was regulated by both water and temperature stress scalars in the MODTEM model. The difference between the EC-LUE and ECM-LUE models was in the integration method of the environmental stress factors; the former adopts the minimum method based on Liebig’s law, and the latter adopts the multiplication method. However, among the seven models, these two models were weaker in explaining daily GPP variations, reaching 23% and 34%, respectively, and the points in the figure were scattered. The simulated values of the EC-LUE and ECM-LUE models were higher than the measured values, reaching 36% and 14%, respectively. Particularly under severe stress conditions, the degree of deviation was significant, resulting in poor accuracy. The performance of the ECM-LUE model was better than that of the EC-LUE model (Figure 6e,g, and Figure A1). The accuracy of the SM-LUE model followed that of the MODTEM model; however, the explanatory power for daily GPP variations was only higher than that of the EC-LUE and ECM-LUE models (Figure 6i and Figure A1). The explanatory power of the Wang model for daily GPP variations was relatively high, but the model accuracy was the lowest. The estimated GPP value was 70% lower than the measured value, which was related to the existence of many environmental constraints in the model (Figure 6m and Figure A1).
On cloudy days, except for the SM-LUE and Wang models, the performance of the other models for daily GPP simulations was relatively good. All models explained 16–52% of the daily GPP variation, with the RMSE and IA ranging from 1.1284 to 2.7853 g C m−2 day−1 and 0.4564 to 0.8292, respectively (Figure 6). The MOD17 and MODTEM models provide a high explanatory power for daily GPP variations. However, the simulated values of the two models were higher than the measured values, reaching 28% and 21%, respectively, and the performance of the MODTEM model was superior to that of the MOD17 model (Figure 6b,d, and Figure A1). The EC-LUE, ECM-LUE, and GLO-PEM models performed relatively well, and the accuracy of the three models was relatively high compared to the other models. Furthermore, the ECM-LUE model with the multiplicative method outperformed the EC-LUE model (Figure 6f,h,l, and Figure A1), which was the same pattern as that in the results on sunny days. Among the seven models, the ECM-LUE model had the best simulation effect on the measured GPP, and the R2, IA, and RMSE were 0.4906, 0.8292, 1.1689 g C m−2 day−1, respectively.

3.4. Accuracy Evaluation of Modified Model Based on PWSI

The performance of the modified LUE model was evaluated using data from June–September 2020 and May–June 2021. On sunny days, after using the PWSI to modify the water stress scalar in the original model, the performance of the seven LUE models was significantly improved, with RMSE and IA ranging from 1.1084 to 1.7488 g C m−2 day−1 and 0.7510 to 0.8816, respectively, and there was less scatter in the figure. All models explained 49–65% of the daily GPP variation in the cork oak plantation. This shows that on sunny days, the PWSI can better indicate the limiting effect of water stress on plant photosynthesis than traditional drought indicators. Except for the MOD17, EC-LUE, and Wang models, the fitting curve of the simulated values and measured values for the other models after modification by the PWSI was very close to the 1:1 line (Figure 7 and Figure A2). For the MOD17 and EC-LUE model structures, because only one stress factor was considered to affect the actual LUE, the simulated values of the two models were still higher than the measured values even when PWSI was modified (Figure 7a,e, and Figure A2). However, because of many limiting factors in the model structure, the simulated value of the modified Wang model was lower than the measured value (Figure 7m and Figure A2). In addition, the modified ECM-LUE model performed better than the modified EC-LUE model Figure 7e,g, and Figure A2). Among the seven models, the model structures with the best performance were the modified ECM-LUE, SM-LUE, and GLO-PEM models based on PWSI (the three models had the same structure after modification), and the R2, IA, and RMSE were 0.6511, 0.8816, 1.1084 g C m−2 day−1, respectively. This was also the optimal LUE model structure suitable for cork oak plantations on sunny days.
On cloudy days, except for the SM-LUE and Wang models, the performance of the models decreased after replacing the water stress scalar in the original model with PWSI, and the explanatory powers of all models for daily GPP variations was only 38–40% (Figure 7). Therefore, the unmodified ECM-LUE model has an optimal structure suitable for cork oak plantations on cloudy days.
In conclusion, the optimal LUE model structure suitable for estimating the GPP of cork oak plantations in northern China can be defined as follows:
G P P = P A R × F P A R N D V I × L U E m a x × W s _ P W S I × T s _ E C L U E , ( C I > 0.5 , L U E m a x = 1.2367 ) P A R × F P A R N D V I × L U E m a x × W s _ E F × T s _ E C L U E , ( C I < 0.5 , L U E m a x = 1.5056 )

3.5. Accuracy Verification of the LUE Model with Optimal Structure

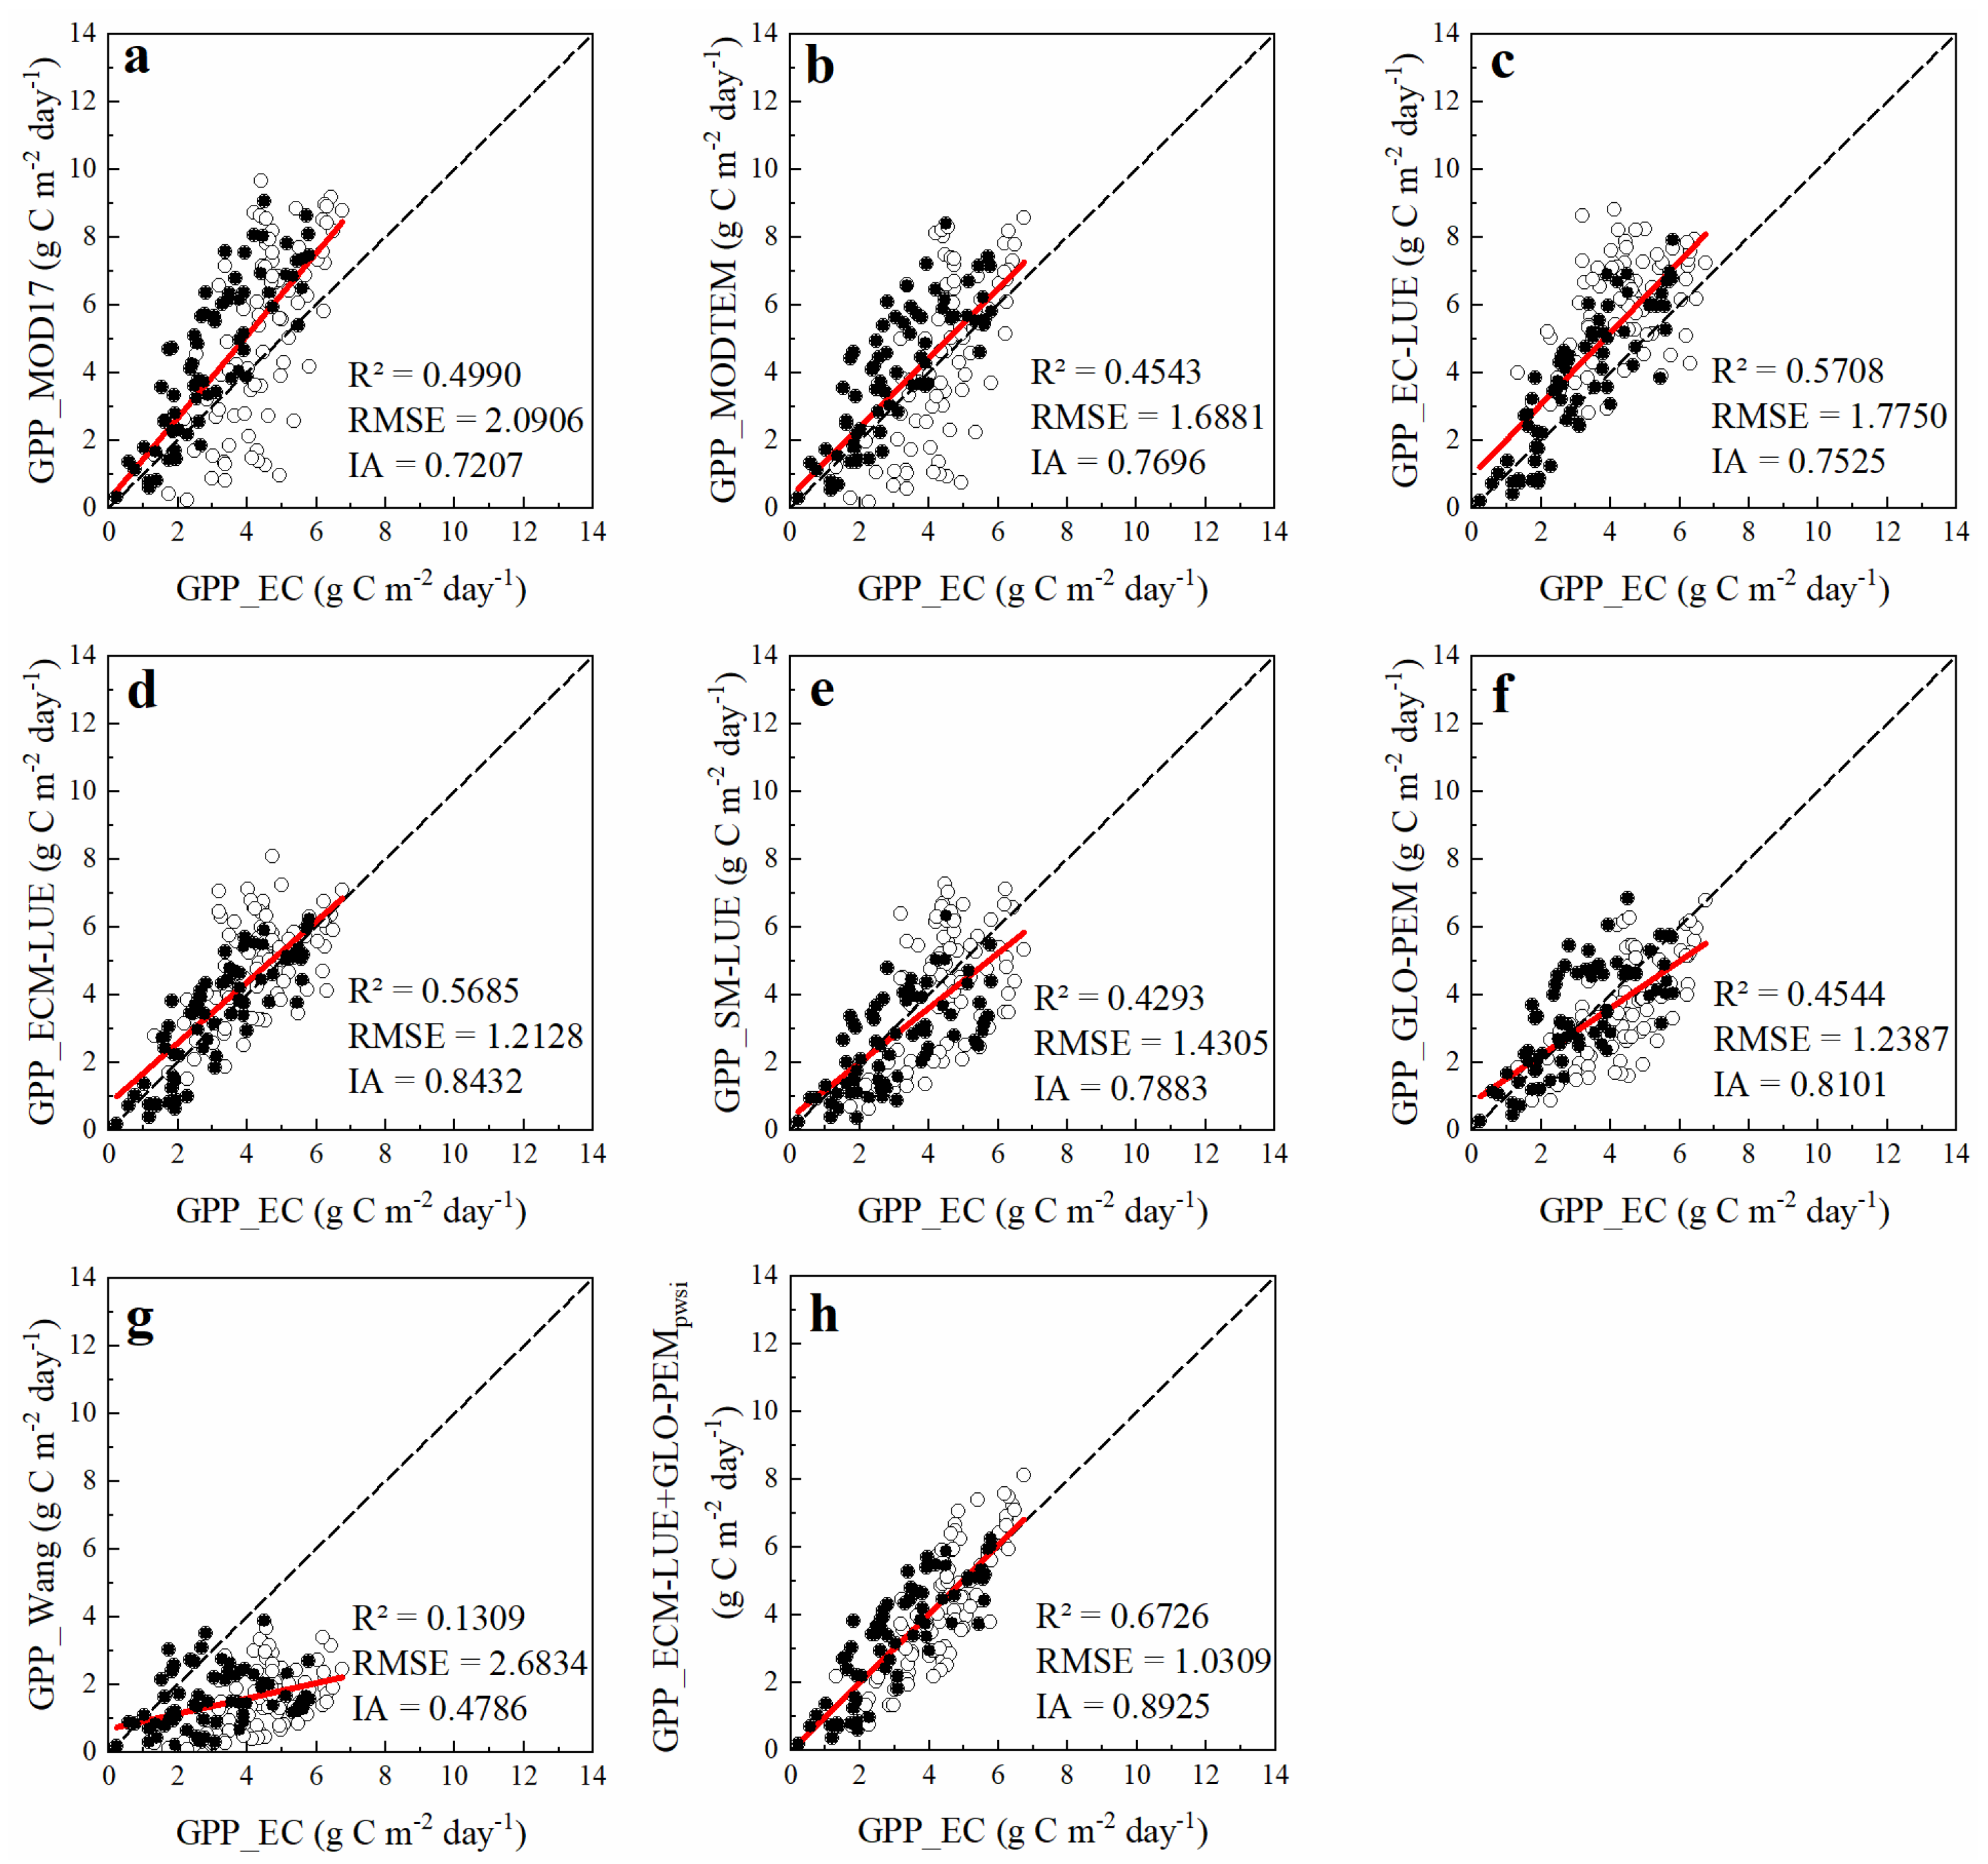
We checked the performance of the LUE model with optimal structure (the combination of the ECM-LUE model on cloudy days and the modified GLO-PEM model based on PWSI on sunny days) using data from July–September 2021 and May–June 2022 (Figure 8 and Figure A3). The optimal structure model can predict the magnitudes and seasonal variations of the measured GPP well in the cork oak plantation, with the R2, IA, and RMSE being 0.6726, 0.8925, 1.0309 g C m−2 day−1, respectively, and the fitting curve of the simulated values and measured values was very close to the 1:1 line. However, the performance of the seven original models was worse than the optimal structure model, with the RMSE and IA ranging from 1.2128 to 2.6834 g C m−2 day−1 and 0.4786 to 0.8432, respectively, and these models explained 13–57% of the daily GPP variation in the cork oak plantation. Moreover, the performance of all models in validation data was similar to that in evaluation data.

4. Discussion

The LUEmax and FPAR are important parameters in the LUE model. We found that the LUEmax was 1.5056 g C MJ−1 on cloudy days and 1.2367 g C MJ−1 on sunny days, and the fitted equations of FPAR and LAI, NDVI were: FPAR = 1 − e−0.5052*LAI, FPAR = 1.2018*NDVI − 0.2583 (Figure 2 andFigure 3). Running and Zhao [46] stated in the user guide of the MOD17 product that the LUEmax for a deciduous broad-leaf forest was 1.1165 g C MJ−1. He et al. [47] considered that the extinction coefficient of multiple vegetation types could be set to 0.50, and Sims et al. [48] found that the slope and intercept of the fitted curve of FPAR and NDVI for deciduous broad-leaf forests were 1.24 and −0.168, respectively. Further, Tong et al. [29] pointed out that as the CI decreases, the LUE gradually increases. These results are in agreement with ours. At present, some studies suggest that LUEmax varies with the model structure, resulting in a large difference in LUEmax for the same species in different LUE models. For example, in the Wang model, the LUEmax was set to 2.97 g C MJ−1 [40], and in the Carbon Fix model (C-Fix), it was only 1.10 g C MJ−1 [49]. Through model parameter optimization, Zheng et al. [10] found that the variation range of LUEmax in different model structures of the same grassland site was 0.70–1.94 g C MJ−1. However, LUEmax is a characteristic parameter of plants, which is related to the plant species and leaf nitrogen content, among other factors [50]. The initial quantum efficiency is an important parameter to characterize the maximum light energy conversion efficiency in photosynthesis; when determining this parameter, photosynthesis is mainly limited by light intensity. Therefore, in the present study, LUEmax was determined using the photosynthesis light-response curve of the plantation. The same method was adopted by Zhang et al. [13].
Model structural differences are considered the most important source of uncertainty in estimating GPP based on LUE models [9,10]. Different quantification methods for FPAR, Ws, and Ts have been used in LUE models to estimate regional and even global GPP [5,14]. In this study, the daily GPP simulated by the seven LUE models on sunny days was poorly matched with the measured GPP, and all models explained only 23–52% of the daily GPP variation in the cork oak plantation (Figure 6). Yuan et al. [9] also found that the Carnegie–Ames–Stanford approach (CASA), C-Fix, Carbon Flux (CFlux), EC-LUE, MOD17, Vegetation Photosynthesis model (VPM), and Vegetation Photosynthesis and Respiration model (VPRM) could only explain 41–57% of the GPP variation of different types of vegetation. Keenan et al. [51] compared 17 models against observations from 36 North American flux towers and showed that none of the models consistently reproduced the variability of the GPP measure from eddy covariance. These models performed poorly in terms of the magnitude and temporal variations of GPP [52]. This indicates that the LUE model still has a significant uncertainty.
Comparing the differences between GPPwat/PGPP and GPPtem/PGPP, we found that the water stress scalar had a greater impact on the performance of the LUE model in our study area, whereas the temperature stress scalar had a relatively small effect (Figure 5). This finding is consistent with the results of Churkina et al. [53] and Bassow and Bazzaz [54]. In our study area, due to the influence of the monsoon climate, the seasonal distribution of precipitation is uneven; the mean precipitation in summer accounts for 68% of the entire year [55]. Continuous rainy days reduced the impact of high temperatures on the productivity of plantations. Furthermore, the soil layer of this site is thin, and the soil layer contains high rock fractions [24]. The thin soil layer limits the water-holding capacity, resulting in drought events easily occurring in spring and autumn with less precipitation. Yuan et al. [9] and Zhang et al. [12] also argued that different methods of quantification of water stress scalars was the main source of the performance divergence of the LUE models in multiple study regions around the world. However, defining the limiting function of water availability in plant photosynthesis has long been a serious challenge [6,9]. Gao et al. [15] pointed out that different LUE models do not accurately represent the complex relationship between water availability and LUE, resulting in large errors in the LUE model. This is consistent with the results of our study (Figure 6 and Figure 7). Currently, indicators commonly used to quantify the limitation of water availability for plant photosynthesis include atmospheric drought indicators, soil moisture indicators, and plant moisture indicators [7], yet there are contrasting opinions regarding which one is optimal [56,57].
Soil water couples the water vapor demand of the atmosphere with the water supply from the soil to the leaves via roots. Soil moisture indicators are always used in the Terrestrial Carbon Flux model (TCF) and the Physiological Principles in Predicting Growth model (3-PG). Some studies have reported that water stress scalars based on soil moisture indicators better explain LUE variations in grasslands than in forests and shrubs [11,58]. This is because woody plants have a higher water availability through deep roots and store more water in stems [58,59,60], thereby reducing the sensitivity of LUE to changes in shallow soil moisture. This was also the main reason for the poor performance of the SM-LUE model in this study on both cloudy and sunny days (Figure 6i,j, and Figure 8e). Since the study area is a lithoid mountain region, the soil layer thickness in most areas is only 20 cm, and plant roots will grow in the rock cracks. The water stress scalar defined by soil moisture indicates that it cannot accurately indicate the limitation of water availability for photosynthesis.
Atmospheric drought indicators, such as VPD and SHD, represent the impact of atmospheric dryness on stomatal conductance and thus on plant transpiration and photosynthesis. Such indicators are often used in the MOD17 and GLO-PEM models. Tong et al. [24] found that atmospheric drought is the main factor causing plant water stress in cork oak plantations. Yuan et al. [61] also reported that VPD and LUE were significantly negatively correlated in sub-humid areas and that the correlation was stronger in humid areas. These results are consistent with our findings. The LUE models established based on the atmospheric drought indicator had a relatively high explanatory power of GPP variation, especially on cloudy days, reaching 52%. However, the GPP values simulated by the MOD17 and MODTEM models were generally larger than the measured GPP values on cloudy days (Figure 6a–d and Figure 8a,b), which is consistent with the results of Ma and Yuan [62]. This is because the water stress scalar defined by VPD indicates that the degree of water stress on photosynthesis limitation is relatively weak on cloudy days (Figure 5). Another disadvantage of the water stress scalar defined by VPD is that photosynthesis is considered to be completely stopped during periods of high VPD [63]. However, soil moisture and other environmental conditions might still be favorable for maintaining photosynthetic activity at a certain level even if the atmosphere is very dry; that is, when the VPD is high, the limiting effect of water stress on photosynthesis may not reach the expected degree [61]. This is the main reason that some simulated values of the MOD17 and MODTEM models were smaller than the measured values when the stress was severe (GPP value is low) on sunny days, and it is the reason for scattered points in the figure Figure 6a,c and Figure 8a,b). In contrast, the VPD was low on cloudy days, and the above phenomena were not obvious. Tong et al. [24] pointed out that photosynthesis is co-regulated by the soil moisture and atmospheric evaporation demand. Mu et al. [64] reported that VPD may decouple soil water dynamics owing to its oversensitivity to temperature, especially in summer monsoon regions.
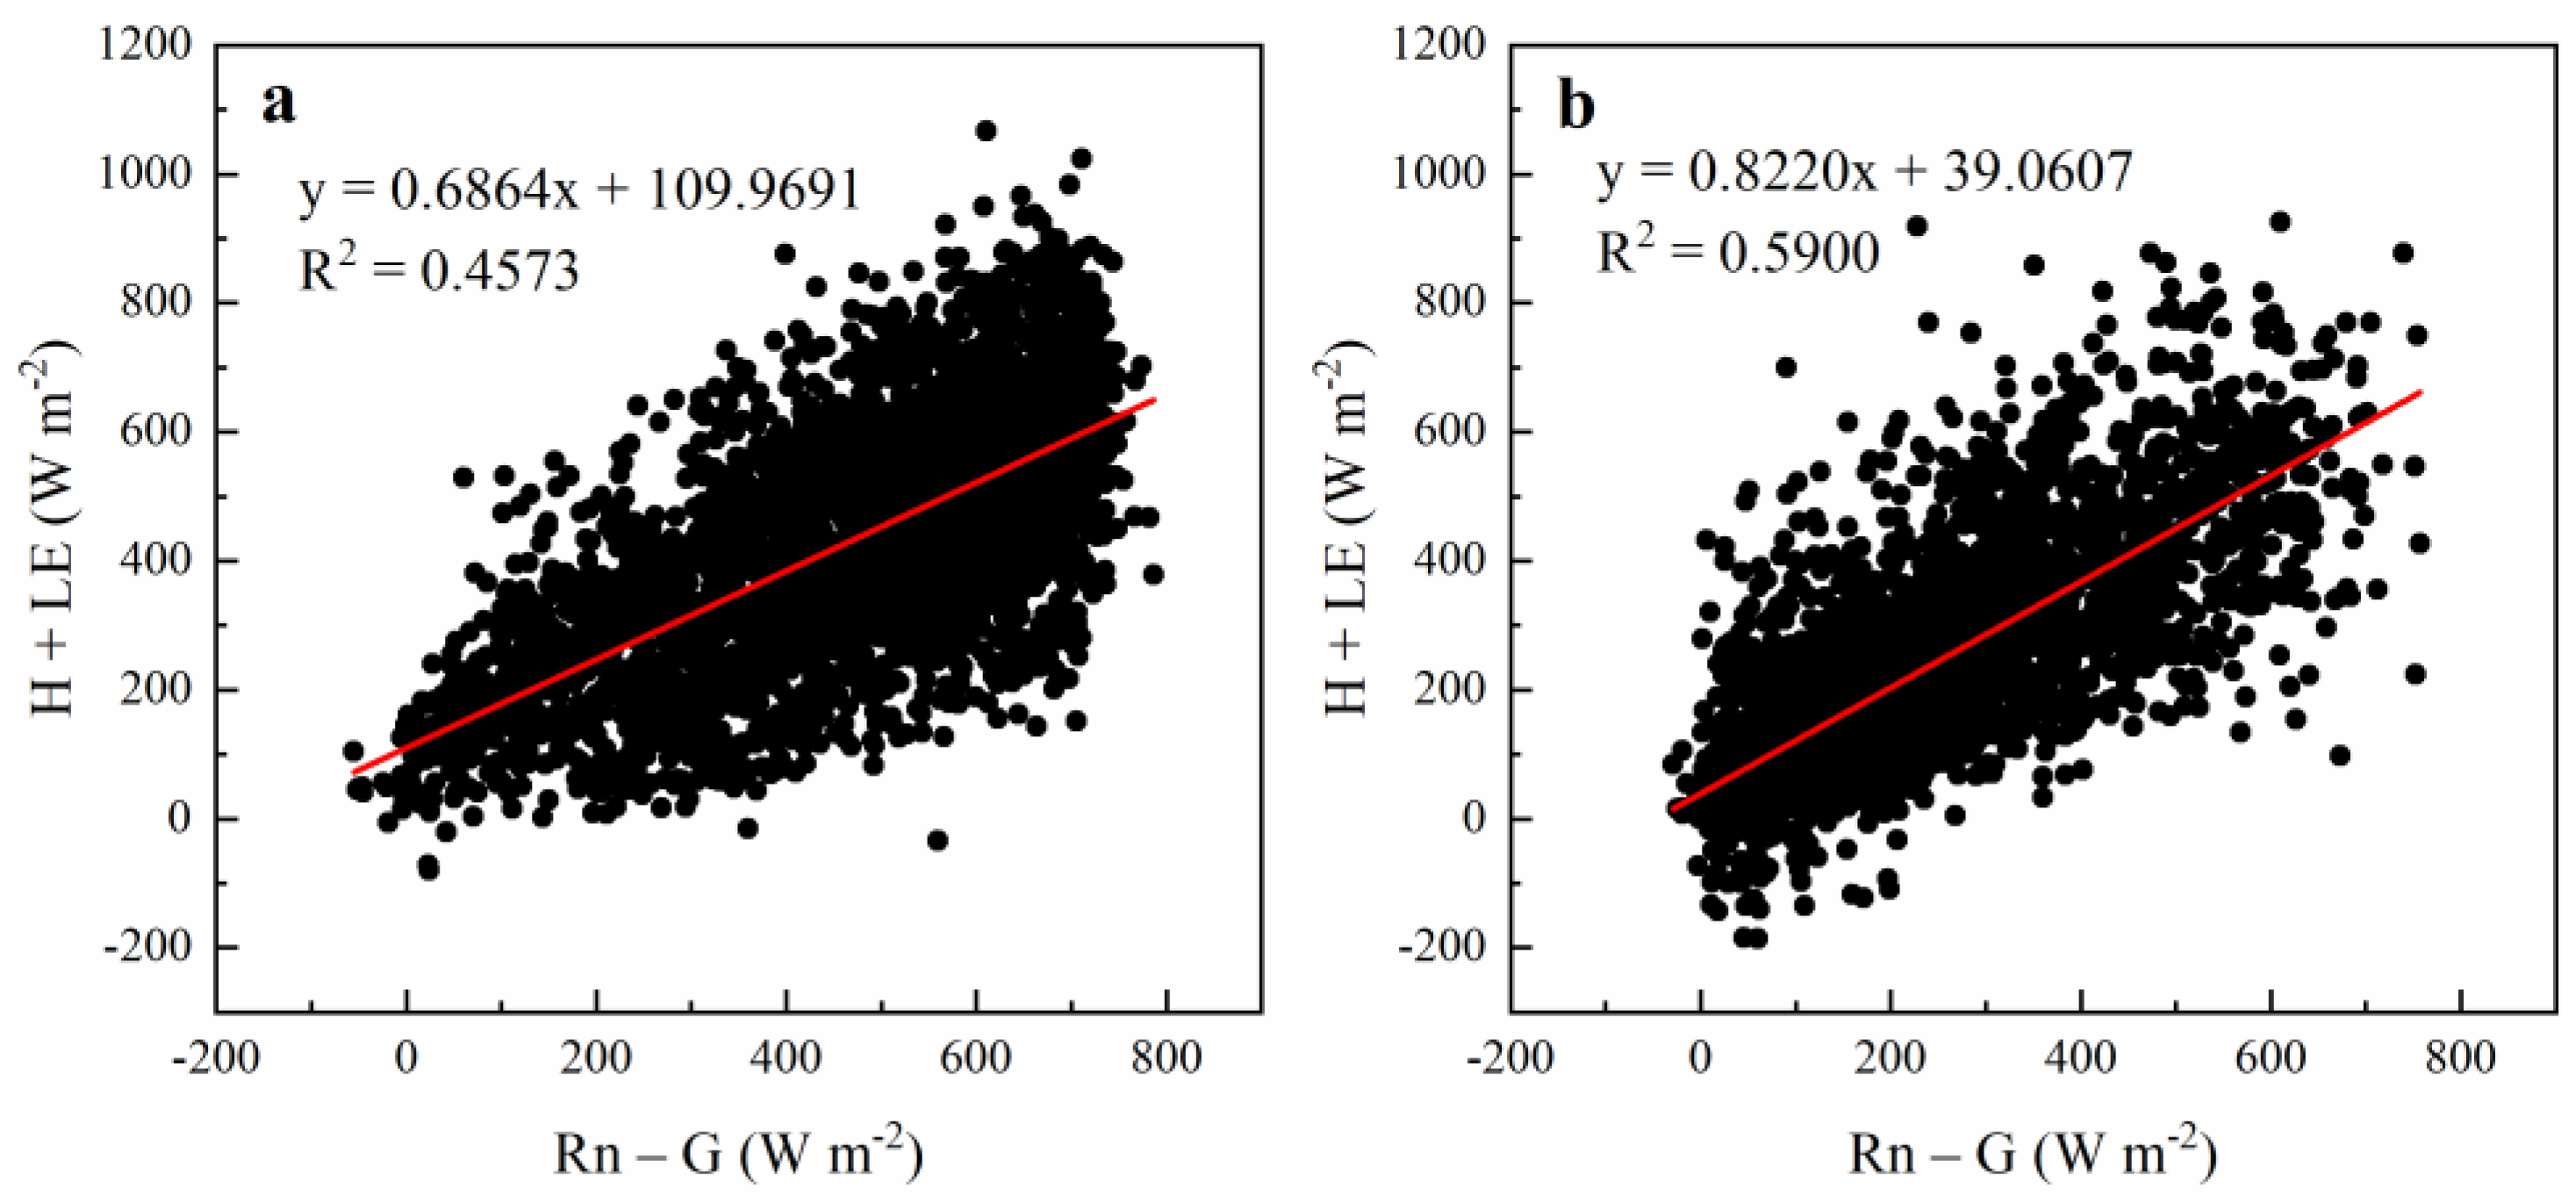
Pei et al. [7] pointed out that plant moisture indicators are preferred in the LUE models. Zhang et al. [11] found that plant moisture indicators were more sensitive to changes in LUE than soil and atmospheric drought indicators. The principle of EF, which indicates water status, is that the decreasing amounts of energy partitioned to evaporate water suggest a stronger moisture limitation. However, our study found that the LUE model constructed based on EF had a poor performance on sunny days but a good performance on cloudy days (Figure 6e,g,f,h and Figure 8c,d). This may be related to the inaccurate measurements of ecosystem energy. The degree of energy closure of the ecosystem was not fixed. For example, Zanotelli et al. [65] found that the degree of energy closure of apple orchards varies between 0.42 and 0.75 in a year. This means that there are biases between the turbulent heat flux and the available energy of the ecosystem. In this study, the energy closure was 0.69 on sunny days, which was similar to the results of Tong et al. [66]. In contrast, on cloudy days, the energy closure was 0.82. In addition, the R2 between the available energy and turbulent heat flux on sunny days was lower than that on cloudy days (Figure A4). This means that the energy error was large on sunny days, resulting in poor performance of EF in indicating water status and low accuracy of the EC-LUE and ECM-LUE models. Moreover, as the available energy increases, the difference between turbulent heat flux and the available energy increases, which increases the EF. This may be the main reason for the higher simulation values of the EC-LUE and ECM-LUE models when environmental stress on sunny days was severe. Xu et al. [67] also found that the EC-LUE model overestimated the GPP of moso bamboo forests under drought conditions and that EF could not characterize the effect of drought on GPP well. Because we could not obtain ground-observed short-wave infrared (SWIR) data, we did not verify the performance of the LUE model constructed based on LSWI. However, previous studies have shown that LSWI is sensitive to leaf water content rather than canopy water content [68], and the regional GPP is limited more by the water condition at the canopy level [69]. Moreover, the LSWI cannot reflect atmospheric water stress because of the weak effects of atmospheric water vapor on the near infrared (NIR) and SWIR bands [70].
Stomatal conductance has long been considered the most sensitive response of plants to water deficit [71], as a result of co-regulation by soil and atmospheric drought, and it controls the exchange of water and air between plants and the external environment. However, it is difficult to directly observe plant canopy conductance on a regional scale. An important consequence of stomatal closure under water stress is a decrease in heat dissipation, which leads to an increase in canopy temperature [72]. Therefore, canopy temperature is highly sensitive to changes in plant water status [21]. This study found that on sunny days, after using PWSI to modify the water stress scalar in the LUE models, the accuracy of simulating GPP in all models was significantly improved, as were the explanatory powers for the GPP variations. In most models, the fitting curves of the simulated and measured values are very close to the 1:1 line (Figure 7 and Figure 8). This verifies that the quantification method of the water stress scalar is the main error source of the seven LUE models, and the traditional water stress indicators cannot accurately indicate the limitation of water stress on photosynthesis. PWSI, which contains both soil and atmospheric drought information, had the best performance in indicating the limitation of water stress on photosynthesis. This result is consistent with the findings of Tong et al. [24] and Li et al. [23]. However, on cloudy days, the radiant energy reaching the ground will change drastically because of cloud cover, which will affect the energy balance of the canopy, cause the canopy temperature to change rapidly, and reduce the performance of PWSI in indicating the water status of plants. Therefore, on cloudy days, the LUE models modified based on the PWSI exhibited poor performance (Figure 7). Gardner et al. [73] pointed out that it is not suitable to observe the canopy temperature for plant water status detection when the solar radiation changes rapidly. According to the PWSI and EF behaviors, the performance of water stress indicators varied significantly under different weather conditions, especially the optical indicators based on remote sensing. These indicators are always considered superior to atmospheric and soil moisture indicators; however, frequent cloud contamination limits their application in LUE models [7,30,31]. Therefore, weather factors must be considered when improving the performance of LUE models.
Most LUE models include two or three environmental stress factors, such as MOD17, which considers water and temperature stress factors based on VPD and Ta, and the GLO-PEM model based on SWC, SHD, and Ta. In terms of integrating environmental stress factors, most LUE models use the multiplication method to integrate environmental stress factors (such as MOD17, GLO-PEM, and VPM models). However, some studies have shown that the minimum method based on Liebig’s law introduced into the model is also useful (e.g., EC-LUE and 3-PG models) [7]. Our study found that the performance of the ECM-LUE model was better than that of the EC-LUE model on cloudy days, and the performance of the ECM-LUE model modified by PWSI was better than that of the EC-LUE model modified by PWSI on sunny days (Figure 6, Figure 7 and Figure 8). However, Zhang et al. [12] found that the minimum method was better than the multiplication method for integrating multiple environmental stress factors in the VPM and EC-LUE models. They pointed out that, in the growing season, the LUE mainly depends on water conditions rather than temperature conditions, resulting in the minimum method working well. However, the occurrence of drought stress is often accompanied by high-temperature stress, and the co-effects of water and temperature stress can significantly reduce the photosynthetic efficiency of plants compared to single-factor stress [74,75,76]. The minimum approach based on Liebig’s law only considers one of the environmental stresses, which underestimates the impact of environmental stress on LUE, resulting in an overestimation of GPP by the LUE model. This is the main reason that the simulated values of the modified MOD17 and EC-LUE models were higher than the measured values in our study (Figure 7a,e and Figure 8a,c). Another point that should be noted is that the water stress scalar (EF) in the EC-LUE model does not vary from 0 to 1, which may be the that why the EC-LUE model with the minimum method to integrate multiple environmental stress factors also performs well in some studies [6,12].
In this study, the performance of the water stress scalar defined by PWSI and the modified model based on PWSI was tested at the site scale based on ground-observed data. Unfortunately, because a thermal infrared camera is not standard equipment for flux networks, the test of the performance of the PWSI was limited by the extent of space, which is the same limitation as that in the study by Biudes et al. [14]. Considering the relationship between canopy temperature and ecosystem moisture and energy status, canopy temperature is a key indicator for characteristics of plant health status, and we suggest that this device should be used as a standard device for flux networks in the future. Furthermore, the performance of the water stress scalar defined by PWSI and the modified LUE model based on PWSI should be verified at more sites with different types of vegetation and explored for applications at the satellite scale in the future.

5. Conclusions

We evaluated the applicability of seven LUE models with typical water stress scalars for GPP simulation of a cork oak plantation in northern China and explored whether using PWSI to modify the above models could improve model performance. Compared to the temperature stress scalar, the water stress scalar has a significant impact on the performance of the LUE model. On sunny days, PWSI was more suitable than traditional water stress indicators for indicating the relationship between water limitation and photosynthesis. After using PWSI to modify the water stress scalar, the performance of all LUE models was improved. However, on cloudy days, the performance of the modified LUE models did not improve, and the EF was more suitable for indicating the limitation of water stress on photosynthesis. The modified GLO-PEM and ECM-LUE models had the optimal model structure for GPP simulation of cork oak plantations in northern China on sunny and cloudy days, respectively. This study provides a reference for simulating forest GPP in other regions.

Author Contributions

Conceptualization, L.L., J.Z. and X.G.; Methodology, L.L., H.H., B.C. and Y.B.; Software, L.L., X.C. and Y.Z.; Validation, L.L.; Writing—original draft preparation, L.L. and X.G.; Writing—review and editing, J.Z., X.G. and J.C.; Visualization, L.L., X.G. and J.Z.; Supervision: J.Z. and X.G.; Funding acquisition, J.Z. and X.G. L.L. and X.G. contributed equally to this work. All authors have read and agreed to the published version of the manuscript.

Funding

This study was sponsored by the National Key Research and Development Project (grant no. 2020YFA0608101) and the National Nonprofit Institute Research Grant of the Chinese Academy of Forestry (CAFYBB2022SY001, CAFYBB2018ZA001, CAFZC2017M005).

Data Availability Statement

The data presented in this study are available on request from the corresponding author. The data are not publicly available due to the fact that the data needs to be used in much future work.

Acknowledgments

We thank Wang Qian from the Henan Agricultural University for advising. We thank Guangguang Li from Nanshan Forest Farm, Jiyuan City for contributing to field measurements. We also appreciate the editors and three anonymous reviewers for their constructive suggestions and comments that improved the manuscript.

Conflicts of Interest

The authors declare no conflict of interest.

Appendix A

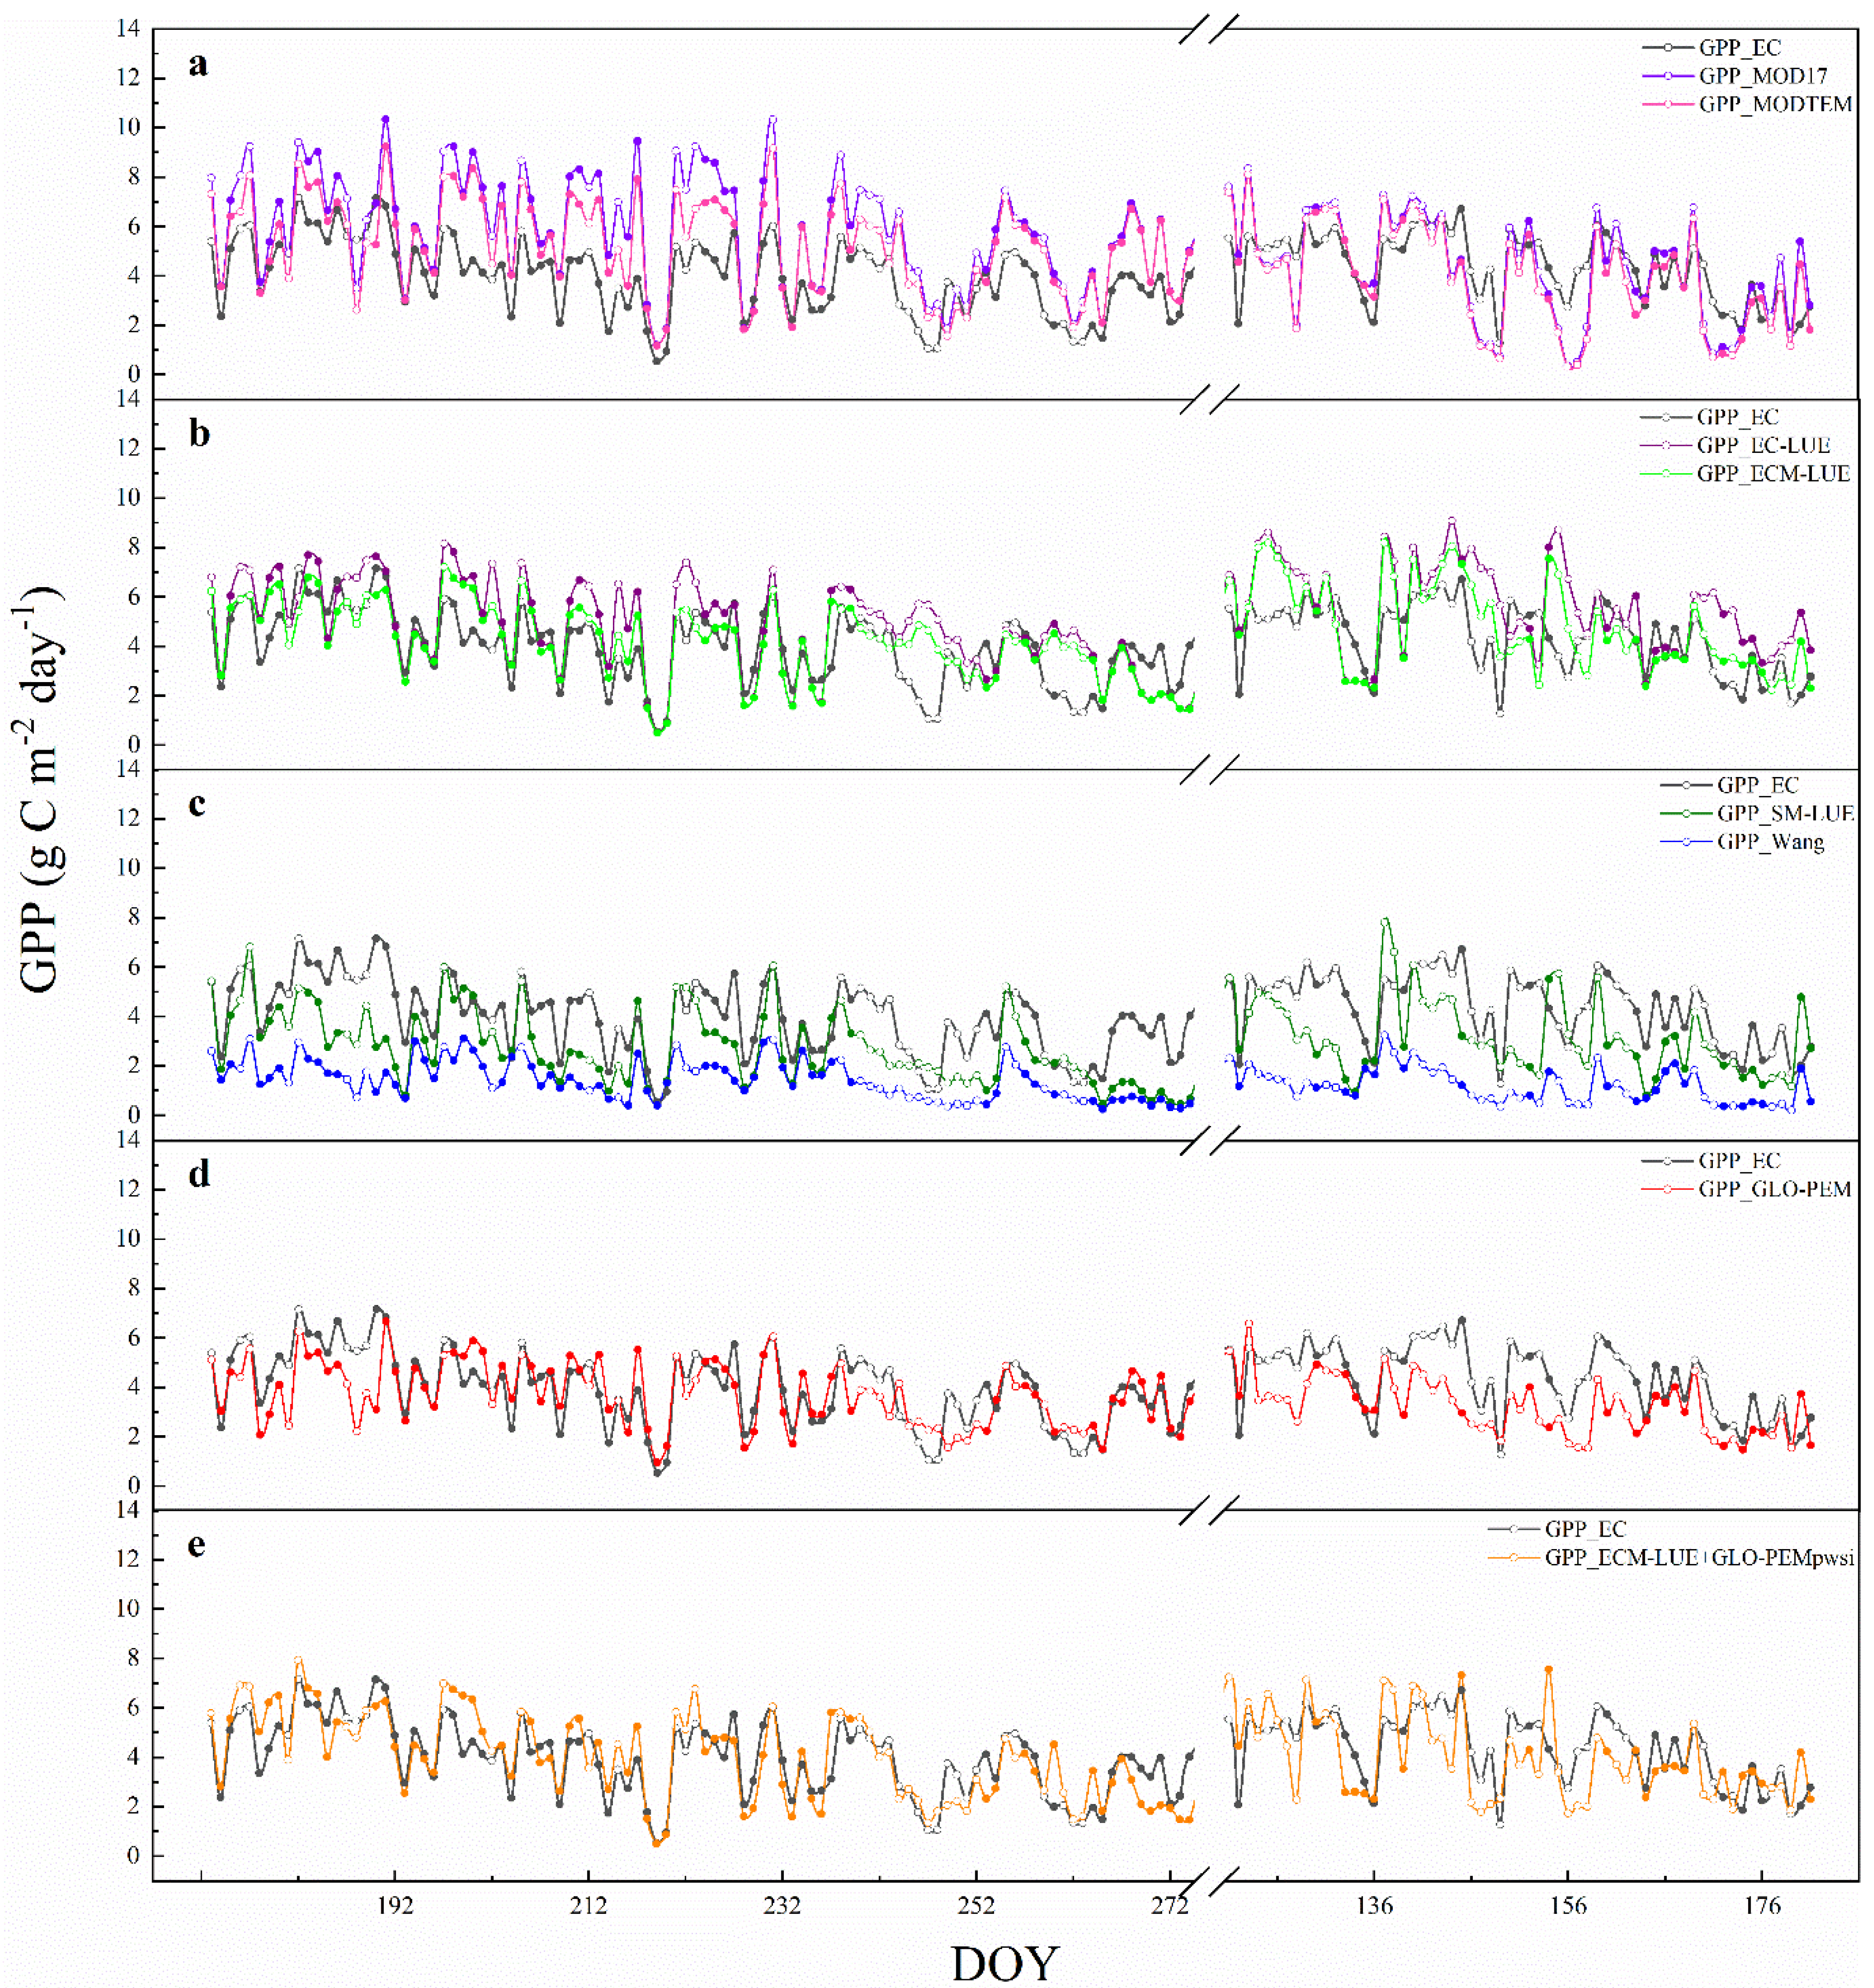
Figure A1. Seasonal variations of gross primary production (GPP) simulated by MOD17 and MODTEM (a), EC-LUE and ECM-LUE (b), SM-LUE and Wang (c), GLO-PEM (d), and ECM-LUE+GLO-PEMpwsi (e) models and observed GPP. ECM-LUE+GLO-PEMpwsi means the combination of ECM-LUE model on cloudy days and the GLO-PEMpwsi model on sunny days. The subscript plant water stress index (PWSI) indicates that PWSI was used to modify the water stress scalar in the LUE model. Solid dots represent cloudy days, and the open circle dots represent sunny days. Data from June–September 2020 and May–June 2021.
Remotesensing 14 05905 g0a1
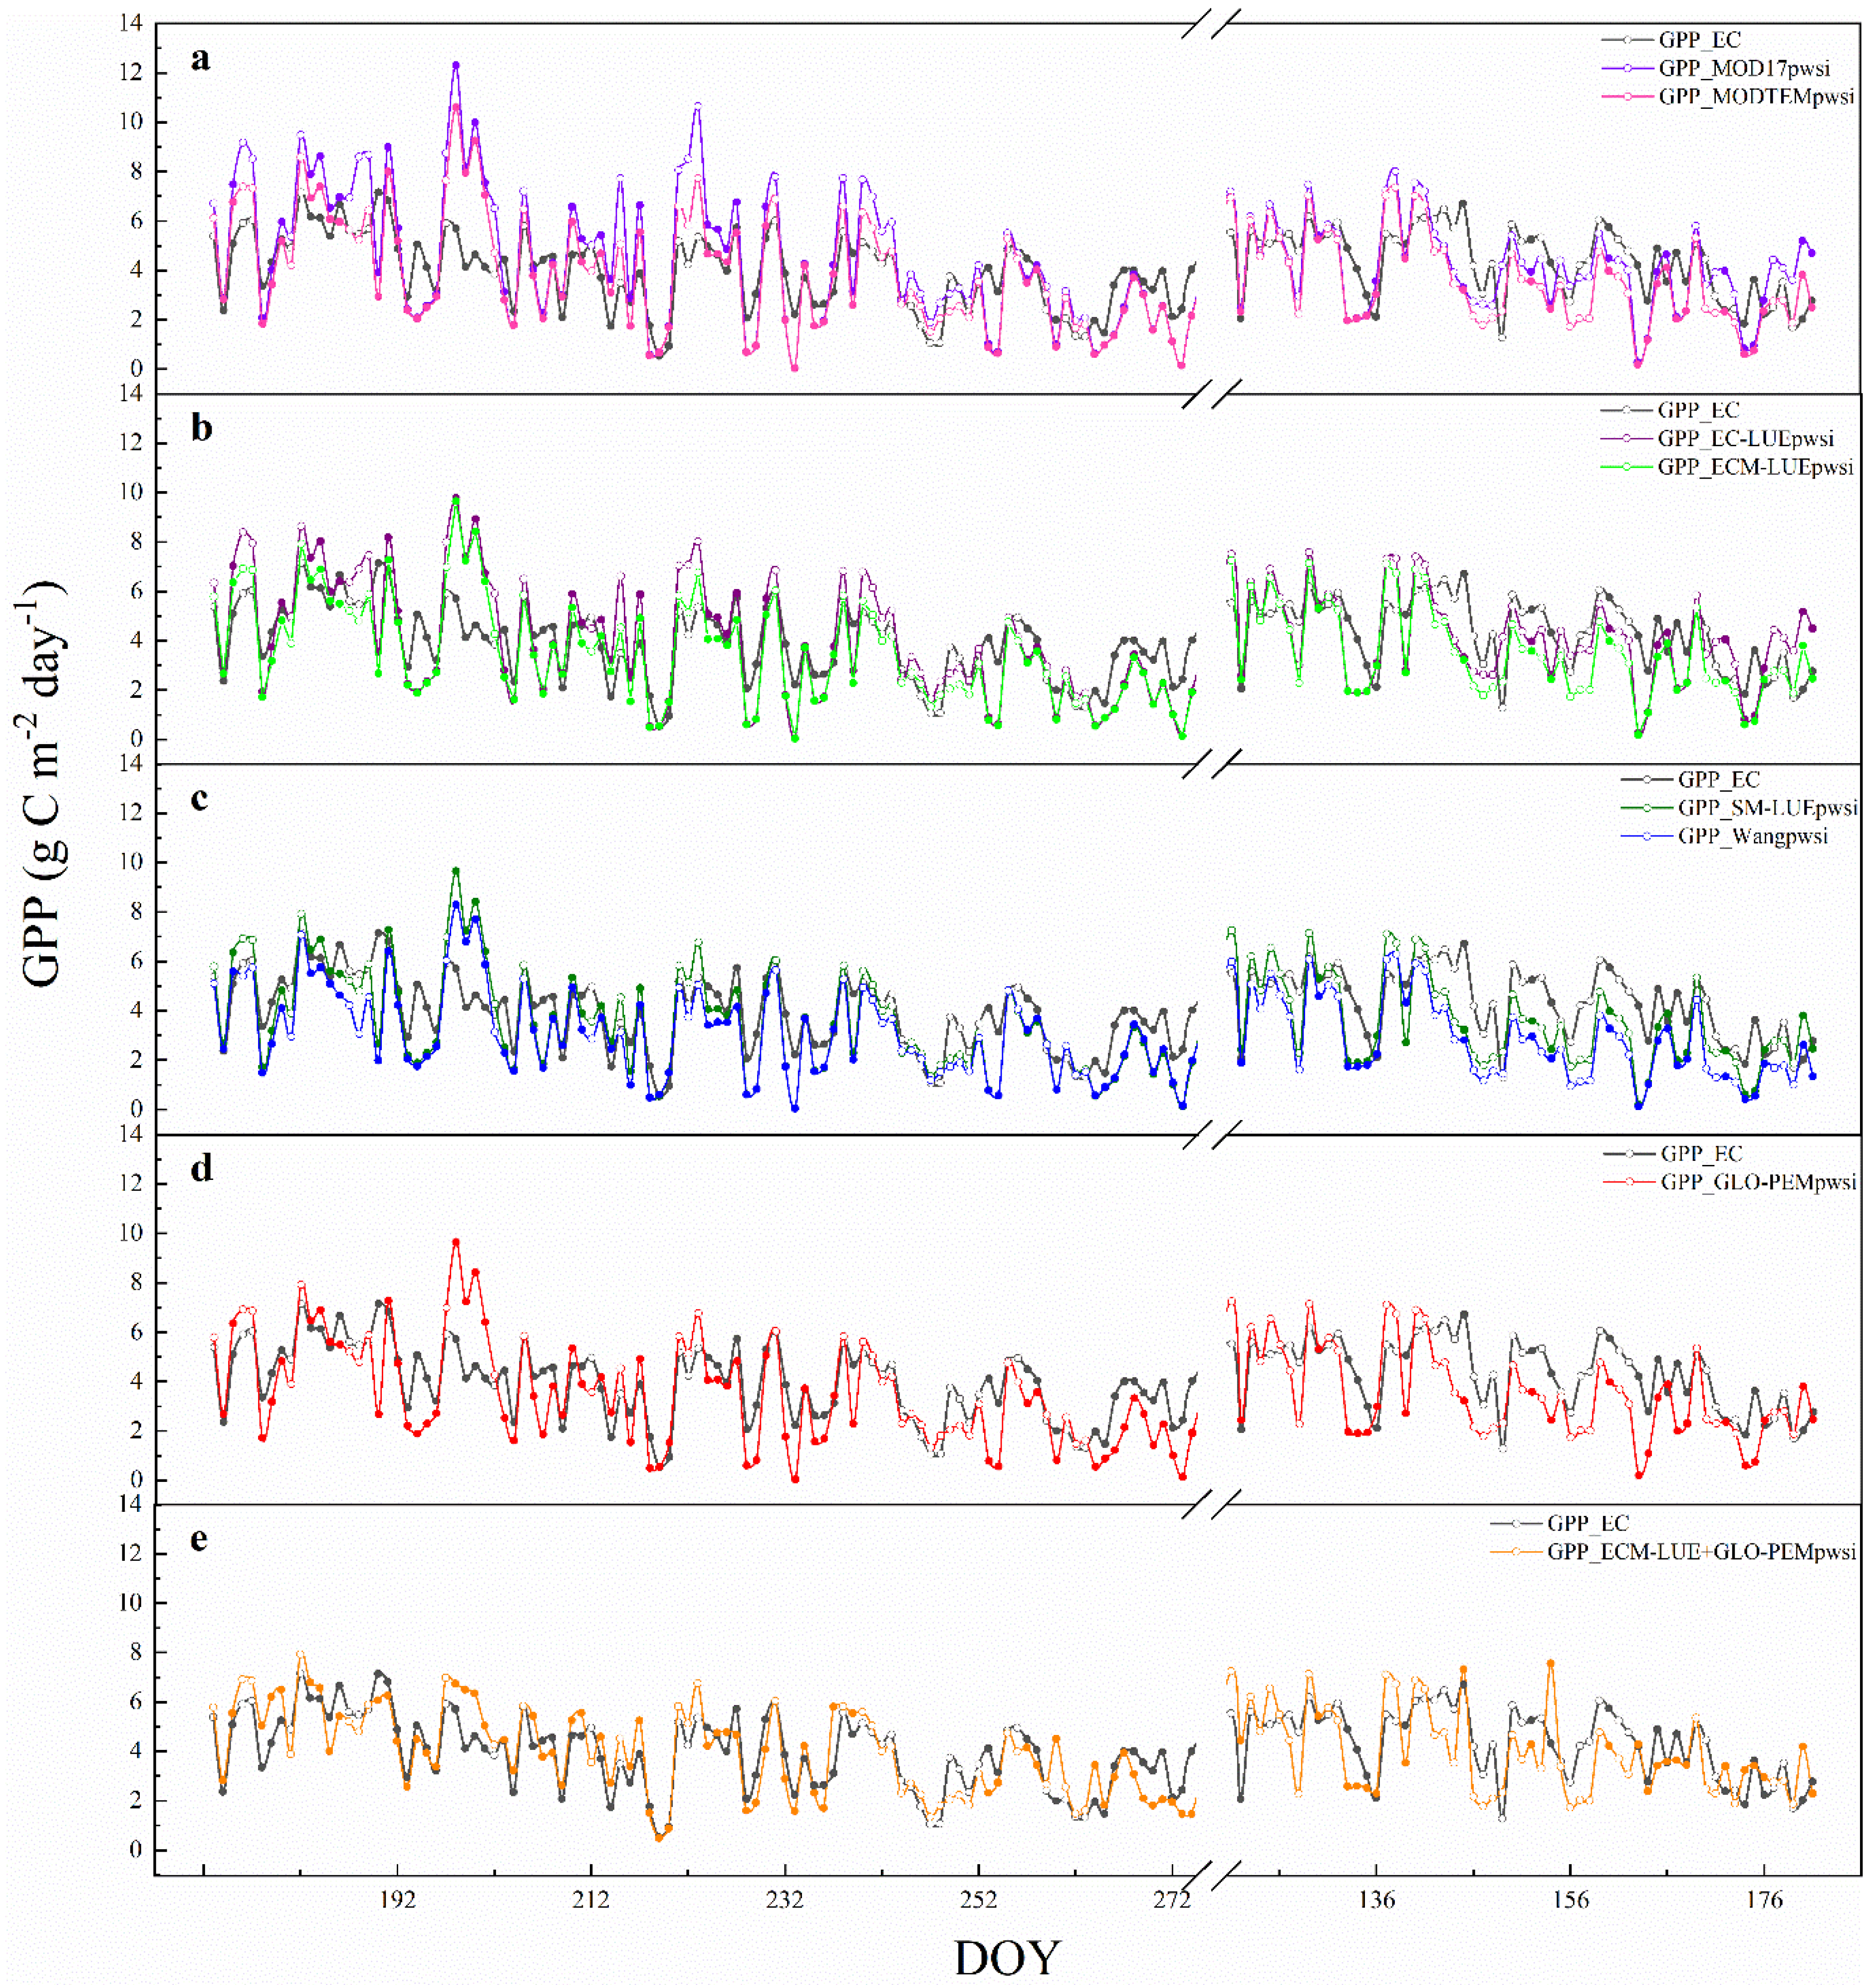
Figure A2. Seasonal variations of gross primary production (GPP) simulated by MOD17pwsi and MODTEMpwsi (a), EC-LUEpwsi and ECM-LUEpwsi (b), SM-LUEpwsi and Wangpwsi (c), GLO-PEMpwsi (d), and ECM-LUE+GLO-PEMpwsi (e) models and observed GPP. ECM-LUE+GLO-PEMpwsi means the combination of ECM-LUE model on cloudy days and the GLO-PEMpwsi model on sunny days. The subscript plant water stress index (PWSI) indicates that PWSI was used to modify the water stress scalar in the LUE model. Solid dots represent cloudy days, and the open circle dots represent sunny days. Data from June–September 2020 and May–June 2021.
Remotesensing 14 05905 g0a2
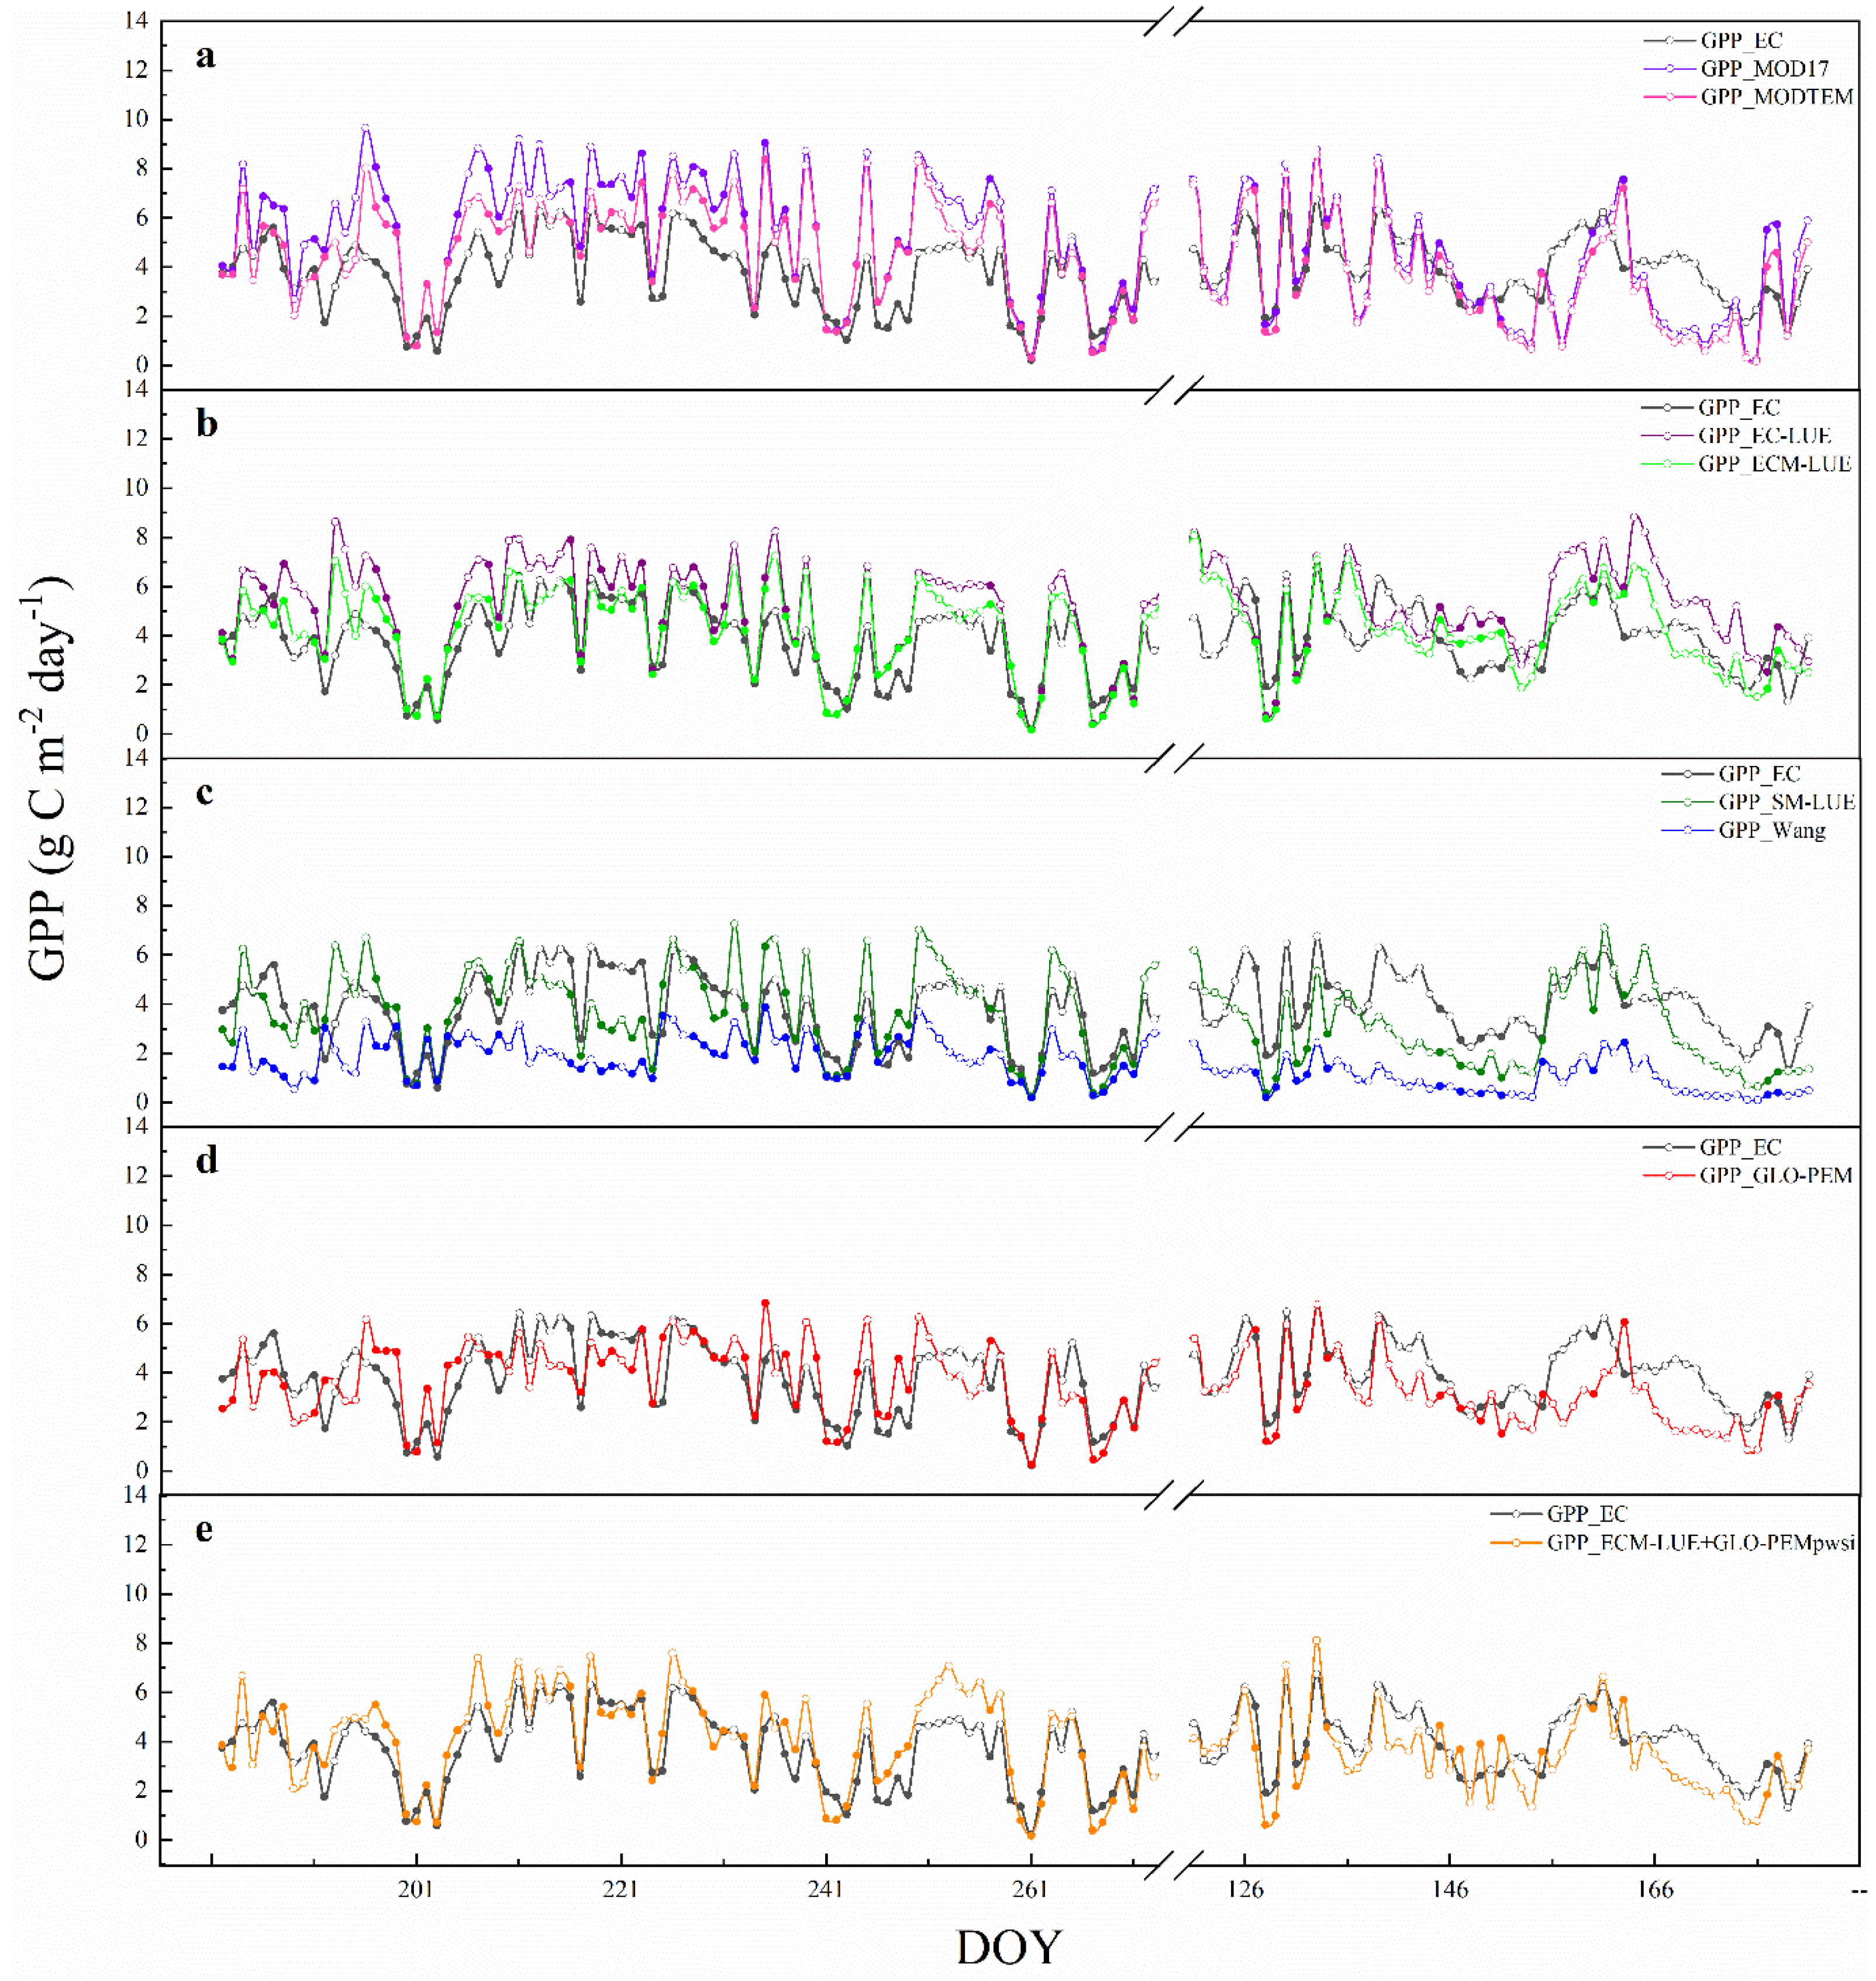
Figure A3. Seasonal variations of gross primary production (GPP) simulated by MOD17 and MODTEM (a), EC-LUE and ECM-LUE (b), SM-LUE and Wang (c), GLO-PEM (d), and ECM-LUE+GLO-PEMpwsi (e) models and observed GPP. ECM-LUE+GLO-PEMpwsi means the combination of ECM-LUE model on cloudy days and the GLO-PEMpwsi model on sunny days. The subscript plant water stress index (PWSI) indicates that PWSI was used to modify the water stress scalar in the LUE model. Data from July–September 2021 and May–June 2022.
Remotesensing 14 05905 g0a3
Figure A4. The relationship between turbulent heat flux (H + LE) and available energy (Rn – G) on sunny days (a) and cloudy days (b) in cork oak plantation. The red line is the fitting curve.
Remotesensing 14 05905 g0a4

References

  1. Trumbore, S.; Brando, P.; Hartmann, H. Forest health and global change. Science 2015, 349, 814–818. [Google Scholar] [CrossRef] [PubMed] [Green Version]
  2. Beer, C.; Reichstein, M.; Tomelleri, E.; Ciais, P.; Jung, M.; Carvalhais, N.; Rödenbeck, C.; Arain, M.A.; Baldocchi, D.; Bonan, G.B. Terrestrial gross carbon dioxide uptake: Global distribution and covariation with climate. Science 2010, 329, 834–838. [Google Scholar] [CrossRef] [PubMed] [Green Version]
  3. Fernández-Martínez, M.; Vicca, S.; Janssens, I.A.; Sardans, J.; Luyssaert, S.; Campioli, M.; Chapin Iii, F.S.; Ciais, P.; Malhi, Y.; Obersteiner, M.; et al. Nutrient availability as the key regulator of global forest carbon balance. Nat. Clim. Chang. 2014, 4, 471–476. [Google Scholar] [CrossRef] [Green Version]
  4. Yao, Y.; Li, Z.; Wang, T.; Chen, A.; Wang, X.; Du, M.; Jia, G.; Li, Y.; Li, H.; Luo, W.; et al. A new estimation of China’s net ecosystem productivity based on eddy covariance measurements and a model tree ensemble approach. Agric. For. Meteorol. 2018, 253–254, 84–93. [Google Scholar] [CrossRef]
  5. Running, S.W.; Nemani, R.R.; Heinsch, F.A.; Zhao, M.; Reeves, M.; Hashimoto, H. A continuous satellite-derived measure of global terrestrial primary production. Bioscience 2004, 54, 547–560. [Google Scholar] [CrossRef]
  6. Yuan, W.; Liu, S.; Zhou, G.; Zhou, G.; Tieszen, L.L.; Baldocchi, D.; Bernhofer, C.; Gholz, H.; Goldstein, A.H.; Goulden, M.L.; et al. Deriving a light use efficiency model from eddy covariance flux data for predicting daily gross primary production across biomes. Agric. For. Meteorol. 2007, 143, 189–207. [Google Scholar] [CrossRef] [Green Version]
  7. Pei, Y.; Dong, J.; Zhang, Y.; Yuan, W.; Doughty, R.; Yang, J.; Zhou, D.; Zhang, L.; Xiao, X. Evolution of light use efficiency models: Improvement, uncertainties, and implications. Agric. For. Meteorol. 2022, 317, 108905. [Google Scholar] [CrossRef]
  8. Monteith, J. Solar radiation and productivity in tropical ecosystems. J. Appl. Ecol. 1972, 9, 747–766. [Google Scholar] [CrossRef] [Green Version]
  9. Yuan, W.; Cai, W.; Xia, J.; Chen, J.; Liu, S.; Dong, W.; Merbold, L.; Law, B.; Arain, A.; Beringer, J.; et al. Global comparison of light use efficiency models for simulating terrestrial vegetation gross primary production based on the LaThuile database. Agric. For. Meteorol. 2014, 192–193, 108–120. [Google Scholar] [CrossRef]
  10. Zheng, Y.; Zhang, L.; Xiao, J.; Yuan, W.; Yan, M.; Li, T.; Zhang, Z. Sources of uncertainty in gross primary productivity simulated by light use efficiency models: Model structure, parameters, input data, and spatial resolution. Agric. For. Meteorol. 2018, 263, 242–257. [Google Scholar] [CrossRef]
  11. Zhang, Y.; Song, C.; Sun, G.; Band, L.E.; Noormets, A.; Zhang, Q. Understanding moisture stress on light use efficiency across terrestrial ecosystems based on global flux and remote-sensing data. J. Geophys. Res. Biogeosci. 2015, 120, 2053–2066. [Google Scholar] [CrossRef]
  12. Zhang, L.; Zhou, D.; Fan, J.; Hu, Z. Comparison of four light use efficiency models for estimating terrestrial gross primary production. Ecol. Model. 2015, 300, 30–39. [Google Scholar] [CrossRef] [Green Version]
  13. Zhang, L.; Zhou, D.; Fan, J.; Guo, Q.; Chen, S.; Wang, R.; Li, Y. Contrasting the Performance of Eight Satellite-Based GPP Models in Water-Limited and Temperature-Limited Grassland Ecosystems. Remote Sens. 2019, 11, 1333. [Google Scholar] [CrossRef] [Green Version]
  14. Biudes, M.S.; Vourlitis, G.L.; Velasque, M.C.S.; Machado, N.G.; de Morais Danelichen, V.H.; Pavao, V.M.; Arruda, P.H.Z.; de Souza Nogueira, J. Gross primary productivity of Brazilian Savanna (Cerrado) estimated by different remote sensing-based models. Agric. For. Meteorol. 2021, 307, 108456. [Google Scholar] [CrossRef]
  15. Gao, D.X.; Wang, S.; Li, Y.; Wang, C.; Wei, F.L.; Fu, B.J.; Li, T. Light use efficiency of vegetation: Model and uncertainty. Acta Ecol. Sin. 2021, 41, 5507–5516. [Google Scholar] [CrossRef]
  16. Idso, S.B.; Jackson, R.D.; Pinter, P.J., Jr.; Reginato, R.J.; Hatfield, J.L. Normalizing the stress-degree-day parameter for environmental variability. Agric. Meteorol. 1981, 24, 45–55. [Google Scholar] [CrossRef]
  17. Jackson, R.D.; Idso, S.B.; Reginato, R.J.; Pinter, P.J., Jr. Canopy temperature as a crop water stress indicator. Water Resour. Res. 1981, 17, 1133–1138. [Google Scholar] [CrossRef]
  18. Bellvert, J.; Marsal, J.; Girona, J.; Gonzalez-Dugo, V.; Fereres, E.; Ustin, S.; Zarco-Tejada, P. Airborne Thermal Imagery to Detect the Seasonal Evolution of Crop Water Status in Peach, Nectarine and Saturn Peach Orchards. Remote Sens. 2016, 8, 39. [Google Scholar] [CrossRef] [Green Version]
  19. Egea, G.; Padilla-Díaz, C.M.; Martinez-Guanter, J.; Fernández, J.E.; Pérez-Ruiz, M. Assessing a crop water stress index derived from aerial thermal imaging and infrared thermometry in super-high density olive orchards. Agric. Water Manag. 2017, 187, 210–221. [Google Scholar] [CrossRef] [Green Version]
  20. Irmak, S.; Haman, D.Z.; Bastug, R. Determination of Crop Water Stress Index for Irrigation Timing and Yield Estimation of Corn. Agron. J. 2000, 92, 1221–1227. [Google Scholar] [CrossRef]
  21. Gerhards, M.; Schlerf, M.; Rascher, U.; Udelhoven, T.; Juszczak, R.; Alberti, G.; Miglietta, F.; Inoue, Y. Analysis of Airborne Optical and Thermal Imagery for Detection of Water Stress Symptoms. Remote Sens. 2018, 10, 1139. [Google Scholar] [CrossRef] [Green Version]
  22. Liu, N.; Deng, Z.; Wang, H.; Luo, Z.; Gutiérrez-Jurado, H.A.; He, X.; Guan, H. Thermal remote sensing of plant water stress in natural ecosystems. For. Ecol. Manag. 2020, 476, 118433. [Google Scholar] [CrossRef]
  23. Li, L.; Nielsen, D.C.; Yu, Q.; Ma, L.; Ahuja, L.R. Evaluating the Crop Water Stress Index and its correlation with latent heat and CO2 fluxes over winter wheat and maize in the North China plain. Agric. Water Manag. 2010, 97, 1146–1155. [Google Scholar] [CrossRef]
  24. Tong, X.; Mu, Y.; Zhang, J.; Meng, P.; Li, J. Water stress controls on carbon flux and water use efficiency in a warm-temperate mixed plantation. J. Hydrol. 2019, 571, 669–678. [Google Scholar] [CrossRef]
  25. Barbagallo, S.; Consoli, S.; Russo, A. A one-layer satellite surface energy balance for estimating evapotranspiration rates and crop water stress indexes. Sensors 2009, 9, 1–21. [Google Scholar] [CrossRef] [Green Version]
  26. Berni, J.A.J.; Zarco-Tejada, P.J.; Sepulcre-Cantó, G.; Fereres, E.; Villalobos, F. Mapping canopy conductance and CWSI in olive orchards using high resolution thermal remote sensing imagery. Remote Sens. Environ. 2009, 113, 2380–2388. [Google Scholar] [CrossRef]
  27. Veysi, S.; Naseri, A.A.; Hamzeh, S.; Bartholomeus, H. A satellite based crop water stress index for irrigation scheduling in sugarcane fields. Agric. Water Manag. 2017, 189, 70–86. [Google Scholar] [CrossRef]
  28. Kanniah, K.D.; Beringer, J.; North, P.; Hutley, L. Control of atmospheric particles on diffuse radiation and terrestrial plant productivity: A review. Progr. Phys. Geogr. 2012, 36, 209–237. [Google Scholar] [CrossRef]
  29. Tong, X.; Zhang, J.; Meng, P.; Li, J.; Zheng, N. Light use efficiency of a warm-temperate mixed plantation in north China. Int. J. Biometeorol. 2017, 61, 1607–1615. [Google Scholar] [CrossRef]
  30. Xiao, X.; Zhang, Q.; Saleska, S.; Hutyra, L.; De Camargo, P.; Wofsy, S.; Frolking, S.; Boles, S.; Keller, M.; Moore, B. Satellite-based modeling of gross primary production in a seasonally moist tropical evergreen forest. Remote Sens. Environ. 2005, 94, 105–122. [Google Scholar] [CrossRef]
  31. Xiao, X.; Zhang, Q.; Braswell, B.; Urbanski, S.; Boles, S.; Wofsy, S.; Moore III, B.; Ojima, D. Modeling gross primary production of temperate deciduous broadleaf forest using satellite images and climate data. Remote Sens. Environ. 2004, 91, 256–270. [Google Scholar] [CrossRef]
  32. Liu, Z. Soil and water conservation survey in China and its application. Sci. Soil Water Conserv. 2013, 11, 1–5. [Google Scholar] [CrossRef]
  33. Liu, L.; Xie, Y.; Gao, X.; Cheng, X.; Huang, H.; Zhang, J. A New Threshold-Based Method for Extracting Canopy Temperature from Thermal Infrared Images of Cork Oak Plantations. Remote Sens. 2021, 13, 5028. [Google Scholar] [CrossRef]
  34. Liu, L.; Gao, X.; Ren, C.; Cheng, X.; Zhou, Y.; Huang, H.; Zhang, J.; Ba, Y. Applicability of the crop water stress index based on canopy–air temperature differences for monitoring water status in a cork oak plantation, northern China. Agric. For. Meteorol. 2022, 327, 109226. [Google Scholar] [CrossRef]
  35. Gu, L.; Fuentes, J.D.; Shugart, H.H.; Staebler, R.M.; Black, T.A. Responses of net ecosystem exchanges of carbon dioxide to changes in cloudiness: Results from two North American deciduous forests. J. Geophys. Res. Atmos. 1999, 104, 31421–31434. [Google Scholar] [CrossRef] [Green Version]
  36. Li, Z.; Zhang, Q.; Li, J.; Yang, X.; Wu, Y.; Zhang, Z.; Wang, S.; Wang, H.; Zhang, Y. Solar-induced chlorophyll fluorescence and its link to canopy photosynthesis in maize from continuous ground measurements. Remote Sens. Environ. 2020, 236, 111420. [Google Scholar] [CrossRef]
  37. Thom, A.S.; Oliver, H.R. On Penman’s equation for estimating regional evaporation. Q. J. R. Meteorol. Soc. 1977, 103, 345–357. [Google Scholar] [CrossRef]
  38. Ye, Z.; Yu, Q. Comparison of a new model of light response of photosynthesis with traditional models. J. Shenyang Agric. Univ. 2007, 38, 771–775. [Google Scholar] [CrossRef]
  39. Prince, S.D.; Goward, S.N. Global primary production: A remote sensing approach. J. Biogeogr. 1995, 22, 815–835. [Google Scholar] [CrossRef]
  40. Wang, S.; Ibrom, A.; Bauer-Gottwein, P.; Garcia, M. Incorporating diffuse radiation into a light use efficiency and evapotranspiration model: An 11-year study in a high latitude deciduous forest. Agric. For. Meteorol. 2018, 248, 479–493. [Google Scholar] [CrossRef]
  41. Wang, Q.; Li, M.W.; Li, Q.; Chen, J.L.; Yang, X.T.; Kou, Y.B.; Zhang, J.S. Drought stress indexes of soil with different texture based on chlorophyll fluorescence parameters of Quercus variabilis seedling. Sci. Soil Water Conserv. 2021, 19, 27–32. [Google Scholar] [CrossRef]
  42. Chen, J.; Song, X.; Wang, Q.; Wang, K.; Zhao, Y. High Temperature Index of PSIIInactivation According to chlorophyll Fluorescence. Chin. J. Agrometeorol. 2013, 34, 563–568. [Google Scholar] [CrossRef]
  43. Sellers, P.; Berry, J.; Collatz, G.; Field, C.; Hall, F. Canopy reflectance, photosynthesis, and transpiration. III. A reanalysis using improved leaf models and a new canopy integration scheme. Remote Sens. Environ. 1992, 42, 187–216. [Google Scholar] [CrossRef]
  44. Cao, M.; Prince, S.D.; Small, J.; Goetz, S.J. Remotely Sensed Interannual Variations and Trends in Terrestrial Net Primary Productivity 1981?2000. Ecosystems 2004, 7, 233–242. [Google Scholar] [CrossRef]
  45. Yang, D.; Xu, X.; Xiao, F.; Xu, C.; Luo, W.; Tao, L. Improving modeling of ecosystem gross primary productivity through re-optimizing temperature restrictions on photosynthesis. Sci. Total Environ. 2021, 788, 147805. [Google Scholar] [CrossRef]
  46. Running, S.W.; Zhao, M. Daily GPP and Annual NPP (MOD17A2/A3) products NASA Earth Observing System MODIS Land Algorithm. MOD17 User’s Guide. 2015. Available online: https://www.ntsg.umt.edu/files/modis/MOD17UsersGuide2015_v3.pdf (accessed on 5 October 2022).
  47. He, M.; Ju, W.; Zhou, Y.; Chen, J.; He, H.; Wang, S.; Wang, H.; Guan, D.; Yan, J.; Li, Y. Development of a two-leaf light use efficiency model for improving the calculation of terrestrial gross primary productivity. Agric. For. Meteorol. 2013, 173, 28–39. [Google Scholar] [CrossRef]
  48. Sims, D.A.; Rahman, A.F.; Cordova, V.D.; Baldocchi, D.D.; Flanagan, L.B.; Goldstein, A.H.; Hollinger, D.Y.; Misson, L.; Monson, R.K.; Schmid, H.P. Midday values of gross CO2 flux and light use efficiency during satellite overpasses can be used to directly estimate eight-day mean flux. Agric. For. Meteorol. 2005, 131, 1–12. [Google Scholar] [CrossRef]
  49. Veroustraete, F.; Sabbe, H.; Eerens, H. Estimation of carbon mass fluxes over Europe using the C-Fix model and Euroflux data. Remote Sens. Environ. 2002, 83, 376–399. [Google Scholar] [CrossRef]
  50. Zhou, Y.; Wu, X.; Ju, W.; Chen, J.M.; Wang, S.; Wang, H.; Yuan, W.; Andrew Black, T.; Jassal, R.; Ibrom, A. Global parameterization and validation of a two-leaf light use efficiency model for predicting gross primary production across FLUXNET sites. J. Geophys. Res. Biogeosci. 2016, 121, 1045–1072. [Google Scholar] [CrossRef]
  51. Keenan, T.; Baker, I.; Barr, A.; Ciais, P.; Davis, K.; Dietze, M.; Dragoni, D.; Gough, C.M.; Grant, R.; Hollinger, D. Terrestrial biosphere model performance for inter-annual variability of land-atmosphere CO2 exchange. Glob. Change Biol. 2012, 18, 1971–1987. [Google Scholar] [CrossRef]
  52. Raczka, B.M.; Davis, K.J.; Huntzinger, D.; Neilson, R.P.; Poulter, B.; Richardson, A.D.; Xiao, J.; Baker, I.; Ciais, P.; Keenan, T.F. Evaluation of continental carbon cycle simulations with North American flux tower observations. Ecol. Monogr. 2013, 83, 531–556. [Google Scholar] [CrossRef] [Green Version]
  53. Churkina, G.; Running, S.W.; Schloss, A.L.; Intercomparison, T.P.O.T.P.N.M. Comparing global models of terrestrial net primary productivity (NPP): The importance of water availability. Glob. Change Biol. 1999, 5, 46–55. [Google Scholar] [CrossRef]
  54. Bassow, S.; Bazzaz, F. How environmental conditions affect canopy leaf-level photosynthesis in four deciduous tree species. Ecology 1998, 79, 2660–2675. [Google Scholar] [CrossRef]
  55. Cheng, X.F.; Zhou, Y.; Hu, M.J.; Wang, F.; Huang, H.; Zhang, J.S. The Links between Canopy Solar-Induced Chlorophyll Fluorescence and Gross Primary Production Responses to Meteorological Factors in the Growing Season in Deciduous Broadleaf Forest. Remote Sens. 2021, 13, 2363. [Google Scholar] [CrossRef]
  56. Samanta, A.; Costa, M.H.; Nunes, E.L.; Vieira, S.A.; Xu, L.; Myneni, R.B. Comment on “Drought-Induced Reduction in Global Terrestrial Net Primary Production from 2000 Through 2009”. Science 2011, 333, 1093. [Google Scholar] [CrossRef] [Green Version]
  57. Hashimoto, H.; Wang, W.; Milesi, C.; Xiong, J.; Ganguly, S.; Zhu, Z.; Nemani, R.R. Structural uncertainty in model-simulated trends of global gross primary production. Remote Sens. 2013, 5, 1258–1273. [Google Scholar] [CrossRef] [Green Version]
  58. Sims, D.A.; Brzostek, E.R.; Rahman, A.F.; Dragoni, D.; Phillips, R.P. An improved approach for remotely sensing water stress impacts on forest C uptake. Glob. Change Biol. 2014, 20, 2856–2866. [Google Scholar] [CrossRef]
  59. Canadell, J.; Jackson, R.; Ehleringer, J.; Mooney, H.; Sala, O.; Schulze, E.-D. Maximum rooting depth of vegetation types at the global scale. Oecologia 1996, 108, 583–595. [Google Scholar] [CrossRef]
  60. Schenk, H.J.; Jackson, R.B. The global biogeography of roots. Ecol. Monogr. 2002, 72, 311–328. [Google Scholar] [CrossRef]
  61. Yuan, W.; Zheng, Y.; Piao, S.; Ciais, P.; Lombardozzi, D.; Wang, Y.; Ryu, Y.; Chen, G.; Dong, W.; Hu, Z. Increased atmospheric vapor pressure deficit reduces global vegetation growth. Sci. Adv. 2019, 5, eaax1396. [Google Scholar] [CrossRef]
  62. Ma, M.; Yuan, W. Differences in Gross Primary Production on the Qinghai-Tibet Plateau. Remote Sens. Technol. Appl. 2017, 32, 406–418. [Google Scholar] [CrossRef]
  63. Wu, X.; Ju, W.; Zhou, Y.; He, M.; Law, B.E.; Black, T.A.; Margolis, H.A.; Cescatti, A.; Gu, L.; Montagnani, L. Performance of linear and nonlinear two-leaf light use efficiency models at different temporal scales. Remote Sens. 2015, 7, 2238–2278. [Google Scholar] [CrossRef] [Green Version]
  64. Mu, Q.; Zhao, M.; Heinsch, F.A.; Liu, M.; Tian, H.; Running, S.W. Evaluating water stress controls on primary production in biogeochemical and remote sensing based models. J. Geophys. Res. 2007, 112. [Google Scholar] [CrossRef] [Green Version]
  65. Zanotelli, D.; Montagnani, L.; Andreotti, C.; Tagliavini, M. Evapotranspiration and crop coefficient patterns of an apple orchard in a sub-humid environment. Agric. Water Manag. 2019, 226, 105756. [Google Scholar] [CrossRef]
  66. Tong, X.; Meng, P.; Zhang, J.; Li, J.; Zheng, N.; Huang, H. Ecosystem carbon exchange over a warm-temperate mixed plantation in the lithoid hilly area of the North China. Atmos. Environ. 2012, 49, 257–267. [Google Scholar] [CrossRef]
  67. Xu, X.; Cheng, Y.; Zhu, D. Simulation of Gross Primary Productivity of Moso Bamboo Forest under Drought Stress based on A Light Use Efficiency Model. Acta Agric. Univ. Jiangxiensis 2019, 41, 512–520. [Google Scholar] [CrossRef]
  68. Maki, M.; Ishiahra, M.; Tamura, M. Estimation of leaf water status to monitor the risk of forest fires by using remotely sensed data. Remote Sens. Environ. 2004, 90, 441–450. [Google Scholar] [CrossRef]
  69. Xiao, J.; Zhuang, Q.; Law, B.E.; Chen, J.; Baldocchi, D.D.; Cook, D.R.; Oren, R.; Richardson, A.D.; Wharton, S.; Ma, S. A continuous measure of gross primary production for the conterminous United States derived from MODIS and AmeriFlux data. Remote Sens. Environ. 2010, 114, 576–591. [Google Scholar] [CrossRef] [Green Version]
  70. Gao, B.-C. NDWI—A normalized difference water index for remote sensing of vegetation liquid water from space. Remote Sens. Environ. 1996, 58, 257–266. [Google Scholar] [CrossRef]
  71. Jones, H.G. Use of infrared thermometry for estimation of stomatal conductance as a possible aid to irrigation scheduling. Agric. For. Meteorol. 1999, 95, 139–149. [Google Scholar] [CrossRef]
  72. Gautam, D.; Pagay, V. A Review of Current and Potential Applications of Remote Sensing to Study the Water Status of Horticultural Crops. Agronomy 2020, 10, 140. [Google Scholar] [CrossRef] [Green Version]
  73. Gardner, B.R.; Nielsen, D.C.; Shock, C.C. Infrared Thermometry and the Crop Water Stress Index. II. Sampling Procedures and Interpretation. J. Prod. Agric. 1992, 5, 466–475. [Google Scholar] [CrossRef]
  74. Xu, Z.Z.; Zhou, G.S. Effects of water stress and nocturnal temperature on carbon allocation in the perennial grass, Leymus chinensis. Physiol. Plant. 2005, 123, 272–280. [Google Scholar] [CrossRef]
  75. Wang, G.; Zhang, X.; Li, F.; Luo, Y.; Wang, W. Overaccumulation of glycine betaine enhances tolerance to drought and heat stress in wheat leaves in the protection of photosynthesis. Photosynthetica 2010, 48, 117–126. [Google Scholar] [CrossRef]
  76. Pradhan, G.P.; Prasad, P.V.; Fritz, A.K.; Kirkham, M.B.; Gill, B.S. Effects of drought and high temperature stress on synthetic hexaploid wheat. Funct. Plant Biol. 2012, 39, 190–198. [Google Scholar] [CrossRef]
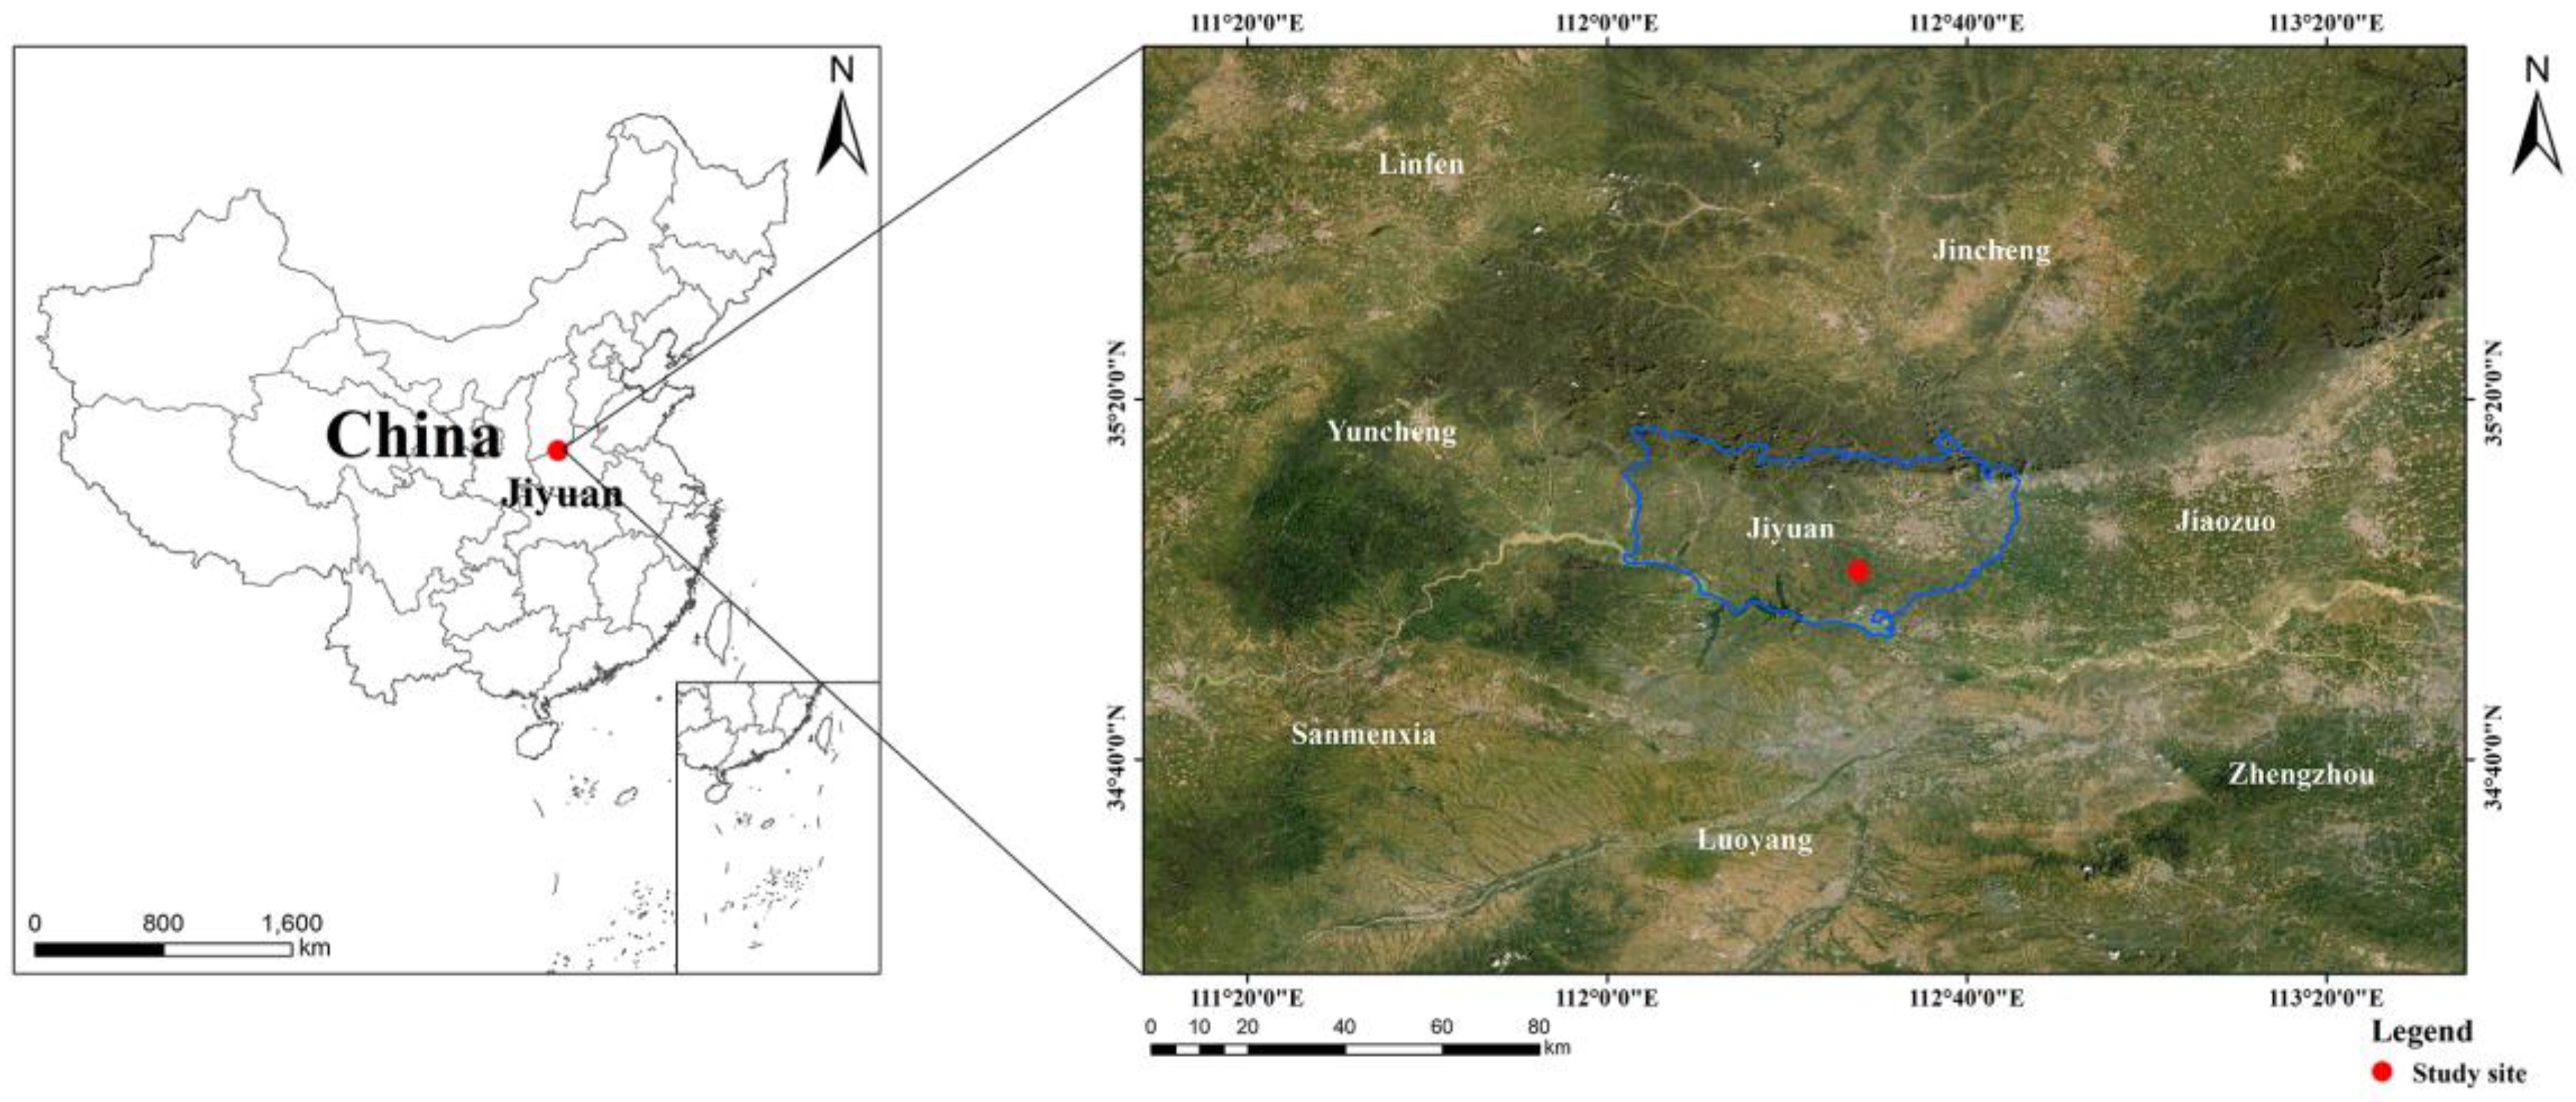
Figure 1. The location of the experimental site. This picture is from Liu et al. [33].
Remotesensing 14 05905 g001
Figure 2. Photosynthesis light-response curve of cork oak plantation on sunny (a) and cloudy (b) days. The bule line is the slope curve of the utilization of the light energy. The red line is the fitting curve.
Remotesensing 14 05905 g002
Figure 3. The relationship between the fraction of incident photosynthetically active radiation absorbed by vegetation canopies (FPAR) and the leaf area index (LAI) (a) and the normalized difference vegetation index (NDVI) (b). The red line is the fitting curve.
Remotesensing 14 05905 g003
Figure 4. Seasonal variations of monthly gross primary productivity (GPP) (a), monthly photosynthetically active radiation (PAR) (b), monthly mean fraction of PAR absorbed by the canopy (FPAR) (c), leaf area index (LAI) (d), normalized difference vegetation index (NDVI) (e), turbulent heat flux (H + LE) and available energy (Rn – G) (f), soil water content (SWC) (g), vapor pressure deficit (VPD) (h), air temperature (Ta) (i), plant water stress index (PWSI) (j), and evaporative fraction (EF) (k) during the period of canopy closure in 2020–2022.
Remotesensing 14 05905 g004
Figure 5. The ratio of gross primary production (GPP) that was simulated by considering only water (GPPwat, (a)) or temperature (GPPtem, (b)) stress scalars in light use efficiency (LUE) models to estimate potential GPP (PGPP).
Remotesensing 14 05905 g005
Figure 6. Comparison of daily gross primary production (GPP) simulated by MOD17 (a,b), MODTEM (c,d), EC-LUE (e,f), ECM-LUE (g,h), SM-LUE (i,j), GLO-PEM (k,l), and Wang (m,n) models versus observed GPP on sunny days and cloudy days. Solid dots represent cloudy days, and the open circle dots represent sunny days. Data from June–September 2020 and May–June 2021. The red line is the fitting curve.
Remotesensing 14 05905 g006
Figure 7. Comparison of daily gross primary production (GPP) simulated by MOD17pwsi (a,b), MODTEMpwsi (c,d), EC-LUEpwsi (e,f), ECM-LUEpwsi (g,h), SM-LUEpwsi (i,j), GLO-PEMpwsi (k,l), and Wangpwsi (m,n) models versus observed GPP on cloudy days. The subscript plant water stress index (PWSI) indicates that PWSI was used to modify the water stress scalar in the LUE model. Solid dots represent cloudy days, and the open circle dots represent sunny days. Data from June–September 2020 and May–June 2021. The red line is the fitting curve.
Remotesensing 14 05905 g007
Figure 8. Comparison of daily gross primary production (GPP) simulated by MOD17 (a), MODTEM (b), EC-LUE (c), ECM-LUE (d), SM-LUE (e), GLO-PEM (f), Wang (g), and ECM-LUE+GLO-PEMpwsi (h) models versus observed GPP. ECM-LUE+GLO-PEMpwsi means the combination of ECM-LUE model on cloudy days and the GLO-PEMpwsi model on sunny days. Solid dots represent cloudy days, and the open circle dots represent sunny days. The subscript plant water stress index (PWSI) indicates that PWSI was used to modify the water stress scalar in the LUE model. Data from July–September 2021 and May–June 2022. The red line is the fitting curve.
Remotesensing 14 05905 g008
Table 1. The inputs of each LUE model.
Model NameLight Absorption (APAR = FPAR*PAR)Water Scalar (Ws)Temperature Scalar (Ts)Reference
MOD17FPAR = 1 − exp(−k*LAI)Ws = 0 (VPD ≥ VPDmax), or (VPDmax − VPD)/(VPDmax − VPDmin) (VPDmin < VPD < VPDmax), or
1 (VPD ≤ VPDmin)
Ts = 0 (Tamin ≤ Tamin_min), or
(Tamin − Tamin_min)/(Tamin_max − Tamin_min) (Tamin_min < Tamin < Tamin_max), or
1 (Tamin ≥ Tamin_max)
[5]
EC-LUEFPAR = a*NDVI − bWs = EF = LE/(H + LE)Ts = ((Ta − Tmin)*(Ta − Tmax))/((Ta − Tmin)*(Ta − Tmax) − (Ta − Topt)2)[6]
SM-LUEFPAR = a*NDVI − bWs = 0 (SWC ≤ SWCmin), or (SWC − SWCmin)/(SWCmax − SWCmin) (SWCmin < SWC < SWCmax), or
1 (SWC ≥ SWCmax)
Ts = ((Ta − Tmin)*(Ta − Tmax))/((Ta − Tmin)*(Ta − Tmax) − (Ta − Topt)2)This study
GLO-PEMFPAR = a*NDVI − bWs = Ws1*Ws2
Ws1 = 1 − 0.05SHD (0 < SHD < 15), or 0.25 (SHD > 15)
Ws2 = 1 − exp(0.4219*(ΔSWC − 210.6347))
Ts = ((Ta − Tmin)*(Ta − Tmax))/((Ta − Tmin)*(Ta − Tmax) − (Ta − Topt)2)[7,39]
WangAPAR = (PAR − PARs)*fg
PARs = PAR*exp(−k*LAI/cos(SZA))
fg = fAPAR/fIPAR
Ws = Ws1*Ws2*Ws3
Ws1 = 1/(1 + VPD/1.5)
Ws2 = (SWC − SWCmin)/(SWCmax − SWCmin)
Ws3 = fAPAR/max(fAPAR)
Ts = 1.1814/((1 + exp(0.2*(Topt − 10 − Ta))*(1 + exp(0.3*(Ta − Topt − 10)))[40]
ECM-LUEFPAR = a*NDVI − bWs = EF = LE/(H + LE)Ts = ((Ta − Tmin)*(Ta − Tmax))/((Ta − Tmin)*(Ta − Tmax) − (Ta − Topt)2)This study
MODTEMFPAR = 1 − exp(−k*LAI)Ws = 0 (VPD ≥ VPDmax), or (VPDmax − VPD)/(VPDmax − VPDmin) (VPDmin < VPD < VPDmax), or
1 (VPD ≤ VPDmin)
Ts = ((Ta − Tmin)*(Ta − Tmax))/((Ta − Tmin)*(Ta − Tmax) − (Ta − Topt)2)This study
FPAR is the fraction of incident photosynthetically active radiation absorbed by the canopy (W m−2), APAR is the photosynthetically active radiation absorbed by the canopy (W m−2), PAR is the incident photosynthetically active radiation (W m−2), PARs is the PAR absorbed by the soil (W m−2), LAI is the leaf area index, k is the light extinction coefficient, SZA is the sun zenith angle, fg is the green canopy fraction, fAPAR is the fraction of PAR absorbed by green vegetation cover, fIPAR is the fraction of PAR intercepted by the total vegetation cover, a and b are the coefficients, NDVI is the normalized difference vegetation index, EF is the evaporative fraction, LE is the latent heat flux (W m−2), H is the sensible heat flux (W m−2), SHD is the specific humidity deficit (g kg−1). VPD is the vapor pressure deficit (kPa), VPDmax is the daylight average VPD when the actual LUE equals 0 (kPa), VPDmin is the daylight average VPD when the actual LUE equals LUEmax (kPa), SWC is the soil water content, ΔSWC is the difference between saturated water content and actual water content in the top 1 m of soil (mm), SWCmax is the soil water content at field capacity, SWCmin is the soil water content at the wilting point, Tamin is the daily minimum temperature (°C), Tamin_min is the daily Tamin when the actual LUE equals 0 (°C), and Tamin_max is the daily Tamin when the actual LUE equals LUEmax (°C), Ta is the air temperature (°C). Tmin, Tmax, and Topt are the minimum, maximum, and optimum air temperatures for photosynthetic activity, respectively (°C).
Publisher’s Note: MDPI stays neutral with regard to jurisdictional claims in published maps and institutional affiliations.