Article

Comprehensive Analysis of PERSIANN Products in Studying the Precipitation Variations over Luzon

Department of Earth Sciences, National Taiwan Normal University, Taipei 11677, Taiwan
*
Author to whom correspondence should be addressed.
Remote Sens. 2022, 14(22), 5900; https://doi.org/10.3390/rs14225900
Submission received: 7 October 2022 / Revised: 10 November 2022 / Accepted: 18 November 2022 / Published: 21 November 2022
(This article belongs to the Special Issue Remote Sensing of Precipitation: Part III)

Abstract

:
This study evaluated the capability of satellite precipitation estimates from five products derived from Precipitation Estimation from Remotely Sensed Information using Artificial Neural Networks (including PERSIANN, PERSIANN-CCS, PERSIANN-CDR, PERSIANN-CCS-CDR, and PDIR-Now) to represent precipitation characteristics over Luzon. The analyses focused on monthly and daily timescales from 2003–2015 and adopted surface observations from the Asian Precipitation Highly Resolved Observational Data Integration Towards Evaluation of Water Resources (APHRODITE) platform as the evaluation base. Among the five satellite precipitation products (SPPs), PERSIANN-CDR was observed to possess a better ability to qualitatively and quantitatively estimate spatiotemporal variations of precipitation over Luzon for the majority of the examined features with the exception of the extreme precipitation events, for which PERSIANN-CCS-CDR is superior to the other SPPs. These results highlight the usefulness of the addition of the cloud patch approach to PERSIANN-CDR to produce PERSIANN-CCS-CDR to depict the characteristics of extreme precipitation events over Luzon. A similar advantage of adopting the cloud patch approach in producing extreme precipitation estimates was also revealed from the comparison of PERSIANN, PERSIANN-CCS, and PDIR-Now. Our analyses also highlighted that all PERSIANN-series exhibit improved skills in regard to detecting precipitation characteristics over west Luzon compared to that over east Luzon. To overcome this weakness, we suggest that an adjustment in the cloud patch approach (e.g., using different cloud temperature thresholds or different brightness temperature and precipitation rate relationships) over east Luzon may be helpful.

Graphical Abstract

1. Introduction

Precipitation is an important component of the hydrological cycle, and thus monitoring changes in precipitation with high spatiotemporal coverage is helpful with regard to water management. To examine the hydrological cycle in various regions, satellite precipitation products (SPPs) have been frequently utilized in previous studies [1,2], primarily due to the wider spatial coverage of SPPs compared to that of other types of observations (e.g., rain gauges or radar observations). The capability of SPPs may depend upon the topography and precipitation type [3,4]. Therefore, various studies have evaluated the performance of SPPs over regions with complex terrain exhibiting precipitation variations at multiple timescales [5,6]. Luzon, the largest island of the Philippines (Figure 1), is characterized by complex terrain and is regulated by seasonal wind circulation changes. According to Flores and Balagot [7], there are various climate types in the Philippines that exhibit significant wet and dry seasons in different sub-regions of Luzon. These specific conditions cause Luzon to possess various climatic features, and thus it is suitable for examining the performance of SPPs in this region.
Recently, a group of SPPs has been developed by the Center for Hydrometeorology and Remote Sensing (CHRS) using artificial neural network (ANN) methods, and these have been termed as Precipitation Estimation from Remotely Sensed Information using ANN (PERSIANN) series (hereafter PERSIANN-series) products. The PERSIANN-series products provide five different SPPs, including PERSIANN, PERSIANN-CCS, PERSIANN-CDR, PERSIANN-CCS-CDR, and PDIR-Now (hereafter PANN, PCCS, PCDR, PCCSCDR, and PDIR for short). Certain SPPs have been developed using the cloud patch approach during the production procedure, while others do not use this approach (Table 1). The cloud patch approach classifies each cloud image into various cloud groups and then establishes the brightness temperature to precipitation rate (Tb–R) relationship [8]. Considering that the five SPPs of the PERSIANN-series exhibit differences in spatiotemporal resolutions and algorithms (Table 1) that imply differences in their ability to depict precipitation changes, it is important to make an inter-comparison among the five SPPs to aid in understanding the disadvantages and advantages of these SPPs.
The performance of the five SPPs from the PERSIANN-series were examined in the context of previous studies [9,10,11] for various regions. For example, [10] reported that PCDR was better than PANN and PCCS in precipitation estimation over Iran during the period from 2003–2015 based on annual, seasonal, and monthly timescales. PCDR is also better than PANN with regard to estimating summer precipitation over Australia [11]. By contrast, Huang et al. [3] observed that PCCSCDR and PDIR yielded better qualitative and quantitative estimates than PCDR, PCCS, and PANN did with regard to capturing May to October precipitation over Taiwan during the 2003–2019 time period. Clearly, the question of which PERSIANN-series products is more suitable for precipitation analysis is location dependent. The performance characteristics of PERSIANN-series products over Luzon, including PANN, PCDR, and PCCS, were examined by Ramos et al. [12], Peralta et al. [13], and Aryastana et al. [14], respectively. However, none of these studies examined the five SPPs of the PERSIANN-series all together over Luzon. Therefore, it is not possible to determine from these studies which one of the five SPPs of the PERSIANN-series is more capable of estimating precipitation over Luzon.
In contrast to the studies mentioned above, this study aimed to examine the capability of all five SPPs of the PERSIANN-series with regard to depicting the monthly and daily variations of precipitation over Luzon. The characteristics of precipitation changes in both frequency and intensity were examined. Additionally, we aimed to clarify if the applications of the cloud patch approach in PERSIANN-series products affected the performance of SPPs in Luzon. It should be noted that even though Luzon is near Taiwan, precipitation and orographic features differ between Luzon and Taiwan [15,16]. Therefore, it is possible that the findings of this study examining Luzon will be very different compared to the results of Huang et al. [3] for Taiwan. Indeed, this will be shown in later examinations, thus adding value to the results of this study. The remainder of this paper is organized as follows: the data and methodology are presented in Section 2; the analysis of features at multiple timescales (climatological, monthly, and daily) is presented in Section 3; and Section 4 summarizes the conclusions and discusses the possible causes for determining the performance of SPPs.

2. Data and Methodology

2.1. Data

The spatiotemporal resolution, latency, and available time periods for all the precipitation datasets are listed in Table 1. The reference base for evaluation used the gridded gauge observations from the V1901 version of Asian Precipitation Highly Resolved Observational Data Integration Towards Evaluation of Water Resources (APHRODITE, hereinafter APHRO for short) that is accessible at https://www.chikyu.ac.jp/precip/ (accessed on 23 May 2022). APHRO is a well-known gridded surface precipitation dataset that has been widely used to validate SPPs worldwide [17]. It is established that APHRO can accurately represent the precipitation characteristics over the Philippines [13]. Therefore, the APHRO is defined as ground-based observation in this study. Detailed information regarding APHRO can be found in Yatagai et al. [18].
The five SPPs of the PERSIANN-series analyzed in this study were provided by the CHRS Data Portal (http://chrsdata.eng.uci.edu/ (accessed on 23 May 2022)). Information regarding the algorithms of the five SPPs is documented below. The PANN is an ANN model developed by the University of Arizona that uses longwave geostationary meteorological satellite infrared (IR) imagery, microwave satellite imagery, and daytime visible imagery as the input data for the algorithm [19]. Compared to the PANN, the PCCS algorithm uses different temperature thresholds for the IR cloud images [8]. An additional cloud patch approach is applied in the PCCS that extracts coldness, size, geometry, and texture features from the cloud coverage under a specific temperature threshold. Conversely, PCDR [20] also uses the PANN algorithm; however, the input data are from gridded satellite IR data (GridSat-B1). No cloud patch approach has been applied in the PCDR. Instead, the quantitative estimates bias of PCDR is adjusted using the GPCP monthly precipitation product at a 2.5° × 2.5° spatial scale [21].
The PCCSCDR generates the precipitation rate outputs of the PCCS model with IR input data from two different sources, including GridSat-B1 (from 1983 to February 2000) and the NOAA Climate Prediction Center global merged IR data (from March 2000 to the present) [22]. Then, the PCCSCDR monthly precipitation rate is matched to the GPCP monthly precipitation product at a 2.5° × 2.5° spatial scale. The PDIR [23] was generated based on the operational implementation of the PDIR algorithm that dynamically shifts cloud top Tb–R curves using climatological data to adjust the precipitation rate. For global land, PDIR uses WorldClim 2 [24] as the precipitation climatology to adjust the Tb–R relationships. In contrast, for the global ocean, PDIR uses PCDR as the precipitation climatology to create a dynamic Tb–R curve model.
Moreover, to depict the wind circulation change we used 925 hPa wind fields with 0.25° × 0.25° spatial resolution from the 5th generation European Centre for Medium-Range Weather Forecasts (ECMWF) Reanalysis data (ERA5) [25]. Earlier studies [26] have demonstrated that these data can illustrate well the relationship between precipitation formation and atmospheric circulation changes.

2.2. Methods

In this study, all SPPs with different spatiotemporal resolutions are converted into the same daily and a 0.25° × 0.25° spatial scale by using the box averaging for all analyses. For evaluation, we focused on the overlap period between APHRO and the five SPPs of the PERISANN-series, and this time period occurred from January 2003 to December 2015 (Table 1). Statistical analysis was performed using the correlation coefficient (CC) and root mean square error (RMSE) that can be calculated using Equations (1) and (2), respectively [27]:
CC   = i = 1 N ( SPP i SPP ¯ ) ( APHRO i APHRO ¯ ) i = 1 N ( SPP i SPP ¯ ) 2 i = 1 N ( APHRO i APHRO ¯ ) 2  
RMSE   = i = 1 N ( SPP i APHRO i ) 2 N 1  
In these two equations, N represents the sample size, SPP ¯ ( APHRO ¯ ) is the average value of SPP (APHRO) from all the samples, and SPPi (APHROi) represents each specific sample of SPP (APHRO). A higher CC value indicates a better performance in the qualitative illustration of variation. A lower value of RMSE indicates a better performance in the quantitative estimation of precipitation magnitude.
Additionally, two skill scores that were frequently used to evaluate SPPs, including the probability of detection (POD) and false alarm ratio (FAR), were calculated using Equations (3) and (4), respectively [27]:
POD = hits hits   +   misses  
FAR =   false   alarms hits   +   false   alarms
As listed in the 2 × 2 contingency table (Table 2), “hits” indicate that the rainy events with daily precipitation > selected threshold occurred in both APHRO and SPP. “False alarms” indicate that the rainy events with daily precipitation > the selected threshold that are observed by SPP are absent in APHRO. “Misses” indicate that the rainy events with daily precipitation > selected threshold that observed by APHRO are absented in SPP. The perfect POD and FAR values were 1 and 0, respectively.

3. Results

3.1. Climatological and Monthly Features

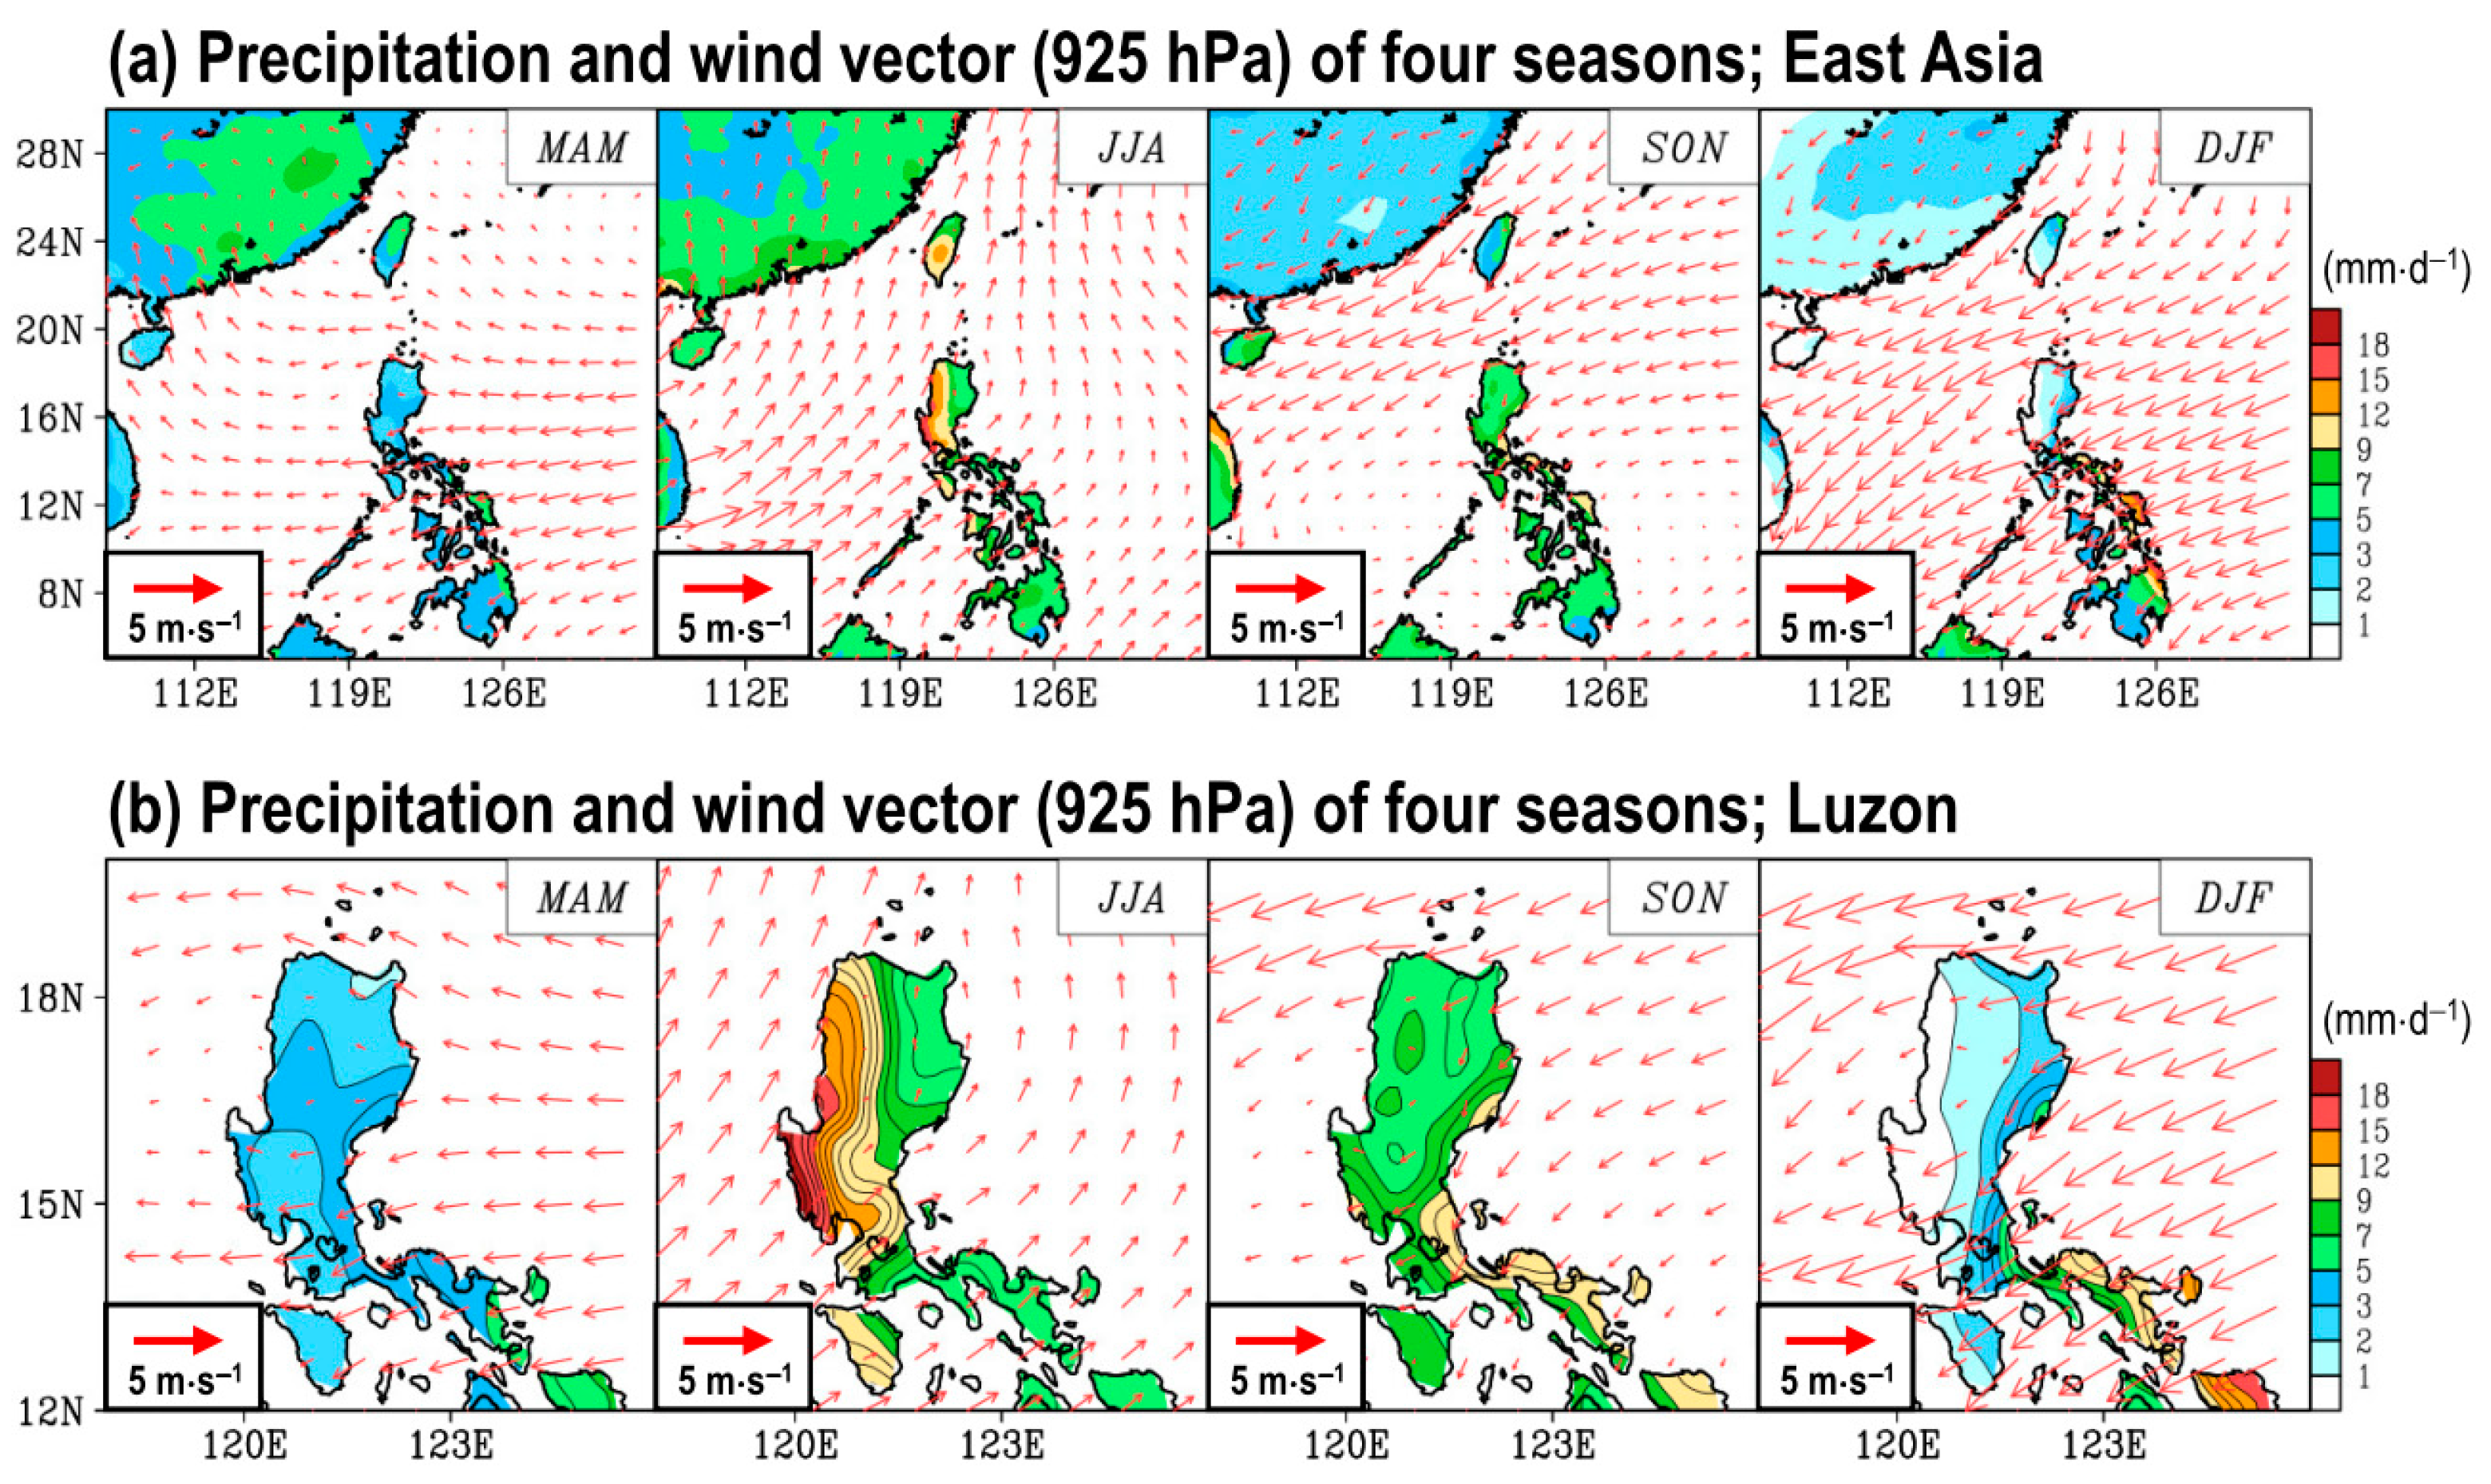
In this subsection, the climatological and monthly features were estimated by averaging data from January 2003 to December 2015. Figure 2 presents the spatial distribution of seasonal mean precipitation observed by APHRO and the associated low-level atmospheric circulation at 925-hPa that was extracted from the ERA5 reanalysis for the two selected domains. Over East Asia (Figure 2a), including Luzon (Figure 2b), large-scale circulation is characterized by prevailing southwesterly winds in summer (June to August, or JJA), northeasterly winds in winter (December to February, or DJF), and two transition seasons that include spring (March to May, or MAM) and autumn (September to November, or SON) [15]. As it is affected by large-scale circulation interacting with the orography over Luzon (Figure 2b), it is common to observe that the windward side exhibits a higher amount of precipitation [26,28,29]. For example, more summer precipitation is observed in western Luzon than is observed in eastern Luzon, while the reverse situation is observed in winter. In contrast to summer and winter, the transition seasons (spring and autumn) exhibit less east-west contrast with regard to precipitation distribution over Luzon.
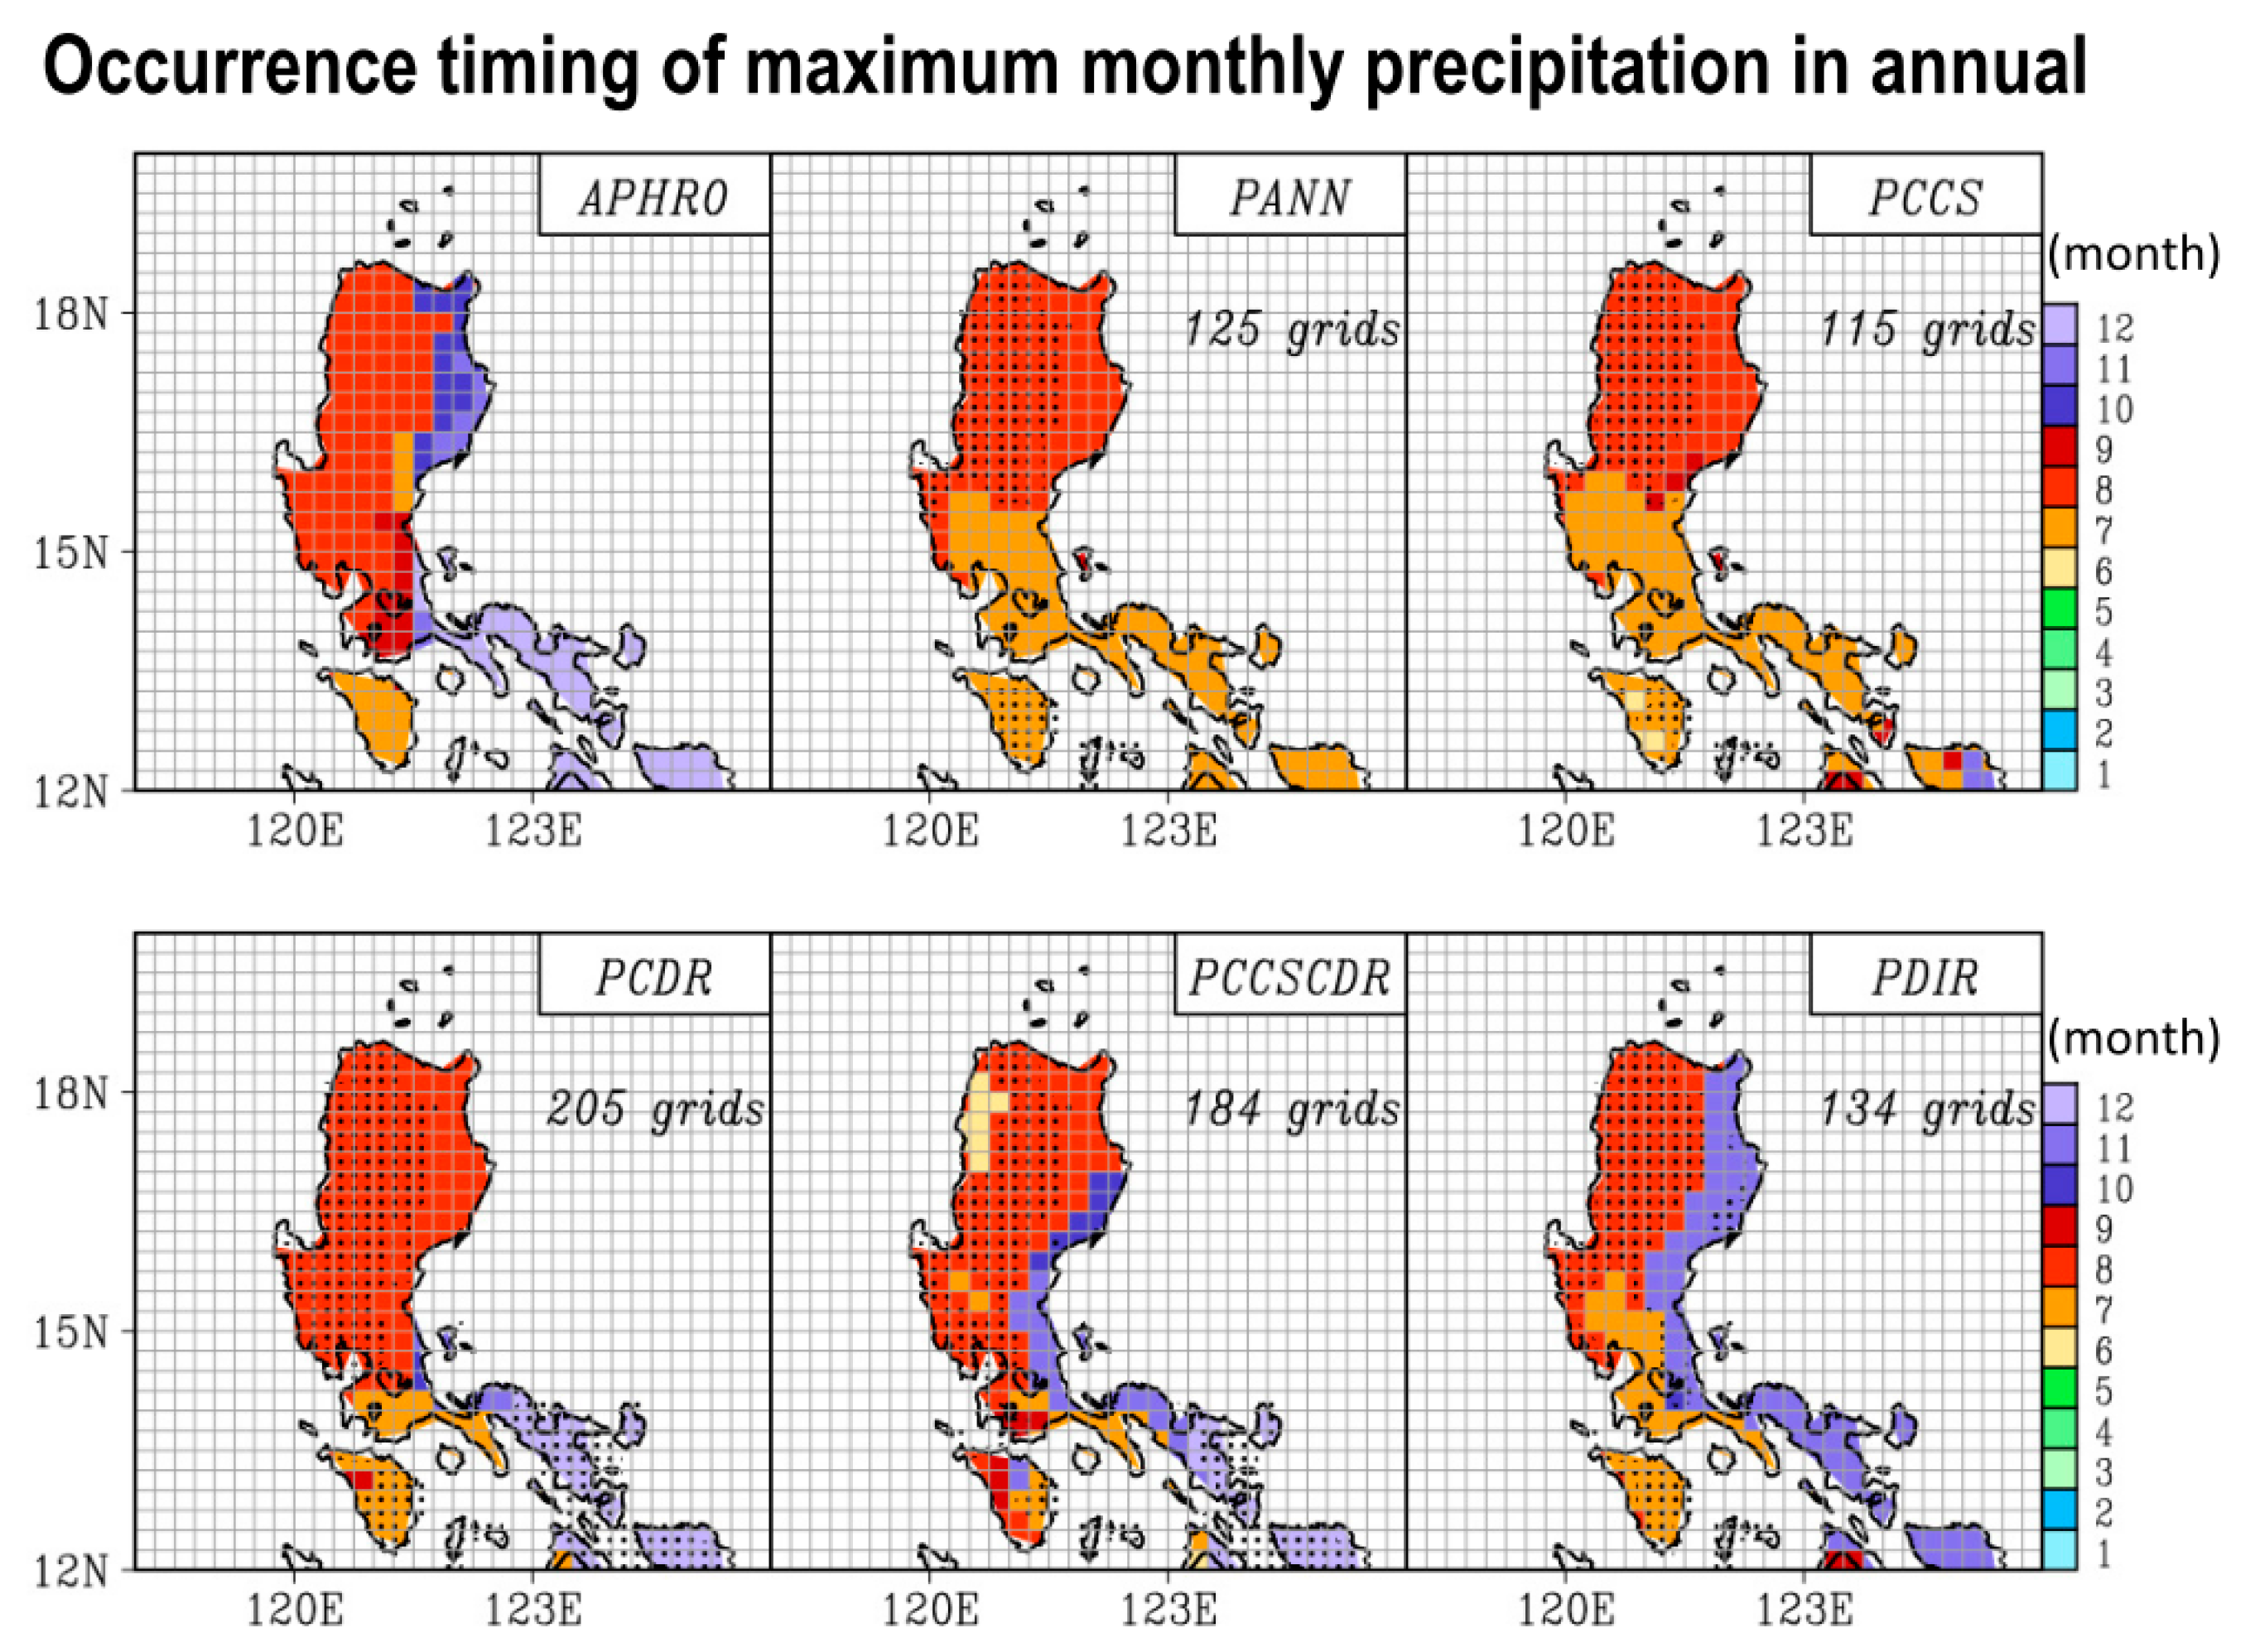
To illustrate the spatial difference in the occurrence timing of the maximum monthly precipitation within a year, we constructed the related phase diagram as observed by APHRO in Figure 3. The APHRO reveals a clear east-west difference with maximum precipitation occurring from July to September over western Luzon and from October to December over eastern Luzon. In contrast to APHRO, PANN and PCCS indicate a more obvious north-south difference with the monthly precipitation peaking north of 15°N in August and peaking south of 15°N in July over Luzon. In contrast, PCDR, PCCSCDR, and PDIR are more capable of depicting the east-west phase delayed feature, and this is similar to APHRO. Among the five SPPs, PCDR exhibited the largest number of spatial grids that accurately depicting the timing of maximum monthly precipitation (~205 grids as indicated within Figure 3), thus suggesting its superior ability to qualitatively illustrate the phase of monthly precipitation changes. However, it should be noted that PCDR has more errors in accurately depicting the timing of maximum monthly precipitation over northeast Luzon than in other sub-regions; this regional difference will be discussed further in Figure 4.
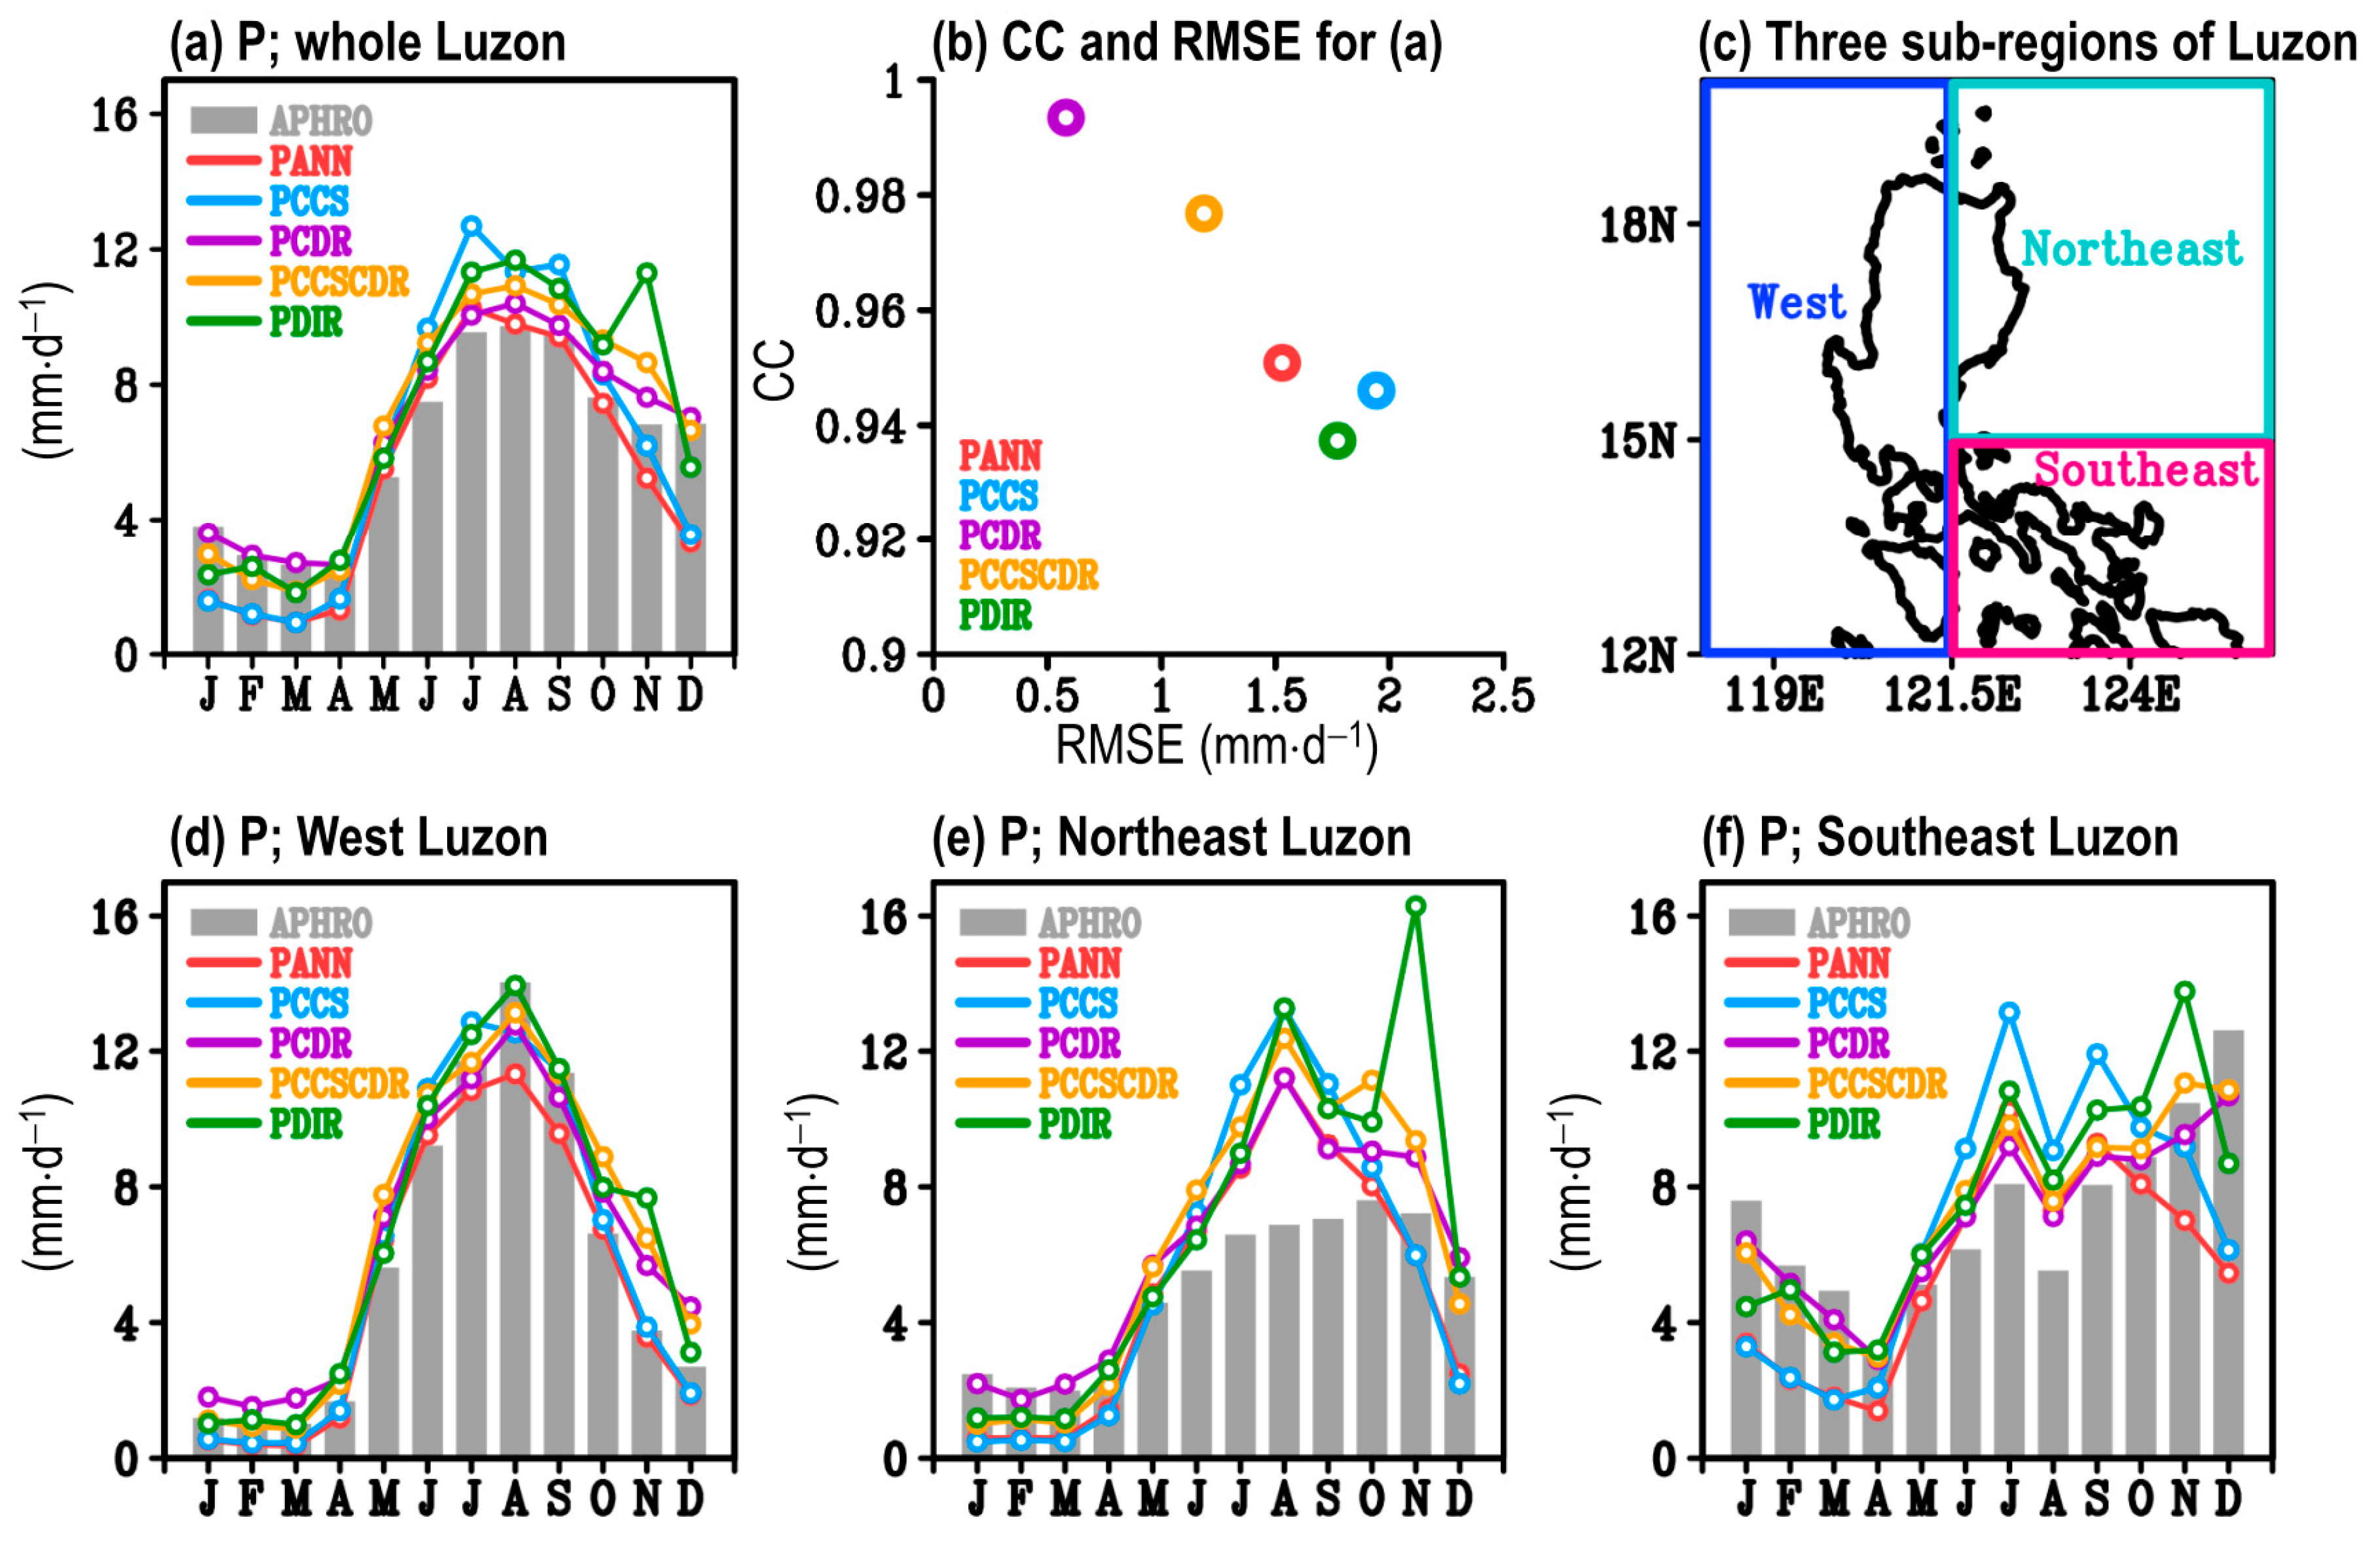
Next, based on the features presented in Figure 3, we separated the domain of Luzon into three sub-regions that included the west, northeast, and southeast sub-regions (Figure 4c). Then, we examined the ability of SPPs to illustrate the annual evolution of monthly mean area-averaged precipitation over the entire Luzon region (Figure 4a,b) and over the three sub-regions of Luzon (Figure 4d–f). From Figure 4a, we note that all SPPs were able to depict the phase change with more precipitation from July to October. Using the time series presented in Figure 4a, we constructed a statistical analysis of CC and RMSE (Figure 4b). Overall, PCDR exhibits the largest CC (0.99) and smallest RMSE (0.58 mm·d−1), thus demonstrating that its performance is better than is that of other SPPs when considering the entire domain of Luzon.
The regional differences are clearly indicated in Figure 4d–f. APHRO (gray bar) reveals that monthly precipitation peaked in August over west Luzon, in October over northeast Luzon, and in December over southeast Luzon. Among the three subregions, all five SPPs exhibited greater ability to capture annual phase evolution over west Luzon than they did over southeast Luzon. Statistical evidence is provided in Table 3 that indicates that all SPPs exhibit a higher CC (lower RMSE) with regard to capturing the temporal phase evolution (precipitation error) over west Luzon than they do over the other two sub-regions. Quantitatively, it is most obvious that all SPPs overestimate the summer precipitation, particularly the August precipitation over northeast Luzon (Figure 4e). Similar error is also noted by Peralta et al. [13] for PCDR, and they suggested that this overestimate situation is related to the orographic effect. As for the overestimation of rainfall in November in PDIR, the data provider (Dr. Phu Nguyen; in personal communication) mentioned that this is also seen in the hydro-estimator product from NOAA but the possible cause is still not clear and deserves research attention in the future. In contrast, all SPPs underestimated winter precipitation over southeast Luzon (Figure 4f). However, even with this magnitude error, all SPPs capture the phase evolution of wet and dry half-years in a manner similar to that of APHRO as presented in Figure 4e,f. This precipitation characteristic explains why the value of CCs in Table 3 for northeast and southeast Luzon remain high.
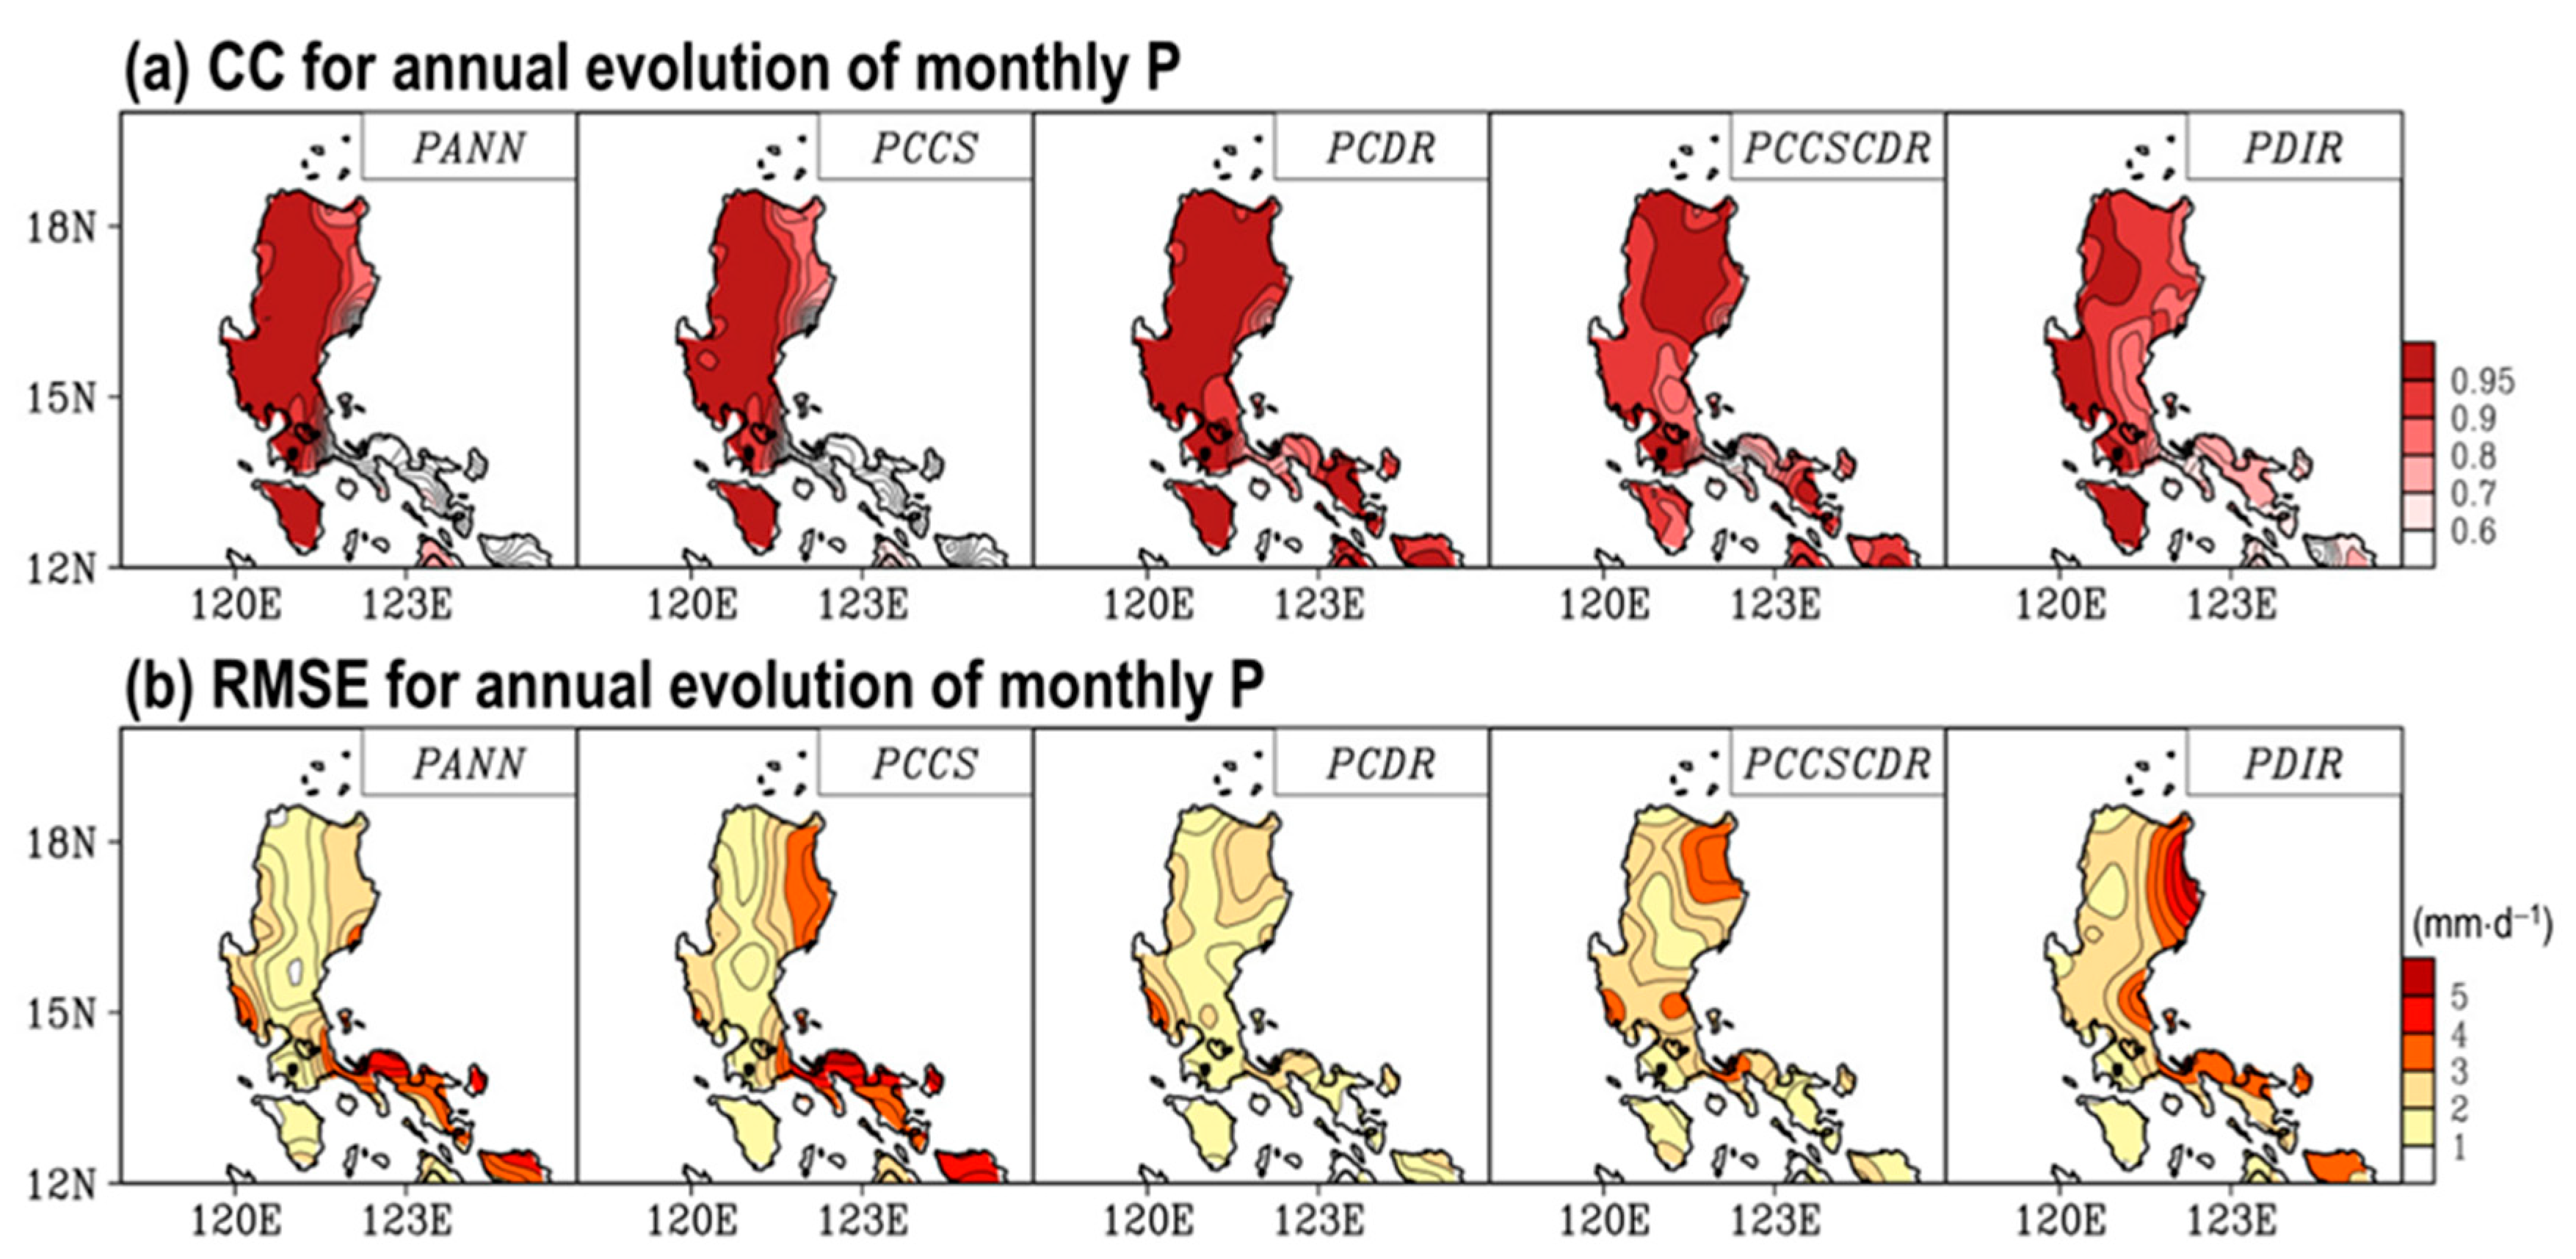
The regional differences in SPPs are further illustrated in Figure 5a that presents the grid-to-grid CC for the annual evolution of climatological monthly precipitation data from January to December. The climatological monthly data were obtained from the average during 2003–2015 for each month of January to December. It should be noted that PANN, PCCS, and PCDR are slightly superior (i.e., higher CC) to PCCSCDR and PDIR with regard to qualitatively illustrating the annual phase evolution over west Luzon. In contrast, over northeast and southeast Luzon, PCDR and PCCSCDR are the two SPPs more capable of illustrating the annual phase evolution. The quantitative estimations of the grid-to-grid RMSE (Figure 5b) further reveal that PANN and PCCS exhibit more errors than PCCSCDR and PDIR do, and this occurs primarily in southeast Luzon. However, the reverse situation is observed over the majority of west Luzon. For statistical comparison, PCDR exhibited better performance with regard to CC and RMSE over the majority of Luzon among the five SPPs (Table 4), and this is consistent with the findings presented in Figure 4.
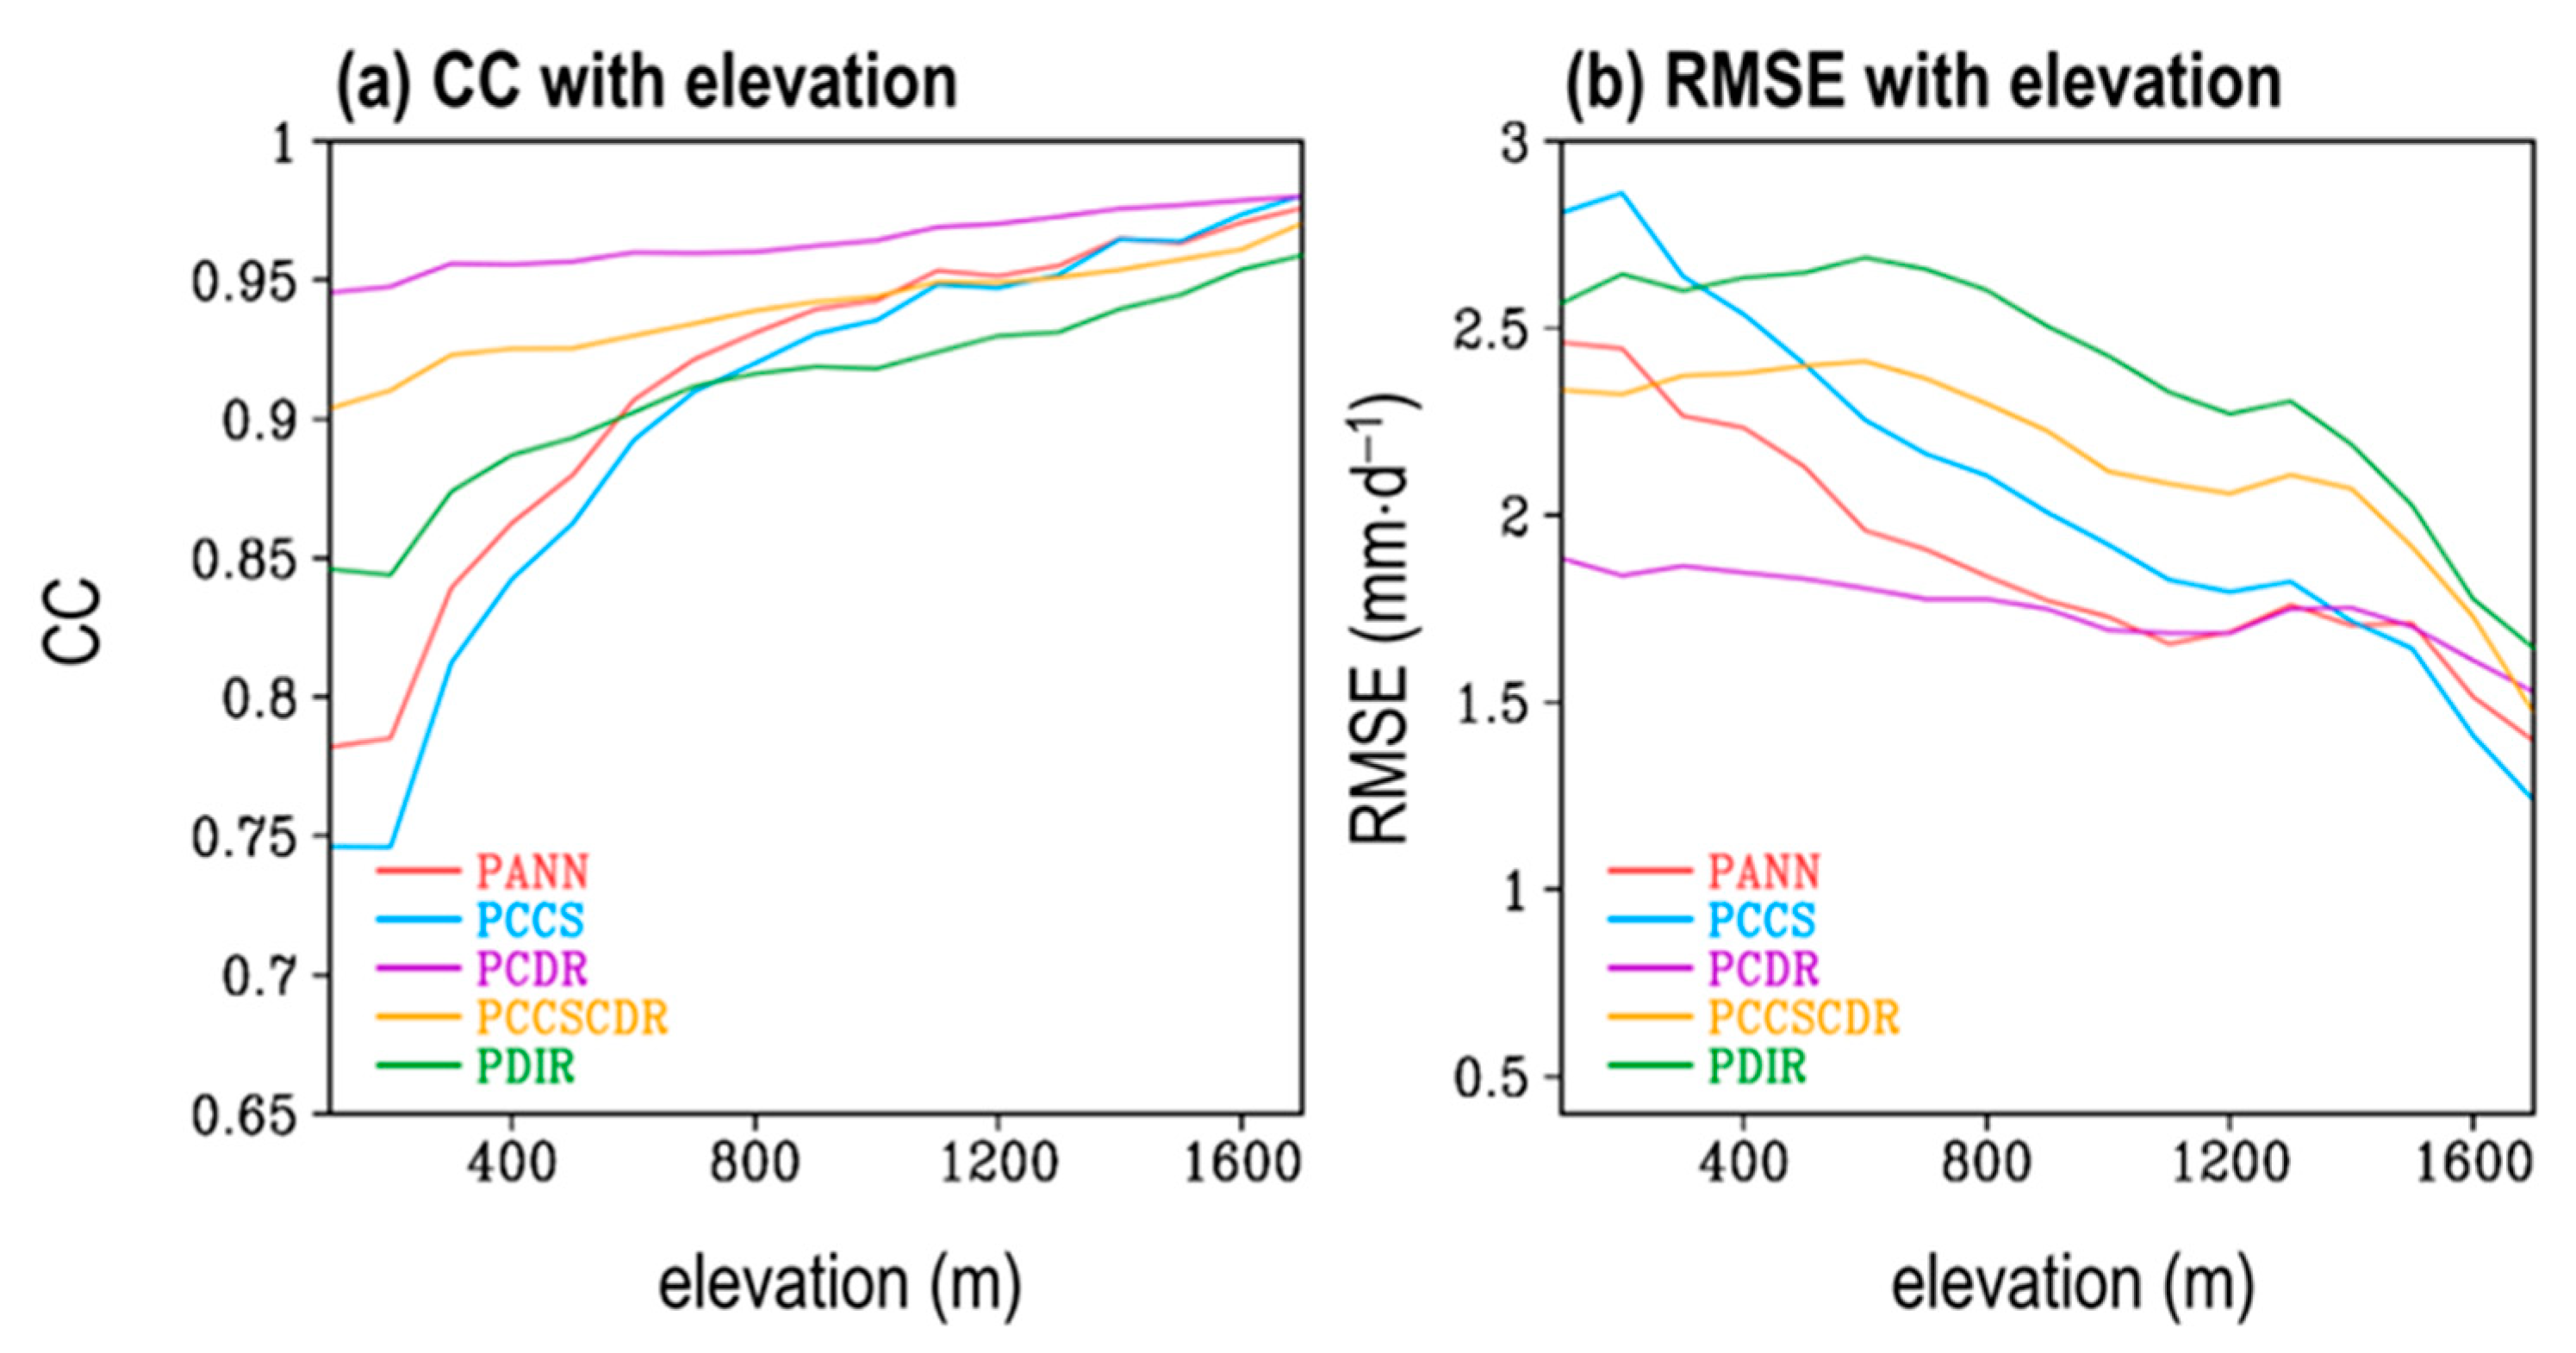
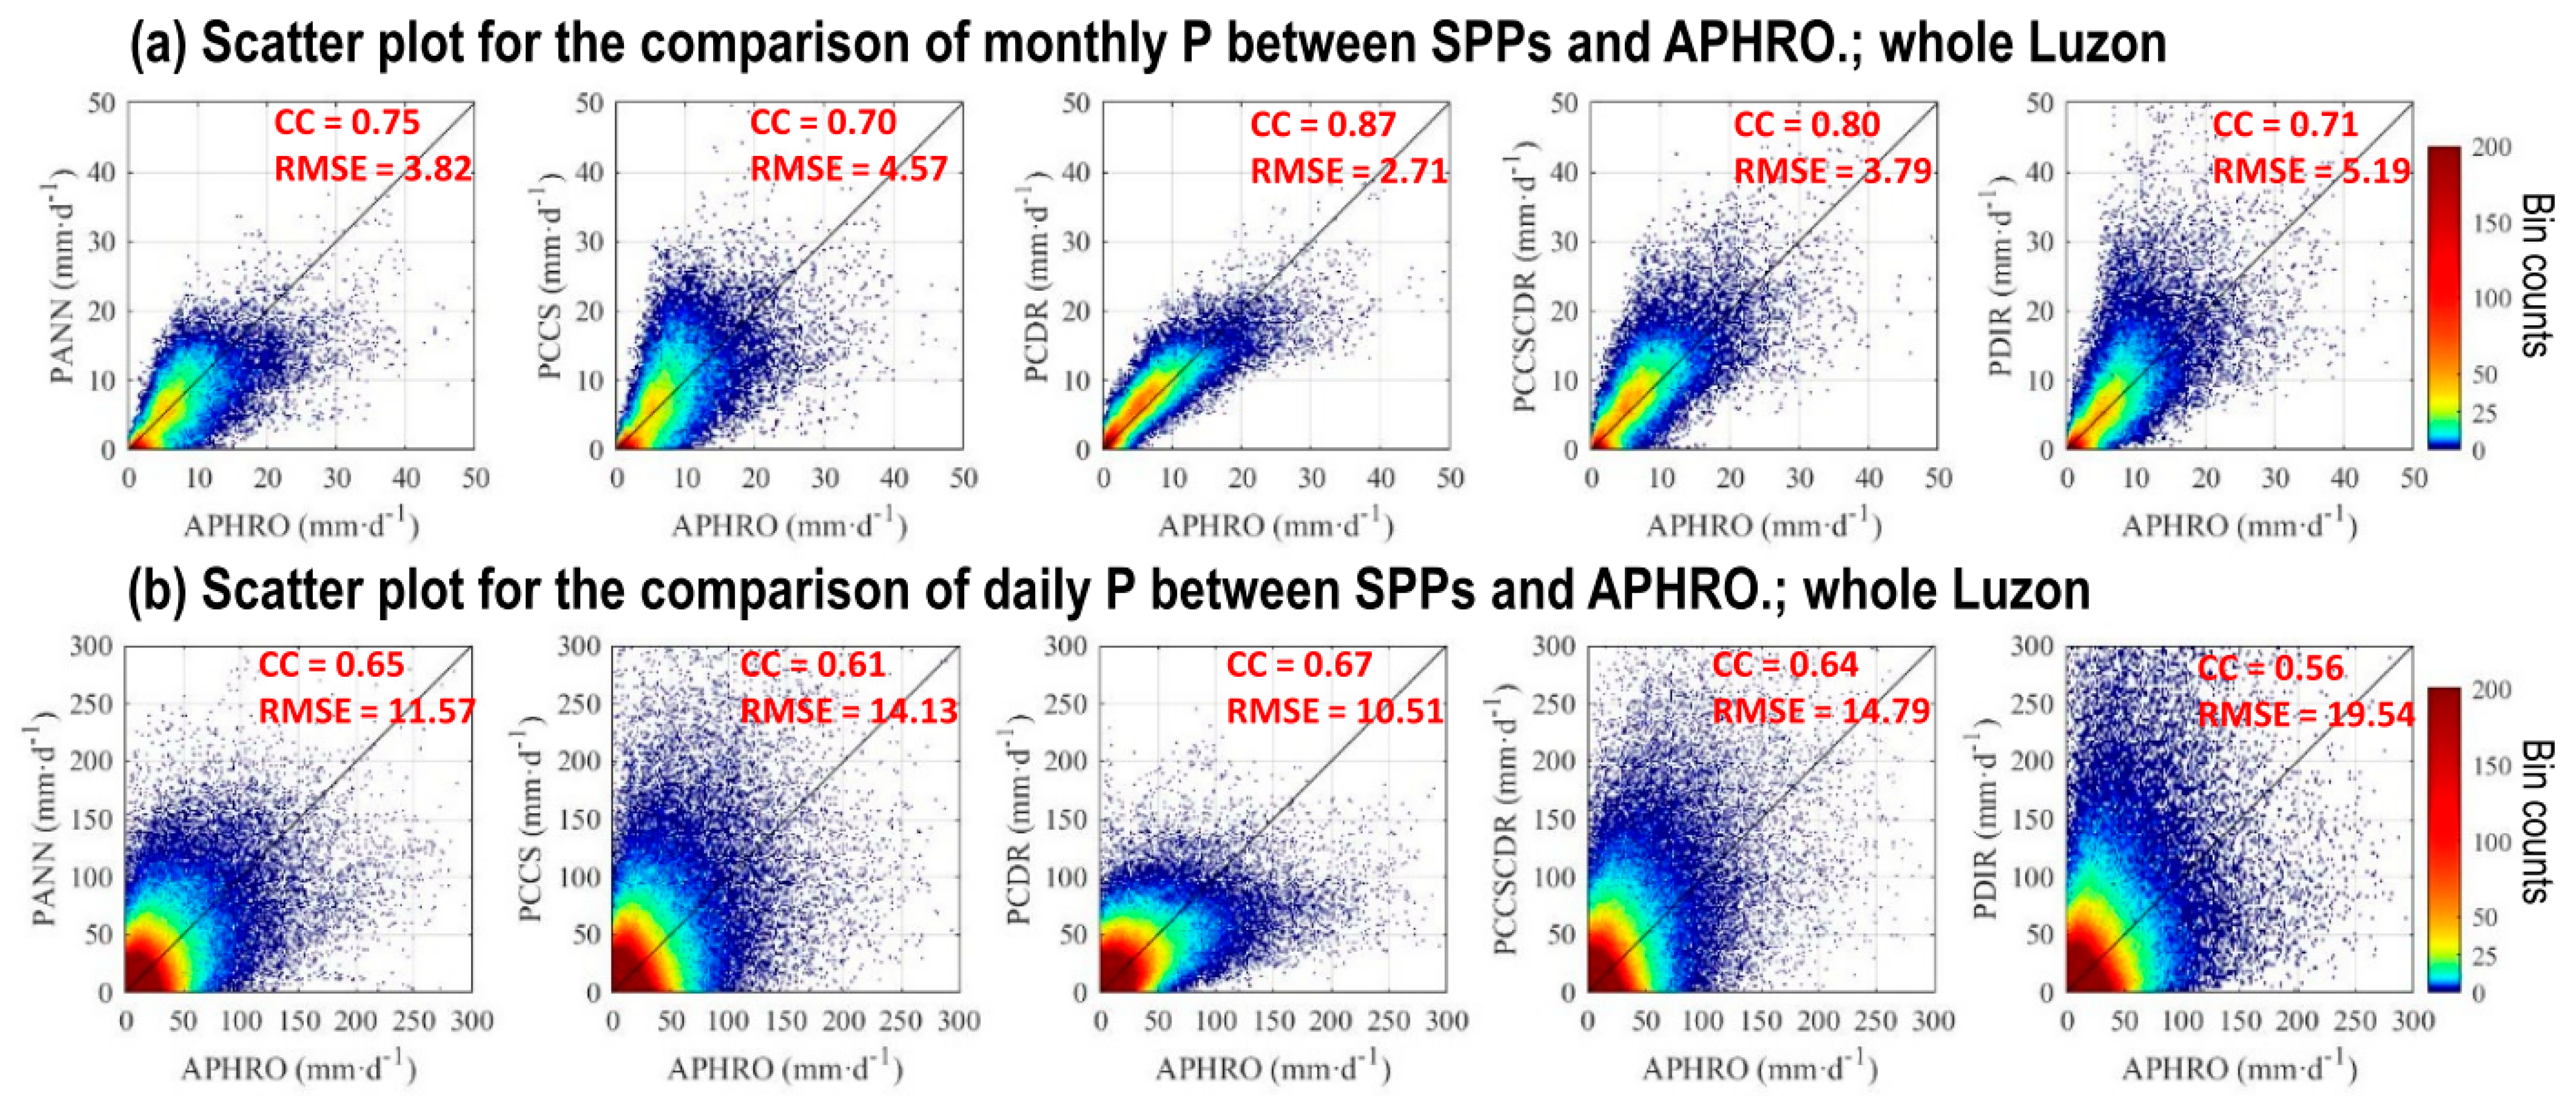
It is questionable if the difference in performance is associated with the elevation of the orography. To clarify this question, we calculated the mean CC and RMSE obtained from the data presented in Figure 5 with the elevation over Luzon (Figure 6). All SPPs exhibit better performance (i.e., higher CC and lower RMSE) with regard to depicting precipitation at higher elevations than they do at lower elevations. The difference in performance among the five SPPs was more obvious at lower elevations than it was at higher elevations. Among the five SPPs, PCDR exhibited a higher CC (Figure 6a) and lower RMSE (Figure 6b) at most elevations. Additionally, the PCDR exhibited the most homogeneous distribution of CC and RMSE with elevation. Evidence for supporting PCDR outperforming other SPPs in depicting the monthly precipitation is provided in Figure 7a that depicts the scatter plot for each SPP versus APHRO for all monthly grid points over Luzon during 2003–2015. As presented in Figure 7a, PCDR is also exhibits the highest CC and lowest RMSE among all compared SPPs, again suggesting that PCDR performed the best in qualitative and quantitative monthly precipitation estimations over Luzon.
It is known that the production of PCDR was not adjusted by the cloud patch approach, while PCCS, PCCSCDR, and PDIR were adjusted. The features presented in Figure 6 and Figure 7a imply that the use of the cloud patch approach for analyzing monthly precipitation over Luzon does not improve precipitation detection over the lower elevations of Luzon. Next, we examined if this suggestion was valid for daily timescale features.

3.2. Daily Features

Figure 7b presents a scatter plot of each SPP versus APHRO for all daily grid points over Luzon during all days from 2003–2015. Similar to the data presented in Figure 7a, the daily timescale also reveals that the PCDR exhibits the highest CC and lowest RMSE among the five SPPs. Relative to other SPPs, the scatter distribution of PCDR as indicated in Figure 7b is concentrated closer to the 1:1 black solid line with the exception of the stronger daily precipitation events in which PCDR exhibits a dominant underestimation bias. Notably, Huang et al. [3] reported that PANN and PCDR appear as caps of maximum daily precipitation at 200 mm·d−1 in Taiwan; however, this feature was not observed in our current study examining Luzon. This highlights the region-dependent performance of PERSIANN-series products.
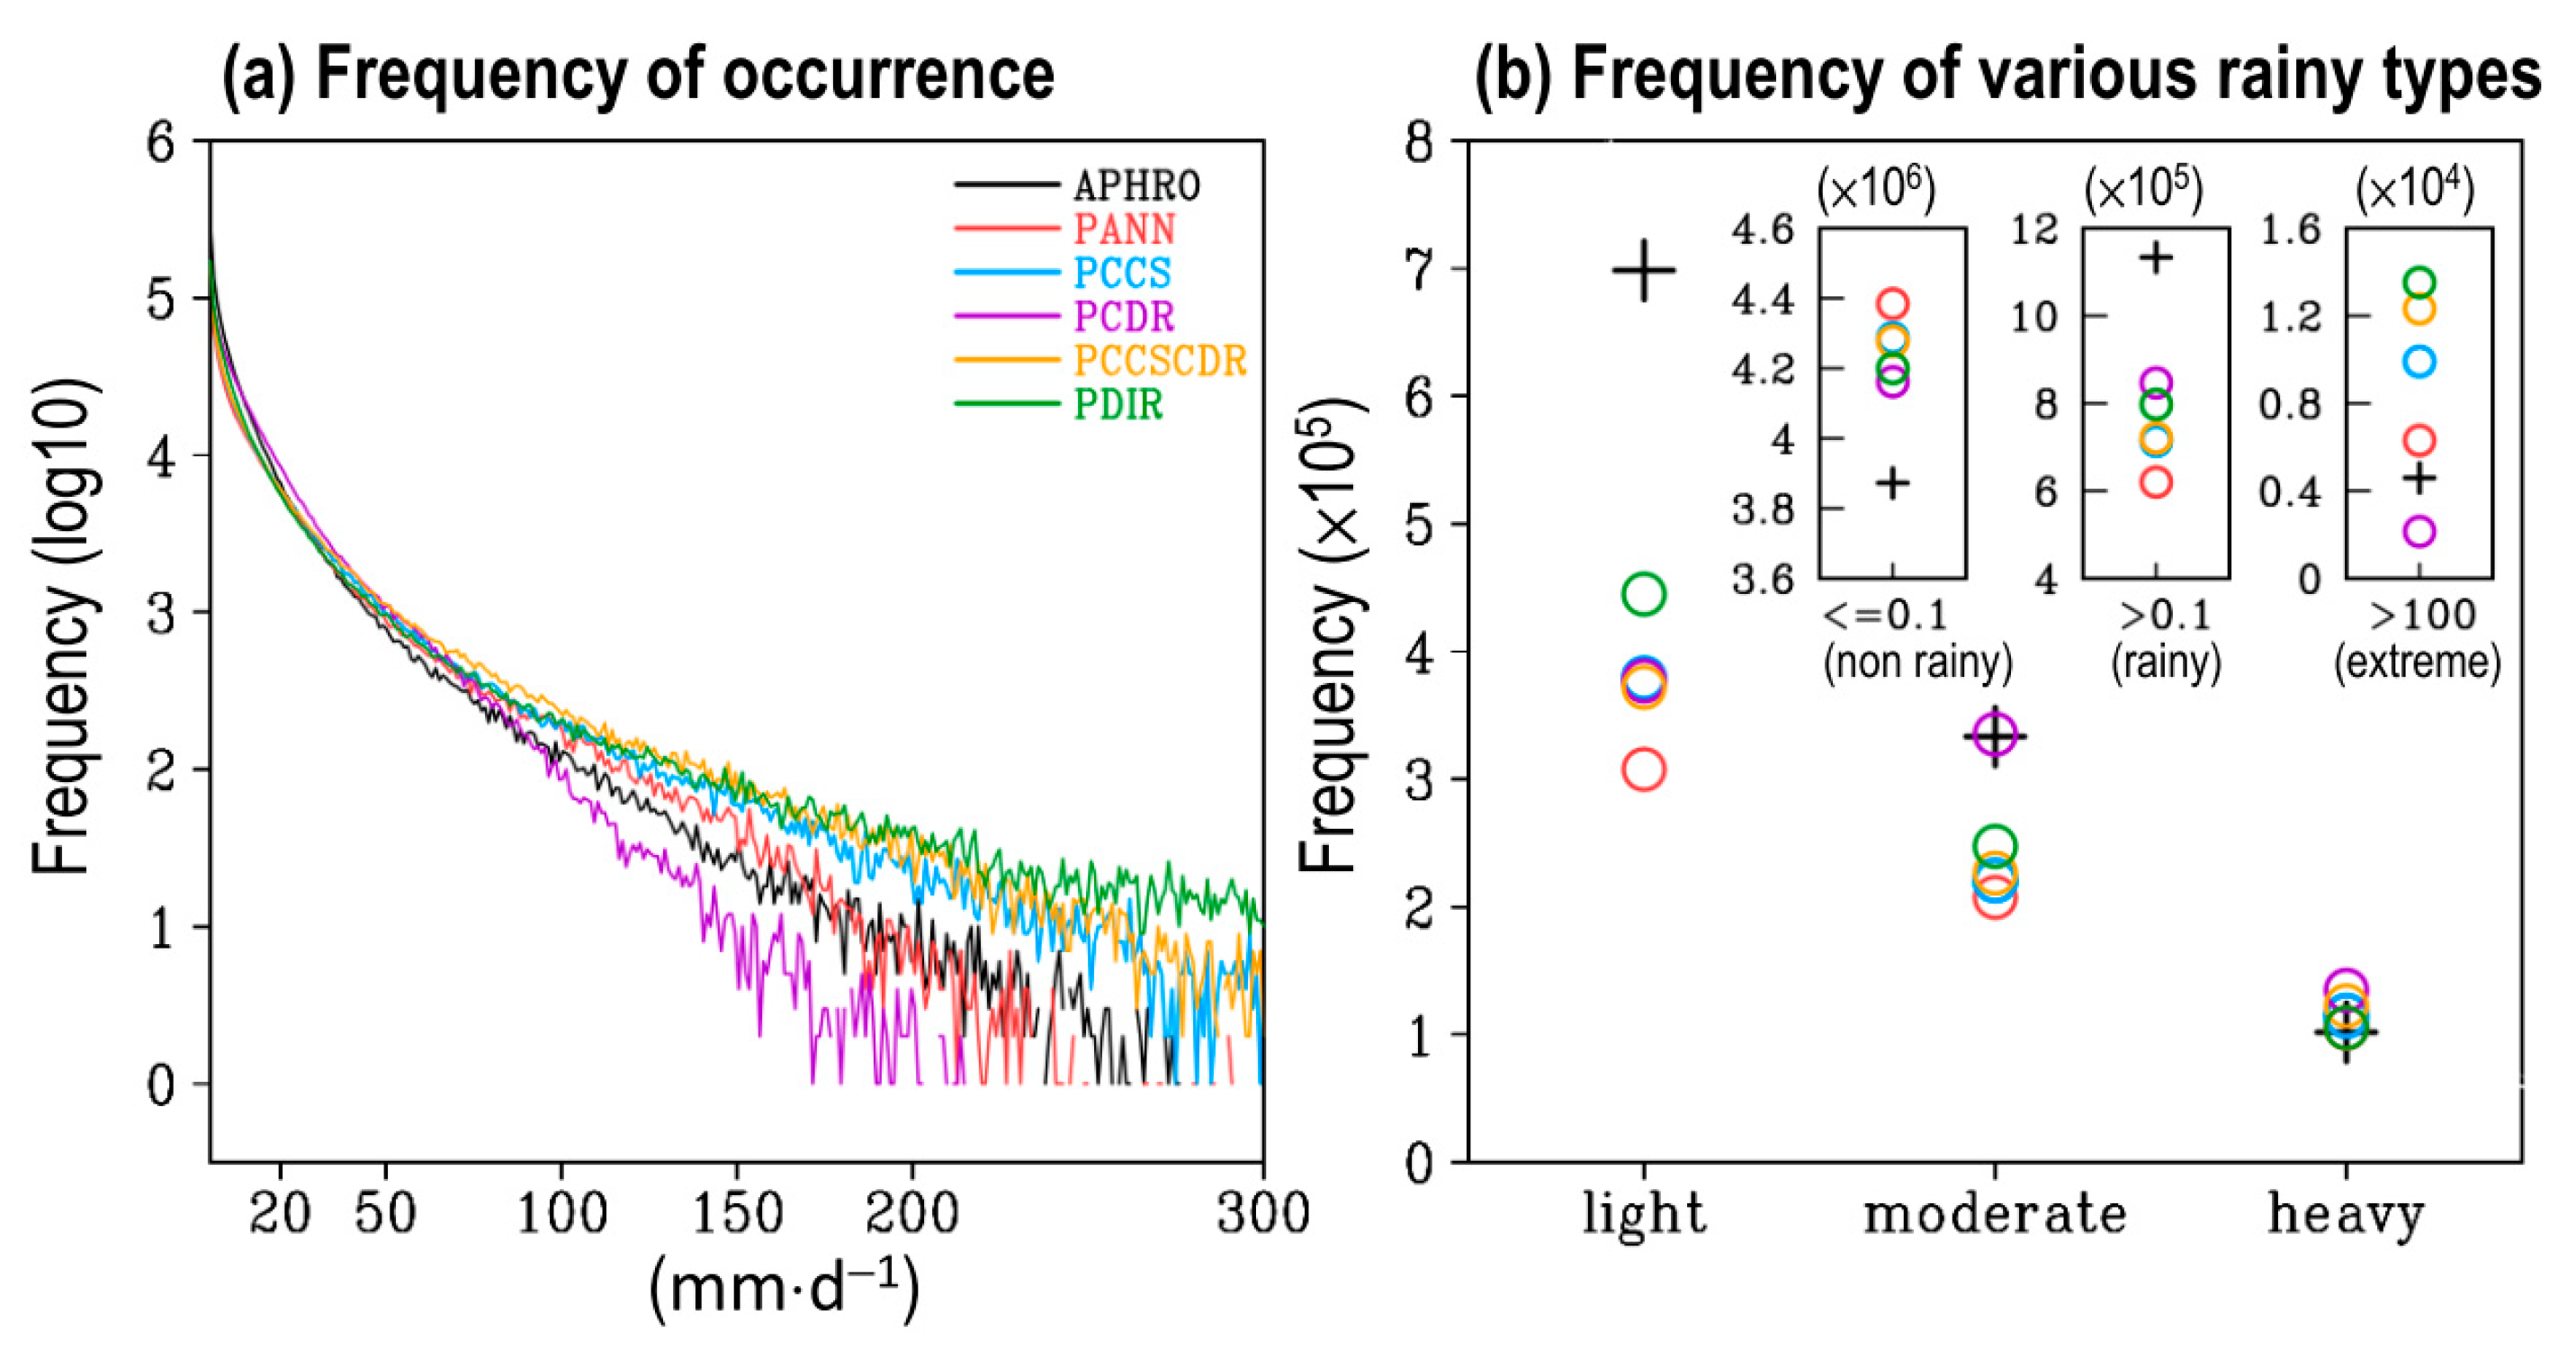
It was also noted from Figure 7b that SPPs using the cloud patch approach (i.e., PCCS, PCCSCDR, and PDIR) tend to overestimate the occurrence frequency of daily precipitation > 100 mm·d−1 in a manner that is more obvious than that of SPPs that do not use the cloud patch approach (i.e., PANN and PCDR). To further clarify this inference, we assessed the frequency of the occurrence of daily precipitation events using different precipitation criteria (Figure 8a). Focusing on the frequency of extreme precipitation events (daily precipitation > 100 mm·d−1), it is clear that PANN outperforms the other SPPs. While PCDR tends to underestimate, the other three SPPs using the cloud patch approach (PCCS, PCCSCDR, and PDIR) tend to overestimate the frequency of extreme precipitation events. Following Sun et al. [30], we also separated precipitation events into light (0.1–5 mm·d−1), moderate (5–20 mm·d−1), and heavy (20–100 mm·d−1) events, and we determined the frequency for each type (Figure 8b). Additionally, the events of no rain (≤0.1 mm·d−1) frequency, rainy (>0.1 mm·d−1) frequency, and extreme (>100 mm·d−1) frequency were added to the top right of Figure 8b. Relative to Figure 8a,b more clearly demonstrates that all the SPPs severely underestimated the frequency of light precipitation events and slightly overestimated heavy precipitation events.
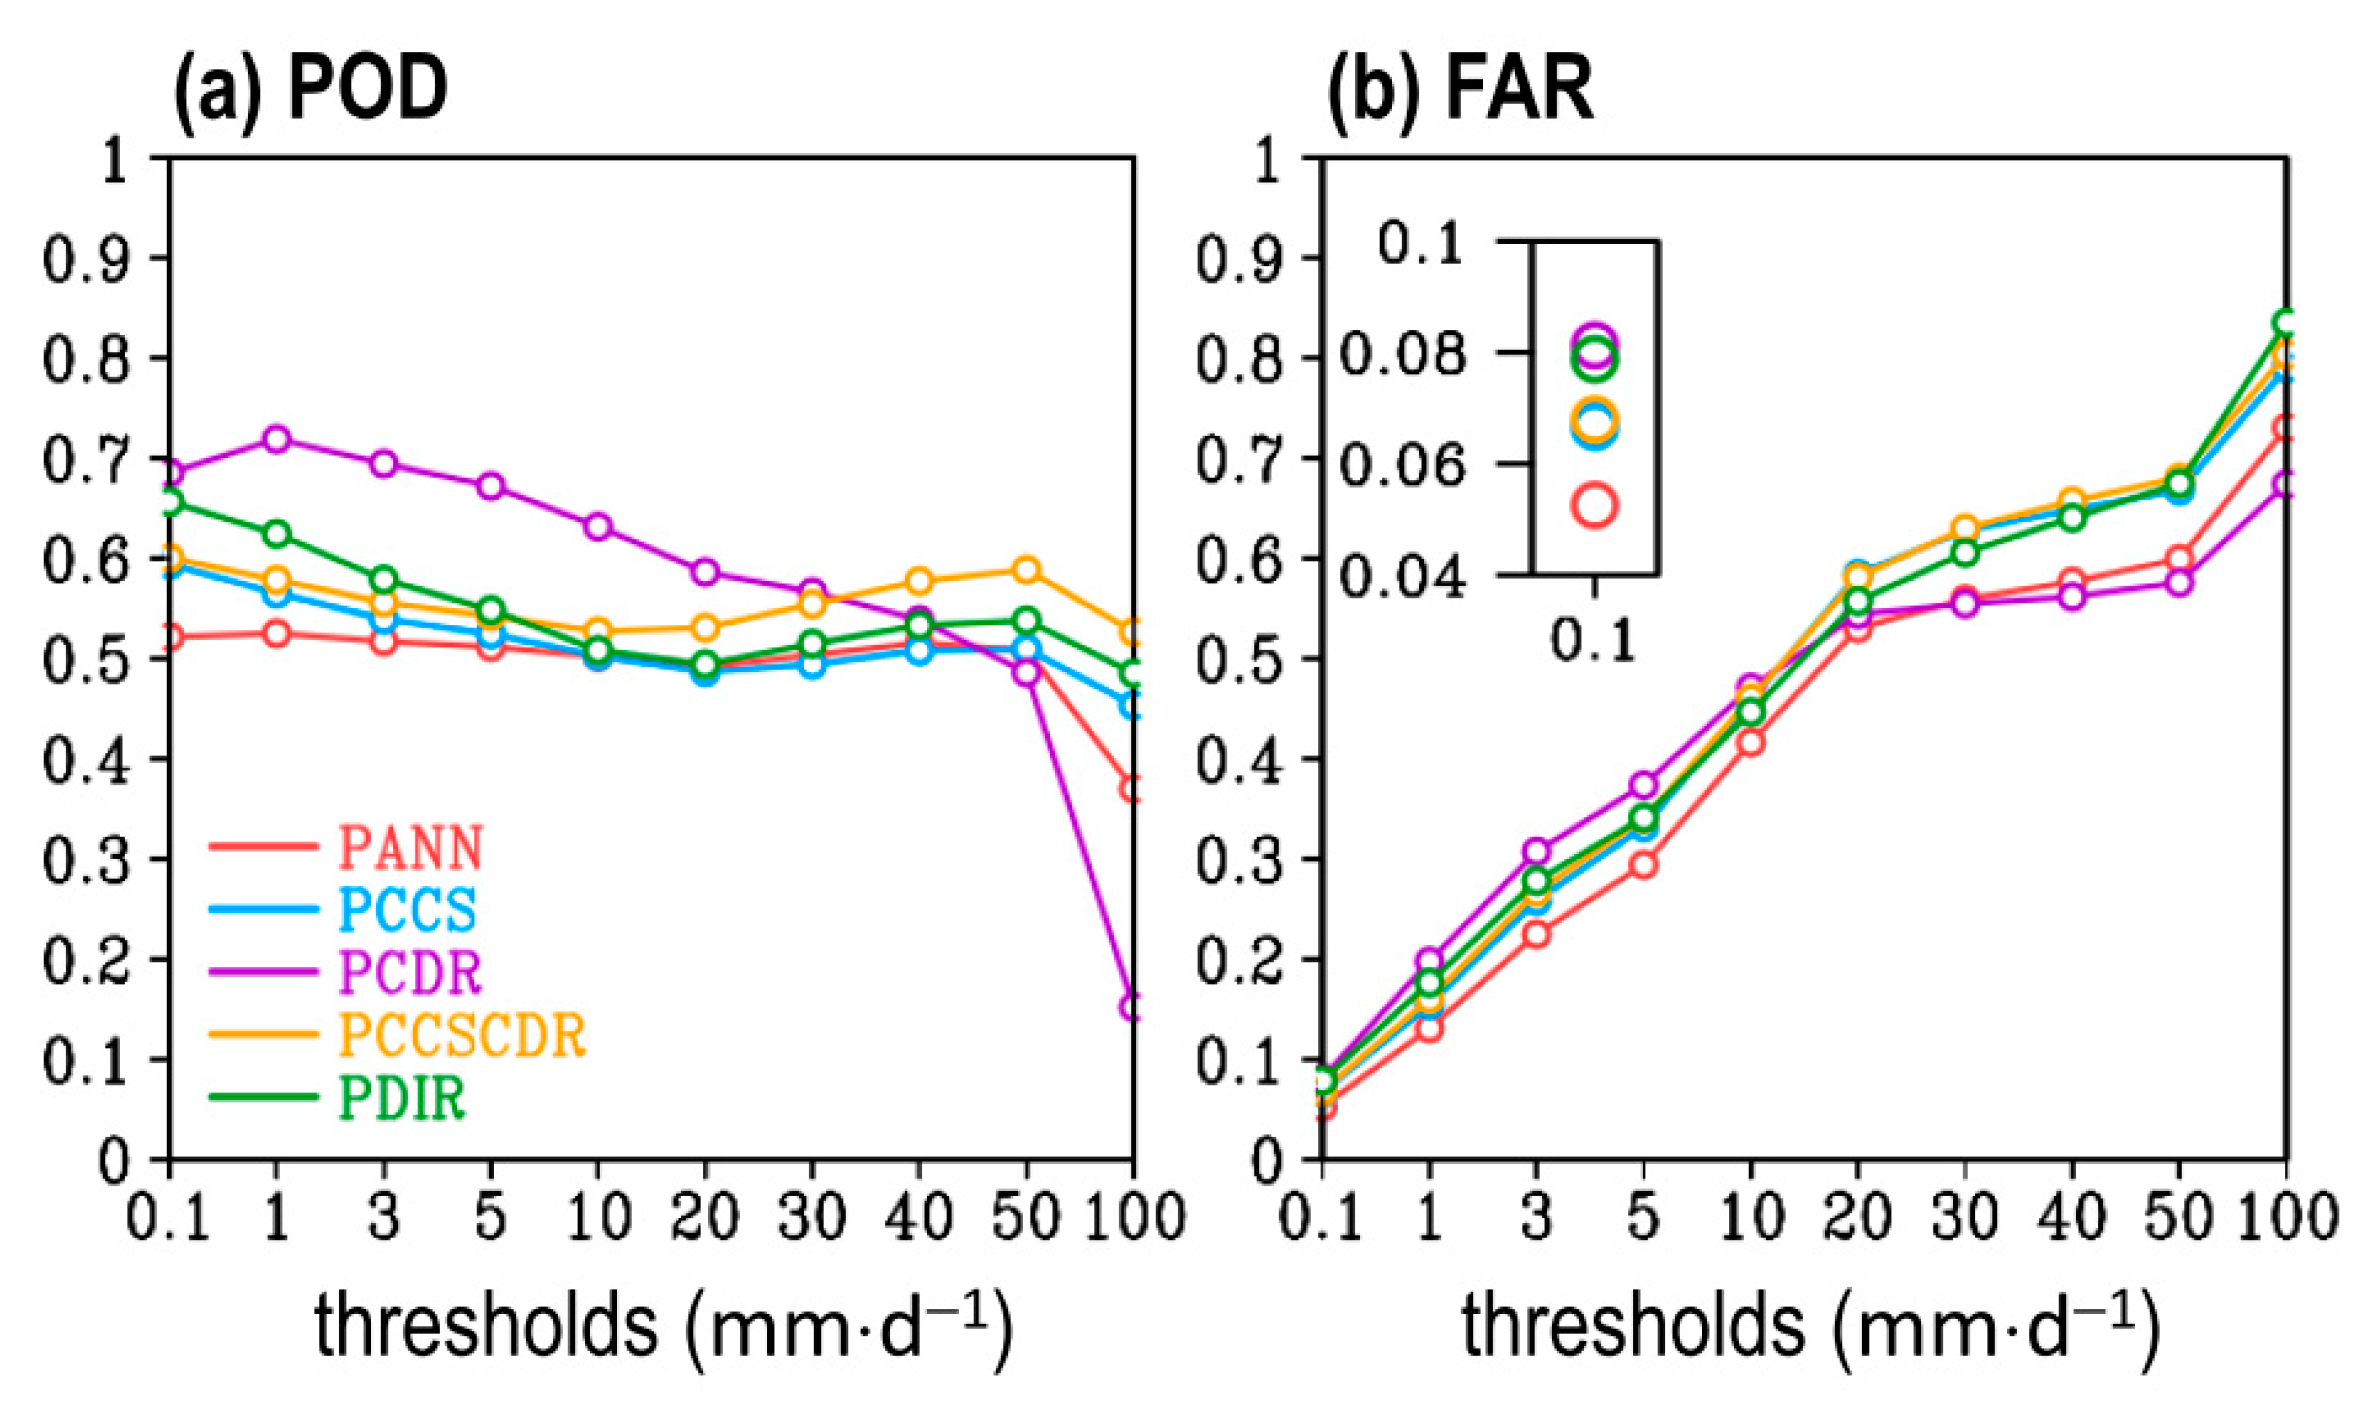
Among all SPPs, PDIR is closer to APHRO in terms of the frequency of light precipitation events, while PCDR is close to APHRO in terms of the frequency of moderate precipitation events. PCDR is also superior to the other four SPPs with regard to detecting the frequency of no-rain events and total rainy events; however, it underestimates the frequency of extreme precipitation events among all SPPs. Therefore, PCDR may not be suitable for detecting extreme precipitation events. To further examine the ability of SPPs to detect precipitation at various thresholds, we examined the POD (Figure 9a) and FAR (Figure 9b) values that were estimated from all rainy grid points over Luzon. In Figure 9a, the value of POD revealed that PCDR was superior to other SPPs at most thresholds with daily precipitation <20 mm·d−1, and this indicates good performance for PCDR with regard to depicting light and moderate precipitation events. In contrast, the POD of PCDR gradually became the worst among all SPPs with daily precipitation >100 mm·d−1, and this indicates the weakness of PCDR in depicting extreme precipitation events. Relative to PCDR, PCCSCDR exhibits a larger POD at most thresholds with daily precipitation >40 mm·d−1, thus implying that adding the cloud patch approach to PCDR to produce PCCSCDR helps to increase the performance with regard to capturing stronger precipitation events.
In addition to PCCSCDR, the other two products with the cloud patch approach (i.e., PCCS and PDIR) exhibit higher POD at criteria of > 100 mm·d−1 as compared to the two products without the cloud patch approach (i.e., PCDR and PANN). One possible explanation is that PCCS, PCCSCDR, and PDIR tend to detect a higher frequency of daily precipitation events of > 100 mm·d−1 than APHRO does, and this can lead to more events matching the criteria of “hit” events (Supplementary Figure S1) and can result in a higher POD score for thresholds of >100 mm·d−1 (Figure 9a). Compared to other SPPs, PCDR also exhibited the highest value for FAR at most thresholds ranging from 0.1–10 mm·d−1 (Figure 9b). In contrast, the FAR values for PCCS, PCCSCDR, and PDIR are slightly higher than are those of PANN and PCDR for daily precipitation events of >20 mm·d−1. Notably, relative to POD the difference in FAR among all SPPs is less obvious (Figure 9b), thus suggesting that the performance of SPP is primarily dominated by POD and is less dominated by FAR.
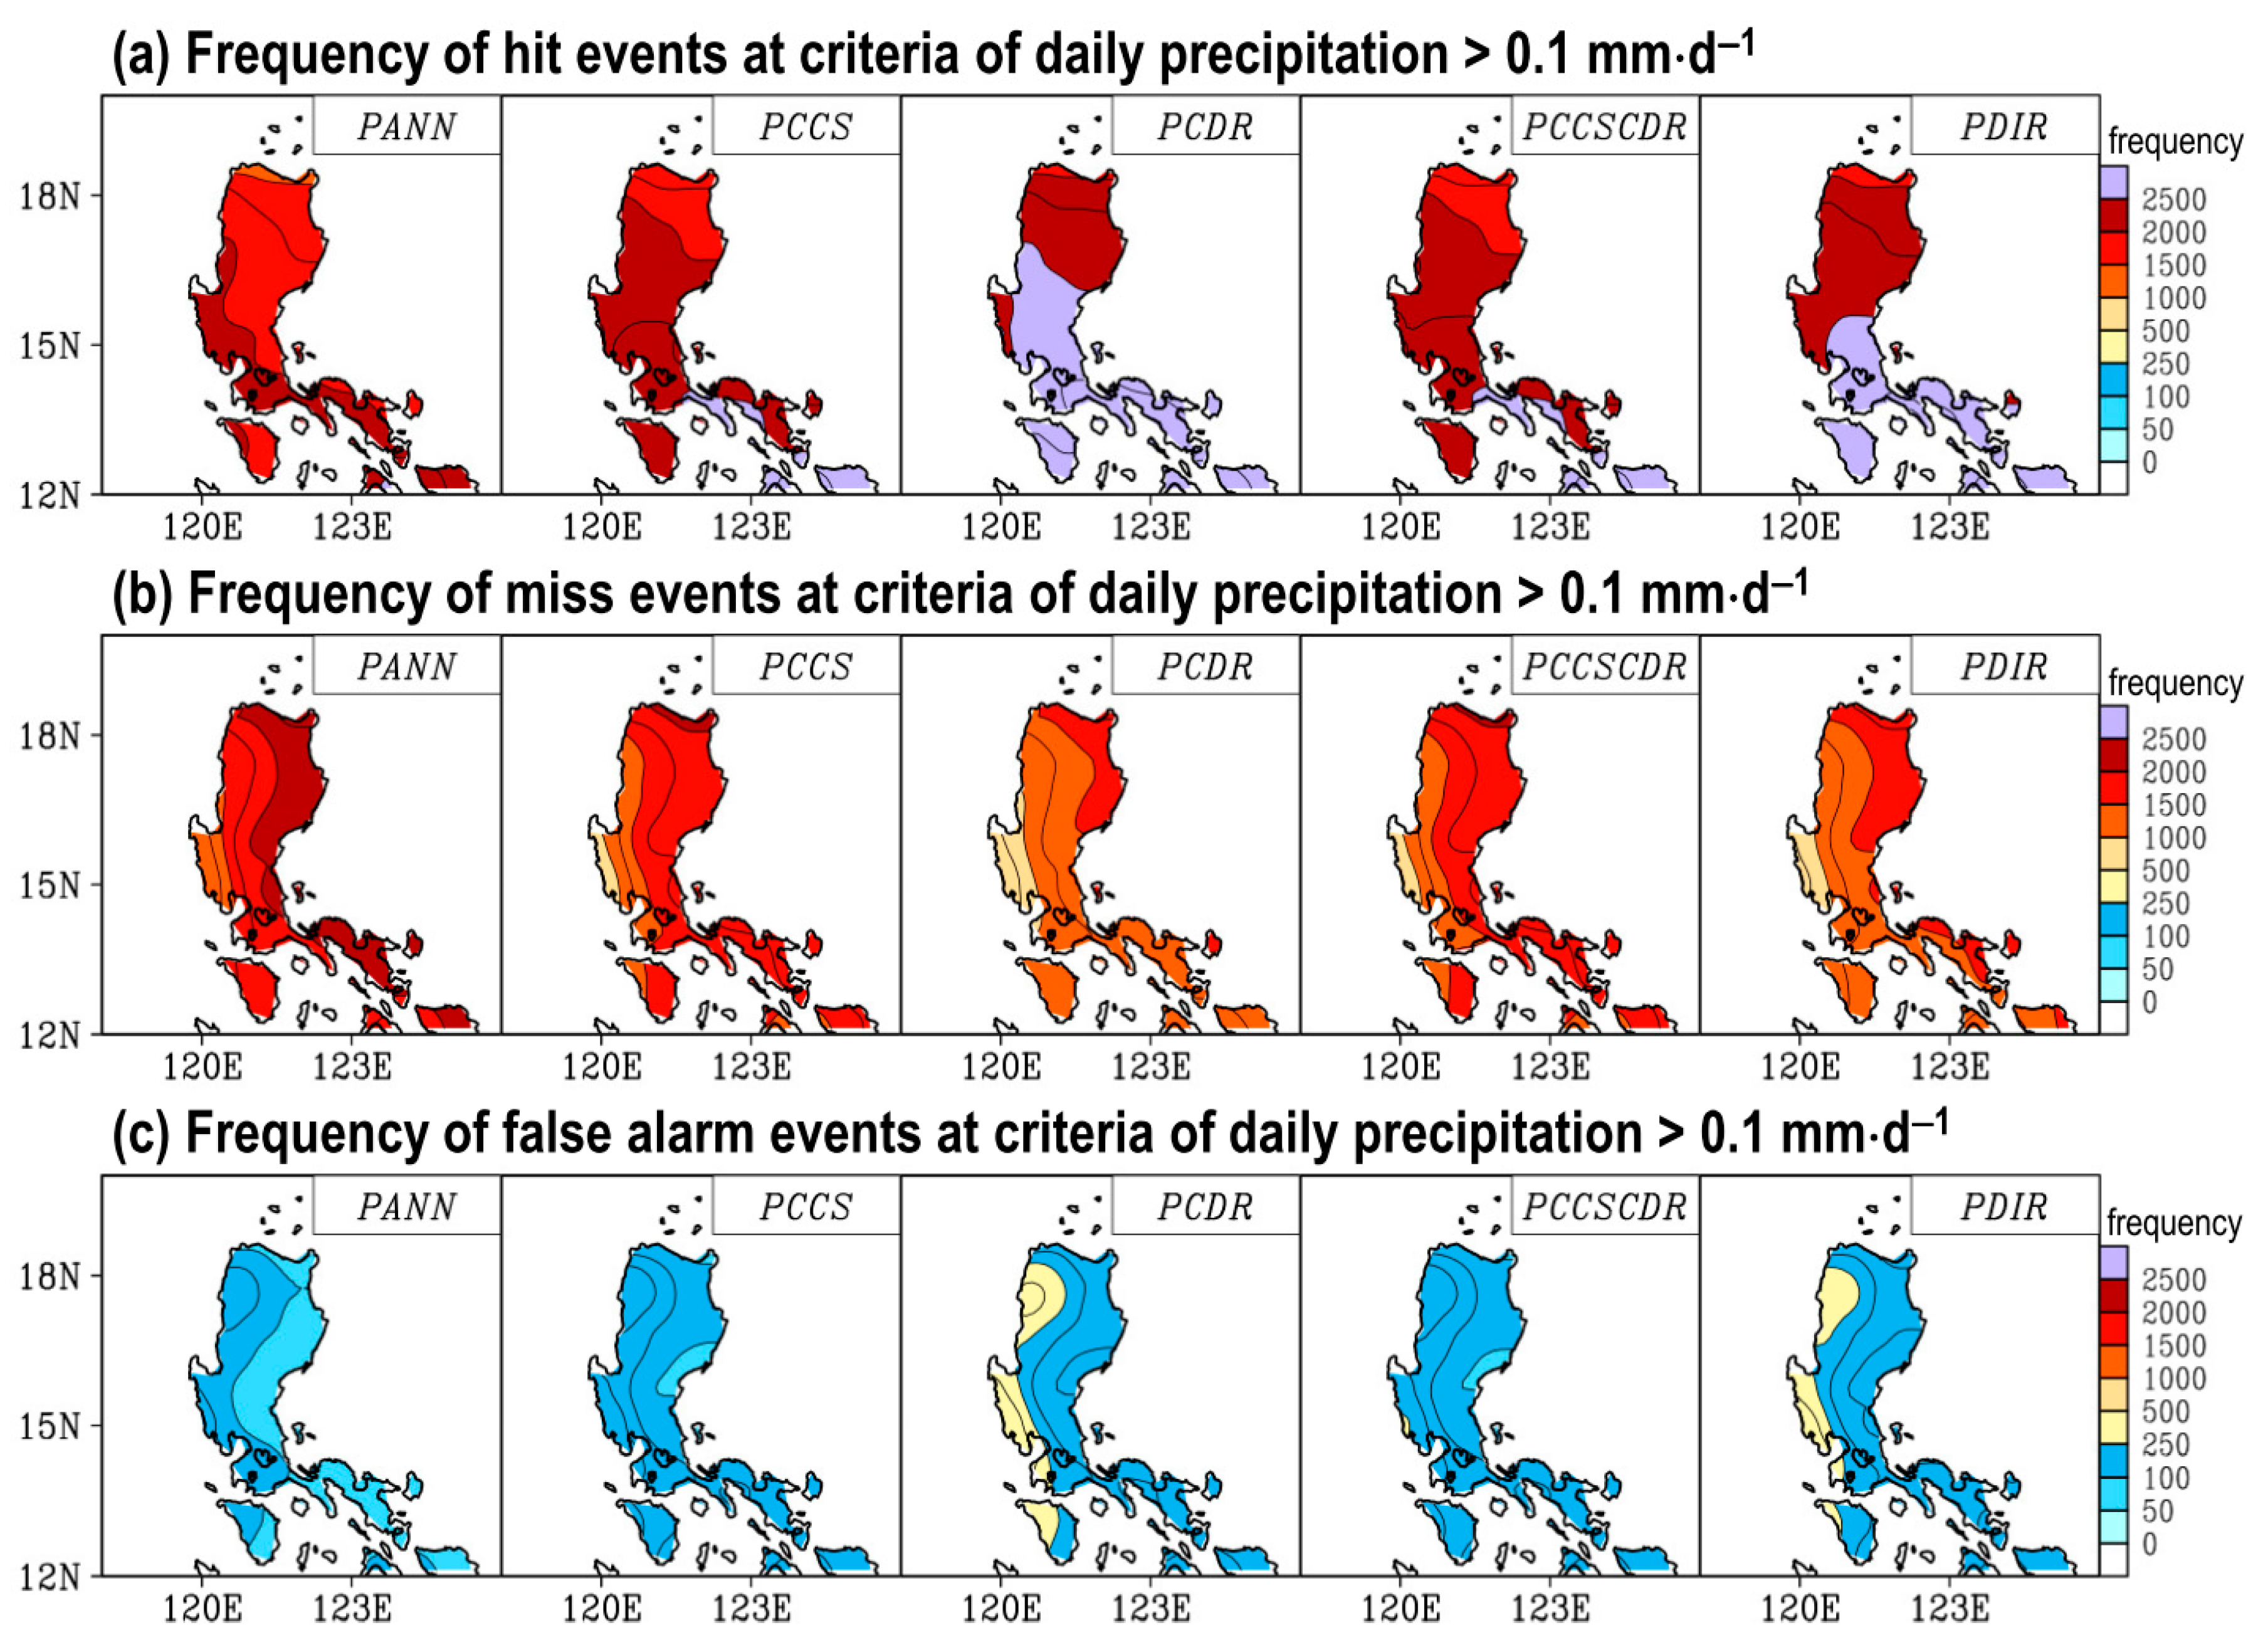
To examine the importance of spatial resolution of the SPPs, we further assessed the spatial distribution of the frequency of hits, misses, and false alarms for all rainy events (Figure 10). All SPPs “hit” most of the events over south Luzon and the nearby archipelago (Figure 10a). In contrast, all SPPs exhibited more “miss” events over east Luzon than they did over west Luzon (Figure 10b). Despite this spatial difference, PCDR exhibits more hits and fewer misses than do other SPPs over the majority of Luzon, and this explains why PCDR exhibits a higher POD value (Figure 9). As for the frequency of false alarm events (Figure 10c), all SPPs indicate that the errors are larger over west Luzon than they are over east Luzon, and PCDR and PDIR exhibit more chances than do other SPPs to cause false alarms in detecting rainy events. It appears that the results of hits, misses, and false alarms do not lead to the same conclusions. Nonetheless, it should be noted that the number of false alarm events is much lower than are the numbers of hit and miss events. Specifically, for most daily rainy events we can conclude from the data presented in Figure 10 that PCDR is the most suitable product for use among the five SPPs.
Additionally, it can be inferred from Figure 10 that the capability of all five SPPs in depicting daily precipitation events is better over west Luzon than it is over east Luzon. This conclusion is consistent with the discussion in Section 3.1 regarding the monthly timescale variation. Supporting evidence is provided in Figure 11 that indicates that the value of POD is much higher than is that of FAR for all SPPs and that POD is higher over west Luzon than it is east Luzon. The east-west contrast observed with regard to POD can be attributed to the large number of hit events and the small number of missed events occurring in west Luzon. The east-west contrast observed with regard to FAR is related to the distribution of false alarms as presented in Figure 10c.

4. Conclusions and Discussion

This study compared five SPPs from the PERSIANN-series to understand their capability to capture precipitation features over Luzon at monthly and daily timescales from 2003–2015. Surface observation (APHRO) was used as the reference base for the evaluation of SPPs in depicting several features, including: (1) the spatiotemporal variation of precipitation at a monthly timescale (Figure 3, Figure 4, Figure 5 and Figure 6); (2) the grid-to-grid quantitative estimates for all rainy events at monthly (Figure 7a) and daily (Figure 7b) timescales; (3) the occurrence of detection for daily rainy events at different precipitation thresholds (Figure 8); and (4) the performance skill (POD and FAR) in capturing the daily rainy events at various precipitation thresholds (Figure 9, Figure 10 and Figure 11). The findings are summarized below.
On monthly time scales, we observe that all SPPs perform better at capturing monthly variability in precipitation over west Luzon than over east Luzon. Among the five SPPs, PCDR exhibits the best qualitative and quantitative depiction of the grid-to-grid monthly precipitation estimates, and this is true for both lower and higher elevations of orography over Luzon. Similarly, PCDR also exhibits the best performance in qualitative and quantitative precipitation estimation for most daily rainy events with the exception of extreme events with daily precipitation of >100 mm·d−1. Further examination of the skill scores (POD and FAR) of daily rainy events revealed that all SPPs exhibit much more “hits” events than they do “false alarms” events. This implies that the determination of SPPs for most daily rainy events is more dependent upon POD and less dependent upon FAR. More specifically, for POD we noted that PCDR outperformed other SPPs at the thresholds of most light-to-moderate precipitation events with daily precipitation of < 20 mm·d−1. In contrast, for extreme events with daily precipitation of >100 mm·d−1, PCCS, PCCSCDR, and PDIR exhibited better skill scores than did PCDR and PANN. Spatially, all SPPs exhibit higher POD scores in west Luzon than they do in east Luzon for daily rainy events, and this is consistent with the suggestion that all SPPs exhibit better performance with regard to depicting the monthly precipitation variation over west Luzon than they do over east Luzon.
Notably, the findings of this study examining Luzon are very different from those of Huang et al. [3] for Taiwan. Huang et al. [3] reported that PDIR exhibits the best performance with regard to quantitatively estimating interannual, annual, and seasonal precipitation characteristics and that PCCSCDR is superior for quantitatively estimating daily timescales over Taiwan. They also reported that the maximum precipitation of the PCDR was set at 200 mm·d−1 in Taiwan; however, this feature was not observed in our results. The difference between this study and Huang et al. [3] again confirms that the capability of PERSIANN-series products depends upon the region, thus further highlighting the need for this study.
Finally, we discussed two questions related to the findings of this study. (1) Why is PCDR not as good as PCCS, PCCSCDR, and PDIR in depicting extreme precipitation events of >100 mm·d−1? (2) Why is SPP performance better in west Luzon than it is in east Luzon? Regarding question (1), Ombadi et al. [31] also reported that the PCDR possesses deficiencies in regard to detecting extreme precipitation in the United States. Considering that PCCS, PCCSCDR, and PDIR are all produced using the cloud patch approach (whereas PCDR is not), it is suggested that the cloud patch approach used in the algorithm may help to more accurately detect the occurrence of extreme precipitation events (i.e., more hit events). Indeed, as explained by Sadeghi et al. [22], it is established that the cloud patch approach can classify the number of cloud patches based on size, geometry, and texture from the IR image. Then, this technique applies a specific Tb–R curve for each cloud patch to calibrate the precipitation estimates. As a result, SPPs using the cloud patch approach (i.e., PCCS, PCCSCDR, and PDIR) are more accurate in detecting the occurrence of extreme precipitation events (Figure 7 and Figure 9). These are the advantages of SPPs that adopt the cloud patch approach.
Other studies have also demonstrated that the cloud patch approach is more sensitive to the heavy precipitation signal generated by deep convection [32] rather than other types of clouds [33]. Consistent with this suggestion, Figure 7b indicates that adding the cloud patch approach in PCDR to produce PCCSCDR does not improve the performance of daily precipitation events of <100 mm·d−1. This suggests that the cloud-patch approach possesses some disadvantages. The cloud patch approach utilizes 253 K (for PCCS and PCCSCDR) or 263 K (for PDIR) cloud temperature as the threshold for feature extraction. Thresholds below 273 K that primarily detect ice particles in clouds may limit the ability to detect warm rain events (i.e., non-extreme precipitation events) [22,23]. Notably, Figure 7b also reveals that relative to PCDR, the use of the cloud patch approach in PCCSCDR helps reduce the errors in underestimating extreme precipitation (i.e., >100 mm·d−1) but also increases the errors in overestimating non-extreme precipitation (i.e., <100 mm·d−1). To overcome this disadvantage, we suggest that the cloud temperature threshold used in PCCSCDR and also in PCCS and PDIR may need to be adjusted to a higher value to reduce the overestimation of non-extreme precipitation [22].
Regarding why the performance of the PERSIANN-series is better in west Luzon than it is in east Luzon, we suggest that this may be related to the observation that the mature stage of local convection occurs more frequently in west Luzon than it does in east Luzon [26]. In general, at the mature stage clouds contain a large number of ice particles, and PMW estimates input in the PERSIANN-series products are sensitive to this [4,5,34]. As a result, the PERSIANN-series is more capable of capturing the local convection systems in the mature stage over west Luzon rather than the decaying stage over east Luzon. Moreover, PERSIANN-series products primarily utilize IR images to train the model. However, as IR estimates in warm orographic clouds exhibit more bias [4,5,35], this could also induce more errors in east Luzon (lower elevations) than it could in west Luzon (higher elevations).

Supplementary Materials

The following supporting information can be downloaded at: https://www.mdpi.com/article/10.3390/rs14225900/s1, Figure S1: Occurrence frequency of different type of events.

Author Contributions

Conceptualization: W.-R.H. Data curation: J.H. and P.-Y.L.; Investigation: W.-R.H. and J.H.; Software: J.H. and P.-Y.L.; Writing (original draft): J.H. and W.-R.H.; Writing (review and editing): J.H., W.-R.H., and P.-Y.L. All authors have read and agreed to the published version of the manuscript.

Funding

This study was supported by the Ministry of Science and Technology of Taiwan under MOST 110-2111-M-003-003, and the National Science and Technology Council of Taiwan under MOST 111-2111-M-003-006 and MOST 111-2625-M-003-005.

Data Availability Statement

The datasets of PERSIANN-series products provided by Center for Hydrometeorology and Remote Sensing (http://chrsdata.eng.uci.edu/ (accessed on 23 May 2022)), the dataset of APHRODITE provided by APHRODITE’s Water Resources related team (https://www.chikyu.ac.jp/precip/ (accessed on 23 May 2022)), and the datasets of ERA5 provided by European Centre for Medium-Range Weather Forecasts (https://www.ecmwf.int/en/forecasts/datasets/reanalysis-datasets/era5 (accessed on 23 May 2022)).

Acknowledgments

We thank the providers of PERSIANN-series products, APHRODITE, and ERA5 datasets. In addition, we are particularly grateful to Phu Nguyen for providing comments to help explain the possible factors of bias in the PERSIANN-series products.

Conflicts of Interest

The authors declare no conflict of interest.

References

  1. Chen, C.; Li, Z.; Song, Y.; Duan, Z.; Mo, K.; Wang, Z.; Chen, Q. Performance of Multiple Satellite Precipitation Estimates over a Typical Arid Mountainous Area of China: Spatiotemporal Patterns and Extremes. J. Hydrometeorol. 2020, 21, 533–550. [Google Scholar] [CrossRef]
  2. Huang, W.-R.; Hsu, J.; Liu, P.-Y.; Deng, L. Multiple satellite-observed long-term changes in the summer diurnal precipitation over Luzon and its adjacent seas during 2000–2019. Int. J. Appl. Earth Obs. Geoinf. 2022, 110, 102816. [Google Scholar] [CrossRef]
  3. Huang, W.-R.; Liu, P.-Y.; Hsu, J. Multiple timescale assessment of wet season precipitation estimation over Taiwan using the PERSIANN family products. Int. J. Appl. Earth Obs. Geoinf. 2021, 103, 102521. [Google Scholar] [CrossRef]
  4. Hsu, J.; Huang, W.R.; Liu, P.Y. Performance assessment of GPM-based near-real-time satellite products in depicting diurnal precipitation variation over Taiwan. J. Hydrol. Reg. Stud. 2021, 38, 100957. [Google Scholar] [CrossRef]
  5. Huang, W.R.; Chang, Y.H.; Liu, P.Y. Assessment of IMERG precipitation over Taiwan at multiple timescales. Atmos. Res. 2018, 214, 239–249. [Google Scholar] [CrossRef]
  6. Hsu, J.; Huang, W.-R.; Liu, P.-Y.; Li, X. Validation of CHIRPS Precipitation Estimates over Taiwan at Multiple Timescales. Remote Sens. 2021, 13, 254. [Google Scholar] [CrossRef]
  7. Flores, J.F.; Balagot, V.F. Climate of the Philippines. Climates of Northern and Eastern Asia; Arakawa, H., Ed.; World Survey of Climatology; Elsevier: Amsterdam, The Netherlands, 1969; Volume 8, pp. 159–213. [Google Scholar]
  8. Hong, Y.; Hsu, K.L.; Sorooshian, S.; Gao, X. Precipitation estimation from remotely sensed imagery using an artificial neural network cloud classification system. J. Appl. Meteorol. 2004, 43, 1834–1853. [Google Scholar] [CrossRef] [Green Version]
  9. Nguyen, P.; Ombadi, M.; Sorooshian, S.; Hsu, K.; AghaKouchak, A.; Braithwaite, D.; Ashouri, H.; Thorstensen, A.R. The PERSIANN family of global satellite precipitation data: A review and evaluation of products. Hydrol. Earth Syst. Sci. 2018, 22, 5801–5816. [Google Scholar] [CrossRef] [Green Version]
  10. Salmani-Dehaghi, N.; Samani, N. Spatiotemporal Assessment of the PERSIANN Family of Satellite Precipitation Data over Fars Province, Iran. Theor. Appl. Climatol. 2019, 138, 1333–1357. [Google Scholar] [CrossRef]
  11. Islam, A.; Yu, B.; Cartwright, N. Assessment and comparison of five satellite precipitation products in Australia. J. Hydrol. 2020, 590, 125474. [Google Scholar] [CrossRef]
  12. Ramos, M.D.; Tendencia, E.; Espana, K.; Sabido, J.; Bagtasa, G. Assessment of Satellite Precipitation Products in the Philippine Archipelago. Int. Arch. Photogramm. Remote Sens. Spat. Inf. Sci 2016, XLI-B1, 423–427. [Google Scholar] [CrossRef] [Green Version]
  13. Peralta, J.C.A.; Narisma, G.T.; Cruz, F.A. Validation of High-Resolution Gridded Rainfall Datasets for Climate Applications in the Philippines. J. Hydrometeorol. 2020, 21, 1571–1587. [Google Scholar] [CrossRef]
  14. Aryastana, P.; Liu, C.Y.; Jou, B.J.D.; Cayanan, E.; Punay, J.P.; Chen, Y.N. Assessment of Satellite Precipitation Data Sets for High Variability and Rapid Evolution of Typhoon Precipitation Events in the Philippines. Earth Space Sci. 2022, 9, e2022EA002382. [Google Scholar] [CrossRef]
  15. Ramage, C.S. Monsoon Meteorology, 1st ed.; Academic Press: New York, NY, USA, 1971. [Google Scholar]
  16. Yen, M.C.; Chen, T.C. Seasonal variation of the rainfall over Taiwan. Int. J. Climatol. 2000, 20, 803–809. [Google Scholar] [CrossRef]
  17. Ahmadi, M.; Kashki, A.; Dadashi Roudbari, A. Spatial modeling of seasonal precipitation-elevation in Iran based on aphrodite database. Model. Earth Syst. Environ. 2018, 4, 619–633. [Google Scholar] [CrossRef]
  18. Yatagai, A.; Kamiguchi, K.; Arakawa, O.; Hamada, A.; Yasutomi, N.; Kitoh, A. APHRODITE: Constructing a long-term daily gridded precipitation dataset for Asia based on a dense network of rain gauges. Bull. Am. Meteorol. Soc. 2012, 93, 1401–1415. [Google Scholar] [CrossRef]
  19. Hsu, K.; Gao, X.; Sorooshian, S.; Gupta, H.V. Precipitation estimation from remotely sensed information using artificial neural networks. J. Appl. Meteorol. 1997, 36, 1176–1190. [Google Scholar] [CrossRef]
  20. Ashouri, H.; Hsu, K.-L.; Sorooshian, S.; Braithwaite, D.K.; Knapp, K.R.; Cecil, L.D.; Nelson, B.R.; Prat, O.P. PERSIANN-CDR: Daily precipitation climate data record from multisatellite observations for hydrological and climate studies. Bull. Am. Meteorol. Soc. 2015, 96, 69–83. [Google Scholar] [CrossRef] [Green Version]
  21. Adler, R.F.; Huffman, G.J.; Chang, A.; Ferraro, R.; Xie, P.P.; Janowiak, J.; Rudolf, B.; Schneider, U.; Curtis, S.; Bolvin, D.; et al. The version-2 global precipitation climatology project (GPCP) monthly precipitation analysis (1979–present). J. Hydrometeorol. 2003, 4, 1147–1167. [Google Scholar] [CrossRef]
  22. Sadeghi, M.; Nguyen, P.; Naeini, M.R.; Hsu, K.; Braithwaite, D.; Sorooshian, S. PERSIANN-CCS-CDR, a 3-hourly 0.04° global precipitation climate data record for heavy precipitation studies. Sci. Data 2021, 8, 157. [Google Scholar] [CrossRef]
  23. Nguyen, P.; Ombadi, M.; Gorooh, V.A.; Shearer, E.J.; Sadeghi, M.; Sorooshian, S.; Hsu, K.; Bolvin, D.; Ralph, M.F. Persiann dynamic infrared–rain rate (PDIR-now): A near-real-time, quasi-global satellite precipitation dataset. J. Hydrometeorol. 2020, 21, 2893–2906. [Google Scholar] [CrossRef] [PubMed]
  24. Fick, S.E.; Hijmans, R.J. WorldClim 2: New 1-km spatial resolution climate surfaces for global land areas. Int. J. Climatol. 2017, 37, 4302–4315. [Google Scholar] [CrossRef]
  25. Hersbach, H.; Bell, B.; Berrisford, P.; Hirahara, S.; Horanyi, A.; Muñoz-Sabater, J.; Nicolas, J.; Peubey, C.; Radu, R.; Schepers, D.; et al. The ERA5 global reanalysis. Q. J. R. Meteorol. Soc. 2020, 146, 1999–2049. [Google Scholar] [CrossRef]
  26. Lee, C.-A.; Huang, W.-R.; Chang, Y.-H.; Huang, S.-M. Impact of multiple-scale circulation interactions on the spring diurnal precipitation over Luzon. Sci. Rep. 2021, 11, 9937. [Google Scholar] [CrossRef]
  27. Wilks, D.S. Statistical Methods in the Atmospheric Sciences, 2nd ed.; Academic Press: Cambridge, MA, USA, 2007; ISBN 9780127519661. [Google Scholar]
  28. Riley Dellaripa, E.M.; Maloney, E.D.; Toms, B.A.; Saleeby, S.M.; van den Heever, S.C. Topographic effects on the Luzon diurnal cycle during the BSISO. J. Atmos. Sci. 2020, 77, 3–30. [Google Scholar] [CrossRef]
  29. Matsumoto, J.; Olaguera, L.M.P.; Nguyen-Le, D.; Kubota, H.; Ii, M.Q.V. Climatological seasonal changes of wind and rainfall in the Philippines. Int. J. Clim. 2020, 40, 4843–4857. [Google Scholar] [CrossRef] [Green Version]
  30. Sun, Q.; Miao, C.; Duan, Q.; Ashouri, H.; Sorooshian, S.; Hsu, K.-L. A review of global precipitation data sets: Data sources, estimation, and intercomparisons. Rev. Geophys. 2018, 56, 79–107. [Google Scholar] [CrossRef] [Green Version]
  31. Ombadi, M.; Nguyen, P.; Sorooshian, S.; Hsu, K. Developing intensity-duration-frequency (IDF) curves from satellite-based precipitation: Methodology and evaluation. Water Resour. Res. 2018, 54, 7752–7766. [Google Scholar] [CrossRef]
  32. Hong, Y.; Gochis, D.; Cheng, J.T.; Hsu, K.L.; Sorooshian, S. Evaluation of PERSIANN-CCS rainfall measurement using the NAME Event Rain Gauge Network. J. Hydrometeorol. 2007, 8, 469–482. [Google Scholar] [CrossRef] [Green Version]
  33. Afzali Gorooh, V.; Kalia, S.; Nguyen, P.; Hsu, K.-l.; Sorooshian, S.; Ganguly, S.; Nemani, R. Deep Neural Network Cloud-Type Classification (DeepCTC) Model and Its Application in Evaluating PERSIANN-CCS. Remote Sens. 2020, 12, 316. [Google Scholar] [CrossRef]
  34. Sungmin, O.; Kirstetter, P.E. Evaluation of diurnal variation of GPM IMERG-derived summer precipitation over the contiguous US using MRMS data. Q. J. R. Meteorol. Soc. 2018, 144, 270–281. [Google Scholar]
  35. Derin, Y.; Yilmaz, K.K. Evaluation of multiple satellite-based precipitation products over complex topography. J. Hydrometeorol. 2014, 15, 1498–1516. [Google Scholar] [CrossRef]
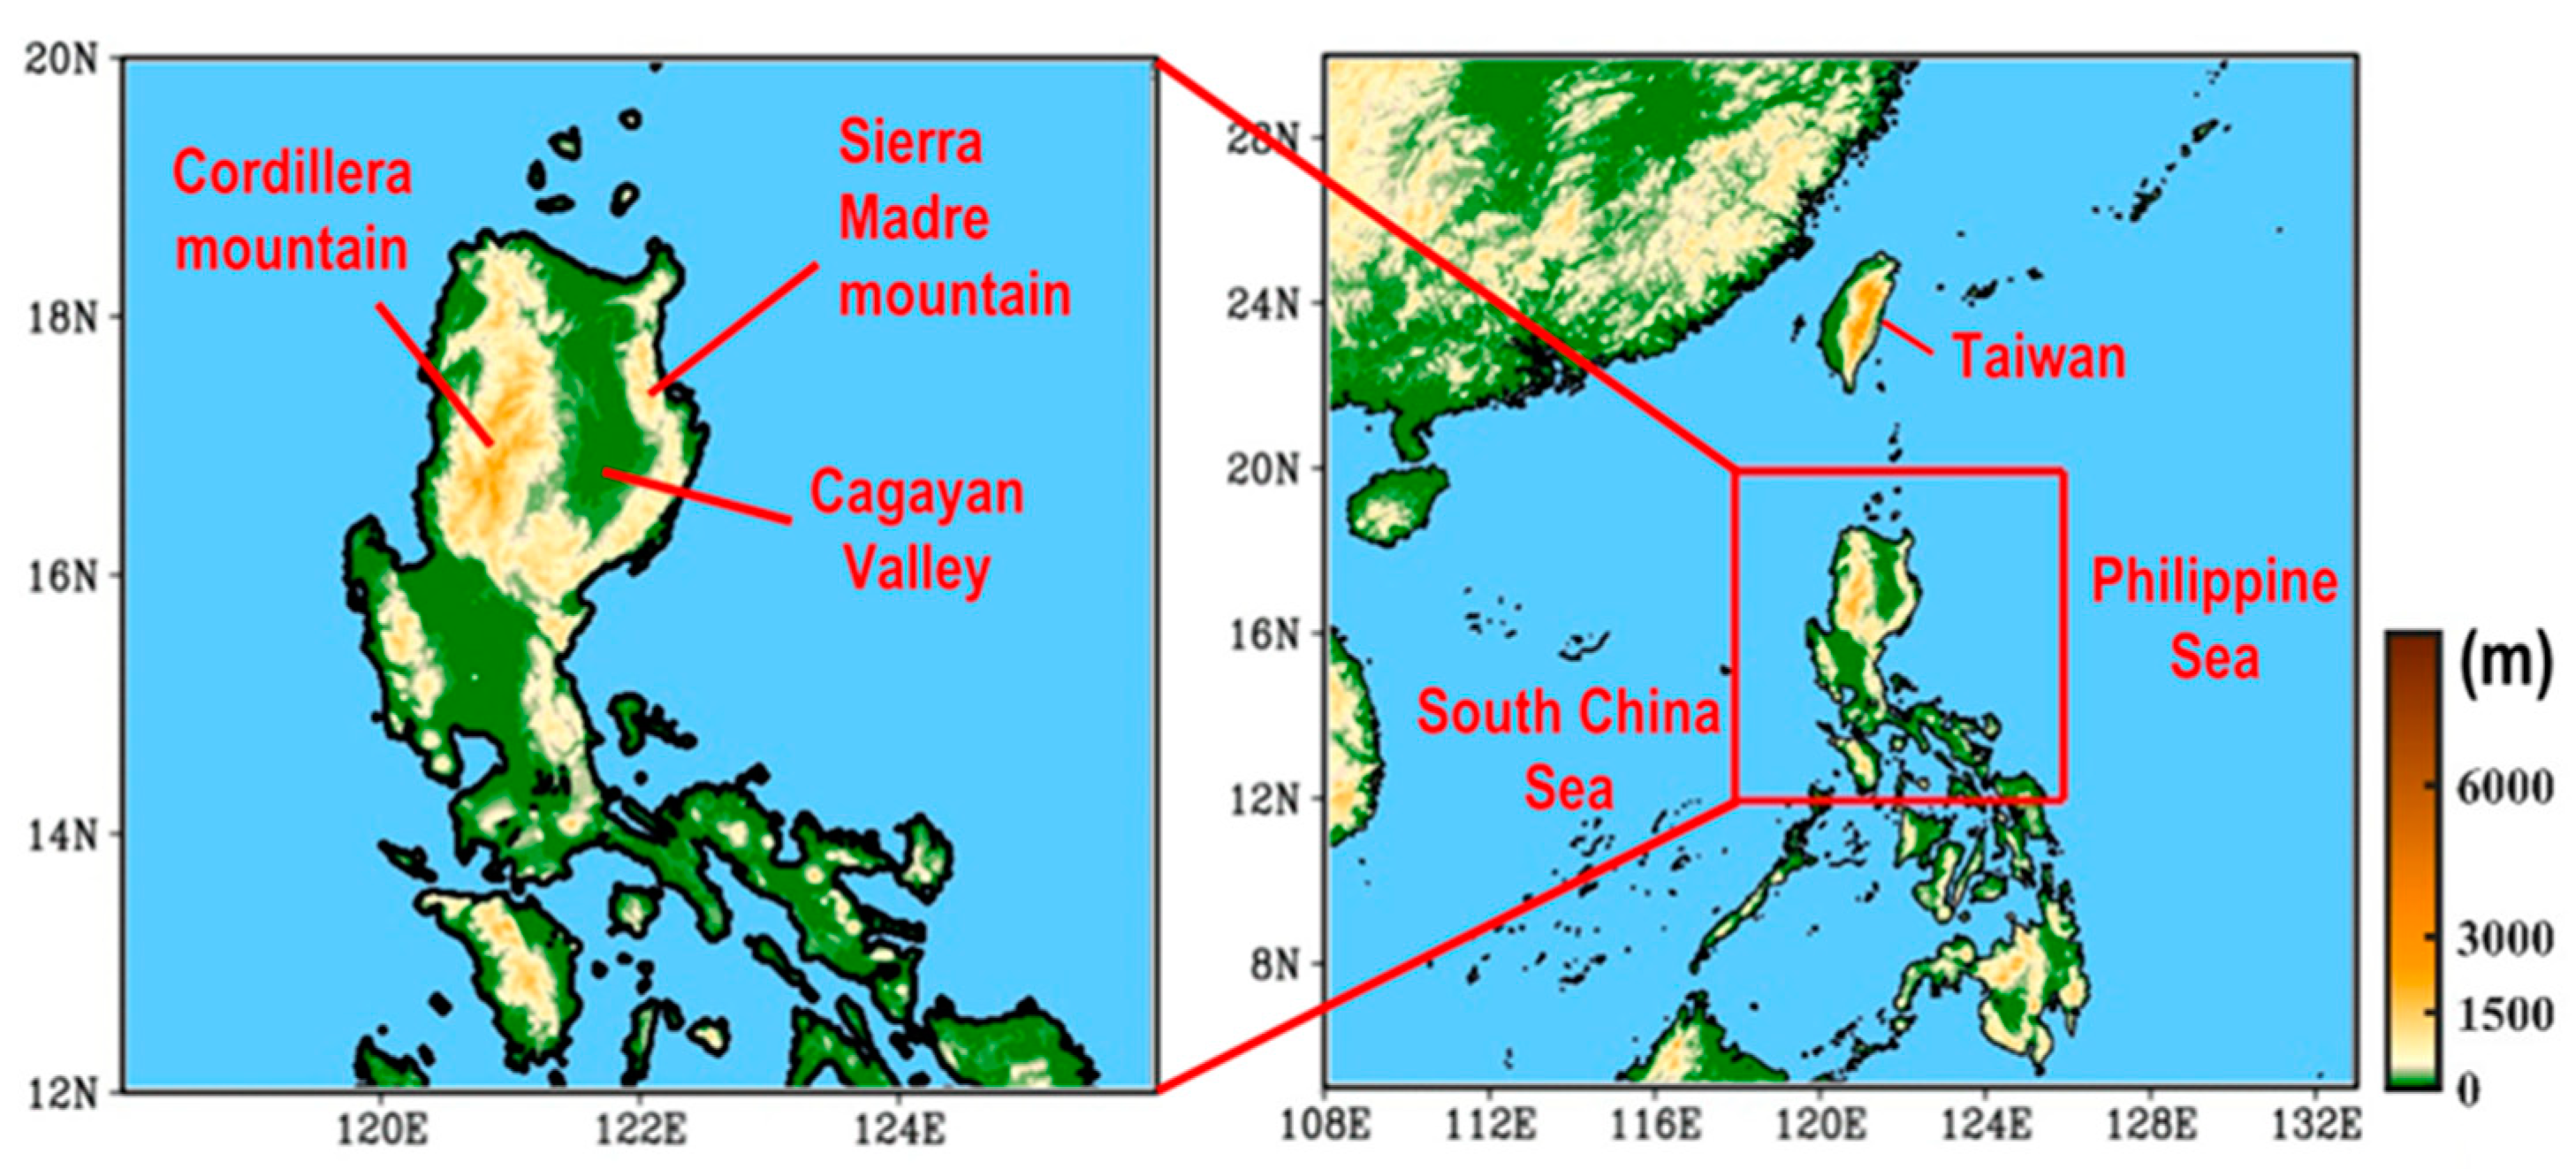
Figure 1. Geographical location and topography of Luzon.
Remotesensing 14 05900 g001
Figure 2. Spatial distribution for the precipitation and wind vector (925 hPa) during four seasons that was averaged from 2003–2015 over two selected domains: (a) East Asia (108°E–133°E, 5°N–30°N); and (b) Luzon (118°E–126°E, 12°N–20°N). Precipitation was extracted from the APHRODITE (hereinafter APHRO), while the wind vector was extracted from the ERA5 reanalysis. MAM, JJA, SON, and DJF denote March to May (spring), June to August (summer), September to November (autumn), and December to February (winter), respectively.
Remotesensing 14 05900 g002
Figure 3. Phase diagram for depicting the timing of the occurrence of maximum value of monthly precipitation constructed based on APHRO and the five products of the PERSIANN-series (including PANN, PCCS, PCDR, PCCSCDR, and PDIR) that were averaged from 2003–2015. The gray line represents the spatial resolution of 0.25° × 0.25° in all data. In the five products of the PERSIANN-series, the areas that depict the same phase as that of APHRO are marked by black dots. To help the discussion in the main text, the number of grid points (at a 0.25° × 0.25° spatial scale) that are covered by dotted areas is provided in the top right panel of each SPP.
Remotesensing 14 05900 g003
Figure 4. Monthly mean precipitation (denote as P) of the APHRO (bar) and the five products of the PERSIANN-series (including PANN, PCCS, PCDR, PCCSCDR, and PDIR) (lines) in the entire Luzon region as averaged from 2003–2015: (b) the correlation coefficient (hereinafter CC) and the root mean square error (hereinafter RMSE) that were calculated between the time series of APHRO and each product of PERSIANN-series in (a); (c) three inland sub-regions of Luzon: west, northeast, and southeast; (d) As in (a), but for west Luzon (c); (e) as in (a), but for northeast Luzon (c); and (f) as in (a), but for southeast Luzon (c).
Remotesensing 14 05900 g004
Figure 5. (a) Grid-to-grid CC between the satellite precipitation products and APHRO for the annual evolution of monthly precipitation as averaged from 2003–2015; and (b) as in (a), but for the RMSE. The contour intervals in (a,b) are 0.05 and 0.5 mm⋅d−1, respectively.
Remotesensing 14 05900 g005
Figure 6. (a) The CC of Figure 5a area-averaged at different elevations; and (b) the RMSE of Figure 5b area-averaged at different elevations.
Remotesensing 14 05900 g006
Figure 7. (a) The scatter plot for the comparison of monthly precipitation between the APHRO and the SPPs from 2003–2015. In (a), the spatial grids (0.25° × 0.25°) over the entire Luzon region are used for comparison. The values of CC and RMSE between the APHRO and the SPPs are added in each panel; and (b) as in (a), but for daily precipitation.
Remotesensing 14 05900 g007
Figure 8. (a) The frequency of daily precipitation events as estimated from Figure 7b at different intensity; and (b) the frequency of various types of precipitation events estimated from (a): non rainy (≤0.1 mm·d−1); rainy (>0.1 mm·d−1); light (0.1–5 mm·d−1); moderate (5–20 mm·d−1); heavy (20–100 mm·d−1); extreme (>100 mm·d−1) events.
Remotesensing 14 05900 g008
Figure 9. Statistical scores calculated for comparing daily precipitation grids that were extracted from Figure 8a between APHRO and five SPPs during 2003–2015 at different precipitation thresholds: (a) the probability of detection (POD); and (b) the false alarm ratio (FAR). In (b), the results for FAR at a 0.1 mm·d−1 threshold are provided in the left top panel and enlarged.
Remotesensing 14 05900 g009
Figure 10. (a) The frequency of hit events at criteria of daily precipitation of >0.1 mm⋅d−1 from 2013–2015 over Luzon. (b) as in (a), but for miss events; and (c) as in (a), but for false alarm events. The contour intervals in (ac) are 250 mm·d−1, 250 mm·d−1, and 50 mm·d−1, respectively.
Remotesensing 14 05900 g010
Figure 11. (a) The spatial distribution of POD at criteria of daily precipitation of >0.1 mm⋅d−1 from 2013–2015 over Luzon; and (b) as in (a), but for FAR. The contour intervals in (a,b) are 0.025 and 0.01, respectively.
Remotesensing 14 05900 g011
Table 1. The information regarding all precipitation datasets and the scheme regarding the algorithm attributes between the satellite precipitation products from the PERSIANN-series.
Short Name of DatasetDatasetSpatial ResolutionPeriodCloud Patch Approach
APHROAPHRODITE0.25° × 0.25°1998/01—2015/12×
PANNPERSIANN0.25° × 0.25°2000/03—NowNo
PCCSPERSIANN-CCS0.04° × 0.04°2003/01—NowYes
PCDRPERSIANN-CDR0.25° × 0.25°1983/01—NowNo
PCCSCDRPERSIANN-CCS-CDR0.04° × 0.04°1983/01—NowYes
PDIRPDIR-Now0.04° × 0.04°2000/03—NowYes
Table 2. Contingency table for the definition of hits, misses, and false alarms that used in Equations (3) and (4). The precipitation rate in ground-based observation or satellite precipitation product (SPP) greater than the selected criteria are indicated as “Yes”, otherwise “No”.
SPP Estimates
YesNo
Ground-based observationYesHitsMisses
NoFalse alarmsCorrect rejections
Table 3. Correlation coefficient (CC) and root mean square error (RMSE; the unit is mm·d−1), for comparison between the time series of ground-based observation (APHRO) and the five products of PERSIANN-series (including PANN, PCCS, PCDR, PCCSCDR, and PDIR) that was extracted from Figure 4. The product possessing highest value of RMSE or lowest value of CC is marked by *.
PANNPCCSPCDRPCCSCDRPDIR
CC; west Luzon0.98 *0.98 *0.98 *0.970.97
CC; northeast Luzon0.900.860.97 *0.960.91
CC; southeast Luzon0.490.440.91 *0.860.71
RMSE; west Luzon1.090.88 *1.121.361.30
RMSE; northeast Luzon1.982.901.73 *2.573.52
RMSE; southeast Luzon3.123.521.13 *1.372.31
Table 4. Area-averaged monthly grid-to-grid correlation coefficient (CC) and root mean square error (RMSE) for comparing APHRO and five products of PERSIANN-series (including PANN, PCCS, PCDR, PCCSCDR, and PDIR) presented in Figure 5. The unit of RMSE is mm·d−1. The product possessing highest value of RMSE or lowest value of CC is marked by *.
PANNPCCSPCDRPCCSCDRPDIR
CC0.800.760.95 *0.910.52
RMSE2.392.691.73 *2.162.49
Publisher’s Note: MDPI stays neutral with regard to jurisdictional claims in published maps and institutional affiliations.