Article

A Prediction Model for the Outbreak Date of Spring Pollen Allergy in Beijing Based on Satellite-Derived Phenological Characteristics of Vegetation Greenness

1
State Key Laboratory of Remote Sensing Science, Faculty of Geographical Science, Beijing Normal University, Beijing 100875, China
2
Beijing Engineering Research Center for Global Land Remote Sensing Products, Faculty of Geographical Science, Beijing Normal University, Beijing 100875, China
*
Author to whom correspondence should be addressed.
Remote Sens. 2022, 14(22), 5891; https://doi.org/10.3390/rs14225891
Submission received: 7 September 2022 / Revised: 27 October 2022 / Accepted: 16 November 2022 / Published: 21 November 2022

Abstract

:
Pollen allergies have a serious impact on people’s physical and mental health. Accurate and efficient prediction of the outbreak date of pollen allergies plays an important role in the conservation of people sensitive to allergenic pollen. It is a frontier research to combine new social media data and satellite data to develop a model to forecast the outbreak date of pollen allergies. This study extracted the real outbreak dates of spring pollen allergies from Sina Weibo records from 2011 to 2021 in Beijing and calculated five vegetation indices of three vegetation types as phenological characteristics within the 30 days before the average outbreak date. The sensitivity coefficients and correlation coefficients were used to screen the phenological characteristics that best reflected the outbreak date of spring pollen allergy. Based on the best characteristic, two kinds of prediction models for the outbreak date of spring pollen allergy in Beijing were established (the linear fit prediction model and the cumulative linear fit prediction model), and the root mean square error (RMSE) was calculated as the prediction accuracy. The results showed that (1) the date of EVI2 (2-band enhanced vegetation index) in evergreen forest first reaching 0.138 can best reflect the outbreak date of pollen allergies in spring, and (2) the cumulative linear fit prediction model based on EVI2 in evergreen forests can obtain a high accuracy with an average RMSE of 3.6 days, which can predict the outbreak date of spring pollen allergies 30 days in advance. Compared with the existing indirect prediction models (which predict pollen concentrations rather than pollen allergies), this model provides a new direct way to predict pollen allergy outbreaks by using only remote sensing time-series data before pollen allergy outbreaks. The new prediction model also has better representativeness and operability and is capable of assisting public health management.

1. Introduction

Pollen allergy is a disease that causes patients to present with IgE-induced (immunoglobulin E) allergy symptoms after inhalation or exposure to pollen allergens [1], such as allergic rhinitis, allergic conjunctivitis, asthma, urticaria, and allergic dermatitis. In Europe, more than 15% of the population suffers from pollen allergies, and the proportion of pollen allergy sufferers is much higher in urban areas [2]. In China, the probability of diseases caused by pollen allergies is 0.5–1.0%, reaching approximately 5% in densely populated areas [3], and the rate of incidence is increasing continuously [4]. For pollen-allergic patients, the most direct way of relieving the symptoms of pollen allergy is to suggest the use of protective gear during the pollen allergy period. Hence, effectively predicting the outbreak date of pollen allergies can help to inform patients for when protection is necessary.
Airborne pollen is an important cause of pollen allergies [5], and the outbreak date of pollen is closely related to vegetation phenology. Remote sensing data have been widely used in vegetation phenology monitoring [6,7]. Therefore, using remote sensing data to reveal the outbreak date of pollen allergies and the greenness characteristics before the outbreak date can facilitate the prevention of pollen allergy diseases.
Current related studies on pollen allergy monitoring based on remote sensing data mainly focus on detecting pollen sources [8,9], extracting the flowering date [10,11], and identifying spectral features of pollen [12,13,14]. Satellite-based monitoring of the flowering date is difficult due to the short flowering period (5–30 days) and the relatively weak spectral signals of flowers at large scales. Satellite data with coarse spatial resolution (e.g., Landsat and MODIS) have fewer applications for monitoring flowering dates due to their low ability to distinguish optical signals of flowering. However, the flowering date is closely related to the phenological characteristics of vegetation greenness [15]. Therefore, the satellite data with moderate and low spatial resolution are able to indirectly reflect the flowering date through the earlier greenness characteristics of vegetation despite its inability to directly detect the spectral signals of flowering, which provides a possibility to monitor the outbreak date of pollen allergy.
The flowering period and pollen concentration are closely related to the symptoms of pollen allergy sufferers [16], so the current prediction models for pollen allergy outbreaks are mainly established to forecast the start date of flowering and the concentration of airborne pollen. Høgda et al. [17] predicted the start of the pollen season of Nordic birch based on the relationship between the normalized difference vegetation index (NDVI) and the phenology records of sites. Karlsen et al. [10] produced a map to characterize the onset of the birch pollen season utilizing NDVI satellite data. Khwarahm et al. [18] developed a technique to estimate the flowering phenophase of birch and grass from MERIS terrestrial chlorophyll index (MTCI) time-series data. Since the start date of the pollen season was recorded by monitoring the concentration of airborne pollen at sites, some studies started to predict the outbreak date of pollen allergies through the empirical relationship between pollen concentration and meteorological parameters [19]. For instance, He et al. [20] established a statistical model for pollen concentration prediction in Beijing combined with meteorological data. Iglesias et al. [21] developed a pollen concentration prediction model of sycamores in northwestern Spain based on temperature data. Myszkowska et al. [22] constructed a pollen concentration prediction model based on the relationship between the pollen concentration of multiple vegetation types and meteorological parameters in southern Poland. However, pollen monitors can only reflect pollen concentrations at the site scale because of their limited spatial coverage. Predicting pollen concentration based on the empirical relationship between pollen concentration and meteorological parameters tends to ignore the effects of other environmental factors on pollen concentration [23]. Therefore, some studies have developed pollen concentration prediction models based on remote sensing data, such as using machine learning methods to establish the relationship between pollen concentration and remote sensing data to predict future pollen concentrations [23,24,25,26]. However, neither the start date of flowering nor the concentration of pollen can fully reflect the outbreak date of pollen allergy, as they are only necessary conditions for pollen allergy rather than sufficient conditions. For example, the pollen concentration is also high in southern China in spring and autumn [27], but the concurrent number of pollen allergic patients is smaller than that in northern China [28]. This contradiction is because pollen allergy is caused by the allergenic pollen concentration rather than the total pollen concentration, and it is also related to seasonal changes in human immunity [29]. Therefore, it is necessary to establish a direct relationship between the incidence of pollen allergy (rather than flowering date or pollen concentration) and remote sensing data to predict the outbreak date of pollen allergy.
Beijing has various plants with allergenic pollen due to the warm temperate semi-humid climate [30], and the three main plants that cause pollen allergy in spring are cypress, poplar, and willow (especially cypress), whose flowering periods are all close to each other [31], resulting in a high risk of pollen allergy [32]. Shi [33] found that one-quarter to one-third of respiratory allergy patients in Beijing are allergic to pollen. Wang et al. [34] discovered that the pollen concentration in Beijing has two peaks, spring (March to April) and summer-autumn (August to September), where allergic pollen mainly comes from woody plants in spring and herbaceous plants in summer-autumn. Meanwhile, the incidence of pollen allergies also has an obvious seasonal pattern, with a high incidence mainly in spring and autumn [35]. To benefit pollen allergic patients in Beijing, researchers have established a pollen concentration prediction model based on meteorological parameters since 2016 to predict recent pollen concentrations in all districts of Beijing [36]. However, the prediction model can only forecast pollen concentration at sites and tends to ignore the effects of other environmental factors on pollen concentration due to the limit of pollen monitor amounts and the uncomprehensive representativeness of meteorological parameters. To address this problem, some scholars have started to apply satellite data to build pollen concentration prediction models in Beijing. Bian et al. [23] established a next-day pollen concentration prediction model based on the average vegetation leaf area index (LAI) and daily meteorological data of tree and grass growth areas in Beijing with a nonlinear autoregressive neural network model (NARXnet). Although the prediction model has a high accuracy, the forecast period is very short, i.e., only for the next day but not for the medium or long term (e.g., the next 10 days or one month), and the forecast content is the total pollen concentration rather than the incidence of pollen allergy. Therefore, it is still difficult to aid the prevention of pollen allergies.
Although there are two peak periods for pollen allergy in Beijing, spring and summer-autumn, we focused on the spring pollen allergy and its vegetation phenological characteristics for prediction models, considering that the vegetation phenology changes more obviously in spring. This study aims to address two issues: first, to reveal the satellite-derived phenological characteristics of vegetation greenness on and before the outbreak date of spring pollen allergy in Beijing; and second, to establish a direct prediction model for the outbreak date of spring pollen allergy in Beijing based on the satellite-derived phenological characteristics of vegetation greenness.

2. Materials and Methods
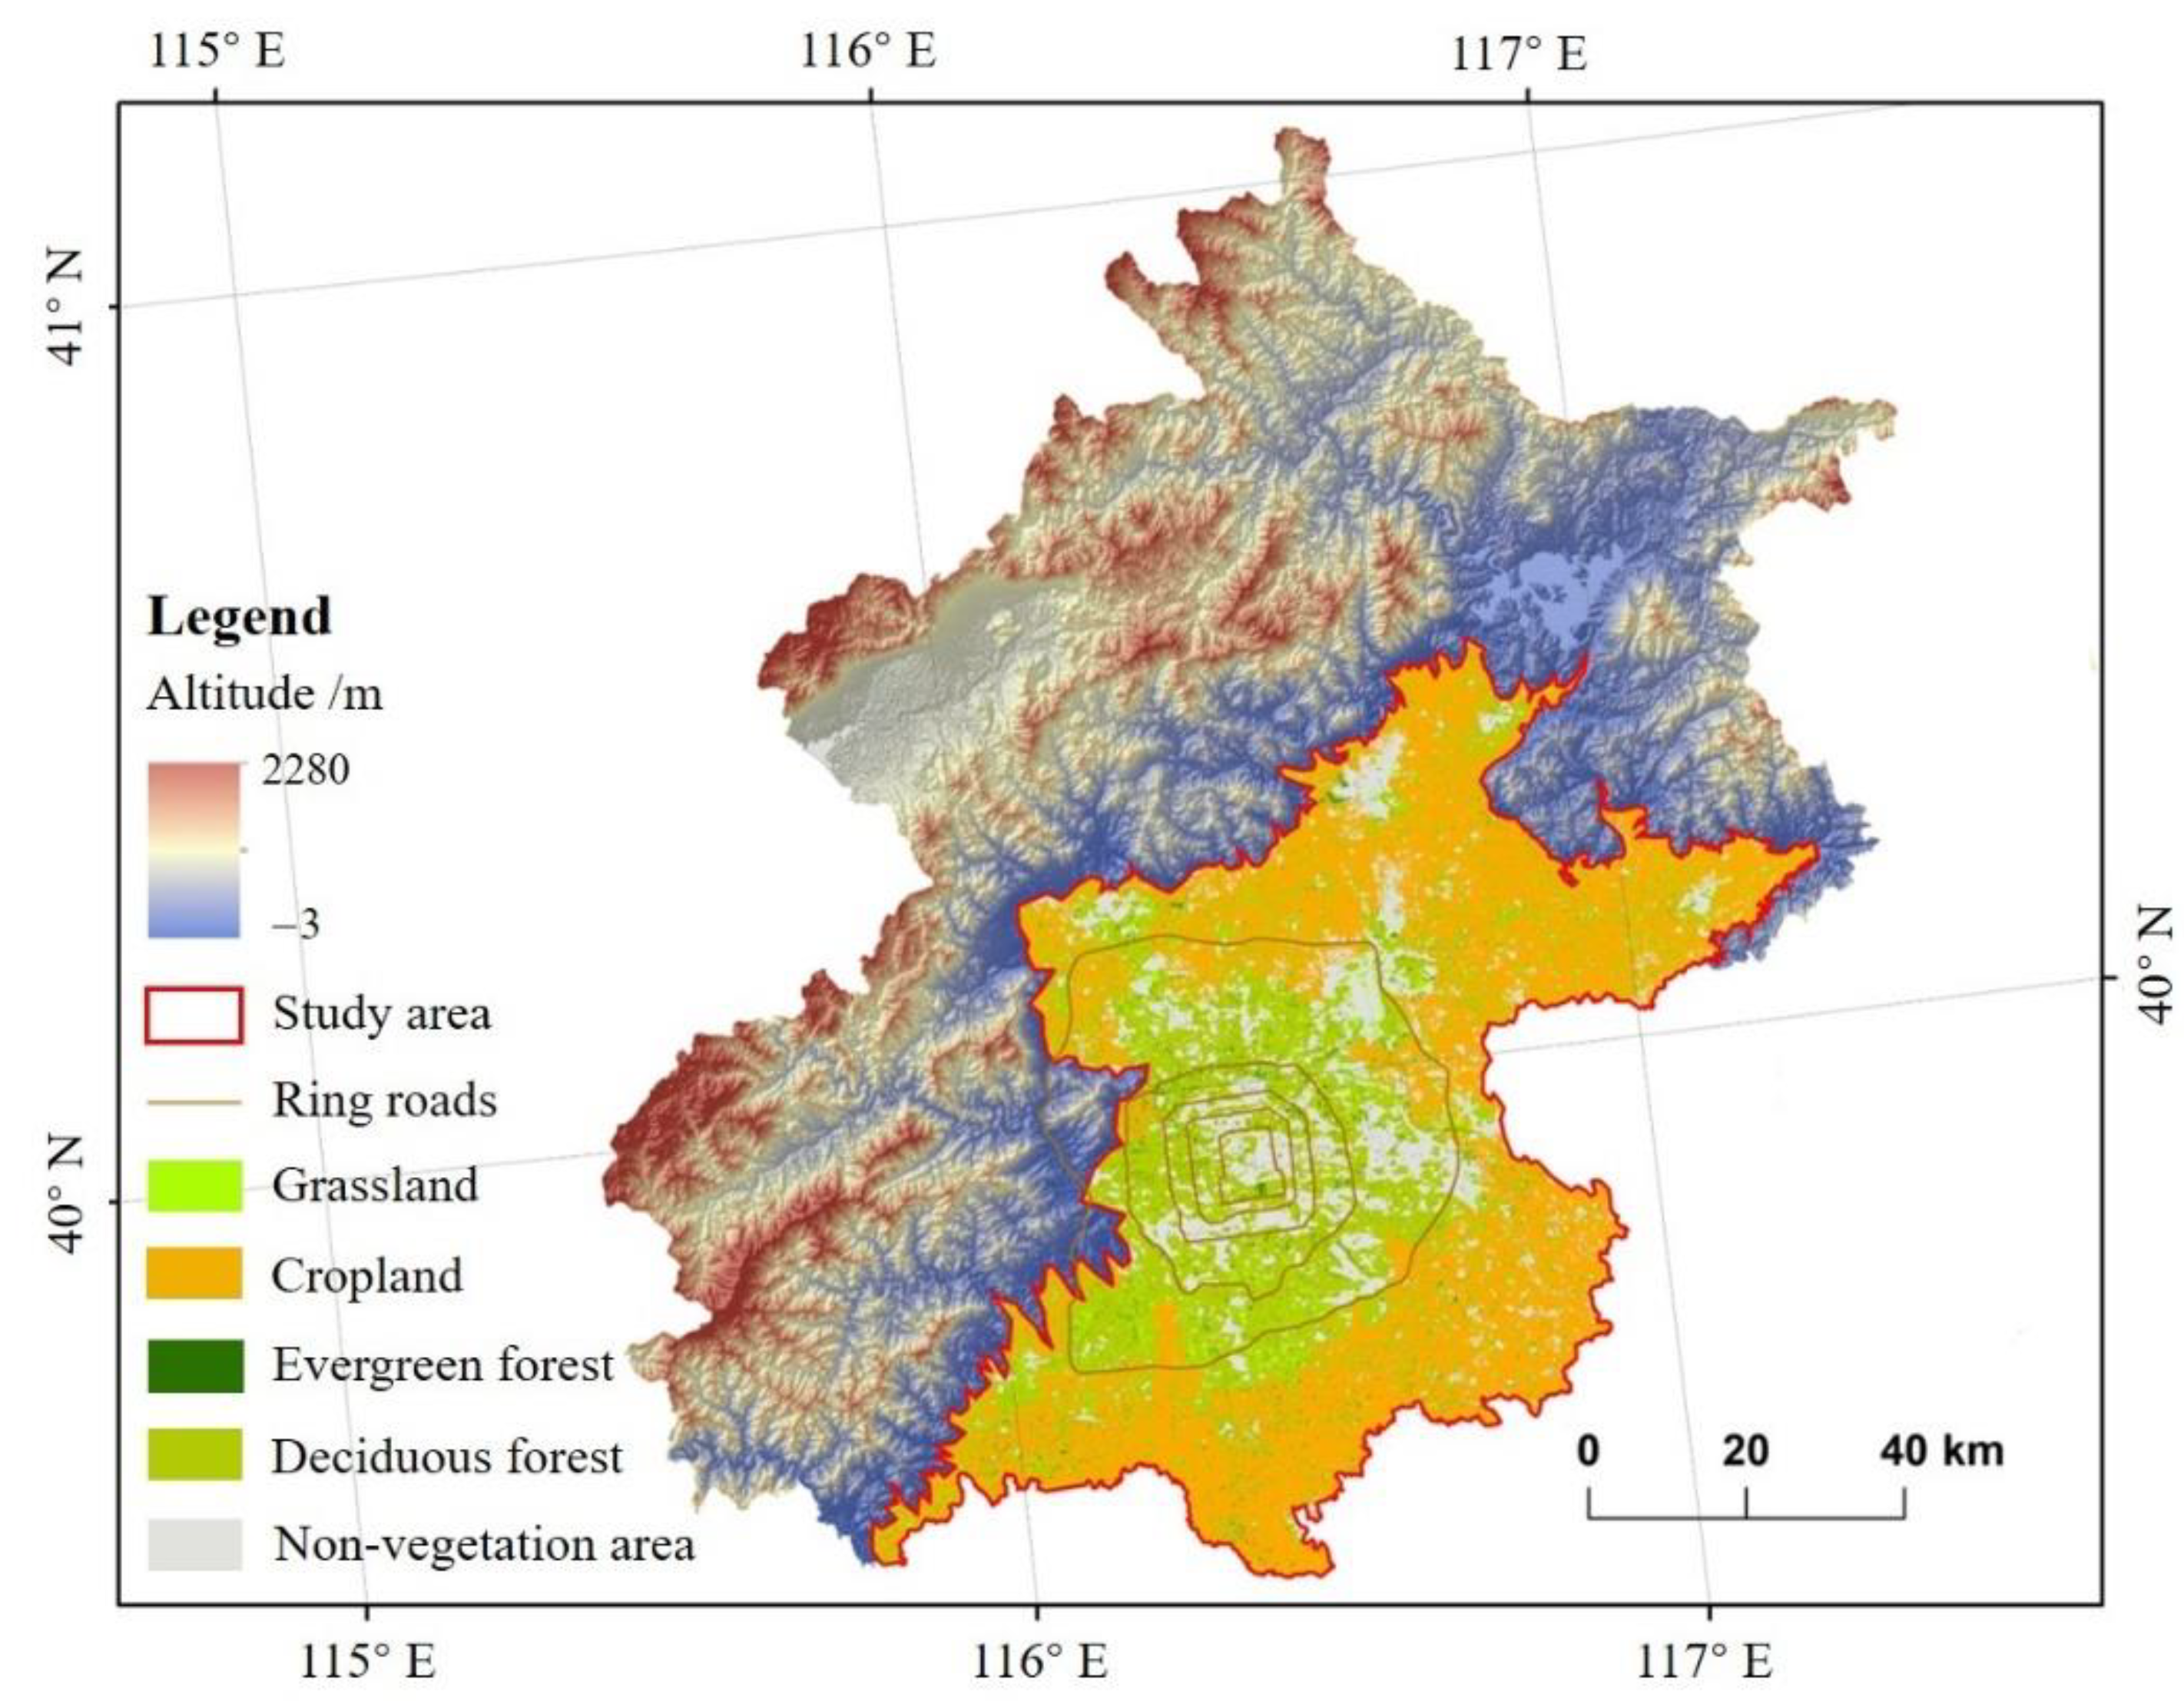
2.1. Study Area

Beijing is surrounded by mountains in the west and north, and its middle is a plain open to the southeast (Figure 1). The plain in the urban area of Beijing with a similar vegetation phenology was selected as the study area (elevation ≤ 100 m) because the local climates and vegetation phenology differ significantly between the plain and the surrounding mountains in Beijing. The study area is located within 39°28′N–40°53′N, 115°83′E–117°30′E, with a warm-temperate semi-humid monsoon climate, an average annual temperature of 12 °C [37], an average annual precipitation of 621 mm [38], and diverse vegetation types. Wang et al. [39] investigated the pollen sources in Beijing urban area and found that the main pollen comes from buttercup (Ranunculaceae), amaranth (Amaranthaceae), pine (Pinaceae), cypress (Cupressaceae), elm (Ulmaceae), birch (Betula), artemisia (Artemisia), quinoa (Chenopodium), willow (Salix), humulus (Humulopsis), and Planetree (Platanus), and the highly allergenic pollen comes from Chinese pine (Pinus tabuliformis), cork oak (Quercus variabilis), green ash (Fraxinus pennsylvanica), poplar (Populus tomentosa), tree of heaven (Ailanthus altissima), birch (Betula platyphylla), white elm (Ulmus pumila) and China savin (Juniperus chinensis). The types of allergenic pollen vegetation differ from season to season, with woody plants such as elm (Ulmaceae), cypress (Cupressaceae), pine (Pinaceae), and willow (Salix) in spring and herbaceous plants such as mulberry (Moraceae), chrysanthemum (Asteraceae), quinoa (Chenopodiaceae), and Graminae (Poaceae) in autumn [40].

2.2. Data

2.2.1. The Outbreak Dates of Spring Pollen Allergy

The outbreak dates of pollen allergies in Beijing were extracted from Sina Weibo records (see details in Appendix A). We obtained 13,404 pollen allergy Weibo records from 2011 to 2021 in Beijing in total, and 1803 valid records were manually screened for analysis. The outbreak dates of spring pollen allergies in Beijing were extracted from the maximum point on the second derivative of the fitted curve for Weibo data with the logistic function. The earliest date of the spring pollen allergy outbreak was on the 70th day (11th March), and the latest date was on the 91st day (1st April) in Beijing from 2011 to 2021. The extraction results were consistent with the outpatient records of pollen allergies in Beijing [34].

2.2.2. Remote Sensing Data

The satellite vegetation indices were downloaded from the Google Earth Engine (GEE). We selected the MODIS surface reflectance daily dataset (MOD09GA) with a resolution of 250 m from 2011 to 2021 to calculate different vegetation indices for different vegetation types during these 11 years.

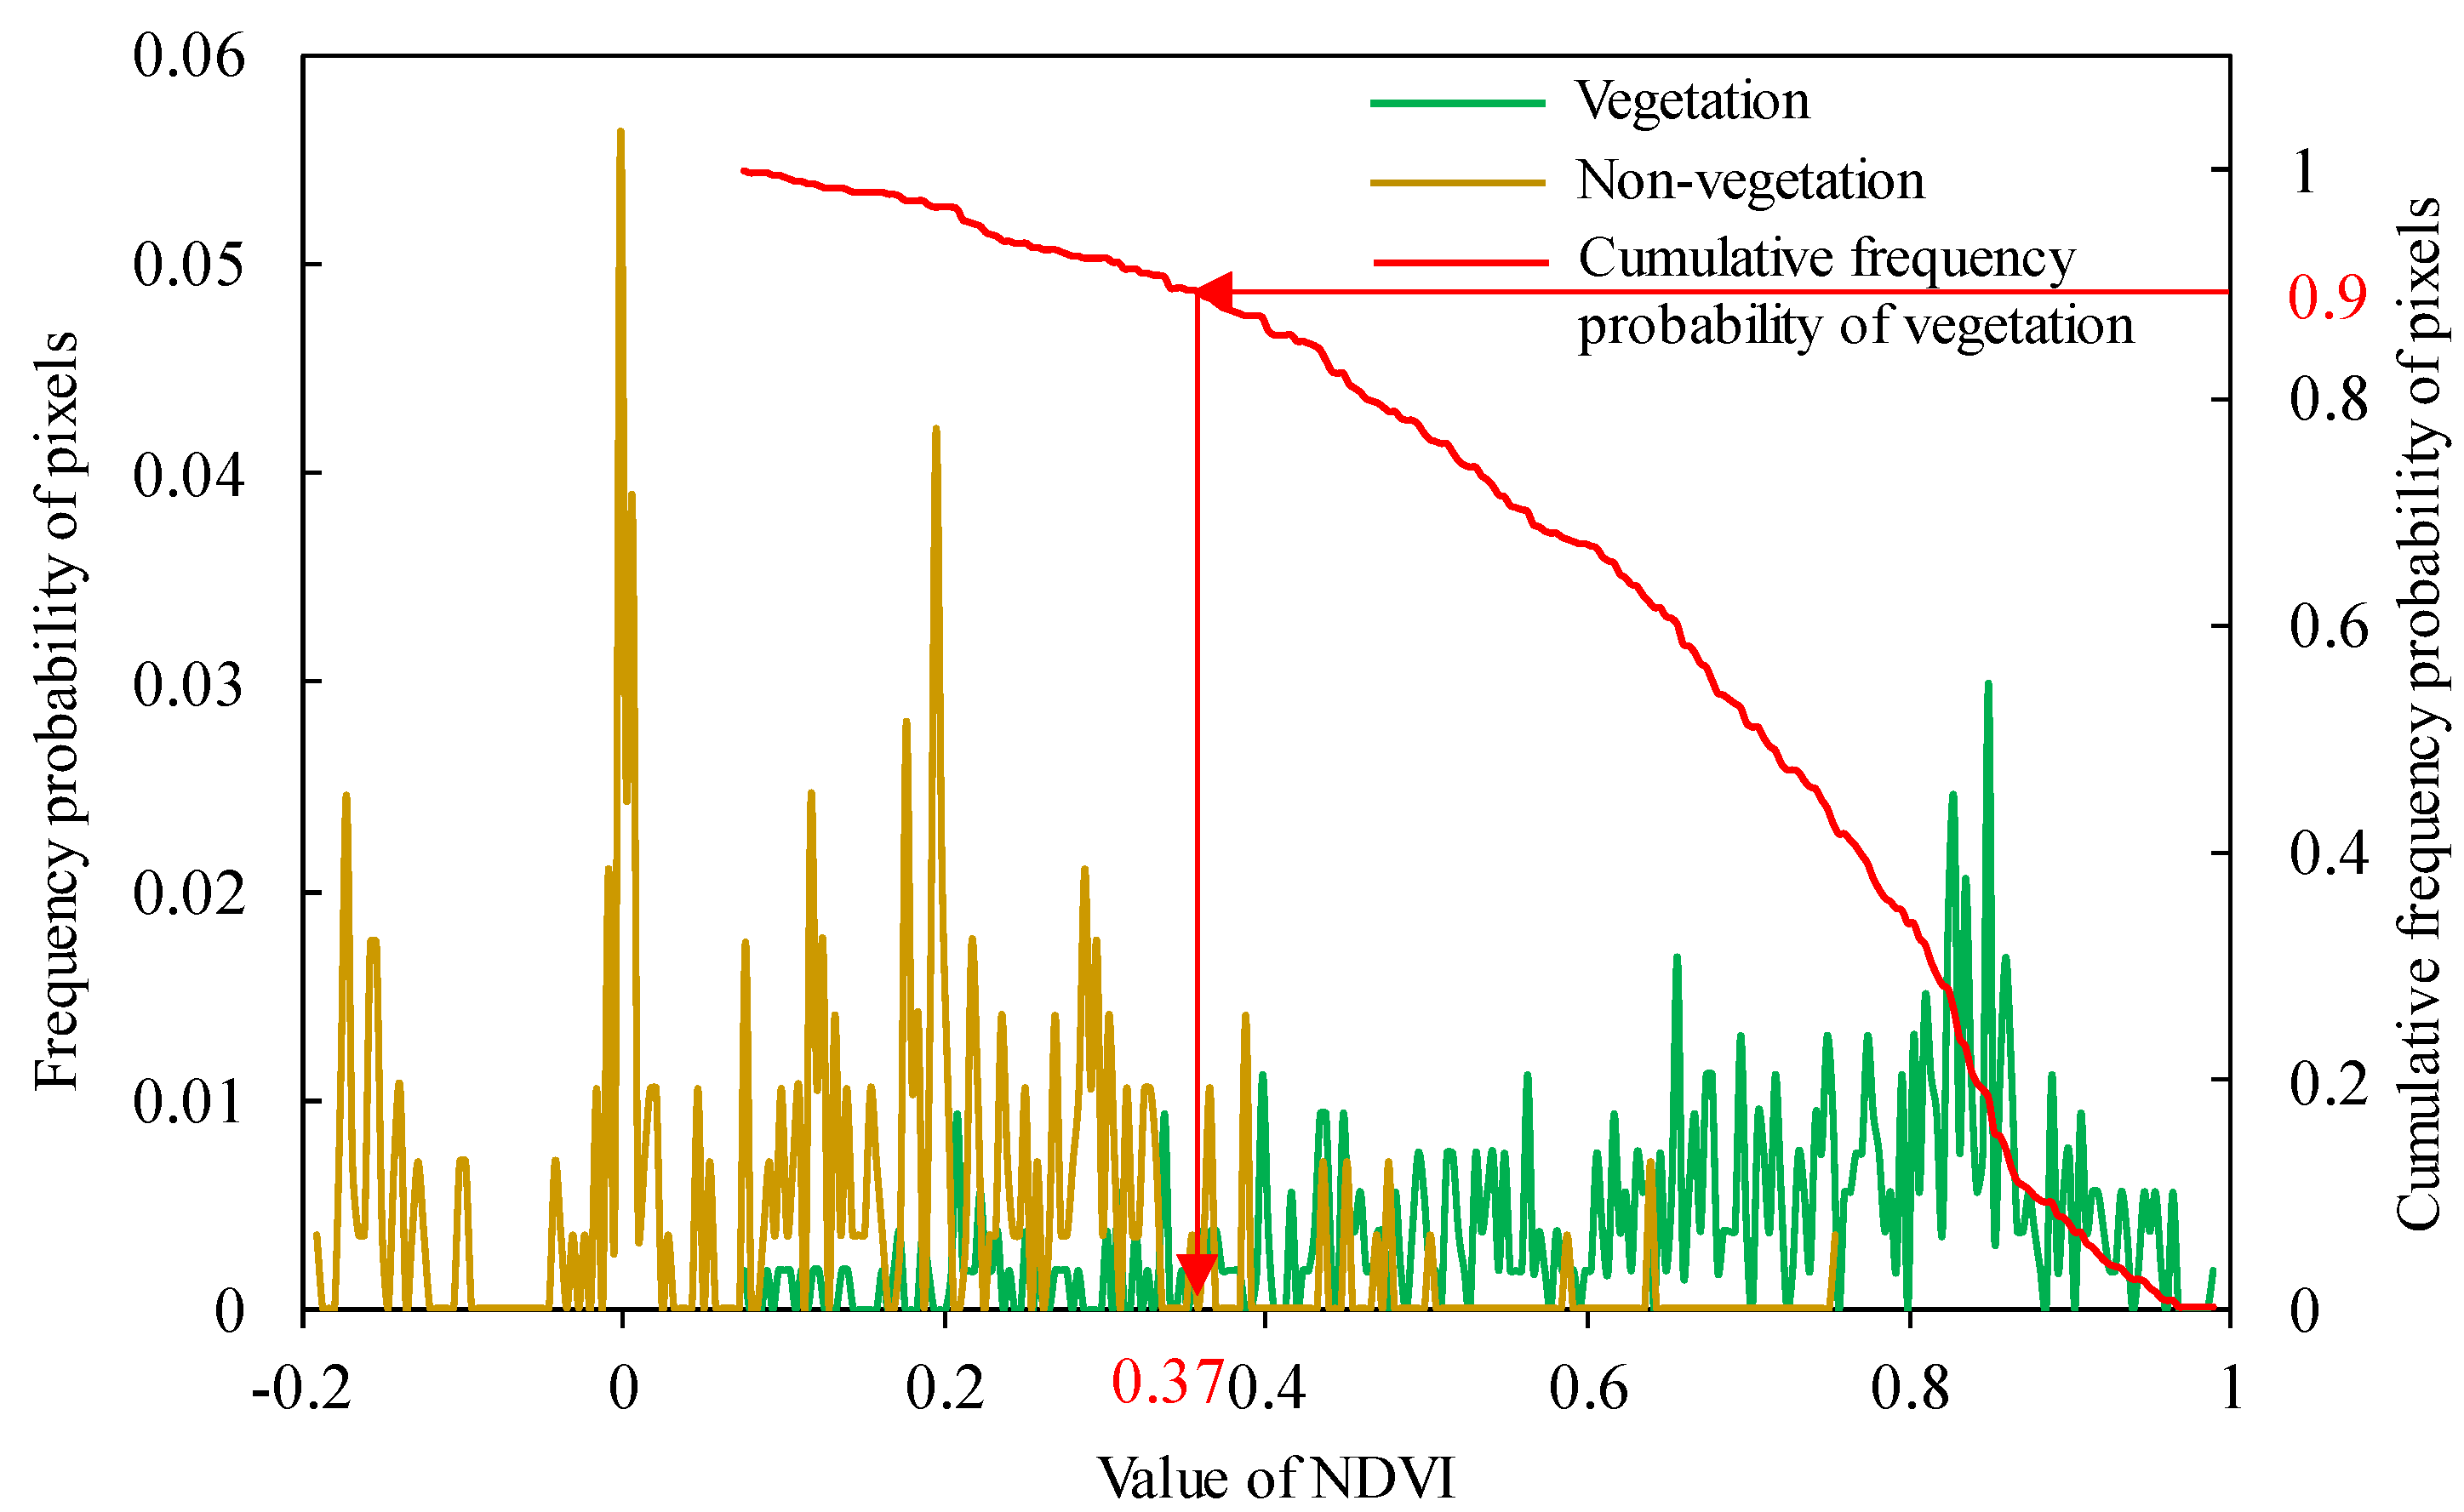
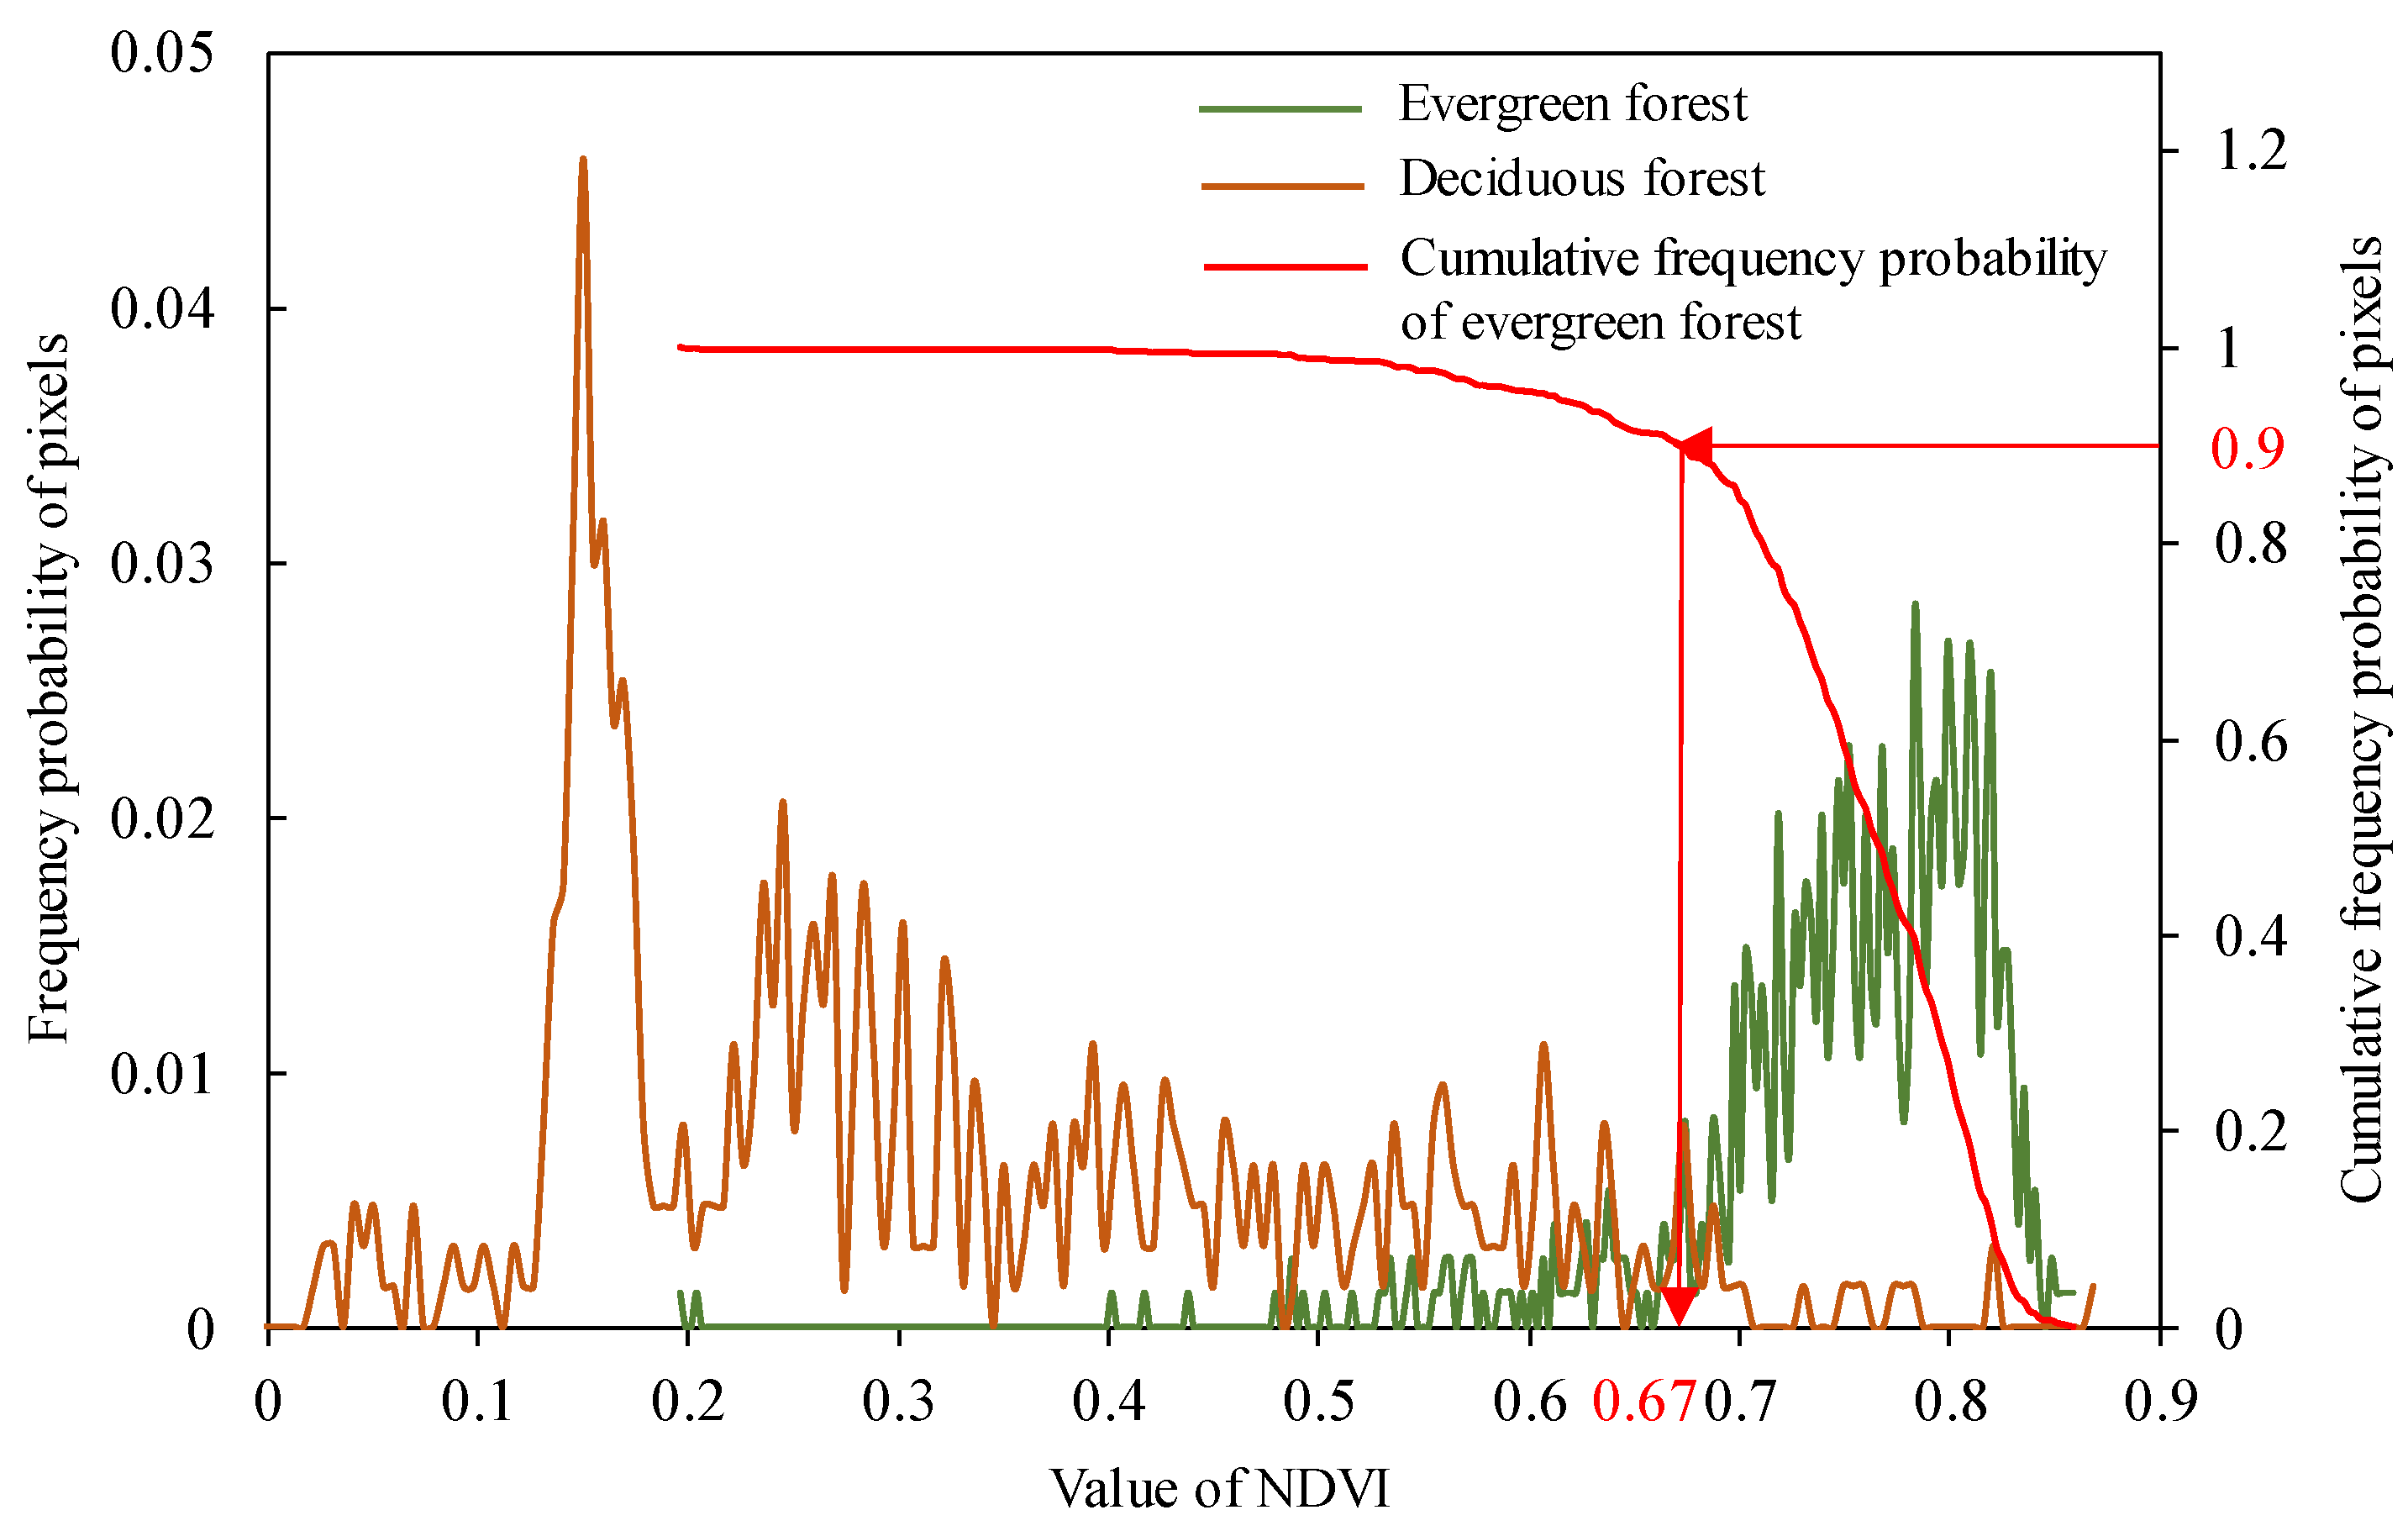
2.2.3. Vegetation Classification Data
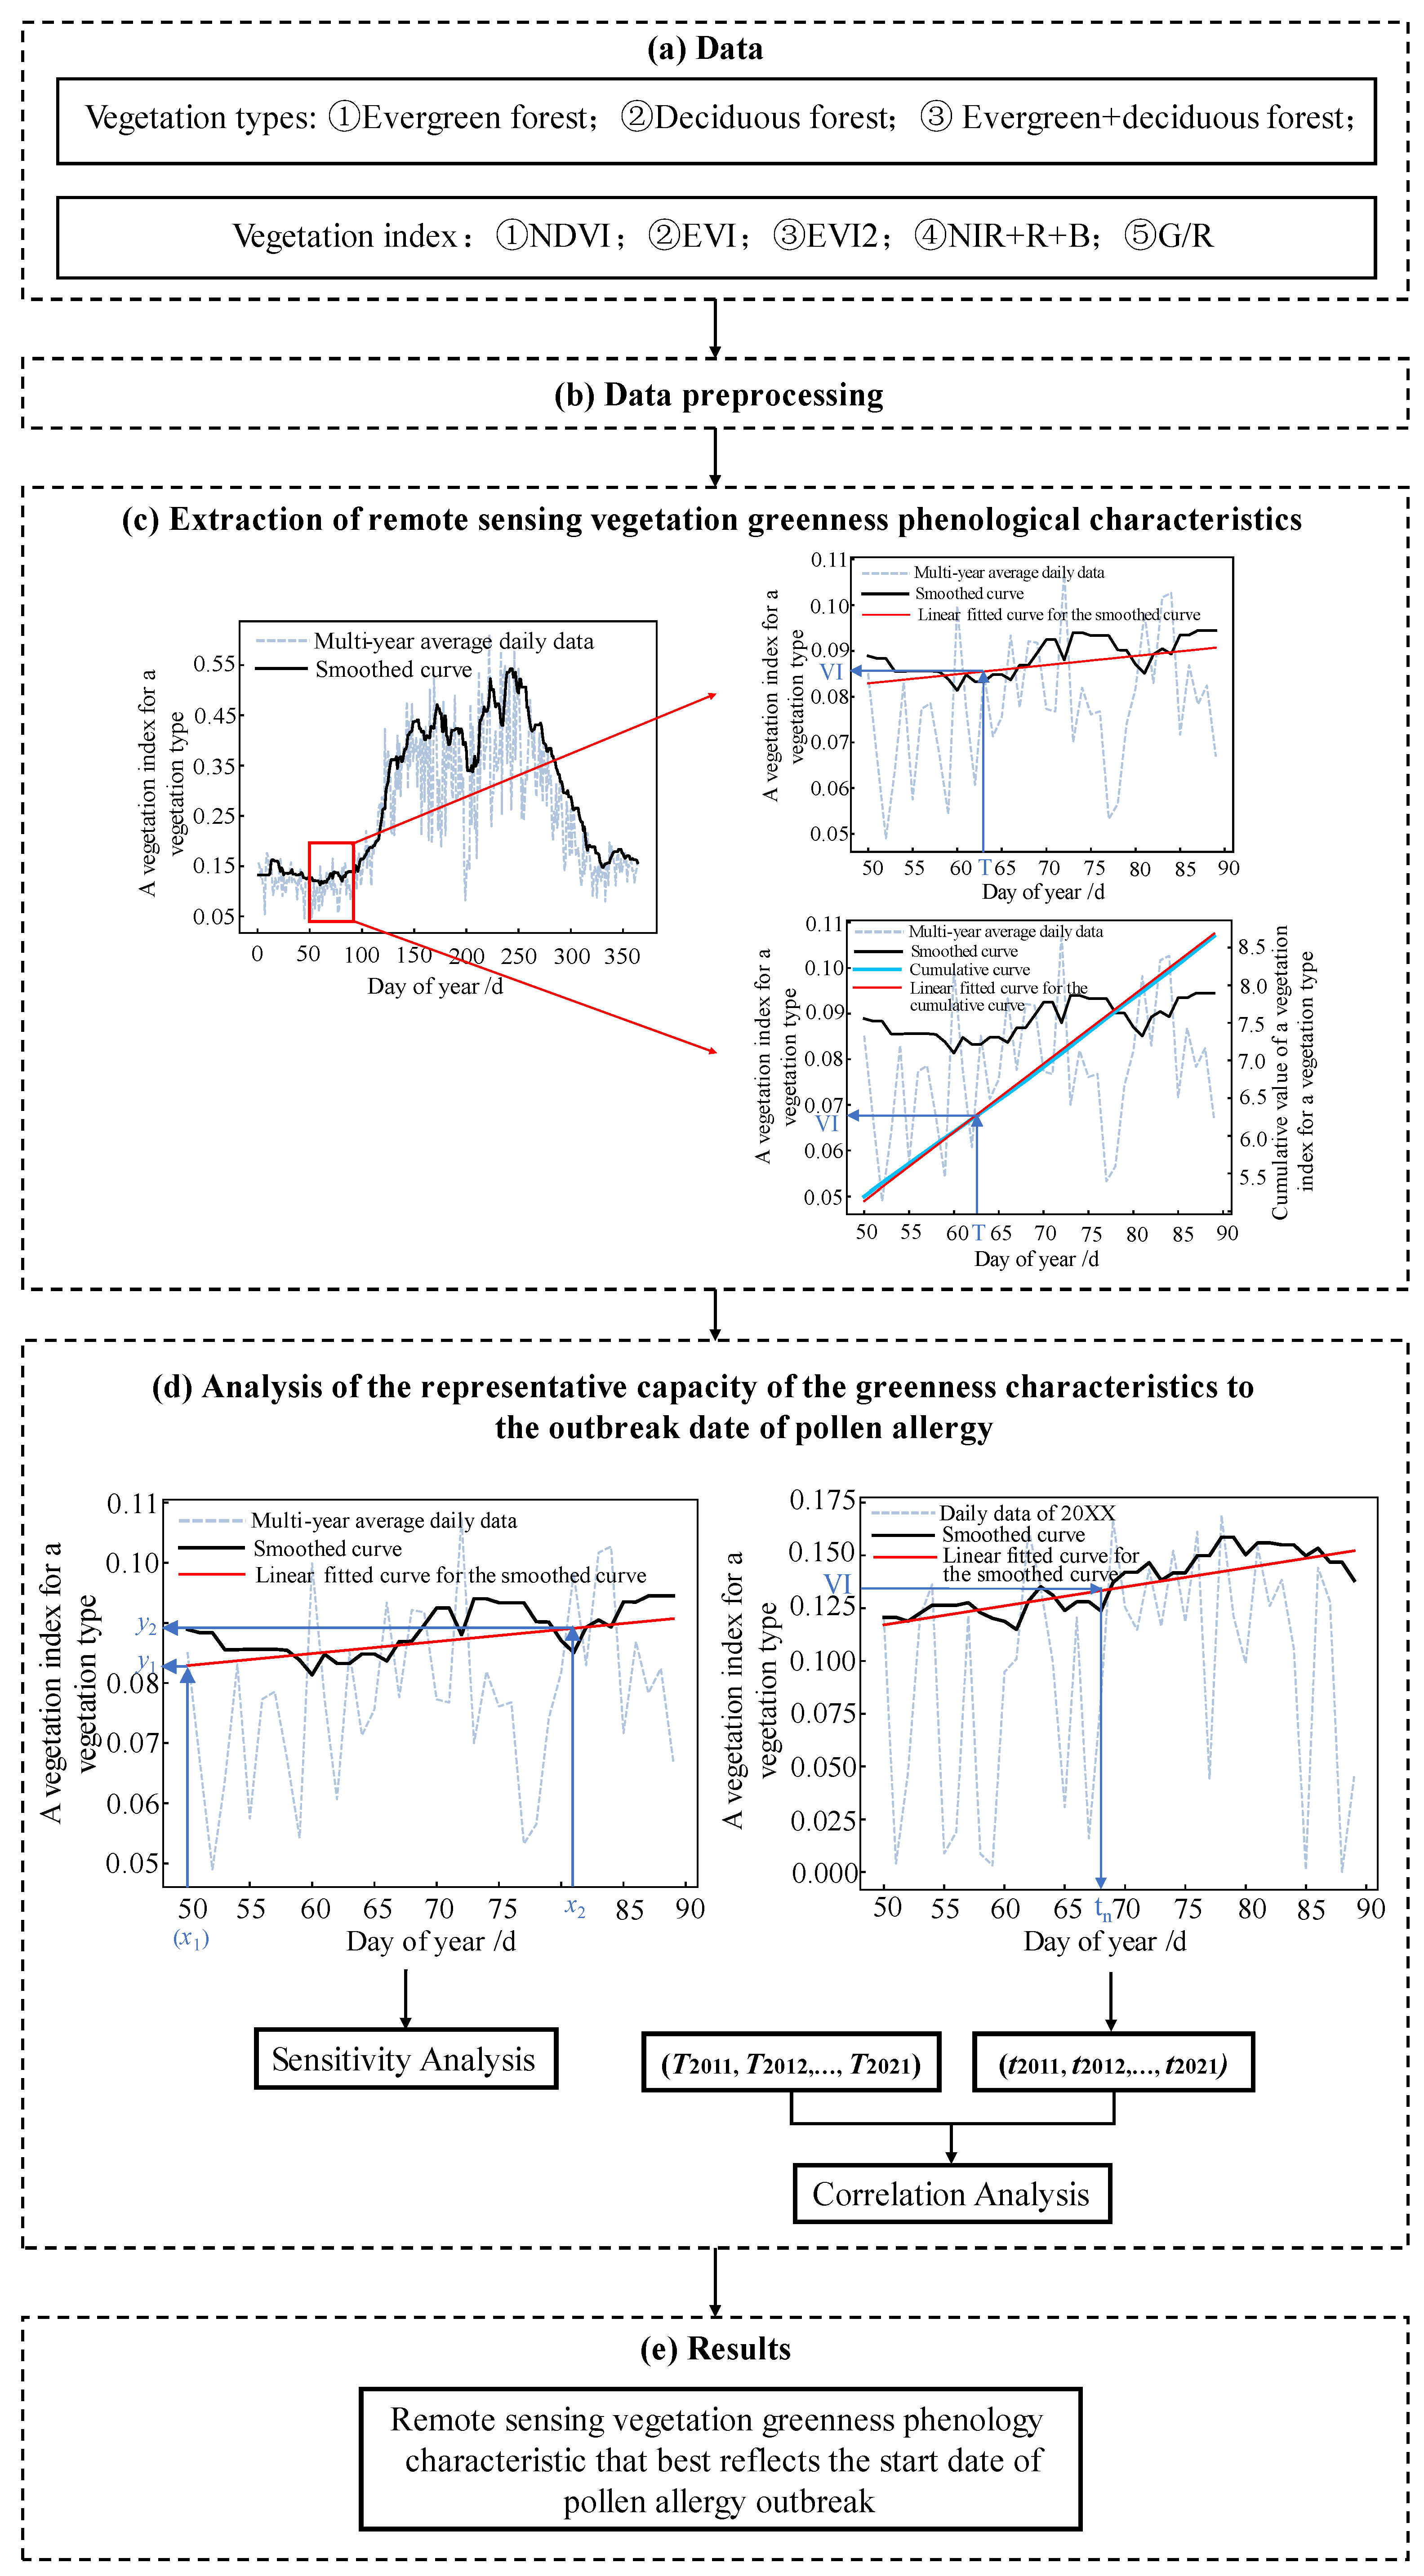
A vegetation classification map with a resolution of 500 m was produced based on satellite data in 2020 and 2021 and the FROM-GLC10 land cover map released by Tsinghua University, which classified the study area into evergreen forest, deciduous forest, grassland, cropland, and non-vegetation areas (Figure 1). The details of specific vegetation classification data and methods are listed in Appendix B. This study focuses on two vegetation types, evergreen forest and deciduous forest, which are related to spring pollen allergens.

2.3. Methods

2.3.1. Extraction of Satellite-Derived Phenological Characteristics of Vegetation Greenness within the 30 Days before the Spring Average Pollen Allergy Outbreak Date during 2011–2021

The concentration and type of pollen are related to the vegetation type in a region [41]. Given that the allergenic vegetation in Beijing is mainly woody plants in spring [42], we selected the vegetation indices in forests to calculate the greenness characteristics before the outbreak date of pollen allergy in spring.
With reference to the study results of pollen identification based on remote sensing spectral features by Peng et al. [12], we used the normalized difference vegetation index (NDVI), enhanced vegetation index (EVI), 2-band enhanced vegetation index (EVI2), the sum of blue, red, and near-infrared reflectance (NIR + R + B) and the ratio of green to red reflectance (G/R) to analyze the characteristic.
For a certain vegetation type, the satellite-derived phenological characteristic of vegetation greenness is defined as a combination of a certain vegetation index value and its corresponding date. The technical process for the extraction of the greenness characteristics before pollen allergy outbreak is shown in Figure 2, which includes the following three main steps: (1) The preprocessing of remote sensing vegetation index time-series data; (2) the extraction of satellite-derived phenological characteristics of vegetation greenness; and (3) the analysis of the representative capacity of the greenness characteristics to the outbreak date of pollen allergy.
(1) Preprocessing of remote sensing vegetation index time-series data
The daily remote sensing images from 2011 to 2021 were used to calculate the vegetation index value for each vegetation type. Since there are many noises in the daily time-series data, we adopted two methods to reduce the noises. First, the spatial 5% trimmed mean of each vegetation index value in every vegetation type was taken as the daily phenological characteristics for each year. Second, the data were smoothed by taking the mean of the higher 6 values within the previous 11-day filtering window for each day.
Since we have set the forecast of pollen allergies to be 30 days in advance and the earliest date of spring pollen allergies in Beijing from 2011 to 2021 is the 70th day and the latest date is the 91st day, we only need to consider the vegetation index time-series data from the 50th to 90th day of each year (Figure 2c). Based on the shape of the vegetation index time-series curve from the 50th to the 90th day, as shown in Figure 2c, we chose a linear function to fit the daily time-series curve and the cumulative time-series curve of the vegetation index.
Y ( t ) = m   + n t
where Y ( t ) is the daily vegetation index value or cumulative vegetation index value; t is DOY 50 ≤ t ≤ 90; and m , n are the parameters that need to be fitted.
(2) The extraction of satellite-derived phenological characteristics of vegetation greenness
The outbreak dates of spring pollen allergy extracted from the Weibo data were used to find the corresponding vegetation index value on the linear fitted curve. For each vegetation type, the value of a certain vegetation index on the outbreak date of pollen allergy is regarded as the satellite-derived phenological characteristic of vegetation greenness in this study (right plots in Figure 2c).
(3) Analysis of the representative capacity of the greenness characteristics to the outbreak date of pollen allergy
To determine the greenness characteristic that can best reflect spring pollen allergy outbreaks, we calculated the sensitivity coefficients of each characteristic to the outbreak date of spring pollen allergies and the correlation coefficients between each characteristic and the outbreak date of spring pollen allergies.
The sensitivity coefficient can reflect the sensitivity of each satellite-derived phenological characteristic of vegetation greenness to the outbreak date of spring pollen allergy. It is calculated as follows:
S v = ( y 2 y 1 ) / y 1 ( x 2 x 1 ) / x 1
where x 1 is the DOY 20 days earlier than the earliest breakout date of spring pollen allergy during 2011–2021, i.e., the 50th day; x 2 is the average DOY of spring pollen allergy outbreak during 2011–2021, i.e., the 81st day; y 1 is the vegetation index value corresponding to x 1 on the fitted curve of the smoothed multiyear average daily curve of a vegetation index for a vegetation type; and y 2 is the vegetation index value corresponding to x 2 on the fitted curve of the smoothed multiyear average daily curve of a vegetation index for a vegetation type (the right plot in Figure 2d).
The correlation coefficient can reflect the degree of consistency between the interannual variation of each characteristic and the outbreak date of spring pollen allergy. A higher value of the correlation coefficient indicates a more stable ability to represent the phenological characteristics of spring pollen allergies. To calculate the correlation coefficient, the average outbreak date (T) of spring pollen allergy (T2011, T2012, …, T2021) during 2011–2021 was used to find the corresponding DOY (t2011, t2012, …, t2021) in each vegetation index value time series of different vegetation types every year. Then, the Pearson correlation coefficient between the real outbreak date (T2011, T2012, …, T2021) and the corresponding satellite DOY (t2011, t2012, …, t2021) was calculated for each combination of vegetation indices and vegetation types (the left plot in Figure 2d).

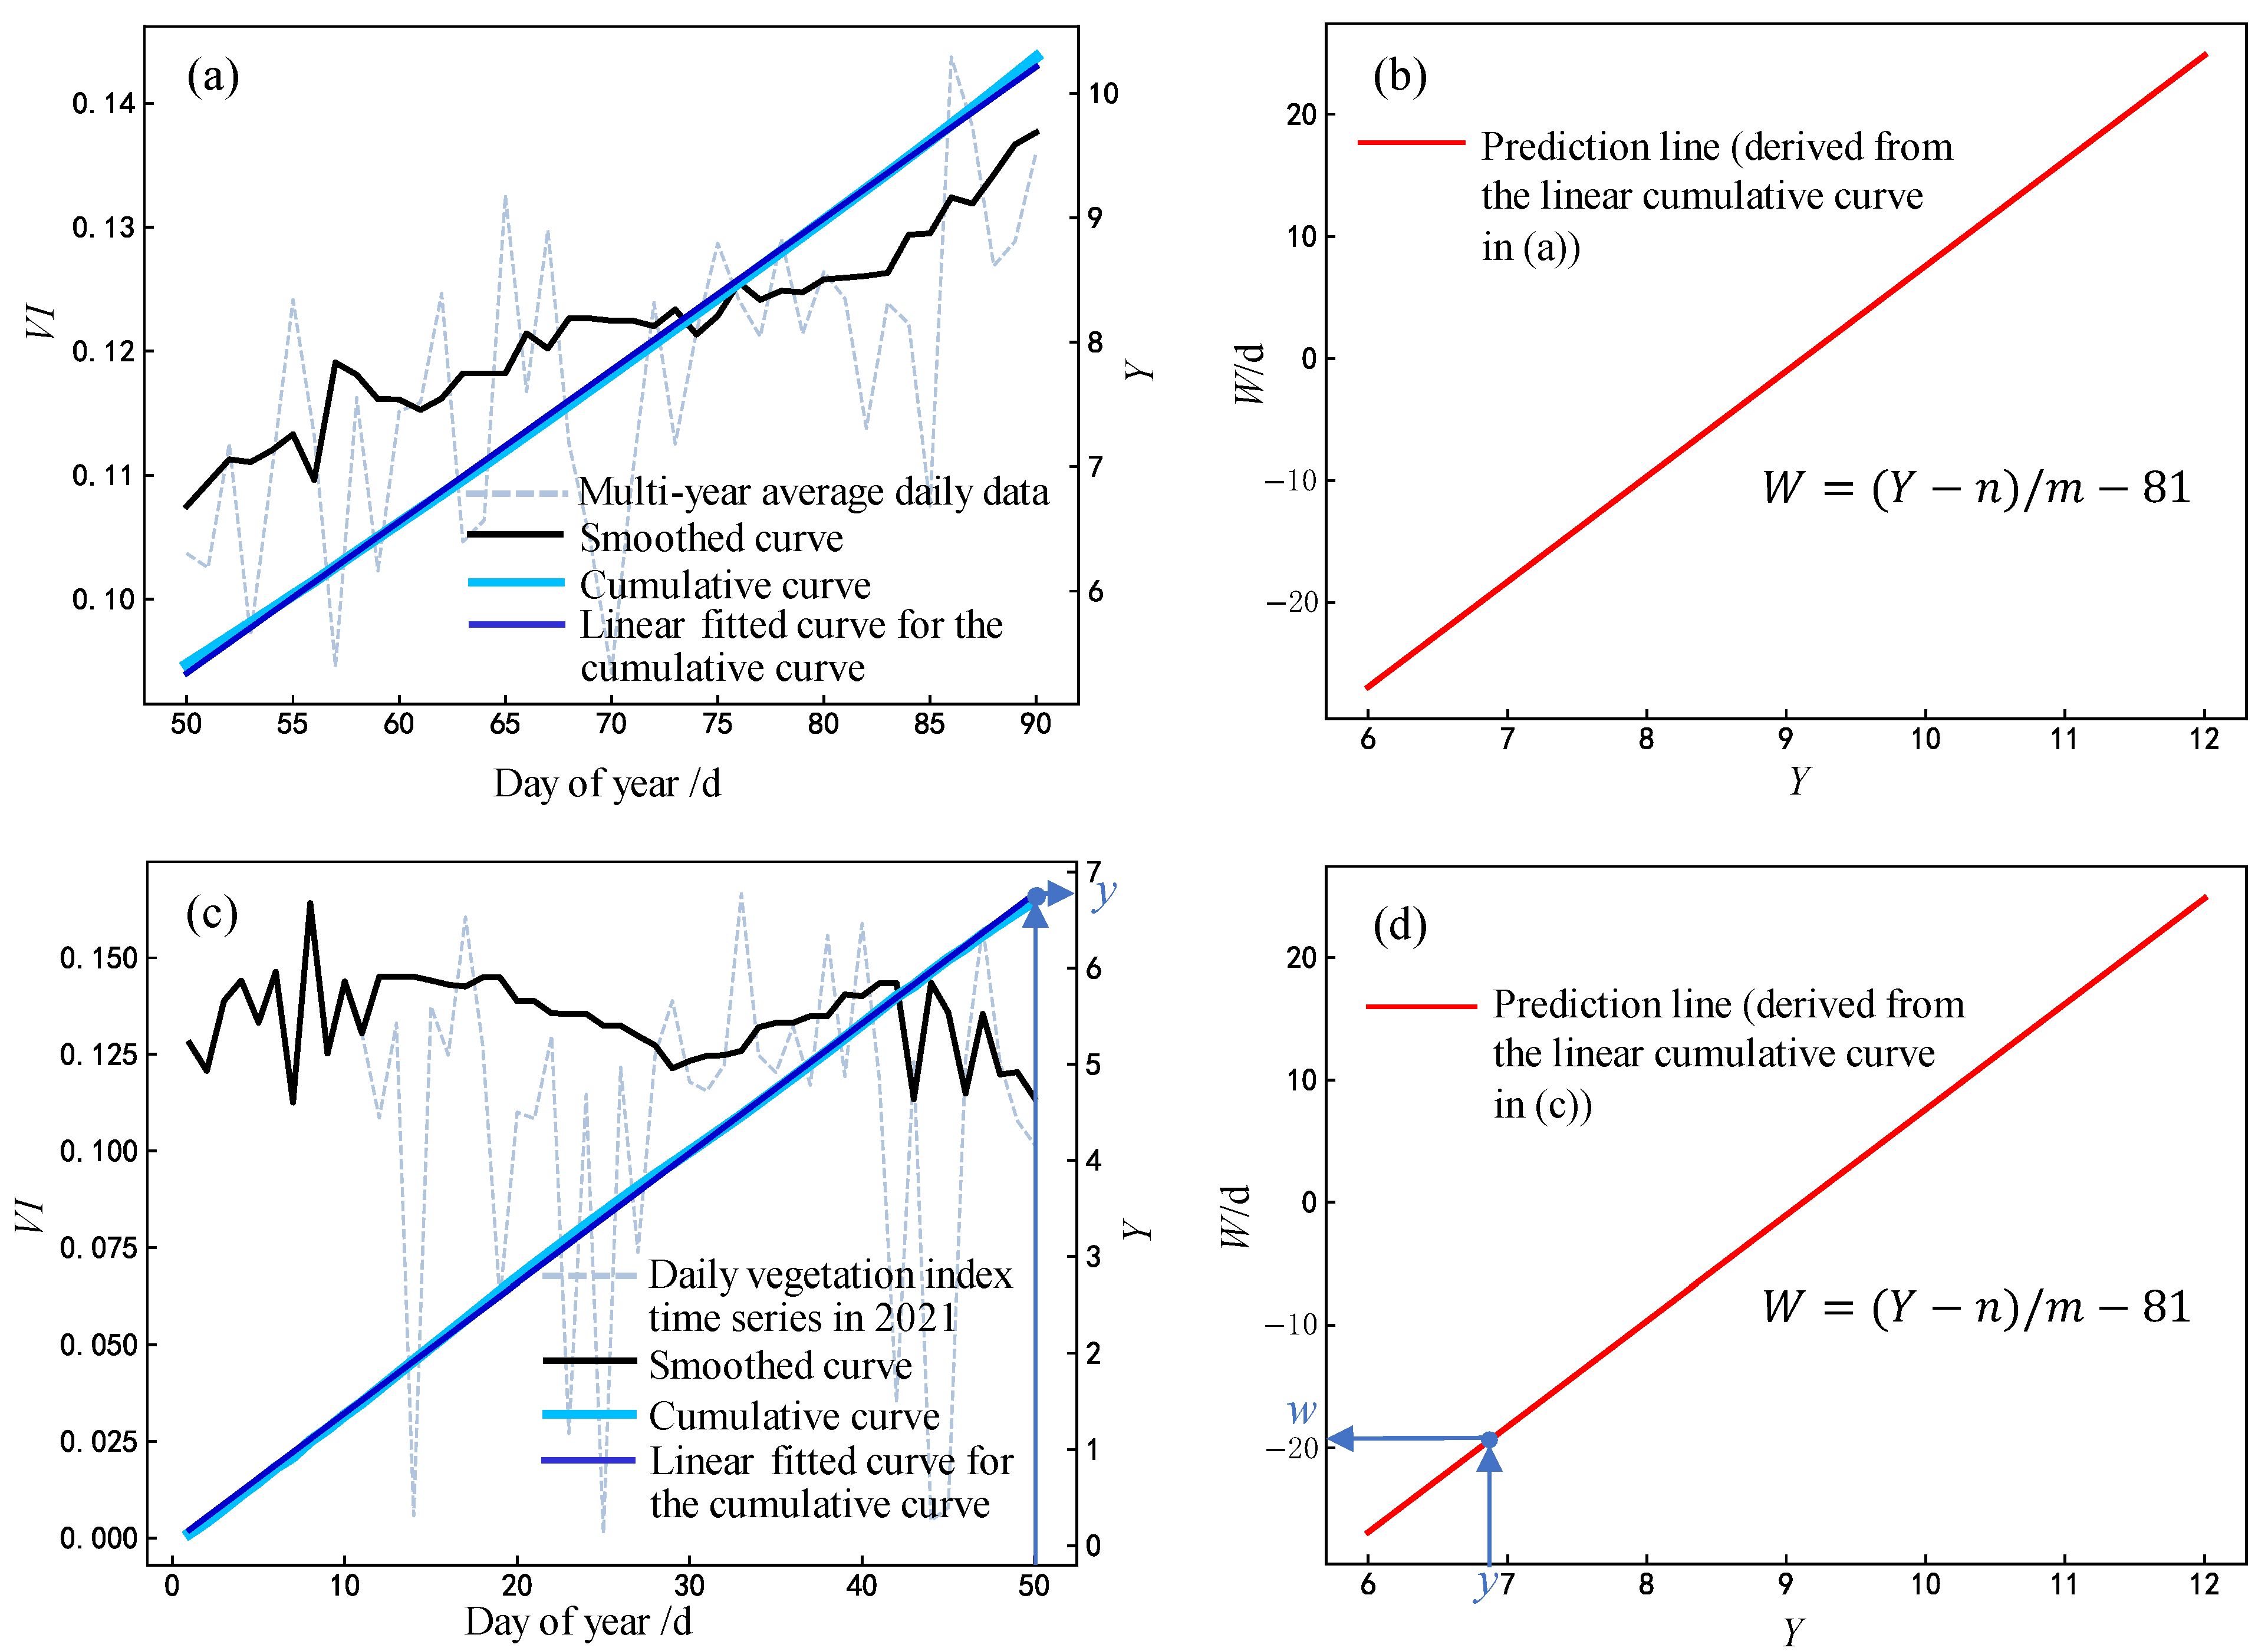
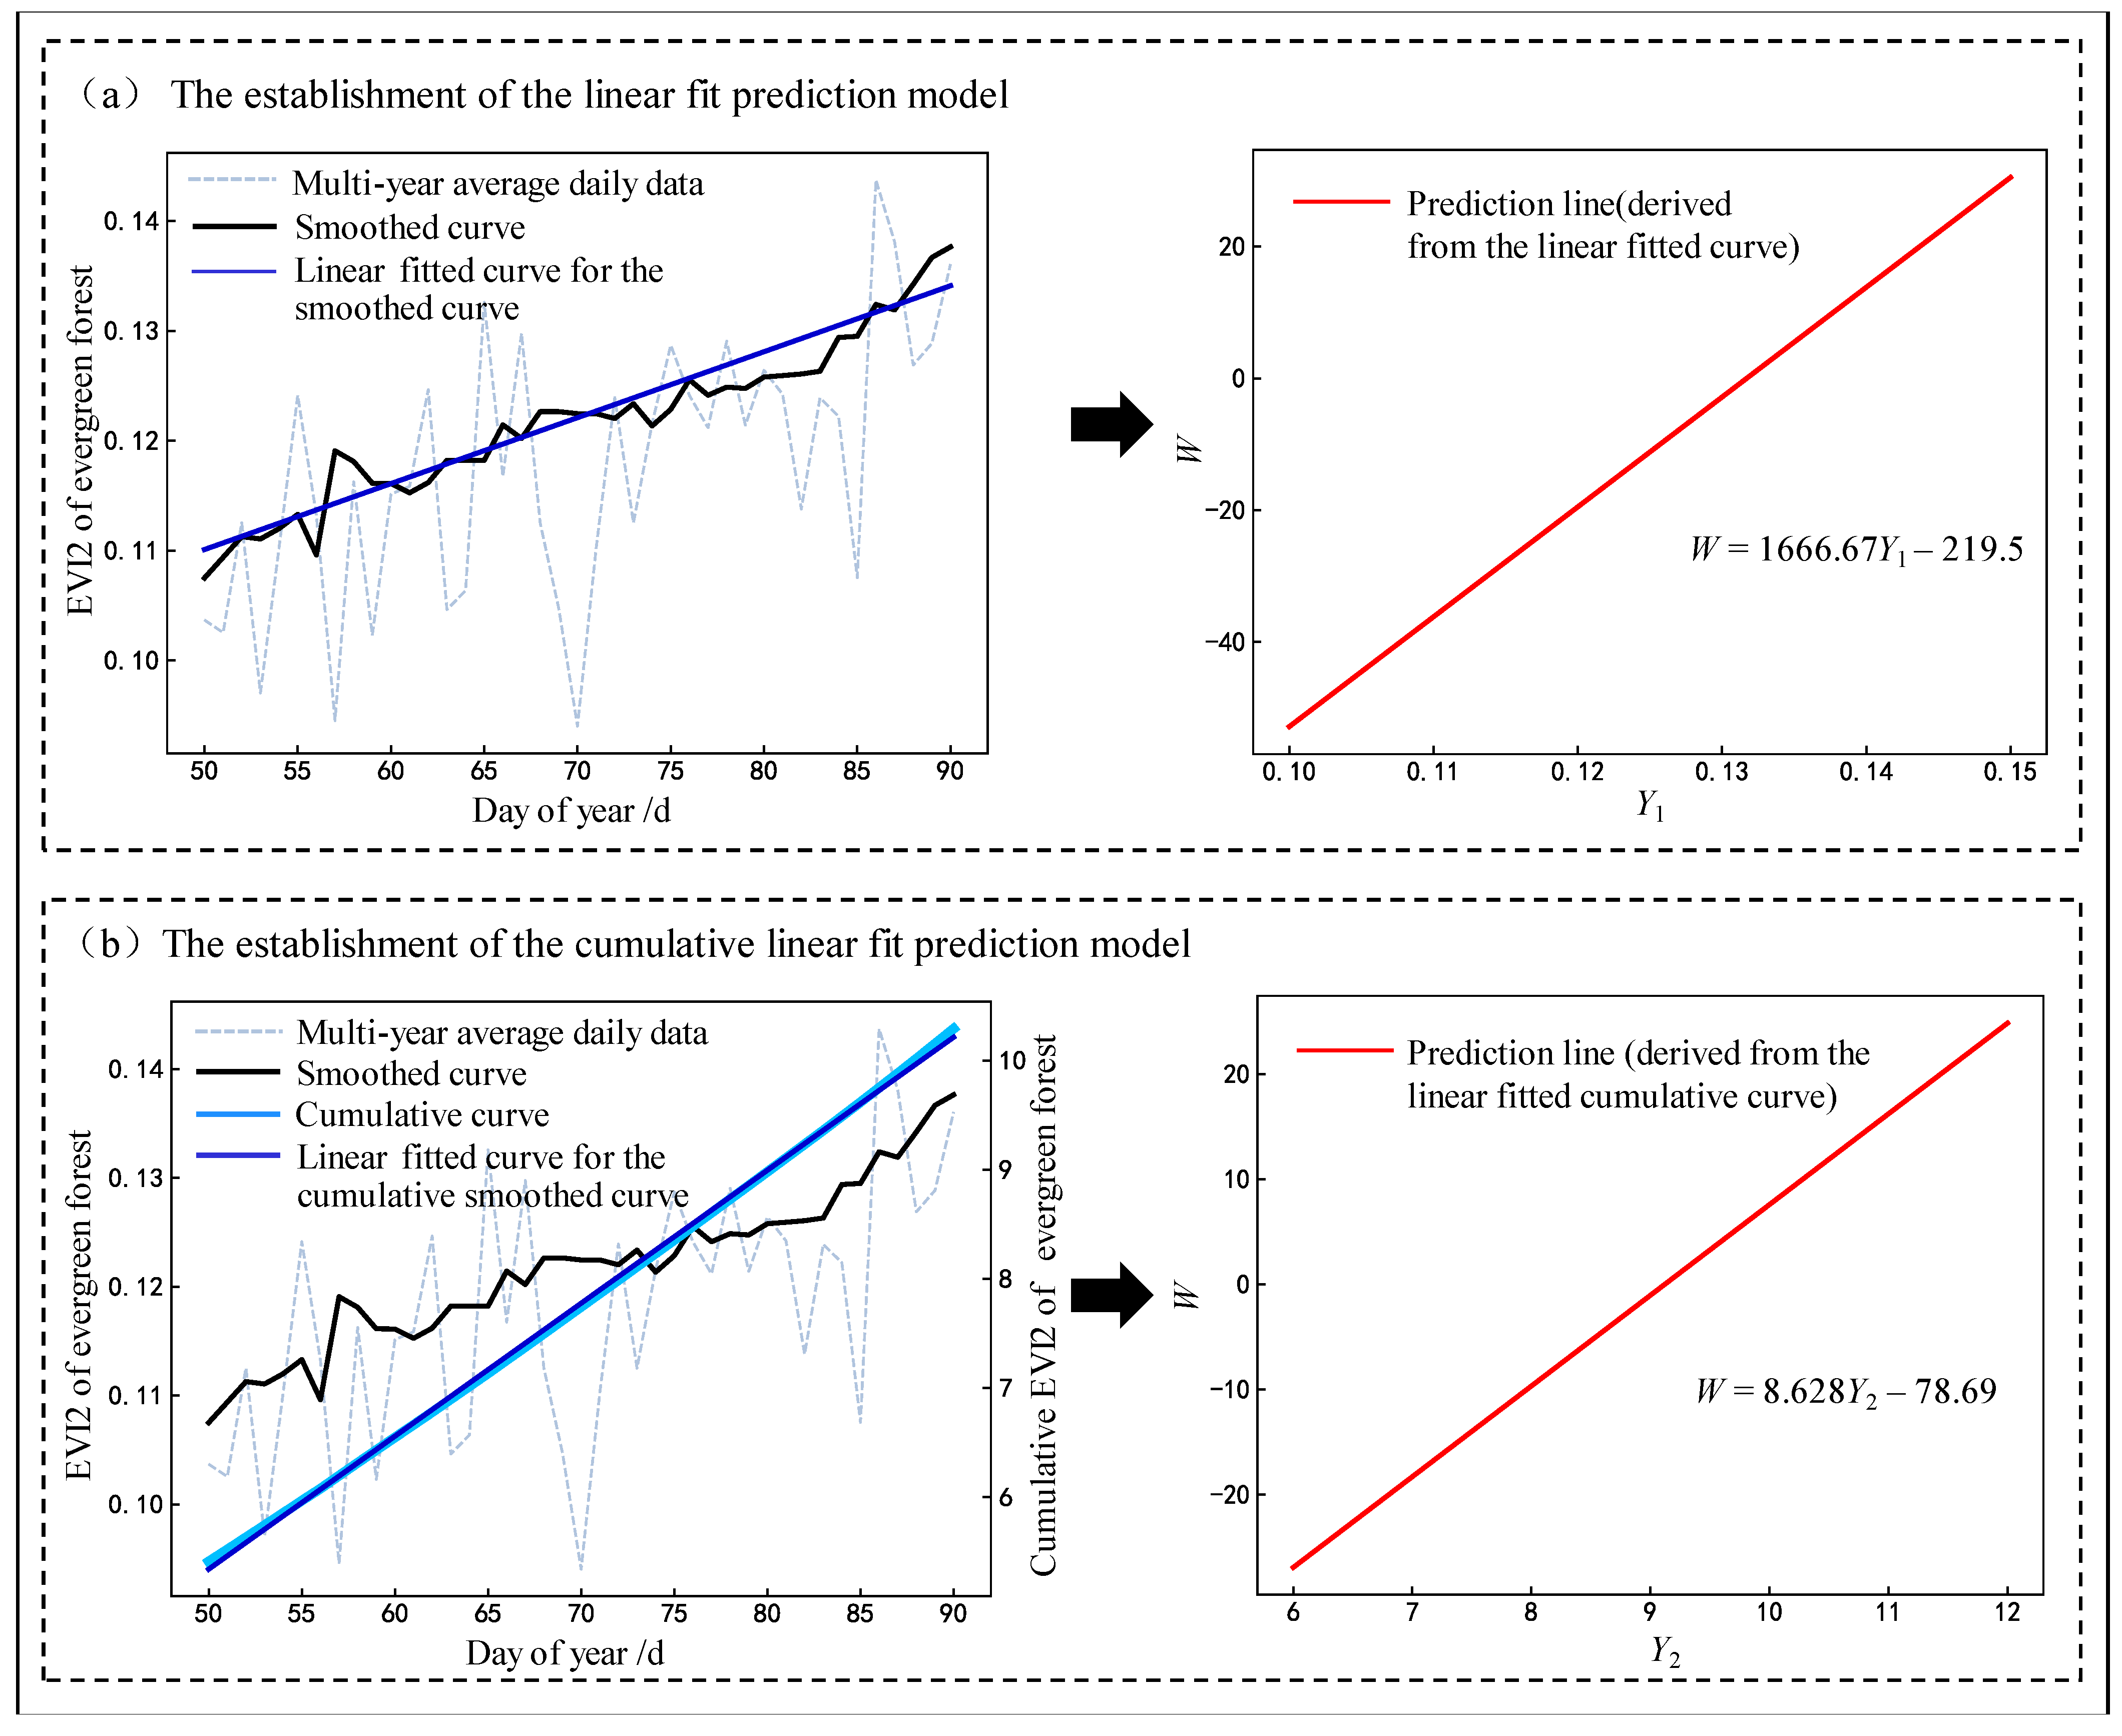
2.3.2. Establishment and Accuracy Assessment of the Prediction Models

We established prediction models based on the satellite-derived phenological characteristics of vegetation greenness within the 20 days before the earliest date of the outbreak dates of spring pollen allergy in Beijing during 2011–2021 (Figure 3a,b). The prediction models were developed as follows.
Y = m t + n
W = Δ t = t t 0 = ( Y n ) / m 81
where Y is the preprocessed multiyear average daily fit curve of the remote sensing vegetation index when establishing the prediction model or the preprocessed daily vegetation index in a given year when predicting; m and n are the coefficient of the linear fit of Y ; W is the prediction function, Δ t is the predicted number of days to the outbreak date of spring pollen allergy in Beijing (a negative value indicates that the outbreak date has not yet arrived, and a positive value indicates that the outbreak date has passed); t is DOY of the current date; and t 0 is DOY of the average outbreak date of spring pollen allergy in Beijing during 2011–2021, i.e., the 81st day. The prediction models for the outbreak date of spring pollen allergy were named the linear fit prediction model and cumulative linear fit prediction model, respectively, according to the different preprocessing of remote sensing vegetation index data.
The accuracy of the prediction models was evaluated with the root mean square error (RMSE), which reflects the deviation of the forecast date from the real date. A smaller RMSE means a higher forecast accuracy. To test the performance of each prediction model (the linear fit prediction model and cumulative linear fit prediction model), the vegetation index on the 50th day of each year during 2011–2021 (the DOY of the 20 days before the earliest outbreak date of spring pollen allergy in these 11 years) was put into every prediction model to calculate the countdown to the outbreak date of spring pollen allergy in Beijing, and then the predicting outbreak date of pollen allergy for each year in Beijing was determined (Figure 3c,d). Finally, the RMSE between forecasted dates and real dates was calculated to select the best prediction model.
To give an objective and fair evaluation of the models, we established the models by randomly selecting 7 years from 2011–2021 and predicted outbreak dates of pollen allergy for the remaining 4 years. A total of 330 training sessions ( C 11 7 = 330 ) were performed for each model (the linear fit prediction model and cumulative linear fit prediction model).

3. Results

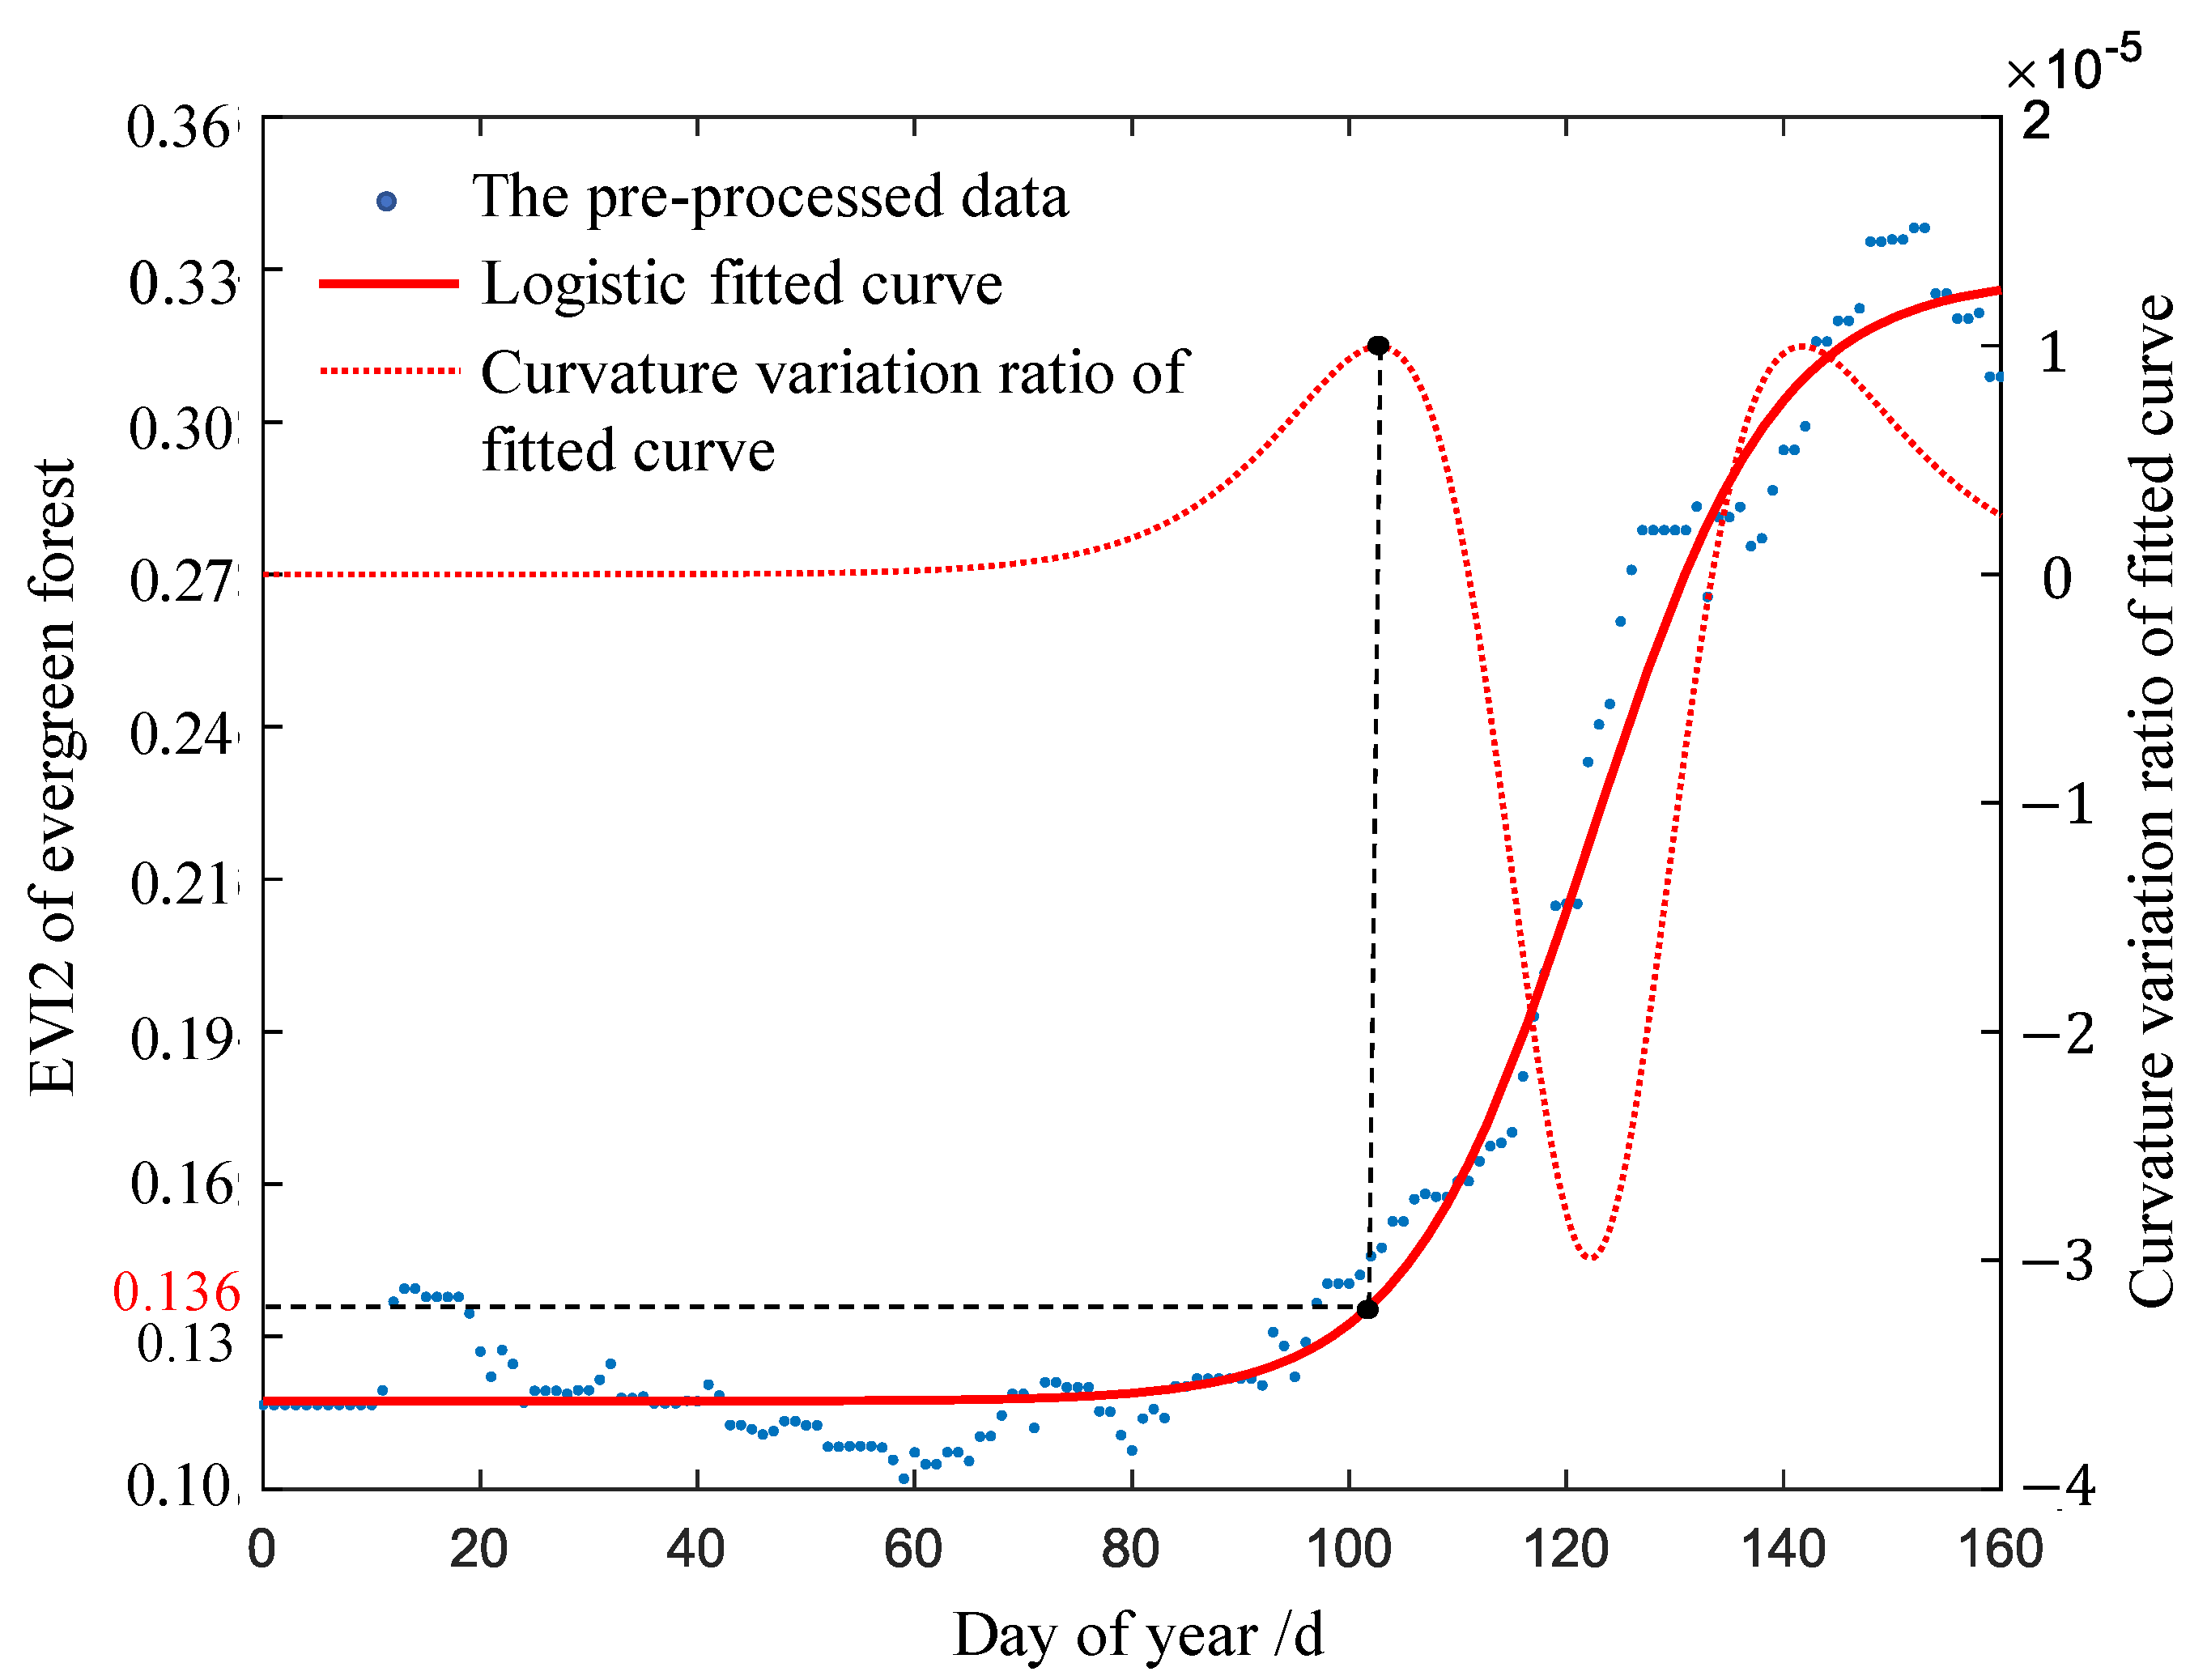
3.1. Satellite-Derived Phenological Characteristics of Vegetation Greenness within 30 Days before the Spring Average Pollen Allergy Outbreak Date during 2011–2021

The value range of each greenness characteristic derived from different vegetation indices was diverse in each vegetation type within the 30 days before the pollen allergy outbreak date (Table 1). During spring, the NIR + R + B values of each vegetation type had the most obvious magnitude of variation among all indices during the 30 days before the outbreak date, and the most obvious change in its value occurred in deciduous forest, from 1.800 to 2.061. The G/R values of each vegetation type changed the least, among which the G/R value of evergreen + deciduous forest changed by only 0.006 during the 30 days.
In terms of sensitivity coefficients (Table 2), the sensitivity coefficient of EVI2 to the outbreak date of spring pollen allergy was the largest at 0.270 in evergreen forest, followed by NDVI of evergreen forest with a sensitivity coefficient of 0.253, and the sensitivity coefficients of G/R of all vegetation types were smaller than 0.01.
The correlation coefficients between each greenness characteristic and the outbreak date of pollen allergy are shown in Table 3. The NDVI and EVI2 of each vegetation type were significantly correlated (p < 0.05) with the outbreak date of spring pollen allergy, with the largest correlation coefficient of 0.762 for the NDVI in deciduous forest, while the EVI and NIR + R + B of each vegetation type were not significantly correlated with the outbreak date.
Combining the sensitivity coefficients and correlation coefficients of each greenness characteristic, we found that the date of EVI2 in evergreen forest first reaching 0.137 can best reflect the outbreak date of pollen allergy in spring.

3.2. The Prediction Models and Their Accuracies

Based on the EVI2 of evergreen forest during 2011–2021, the linear fit prediction model and cumulative linear fit prediction model were developed, which best reflects the outbreak date of spring pollen allergy in Beijing (Figure 4). The expressions of each prediction model were obtained as follows:
(1) The linear fit prediction model
W =1666.67Y1 − 219.5
where Y1 is the smoothed daily EVI2 value of evergreen forest for a given forecast year and W is the number of days to the outbreak date of spring pollen allergy in Beijing.
(2) The cumulative linear fit prediction model
W =8.628Y2 − 78.69
where Y2 is the cumulative smoothed daily EVI2 value of evergreen forest for a given forecast year and W is the number of days to the outbreak date of spring pollen allergy in Beijing.
The prediction accuracies obtained from 330 training sessions for each model based on EVI2 of evergreen forest are shown in Table 4. The average RMSEs of the linear fit prediction model and the cumulative linear fit prediction model were 95.549 days and 3.589 days, respectively, which indicated that the linear fit prediction model has little predictive power while the cumulative linear fit prediction model has a very good prediction ability. It should be noted that the first training session in Table 4 with the years 2011–2017 for model building and the years 2018–2021 for model test can also get a low RMSE (i.e., 3.369 days) for the cumulative linear fit prediction model, though there is a dramatic increase in the number of valid pollen allergy Weibo records since 2018 (Figure A1), which indicated that the dramatic increase in the number of valid records since 2018 did not affect the prediction accuracy.
To further verify the validity of the screened vegetation phenological greenness characteristic that best reflects the date of pollen allergy outbreak (i.e., EVI2 of evergreen forest), we also tested the prediction accuracies for the models based on NDVI of evergreen forest and EVI2 of deciduous forest (Table 4), respectively. Controlling the variable in model construction (i.e., change EVI2 to NDVI or change evergreen forest to deciduous forest), we found that the prediction accuracy of each model built by the above two vegetation characteristics was lower than that of the prediction model built by EVI2 of evergreen forest.

4. Discussion

4.1. Phenological Characteristics of Remote Sensing Vegetation Greenness at the Beginning and Early Stages of the Spring Pollen Allergy Outbreak in Beijing

We found that the date of EVI2 in evergreen forest first reaching 0.137 can best reflect the outbreak date of pollen allergy in spring. Evergreen forest can better reflect spring pollen allergy outbreaks in Beijing than other vegetation types because cypress, the main allergenic vegetation in Beijing in spring, is an evergreen plant [31]. EVI2 can better indicate vegetation greenness before flowering because it can reduce atmospheric and soil disturbances [43,44], making it more sensitive to vegetation greenness in areas with high background noises [44,45].
EVI2 at 0.137 of evergreen forest has a specific phenological indication. The remote sensing vegetation index time-series curve for a complete vegetation growth season generally has four key transition dates: greenup (the date of onset of photosynthetic activity), maturity (the date at which plant green leaf area achieves maximum), senescence (the date at which photosynthetic activity and green leaf area begin to rapidly decrease), and dormancy (the date at which physiological activity becomes near zero) [6]. In this study, the satellite-derived greenness characteristic that best reflected the outbreak date of spring pollen allergy corresponded to the key greenup transition date: the date of EVI2 at 0.137 in the growth period of evergreen forest in spring corresponded to the greenup date of evergreen forest (e. g. the date of EVI2 at 0.136 of evergreen) (Figure 5). Actually, the allergenic pollens in Beijing in spring mainly come from cypress, poplar, and willow, especially cypress [40]. As an evergreen forest, cypress flowerings at the time of needle-leaf flush, while poplar and willow flowering first and then leaf out immediately. However, if the flowering and leaf spreading periods of the allergenic plant are separated by a long time, its greenness characteristics cannot reflect its flowering, and the method will be not applicable.

4.2. Advantages of the Prediction Models

The cumulative linear fit prediction model has a very good prediction ability for the outbreak date of spring pollen allergy in Beijing based on the EVI2 of evergreen forest. It not only attenuates the fluctuation of the original data before the pollen allergy outbreak by cumulating daily data, but also has a higher fitting accuracy compared with the linear fit prediction model, in which the cumulative linear fitting curve almost coincides with the cumulative EVI2 time-series curve at the prediction period (Figure 4).
The existing pollen allergy-related prediction models mainly forecast pollen allergy outbreaks by forecasting the airborne pollen concentration through the empirical relationships between pollen concentrations and meteorological elements [46,47]. There are also models utilizing the flowering period of allergenic vegetation estimated by the blooming period of earlier flowering vegetation [48] to predict pollen allergies, but these models only predict vegetation characteristics related to pollen allergies and do not directly predict the date when people will be affected by allergic pollens. In addition, the existing prediction models require a substitution of data related to multiple meteorological factors for actual forecasting, which greatly limits the application of the prediction models. Moreover, the forecasting accuracy of the existing models is reduced by this indirect relationship between forecasting features and pollen allergy outbreaks.
The newly developed cumulative linear fit prediction model is not only capable of directly forecasting pollen allergy outbreaks, but also has a high data availability to operate, which only requires remote sensing vegetation index time-series data in the preliminary period of pollen allergy outbreaks. Moreover, the cumulative linear fit prediction model is more representative (directly reflecting pollen allergy rather than pollen concentration) and operational, and the accuracy of this direct forecast is higher (RMSE of 3.5 days) than that of the indirect forecast.

4.3. The Importance of Data Preprocessing for the Daily Vegetation Index Time-Series Data and Limitations for the Application of the Prediction Models

There are many noises in the daily vegetation index time-series data because of the disturbances from cloud contamination and atmospheric conditions [49]. Therefore, it is needed to reduce the noises before the application of the prediction models. In this study, the spatial 5% trimmed mean of each vegetation index value in every vegetation type was taken as the daily phenological characteristics for each year, and then the data were further smoothed by taking the mean of the higher six values within the previous 11-day filtering window for each day. Other noise reduction methods may affect the forecast accuracy since the prediction models are easily limited to the quality of remote sensing data. In extreme cases, if the study area is long affected by cloud cover, which causes degradation in the quality of remote sensing data, the forecast accuracy will be significantly reduced.

5. Conclusions

This study revealed the satellite-derived phenological characteristics of vegetation greenness before the spring pollen allergy outbreak in Beijing based on 11-year Sina Weibo data and corresponding satellite data, and established a prediction model to forecast the outbreak date of spring pollen allergies in Beijing based on the phenological characteristics that best reflect spring pollen allergies. The main conclusions are as follows.
(1) The satellite-derived phenological characteristics of vegetation greenness are obvious during the early period of the spring pollen allergy outbreak in Beijing. The date of EVI2 in evergreen forest first reaching 0.138 can best reflect the outbreak date of pollen allergy in spring. Moreover, it has a specific phenological indication: the date of EVI2 in evergreen forest first reaching 0.138 in spring basically corresponds to the greenup date.
(2) The cumulative linear fit prediction model based on EVI2 of evergreen forest has a very good prediction ability for forecasting the spring pollen allergy outbreak date in Beijing, and it can predict 30 days in advance, with a low average RMSE of 3.6 days. The existing forecast models of pollen allergy outbreak are mainly based on indirect forecasting of pollen concentrations, while the newly developed model can forecast pollen allergy outbreak directly. It only requires the time-series data of remote sensing vegetation index before pollen allergy outbreak to achieve the forecast, which is more representative (directly reflecting pollen allergy rather than pollen concentration) and operable. However, the forecast accuracy of the cumulative linear fit prediction model is easily limited by the quality of remote sensing data, and if the study area is affected by cloud cover for a long time, which results in degradation of the quality of satellite remote sensing data, the forecast accuracy will be significantly reduced.

Author Contributions

W.Z. and X.Y. were responsible for the conceptualization of the study and analysis of the data; C.Z. is contributed in writing and reviewing. All authors have read and agreed to the published version of the manuscript.

Funding

This research is funded by Graduate-Postgraduate Connection Talent Cultivation Program of the Faculty of Geographical Science (FGS), Beijing Normal University (BNU) and the National Natural Science Foundation of China Major Program (No. 42192580, 42192581).

Data Availability Statement

Data is available upon request from the corresponding author.

Acknowledgments

Thanks for the help provided by the whole group of professor Zhu W., especially He B.

Conflicts of Interest

The authors declare no conflict of interest.

Appendix A. Extraction of the Start Dates of Pollen Allergy Outbreaks in Beijing Based on Sina Weibo Data

Appendix A.1. Data

A total of 13,404 Weibo records were retrieved by a self-written Python program with the keyword “pollen allergy” in Beijing from 2011–2021 from the Sina Weibo website (https://weibo.com/ (accessed on 10 September 2021)). After visual interpretation of the retrieved Weibo contents, 11,601 invalid Weibo records (e.g., microblogs published in Beijing and without pollen allergy symptoms at the time of publication, such as advertisements) were excluded, and 1803 valid Weibo records (i.e., microblogs published in Beijing and with pollen allergy symptoms at the time of publication) were screened for the extraction of pollen allergy outbreak dates. The statistical results showed that the number of valid records varies little from 2011–2017 (36–99) but has increased dramatically since 2018 (299–395) (Figure A1), which is attributed to the wide popularity of Weibo on mobile phones since 2018. Since the pollen allergy outbreak dates were extracted separately based on the Weibo data of each year, the dramatic increase in the number of valid records since 2018 does not affect the overall extraction results.
Figure A1. Weibo data with the keyword “pollen allergy” in Beijing during 2011–2021. The sharp increase in Weibo data in 2018 is because the mobile side of Weibo began to be widely popular in that year, with mobile active users accounting for 93% of the total active users, which is sourced from the Weibo Data Center. Weibo 2018 User Development Report [EB/0 L], 2019–03-15.
Remotesensing 14 05891 g0a1

Appendix A.2. Methods

The number of valid records per 5 days from 2011 to 2021 was counted, and the dates of valid records were recorded in DOY. The data were fitted with a logistic curve (Figure A2). In the process of fitting, each peak of the curve was divided into two parts, and the left part was fitted. The best fitting curve was selected according to the principle of minimum fitting variance. Finally, the local maximum point of the second derivative of the best fitting curve in the left part was used as the outbreak date of pollen allergy in that year.
Figure A2. A schematic diagram for extracting the outbreak dates of pollen allergies based on valid microblog data.
Remotesensing 14 05891 g0a2

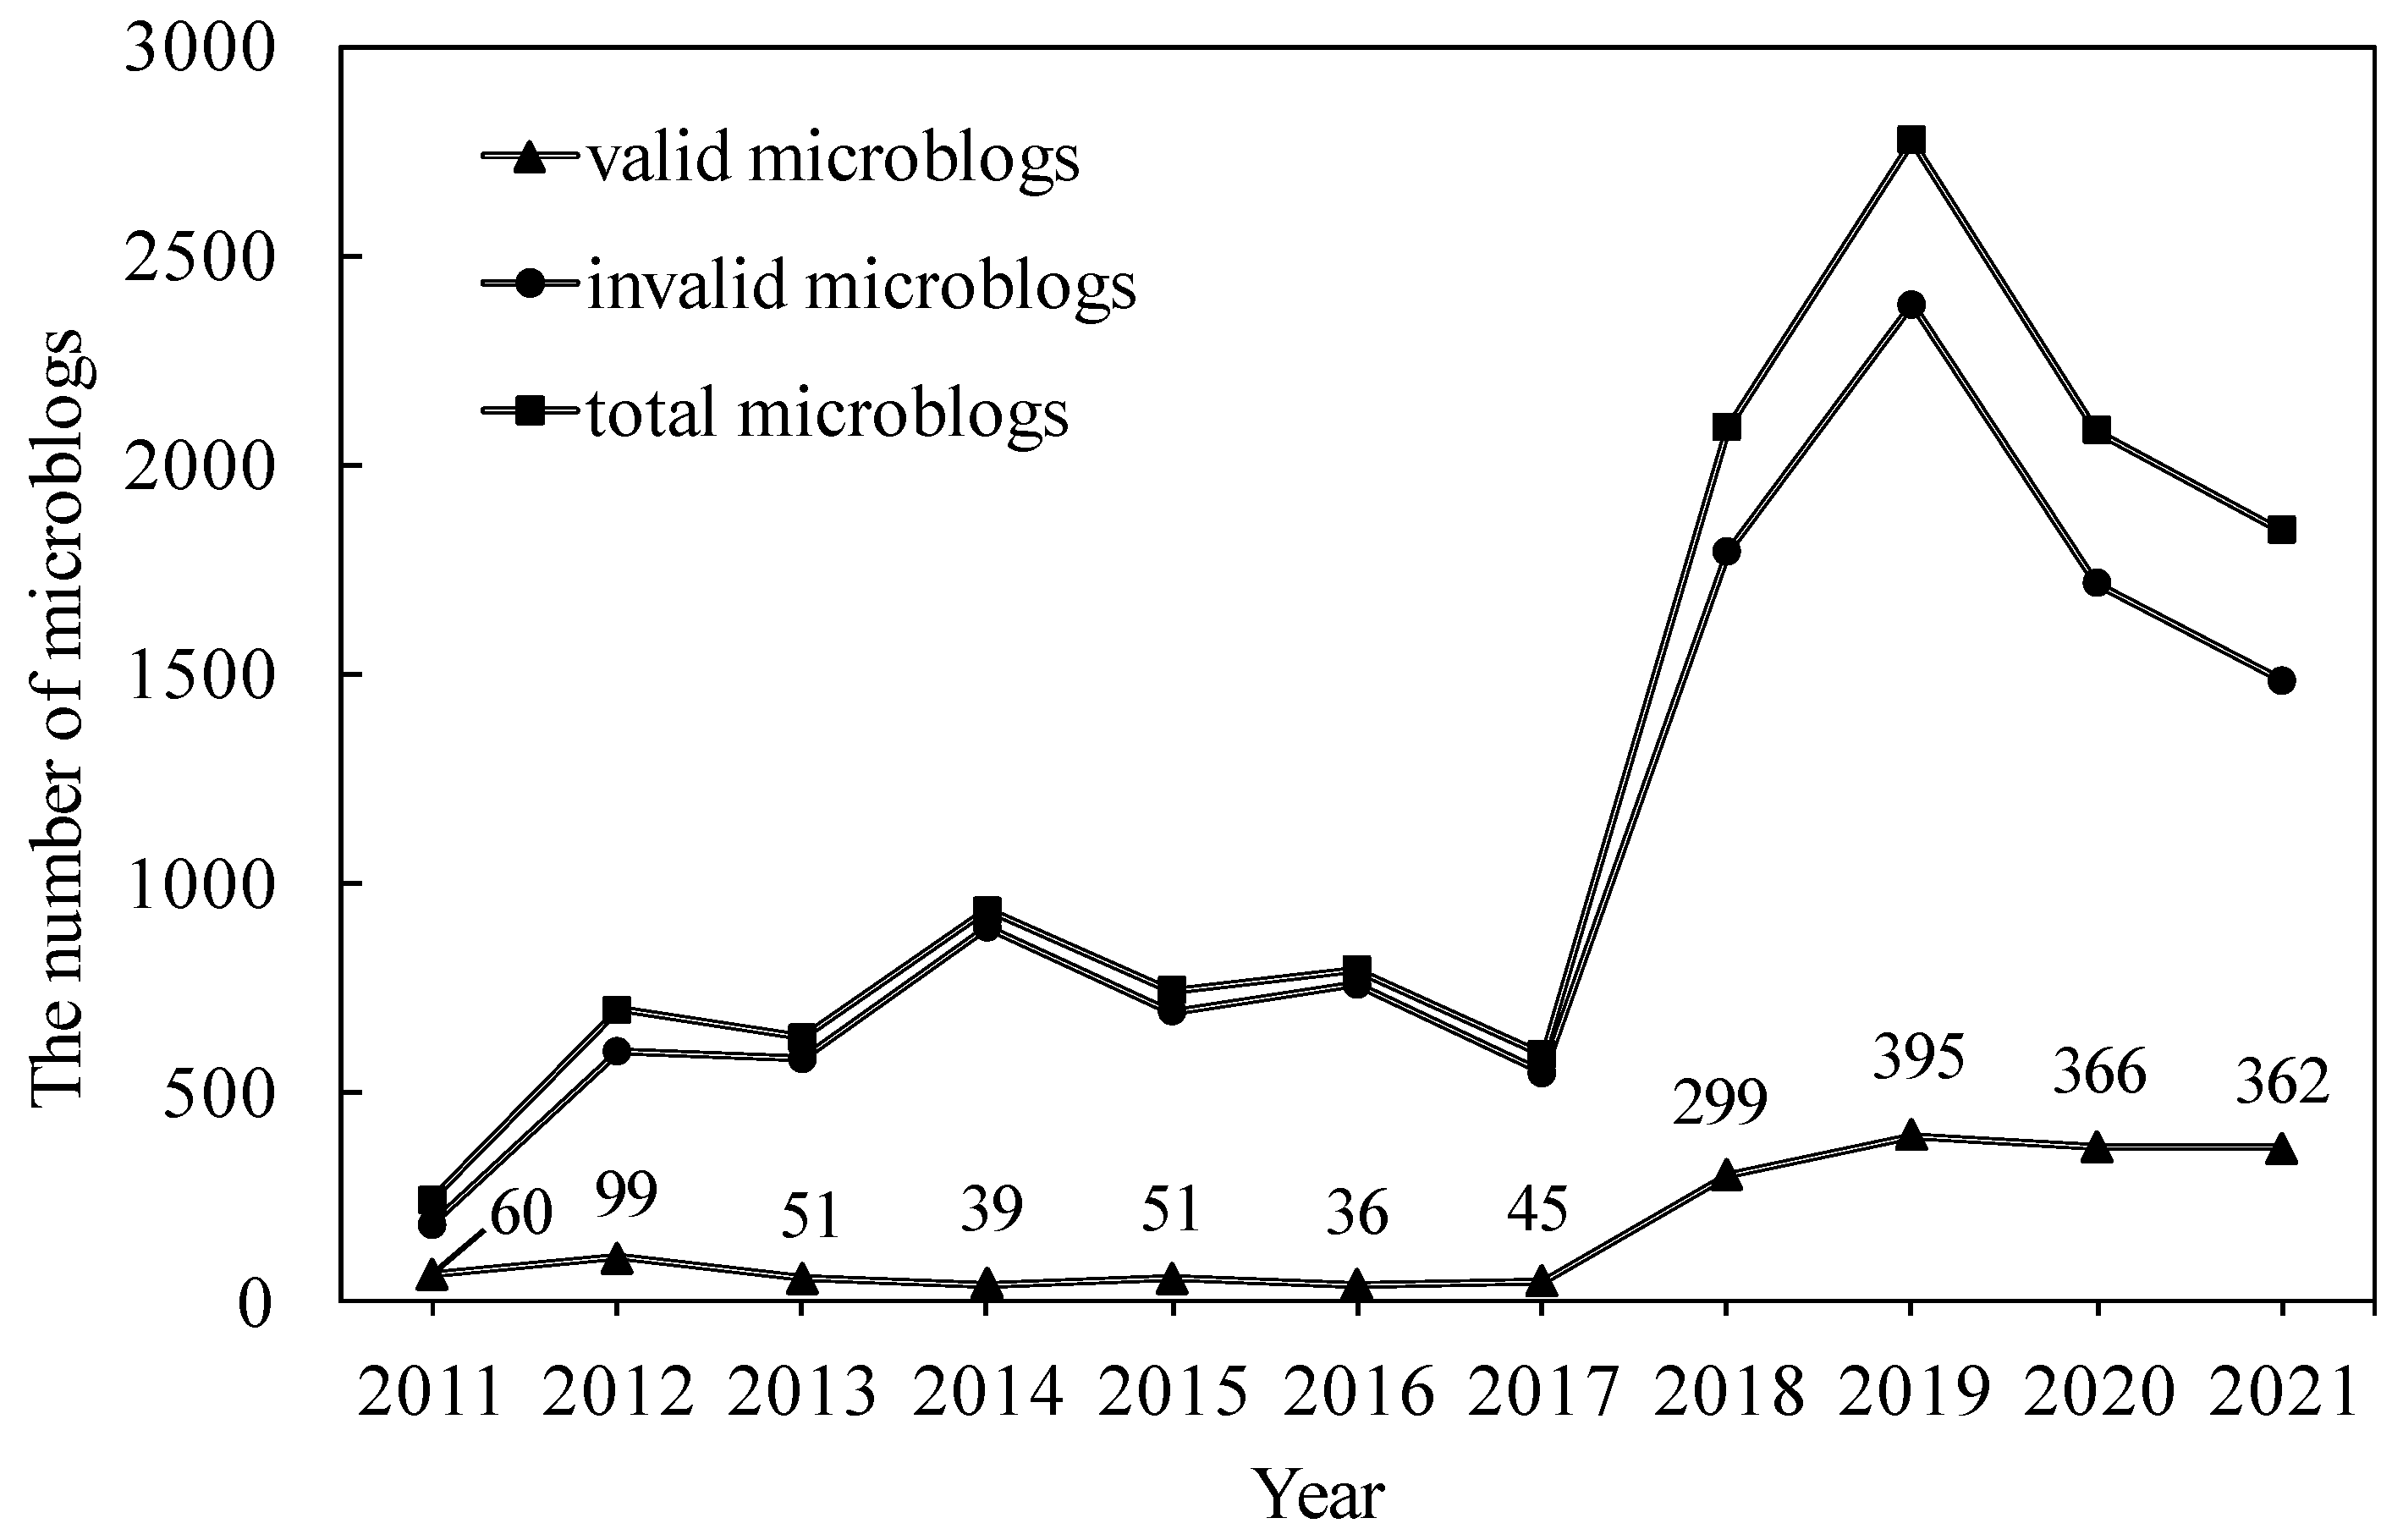
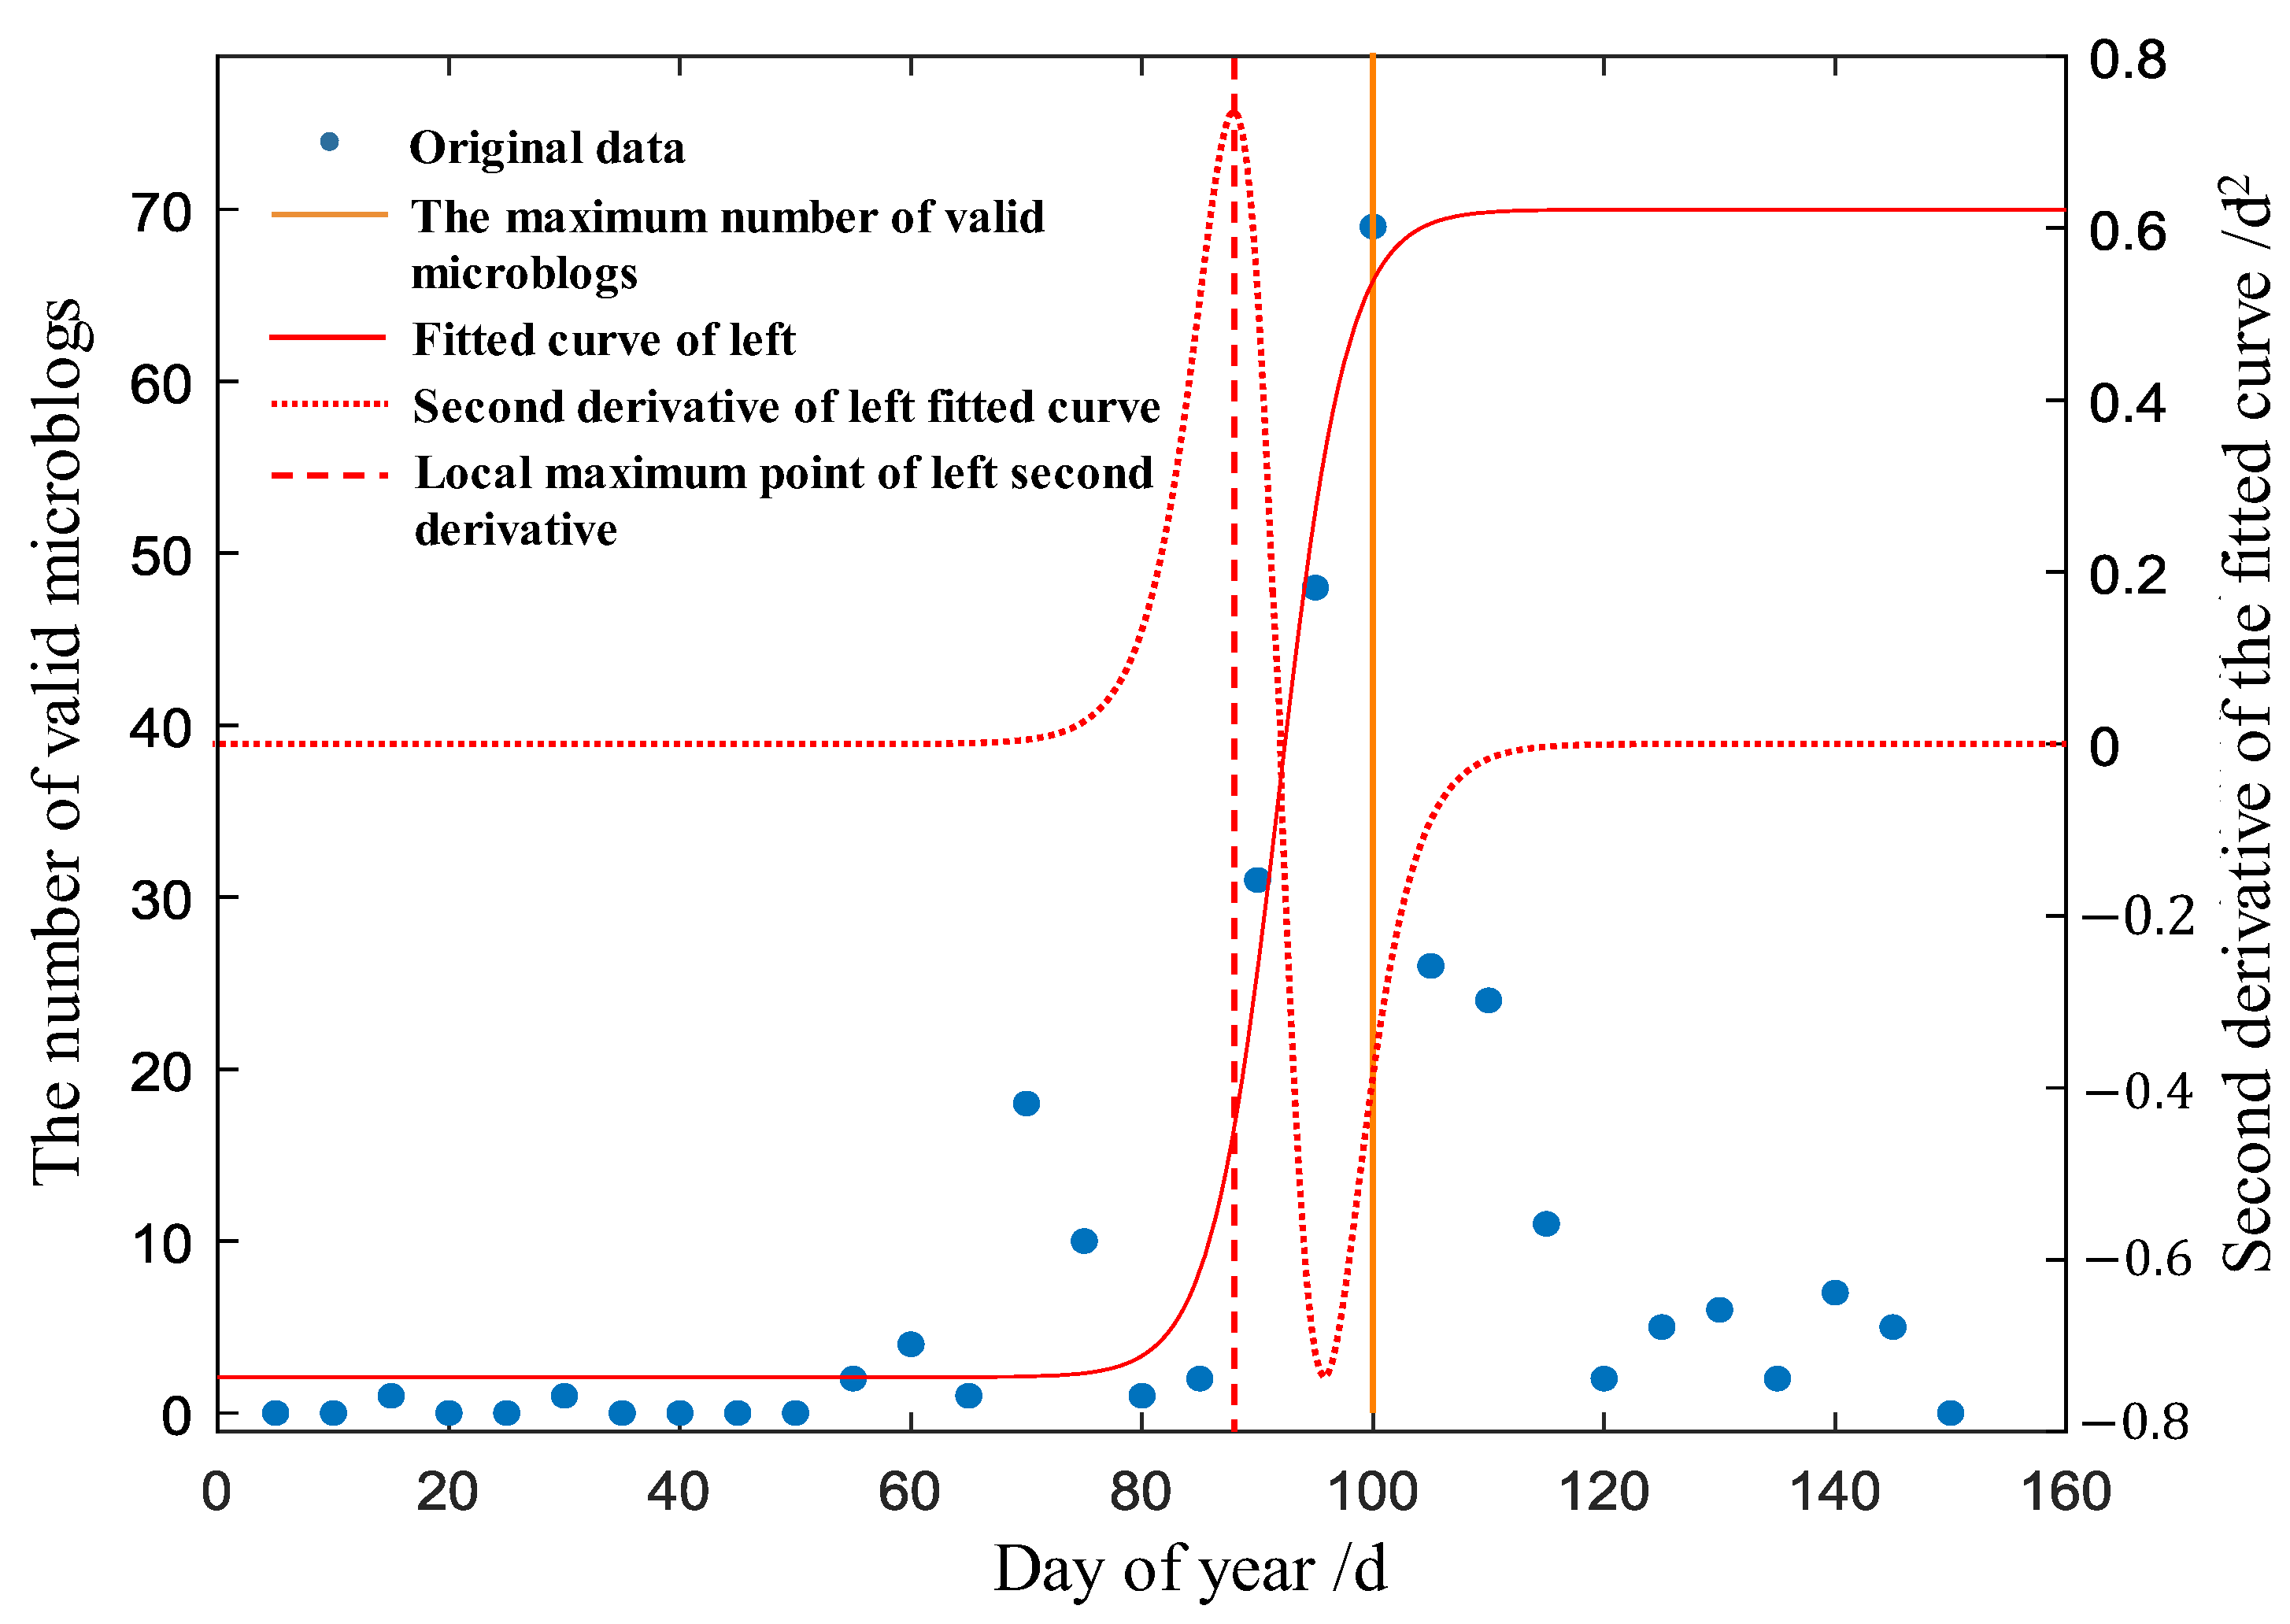
Appendix A.3. Results

The outbreak dates of spring pollen allergy in Beijing were from March 11th to April 1st (Table A1), and the peak of spring pollen allergy diagnosis in Beijing also occurred from March to April (Table A2), which indicated that the outbreak dates of spring pollen allergy in Beijing extracted from the Weibo data were reliable and could be used to establish the prediction models. However, since the diagnosis data is on a monthly scale, we can only use this data to compare with the pollen allergy outbreak dates extracted from the Weibo on a monthly scale (the peaks are all in March), and cannot verify the consistency of interannual variation at a shorter time scale (e.g., 5 or 10 days).
Table A1. The start date of spring pollen allergy outbreak extracted from microblog data.
20112012201320142015201620172018201920202021
Day of year8687918182768181707288
Date17 March28 March01 April22 March23 March17 March22 March22 March11 March13 March29 March
Table A2. Diagnosis data of pollen allergies in spring in Beijing in 2015 [34].
MonthAllergic RhinitisBronchial AsthmaTotal
Jan.142912162645
Feb.12859632248
Mar.255412633817
Apr.202112793300
May172811612889
June178512323017
July145111652616
Aug.334314714814
Sept.274414654209
Oct.200512383243
Nov.184912883137
Dec.230015133813
Note: The peak of spring pollen allergy diagnosis in Beijing occurred from March to April.

Appendix B. Description of Vegetation Classification
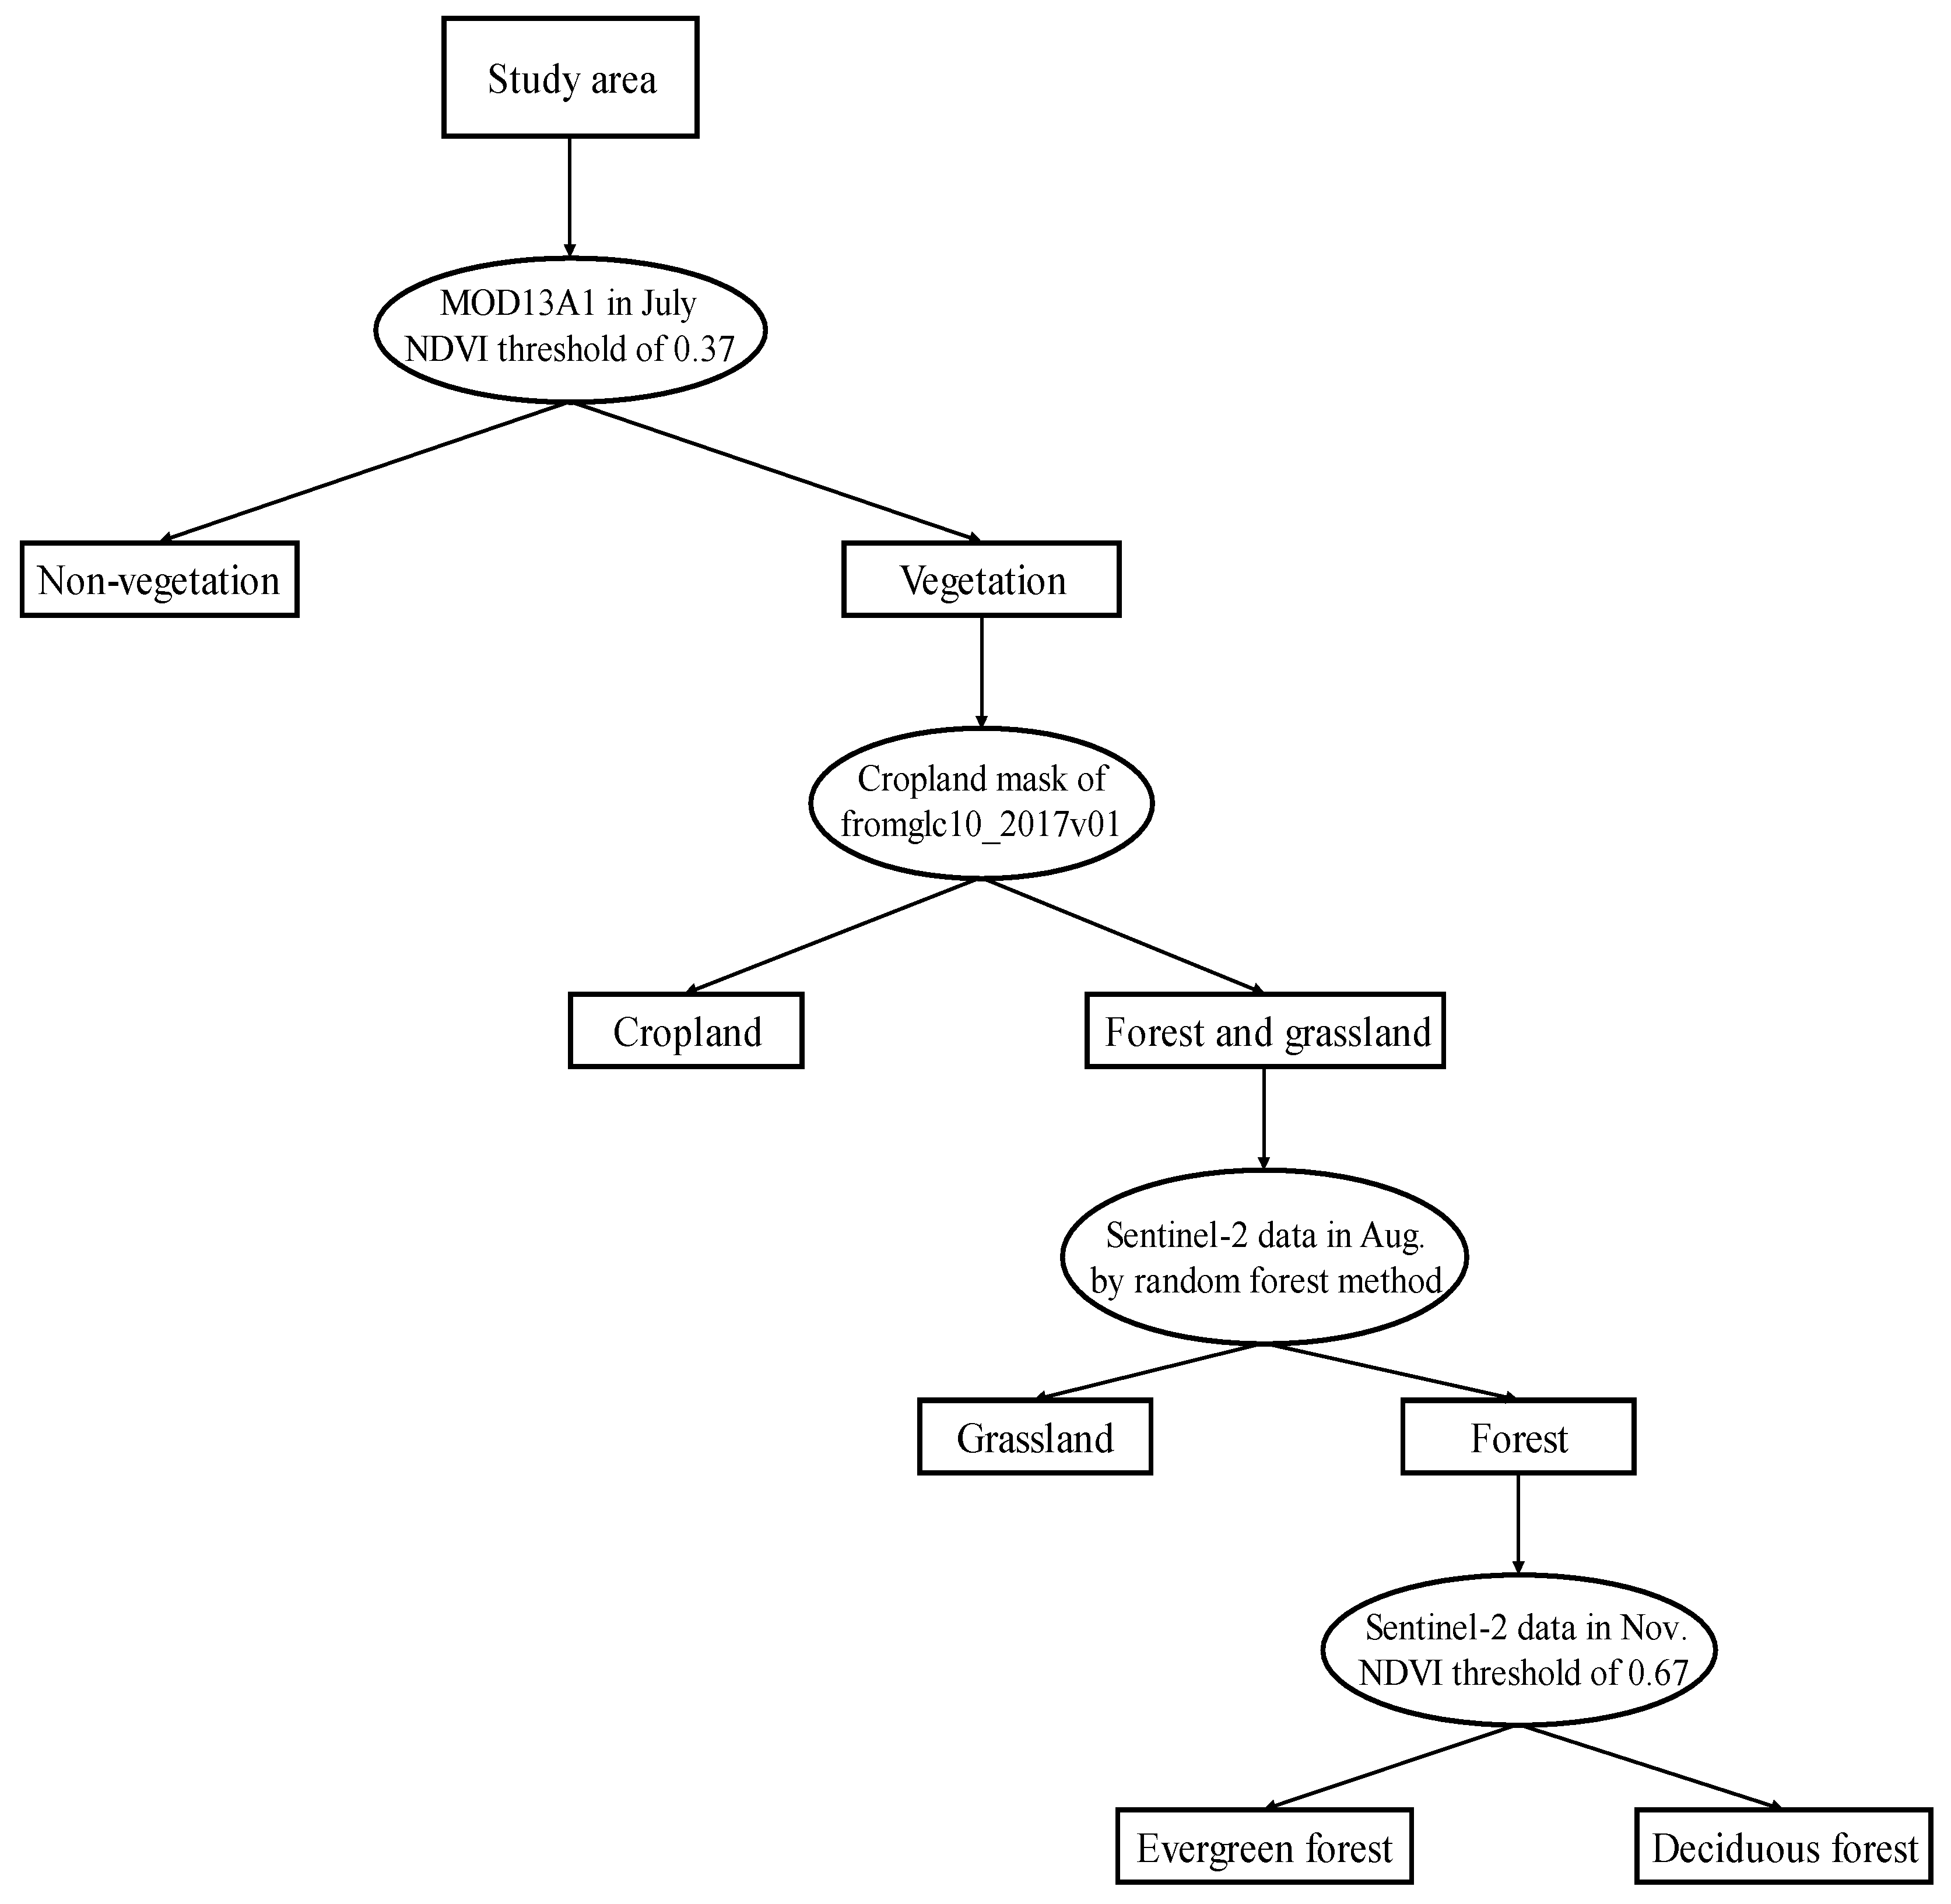
Appendix B.1. Data

Sentinel-2 images, the vegetation index product of MODIS (MOD13A1), and the Fromglc10_2017v01 land cover classification product were used for vegetation classification. Sentinel-2 data were obtained from the ESA website (https://scihub. copernicus.eu/ (accessed on 10 January 2022)) with a spatial resolution of 10 m. The Sentinel-2 images in August 2020 were used to identify grassland in the study area, and the images in November 2021 were used to identify evergreen forest in the study area. The MOD13A1 data were obtained from the USGS website (https://lpdaacsvc.cr.usgs.gov/ (accessed on 20 January 2022)), with a spatial resolution of 500 m. Its NDVI data in July 2021 were used to identify vegetation cover areas in the study area. The Fromglc10_2017v01 land cover classification product comes from Tsinghua University (http://data.ess.tsinghua.edu.cn/fromglc10_2017v01.html (accessed on 5 March 2022)), which was produced based on the 2017 Sentinel-2 data with a spatial resolution of 10 m. The cropland class from these data was directly used in this study.
The training and testing samples used for vegetation classification were selected by visual interpretation of high-resolution Google Earth images. For the classification of vegetation and non-vegetation, 230 training samples were selected (180 vegetation samples and 50 non-vegetation samples), and 220 testing samples were selected (175 vegetation samples and 45 non-vegetation samples); for the classification of grassland and forest, 55 training samples were selected (25 grassland samples and 30 forest samples), and 60 testing samples were selected (30 grassland samples and 30 forest samples); and for the classification of evergreen and deciduous forests, 120 training samples were selected (50 for evergreen forests and 70 for deciduous forests) and 130 testing samples were selected (55 evergreen forest samples and 30 forest samples).

Appendix B.2. Methods

The vegetation classification process is shown in Figure A3, and the general idea is to extract them by type.
Figure A3. Process diagram of vegetation classification.
Remotesensing 14 05891 g0a3
When classifying the vegetation and non-vegetation types, the NDVI threshold method was used because of the large differences in NDVI values between vegetation and non-vegetation in summer. The threshold value was determined by the cumulative frequency probability distribution plot method based on the NDVI data in July 2021, and the NDVI value corresponding to the cumulative frequency probability of 90% was taken as the threshold value (e. g. the value of NDVI at 0.37) (Figure A4). The purpose of vegetation classification in this study is to analyze the vegetation phenological characteristics of pollen allergies, so it is necessary to pursue a high user accuracy of vegetation classification, and using this method to determine the classification threshold can theoretically ensure that the user accuracy of vegetation classification is higher than 90%. Although the producer accuracy of vegetation classification may be reduced (i.e., some pixels that are actually vegetation are not classified as vegetation), this does not affect the subsequent analysis of vegetation phenological characteristics of pollen allergies.
Figure A4. Pixel frequency probability distribution of NDVI values of vegetation and non-vegetation training samples.
Remotesensing 14 05891 g0a4
When classifying cropland, grassland, and forest, cropland was first masked from the Fromglc10_2017v01 land cover data. Since the reflectance of forest and grassland differed greatly in the red band, the near-infrared band and three red edge bands in summer, forest, and grassland were identified based on these bands of Sentinel-2 data in August by random forest classification.
When classifying the evergreen and deciduous forests, the NDVI threshold method was used because the NDVI values of evergreen and deciduous forests differed greatly in autumn and winter. The specific procedure was the same as that used to classify vegetation and non-vegetation, and the frequency probability distribution of NDVI values for the training samples of evergreen and deciduous forests is shown in Figure A5. The final NDVI threshold value for classifying evergreen and deciduous forests was determined to be 0.67.
Figure A5. Pixel frequency probability distribution of NDVI values of evergreen and deciduous forest training samples.
Remotesensing 14 05891 g0a5
Finally, the classification accuracy is obtained by calculating the confusion matrix with testing samples.

Appendix B.3. Results

The results of vegetation classification in the study area are shown in Figure 1, and the user accuracy and producer accuracy of each vegetation type are shown in Table A3. The user accuracy is higher than 90%, which means that the classified vegetation types are reliable; and the producer accuracy is lower than the user accuracy, but it is above 80%. Since this study mainly uses the vegetation classification results to analyze the satellite phenological characteristics of vegetation greenness before pollen allergy outbreaks, even if some vegetation types are not identified, it does not affect the research results, so a user accuracy above 90% is sufficient to meet the needs of this study.
Table A3. The accuracy of vegetation classification.
Vegetation TypeUser Accuracy/%Producer Accuracy/%Number of PixelsArea/km2
Non-vegetation area99.8392.47134083352.0
Grassland95.8684.792790697.5
Evergreen forest97.5394.8736791.8
Deciduous forest91.3482.93607151.8
Cropland90.7685.6596442411.0
Note: The size of each pixel is 500 m × 500 m.

References

  1. Taketomi, E.; Sopelete, M.; Moreira, P.; Vieira, F. Pollen allergic disease: Pollens and its major allergens. Braz. J. Otorhinolaryngol. 2006, 72, 562–567. [Google Scholar] [CrossRef] [Green Version]
  2. D’Amato, G.; Cecchi, L.; Bonini, S.; Nunes, C.; Annesi-Maesano, I.; Behrendt, H.; Liccardi, G.; Popov, T.; Van Cauwenberge, P. Pollen-related allergy in Europe. Allergy 1998, 53, 567–578. [Google Scholar] [CrossRef] [PubMed]
  3. Wang, X. Pollen-Environment-Human; Geological Press: Beijing, China, 1992; pp. 37–45. [Google Scholar]
  4. Guan, L.; Gao, Q.; Li, H.; Li, J.; Gao, Q. Characteristics of airborne pollen variation and its relationship with meteorological elements in urban areas of Langfang. Serves Agric. Technol. 2021, 38, 93–98. [Google Scholar]
  5. Ghosal, K.; Gupta-Bhattacharya, S. Current glimpse of airborne allergenic pollen in Indian subcontinent. Acta Agrobot. 2015, 68, 349–355. [Google Scholar] [CrossRef] [Green Version]
  6. Zhang, X.; Friedl, M.; Schaaf, C.; Strahler, A.; Hodged, J.; Gao, F.; Reed, B.; Huete, A. Monitoring vegetation phenology using MODIS. Remote Sens. Environ. 2003, 84, 471–475. [Google Scholar] [CrossRef]
  7. Liu, L.; Cao, R.; Chen, J.; Shen, M.; Wang, S.; Zhou, J.; He, B. Detecting crop phenology from vegetation index time-series data by improved shape model fitting in each phenological stage. Remote Sens. Environ. 2022, 277, 113060. [Google Scholar] [CrossRef]
  8. Skjøth, C.; Ørby, P.; Becker, T.; Geels, C.; Schlünssen, V.; Sigsgaard, T.; Bønløkke, J.; Sommer, J.; Søgaard, P.; Hertel, O. Identifying urban sources as cause of elevated grass pollen concentrations using GIS and remote sensing. Biogeosciences 2013, 10, 541–554. [Google Scholar] [CrossRef] [Green Version]
  9. Xu, J.; Cai, Z.; Wang, T.; Liu, G.; Tang, P.; Ye, X. Exploring Spatial Distribution of Pollen Allergenic Risk Zones in Urban China. Sustainability 2016, 8, 978. [Google Scholar] [CrossRef] [Green Version]
  10. Karlsen, S.; Ramfjord, H.; Høgda, K.; Johansen, B.; Danks, F.; Brobakk, T. A satellite-based map of onset of birch (Betula) flowering in Norway. Aerobiologia 2009, 25, 15. [Google Scholar] [CrossRef]
  11. Bogawski, P.; Grewling, Ł.; Jackowiak, B. Predicting the onset of Betula pendula flowering in Poznań (Poland) using remote sensing thermal data. Sci. Total Env. 2019, 25, 1485–1499. [Google Scholar] [CrossRef]
  12. Peng, D.; Jiang, Z.; Huete, A. A preliminary study on remote sensing identification of pollen based on spectral characteristics analysis. In Proceedings of the 8th Workshop on Imaging Spectroscopy and Applications and Interdisciplinary Forum, Shanghai, China, 1 May 2010; pp. 87–93. [Google Scholar]
  13. Peng, D.; Jiang, Z.; Huete, A.; Ponce-Campos, G.; Nguyen, U.; Luvall, J. Response of Spectral Reflectances and Vegetation Indices on Varying Juniper Cone Densities. Remote Sens. 2013, 5, 5330–5345. [Google Scholar] [CrossRef]
  14. Saito, Y.; Ichihara, K.; Morishita, K.; Uchiyama, K.; Kobayashi, F.; Tomida, T. Remote Detection of the Fluorescence Spectrum of Natural Pollen Floating in the Atmosphere Using a Laser-Induced-Fluorescence Spectrum (LIFS) Lidar. Remote Sens. 2018, 10, 1533. [Google Scholar] [CrossRef] [Green Version]
  15. Kim, N.; Lee, H.; Cha, J. A study on changes of phenology and characteristics of spatial distribution using MODIS images. J. Korea Soc. Environ. Restor. Technol. 2013, 16, 59–69. [Google Scholar] [CrossRef] [Green Version]
  16. Qasem, J.; Nasrallah, H.; Al-Khalaf, B.; Al-Sharifi, F.; Al-Sherayfee, A.; Almathkouri, S.; Al-Saraf, H. Meteorological factors, aeroallergens and asthma-related visits in Kuwait: A 12-month retrospective study. Ann. Saudi Med. 2008, 28, 435–441. [Google Scholar] [PubMed]
  17. Høgda, K.; Karlsen, S.; Solheim, I.; Tømmervik, H.; Ramfjord, H. The start dates of birch pollen seasons in Fennoscandia studied by NOAA AVHRR NDVI data. In Proceedings of the IEEE International Symposium on Geoscience and Remote Sensing, Toronto, ON, Canada, 24–28 June 2002; Volume 6, pp. 3299–3301. [Google Scholar]
  18. Khwarahm, N.; Jadunandan, D.; Skjøth, C.; Newnham, R.; Adams-Groom, B.; Head, K.; Caulton, E.; Atkinson, P. Mapping the birch and grass pollen seasons in the UK using satellite sensor time-series. Sci. Total Environ. 2017, 578, 586–600. [Google Scholar] [CrossRef] [PubMed] [Green Version]
  19. Tang, R.; Wang, L.; Yin, J.; Li, H.; Sun, J.; Zhi, Y.; Kai, G.; Wen, L.; Gu, J.; Wang, L.; et al. History of Hay Fever in China. Sci. China Vitae 2021, 51, 901–907. [Google Scholar] [CrossRef]
  20. He, H.; Zhang, D.; Qiao, B. A preliminary study on the relationship between pollen content in air and meteorological elements in Beijing urban areas. Chin. J. Microbiol. Immunol. 2001, 2001, 36–38. [Google Scholar]
  21. Iglesias, I.; Rodriguez-Rajo, F.; Méndez, J. Behavior of Platanus hispanica pollen, an important spring aeroallergen in northwestern Spain. J. Investig. Allergol. Clin. Immunol. 2007, 17, 145–156. [Google Scholar]
  22. Myszkowska, D.; Majewska, R. Pollen grains as allergenic environmental factors—New approach to the forecasting of the pollen concentration during the season. Ann. Agric. Environ. Med. 2014, 21, 681–688. [Google Scholar] [CrossRef] [Green Version]
  23. Bian, M.; Guo, S.; Wang, W.; Ouyang, Y.; Huang, Y.; Teng, F. Prediction of next-day pollen concentration in Beijing by integrating vegetation remote sensing data. J. Geo-Inf. Sci. 2021, 23, 1705–1713. [Google Scholar]
  24. Devadas, R.; Huete, A.; Vicendese, D.; Erbas, B.; Beggs, P.; Medek, D.; Haberle, S.; Newnham, R.; Jonhnston, F.; Jaggard, A.; et al. Dynamic ecological observations from satellites inform aerobiology of allergenic grass pollen. Sci. Total Environ. 2018, 633, 441–451. [Google Scholar] [CrossRef] [PubMed]
  25. Huete, A.; Tran, N.; Nguyen, H.; Xie, Q.; Katelaris, C. Forecasting pollen aerobiology with Modis EVI, land cover, and phenology using machine learning tools. In Proceedings of the IGARSS 2019—2019 IEEE International Geoscience and Remote Sensing Symposium, Yokohama, Japan, 28 July–2 August 2019; pp. 5429–5432. [Google Scholar]
  26. Katz, D.; Batterman, S.A. Allergenic pollen production across a large city for common ragweed (Ambrosia artemisiifolia). Landsc. Urban Plan. 2019, 190, 103615. [Google Scholar] [CrossRef] [PubMed]
  27. Cheng, S.; Yu, Y.; Ruan, B. Species and distribution of airborne pollen plants in major cities of China. Chin. J. Allergy Clin. Immunol. 2015, 9, 136–141. [Google Scholar]
  28. Luo, H.; Ma, S.; Zhao, Y.; Cao, F.; He, F.; Liu, Z.; Bousquet, J.; Wang, C.; Zhang, L.; Bachery, C. Sensitization patterns an minimum screening panels for aeroallergens in self-reported allergic rhinitis in China. Sci. Rep. 2017, 7, 9286. [Google Scholar]
  29. Pierre, K.; Schlesinger, N.; Androulakis, I. The role of the hypothalamic-pituitary-adrenal axis in modulating seasonal changes in immunity. Physiol. Genomics. 2016, 48, 719–738. [Google Scholar] [CrossRef] [Green Version]
  30. Meng, L.; Wang, X.; Ouyang, Z.; Ren, Y.; Wang, Q. Seasonal distribution characteristics of airborne pollen in urban areas of Beijing. Acta Ecologica. Sinica. 2013, 33, 2381–2387. [Google Scholar] [CrossRef]
  31. Ma, T.; Wang, H.; Chen, Y. Common inhalation allergen sensitization profiles of outpatients in Beijing. Chin. J. Allergy Clin. Immunol. 2021, 15, 136–143. [Google Scholar]
  32. Wei, Q. Diagnosis and treatment of hay fever. Chin. J. Clin. 2003, 2003, 6–8. [Google Scholar]
  33. Shi, R. Pollen Allergy; China Science and Technology Press: Beijing, China, 2009; pp. 32–48. [Google Scholar]
  34. Wang, X.; Tian, Z.; Ning, H.; Wang, X. Analysis of the relationship between airborne pollen distribution and allergic disease visits in urban areas of Beijing. J. Clin. Otolaryngol.-Head Neck Surg. 2017, 31, 757–761. [Google Scholar]
  35. Wei, Q. Diagnosis, treatment and prevention of hay fever. Chin. J. Peactical Intern. Med. 2012, 32, 89–91. [Google Scholar]
  36. Ouyang, Y.; Li, J.; Zhang, D.; Fan, E.; Li, Y.; Zhang, L. A model to predict the incidence of allergic rhinitis based on meteorological factors. Sci. Rep. 2017, 7, 10006. [Google Scholar] [CrossRef]
  37. Li, C.; Wang, G. Characteristic analysis of temperature change in Haidian District, Beijing, from 1975 to 2019. Mod. Agric. Sci. Technol. 2021, 929, 199–201+204. [Google Scholar]
  38. Ren, D.; Yang, J.; Zhang, J. Analysis of the trend of precipitation changes in Beijing. Water Resour. Hydropower Eng. 2021, 52, 155–158. [Google Scholar]
  39. Wang, Z.; Xu, H. Characteristics of atmospheric pollen and its environmental significance in modern dust storm and non-dust storm weather—A case study of Beijing area. Geogr. Res. 2006, 43, 262–267. [Google Scholar]
  40. Ouyang, Y.; Li, Y.; An, Y.; Li, Y.; Zhang, L. Analysis of allergenic pollen species and concentrations in summer-autumn in northern China. Chin. Otolaryngol.-Head Neck Surg. 2020, 27, 184–187. [Google Scholar]
  41. Zheng, Z.; Tian, F.; Cao, X. A study on surface pollen assemblage and relationship with vegetation from some vegetation types in central North China. Geogr. Geo-Inf. Sci. 2008, 24, 92–97. [Google Scholar]
  42. Ouyang, Z.; Jiang, N.; Zheng, H.; Meng, X.; Wang, X. Species composition, distribution and phenological characters of pollen-allergenic plants in Beijing urban area. Chin. J. Appl. Ecol. 2007, 18, 1953–1958. [Google Scholar]
  43. Liu, Q.; Huete, A. Feedback based modification of the NDVI to minimize canopy background an atmo-spheric noise. IEEE Tansactions Geosci. Remote Sens. 1995, 33, 457–465. [Google Scholar] [CrossRef]
  44. Zhang, Y.; Huete, A.; Didan, K.; Miura, T. Development of a two-band enhanced vegetation index without a blue band. Remote Sens. Environ. 2008, 112, 3833–3845. [Google Scholar]
  45. Huete, A.; Didan, K.; Miura, T.; Rodriguez, E.; Gao, X.; Ferreira, L. Overview of the radiometric and biophysical performance of the MODIS vegetation indices. Remote Sens. Environ. 2002, 83, 195–213. [Google Scholar] [CrossRef]
  46. Bai, Y.; Liu, B.; Duan, L.; Pang, L.; Huang, J. A preliminary study on warning of allergic diseases caused by pollen. J. Environ. Health 2009, 26, 229–232. [Google Scholar]
  47. Zhang, D.; Hai, Y.; Feng, T.; Wu, Z.; He, H.; Zhang, L.; Chu, W.; Wan, G. Applied research on the 1–4 day pollen concentration forecast in Beijing Area. Meteorol. Mon. 2010, 36, 128–132. [Google Scholar]
  48. Zhang, M.; Yang, G.; Fan, Z.; Zhang, L. Forecasting the flowering period of major allergenic pollen trees in Beijing. J. Environ. Health 2008, 262–263. [Google Scholar]
  49. Kobayashi, H.; Dye, D.G. Atmospheric conditions for monitoring the long-term vegetation dynamics in the Amazon using normalized difference vegetation index. Remote Sens. Environ. 2005, 97, 519–525. [Google Scholar] [CrossRef]
Figure 1. Study area. Note the downtown area of Beijing is mainly located within the Outer Ring Road.
Remotesensing 14 05891 g001
Figure 2. Technical process diagram for the extraction of satellite-derived vegetation greenness phenological characteristics before the pollen allergy outbreak. T in the right plots of (c) is the average DOY of spring pollen allergy outbreak during 2011–2021; VI in the right plots of (c) and (d) is the vegetation index value corresponding to the average DOY of pollen allergy outbreak; x 1 in the left plot of (c) is the DOY that 20 days earlier than the earliest breakout date of spring pollen allergy during 2011–2021, i.e., the 50th day; x 2 is the average DOY of spring pollen allergy outbreak during 2011–2021, i.e., the 81st day; y 1 is the vegetation index value corresponding to x 1 on the fitted curve of the smoothed multiyear average daily curve of a vegetation index for a vegetation type; y 2 is the vegetation index value corresponding to x 2 on the fitted curve of the smoothed multiyear average daily curve of a vegetation index for a vegetation type; tn in the right plot of (d) is the corresponding DOY of VI in each year during 2011–2021; and Tn is the DOY of spring pollen allergy outbreak in each year during 2011–2021.
Remotesensing 14 05891 g002
Figure 3. An example shows how the prediction model of pollen allergy works for each year. (a) The preprocess of vegetation index data during 2011–2021; (b) the final cumulative linear fit prediction model; (c) the preprocess of vegetation index data in 2021 from the 1st day to the 50th day; and (d) the process of predicting pollen allergy in 2021. Y is the vegetation index value; W is the predicted number of days to the outbreak date of spring pollen allergy in Beijing (a negative value indicates that the outbreak date has not yet arrived, and a positive value indicates that the outbreak date has passed); y is the smoothed cumulative vegetation index value on the 50th day in 2021; and w is the predicted number of days to the outbreak date of spring pollen allergy in Beijing in 2021. Note the difference between the model building with the multi-year average vegetation index time series in (a) and the model prediction with the daily vegetation index time series in a certain year in (c).
Remotesensing 14 05891 g003
Figure 4. The establishment of two prediction models based on EVI2 of evergreen forest during 2011–2021. W is the number of days to the outbreak date of spring pollen allergy in Beijing, Y1 is the smoothed daily EVI2 value of evergreen forest for a given forecast year, and Y2 is the cumulative smoothed daily EVI2 value of evergreen forest for a given forecast year.
Remotesensing 14 05891 g004
Figure 5. The EVI2 value corresponding to the green-up date of evergreen forest. The black dots correspond to the green-up date of the evergreen forest.
Remotesensing 14 05891 g005
Table 1. The value range of each greenness characteristic derived from different vegetation indices within the 30 days before the spring average pollen allergy outbreak date during 2011–2021.
Vegetation TypeNDVIEVIEVI2NIR + R + BG/R
Evergreen Forest0.257–0.3090.125–0.1310.113–0.1382.074–2.2170.967–0.974
Deciduous Forest0.196–0.2270.107–0.1230.095–0.1261.800–2.0610.971–0.976
Evergreen + Deciduous Forest0.233–0.2600.117–0.1350.113–0.1242.008–2.1390.969–0.975
Table 2. The sensitivity coefficients of each greenness characteristic to the vegetation greenness date of spring pollen allergy.
Vegetation TypeNDVIEVIEVI2NIR + R + BG/R
Evergreen Forest0.2530.0600.2700.0860.009
Deciduous Forest0.1980.1870.1160.1810.006
Evergreen+ Deciduous Forest0.1450.1920.1220.0820.008
Note: Bold font indicates the maximum value of the sensitivity coefficient in each row.
Table 3. The correlation coefficients between the interannual variations in each greenness characteristic and the outbreak dates of pollen allergy.
Vegetation TypeNDVIEVIEVI2NIR + R + BG/R
Evergreen Forest0.724 *0.2890.693 *0.1590.612 *
Deciduous Forest0.762 *0.4290.633 *0.4850.538
Evergreen+ Deciduous Forest0.717 *0.6750.705 *0.2800.519
Note: Bold font indicates the maximum value of the correlation coefficient in each row; * indicates significance at p = 0.05.
Table 4. Cross-test results of the prediction models based on EVI2 of evergreen forest, NDVI of evergreen forest and EVI2 of deciduous forest for 330 training sessions.
Years for Model BuildingYears for Model TestRMSE for the Linear Fit Prediction ModelRMSE for the Cumulative Linear Fit Prediction Model
EVI2 of Evergreen ForestNDVI of Evergreen ForestEVI2 of Deciduous ForestEVI2 of Evergreen ForestNDVI of Evergreen ForestEVI2 of Deciduous Forest
2011–20172018–202152.99161.53842.4973.36918.17714.123
2012–20182011, 2019–20219.832242.95355.8082.43419.81114.123
2013–20192011–2012, 2020–202148.86278.27256.4641.76615.81311.989
2014–20202011–2013, 202111.39953.60818.2322.85311.28510.225
2015–20212011–201440.17288.49114.3853.07331.5256.865
Average of RMSEs
(mean ± sd)
/95.549 ± 197.572 92.636 ± 134.07526.673 ± 21.7253.589 ± 1.101 22.519 ± 10.18410.450 ± 2.689
Publisher’s Note: MDPI stays neutral with regard to jurisdictional claims in published maps and institutional affiliations.

