
Laser Scanning Investigation and Geophysical Monitoring to Characterise Cultural Heritage Current State and Threat by Traffic-Induce Vibrations: The Villa Farnesina in Rome

 ,
,  ,
,
Abstract
1. Introduction
2. Materials and Methods
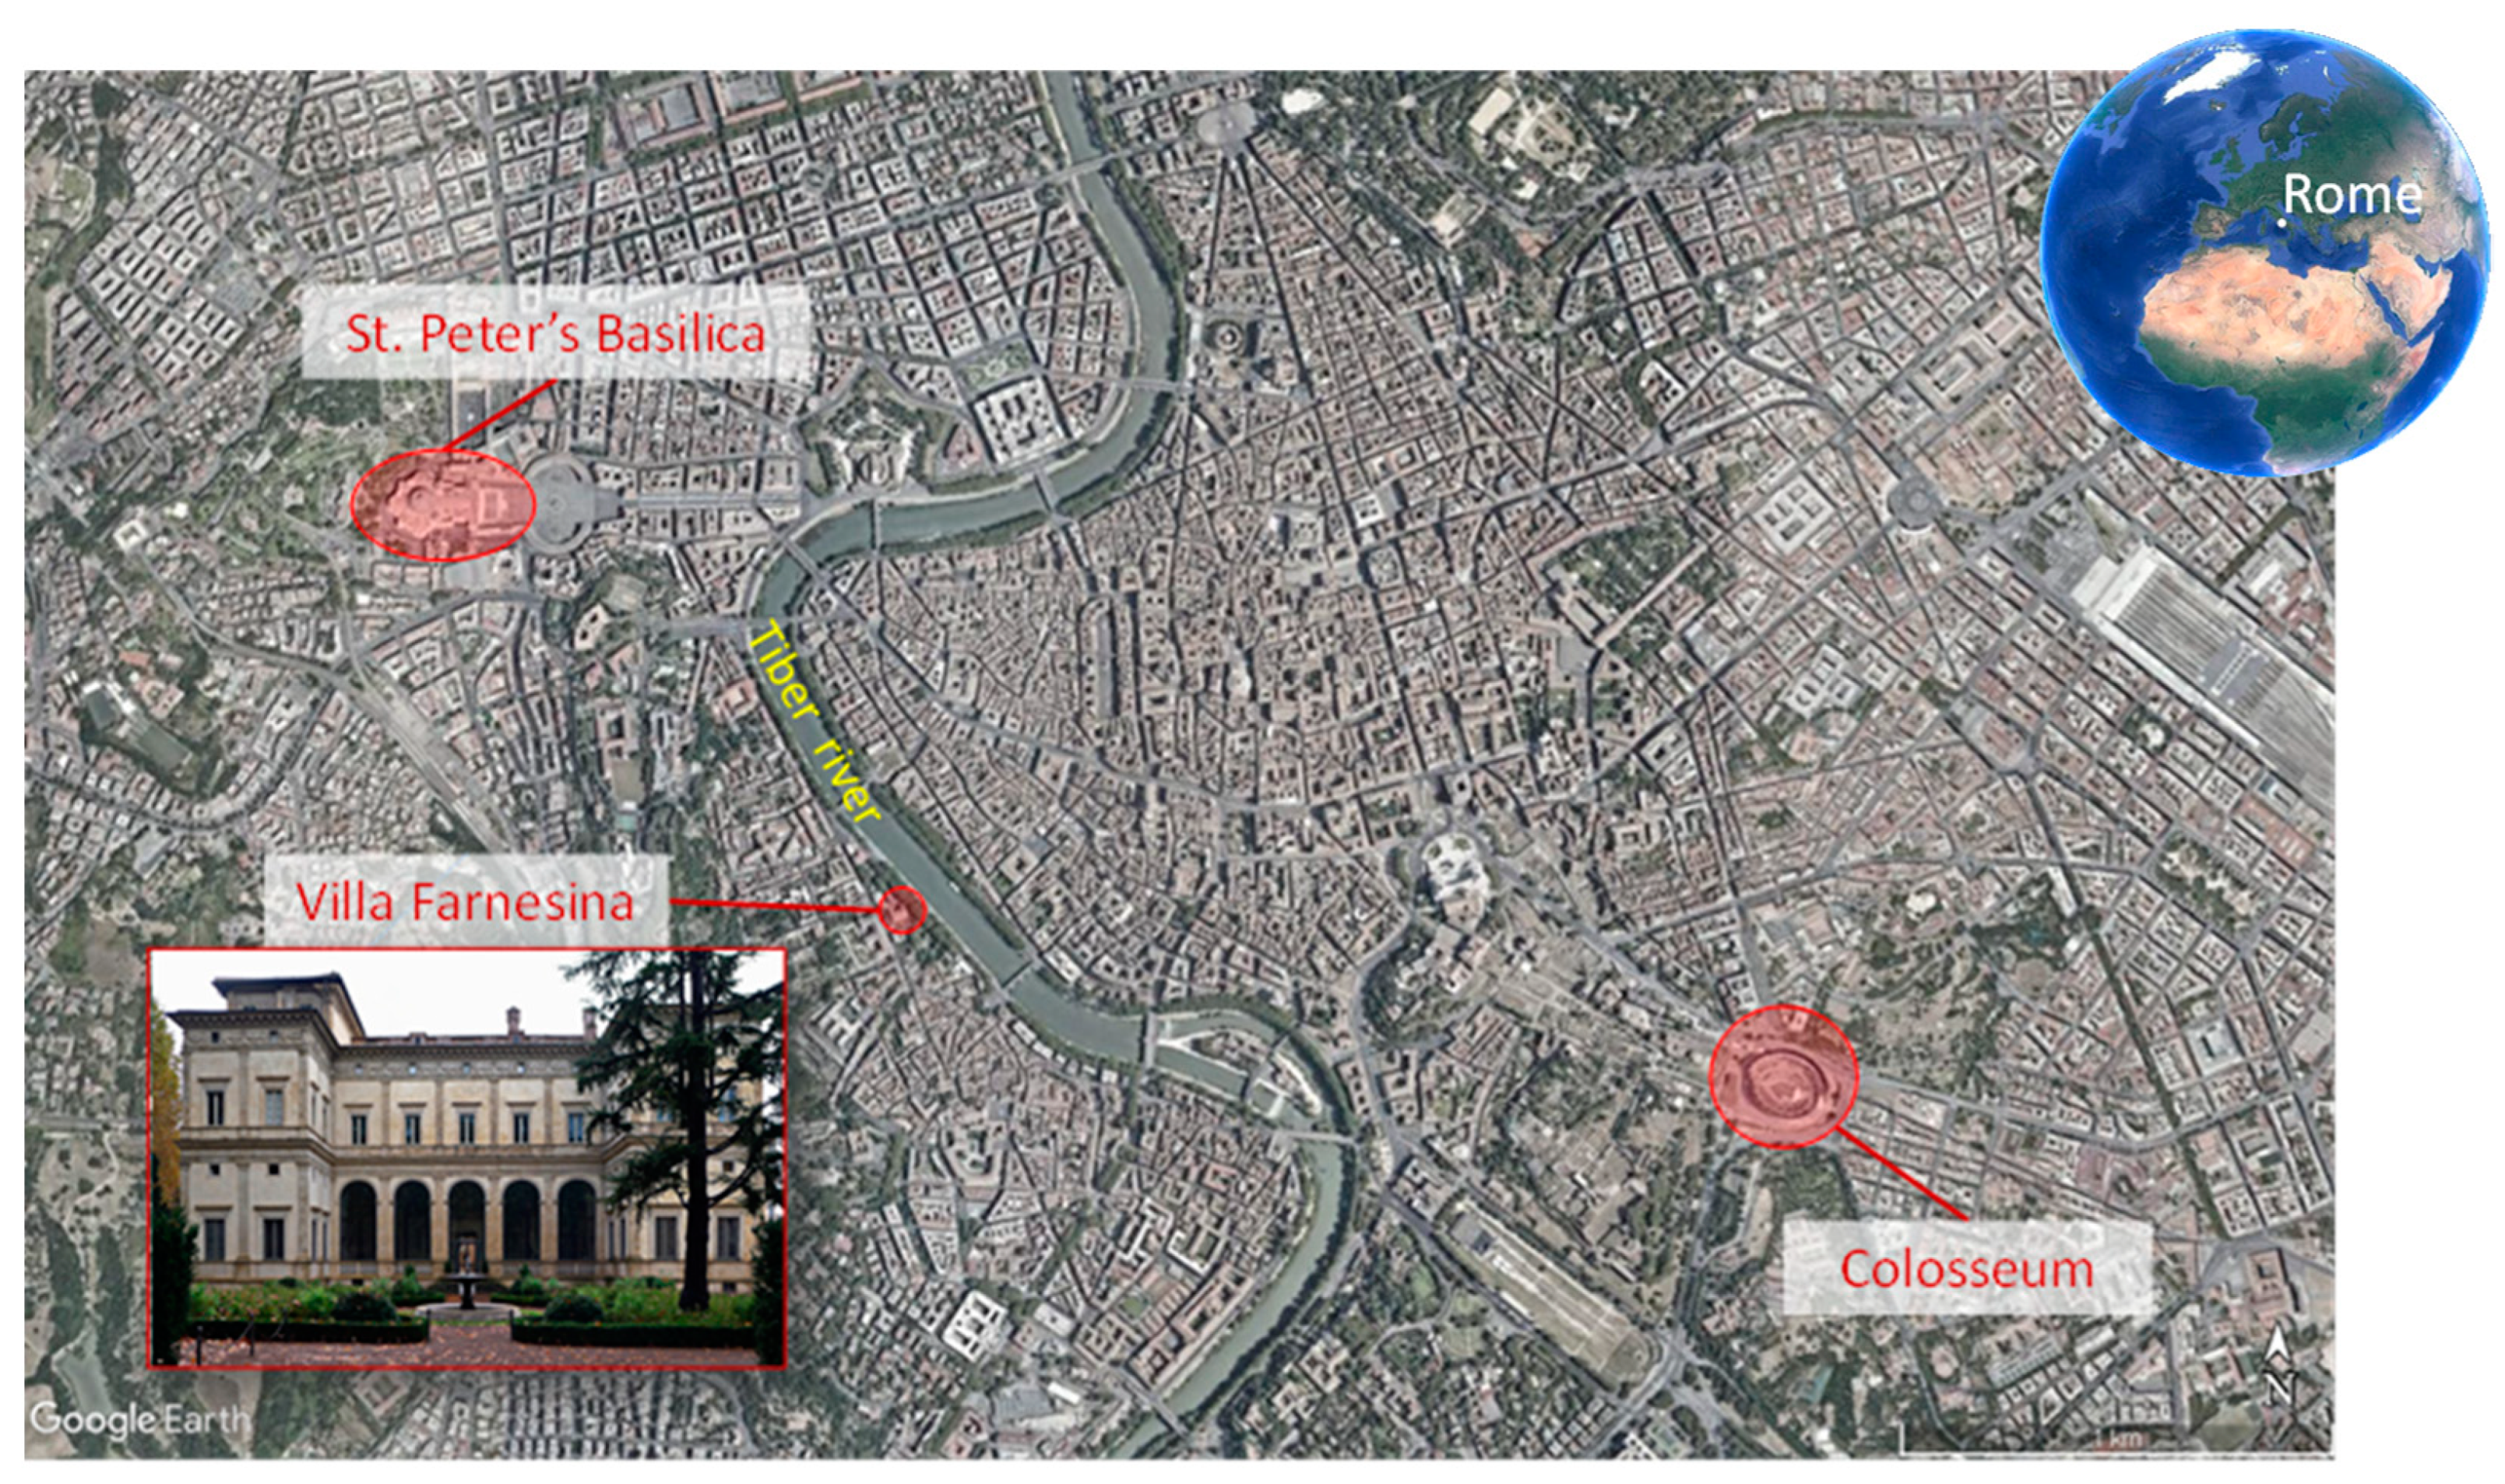
2.1. The Case Study: Villa Farnesina
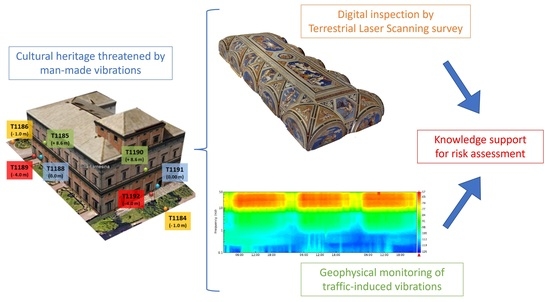
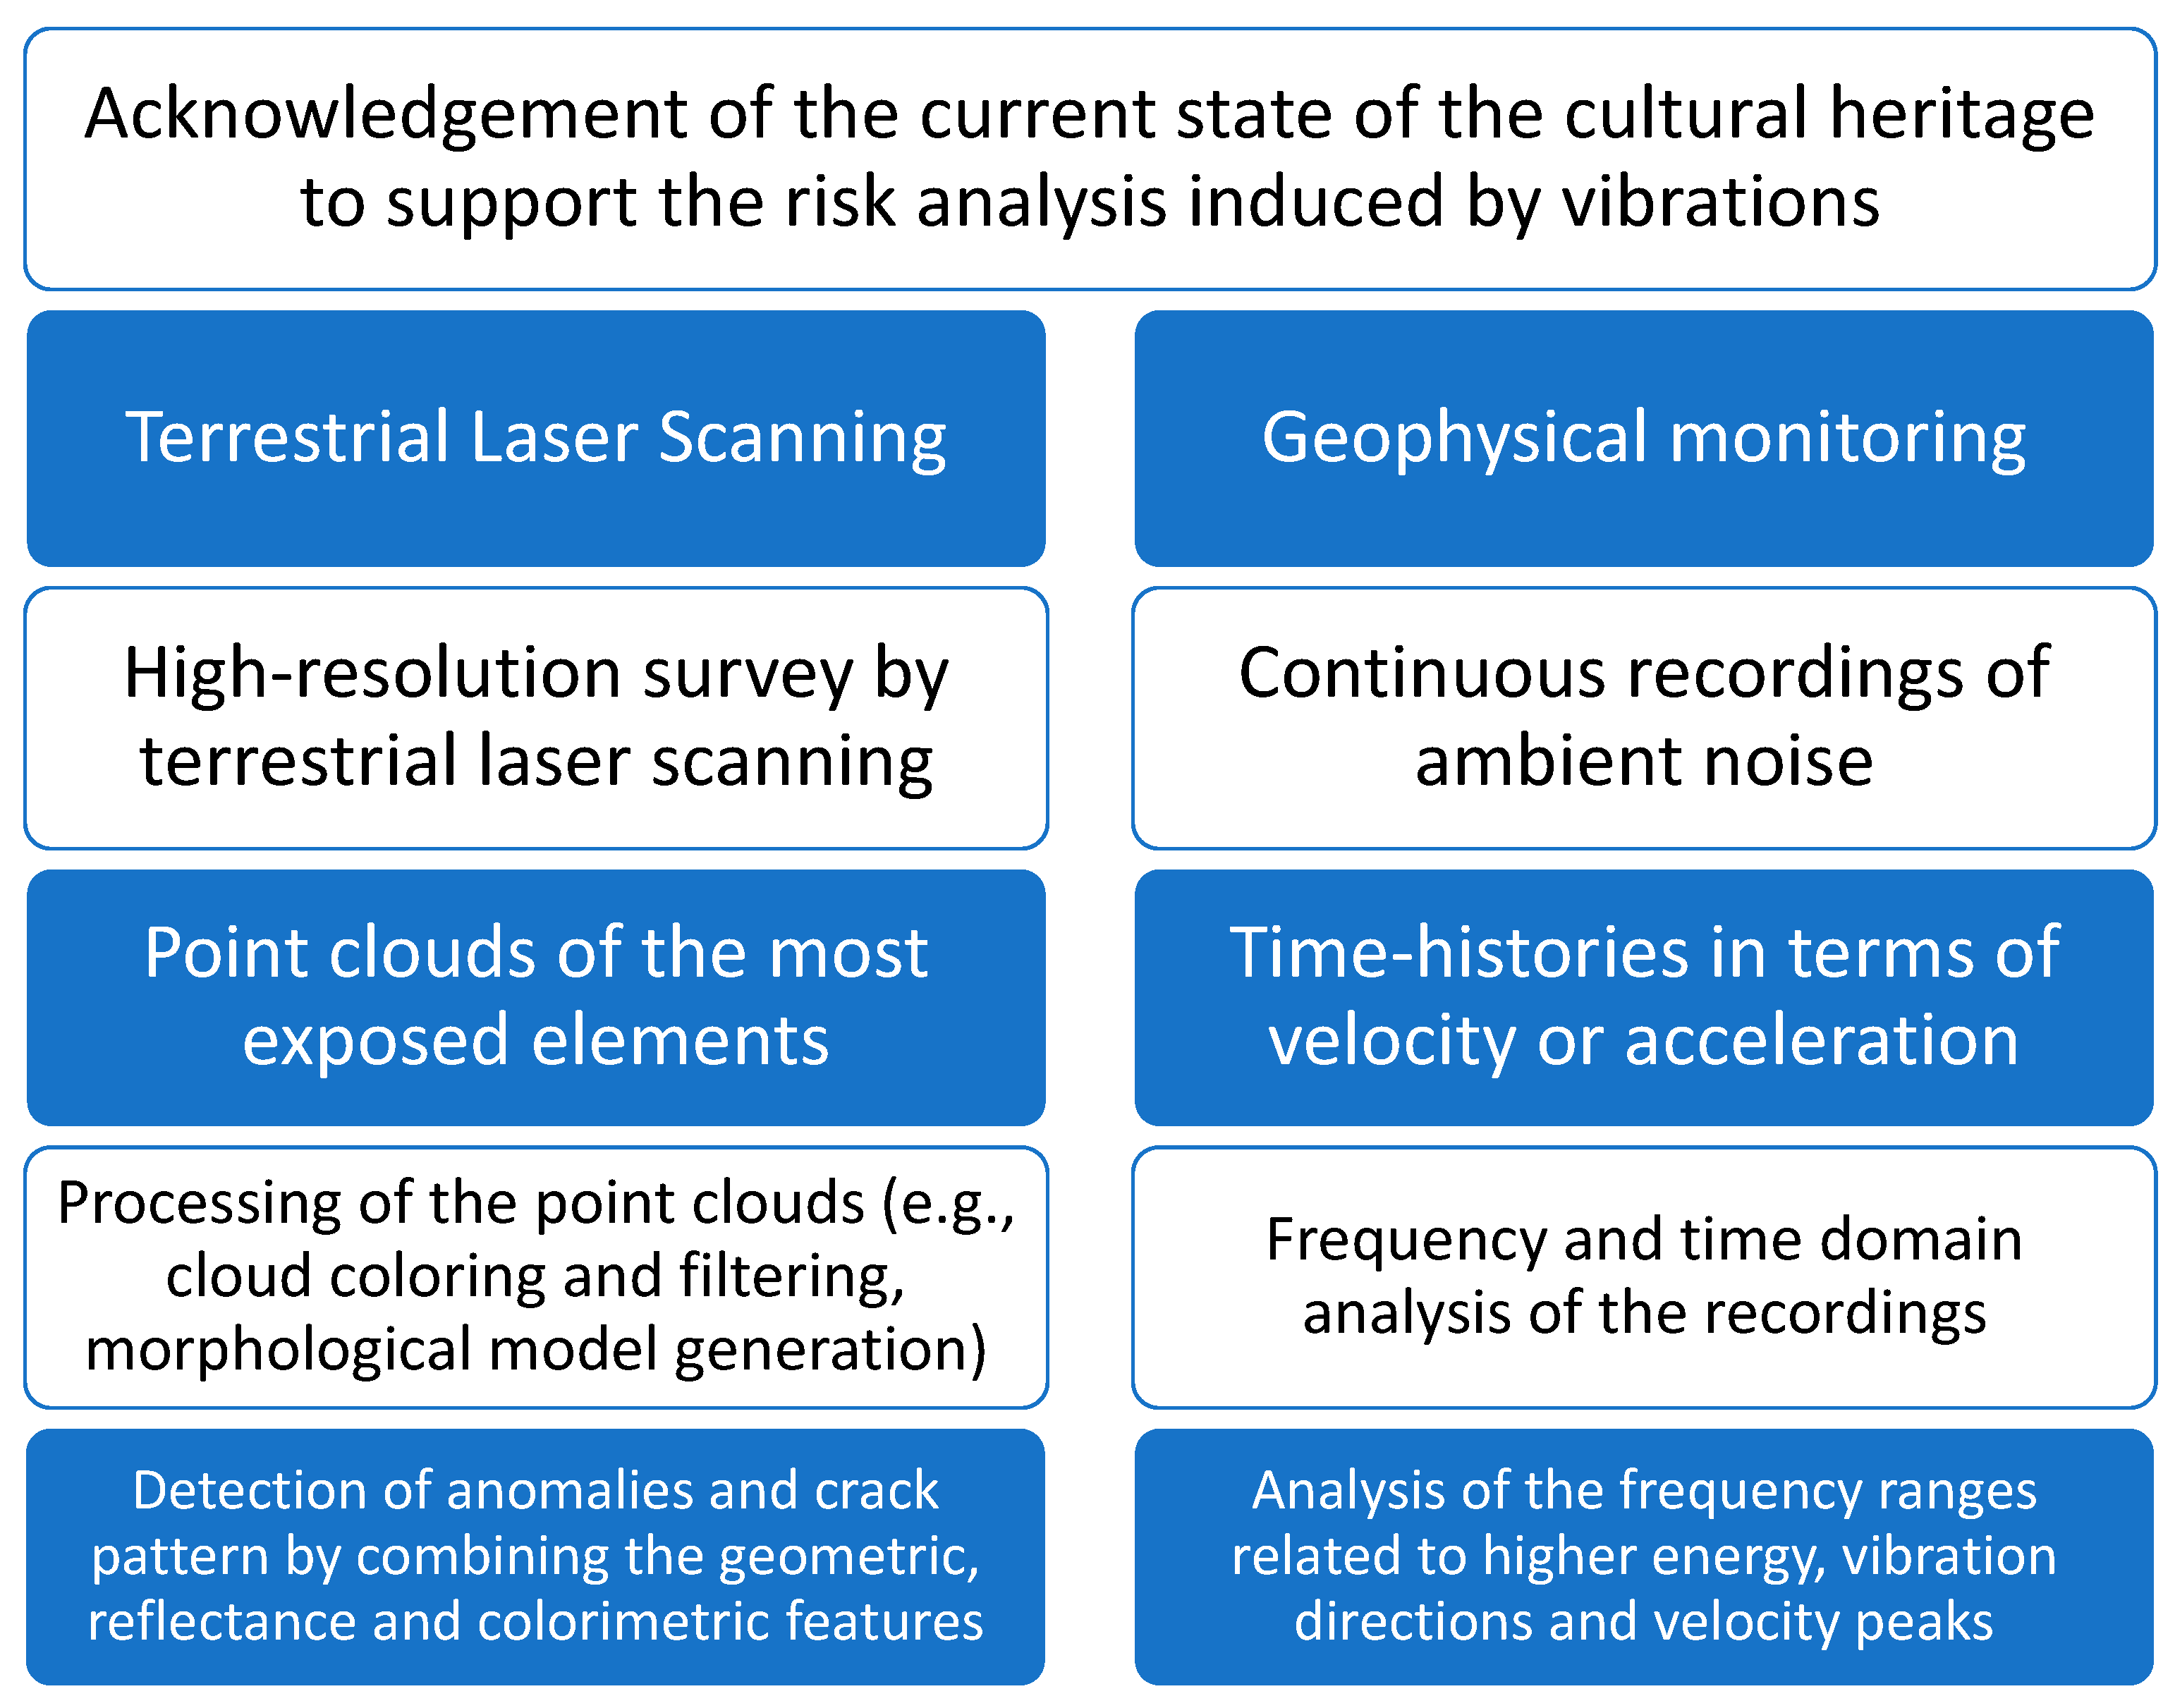
2.2. Methodology
2.2.1. Laser Scanning Survey
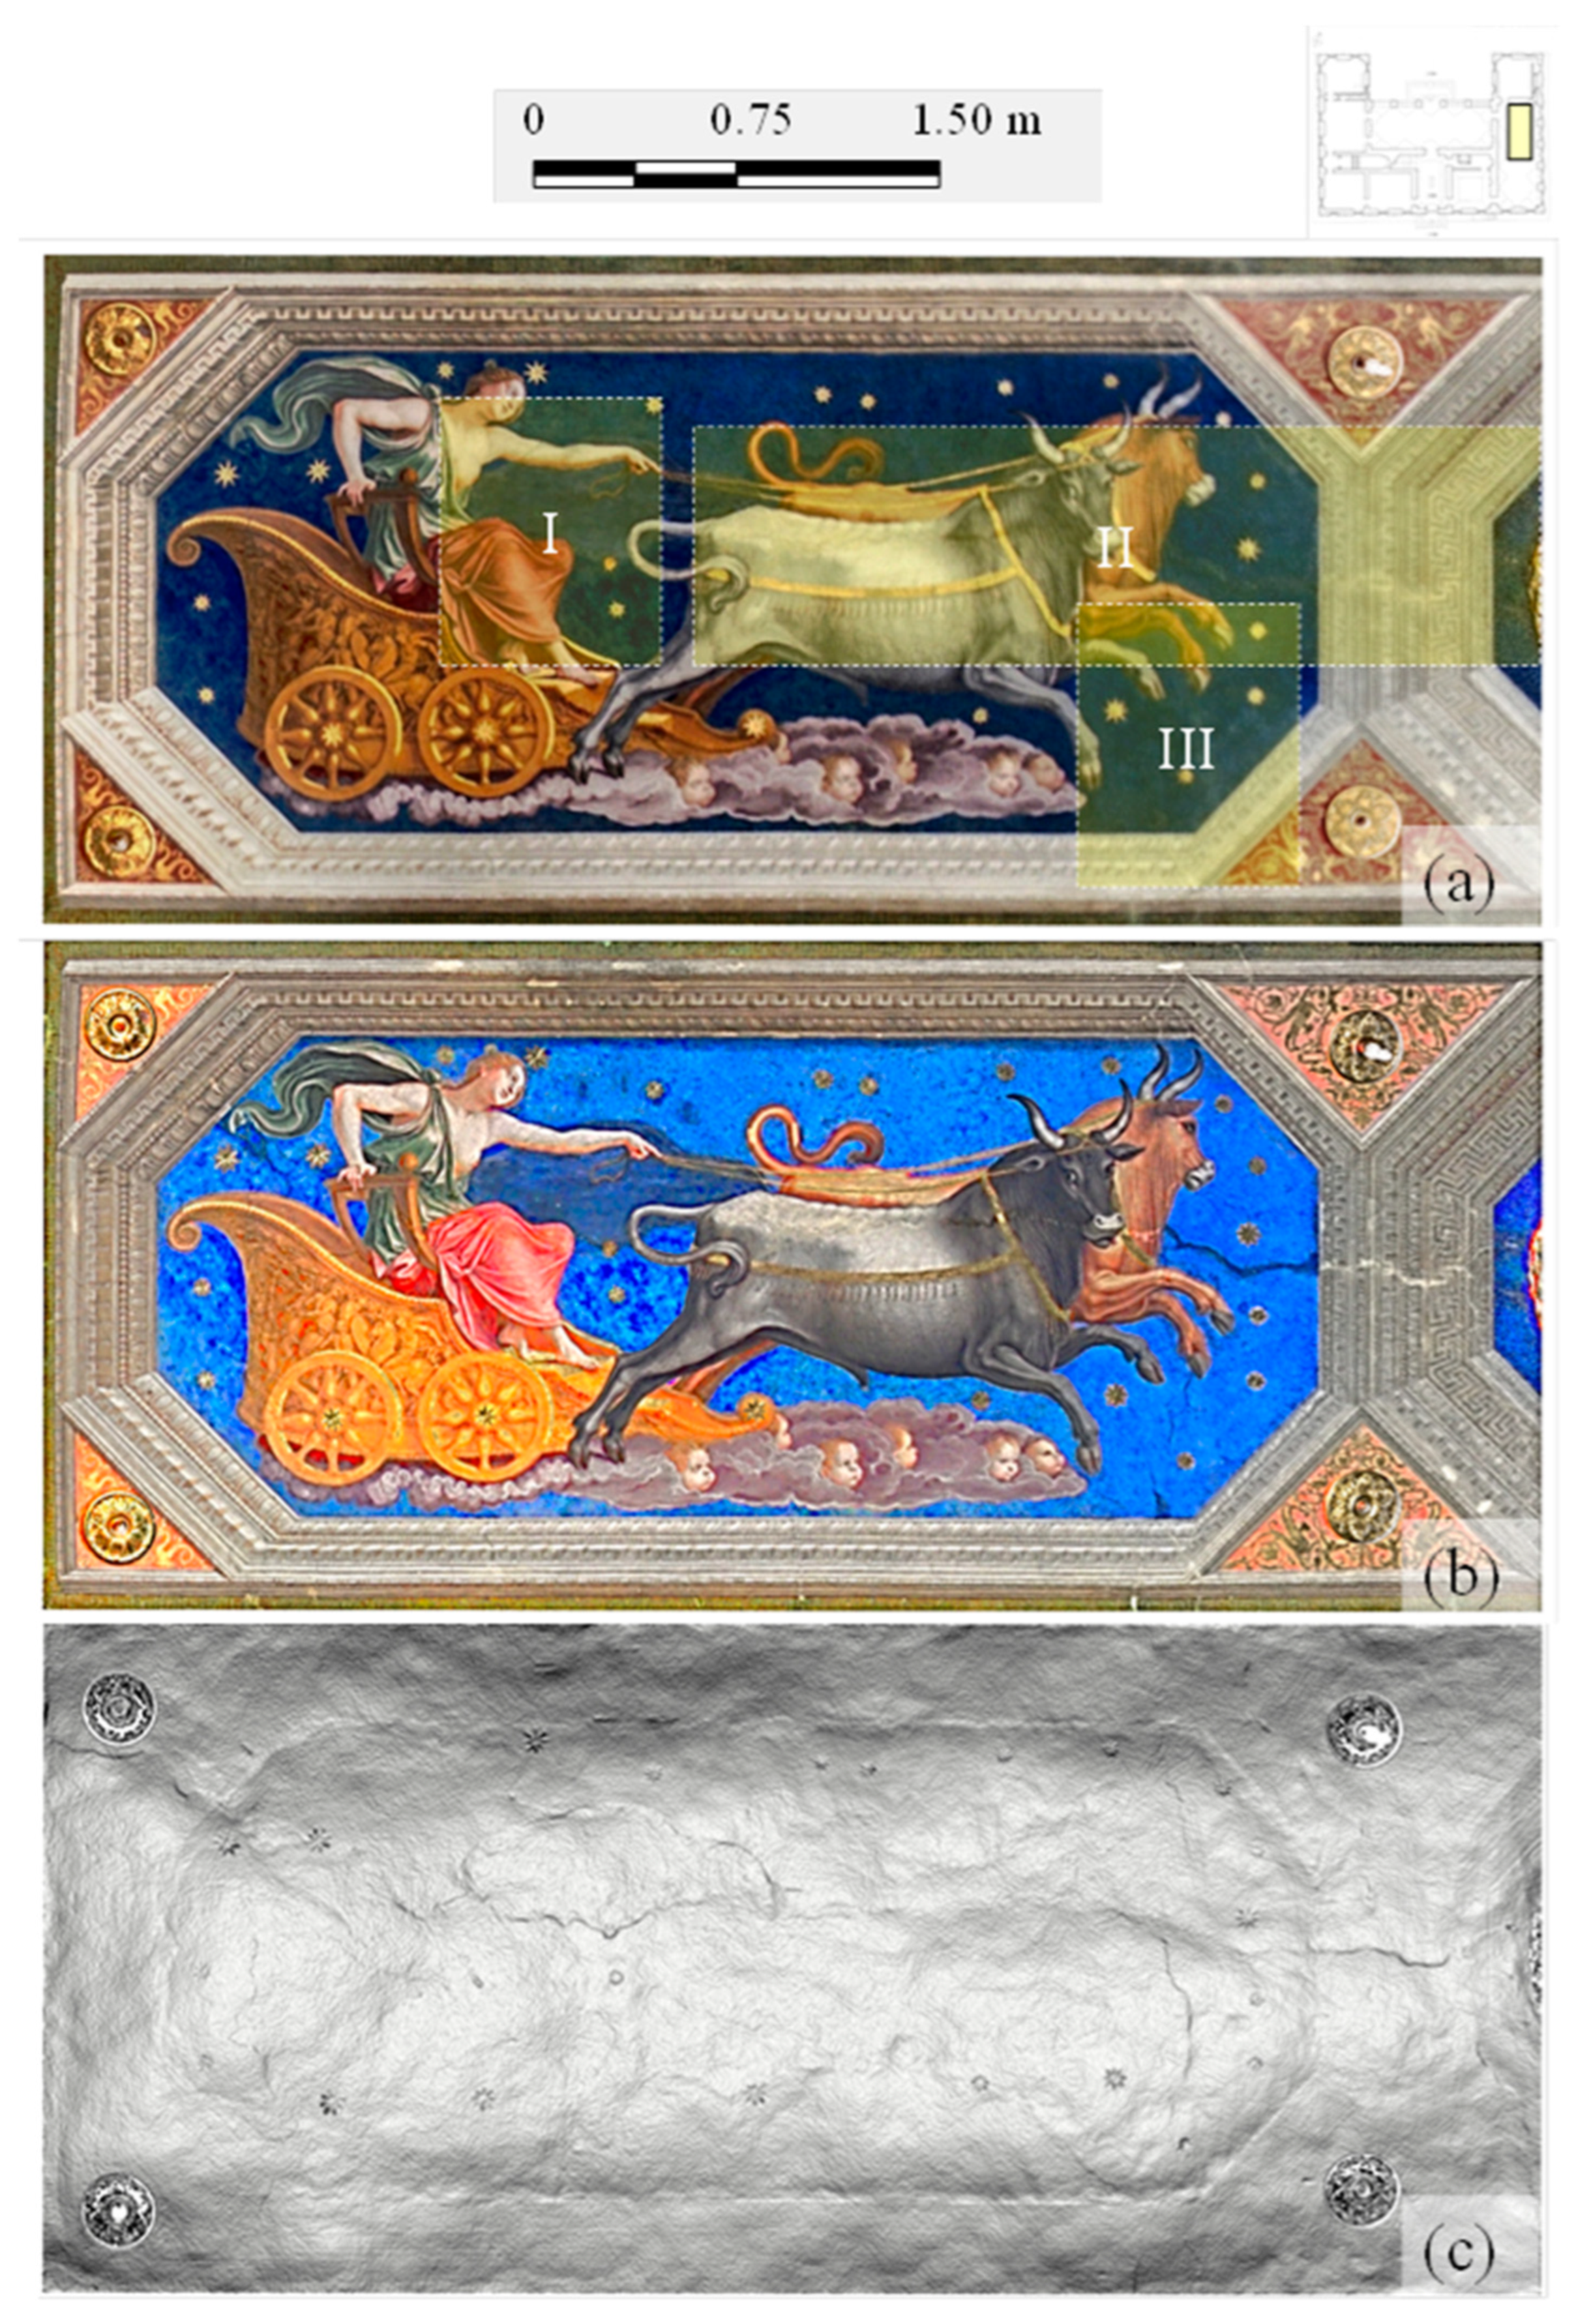
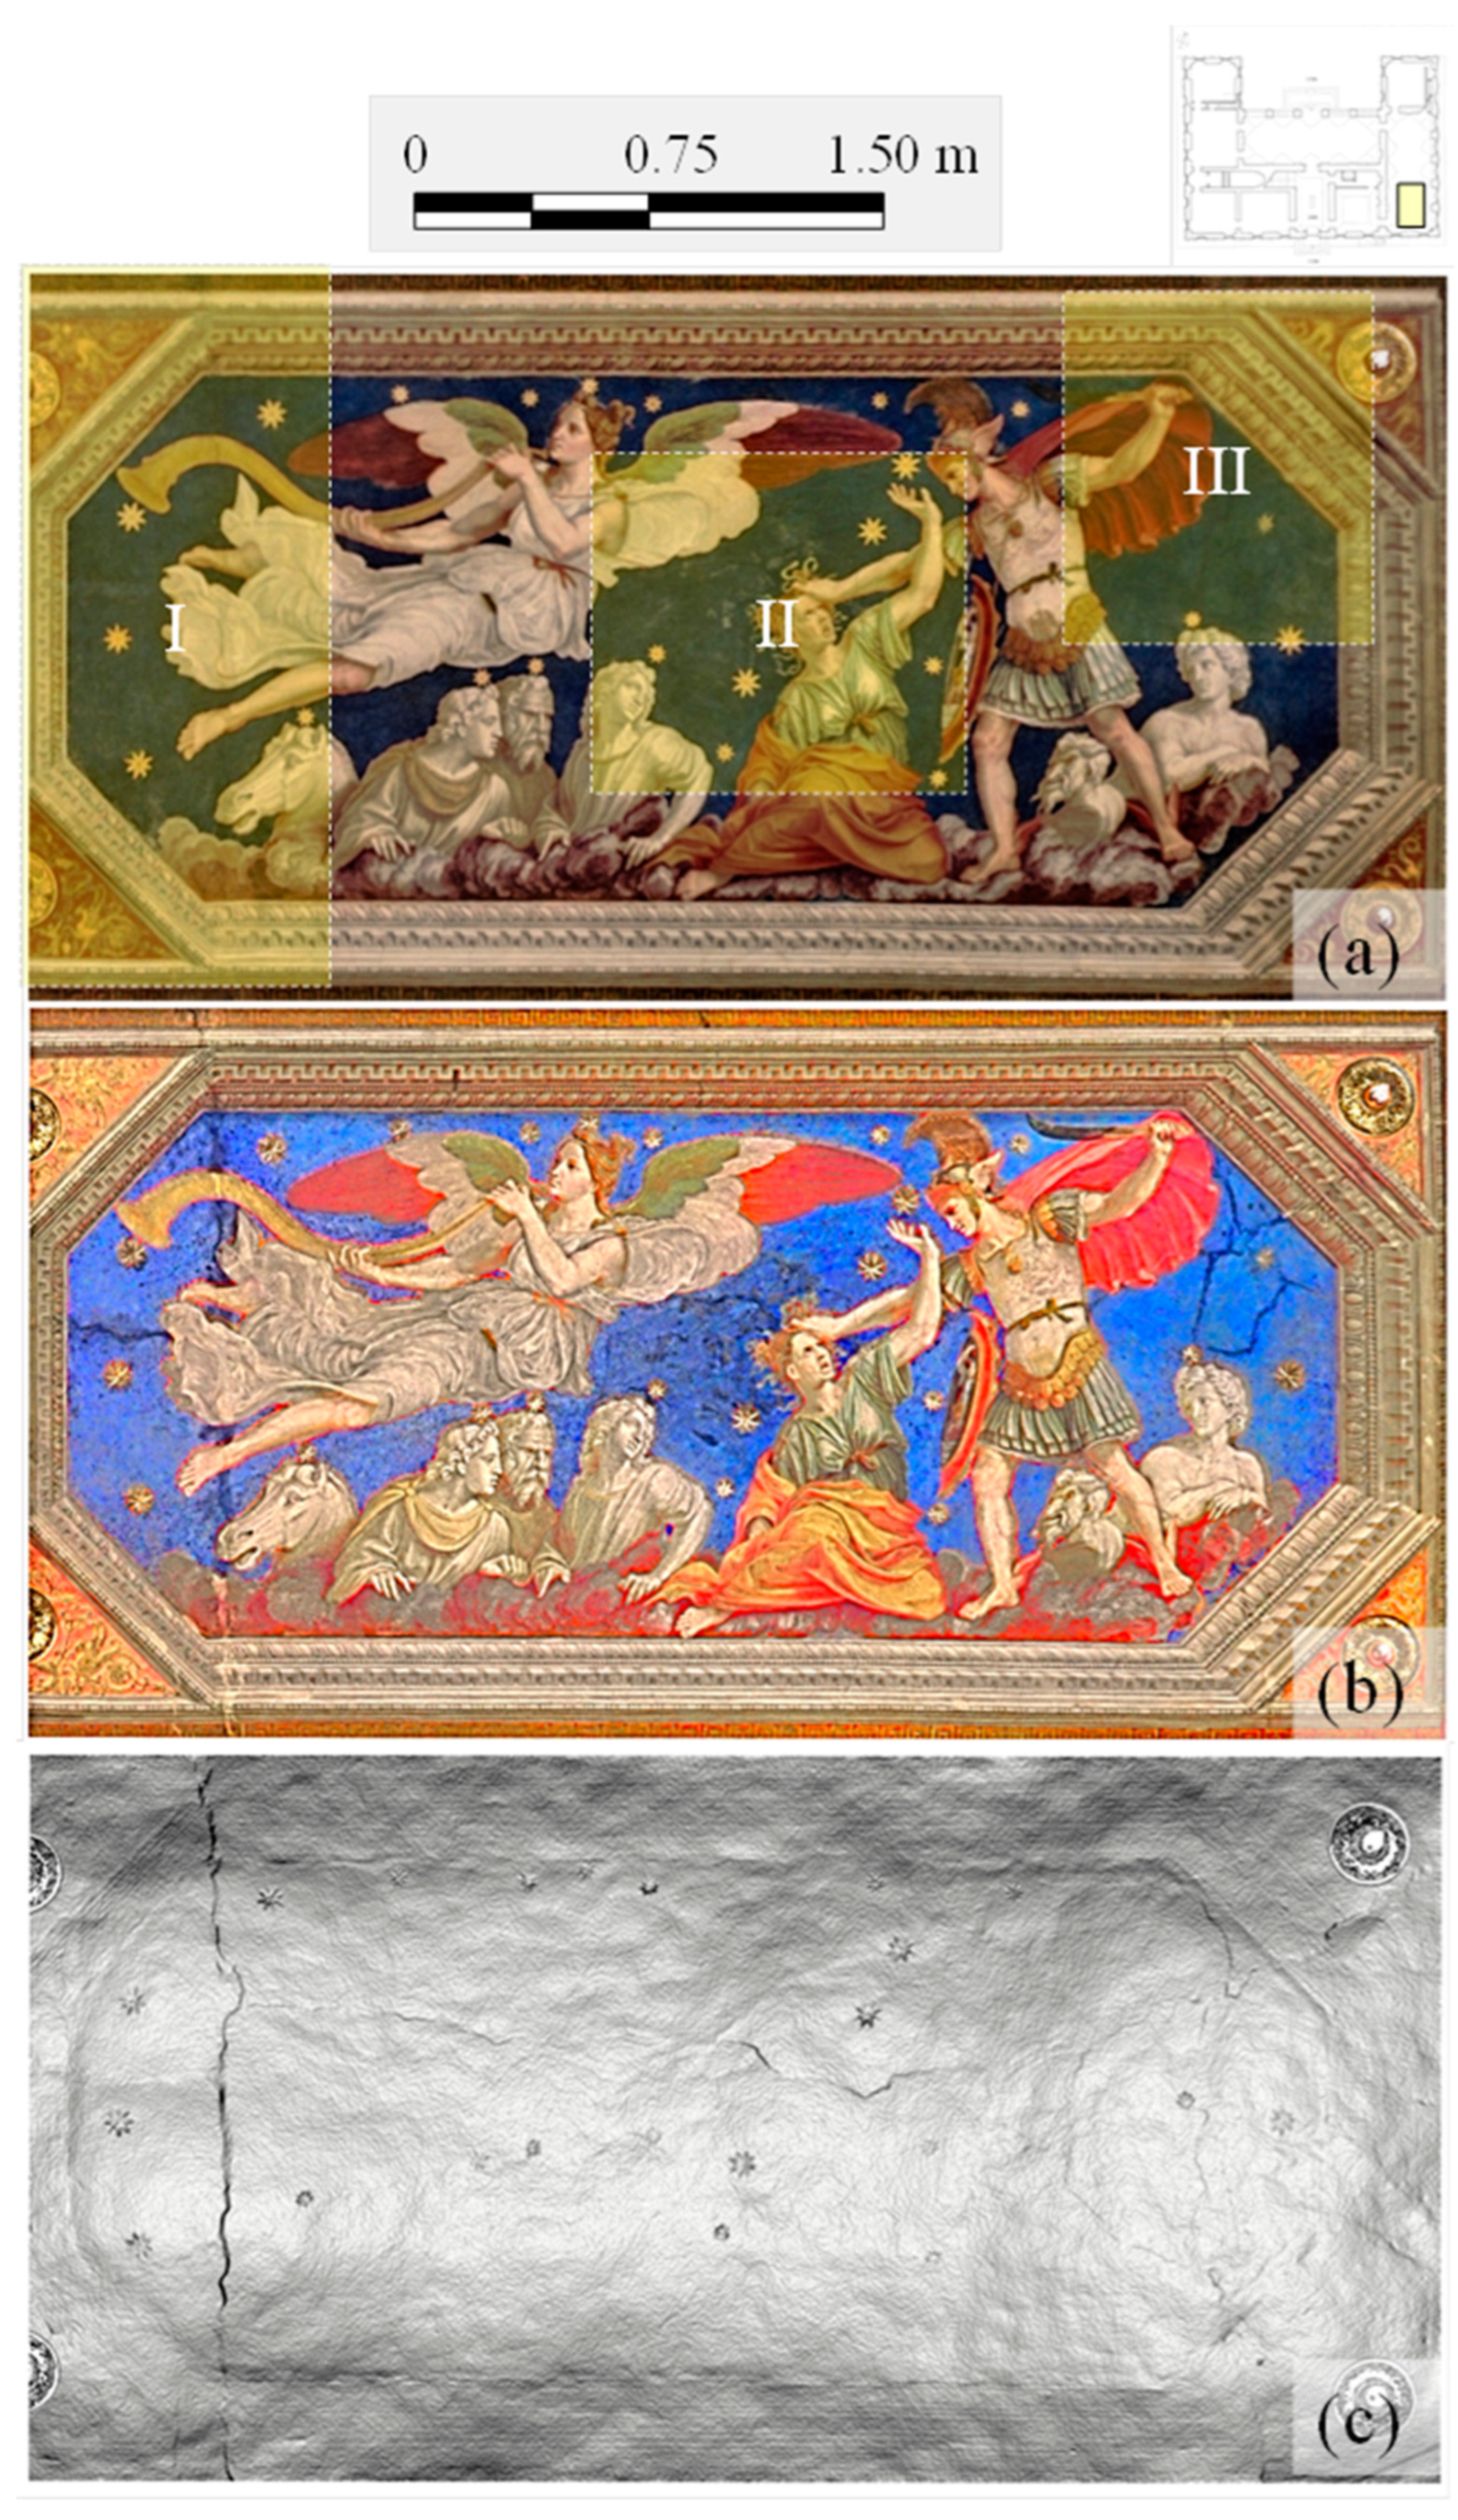
- The RGB Colour information by combining the high-resolution pictures with the point cloud by mean of the Z+F LaserControl® [43];
- The local morphology by calculating, for each point, the normal direction to the plane, obtained by interpolating all the points within a distance of 2 cm from the reference one through a script implemented in Cloud Compare [44];
- The “false” colours, enhanced by combining the “true” ones with the intensity of laser signal (at higher spatial resolution) using pan-sharpening techniques. This processing was performed through an algorithm implemented in Cloud Compare based on Brovey transformation (cf. [45]), that allows obtaining false R’G’B’ components by dividing the true RGB components by their sum and then multiplying them by the scalar intensity, normalised in the range 0–255.
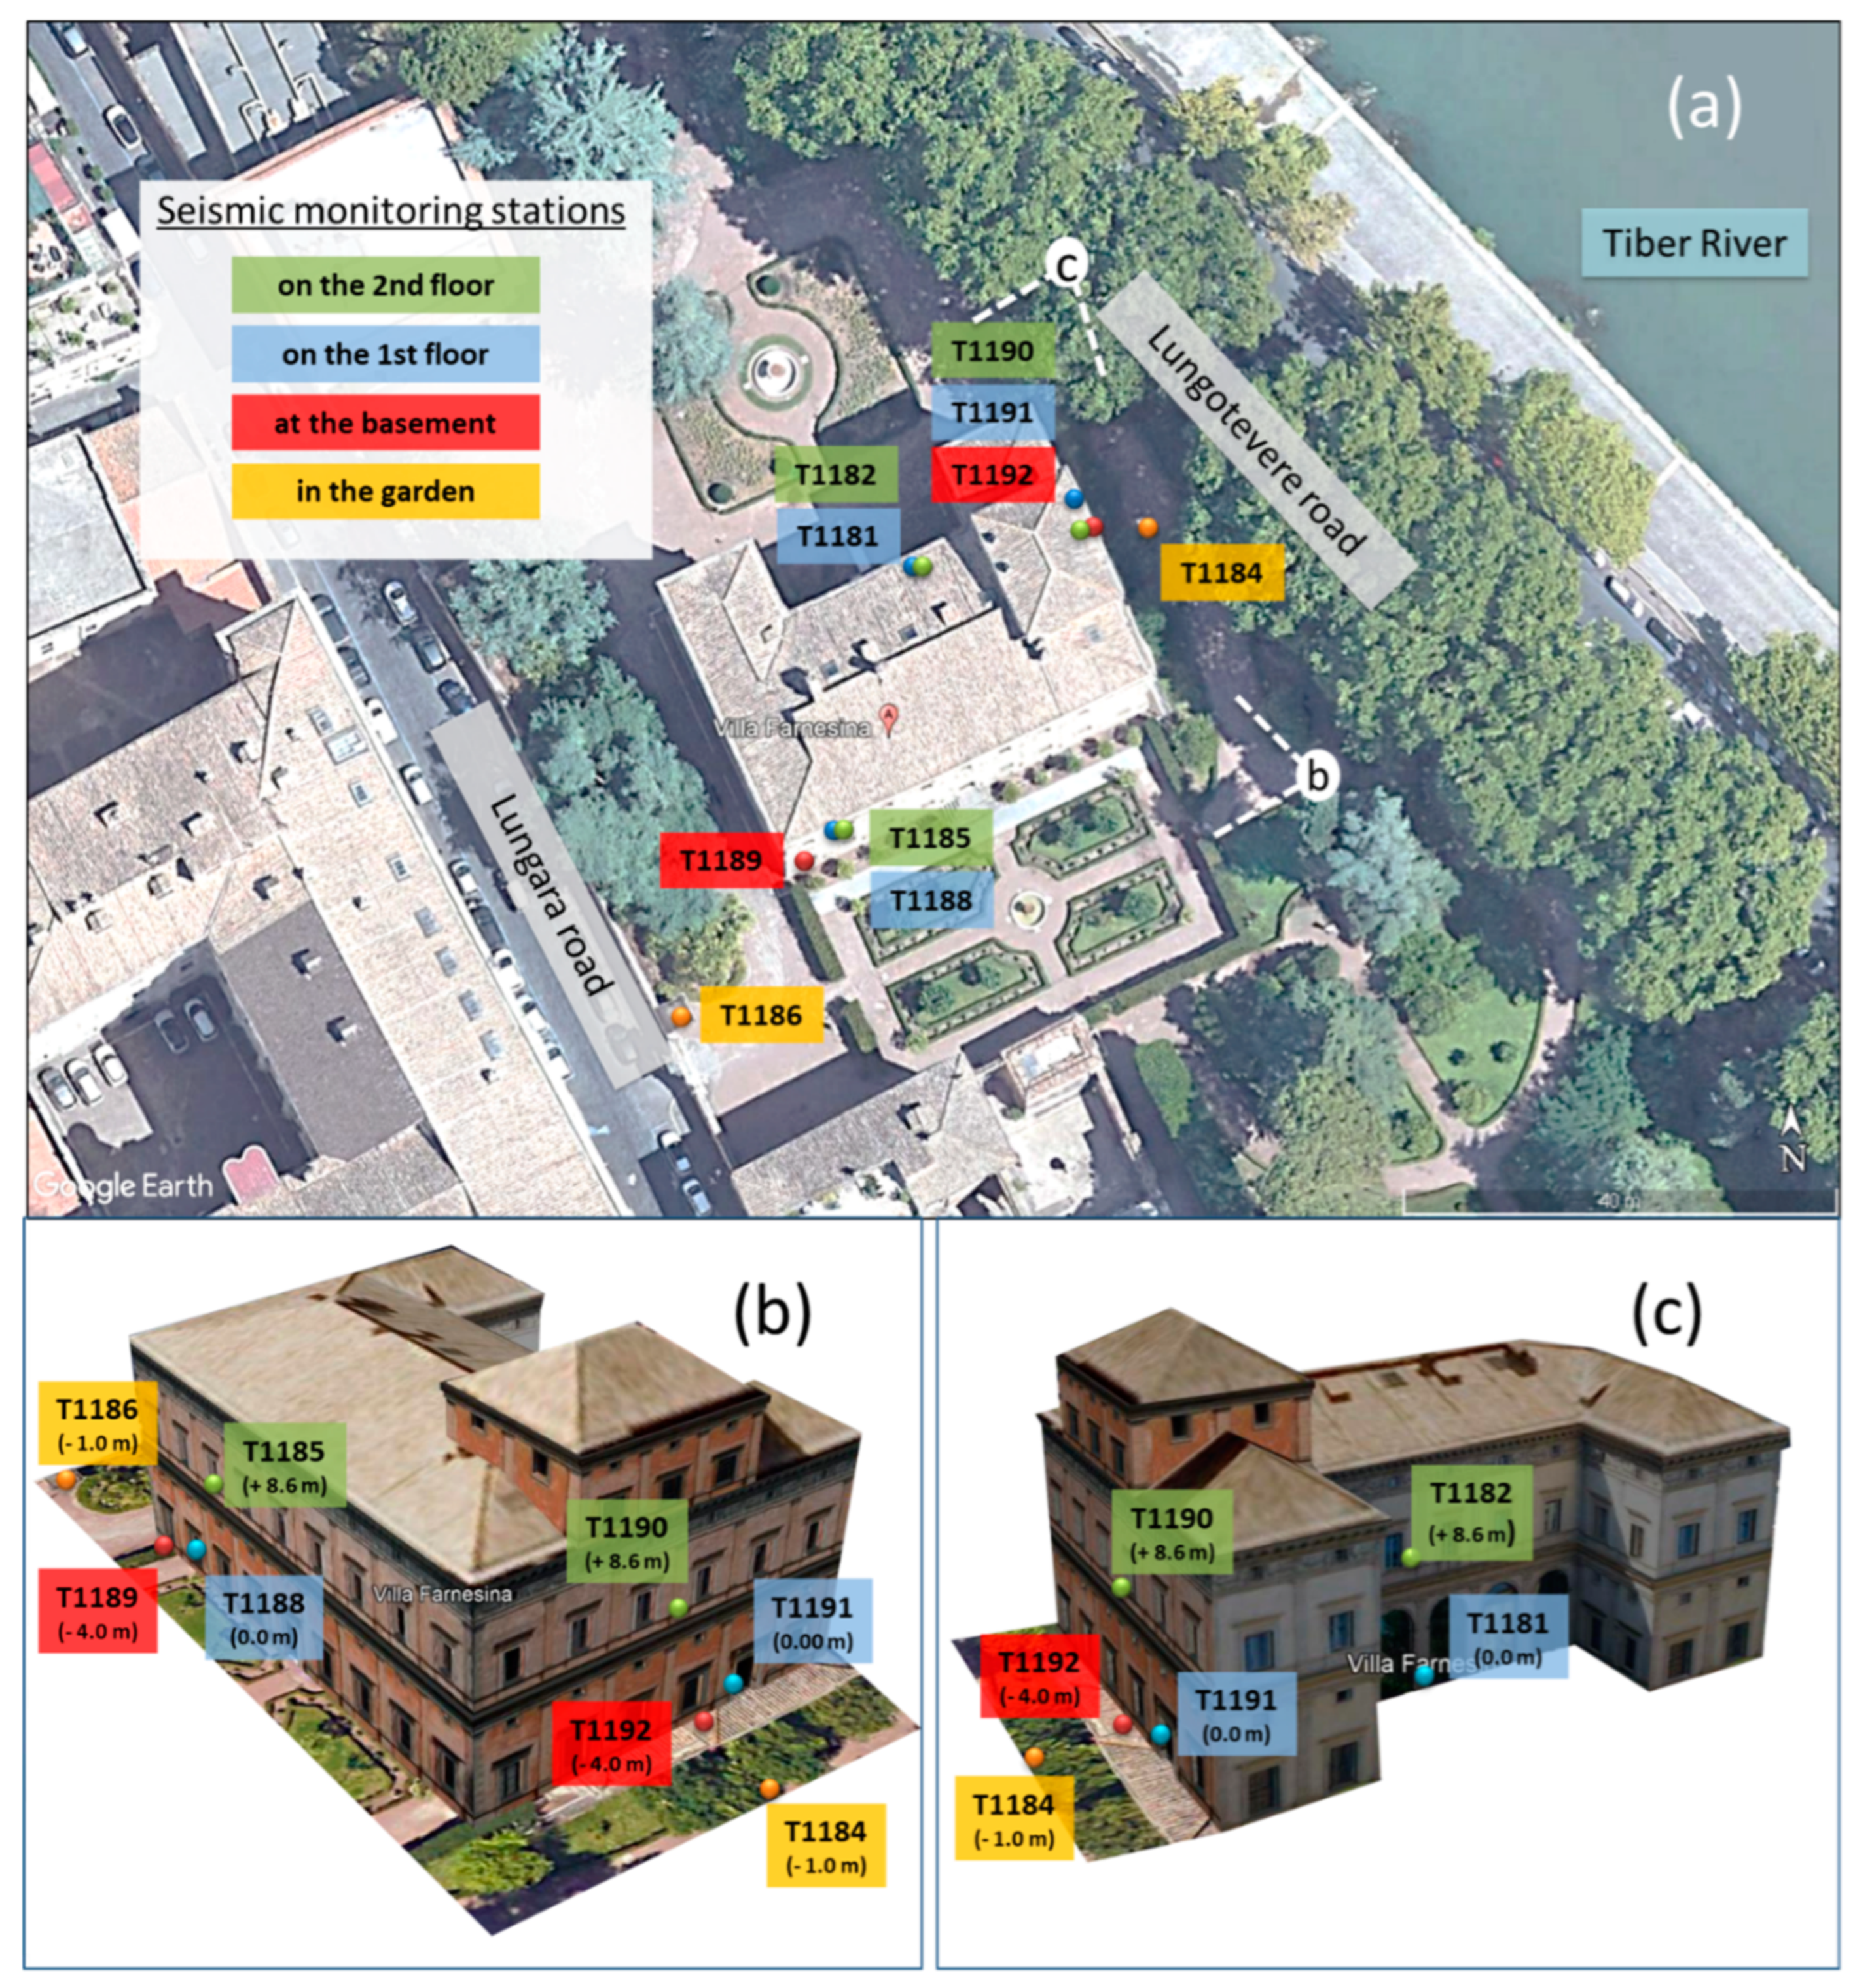
2.2.2. Geophysical Monitoring
3. Results
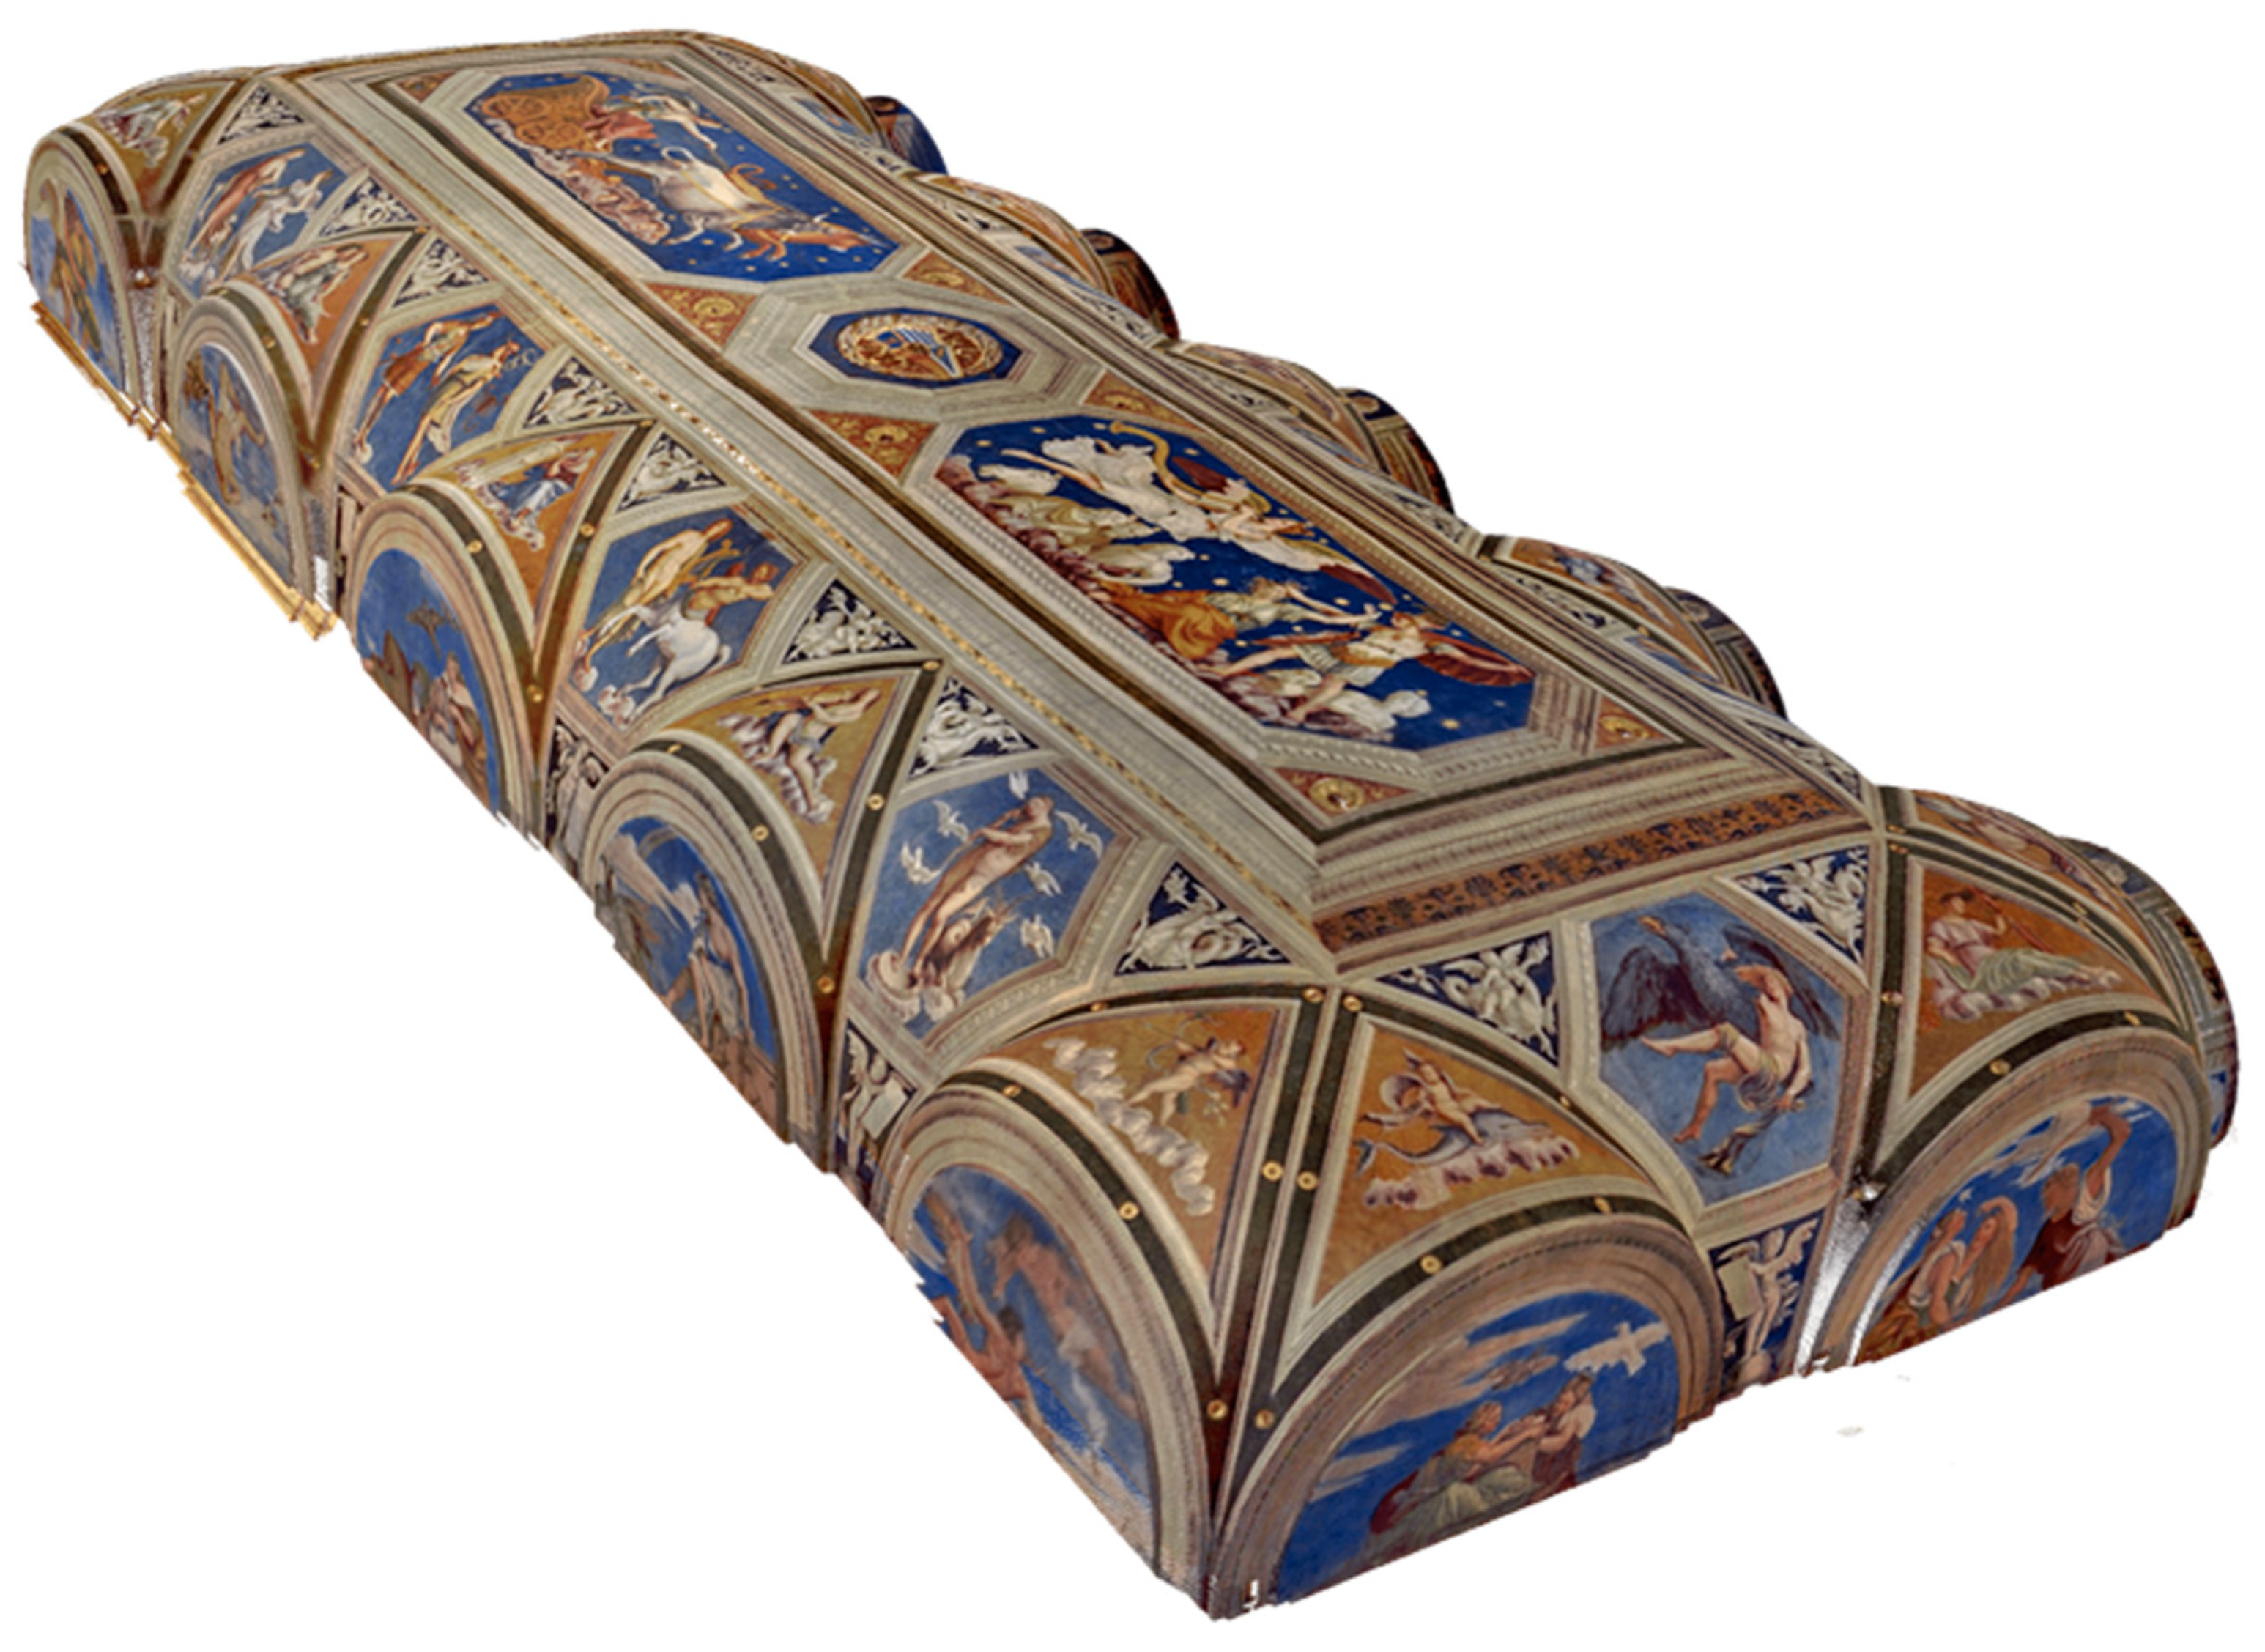
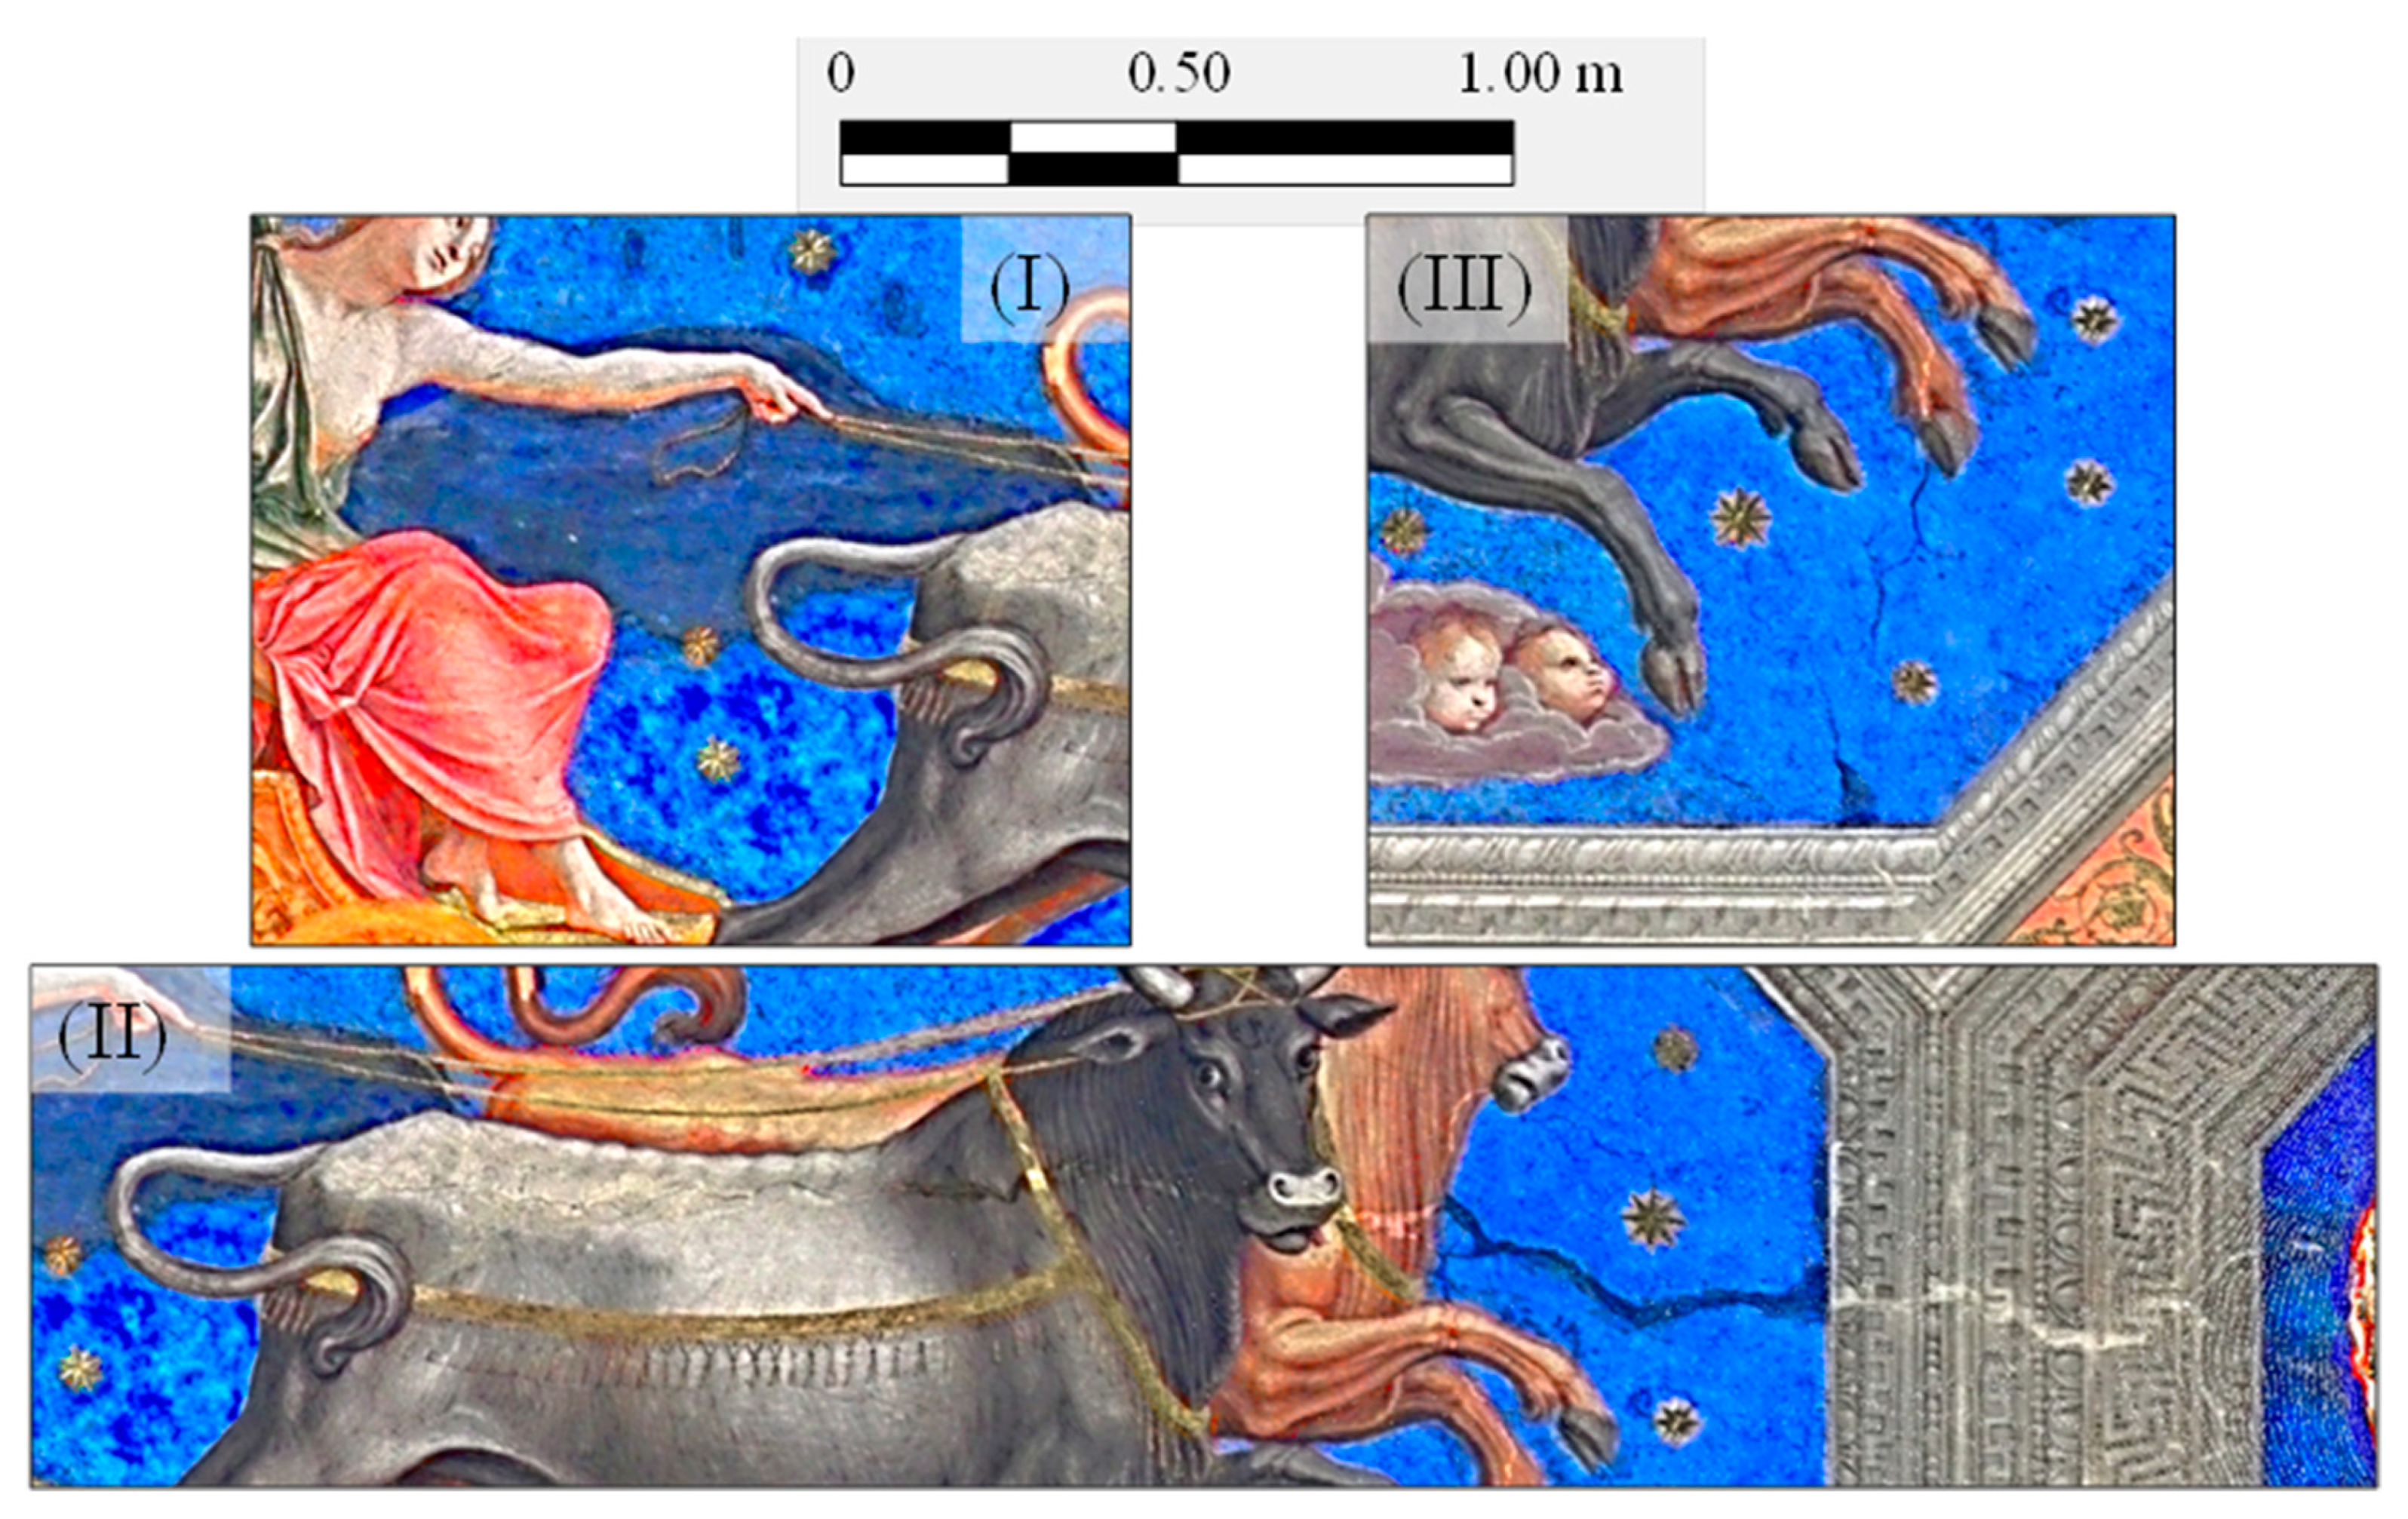
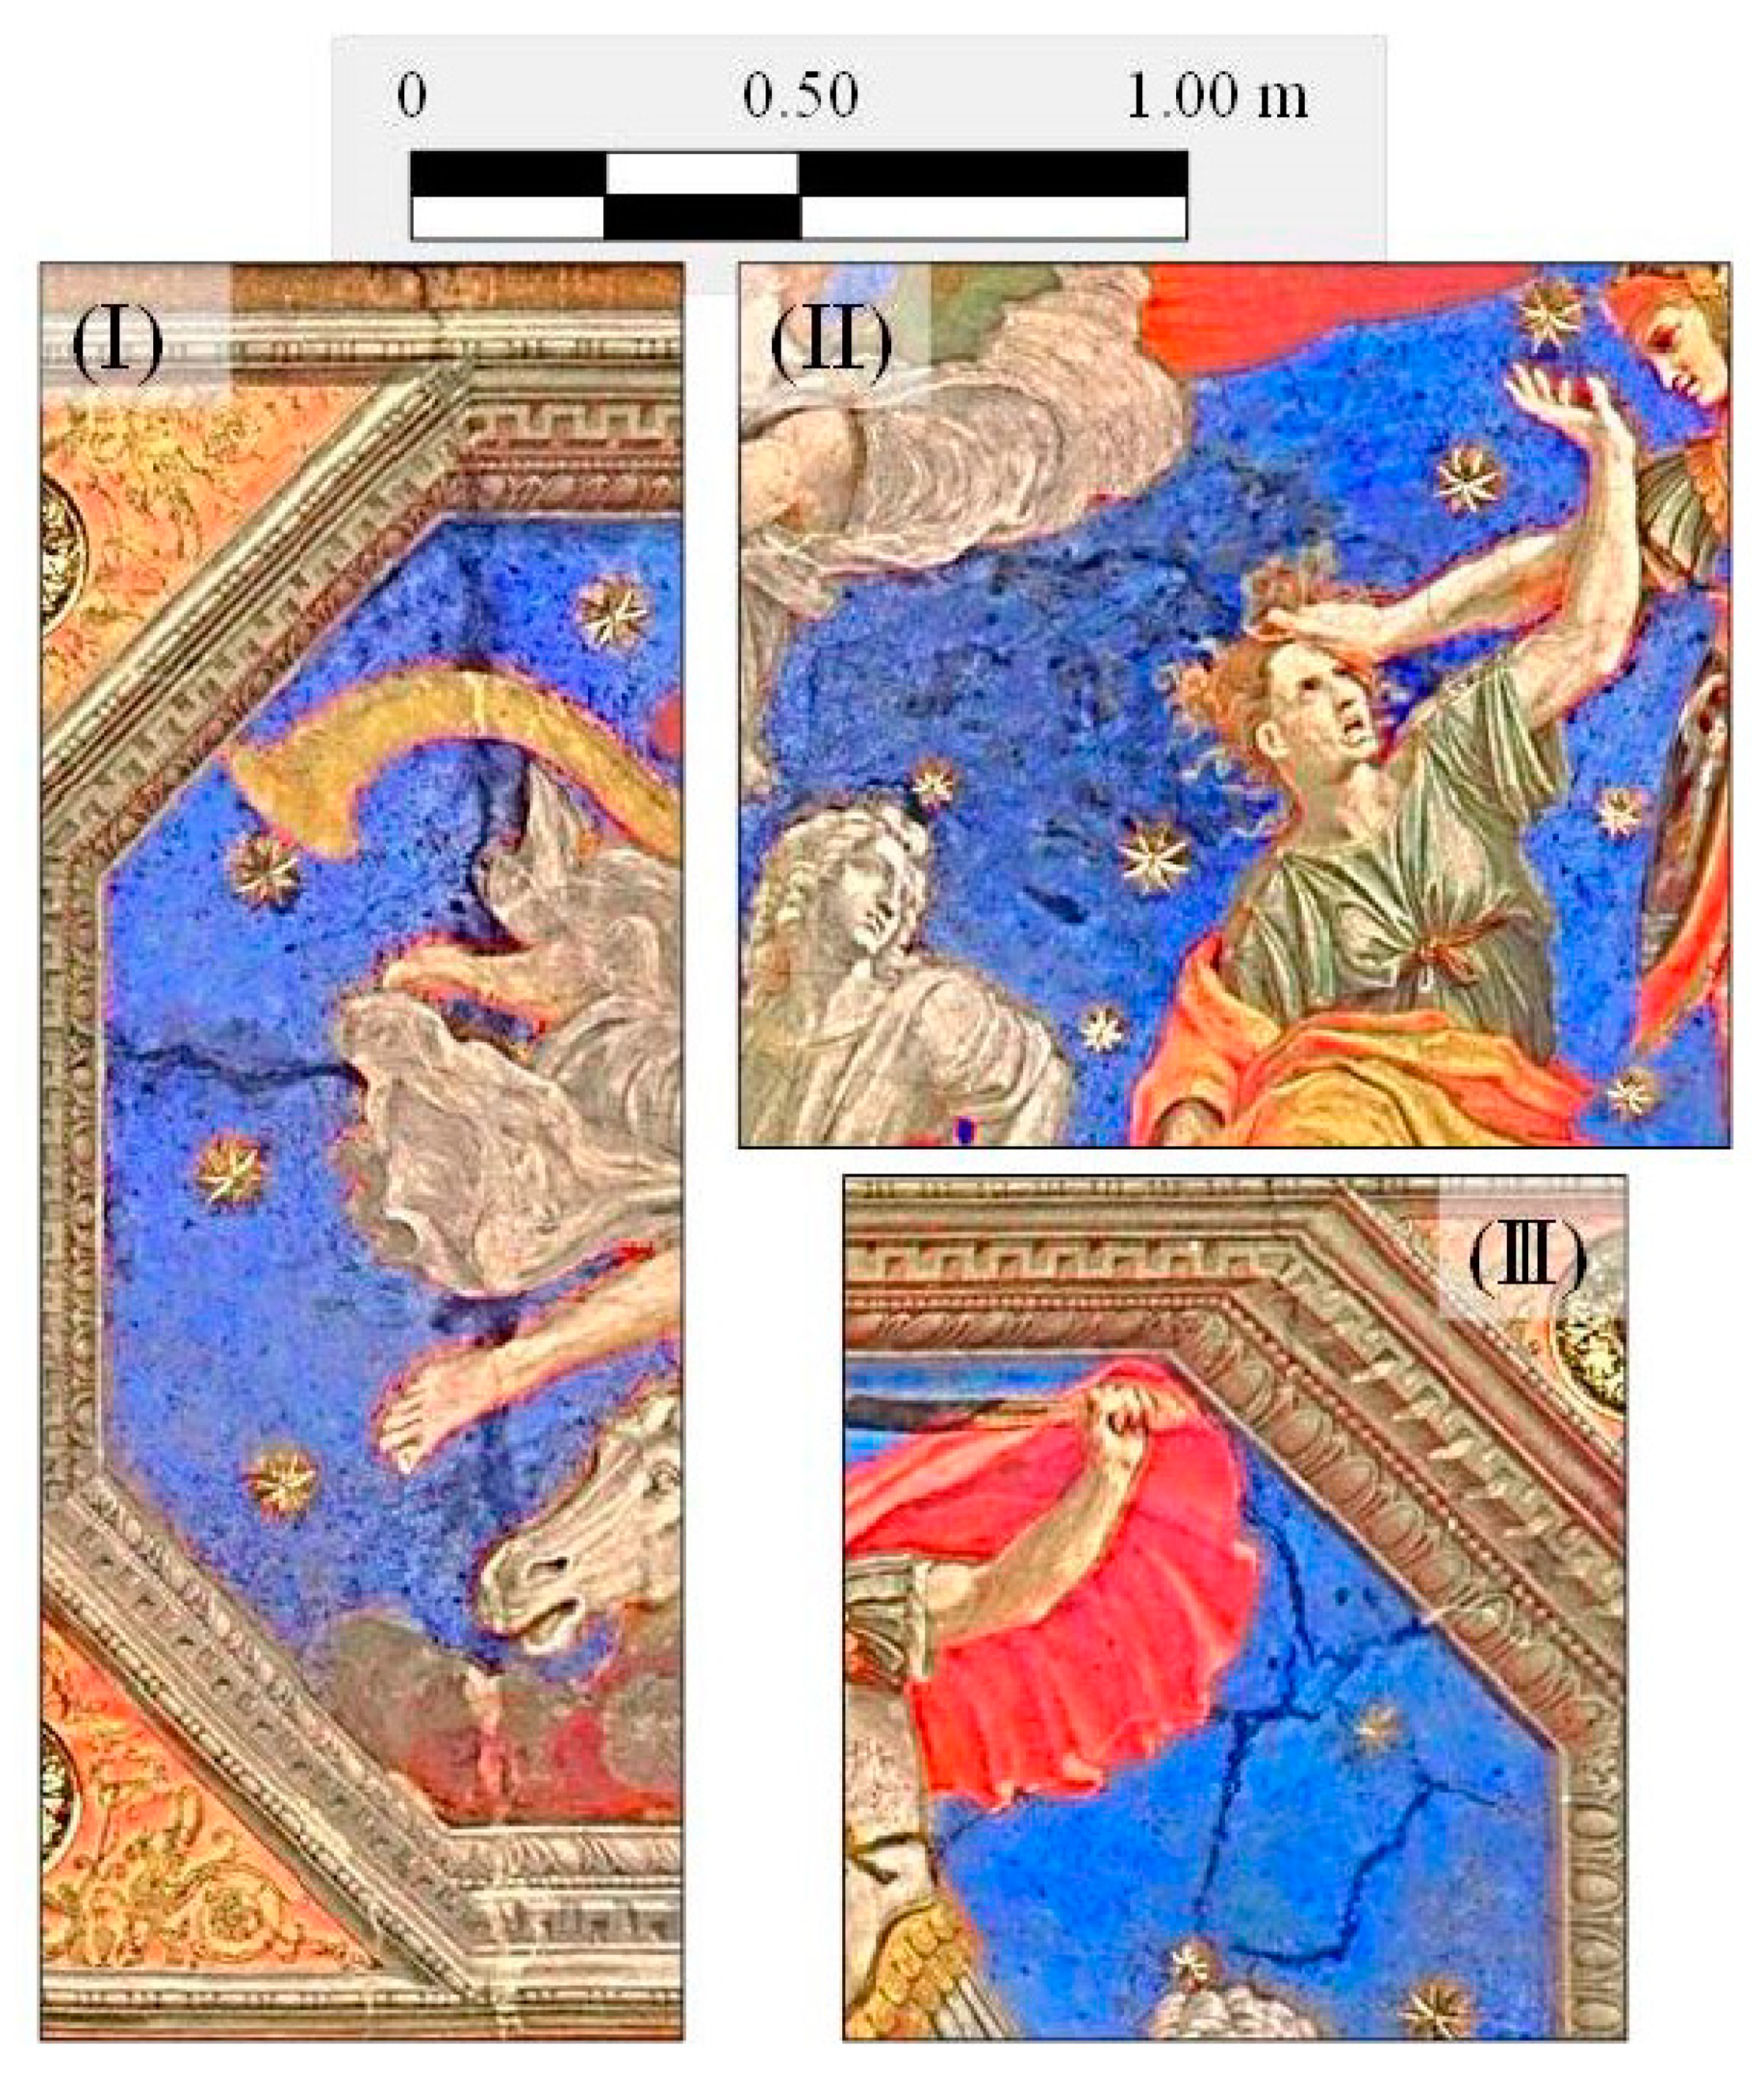
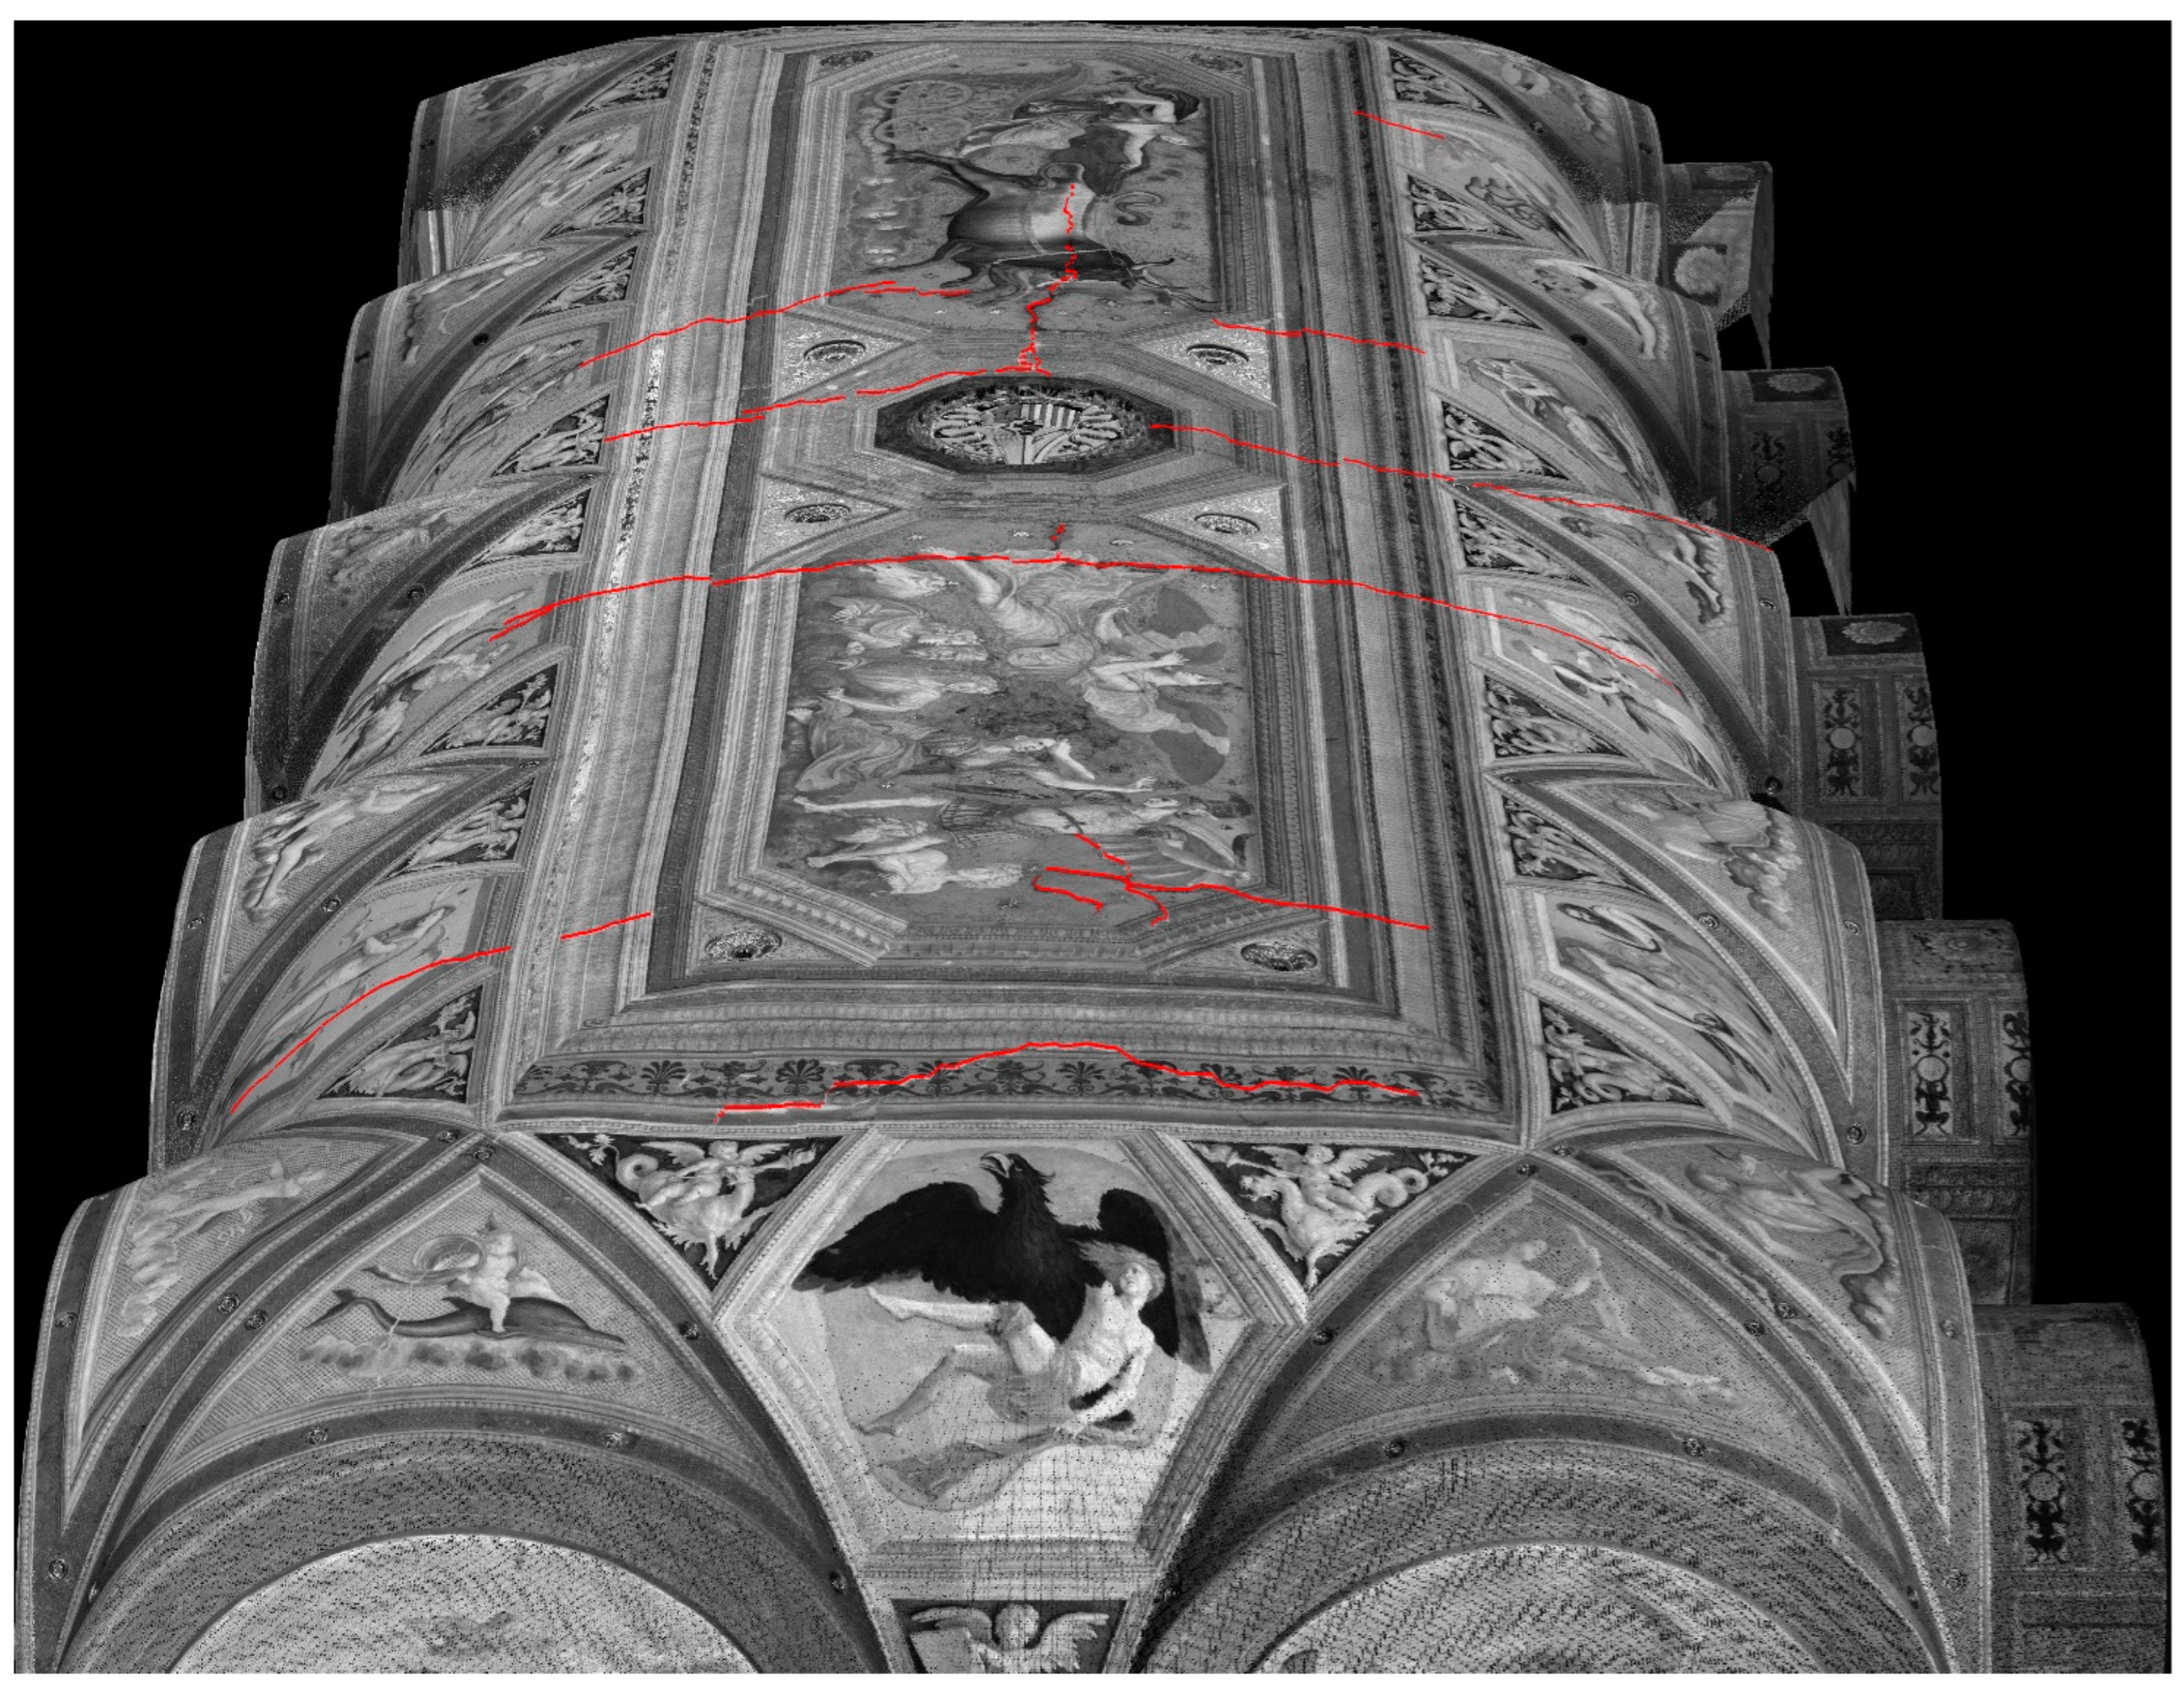
3.1. The Signs of the “Past” on the Frescoes
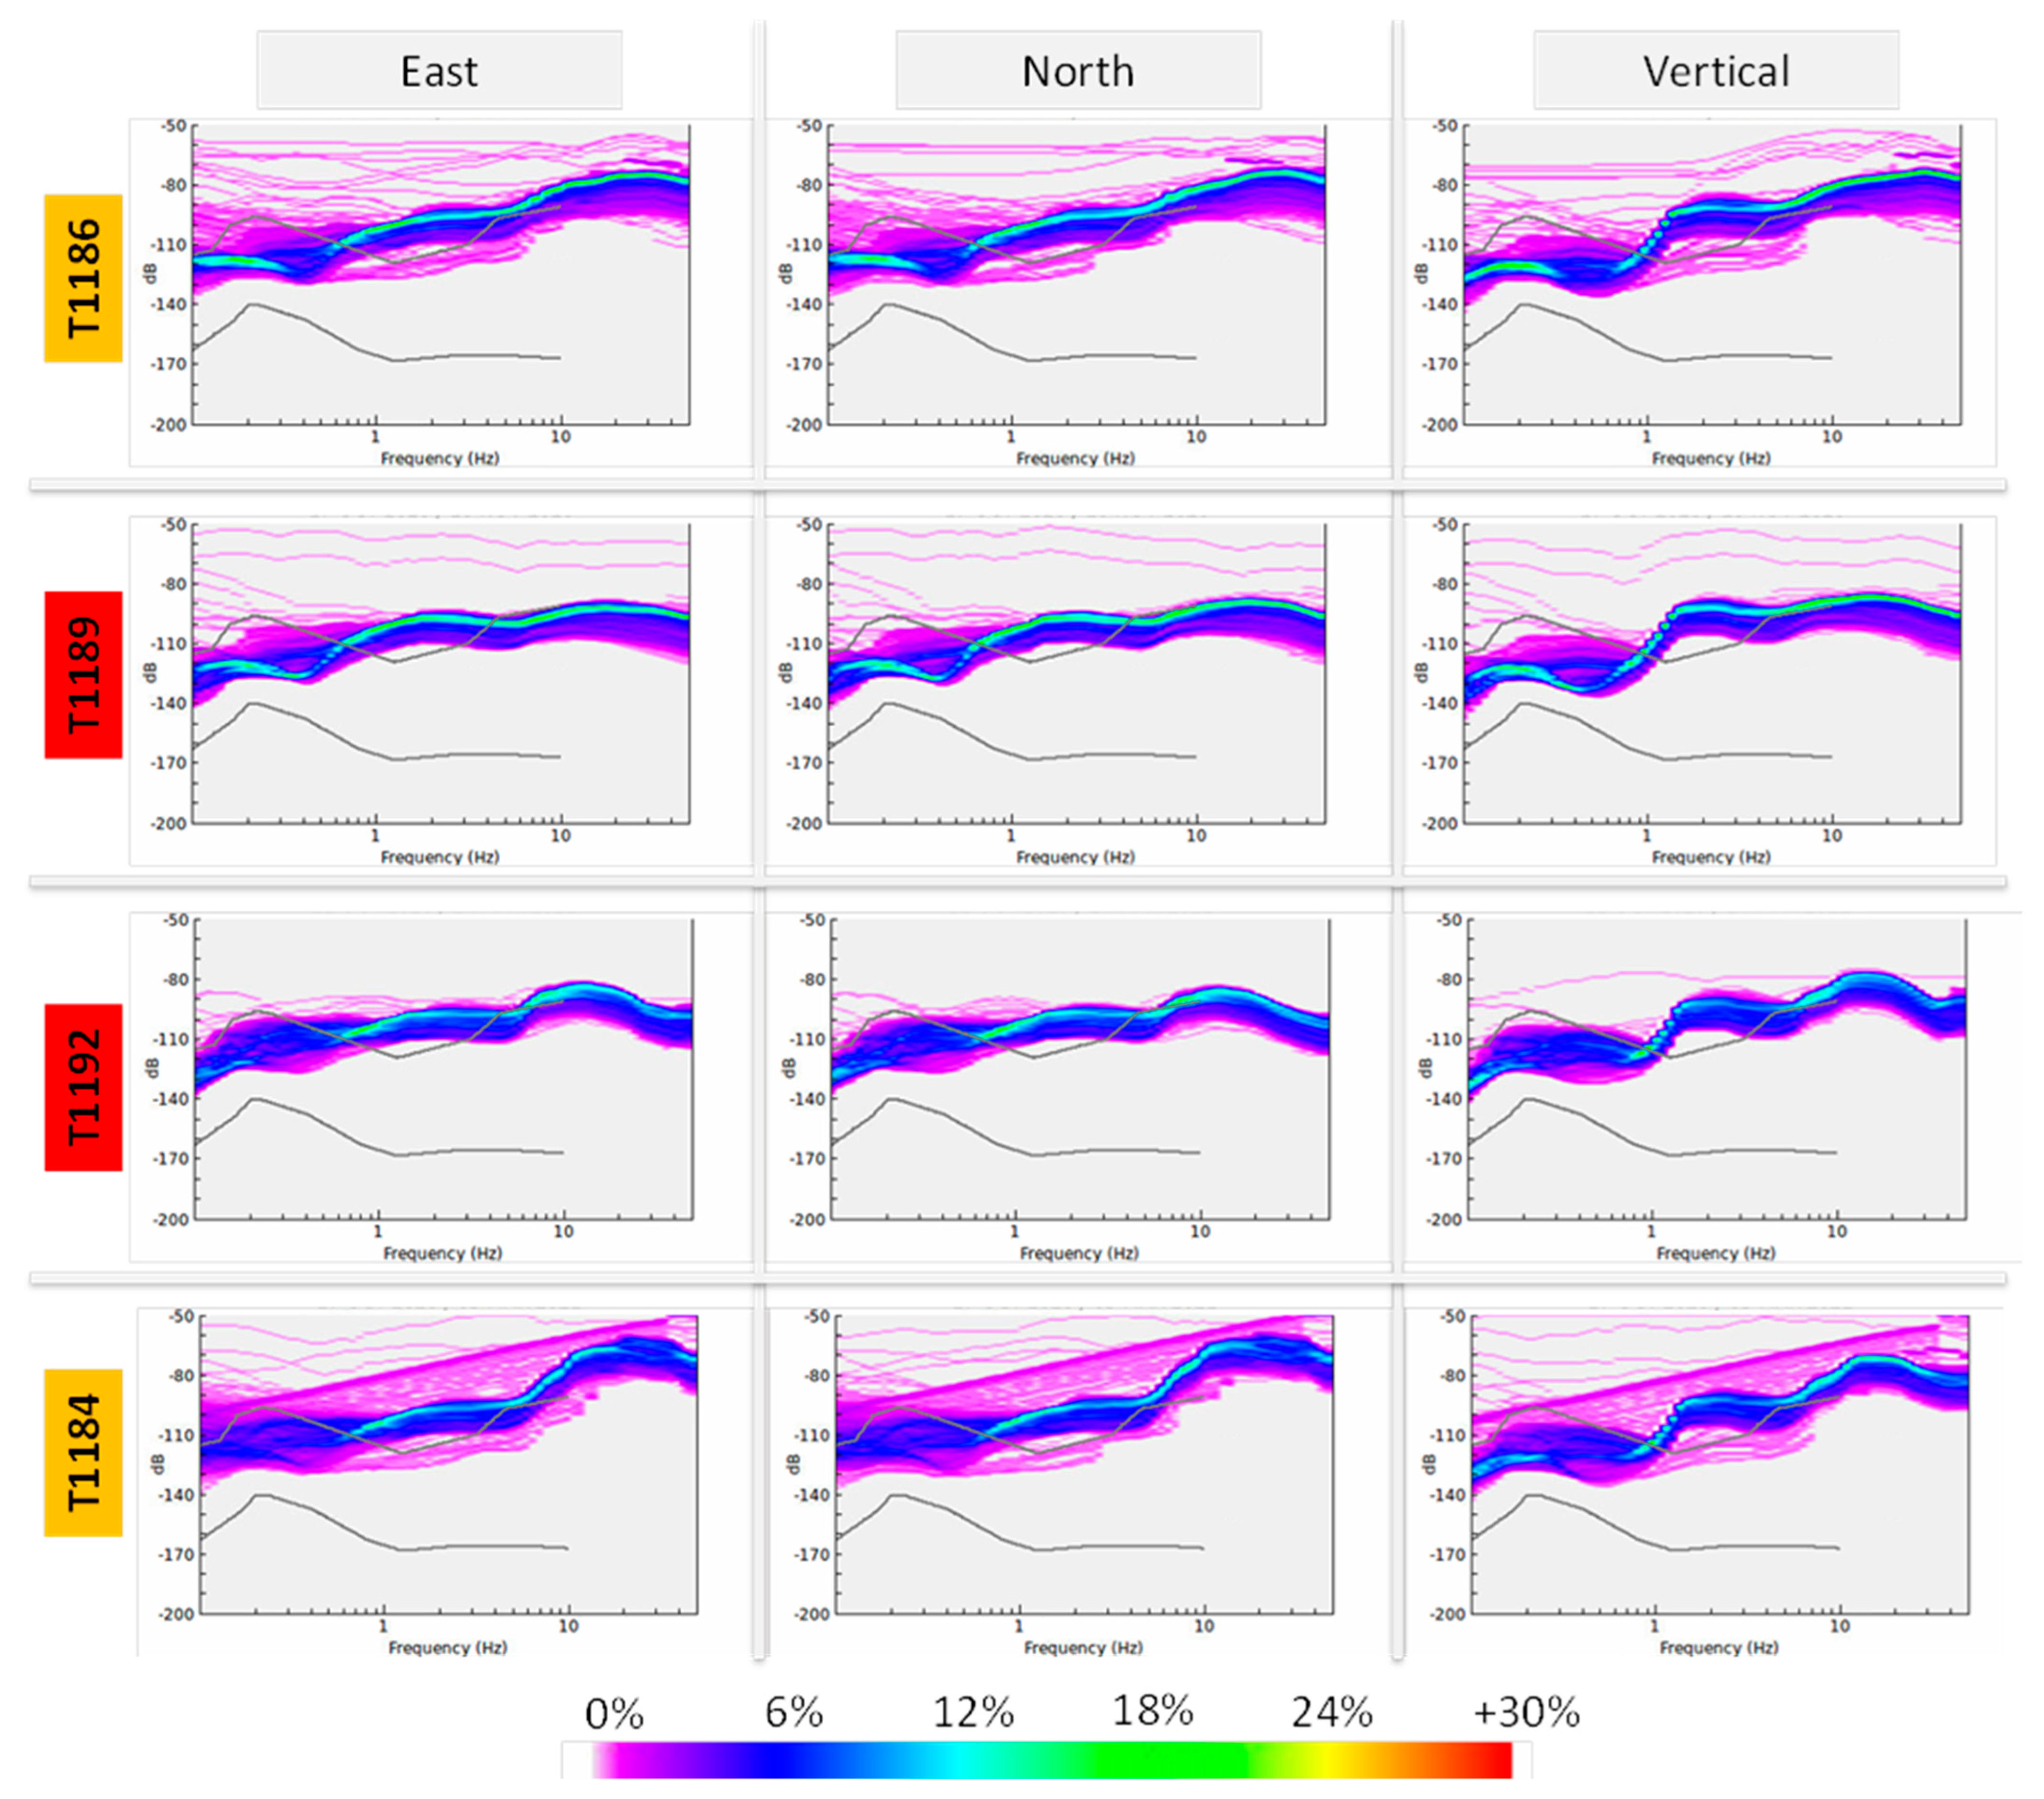
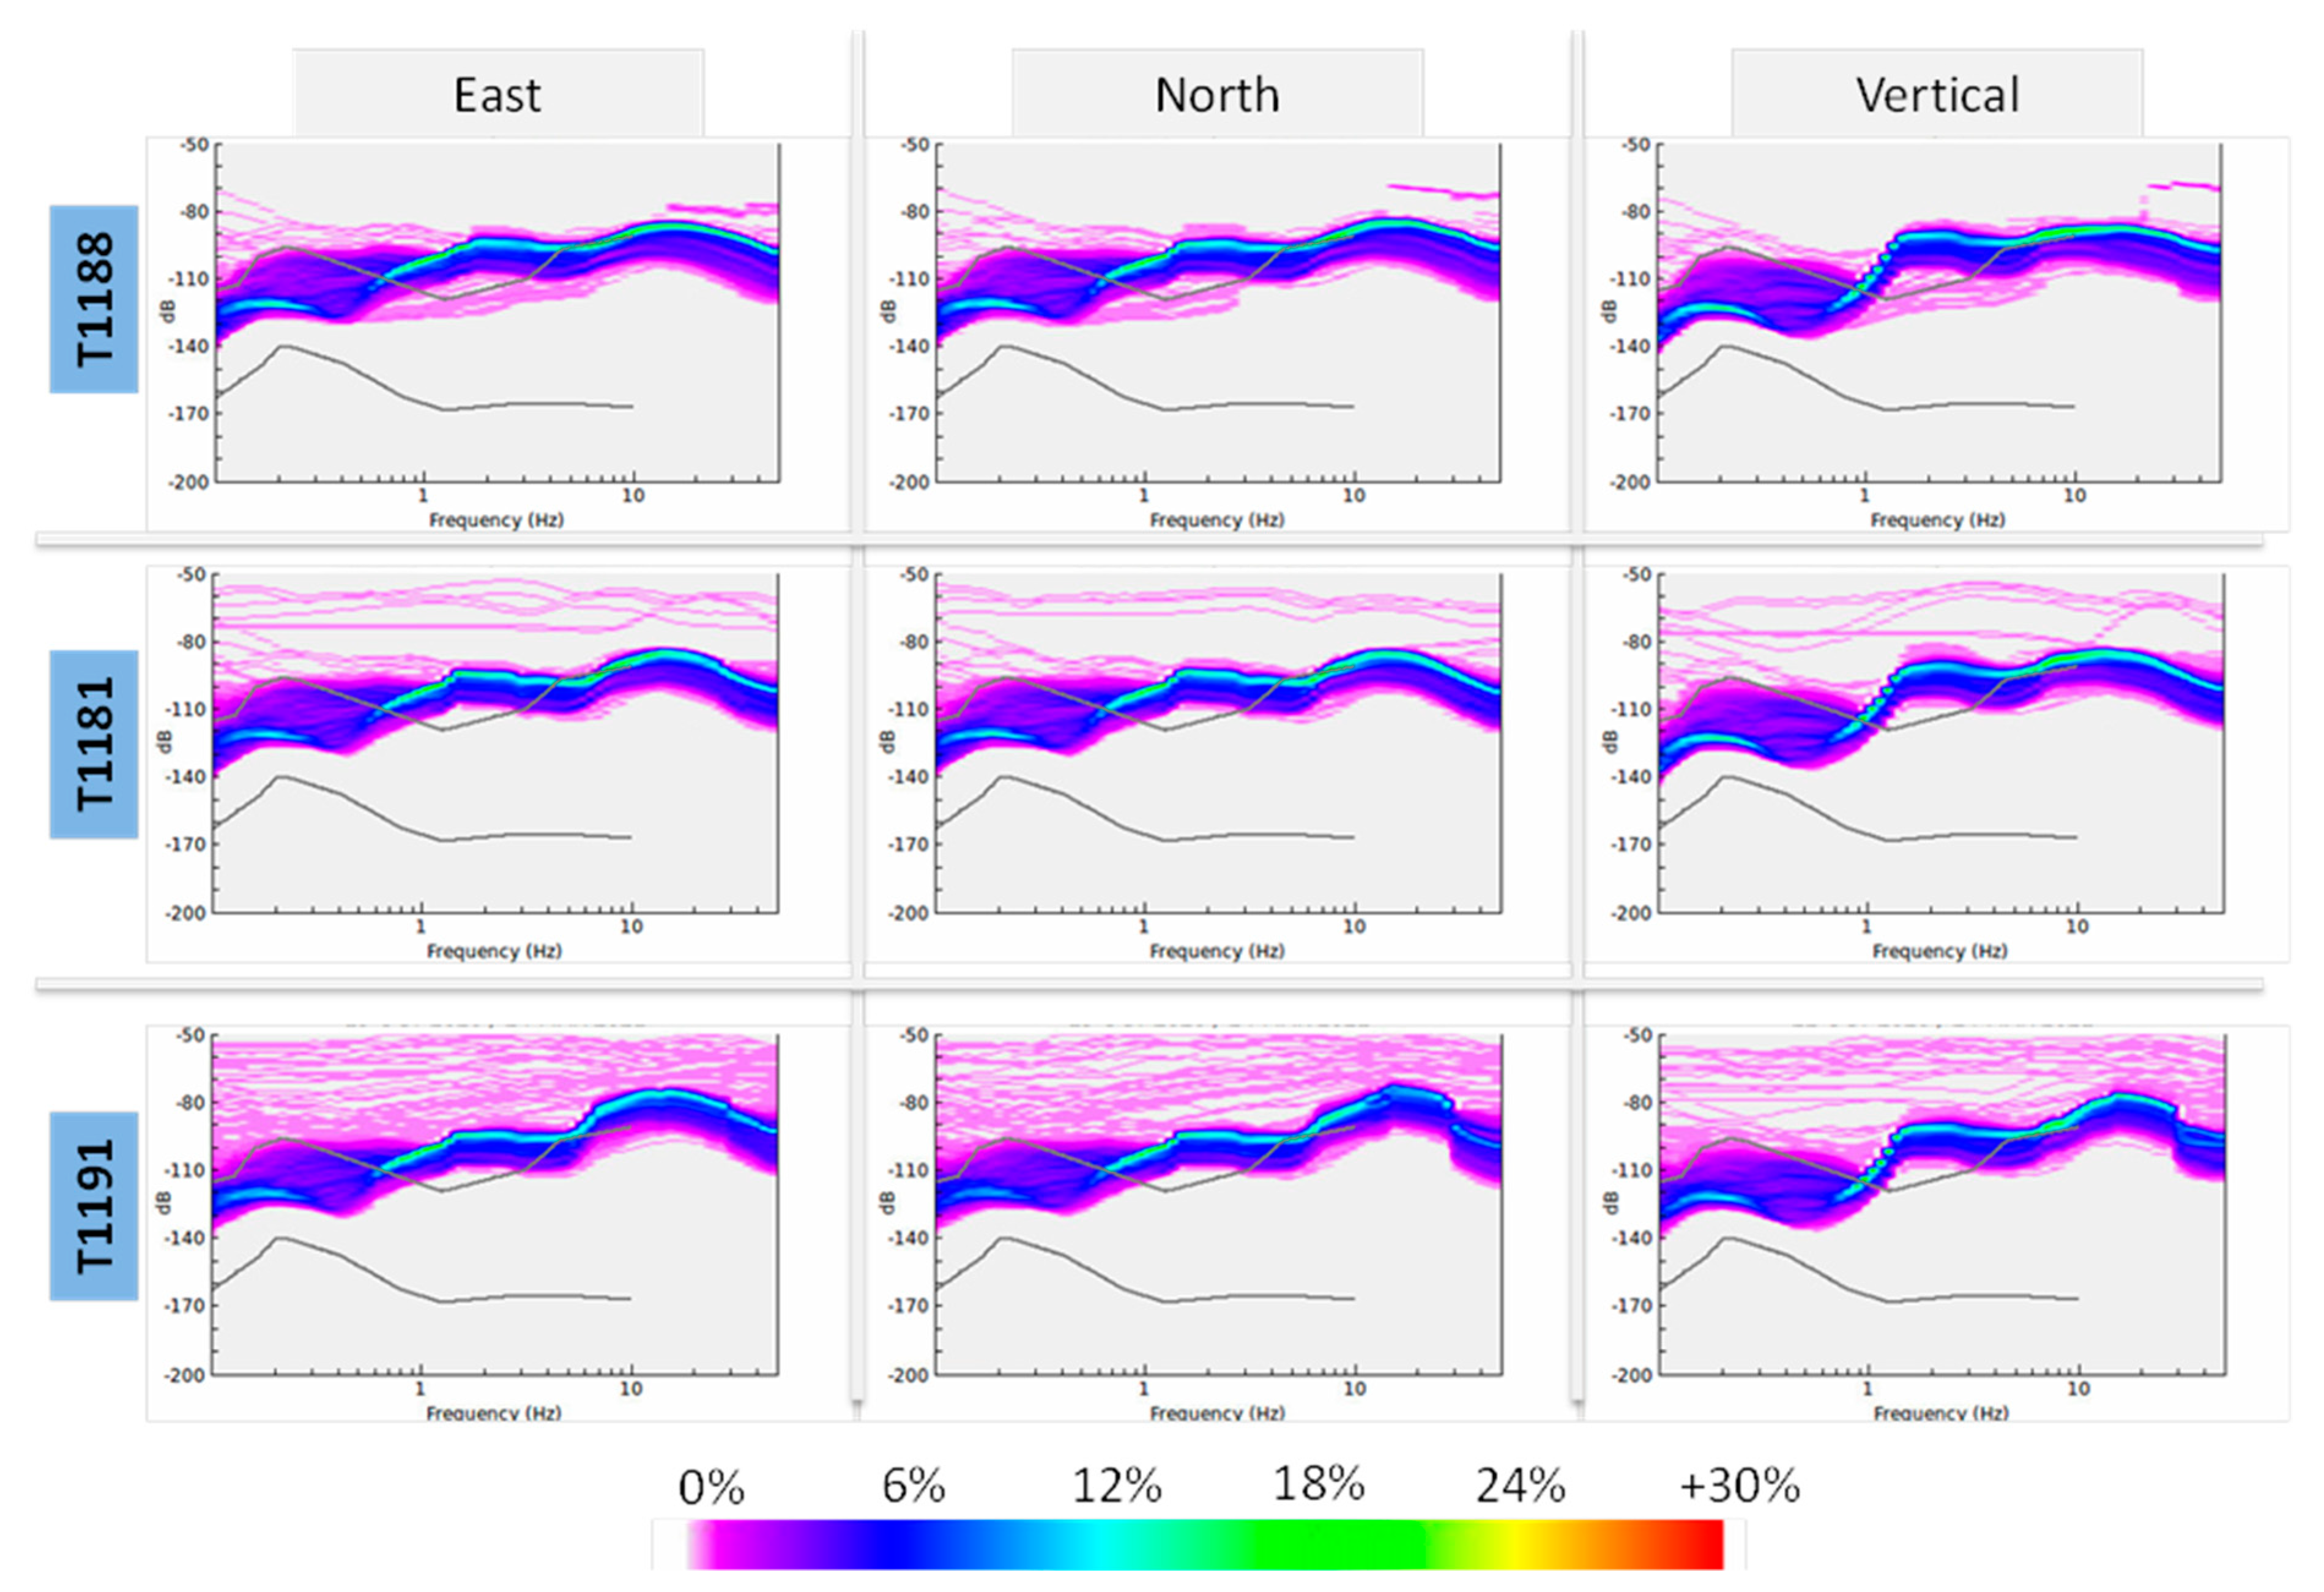
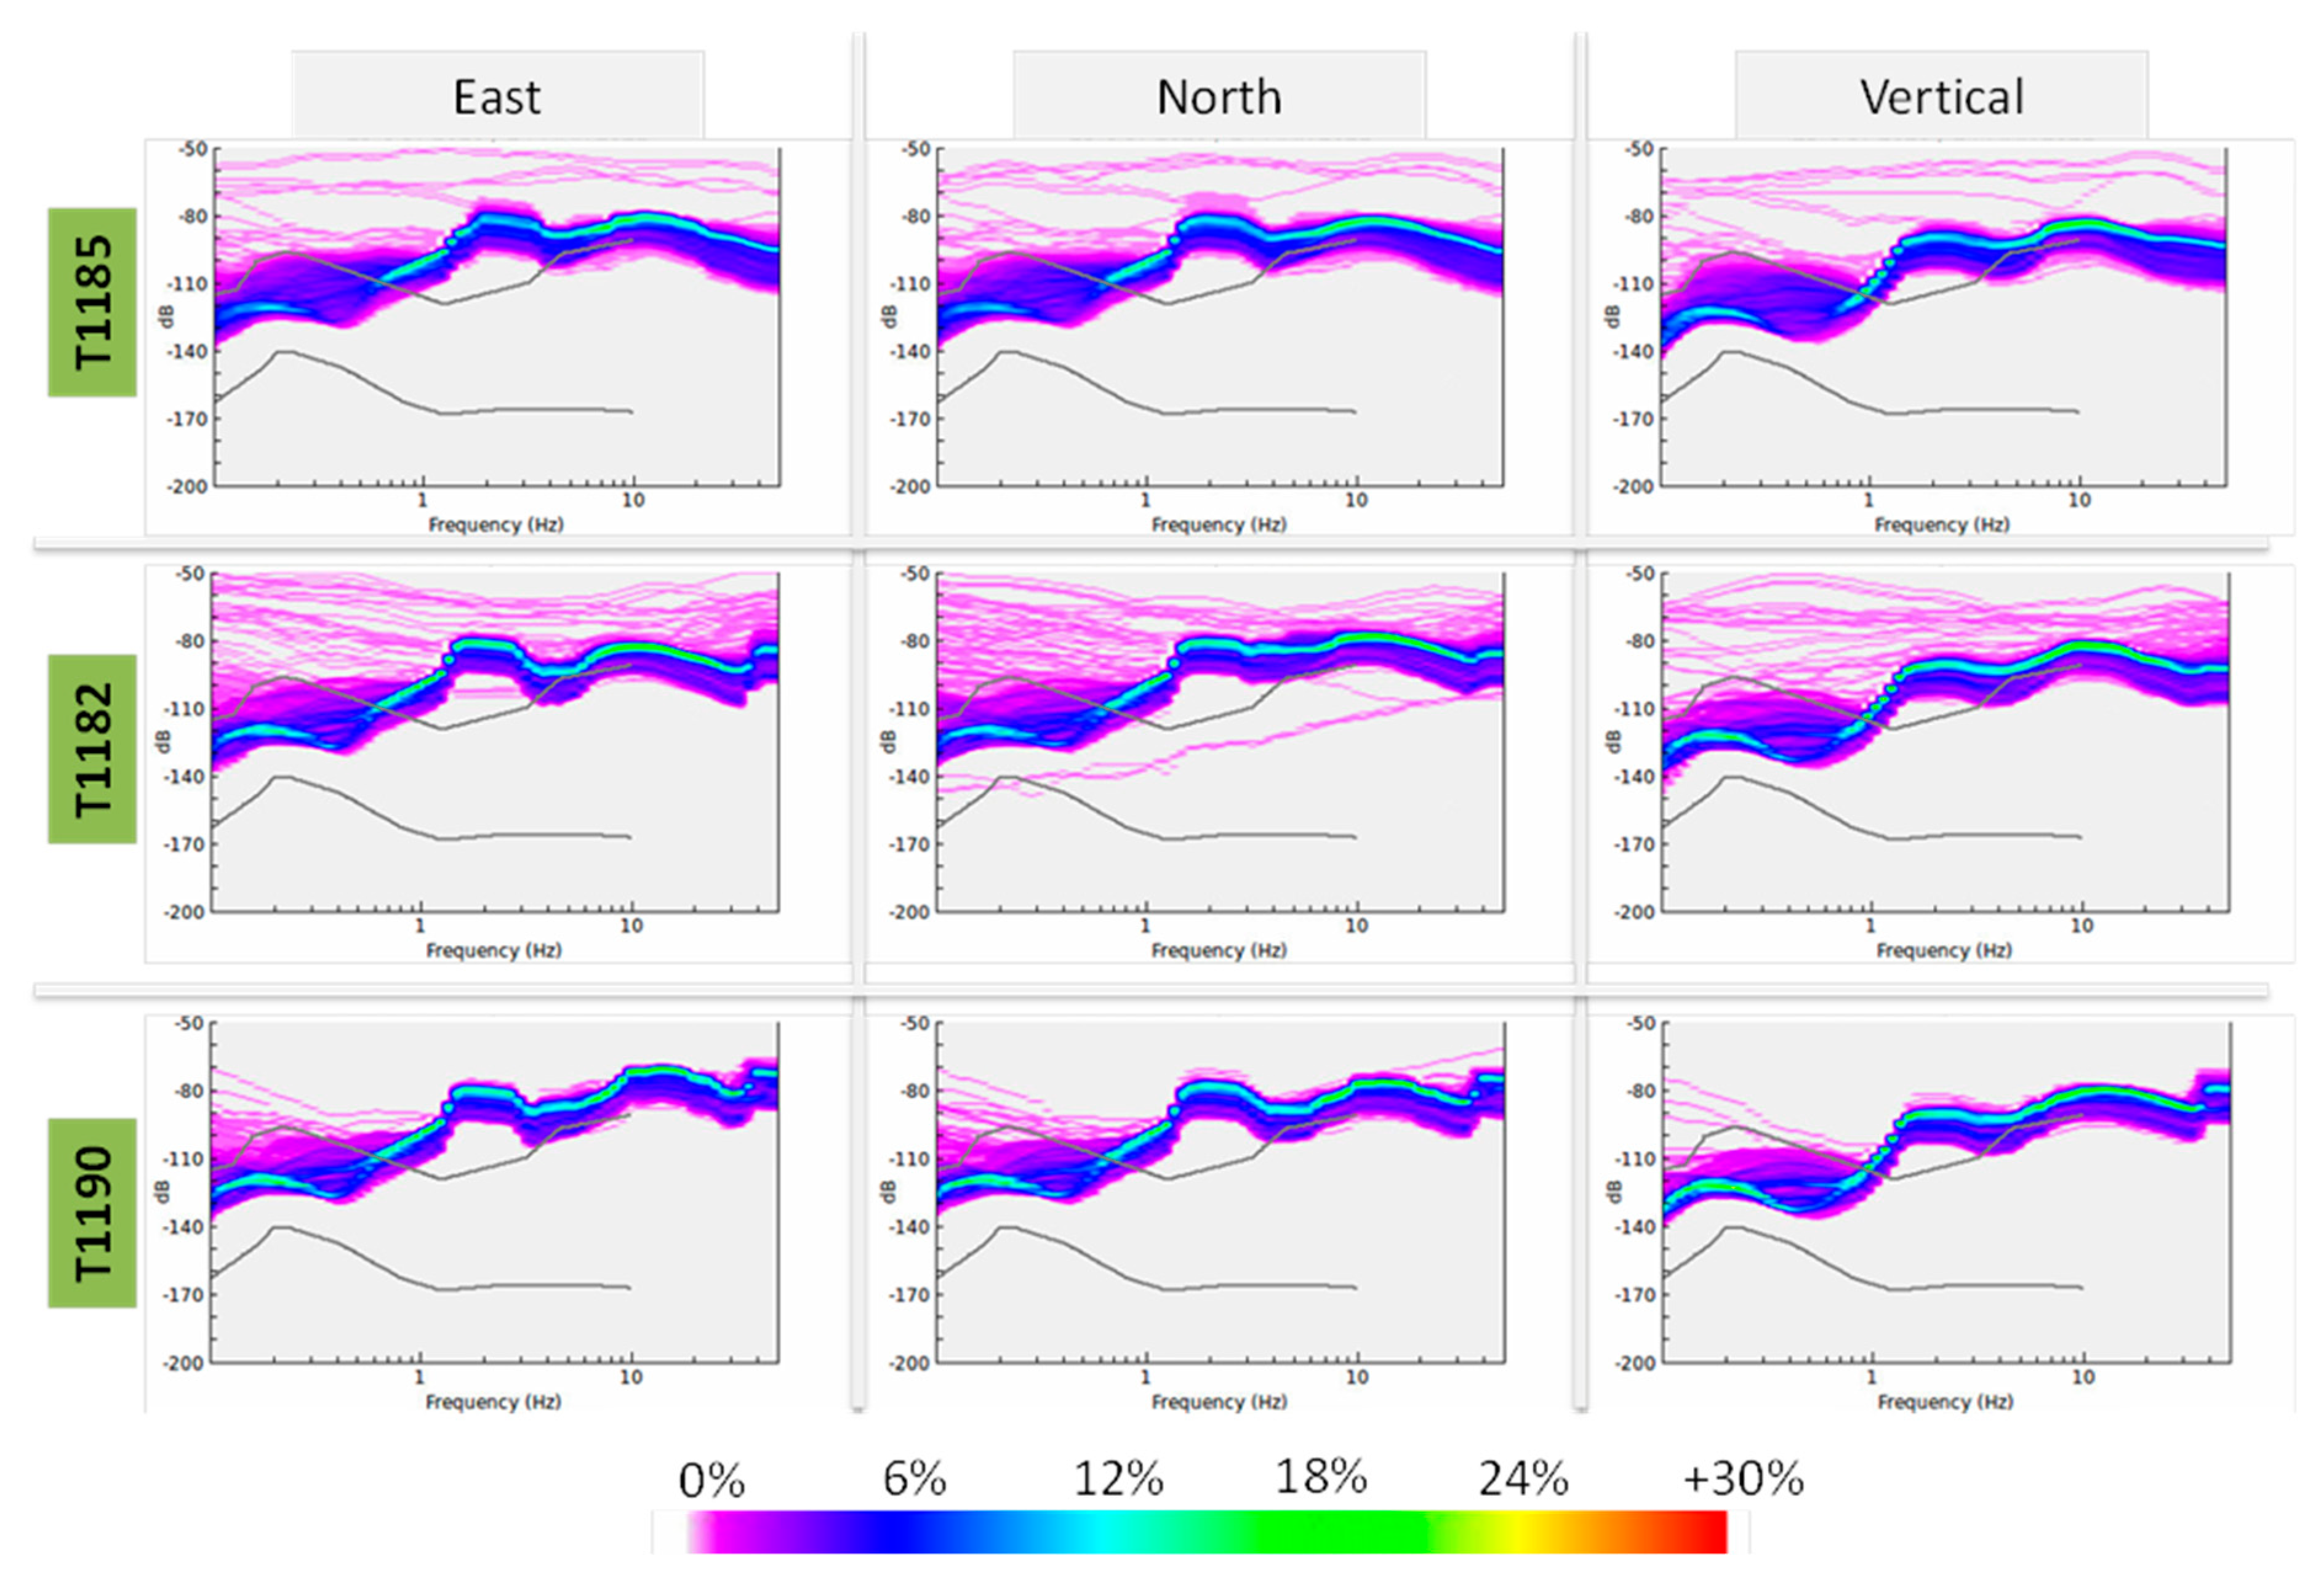
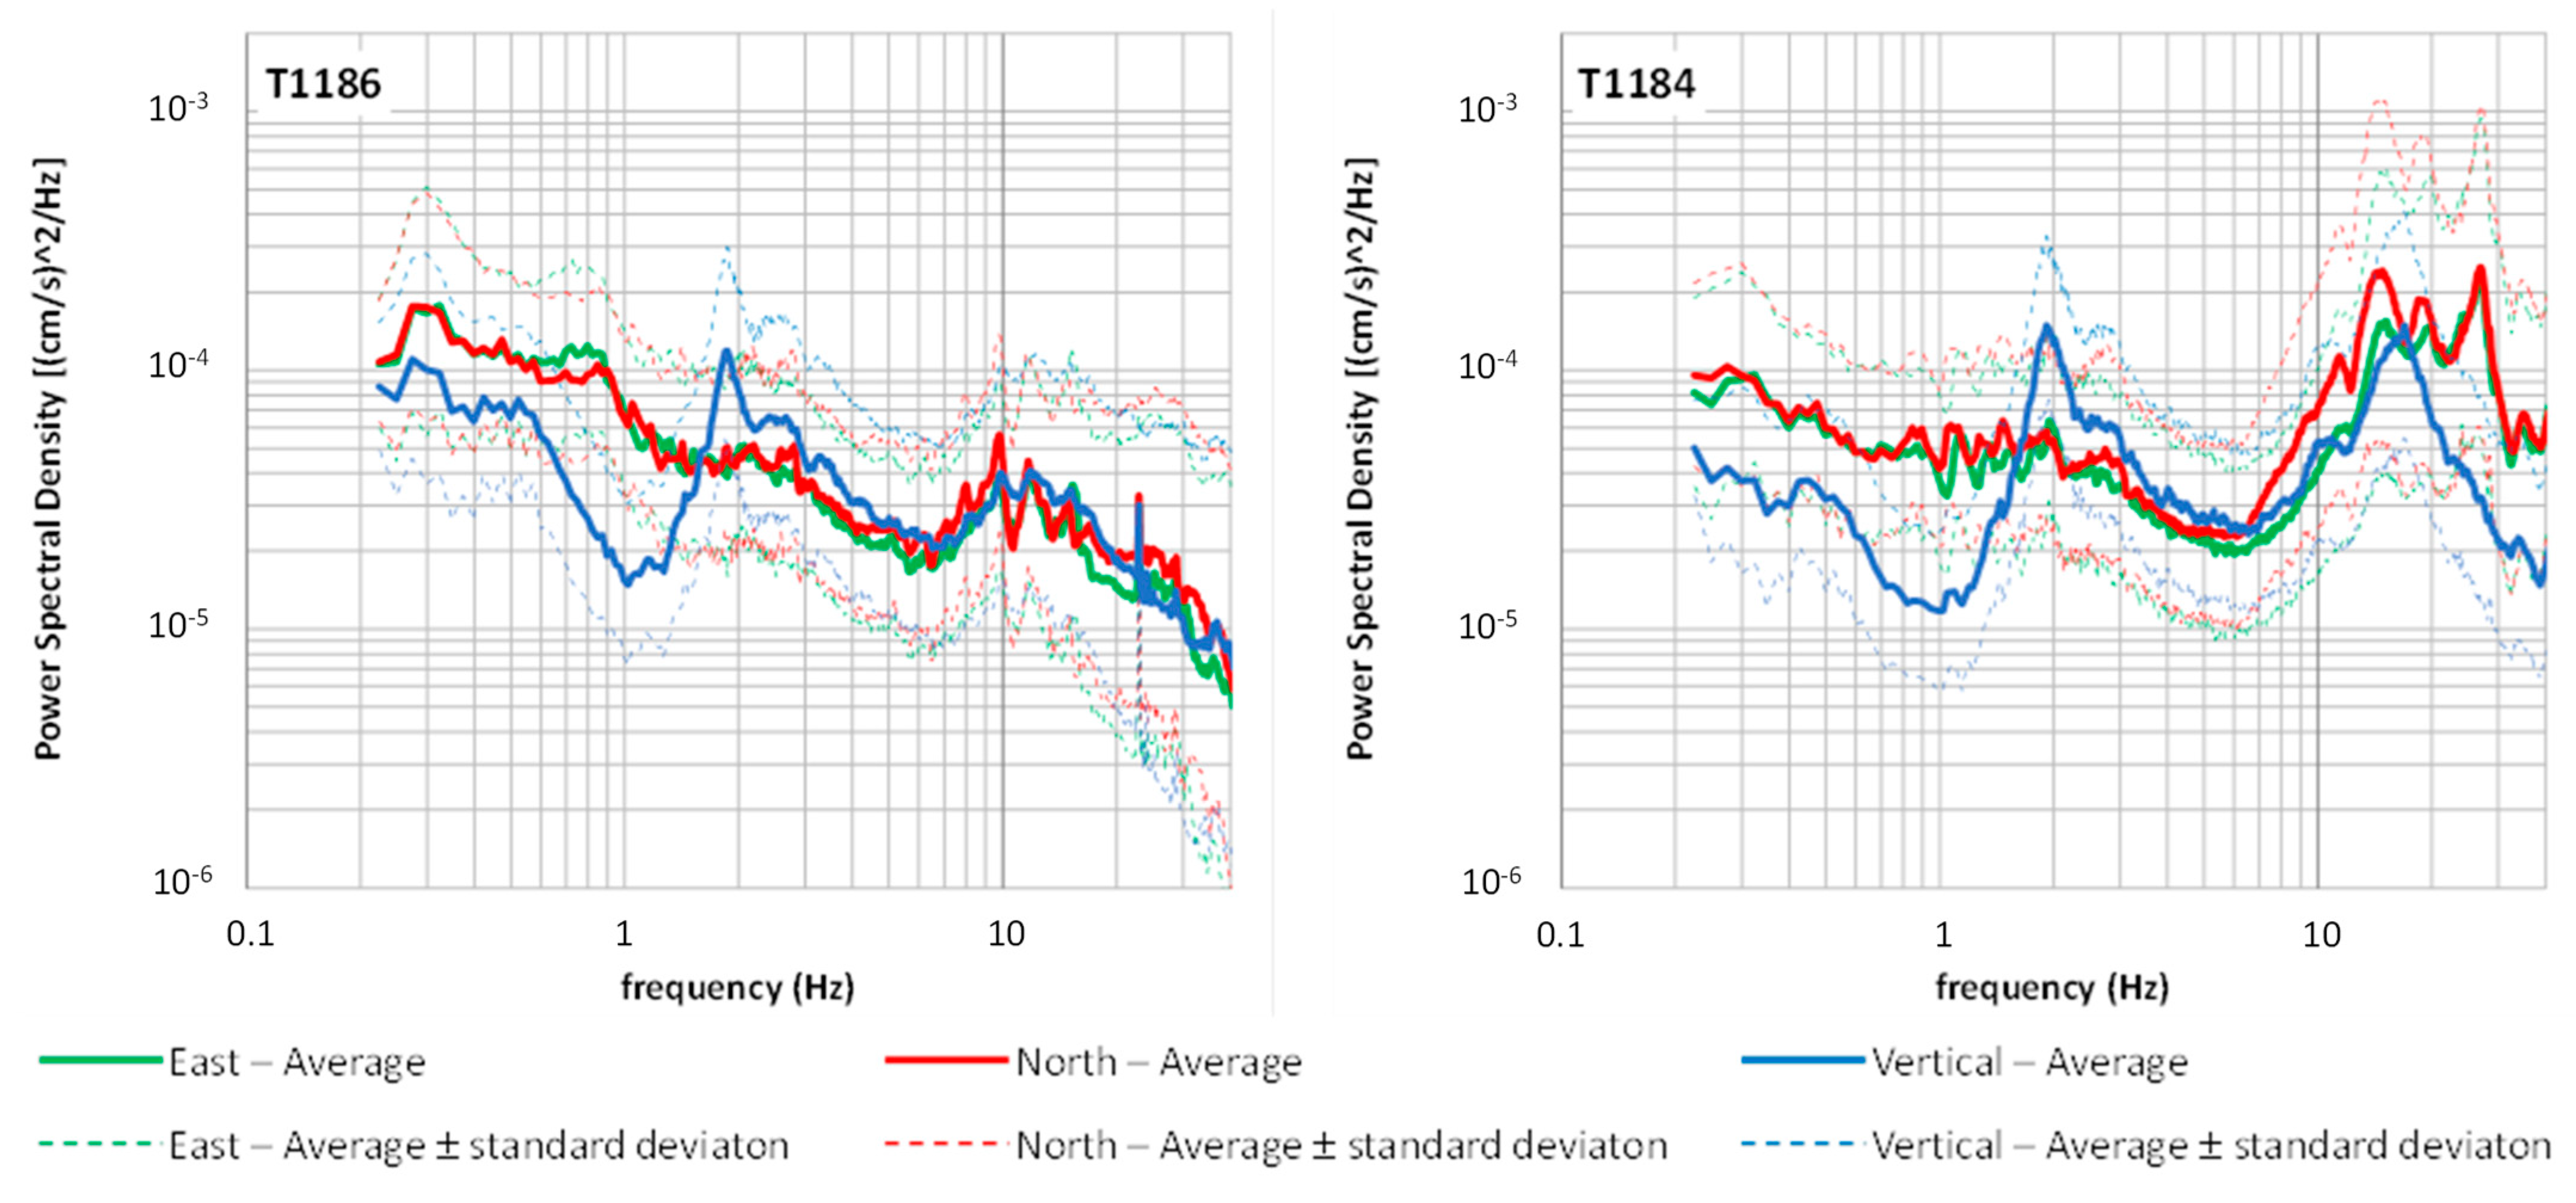
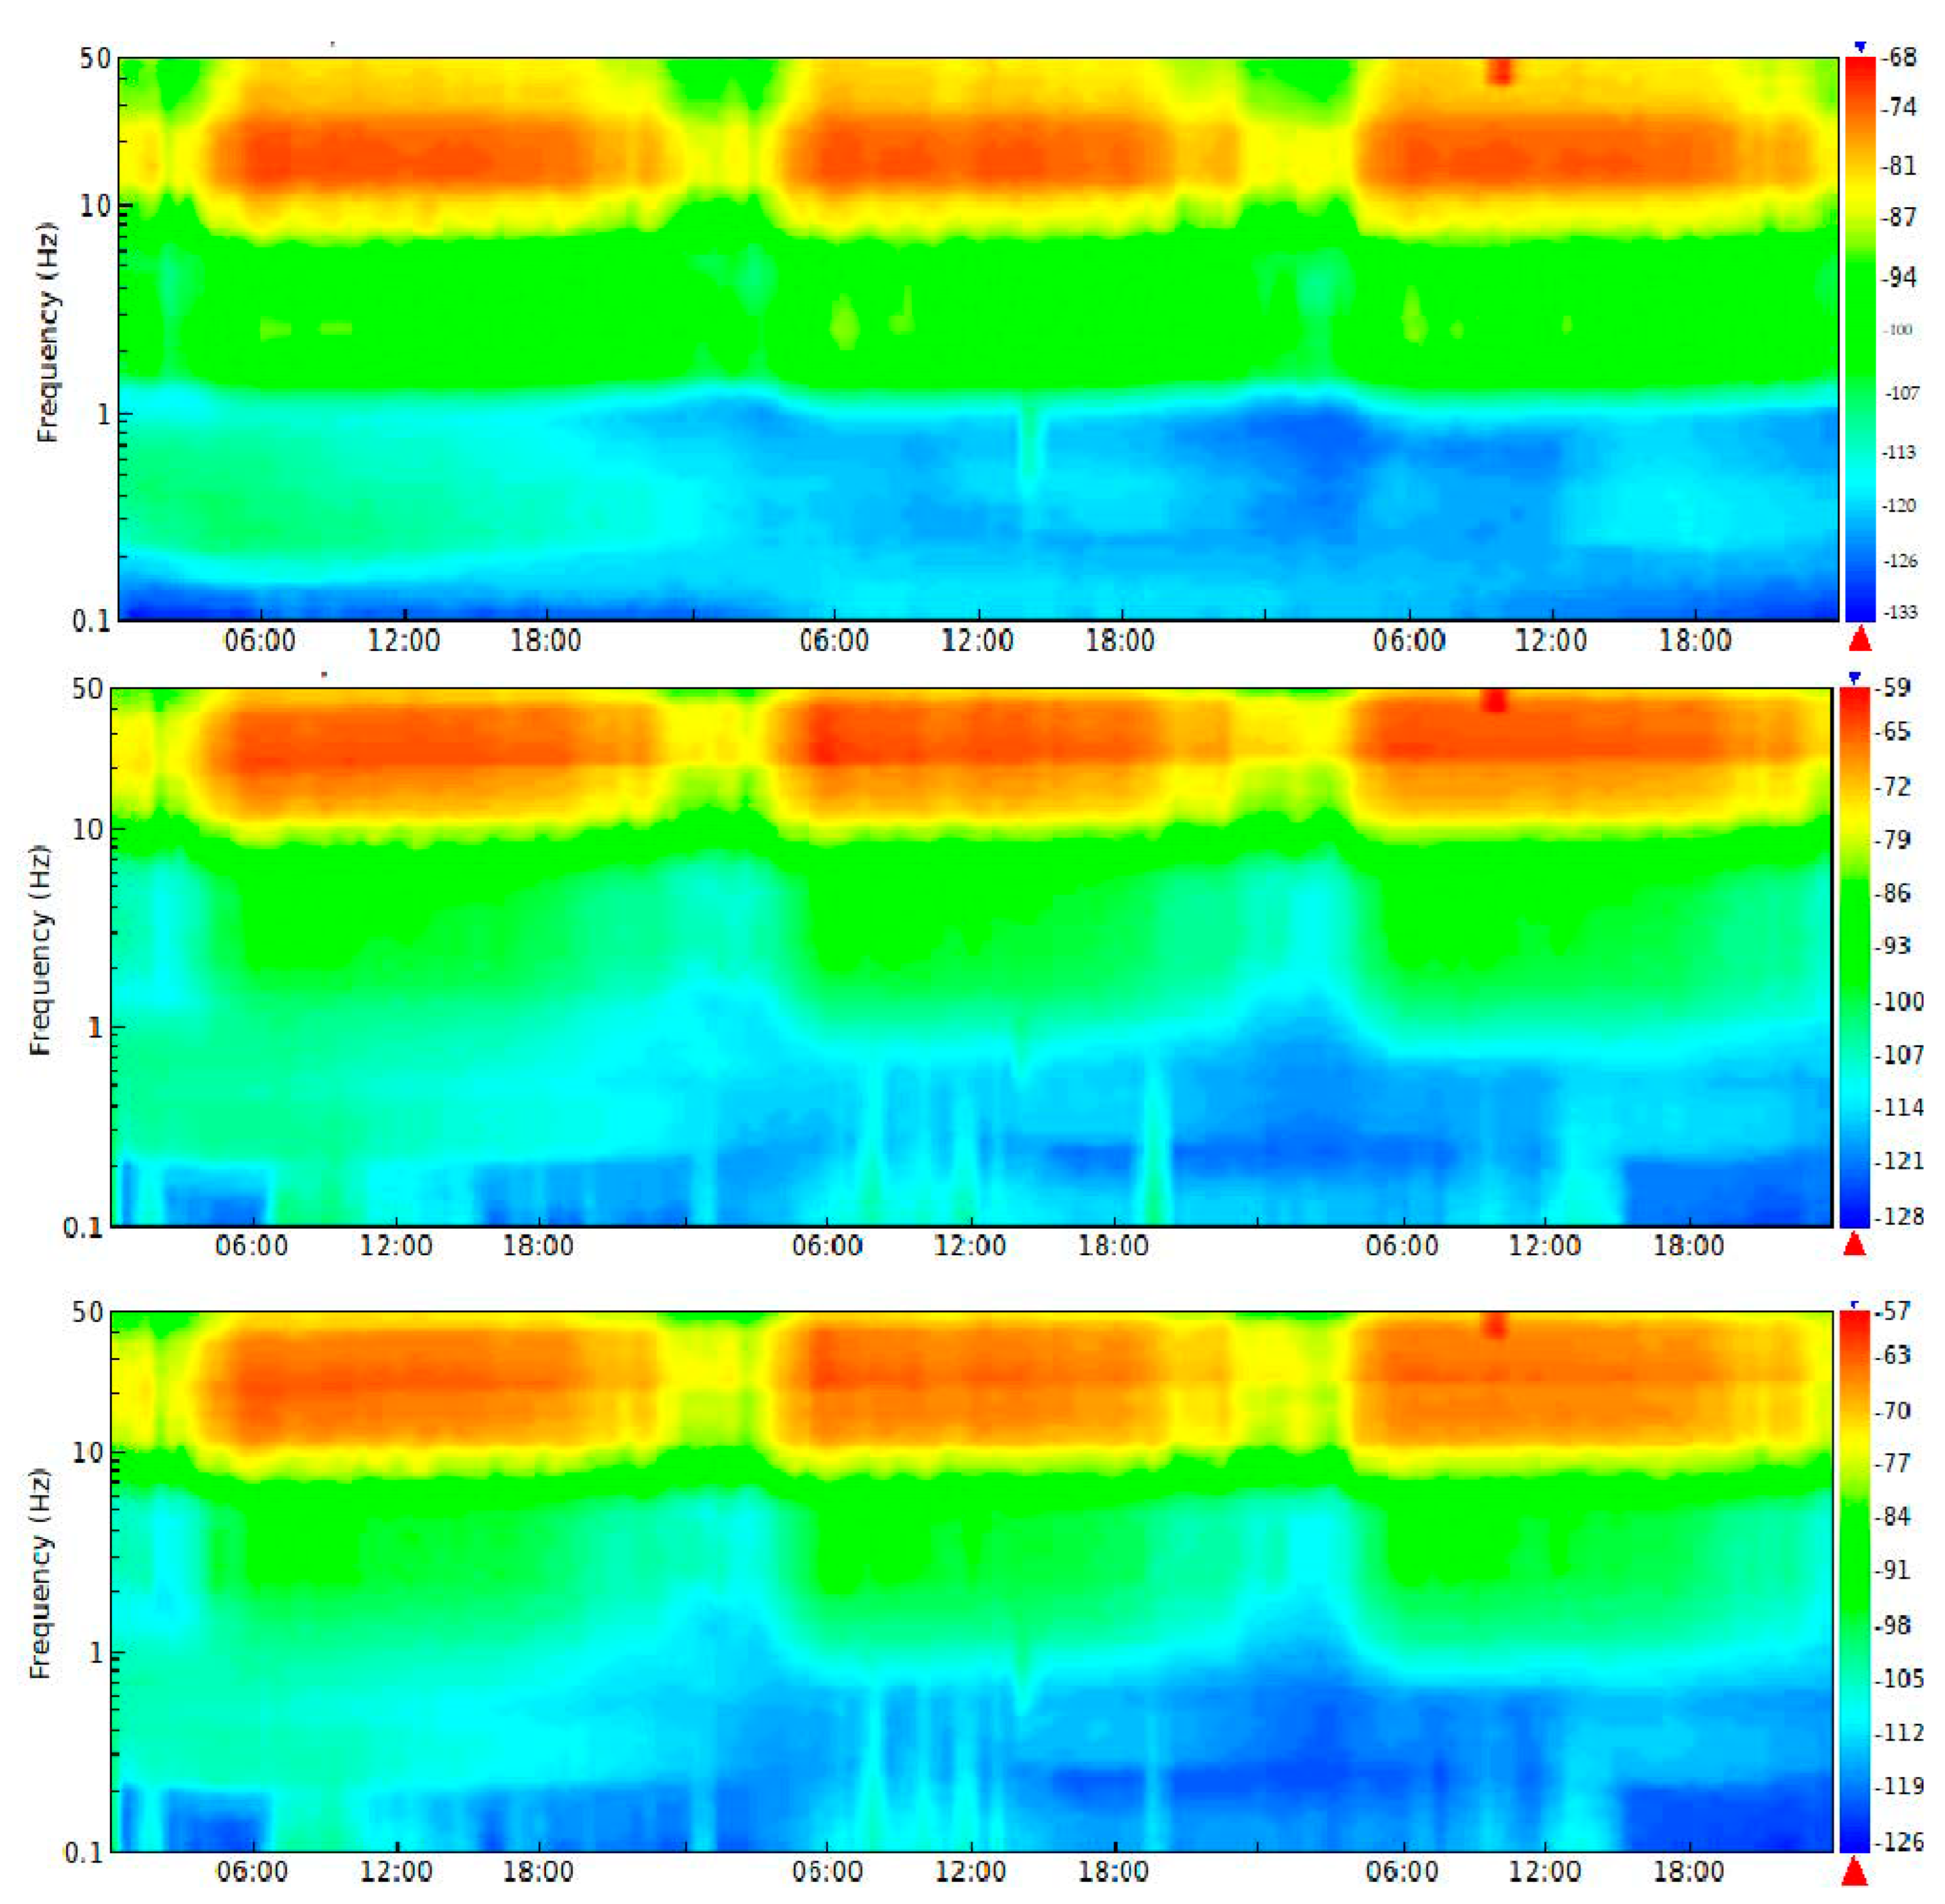
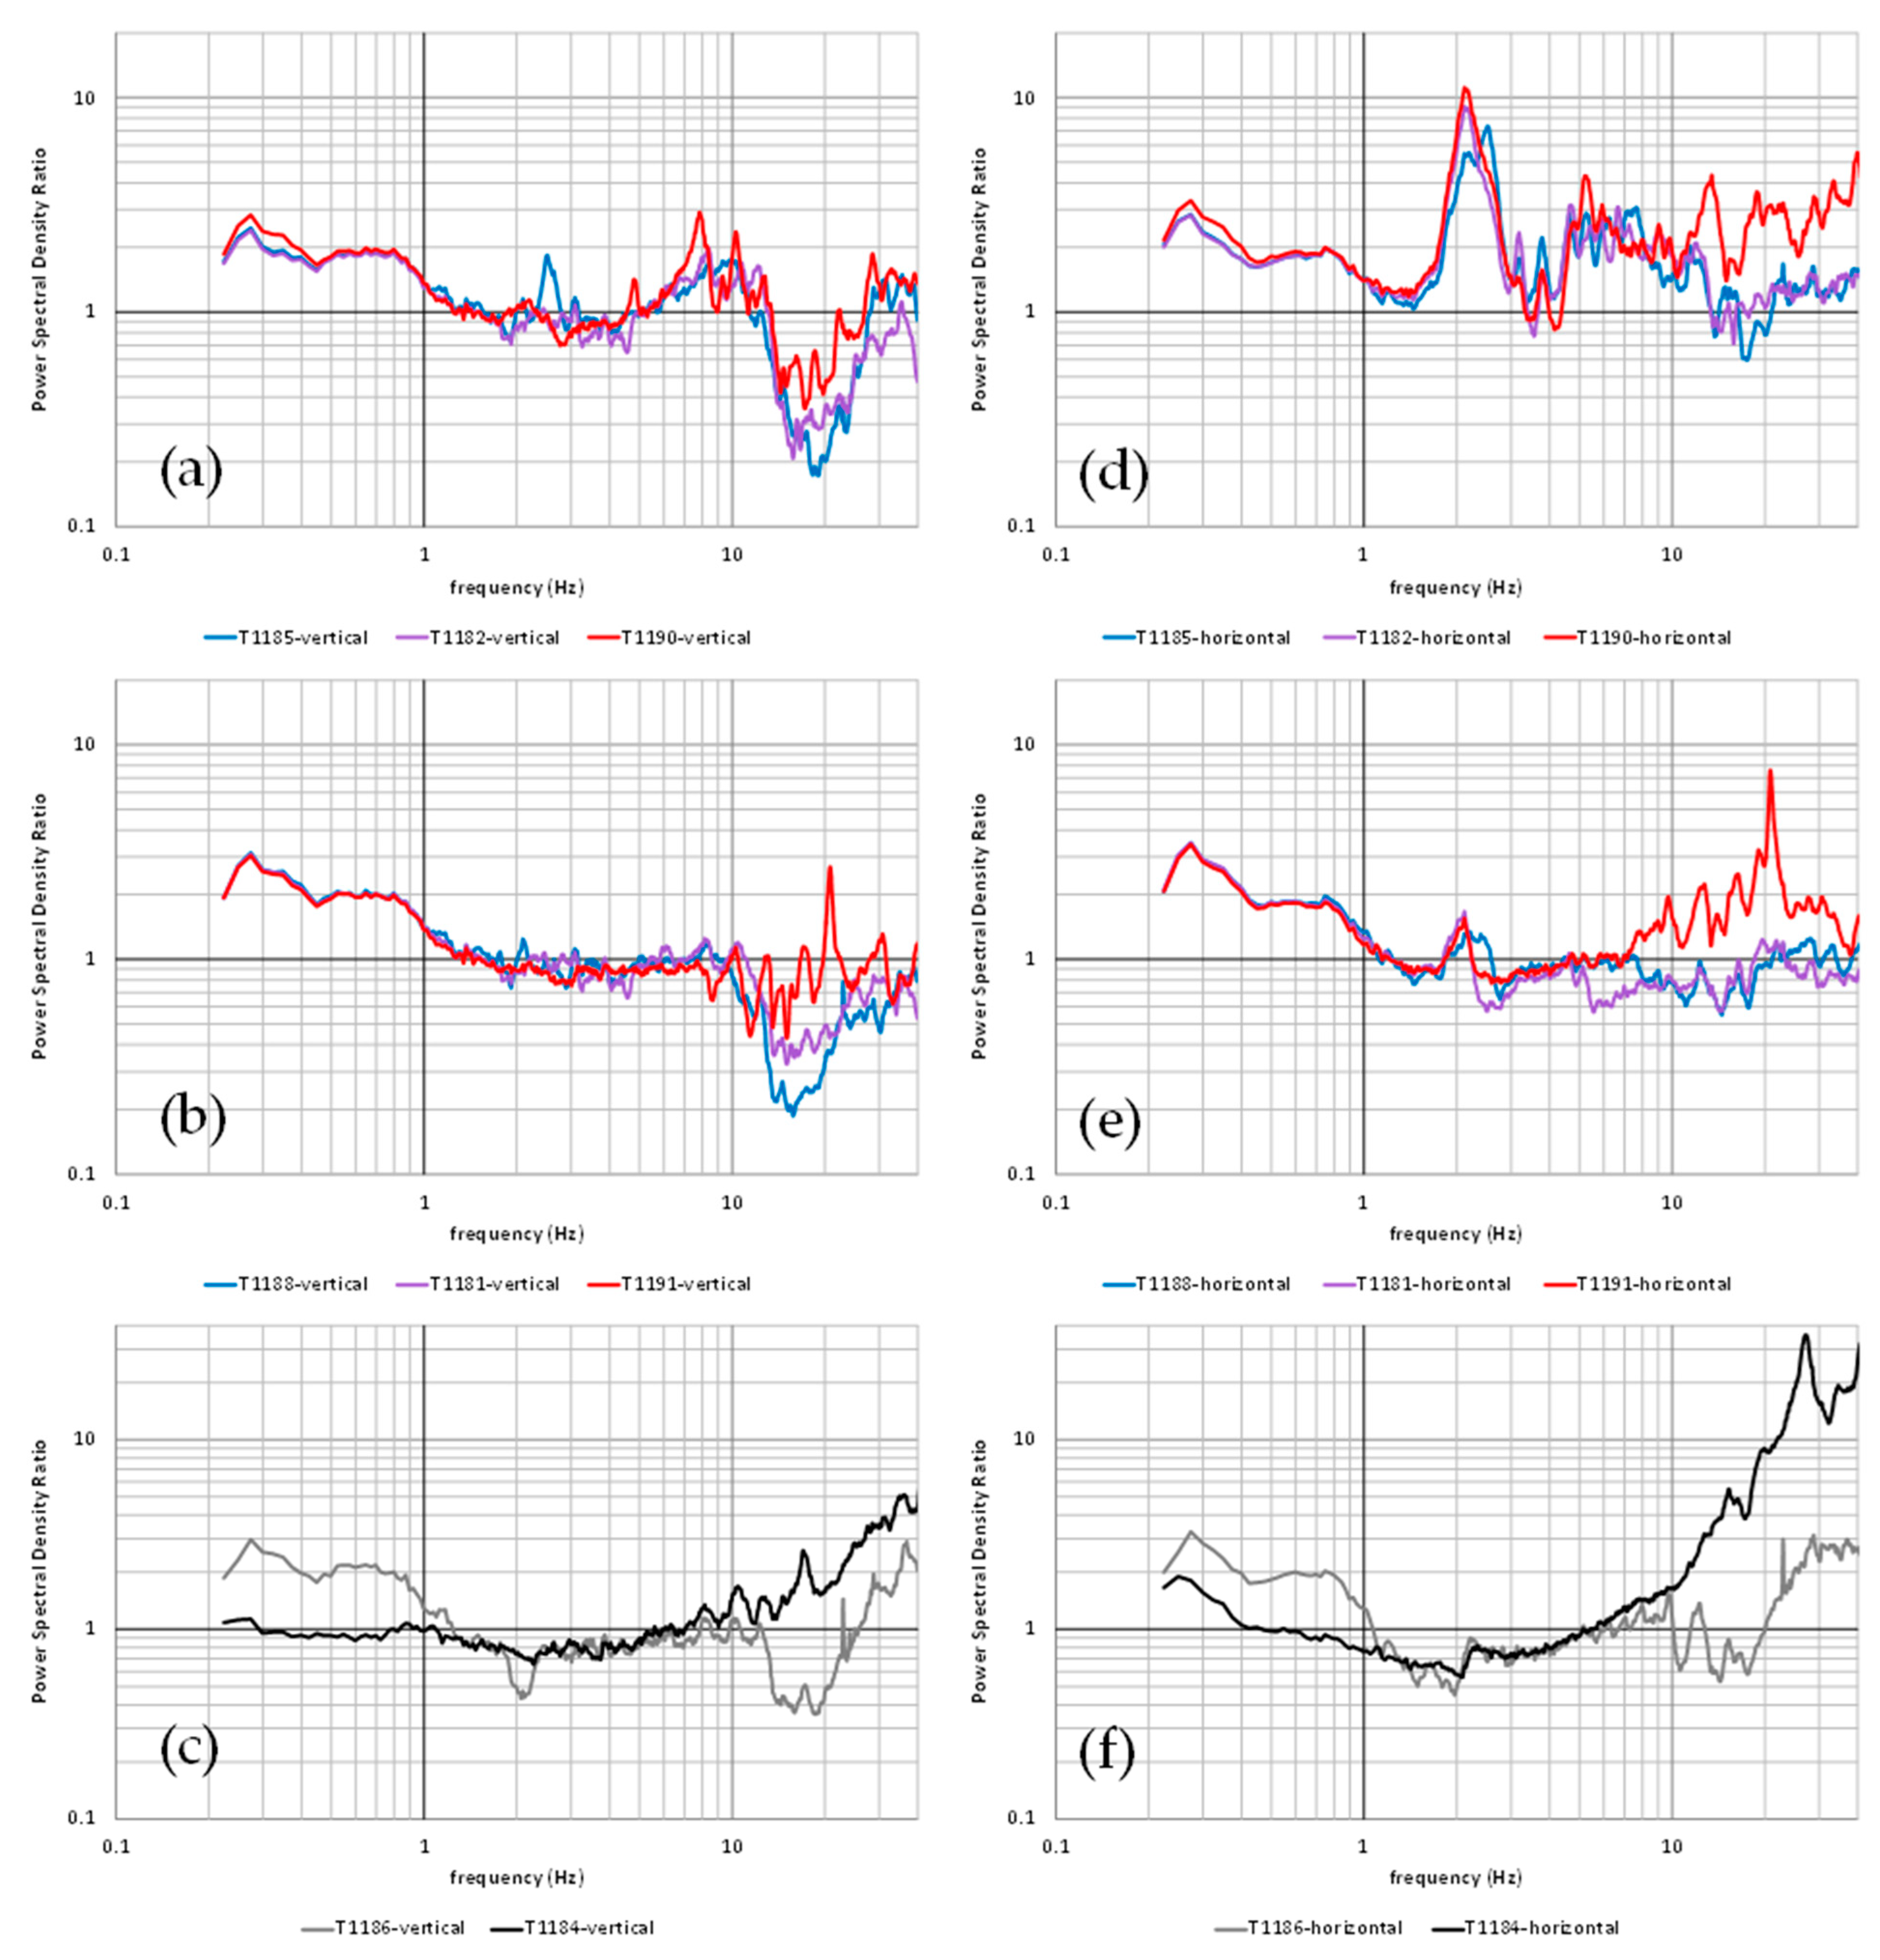
3.2. The Current Level of the Vibrations
4. Discussion
5. Conclusions
Author Contributions
Funding
Data Availability Statement
Acknowledgments
Conflicts of Interest
References
- Tatì, M.B.; Cianetti, M.M.; de Canio, G.E. Impact of traffic vibration on the temple of Minerva Medica, Rome: Preliminary study within the co.b.ra. project. Int. J. Herit. Archit. Stud. Repairs Maintence 2017, 2, 102–114. [Google Scholar] [CrossRef][Green Version]
- Giovanis, E. The relationship between teleworking, traffic and air pollution. Atmos. Pollut. Res. 2018, 9, 1–14. [Google Scholar] [CrossRef]
- Guo, Y.; Zhang, Q.; Lai, K.K.; Zhang, Y.; Wang, S.; Zhang, W. The Impact of Urban Transportation Infrastructure on Air Quality. Sustainability 2020, 12, 5626. [Google Scholar] [CrossRef]
- Betta, L.; Dattilo, B.; di Bella, E.; Finocchiaro, G.; Iaccarino, S. Tourism and Road Transport Emissions in Italy. Sustainability 2021, 13, 12712. [Google Scholar] [CrossRef]
- Rainer, J.H. Effect of vibrations on historic buildings: An overview. Assoc. Preserv. Technol. Bull. 1982, 15, 2–10. [Google Scholar] [CrossRef]
- Xia, B.; Wei, P.B.; Cao, Y.M. Traffic-induced vibrations of ground environments and buildings. In Environmental Vibrations: Prediction, Monitoring, Mitigation and Evaluation, 1st ed.; Takemiya, H., Ed.; Taylor & Francis Group: London, UK, 2005; pp. 529–539. [Google Scholar]
- Beben, D.; Maleska, T.; Bobra, P.; Duda, J.; Anigacz, W. Influence of Traffic-Induced Vibrations on Humans and Residential Building-A Case Study. Int. J. Environ. Res. Public Health 2022, 19, 5441. [Google Scholar] [CrossRef]
- Caserta, A.; Doumaz, F.; Costanzo, A.; Gervasi, A.; Thorossian, W.; Falcone, S.; La Piana, C.; Minasi, M.; Buongiorno, M.F. Assessing soil-structure interaction during the 2016 central Italy seismic sequence (Italy): Preliminary results. Ann. Geophys. 2016, 59, 1–7. [Google Scholar]
- Costanzo, A.; Caserta, A. Seismic response across the Tronto Valley (at Acquasanta Terme, AP, Marche) based on the geophysical monitoring of the 2016 Central Italy seismic sequence. Bull. Eng. Geol. Environ. 2019, 78, 5599–5616. [Google Scholar] [CrossRef]
- Costanzo, A.; D’Onofrio, A.; Silvestri, F. Seismic response of a geological, historical and architectural site: The Gerace cliff (southern Italy). Bull. Eng. Geol. Environ. 2019, 78, 5617–5633. [Google Scholar] [CrossRef]
- Ferraro, A.; Grasso, S.; Maugeri, M.; Totani, F. Seismic response analysis in the southern part of the historic centre of the City of L’Aquila (Italy). Soil Dyn. Earthq. Eng. 2016, 88, 256–264. [Google Scholar] [CrossRef]
- Brando, G.; Pagliaroli, A.; Cocco, G.; Di Buccio, F. Site effects and damage scenarios: The case study of two historic centers following the 2016 Central Italy earthquake. Eng. Geol. 2020, 272, 105647. [Google Scholar] [CrossRef]
- Zini, G.; Betti, M.; Bartoli, G. Experimental analysis of the traffic-induced-vibration on an ancient lodge. Struct. Control Health Monit. 2022, 29, e2900. [Google Scholar] [CrossRef]
- Clemente, P.; Rinaldis, D. Protection of a monumental building against traffic-induced vibrations. Soil Dyn. Earthq. Eng. 1998, 17, 289–296. [Google Scholar] [CrossRef]
- Korkmaz, K.A.; Ay, Z.; Keskin, S.N.; Ceditoglu, D. Investigation of traffic-induced vibrations on masonry buildings in Turkey and countermeasures. J. Vib. Control 2011, 17, 3–10. [Google Scholar] [CrossRef]
- Baraccani, S.; Azzara, R.M.; Palermo, M.; Gasparini, G.; Trombetti, T. Long-term seismometric monitoring of the two towers of bologna(Italy): Modal frequencies identification and effects due to traffic induced vibrations. Front. Built Environ. 2020, 6, 85. [Google Scholar] [CrossRef]
- Haladin, I.; Bogut, M.; Lakušić, S. Analysis of Tram Traffic-Induced Vibration Influence on Earthquake Damaged Buildings. Buildings 2021, 11, 590. [Google Scholar] [CrossRef]
- Persson, P.; Andersen, L.V.; Persson, K.; Bucinskas, P. Effect of structural design on traffic-induced building vibrations. Procedia Eng. 2017, 199, 2711–2716. [Google Scholar] [CrossRef]
- Pau, A.; Vestroni, F. Vibration assessment and structural monitoring of the Basilica of Maxentius in Rome. Mech. Syst. Signal Process. 2013, 41, 454–466. [Google Scholar] [CrossRef]
- Crispino, M.; D’Apuzzo, M. Measurement and prediction of traffic-induced vibrations in a heritage building. J. Sound Vib. 2001, 246, 319–335. [Google Scholar] [CrossRef]
- Erkal, A. Transmission of Traffic-induced Vibrations on and around the Minaret of Little Hagia Sophia. Int. J. Archit. Herit. 2017, 11, 349–362. [Google Scholar] [CrossRef]
- Lorenzoni, F.; Casarin, F.; Modena, C.; Caldon, M.; Islami, K.; da Porto, F. Structural health monitoring of the Roman Arena of Verona, Italy. J. Civ. Struct. Health Monit. 2013, 3, 227–246. [Google Scholar] [CrossRef]
- Puzzilli, L.M.; Bongiovanni, G.; Clemente, P.; Di Fiore, V.; Verrubbi, V. Effects of Anthropic and Ambient Vibrations on Archaeological Sites: The Case of the Circus Maximus in Rome. Geosciences 2021, 11, 463. [Google Scholar] [CrossRef]
- Bernardini, G.; De Pasquale, G.; Gallino, N.; Gentile, C. Microwave interferometer for ambient vibration measurements on civil engineering structures: 2. Application to full-scale Bridges. In Proceedings of the Experimental Vibration Analysis for Civil Engineering Structures (EVACES’07), Porto, Portugal, 24–26 October 2007; pp. 153–162. [Google Scholar]
- Mugnai, F.; Cosentino, A.; Mazzanti, P.; Tucci, G. Vibration Analyses of a Gantry Structure by Mobile Phone Digital Image Correlation and Interferometric Radar. Geomatics 2022, 2, 17–35. [Google Scholar] [CrossRef]
- Antonielli, B.; Caporossi, P.; Mazzanti, P.; Moretto, S.; Rocca, A. InSAR & Photomonitoringtm for Dams and Reservoir Slopes Health & Safety Monitoring. In Proceedings of the Twenty-Sixth International Congress on Large Dams/Vingt-Sixième Congrès International des Grands Barrages, Vienna, Austria, 4–6 July 2018; p. 4. [Google Scholar]
- Mugnai, F.; Tucci, G.; Da Re, A. Digital image correlation in assessing structured-light 3D scanner’s gantry stability: Performing david’s (michelangelo) high-accuracy 3D survey. In Proceedings of the International Archives of the Photogrammetry, Remote Sensing and Spatial Information Sciences, Torino, Italy, 1 August 2021; Volume XLVI-M-1–2, pp. 463–469. [Google Scholar]
- Ozelim, L.C.d.S.M.; Borges, L.P.d.F.; Cavalcante, A.L.B.; Albuquerque, E.A.C.; Diniz, M.d.S.; Góis, M.S.; Costa, K.R.C.B.d.; Sousa, P.F.d.; Dantas, A.P.d.N.; Jorge, R.M.; et al. Structural Health Monitoring of Dams Based on Acoustic Monitoring, Deep Neural Networks, Fuzzy Logic and a CUSUM Control Algorithm. Sensors 2022, 22, 2482. [Google Scholar] [CrossRef] [PubMed]
- DIN 4150-3:1999; Structural Vibrations—Part 3: Effects of Vibration on Structures. Deutsches Institut fur Normung: Berlin, Germany, 2016.
- UNI 9916:2014; Criteri di Misura e Valutazione Degli Effetti Delle Vibrazioni Sugli Edifici. Ente Nazionale Italiano di Unificazione: Milan, Italy, 2014.
- SN 640312:2013; Effet des Ébranlements sur les Constructions. Swiss Standard: Swiss, Switzerland, 2013.
- UNESCO World Heritage List. Available online: https://whc.unesco.org/en/list/ (accessed on 21 April 2021).
- Villa Farnesina: A Resilience Laboratory. Traffic Vibrations: The project by Prof. Eng. Gustavo Colonnetti, Lincei Fellow (1886–1968). Accademia dei Lincei, Roma. Available online: http://www.Villafarnesina.it/wp-content/uploads/2020/12/TotemTraffico3.pdf (accessed on 21 May 2022).
- INGV Project Dynamic Planet. Available online: https://progetti.ingv.it/en/pianeta-dinamico (accessed on 21 April 2021).
- Costanzo, A.; Falcone, S.; La Piana, C.; Lapenta, V.; Musacchio, M.; Sgamellotti, A.; Buongiorno, M.F. Traffic-induced vibrations on cultural heritage in urban area: The case of Villa Farnesina in Rome. J. Phys. Conf. Ser. 2022, 2204, 012043. [Google Scholar] [CrossRef]
- Colonnetti, G.; Massari, G. Relazione per lo Studio dei Danni Arrecati dal Traffico Pesante alla Farnesina; Accademia Nazionale dei Lincei: Roma, Italy, 1959. (In Italian) [Google Scholar]
- Pfeifer, N.; Briese, C. Laser scanning: Principles and applications. In Proceedings of the 3rd International Exhibition and Scientific Congress on Geodesy, Mapping, Geology, Geophysics, Novosibirsk, Russia, 25–27 April 2007. [Google Scholar]
- Andrews, D.D.; Bedford, J.; Papworth, H. ; English Heritage. Measured and Drawn: Techniques and Practice for the Metric Survey of Historic Buildings; English Heritage: Swindon, UK, 2009. [Google Scholar]
- Z+F IMAGER® 5010C. Available online: https://www.zofre.de/en/laser-scanners/3d-laser-scanner/z-f-imagerr-5010c (accessed on 2 July 2022).
- Olsen, M.J.; Kuester, F.; Chang, B.J.; Hutchinson, T.C. Terrestrial laser scanning-based structural damage assessment. J. Comput. Civ. Eng. 2010, 24, 264–272. [Google Scholar] [CrossRef]
- Costanzo, A.; Minasi, M.; Casula, G.; Musacchio, M.; Buongiorno, M.F. Combined Use of Terrestrial Laser Scanning and IR Thermography Applied to a Historical Building. Sensors 2015, 15, 194–213. [Google Scholar] [CrossRef]
- Costanzo, A.; Pisciotta, A.; Pannaccione Apa, M.I.; Bongiovanni, S.; Capizzi, P.; D’Alessandro, A.; Martorana, R. Integrated use of unmanned aerial vehicle photogrammetry and terrestrial laser scanning to support archaeological analysis: The Acropolis of Selinunte case (Sicily, Italy). Archaeol. Prospect. 2020, 28, 153–165. [Google Scholar] [CrossRef]
- Z+F LaserControl®. Available online: https://www.zofre.de/en/laser-scanners/laserscanning-software/z-f-lasercontrolr (accessed on 2 July 2022).
- Cloud Compare Documentation. Available online: https://www.cloudcompare.org/doc/wiki/index.php/Main_Page (accessed on 2 July 2022).
- Gillespie, A.R.; Kahle, A.B.; Walker, R.E. Color enhancement of highly correlated images-II: Channel ratio and “chromaticity” transformation techniques. Remote Sens. Environ. 1987, 22, 343–365. [Google Scholar] [CrossRef]
- Nanometrics Inc. CENTAUR Technical Specifications; Nanometrics, Inc.: Kanata, ON, Canada, 2018; Available online: https://www.nanometrics.ca/products/digitizers/centaur-digital-recorder (accessed on 2 July 2022).
- Nanometrics Inc. TRILLIUM COMPACT Technical Specifications; Nanometrics, Inc.: Kanata, ON, Canada, 2018; Available online: https://www.nanometrics.ca/products/seismometers/trillium-compact (accessed on 2 July 2022).
- Nanometrics Inc. TITAN Technical Specifications; Nanometrics, Inc.: Kanata, ON, Canada, 2018; Available online: https://www.nanometrics.ca/products/accelerometers/titan-accelerometer (accessed on 2 July 2022).
- McNamara, D.E.; Buland, R.P. Ambient Noise Levels in the Continental United States. Bull. Seism. Soc. Am. 2004, 94, 1517–1527. [Google Scholar] [CrossRef]
- PQLX Software. Available online: https://ds.iris.edu/ds/nodes/dmc/software/downloads/pqlx/2011365p4/ (accessed on 2 July 2022).
- Peterson, J. Observations and Modeling of Seismic Background Noise; US Geological Survey Open-File Report; US Geological Survey: Reston, VA, USA, 1993; pp. 93–322.
- Brincker, R.; Zhang, L.; Andersen, P. Modal Identification from Ambient Responses using Frequency Domain Decomposition. In Proceedings of the International Modal Analysis Conference (IMAC), San Antonio, TX, USA, 7–10 February 2000; pp. 625–630. [Google Scholar]
- Brincker, R.; Zhang, L.; Andersen, P. Modal identification of output-only systems using frequency domain decomposition. Smart Mater. Struct. 2001, 10, 441. [Google Scholar] [CrossRef]
- Athanasopuolos, G.A.; Pelekis, P.C. Ground vibrations from sheetpile driving in urban environment: Measurements, analysis and effects on buildings and occupants. Soil Dyn. Earthq. Eng. 2000, 19, 371–387. [Google Scholar] [CrossRef]
- Lague, D.; Brodu, N.; Leroux, J. Accurate 3D comparison of complex topography with terrestrial laser scanner: Application to the Rangitikei canyon (N-Z). ISPRS J. Photogramm. Remote Sens. 2013, 82, 10–26. [Google Scholar] [CrossRef]
- Lercari, N. Monitoring earthen archaeological heritage using multi-temporal terrestrial laser scanning and surface change detection. J. Cult. Herit. 2019, 39, 152–165. [Google Scholar] [CrossRef]
- Barnhart, T.B.; Crosby, B.T. Comparing Two Methods of Surface Change Detection on an Evolving Thermokarst Using High-Temporal-Frequency Terrestrial Laser Scanning, Selawik River, Alaska. Remote Sens. 2013, 5, 2813–2837. [Google Scholar] [CrossRef]
- Yang, H.; Xu, X. Intelligent crack extraction based on terrestrial laser scanning measurement. Meas. Control 2020, 53, 3–4. [Google Scholar] [CrossRef]
- Stałowska, P.; Suchocki, C.; Rutkowska, M. Crack detection in building walls based on geometric and radiometric point cloud information. Autom. Constr. 2022, 134, 104065. [Google Scholar] [CrossRef]


| Frequency Range | PPV/PCPV | Threshold Values (mm/s) | Exposition | Component | |
|---|---|---|---|---|---|
| 1–10 Hz | PCPV + | 3 | short-term | horizontal | DIN 4150-3 [29] UNI 9916 [30] |
| 10–50 Hz | PCPV + | 3–8 | horizontal | ||
| 50–100 Hz | PCPV + | 8–10 | horizontal | ||
| All | PCPV * | 8 | horizontal | ||
| All | PCPV + | 2.5 | horizontal | ||
| All | PCPV + | 20 | vertical | ||
| All | PCPV + | 2.5 | long-term | horizontal | |
| All | PCPV + | 10 | short-term | vertical | UNI 9916 [30] |
| 8–30 Hz | PPV | 7.5–15 | occasional | module of resultant vector | SN 640312 [31] |
| 30–60 Hz | PPV | 10–20 | |||
| 60–150 Hz | PPV | 15–30 | |||
| 8–30 Hz | PPV | 3–6 | frequent | ||
| 30–60 Hz | PPV | 4–8 | |||
| 60–150 Hz | PPV | 6–12 | |||
| 8–30 Hz | PPV | 1.5–3 | continuous | ||
| 30–60 Hz | PPV | 2–4 | |||
| 60–150 Hz | PPV | 3–6 |
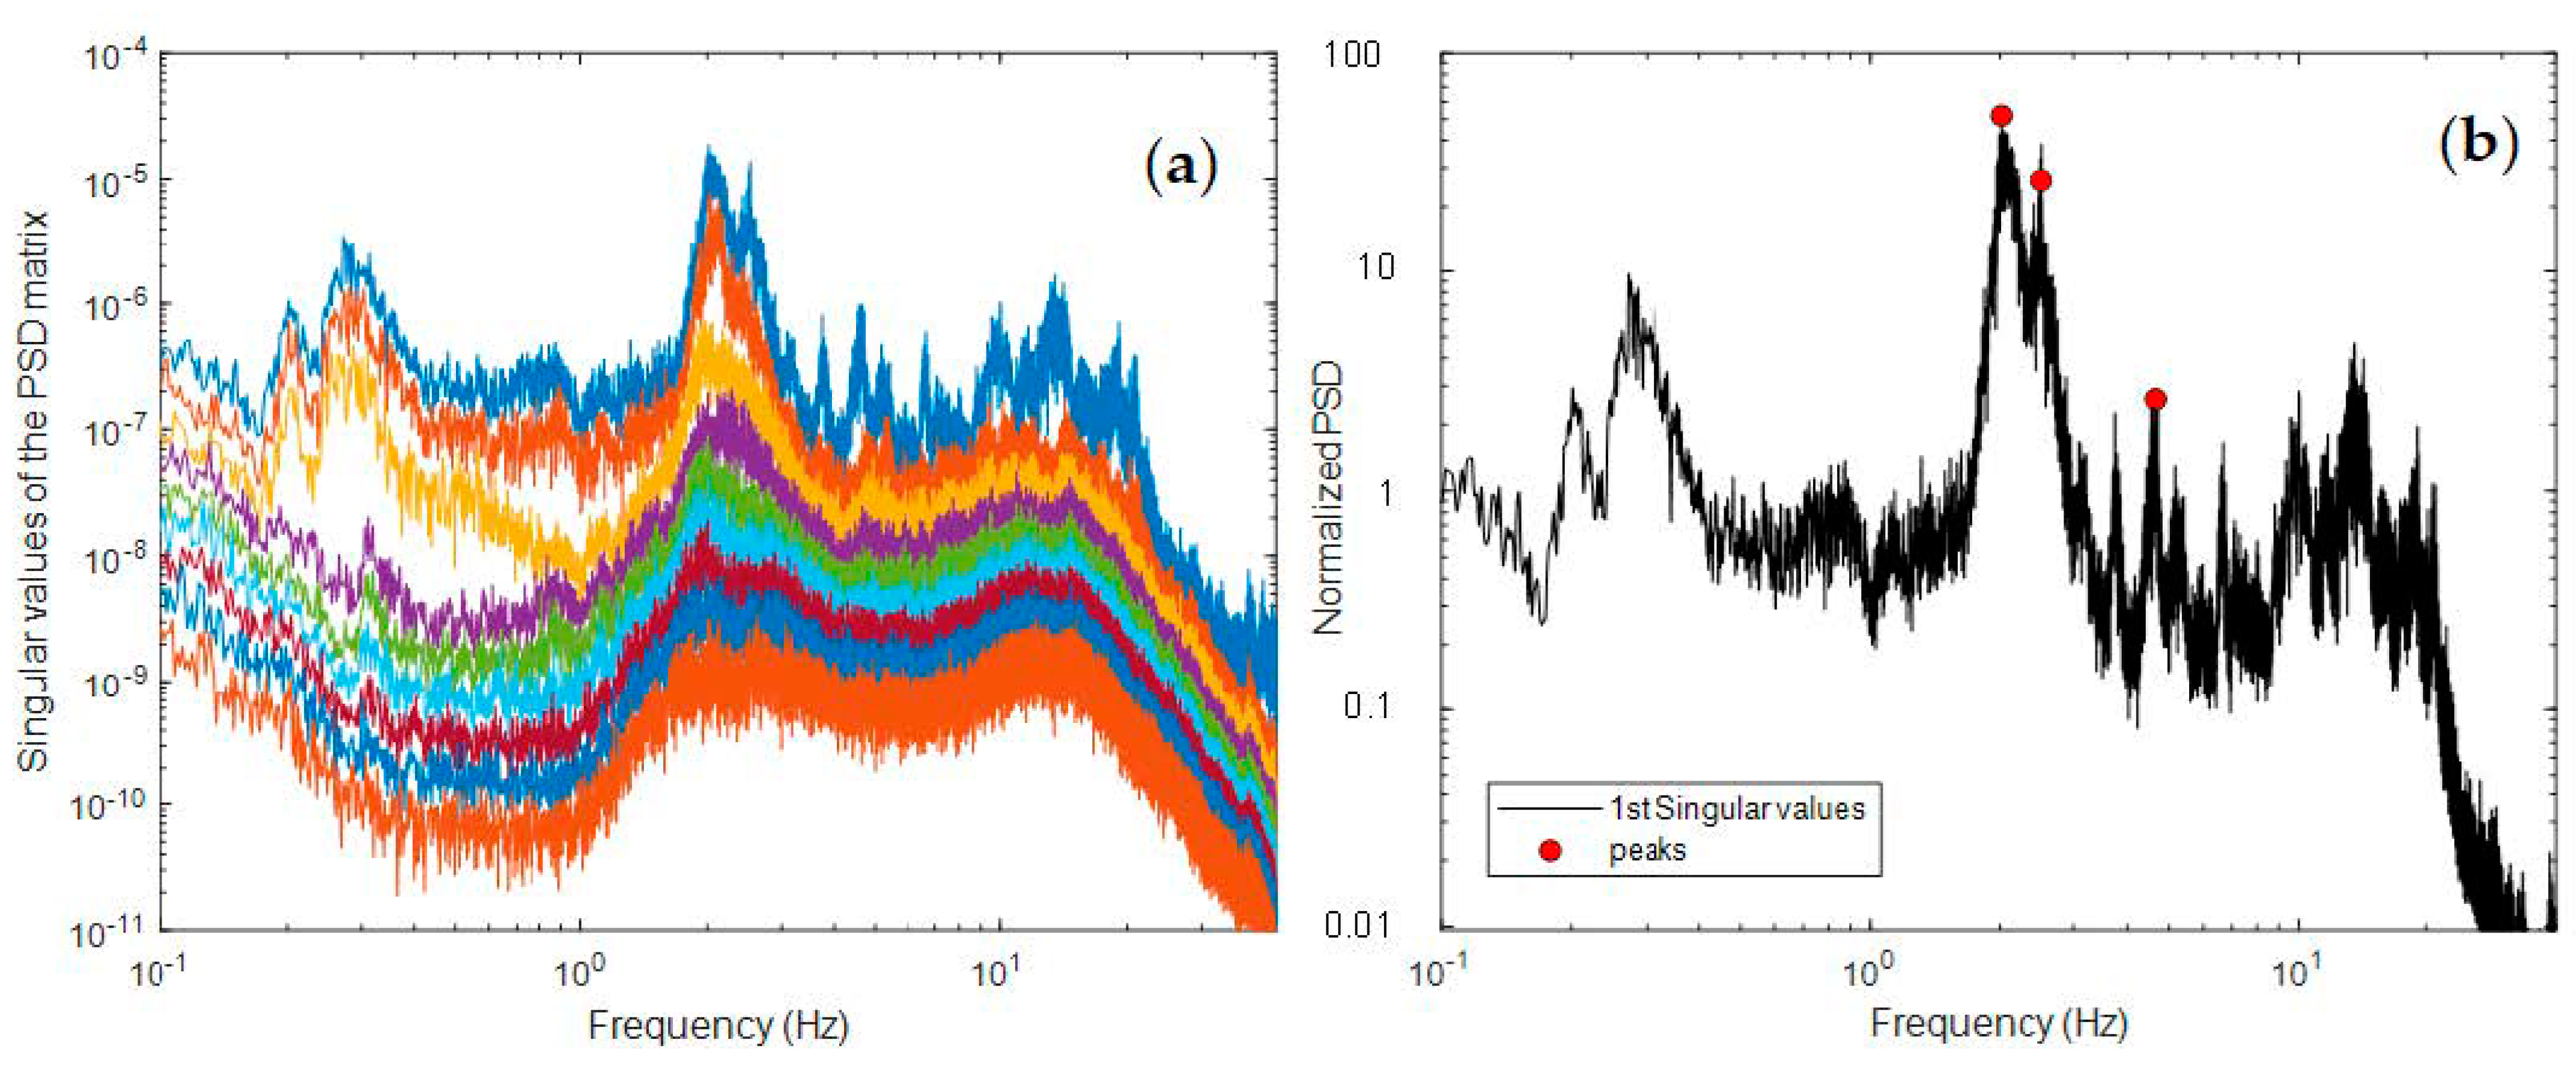
| Structural Modes | 1 | 2 | 3 |
|---|---|---|---|
| Natural frequency [Hz] | 2.016 | 2.522 | 4.651 |
| Damping ratio [%] | 4.07 | 4.08 | 2.78 |
Publisher’s Note: MDPI stays neutral with regard to jurisdictional claims in published maps and institutional affiliations. |
© 2022 by the authors. Licensee MDPI, Basel, Switzerland. This article is an open access article distributed under the terms and conditions of the Creative Commons Attribution (CC BY) license (https://creativecommons.org/licenses/by/4.0/).
Share and Cite
Costanzo, A.; Falcone, S.; La Piana, C.; Lapenta, V.; Musacchio, M.; Sgamellotti, A.; Buongiorno, M.F. Laser Scanning Investigation and Geophysical Monitoring to Characterise Cultural Heritage Current State and Threat by Traffic-Induce Vibrations: The Villa Farnesina in Rome. Remote Sens. 2022, 14, 5818. https://doi.org/10.3390/rs14225818
Costanzo A, Falcone S, La Piana C, Lapenta V, Musacchio M, Sgamellotti A, Buongiorno MF. Laser Scanning Investigation and Geophysical Monitoring to Characterise Cultural Heritage Current State and Threat by Traffic-Induce Vibrations: The Villa Farnesina in Rome. Remote Sensing. 2022; 14(22):5818. https://doi.org/10.3390/rs14225818
Chicago/Turabian StyleCostanzo, Antonio, Sergio Falcone, Carmelo La Piana, Virginia Lapenta, Massimo Musacchio, Antonio Sgamellotti, and Maria Fabrizia Buongiorno. 2022. "Laser Scanning Investigation and Geophysical Monitoring to Characterise Cultural Heritage Current State and Threat by Traffic-Induce Vibrations: The Villa Farnesina in Rome" Remote Sensing 14, no. 22: 5818. https://doi.org/10.3390/rs14225818
APA StyleCostanzo, A., Falcone, S., La Piana, C., Lapenta, V., Musacchio, M., Sgamellotti, A., & Buongiorno, M. F. (2022). Laser Scanning Investigation and Geophysical Monitoring to Characterise Cultural Heritage Current State and Threat by Traffic-Induce Vibrations: The Villa Farnesina in Rome. Remote Sensing, 14(22), 5818. https://doi.org/10.3390/rs14225818