
Development and Utilization of a Mirror Array Target for the Calibration and Harmonization of Micro-Satellite Imagery

 ,
,  , ,
, ,
Abstract
1. Introduction
2. Calibration Site Development
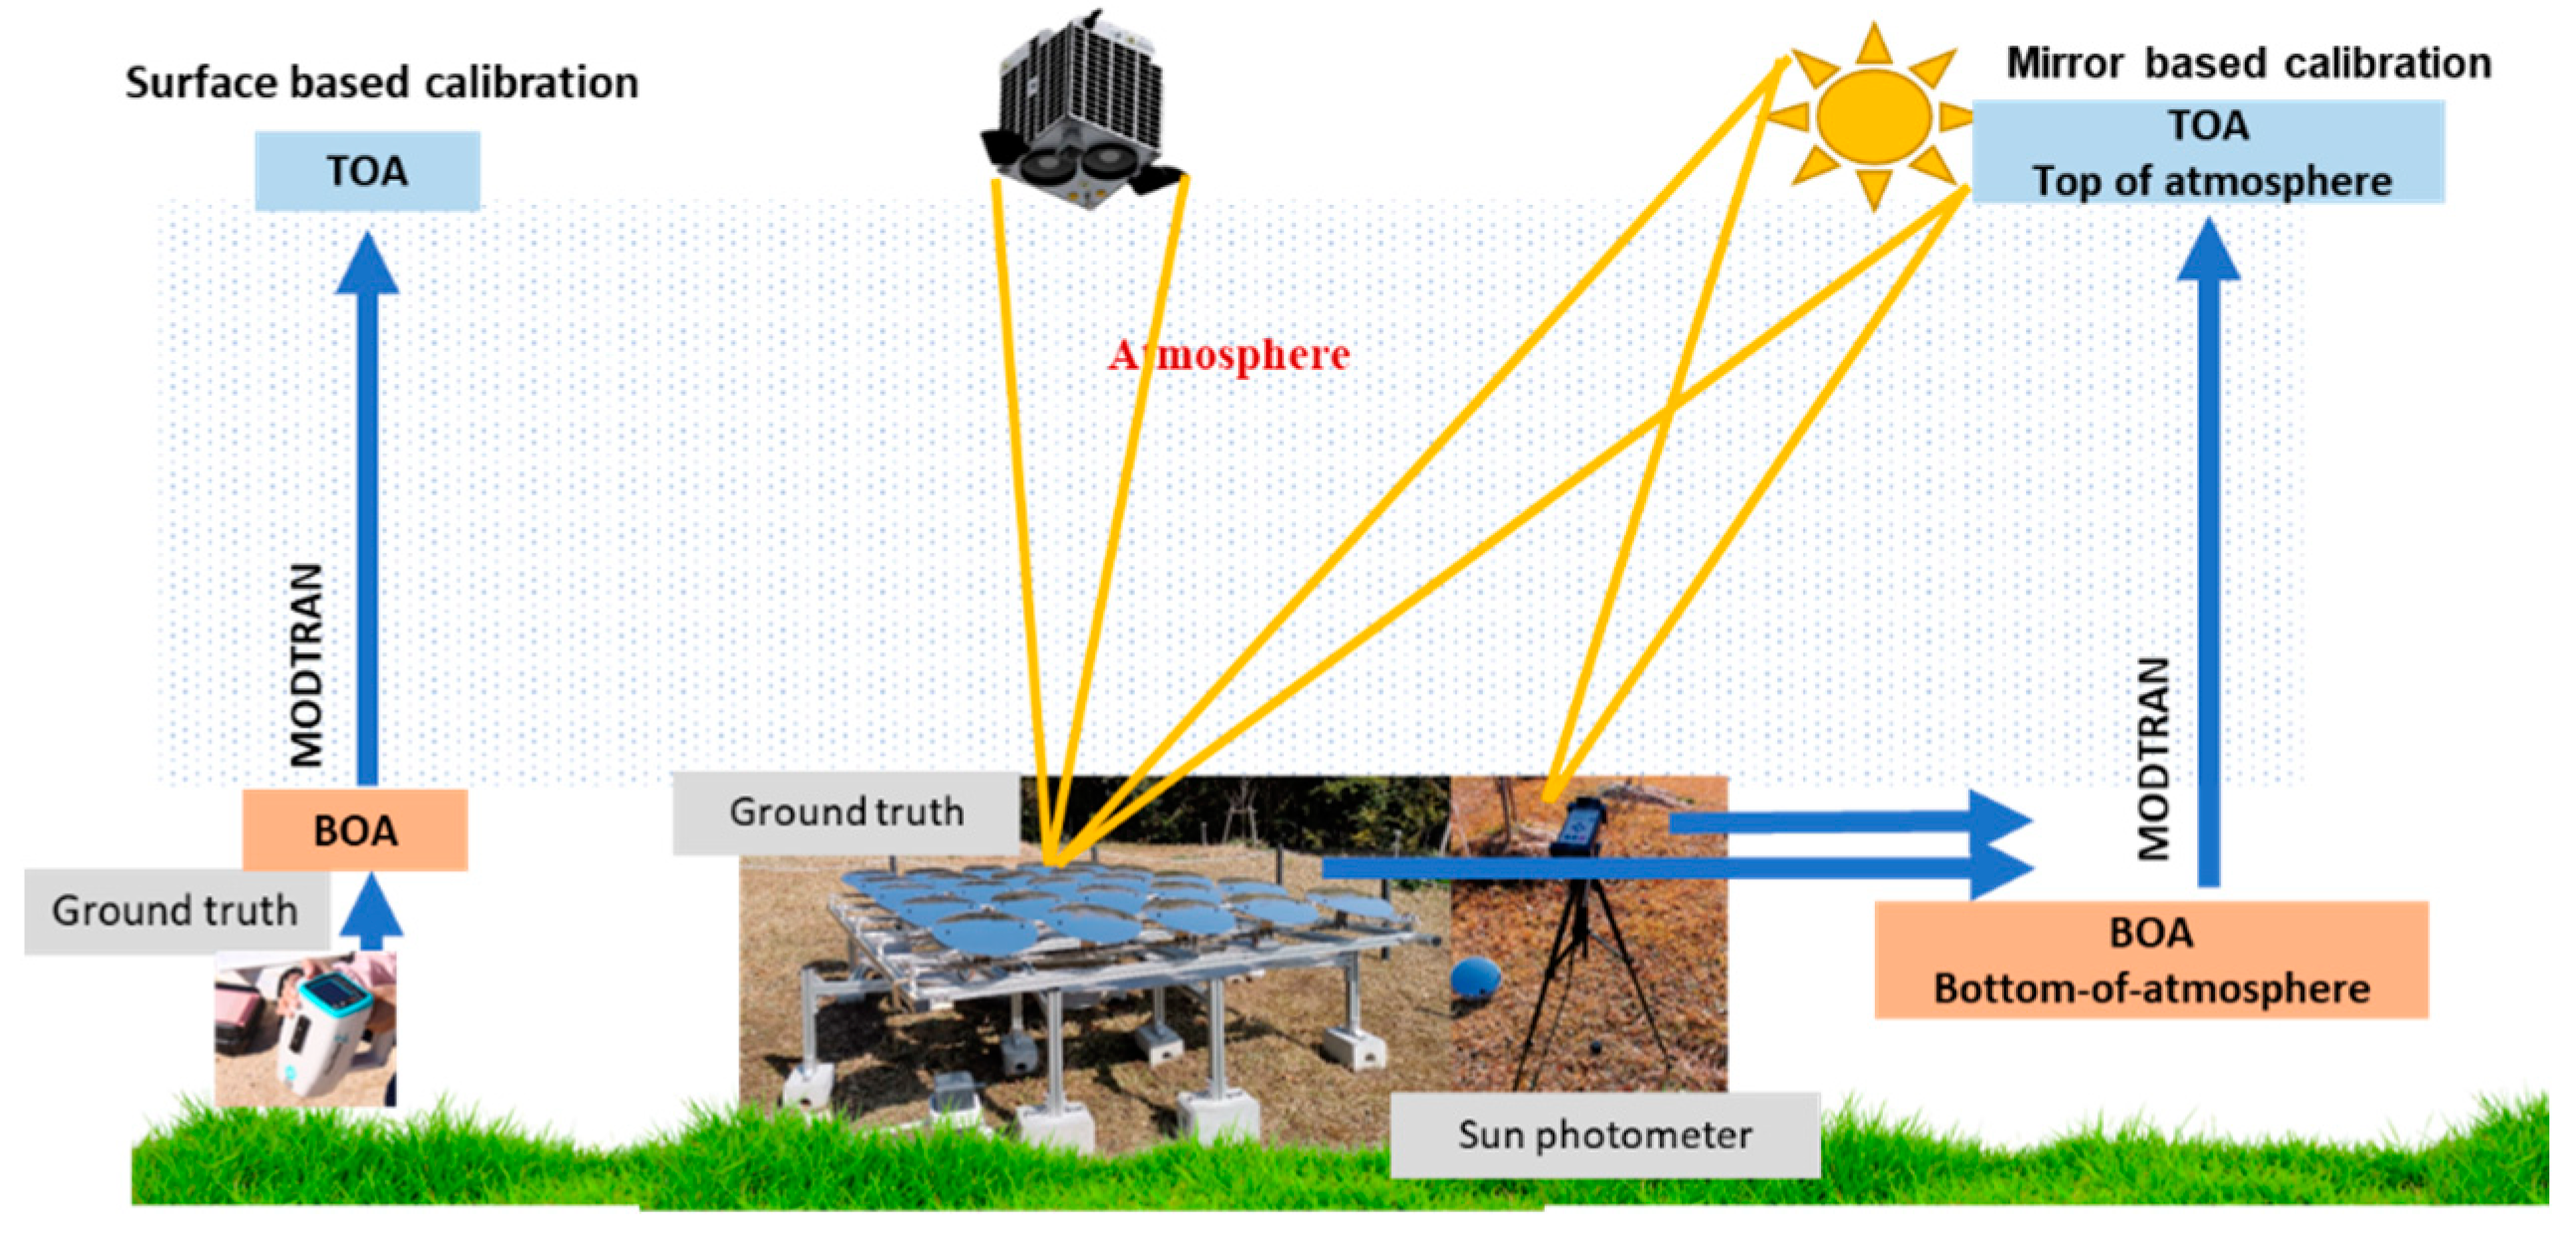
2.1. Calibration Approach
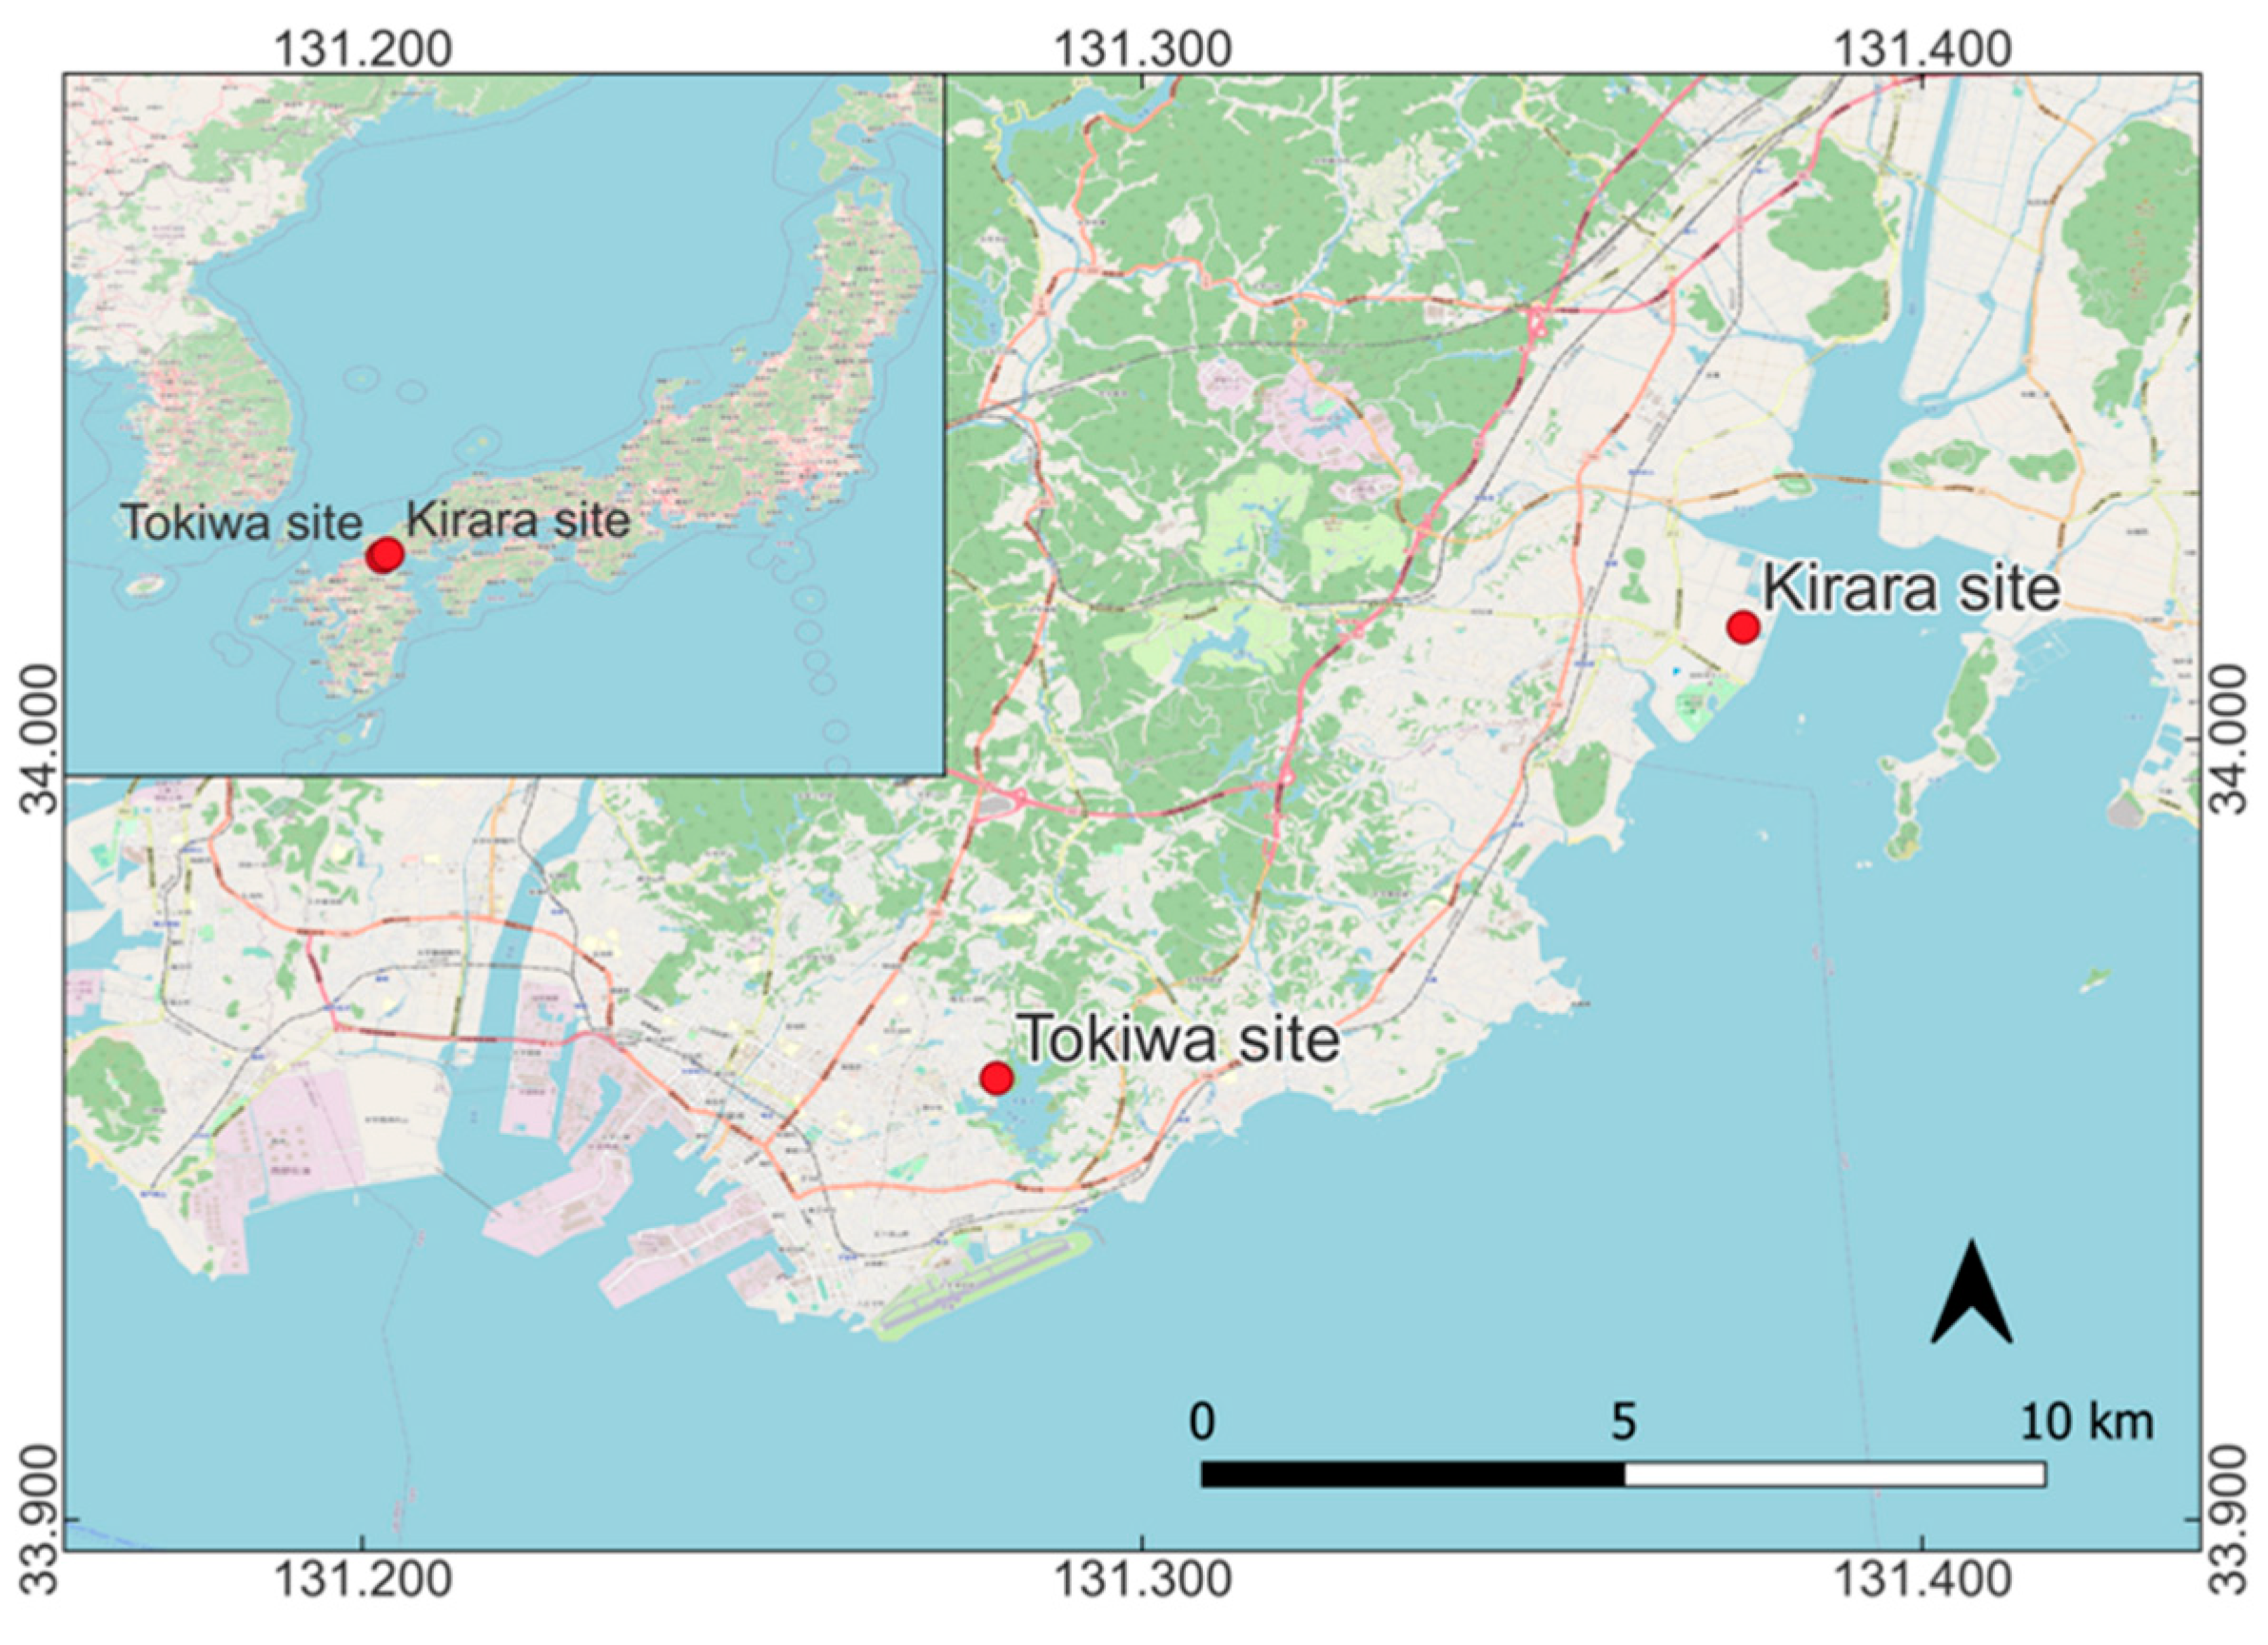
2.2. Site Selection
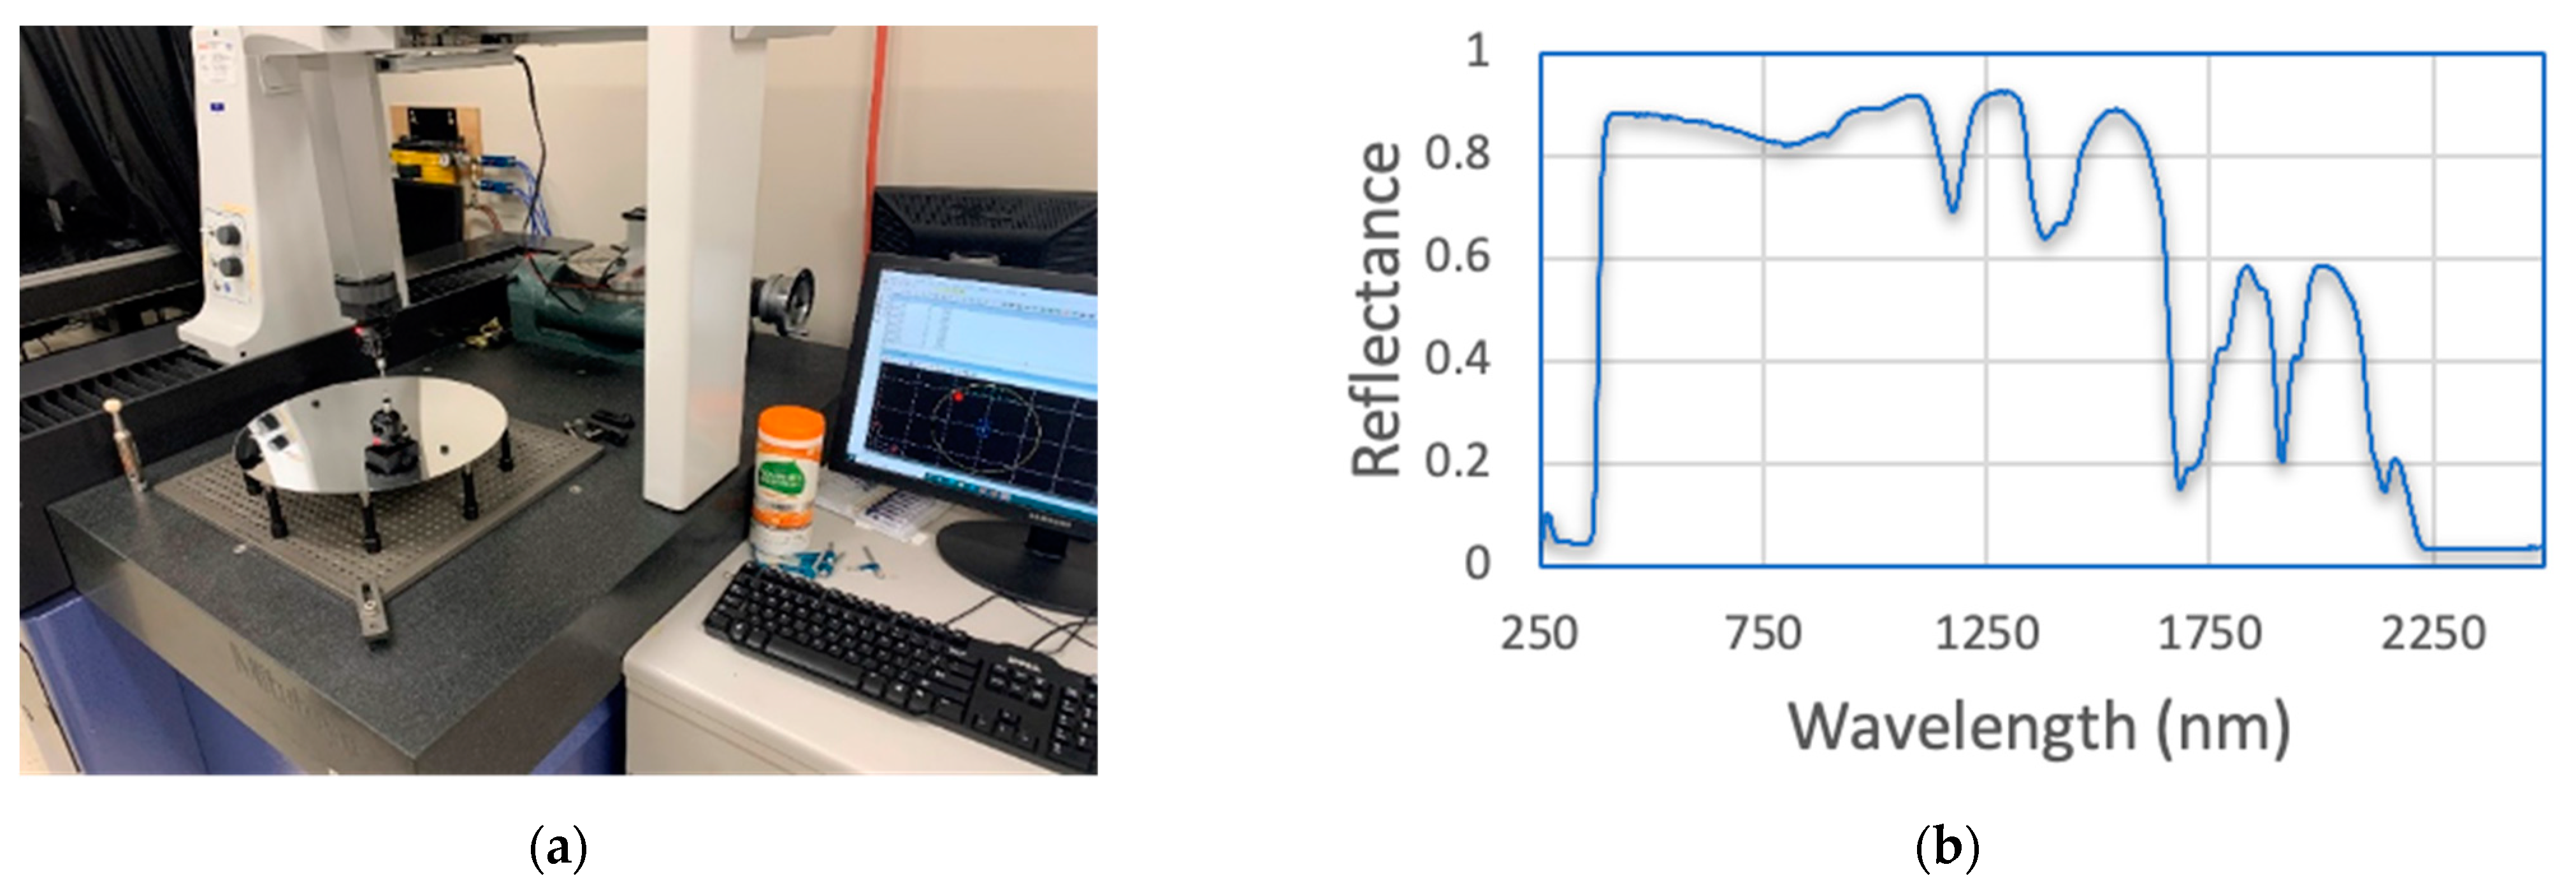
2.3. Mirror Reflectivity Measurement
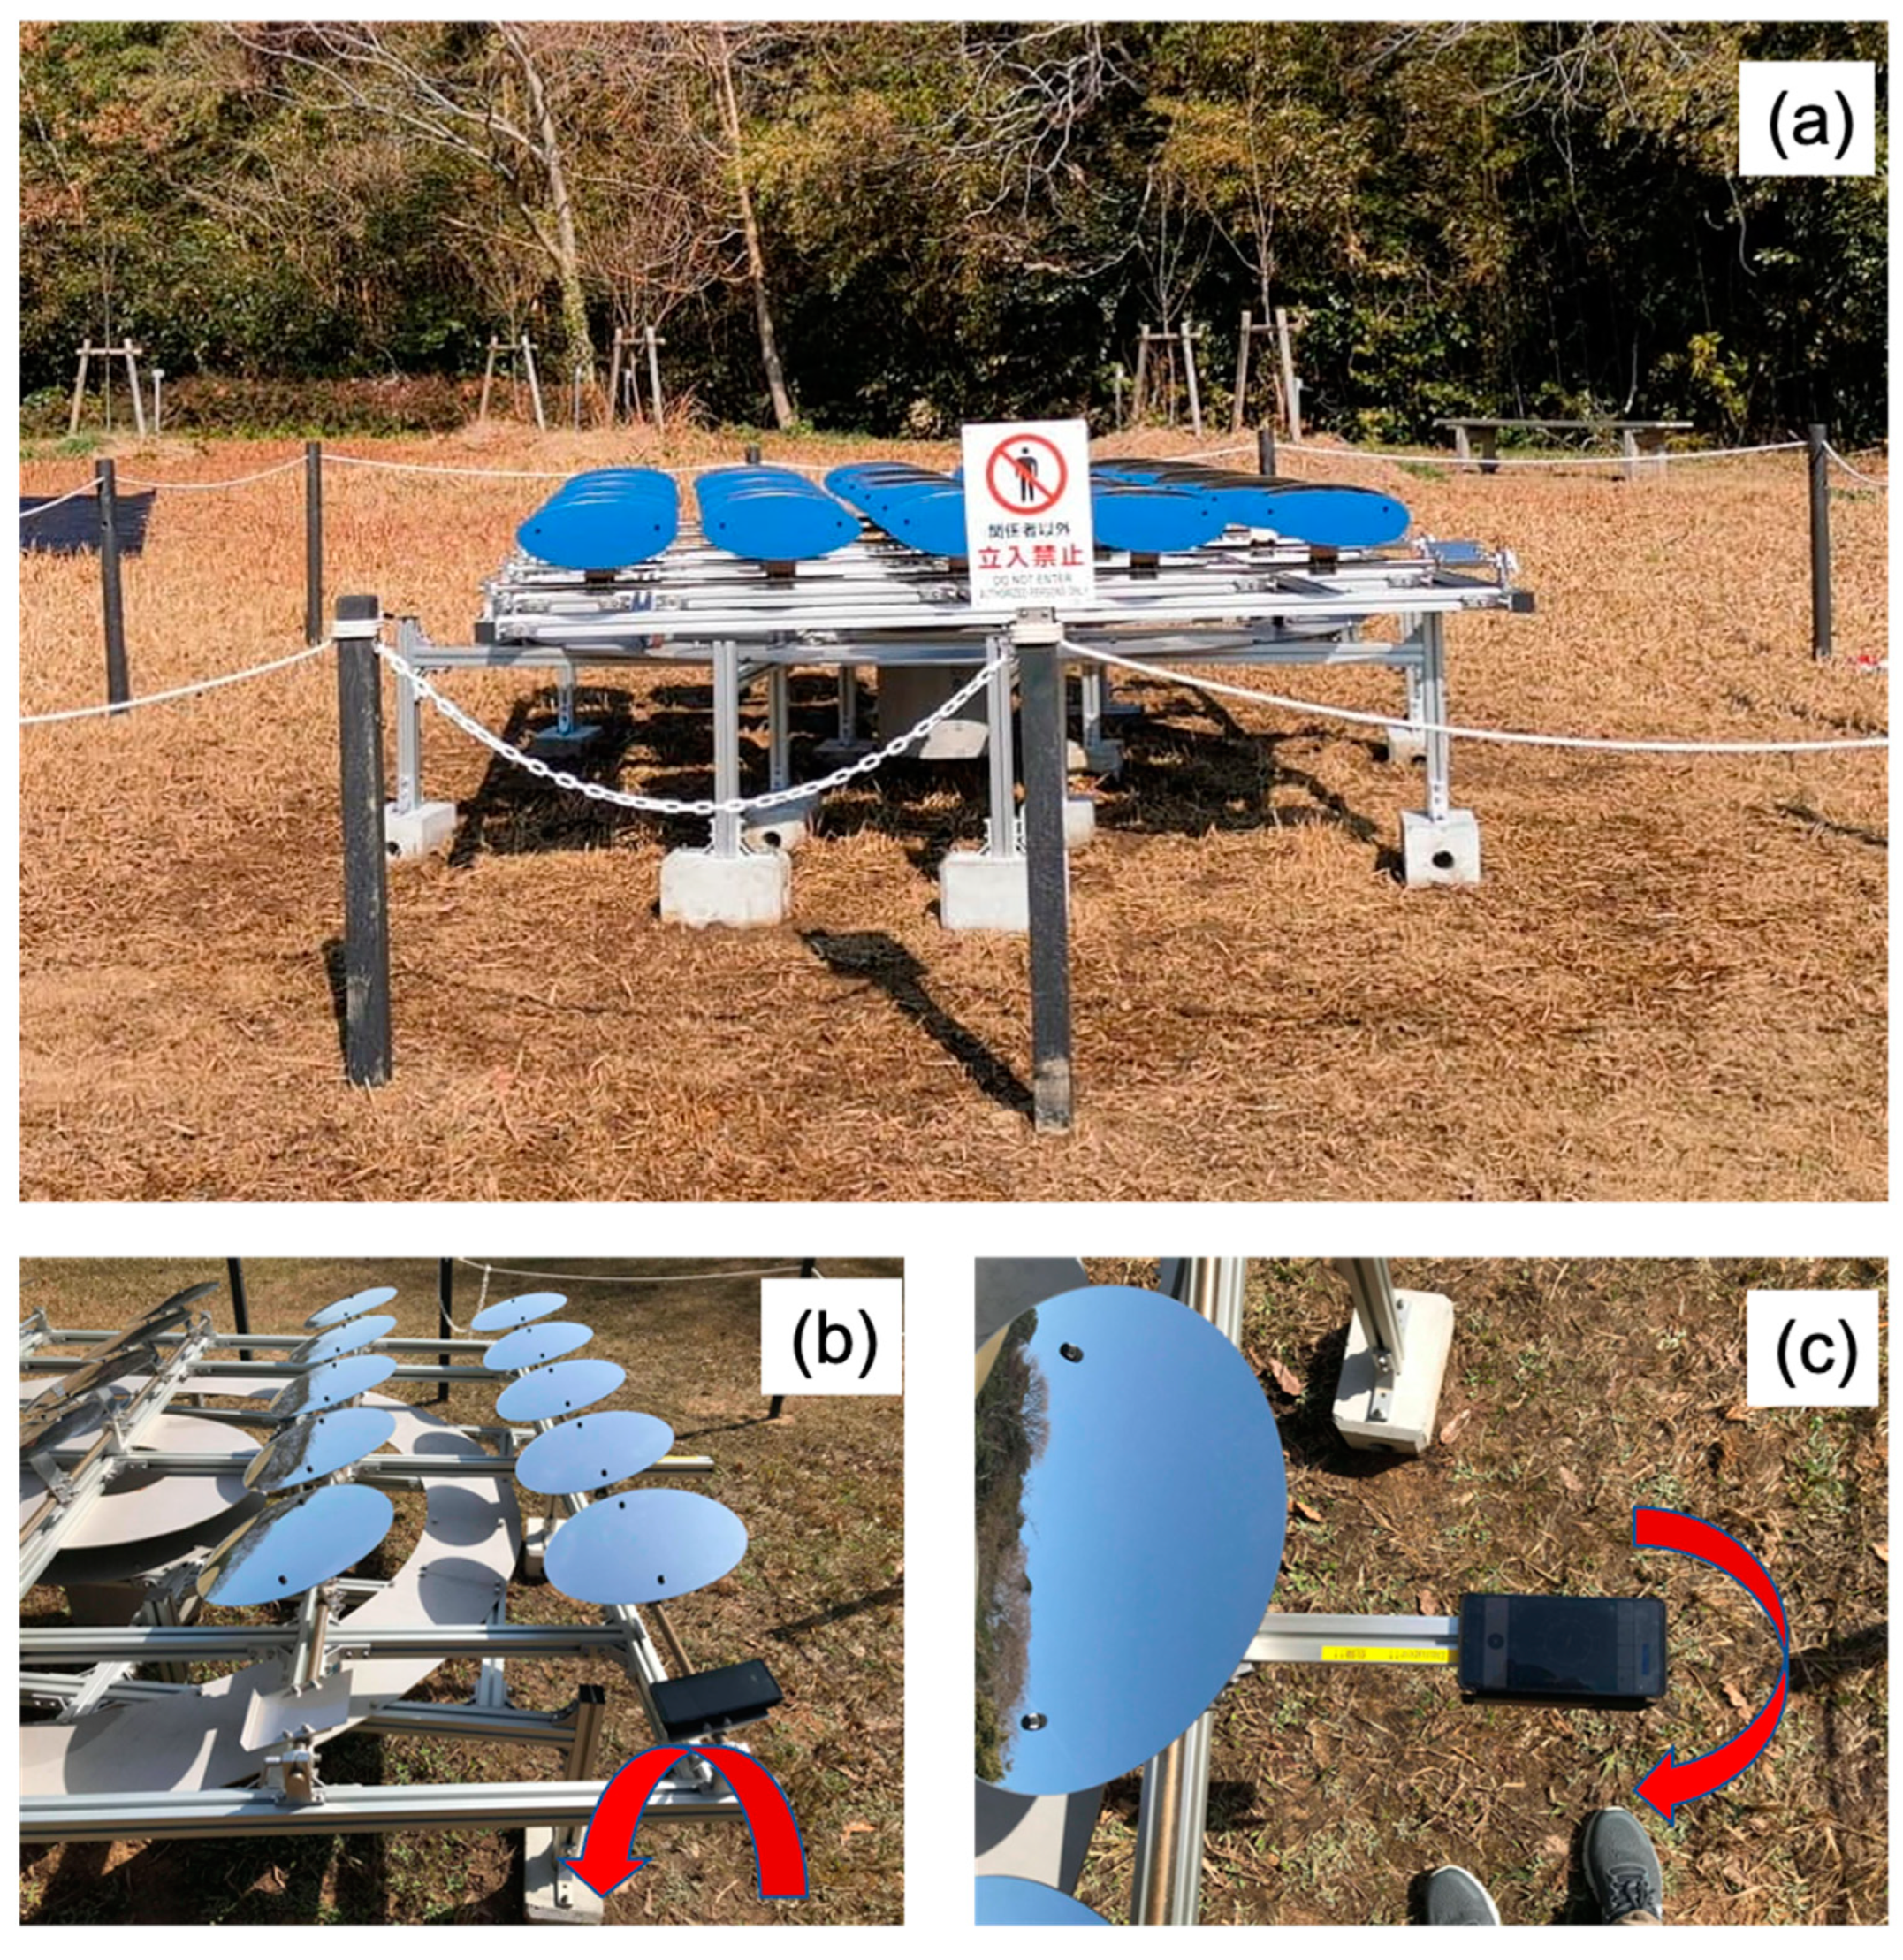
2.4. Mirror Array Development
3. Satellite Constellation, Images and Equipment Used
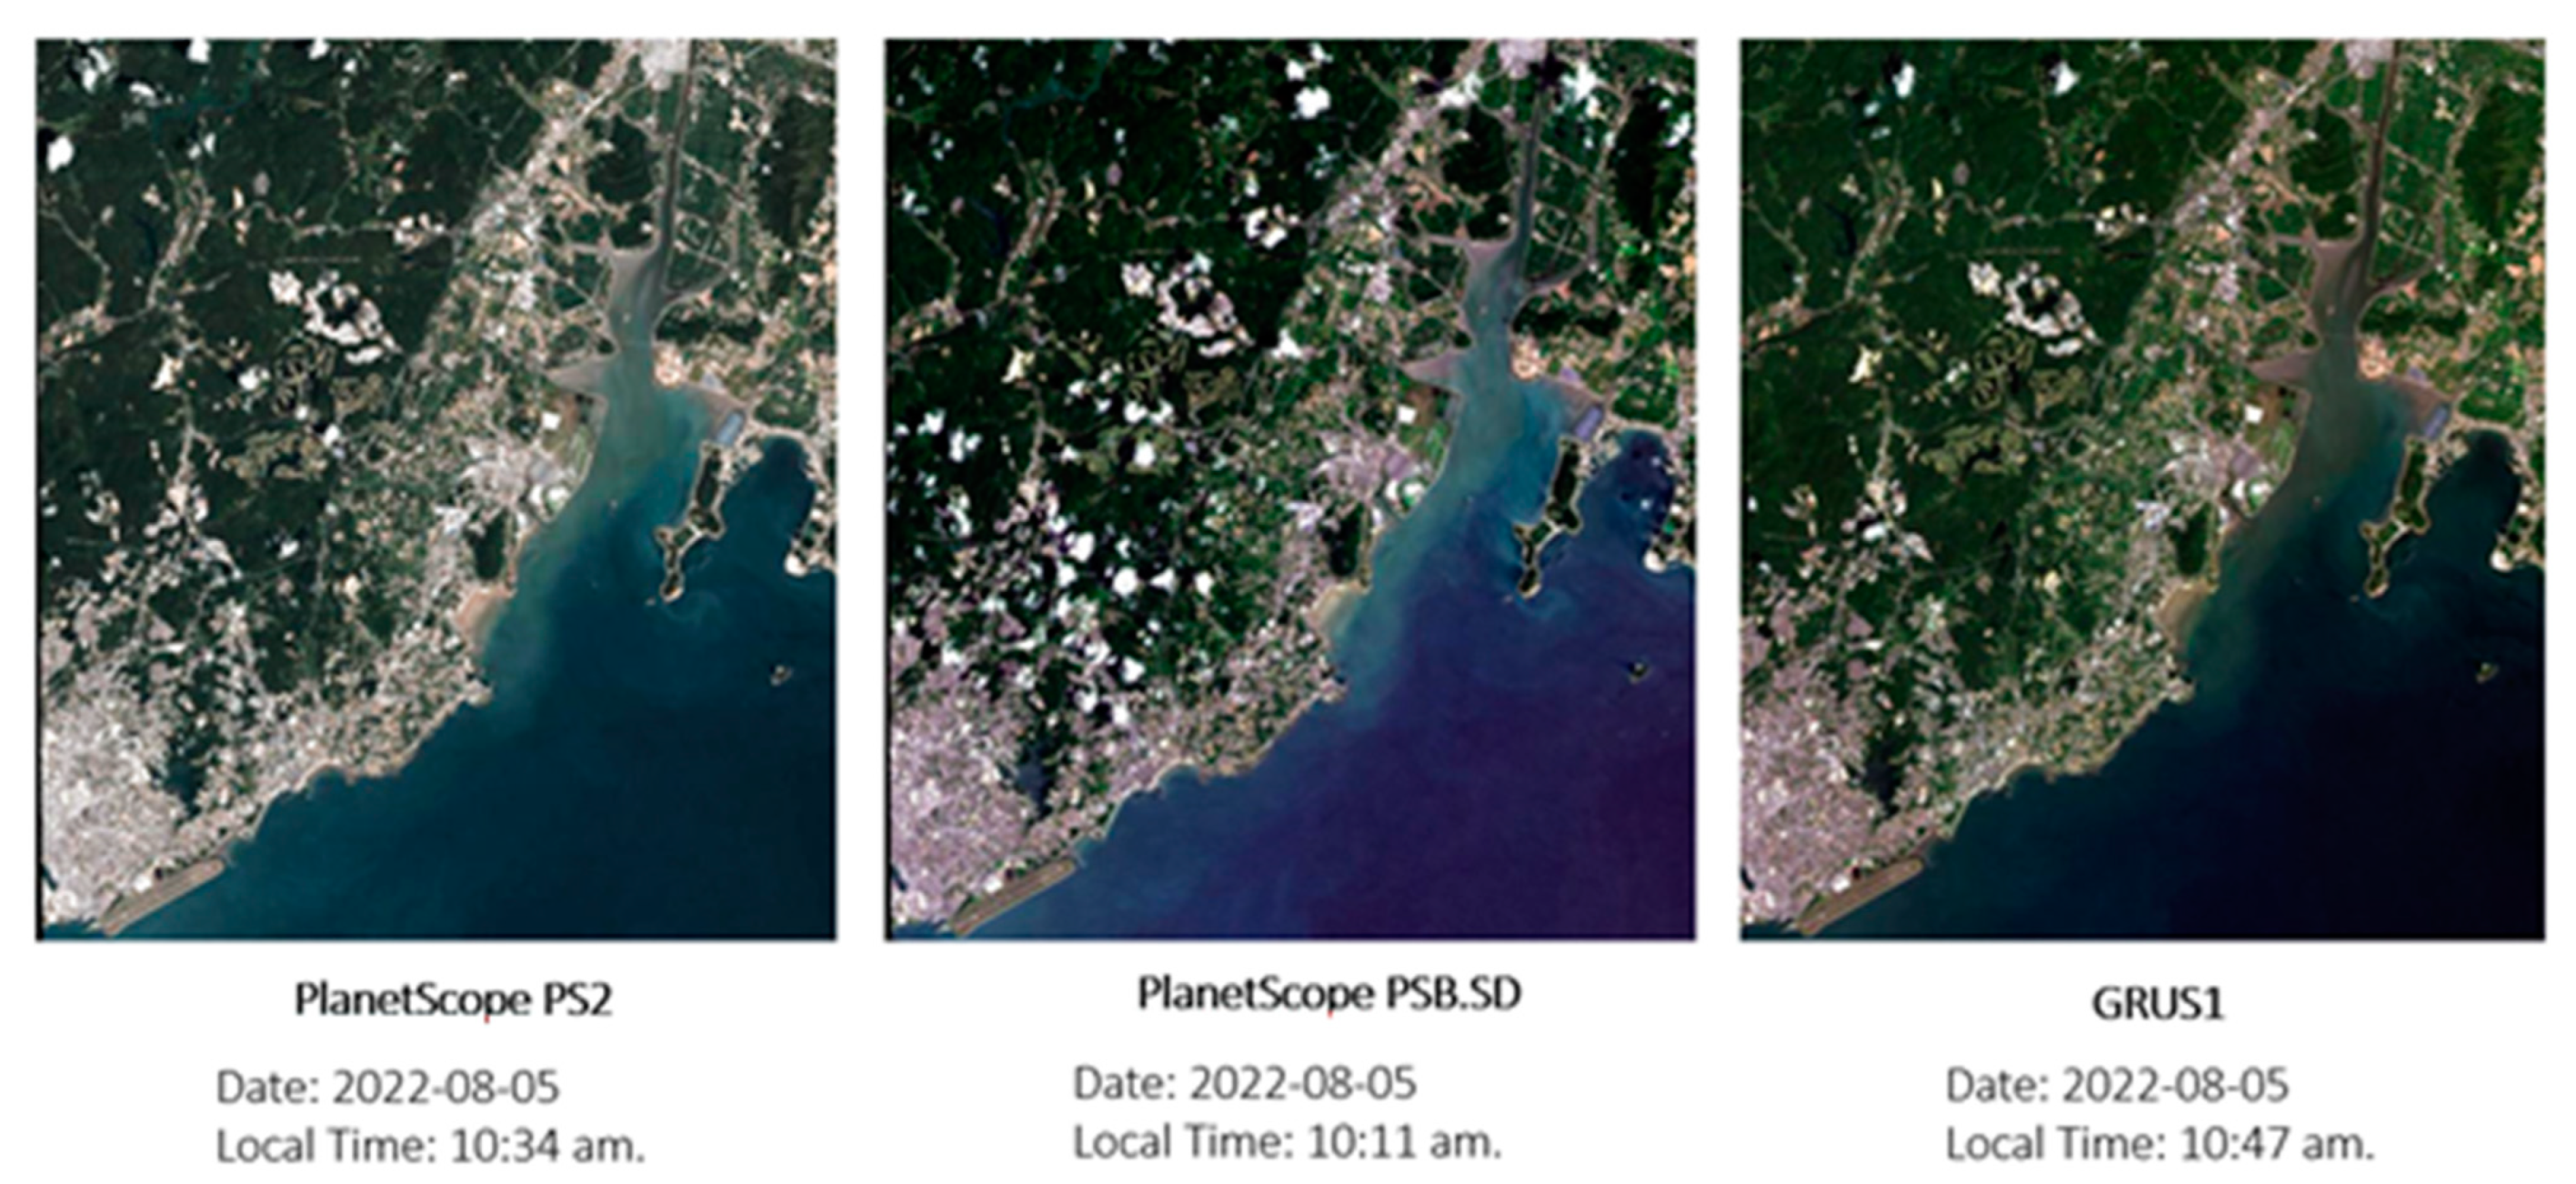
3.1. Details about Satellite Constellation Sensors and Images Used
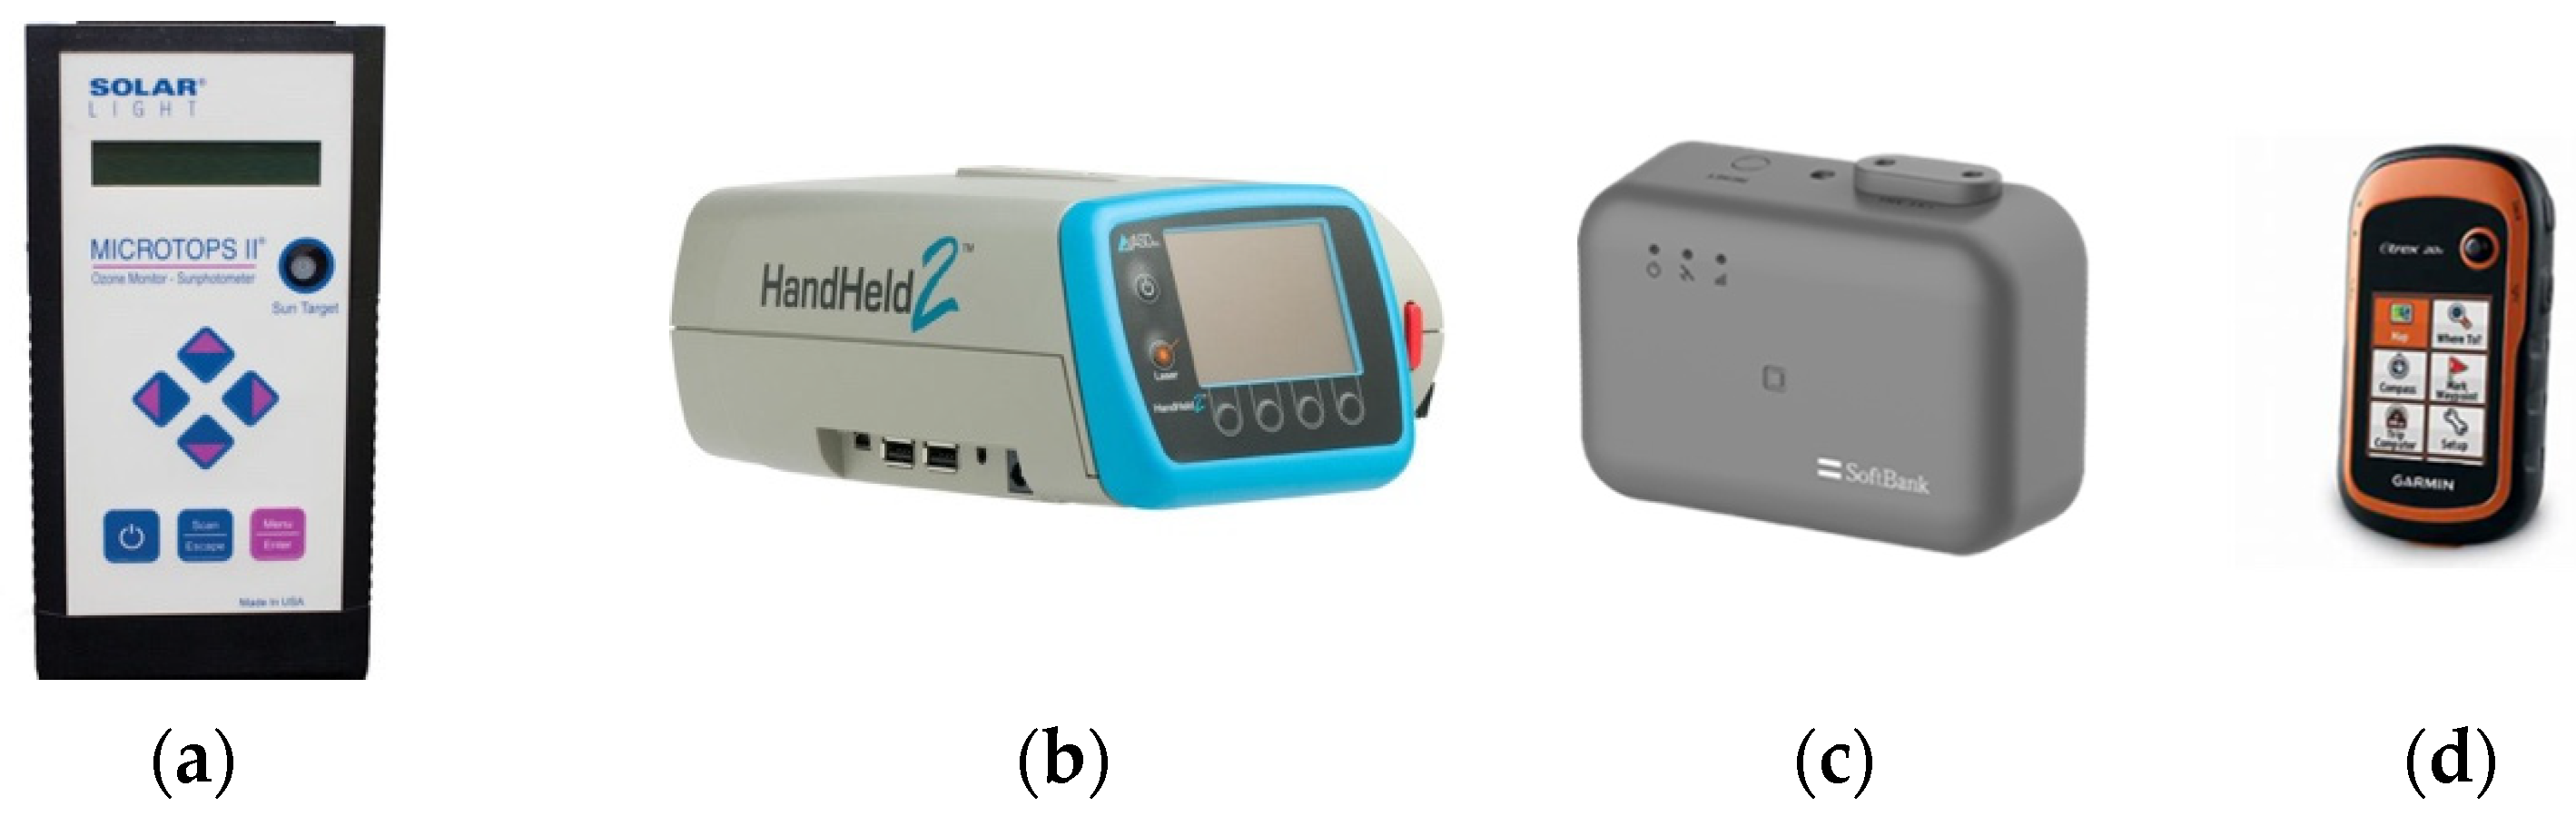
3.2. Equipment Used
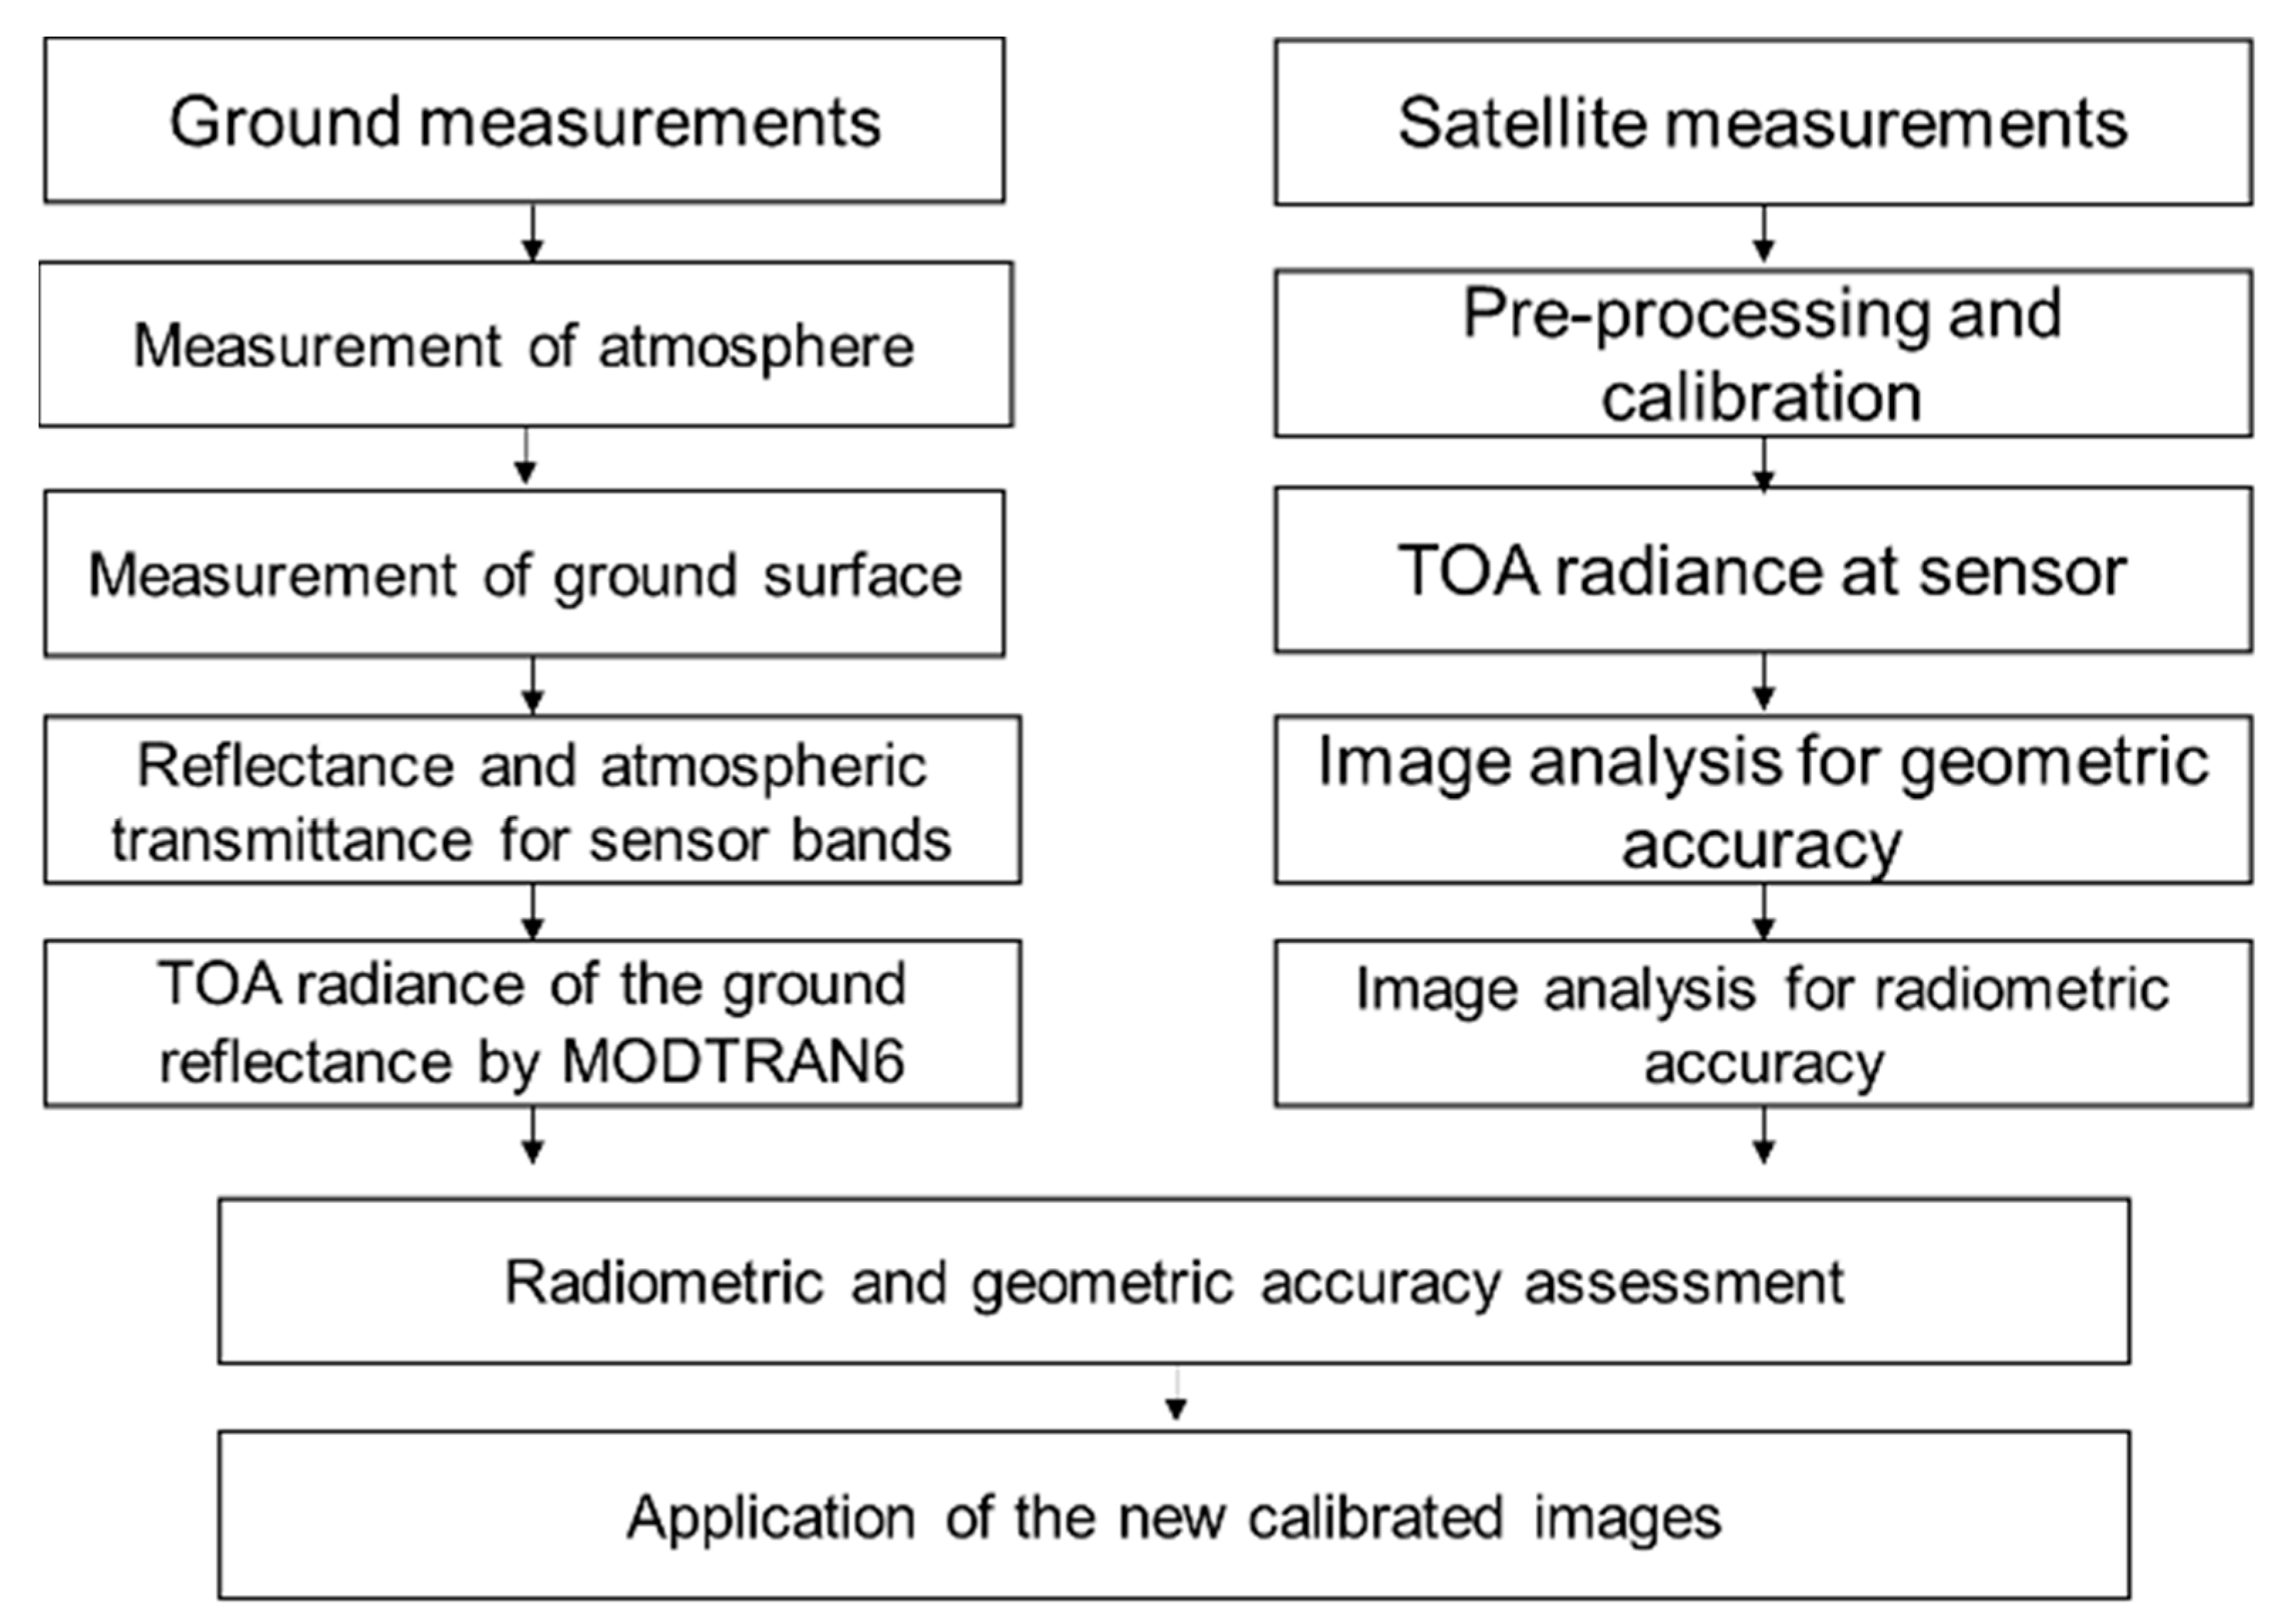
4. Methodology
4.1. Vicarious Calibration through Ground Point Surface Reflectance
4.2. Vicarious Calibration through Point Source Reflectance
4.3. Atmospheric Transmittance
4.3.1. The Extraterrestrial Constant
4.3.2. The Angstrom Coefficient
4.4. Satellite Images Analysis
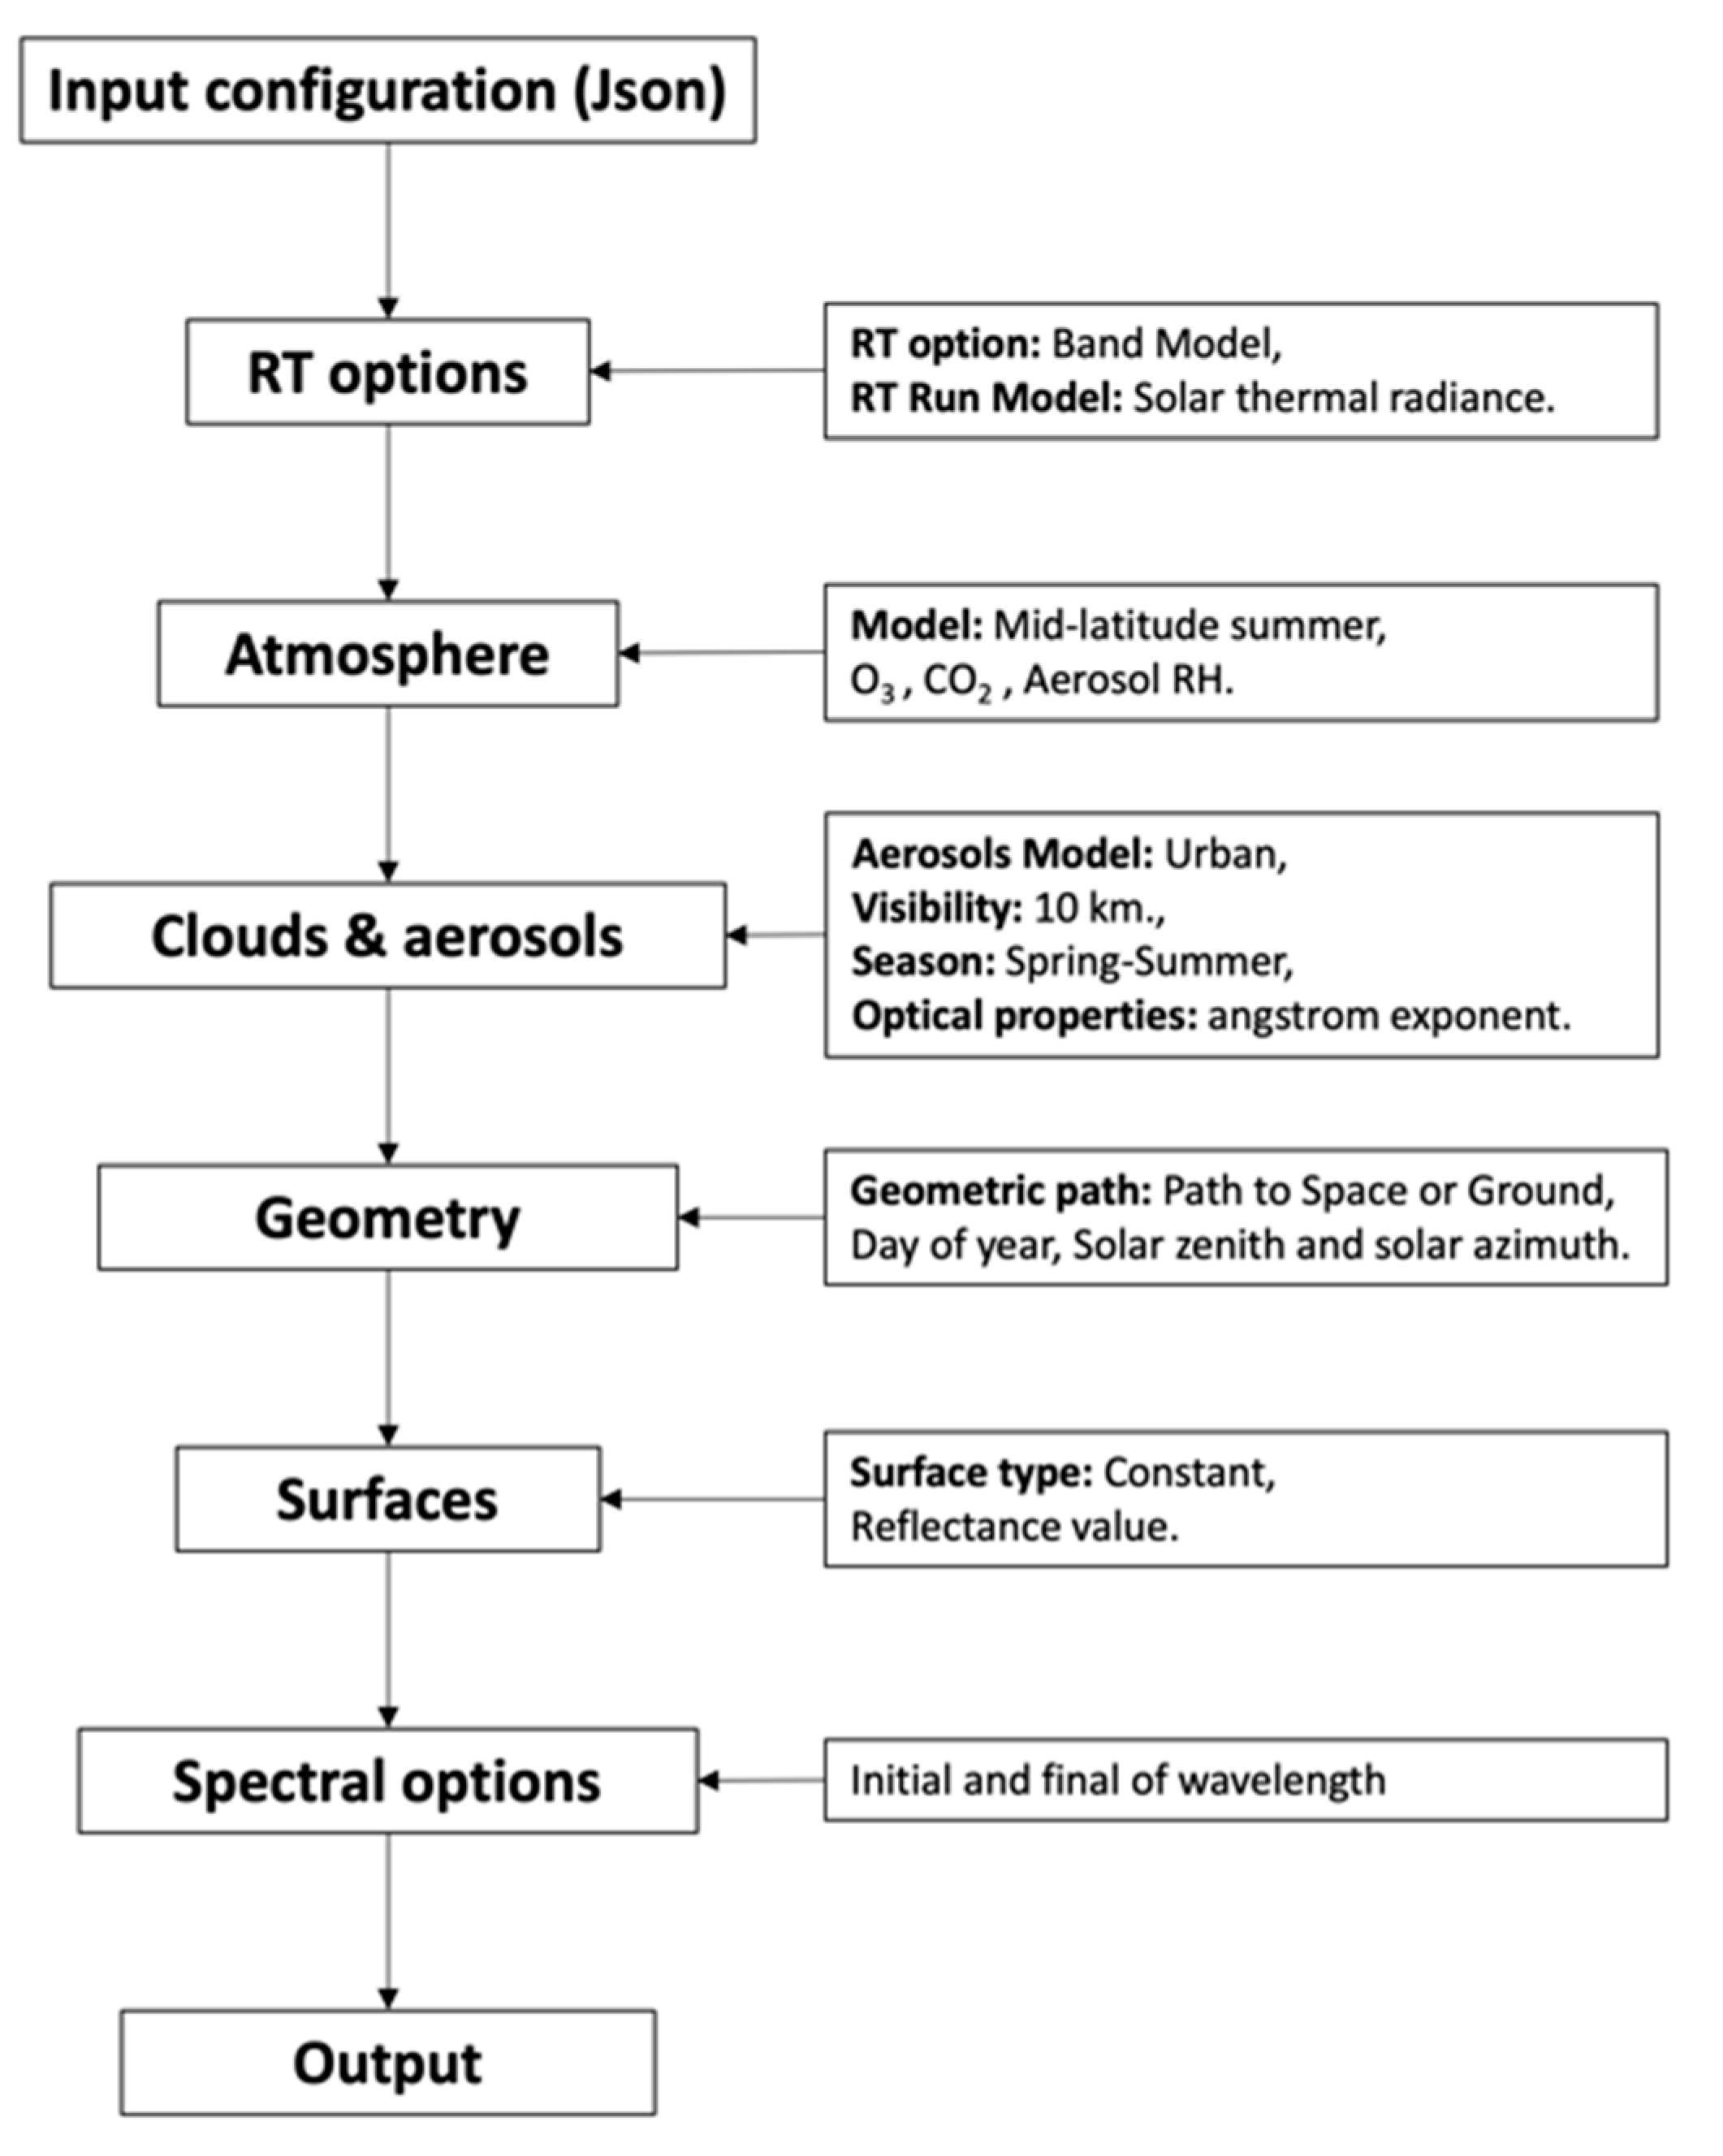
4.5. TOA Radiance Estimation by MODTRAN
- RT options: the multiple scattering DISORT (DIScrete Ordinate Radiative Transfer) model with solar and thermal radiances mode was selected.
- Atmosphere options: the mid-latitude summer model with other parameters such as H2O, O3, CO2 and aerosol RH was selected.
- Clouds and aerosol options: no clouds, urban model with optical depth value, spring-summer season with user-defined aerosols and optical properties estimated by Microtops II 521&540 and Angstrom coefficient.
- Geometry options: path to space or ground with properly calculated parameters such as observer and zenith, target, day of the year, Earth radius, solar zenith and azimuth angles.
- Surface options: Lambertian surface type with the ground-measured reflectance estimated in accordance with the satellite sensor’s bands.
- Spectral options: band spectral characteristics including a width initial and final range with an increment, FWHM, wavelength unit, plot out file and spectral response function of the satellite bands. The input data for running MODTRAN6 are given in a JSON file (Appendix A).
5. Experiment Results
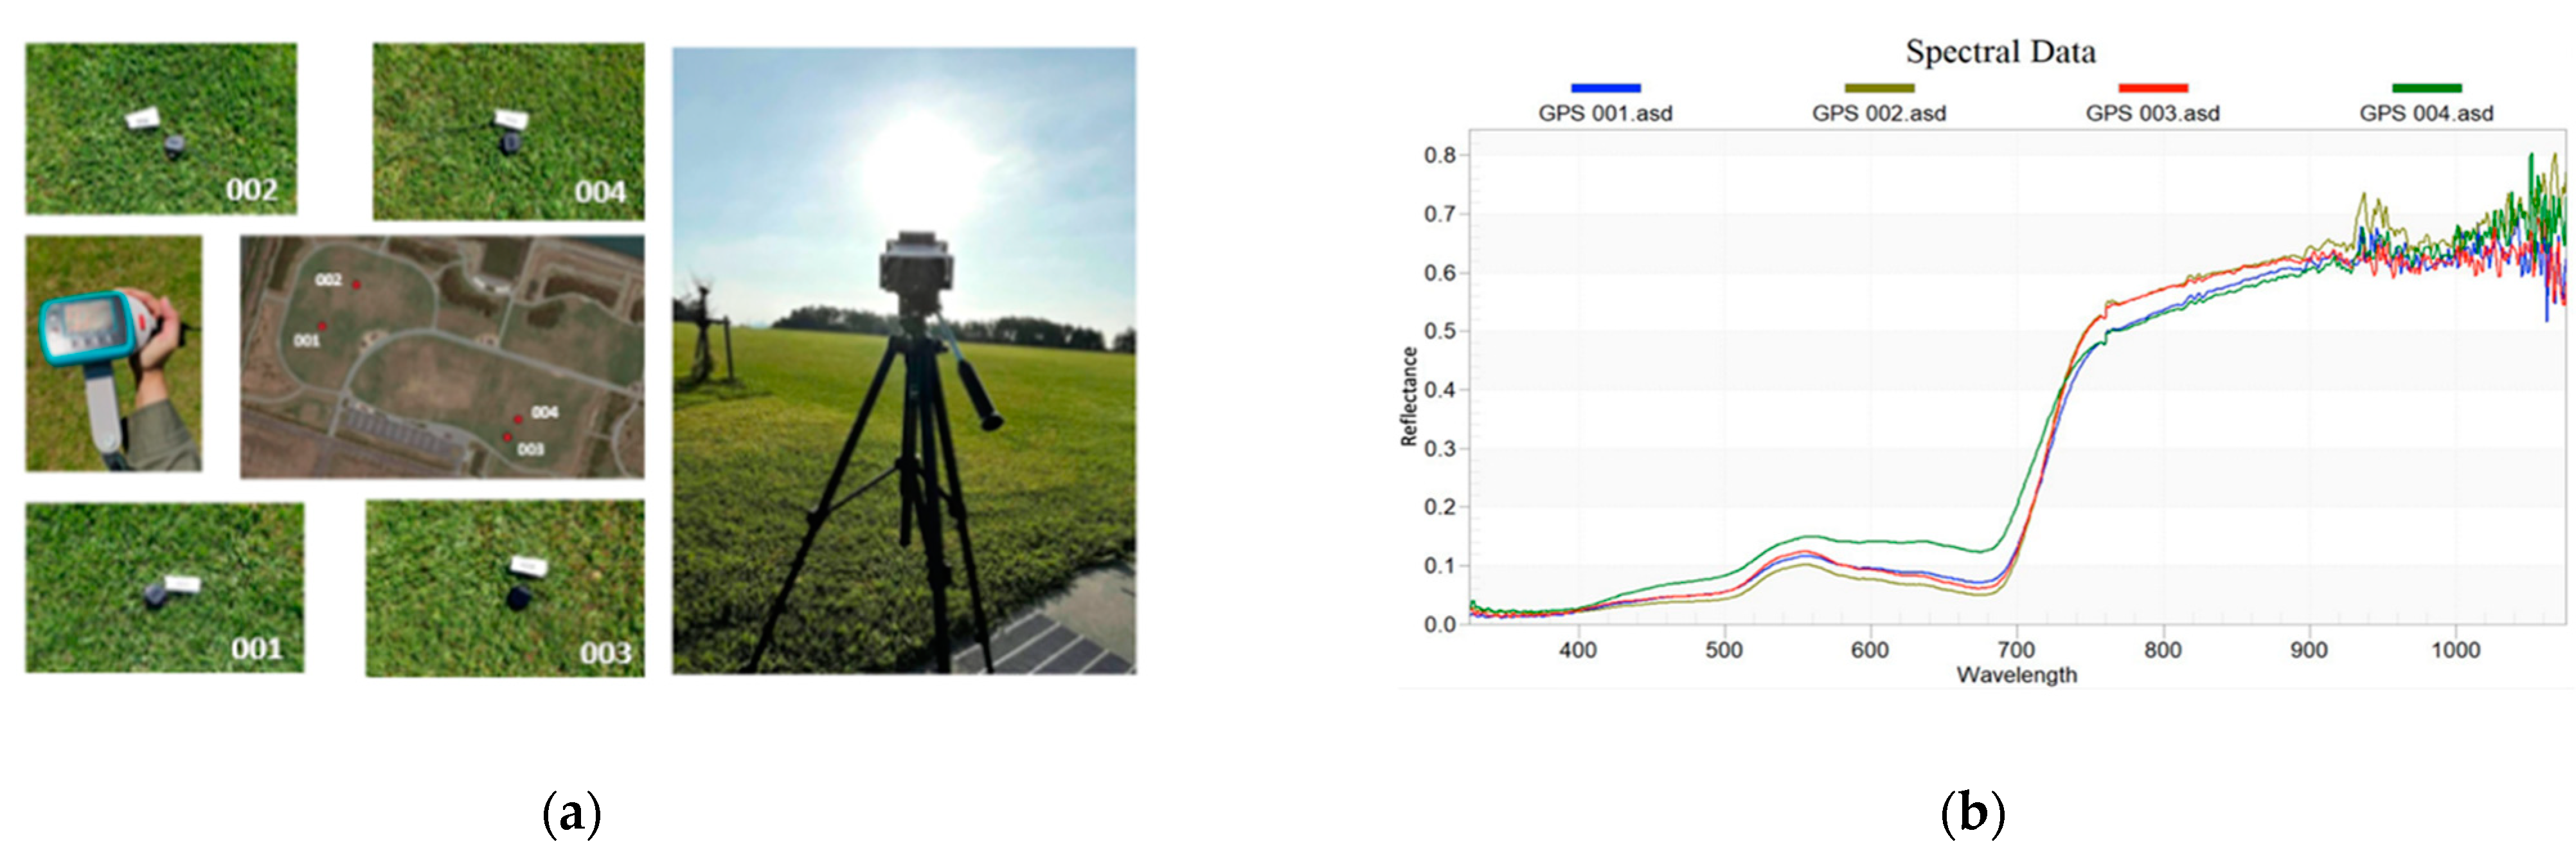
5.1. Data Collection at the Ground Surface
5.2. Atmospheric Measurements and Transmittance
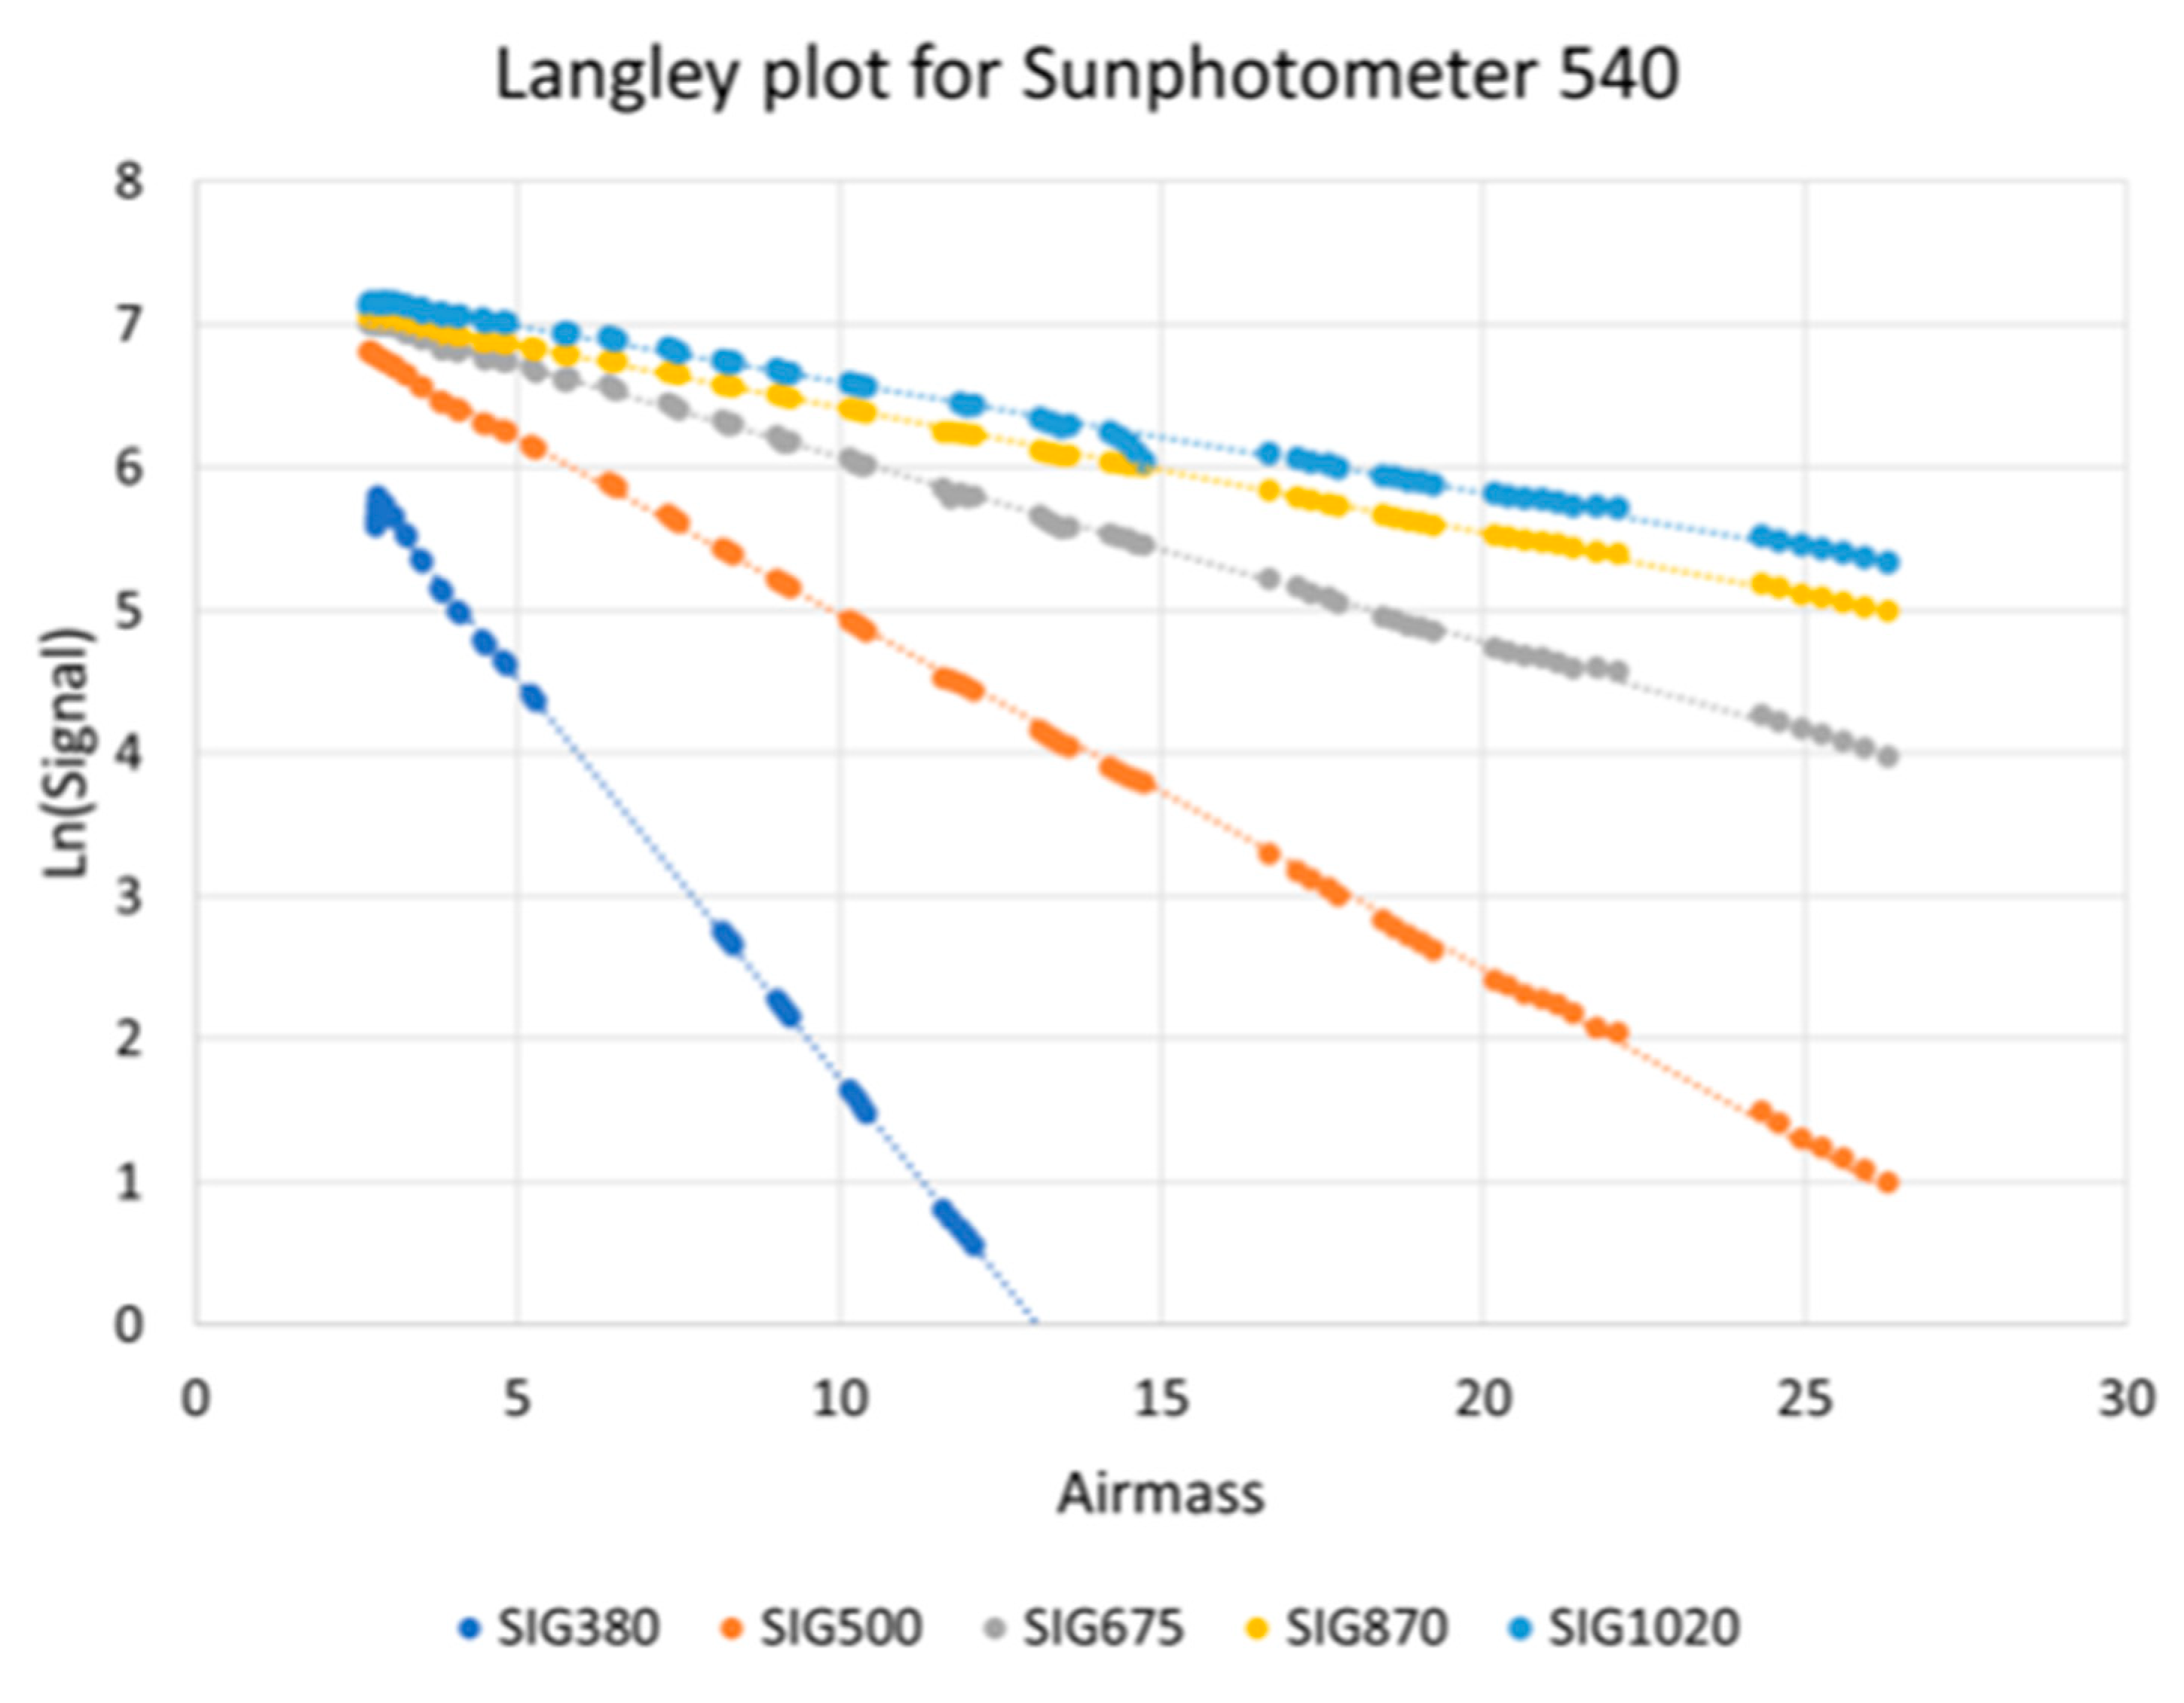
5.2.1. Langley Calibration of Microtops II Sunphotometer
5.2.2. Angstrom Coefficient
5.3. MODTRAN Simulation
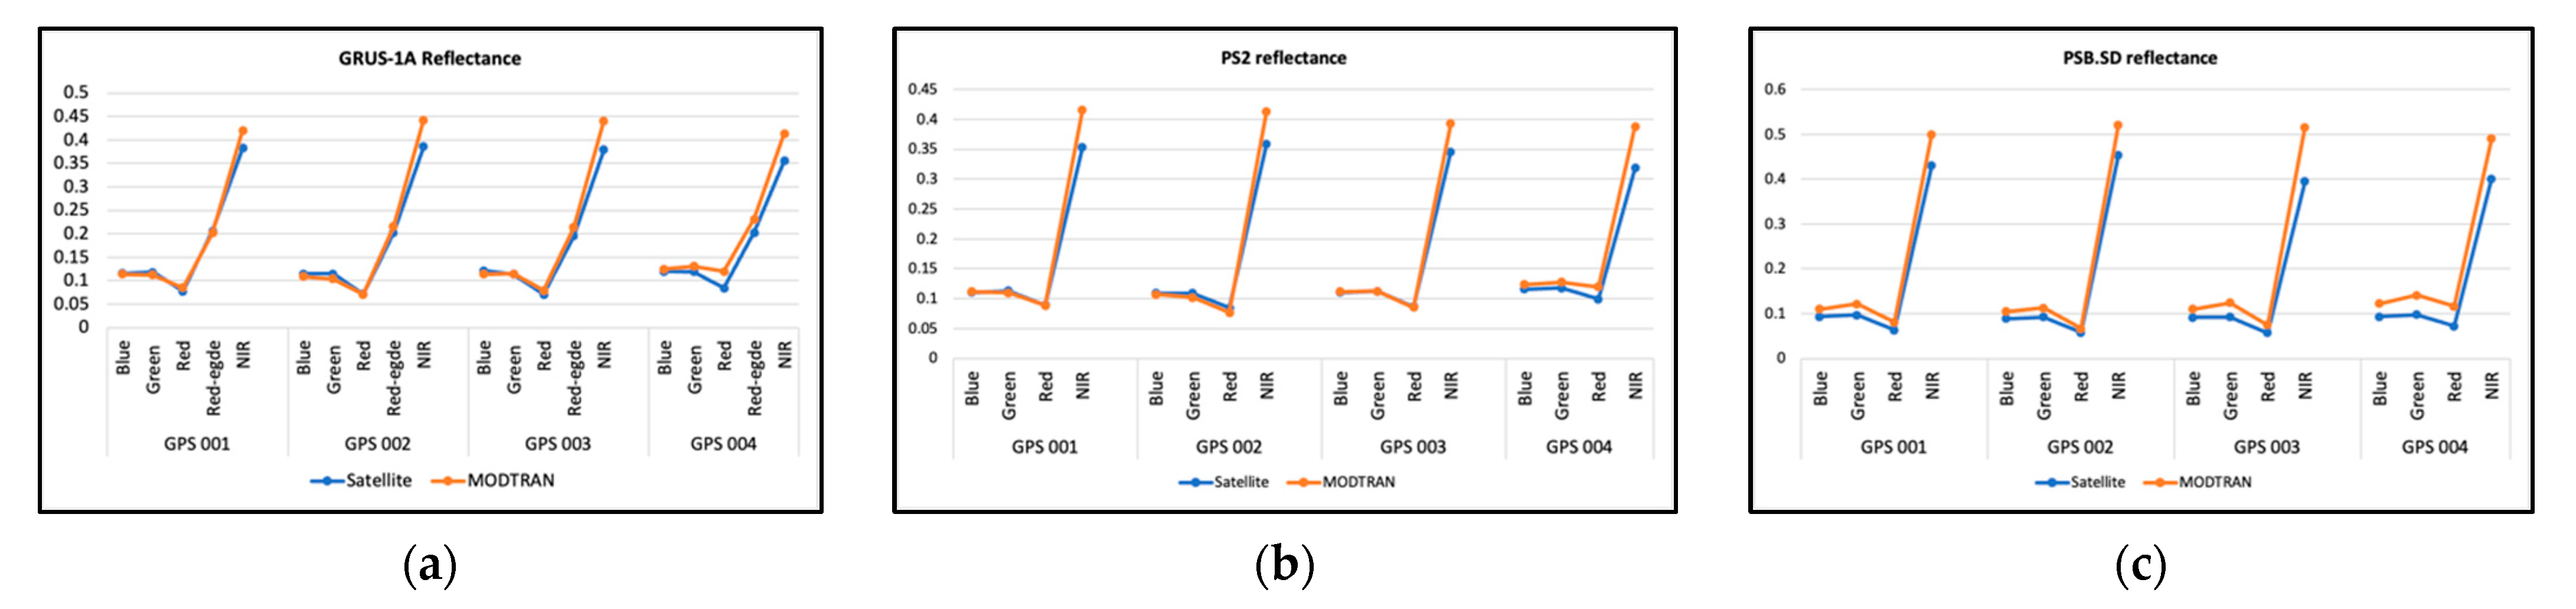
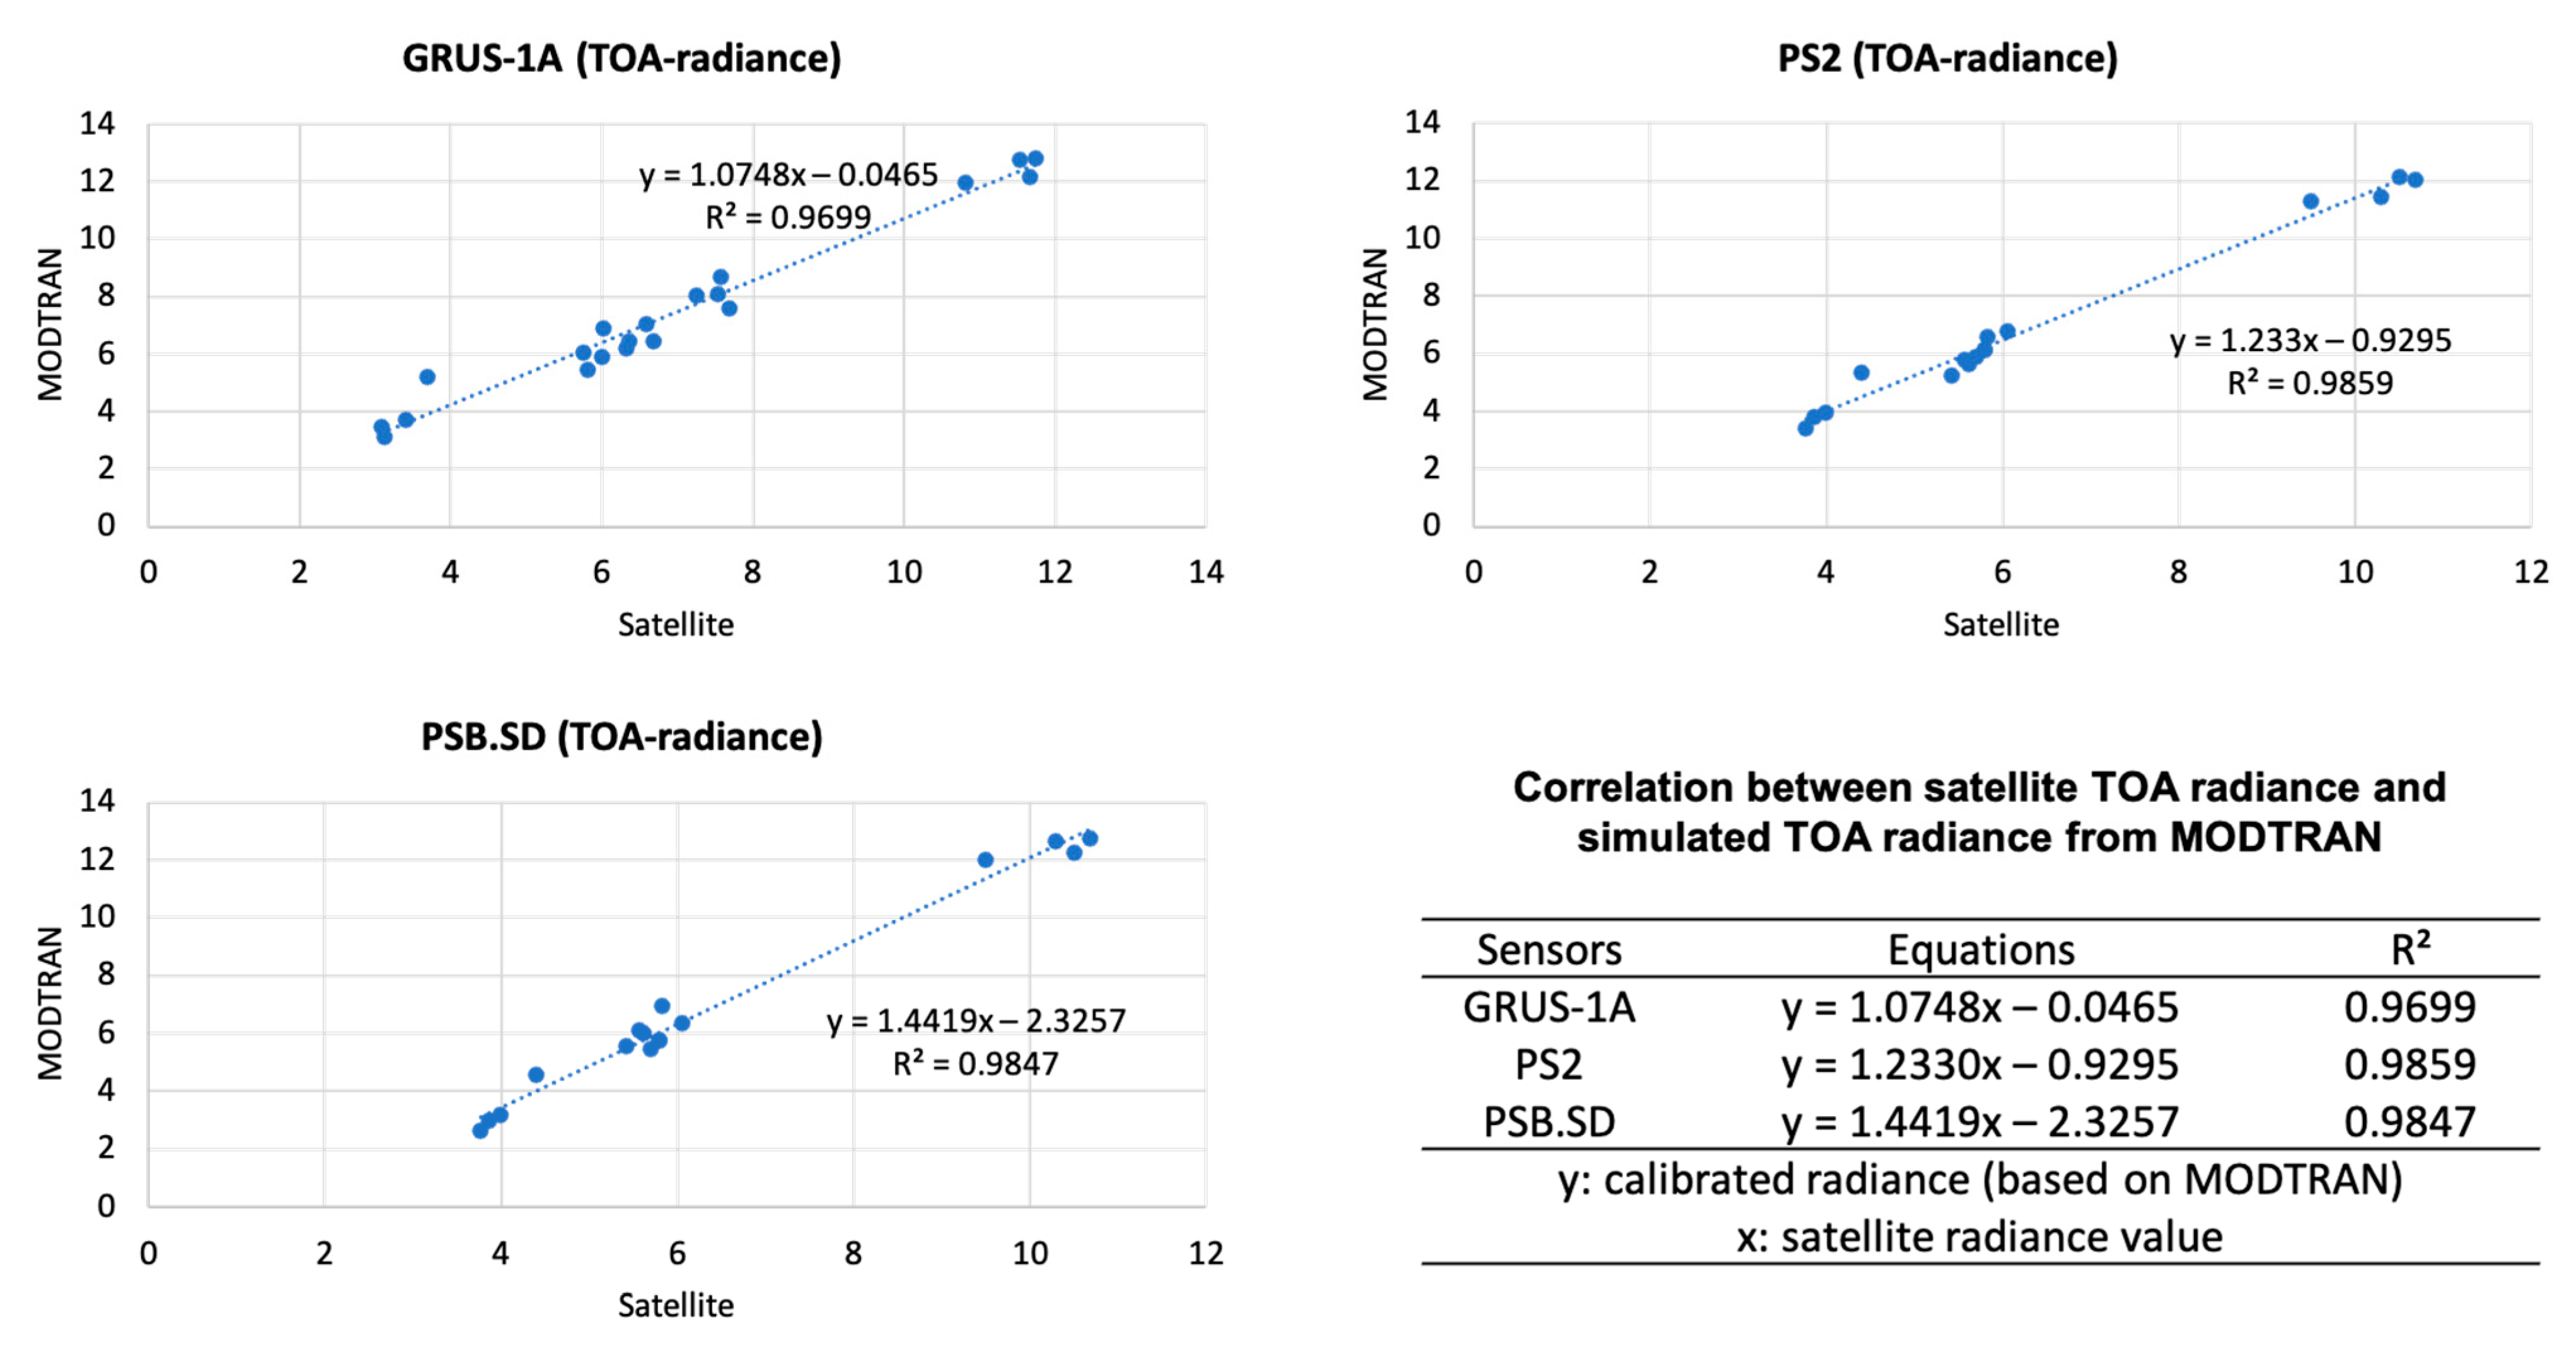
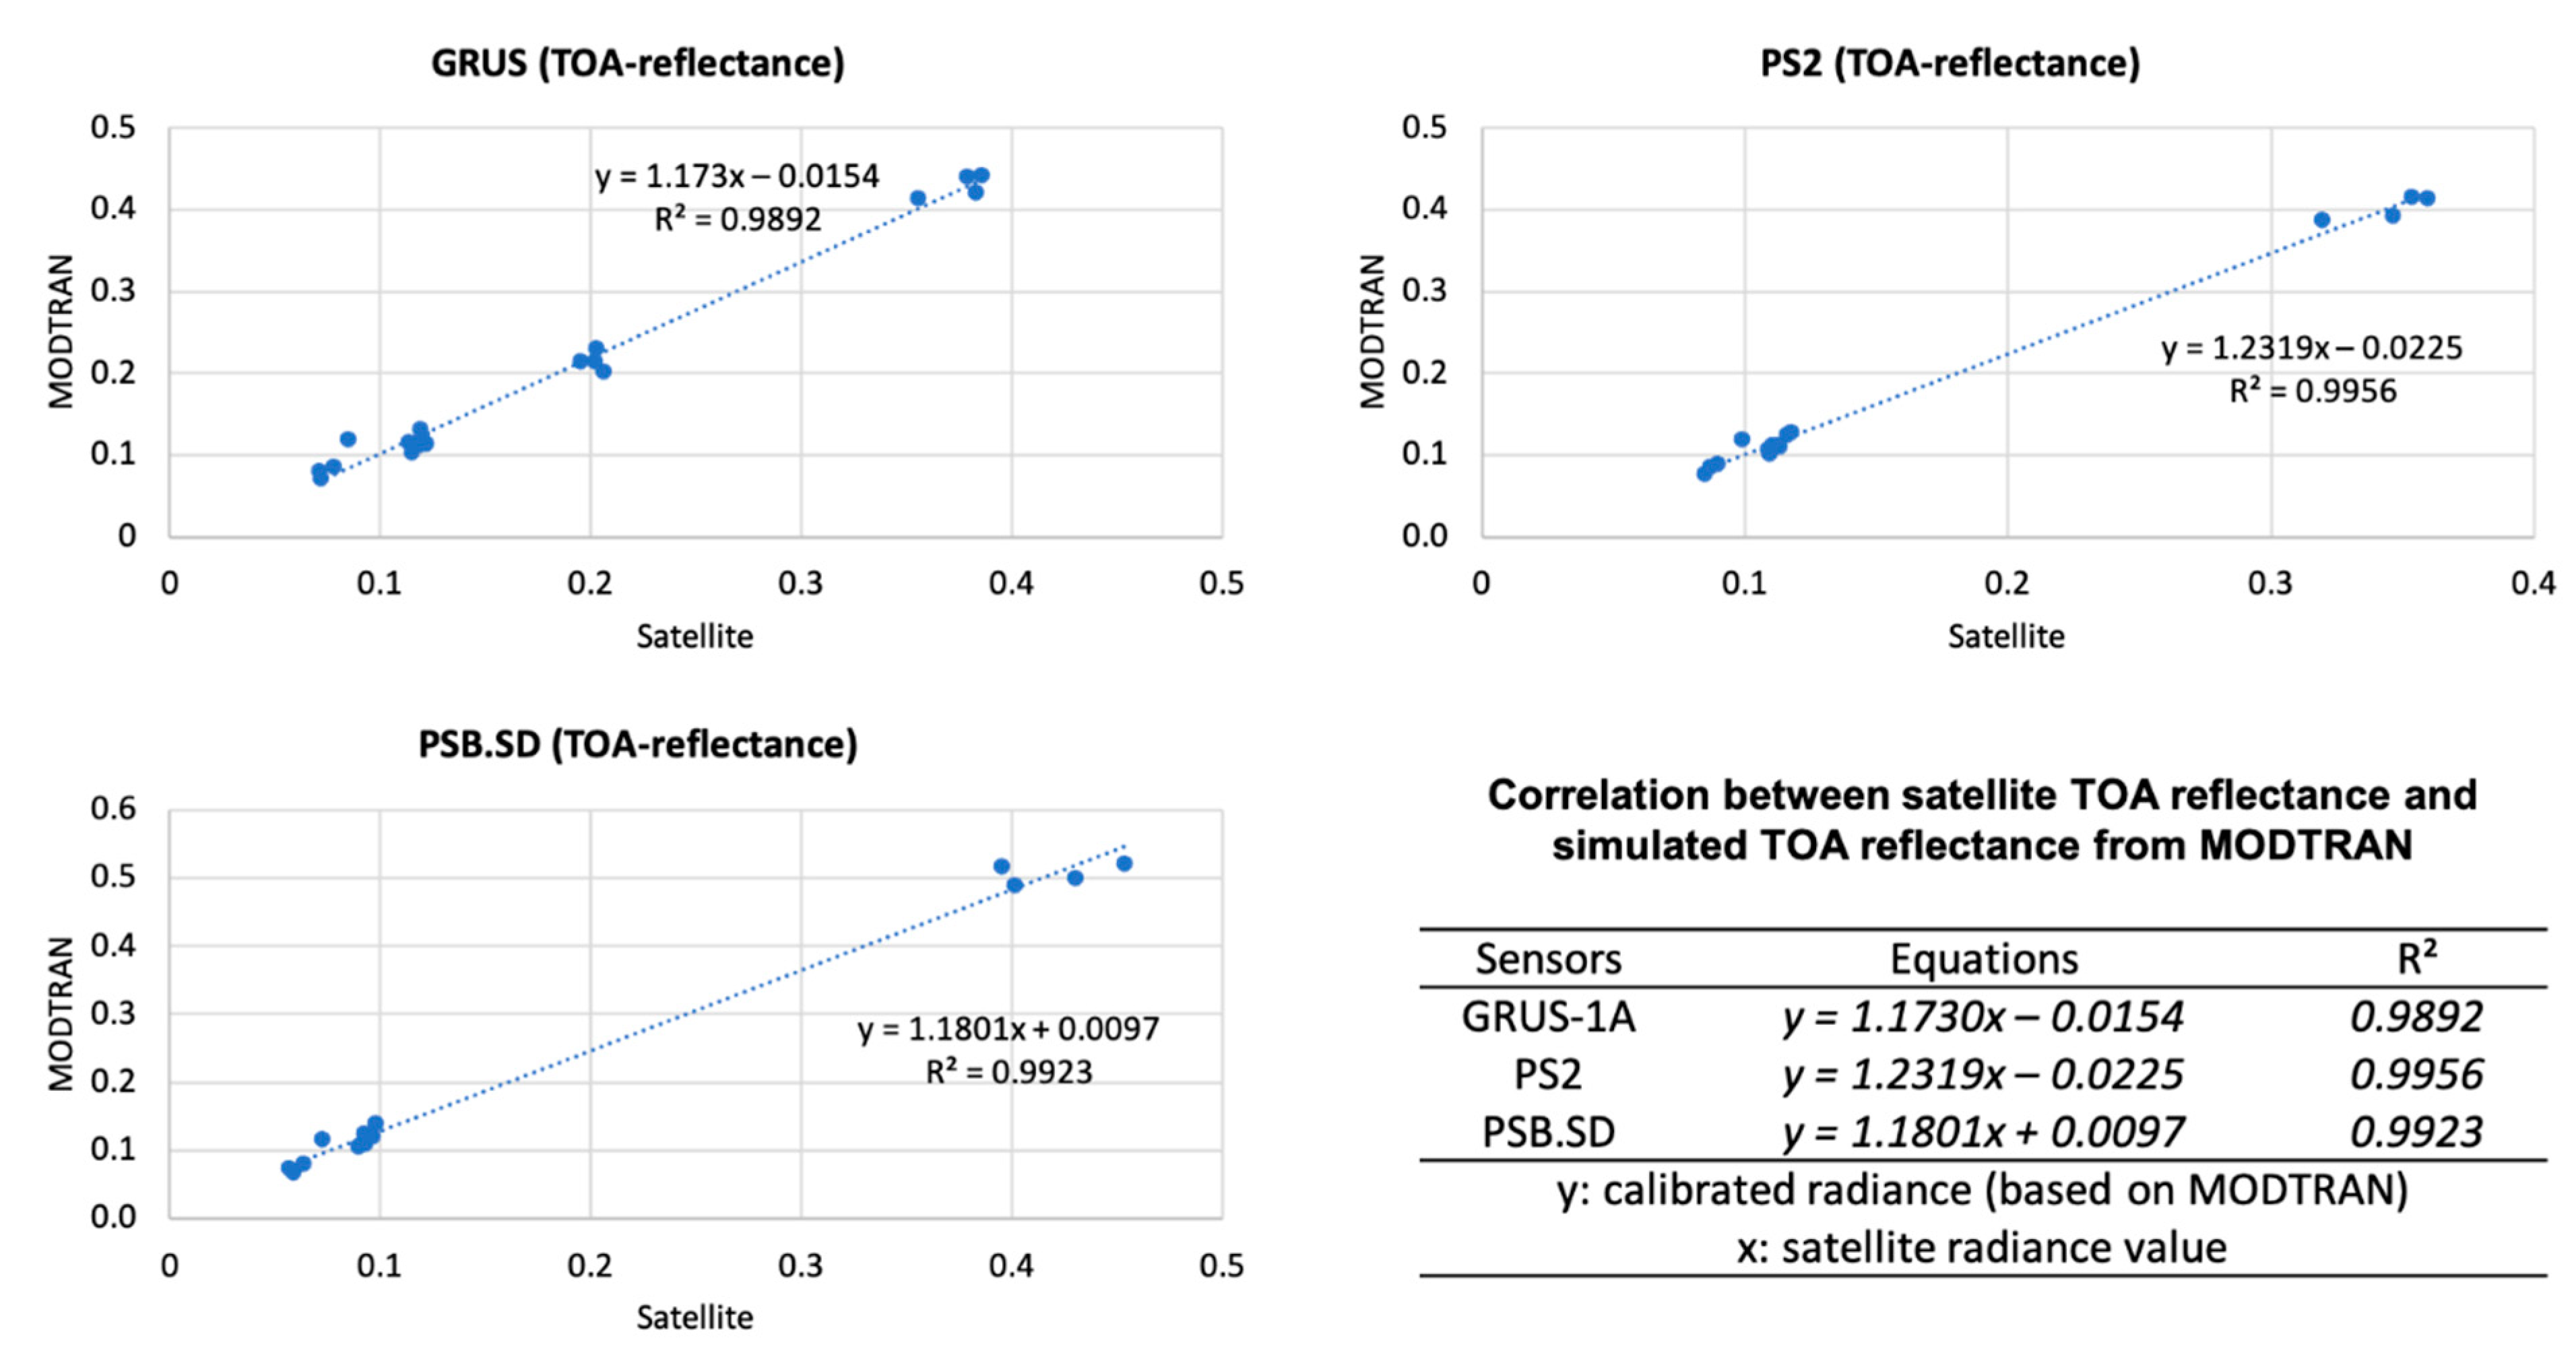
5.4. Comparison of Simulated MODTRAN and Satellites TOA
5.5. Calibration Coefficient Calculation for TOA Radiance and Reflectance
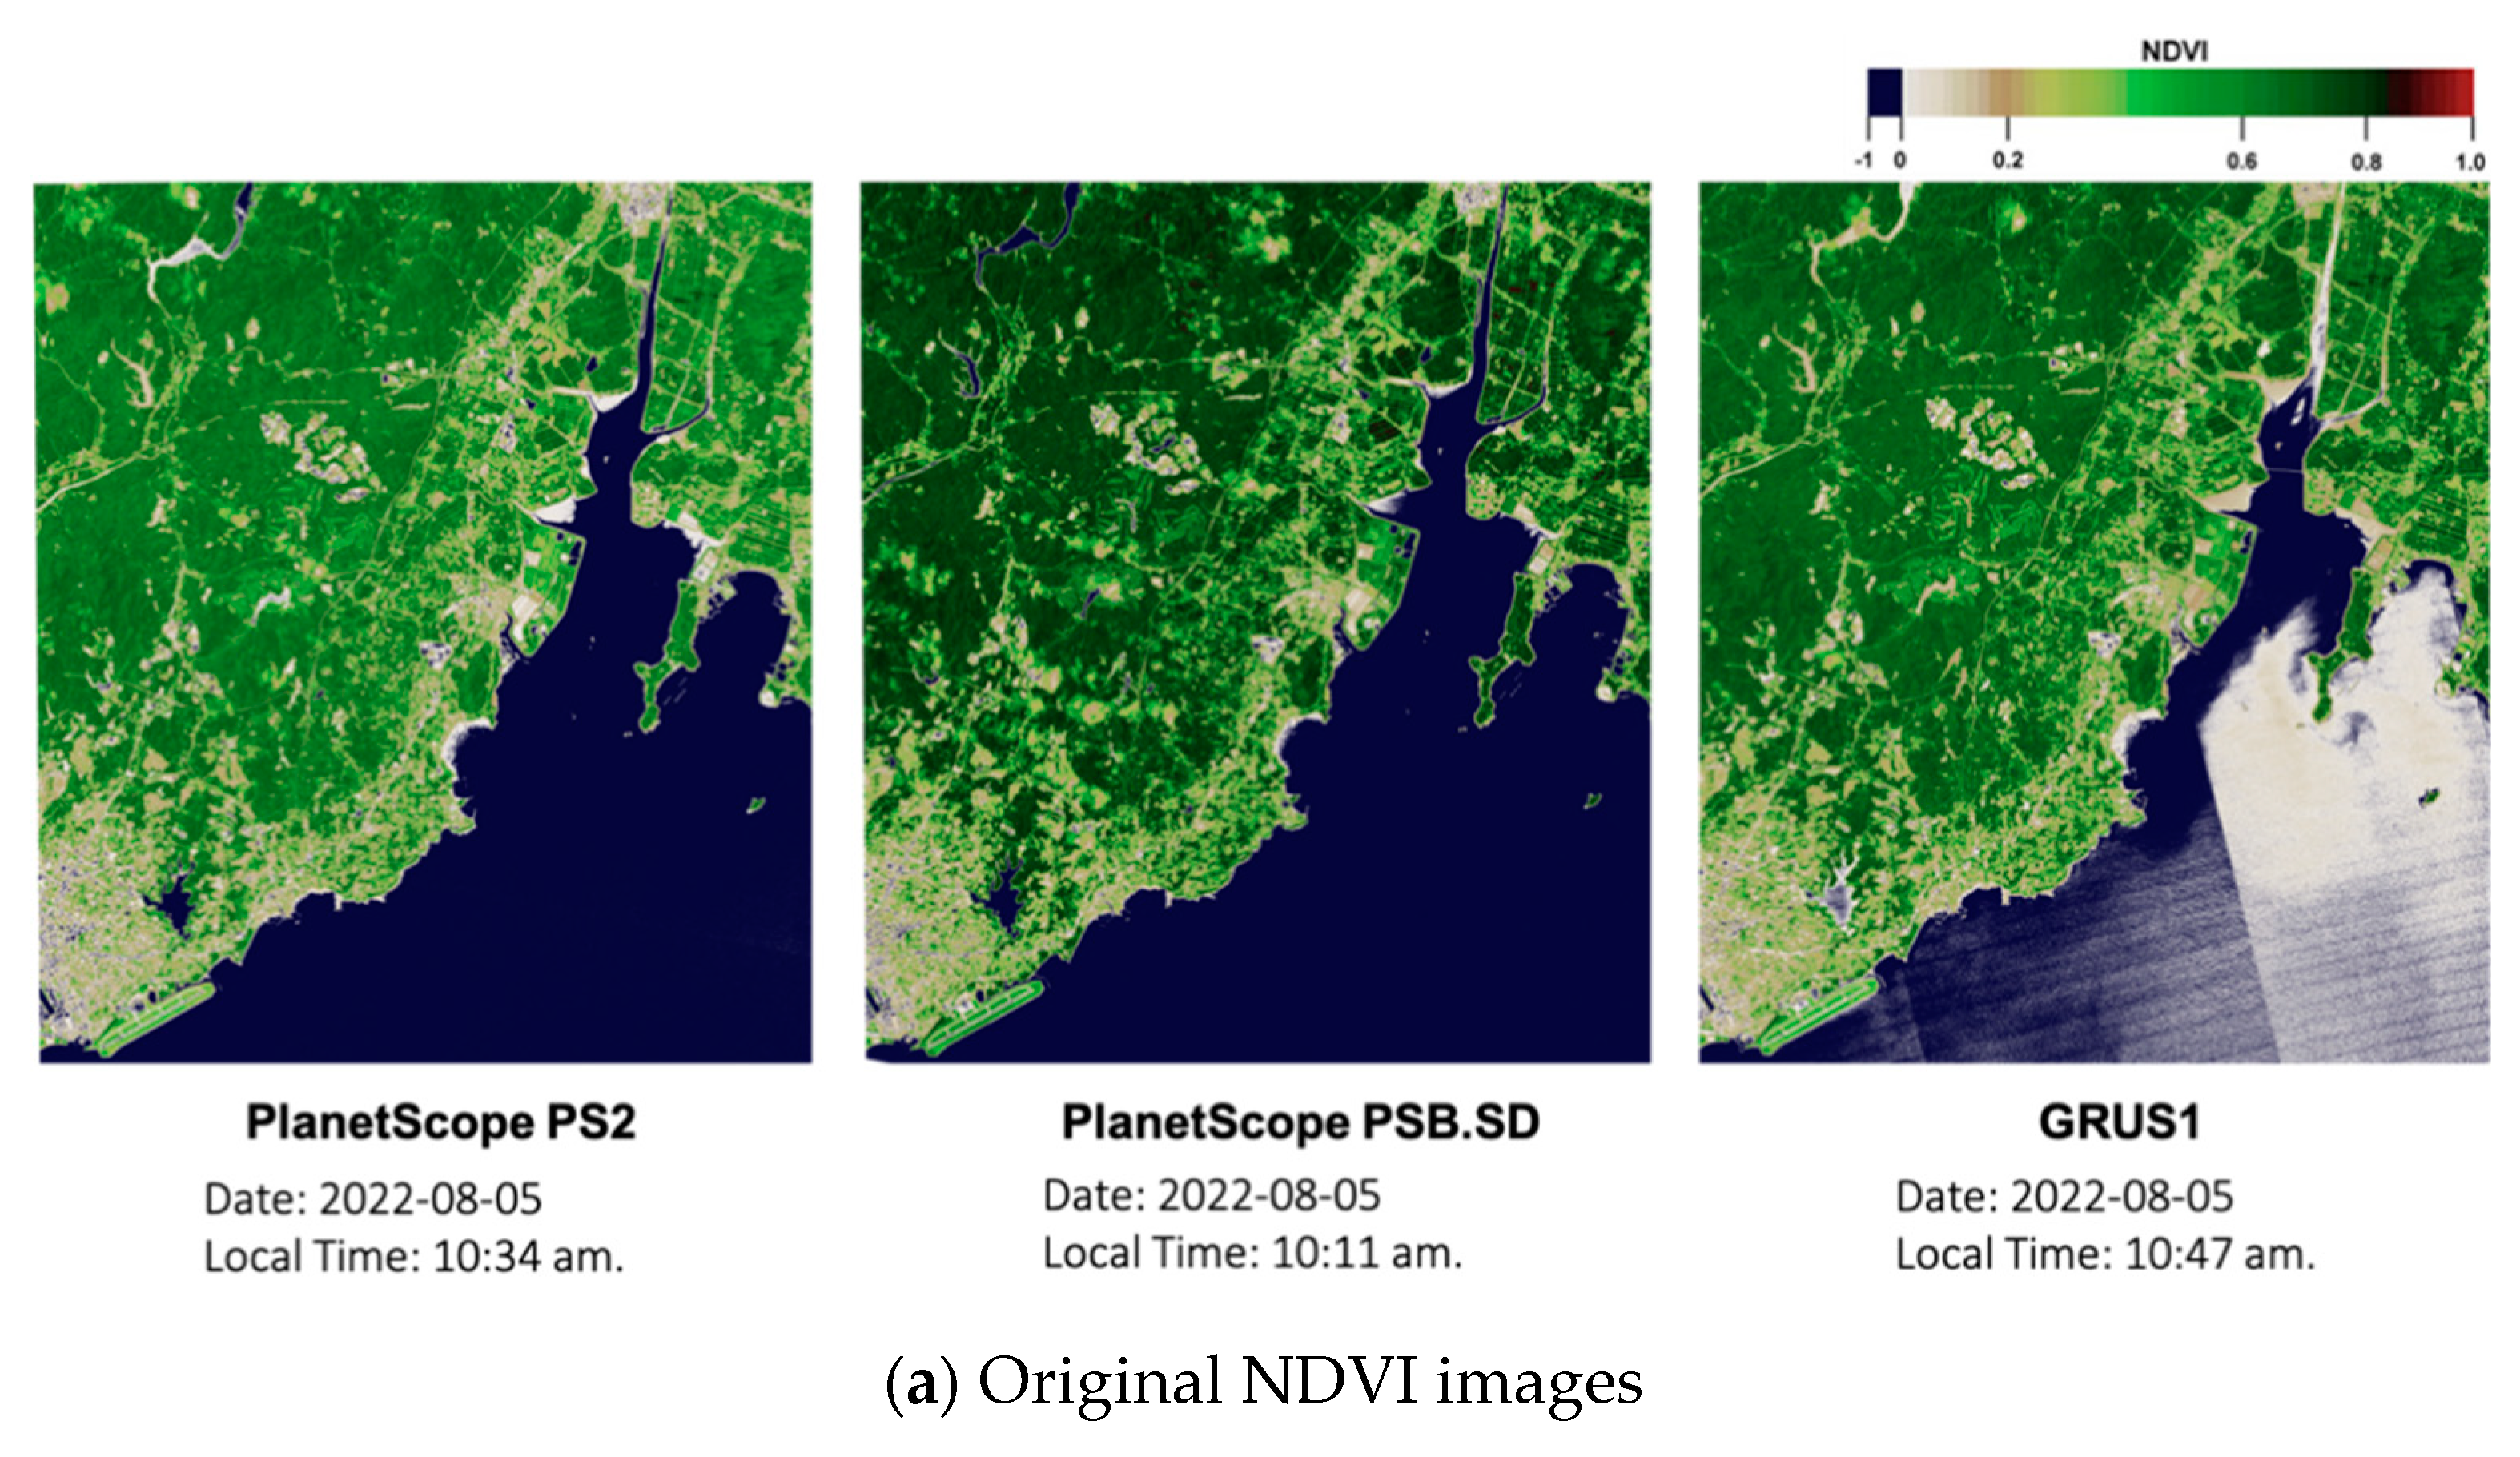
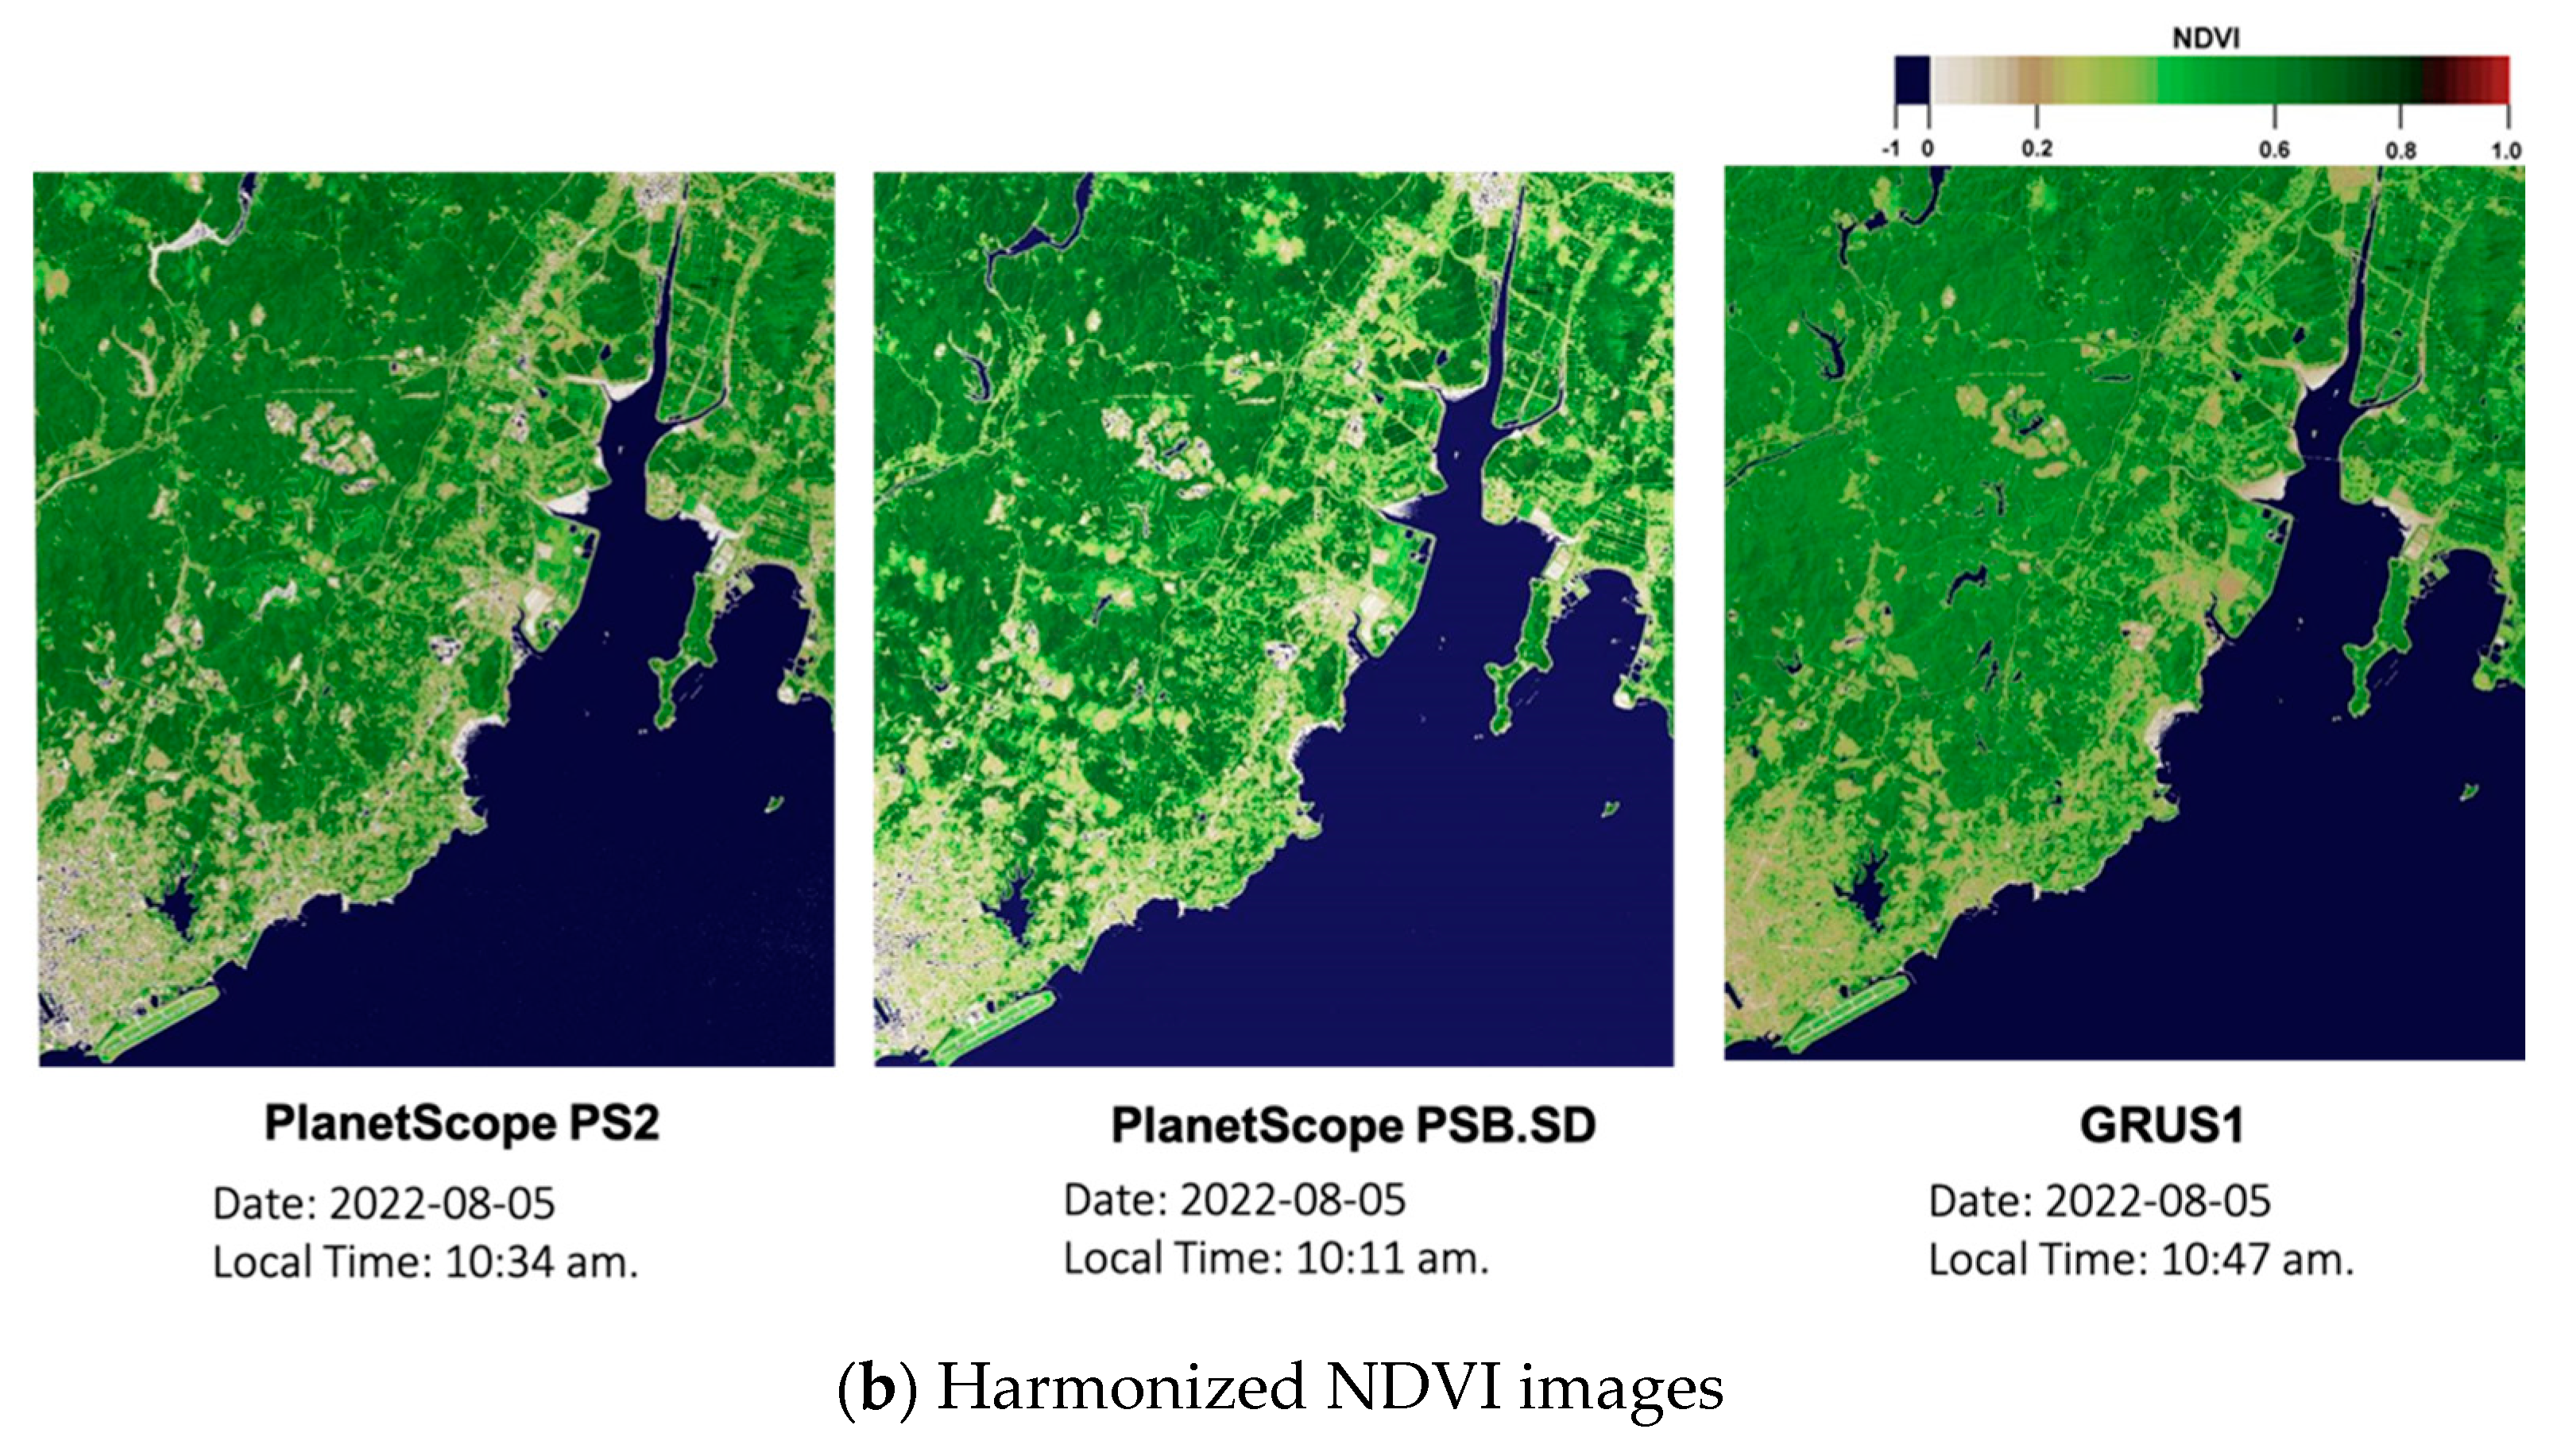
5.6. Calibration Coefficient for Image Harmonization
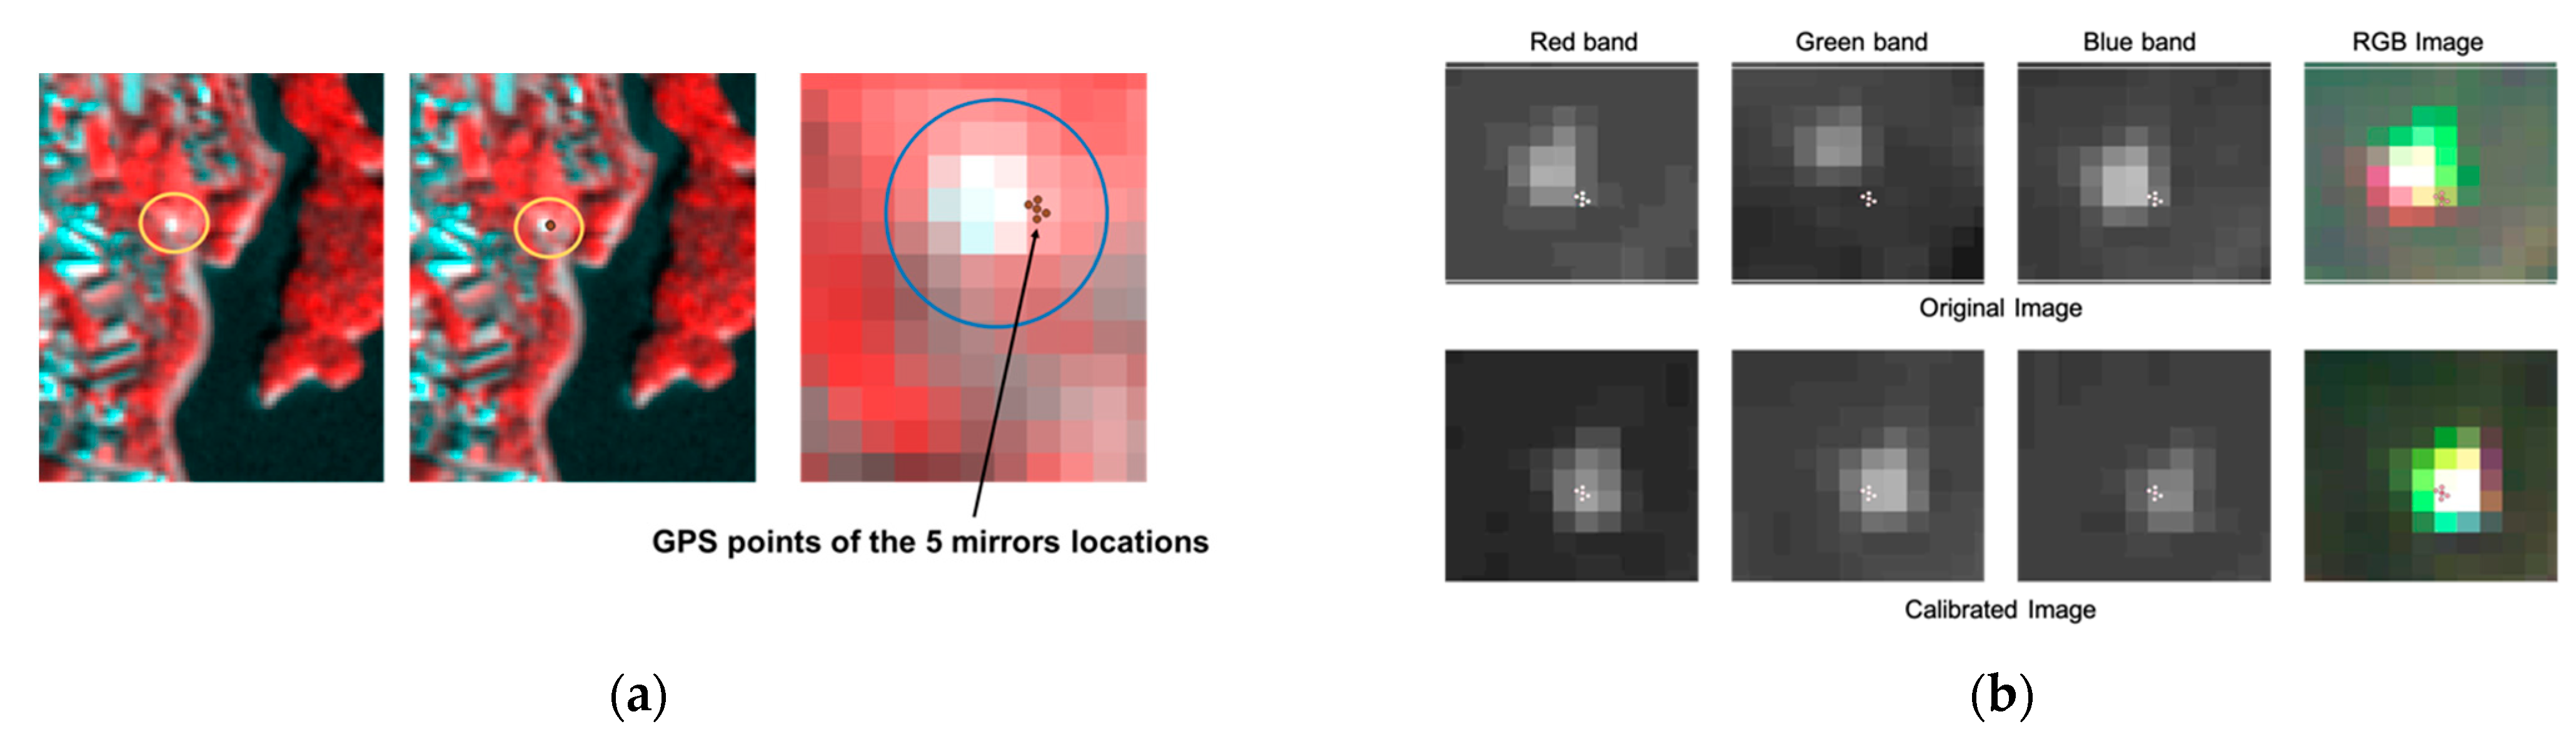
5.7. Image Correction Using a Mirror-Array
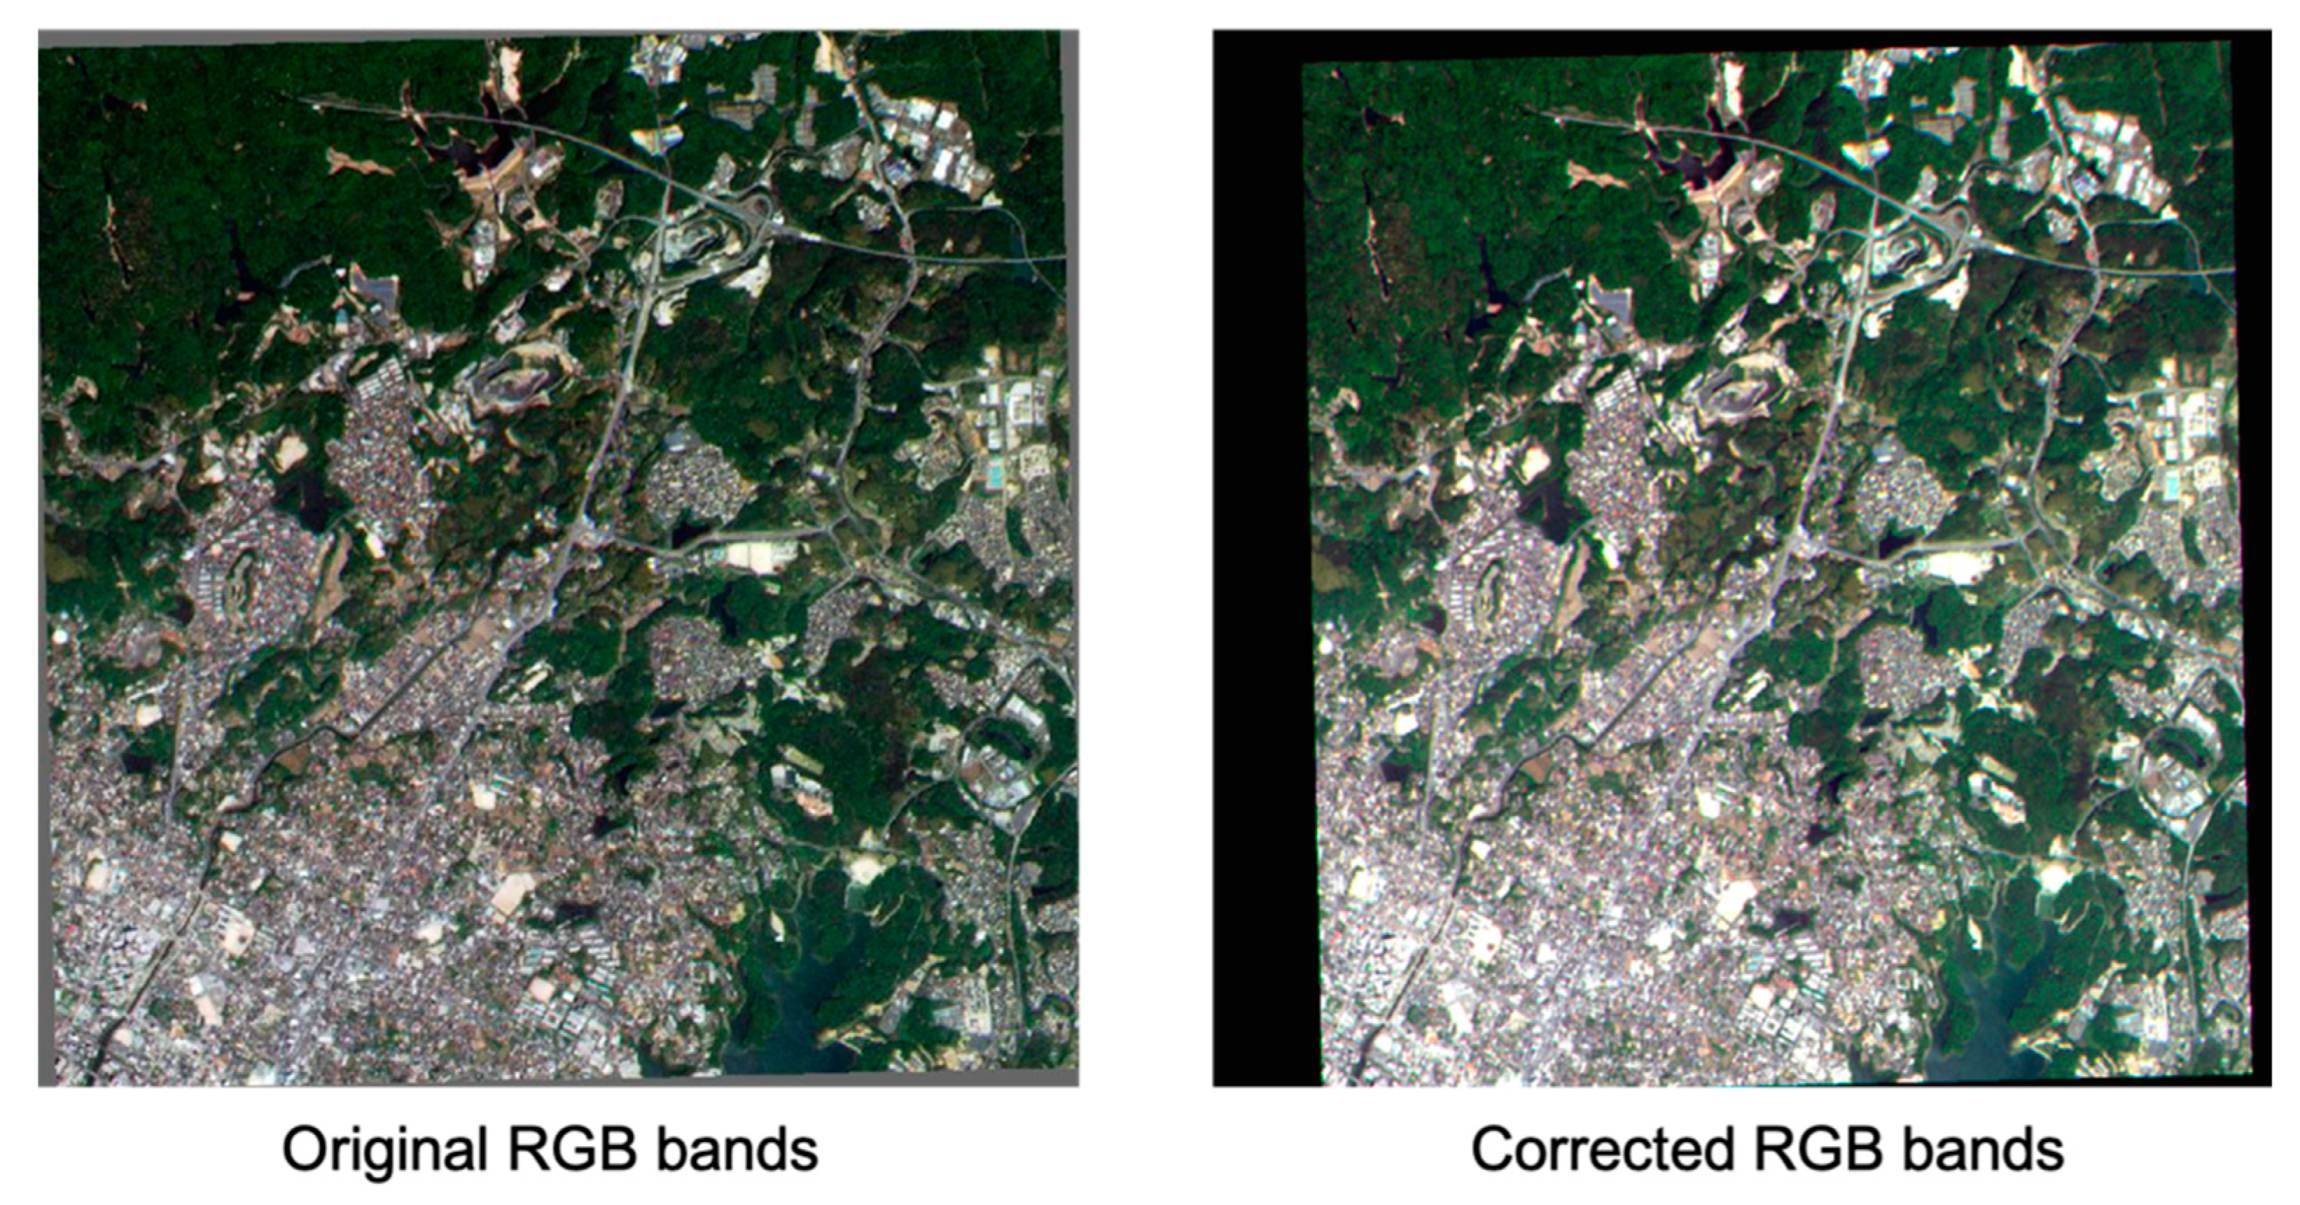
5.7.1. Geometric Correction
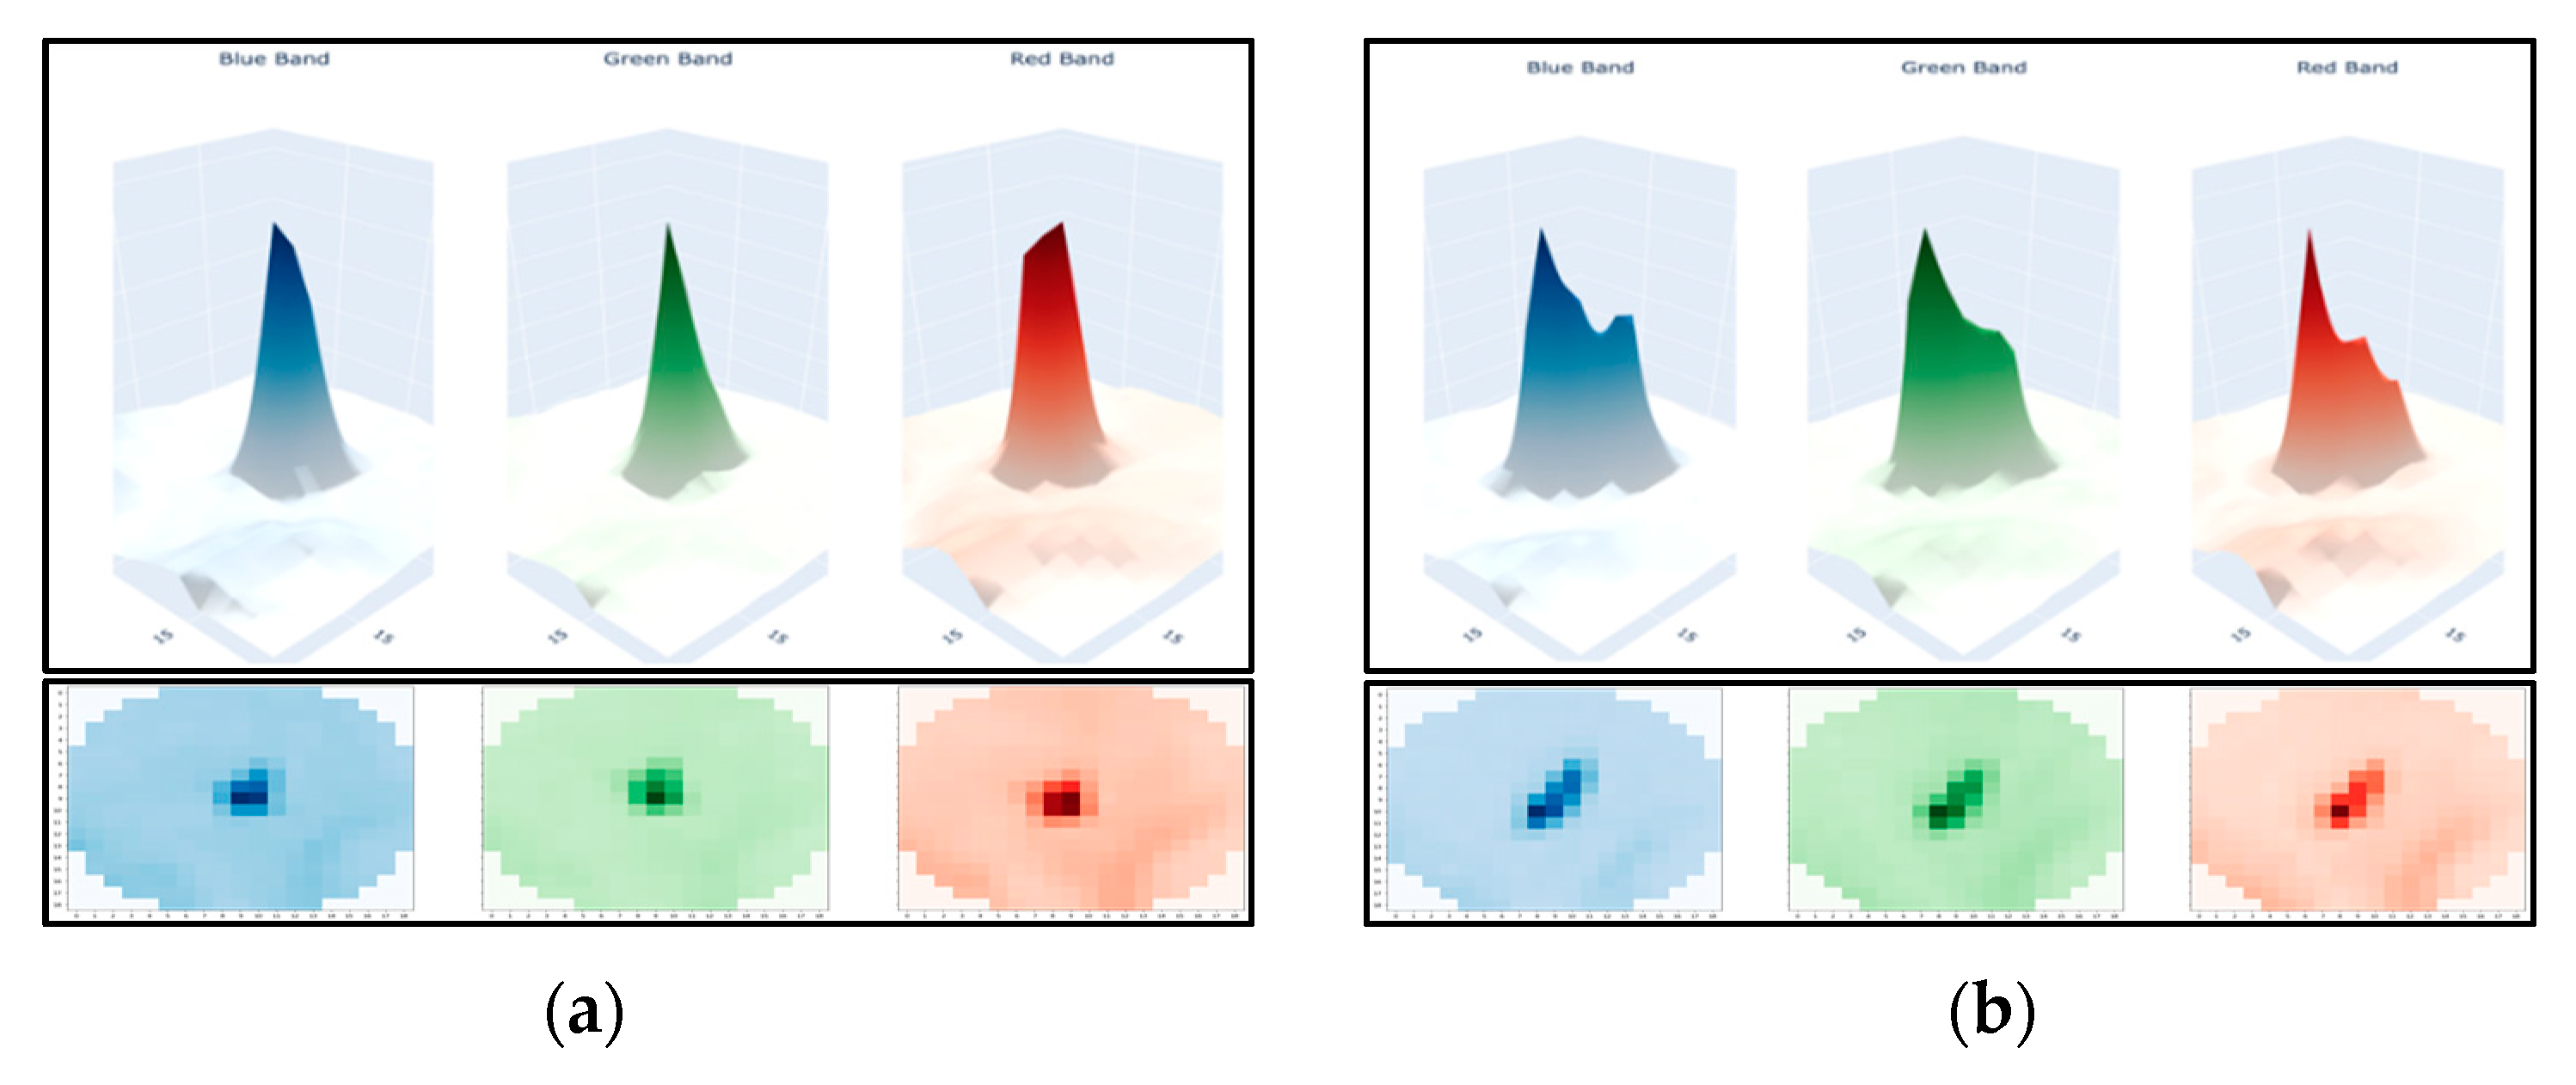
5.7.2. Energy Distribution of Mirror-Array
6. Discussion and Conclusions
Author Contributions
Funding
Data Availability Statement
Acknowledgments
Conflicts of Interest
Appendix A
References
- Helder, D.; Thome, K.J.; Mishra, N.; Chander, G.; Xiong, X.; Angal, A.; Choi, T. Absolute Radiometric Calibration of Landsat Using a Pseudo Invariant Calibration Site. IEEE Trans. Geosci. Remote Sens. 2013, 51, 1360–1369. [Google Scholar] [CrossRef]
- Chander, G.; Markham, B. Revised Landsat-5 TM Radiometrie Calibration Procedures and Postcalibration Dynamic Ranges. IEEE Trans. Geosci. Remote Sens. 2003, 41, 2674–2677. [Google Scholar] [CrossRef]
- Shin, D.Y.; Ahn, H.Y.; Lee, S.G.; Choi, C.U.; Kim, J.S. Radiometric Cross-Calibration of KOMPSAT-3A with Landsat-8. Int. Arch. Photogramm. Remote Sens. Spat. Inf. Sci.—ISPRS Arch. 2016, 379–382. [Google Scholar] [CrossRef]
- Nag, S.; Dabney, P.; Ravindra, V.; Anderson, C. Planning a Reference Constellation for Radiometric Cross-Calibration of Commercial Earth Observing Sensors. arXiv 2020, arXiv:2010.09946. [Google Scholar]
- Tamkuan, N.; Ichikawa, D.; Katiyar, V.; Nagai, Y.; Eguchi, T.; Nagai, M. Optical Multi-Satellite Data Calibration for Image Integration and Harmonization. In Proceedings of the International Geoscience and Remote Sensing Symposium, (IGARSS 2022), Kuala Lumpur, Malaysia, 17–22 July 2022; pp. 4595–4598. [Google Scholar]
- Yeom, J.M.; Ko, J.; Hwang, J.; Lee, C.S.; Choi, C.U.; Jeong, S. Updating Absolute Radiometric Characteristics for KOMPSAT-3 and KOMPSAT-3A Multispectral Imaging Sensors Using Well-Characterized Pseudo-Invariant Tarps and Microtops II. Remote Sens. 2018, 10, 697. [Google Scholar] [CrossRef]
- Schiller, S.J.; Silny, J. The Specular Array Radiometric Calibration (SPARC) Method: A New Approach for Absolute Vicarious Calibration in the Solar Reflective Spectrum. In Remote Sensing System Engineering III; SPIE: Bellingham, WA, USA, 2010; Volume 7813. [Google Scholar]
- Schiller, S.J.; Teter, M.; Silny, J. Comprehensive Vicarious Calibration and Characterization of a Small Satellite Constellation Using Specular Array Calibration (SPARC) Method. In Proceedings of the Small Satellite Conference, Logan, UT, USA, 5–10 August 2017. [Google Scholar]
- Solar Light Company. User’s Guide MICROTOPS II, Sunphotometer Version 5.6; Solar Light Company: Glenside, PA, USA, 2011; ISBN 2155178700. [Google Scholar]
- ASD FieldSpec® HandHeld 2 User Manual. 2010, pp. 1–140. Available online: http://www.geo-informatie.nl/courses/grs60312/material2017/manuals/600860-Dhh2manual.Pdf (accessed on 10 July 2021).
- Slater, P.N.; Biggar, S.F.; Holm, R.G.; Jackson, R.D.; Mao, Y.; Moran, M.S.; Palmer, J.M.; Yuan, B. Reflectance- and Radiance-Based Methods for the in-Flight Absolute Calibration of Multispectral Sensors. Remote Sens Environ. 1987, 22, 11–37. [Google Scholar] [CrossRef]
- Biggar, S.F.; Dinguirard, M.C.; Gellman, D.I.; Henry, P.J.; Jackson, R.D.; Moran, M.S.; Slater, P.N. Radiometric Calibration of SPOT 2 HRV: A Comparison of Three Methods. In Proceedings of the Calibration of Passive Remote Observing Optical and Microwave Instrumentation, Orlando, FL, USA, 3–5 April 1991; SPIE: Bellingham, WA, USA, 1991; Volume 1493, pp. 155–162. [Google Scholar]
- Moran, M.S.; Henry, P.J.; Biggar, S.F.; Gellman, D.I.; Thome, K.J.; Slater, P.N.; Dinguirard, M.C. Review of SPOT-1 and -2 Calibrations at White Sands from Launch to the Present; SPIE: Bellingham, WA, USA, 2005; p. 14. [Google Scholar]
- Russell, B.; Scharpf, D.; Holt, J.; Arnold, W.; Durell, C.N.; Jablonski, J.; Conran, D.; Schiller, S.J.; Leigh, L.; Aaron, D.; et al. Initial Results of the FLARE Vicarious Calibration Network. In Earth Observing Systems XXV; SPIE: Bellingham, WA, USA, 2020; p. 14. [Google Scholar]
- Russell, B.; Holt, J.; Durell, C.; Arnold, W.; Conran, D.; Jumpasut, A.; Colm, L.; Schiller, S. The FLARE Network: Vicarious Cal/Val for Earth Observation Satellites. In Proceedings of the AIAA/USU Conference on Small Satellites, Logan, UT, USA, 7–12 August 2021. [Google Scholar]
- Ichoku, C.; Levy, R.; Kaufman, Y.J.; Remer, L.A.; Li, R.-R.; Martins, V.J.; Holben, B.N.; Abuhassan, N.; Slutsker, I.; Eck, T.F.; et al. Analysis of the Performance Characteristics of the Five-Channel Microtops II Sun Photometer for Measuring Aerosol Optical Thickness and Precipitable Water Vapor. J. Geophys. Res. 2002, 107, 4179. [Google Scholar] [CrossRef]
- AxelGlobe. AxelGlobe Image Specification Sheet Change History. Available online: https://docs.axelglobe.com/en/image-specifications (accessed on 21 September 2021).
- Planet Labs Inc. PlanetScope Product Specification. Available online: https://assets.planet.com/docs/Planet_PSScene_Imagery_Product_Spec_June_2021.pdf (accessed on 10 September 2021).
- Berk, A.; Anderson, G.P.; Acharya, P.K.; Shettle, E.P. MODTRAN®5.2.1 User’s Manual. Available online: https://citeseerx.ist.psu.edu/viewdoc/download?doi=10.1.1.458.1743&rep=rep1&type=pdf (accessed on 15 August 2021).
- Berk, A.; van den Bosch, J.; Hawes, F.; Perkins, T.; Conforti, P.; Acharya, P.K.; Anderson, G.P.; Kennett, R.G. MODTRAN®6.0 User’s Manual. Available online: https://wiki.harvard.edu/confluence/display/hufasstubbsgroup/MODTRAN6%2C+2022?preview=/301915384/301915472/MODTRAN6User%27sManual.pdf (accessed on 17 August 2021).
- Berk, A. MODTRAN—Radiative Transfer. Available online: https://www.spectral.com/our-software/modtran/ (accessed on 20 October 2021).
- Ross, V. Validation of the MODTRAN 6 Refracted Geometry Algorithms in the Marine Boundary Layer and Development of EOSPEC Modules, DRDC Report; Aerex Avionics Inc.: Breakeyville, QU, Canada,.
- Berk, A.; Conforti, P.; Kennett, R.; Perkins, T.; Hawes, F.; van den Bosch, J. MODTRAN® 6: A Major Upgrade of the MODTRAN® Radiative Transfer Code. In Proceedings of the Workshop on Hyperspectral Image and Signal Processing, Evolution in Remote Sensing, Lausanne, Switzerland, 24–27 June 2014. [Google Scholar]
- Cerqueira, J.G.; Fernandez, J.H.; Hoelzemann, J.J.; Leme, N.M.P.; Sousa, C.T. Langley Method Applied in Study of Aerosol Optical Depth in the Brazilian Semiarid Region Using 500, 670 and 870 Nm Bands for Sun Photometer Calibration. Adv. Space Res. 2014, 54, 1530–1543. [Google Scholar] [CrossRef]


| Properties | Measured Value | Unit |
|---|---|---|
| Mirror diameter | 0.35 | Meter |
| Number of mirrors | 25 | — |
| Curvature radius | 3.0 | Meter |
| Ground Sample Distance (GSD) | 15.0 | Meter |
| Mirror reflectivity | 82–90 | Percentage |
| Bands | Wavelength | Reflectance |
|---|---|---|
| Blue | 450–505 | 0.879134 |
| Green | 515–585 | 0.872239 |
| Red | 620–685 | 0.856178 |
| Red-Edge | 705–745 | 0.837973 |
| NIR | 770–900 | 0.829395 |
| Spectral bands | Panchromatic | 450–900 nm |
| Blue | 450–505 nm | |
| Green | 515–585 nm | |
| Red | 620–685 nm | |
| Red Edge | 705–745 nm | |
| Near Infrared | 770–900 nm | |
| Swath | 57+ Km | |
| Ground resolution | Panchromatic | 2.5 m |
| Multispectral | 5.0 m |
| Instrument | PS2 | PSB.SD |
|---|---|---|
| Spectral Bands | Blue: 455–515 nm Green: 500–590 nm Red: 590–670 nm NIR: 780–860 nm | Blue: 465–515 nm Green: 513–549 nm Red: 650–680 nm Red-Edge: 697–713 nm NIR: 845–885 nm (8-band will be released in the future) |
| Resolution | 3.125 m | |
| Band Name | Langley Plot Line | Extraterrestrial Constant V0 |
|---|---|---|
| 380 nm | y = −0.5593x + 7.3151 | 7.3151 |
| 500 nm | y = −0.2476x + 7.5864 | 7.5864 |
| 675 nm | y = −0.1289n + 7.3609 | 7.3609 |
| 870 nm | y = −0.0871x + 7.2634 | 7.2634 |
| 1020 nm | Y = −0.0775x + 7.3733 | 7.3733 |
| GPS_ID of Points | GRUS-1A Radiance | GRUS-1A Reflectance | ||||||||
|---|---|---|---|---|---|---|---|---|---|---|
| Blue | Green | Red | Red Edge | NIR | Blue | Green | Red | Red Edge | NIR | |
| 001 | 6.435 | 5.902 | 3.714 | 7.589 | 12.181 | 0.114 | 0.112 | 0.085 | 0.202 | 0.421 |
| 002 | 6.174 | 5.469 | 3.117 | 8.076 | 12.804 | 0.109 | 0.104 | 0.071 | 0.215 | 0.442 |
| 003 | 6.435 | 6.046 | 3.487 | 8.030 | 12.760 | 0.114 | 0.115 | 0.080 | 0.214 | 0.441 |
| 004 | 7.065 | 6.889 | 5.227 | 8.676 | 11.966 | 0.125 | 0.131 | 0.119 | 0.231 | 0.413 |
| GPS_ID of Points | PS2-Radiance | PS2-Reflectance | ||||||
|---|---|---|---|---|---|---|---|---|
| Blue | Green | Red | NIR | Blue | Green | Red | NIR | |
| 001 | 6.150 | 5.661 | 3.978 | 12.119 | 0.112 | 0.110 | 0.089 | 0.416 |
| 002 | 5.874 | 5.244 | 3.428 | 12.061 | 0.107 | 0.102 | 0.077 | 0.414 |
| 003 | 6.156 | 5.774 | 3.821 | 11.458 | 0.112 | 0.112 | 0.085 | 0.393 |
| 004 | 6.806 | 6.575 | 5.359 | 11.319 | 0.124 | 0.128 | 0.120 | 0.388 |
| GPS_ID of Points | PSBSD-Radiance | PSBSD-Reflectance | ||||||
|---|---|---|---|---|---|---|---|---|
| Blue | Green | Red | NIR | Blue | Green | Red | NIR | |
| 001 | 5.731 | 5.988 | 3.185 | 12.270 | 0.110 | 0.122 | 0.081 | 0.500 |
| 002 | 5.462 | 5.568 | 2.636 | 12.767 | 0.105 | 0.113 | 0.067 | 0.520 |
| 003 | 5.733 | 6.101 | 2.948 | 12.652 | 0.110 | 0.124 | 0.075 | 0.516 |
| 004 | 6.364 | 6.920 | 4.561 | 12.017 | 0.123 | 0.141 | 0.116 | 0.490 |
| GRUS-1 (Reflectance) | Blue | Green | Red | Red Edge | NIR |
|---|---|---|---|---|---|
| Satellite pixel | 0.118 | 0.117 | 0.076 | 0.201 | 0.376 |
| MODTRAN simulation | 0.115 | 0.115 | 0.089 | 0.215 | 0.429 |
| Difference (Satellite-MODTRAN) | 0.003 | 0.001 | −0.013 | −0.014 | −0.054 |
| Difference (%) (Difference/MODTRAN) | 2.246% | 0.985% | −14.167% | −6.509% | −12.536% |
| PS2 (Reflectance) | Blue | Green | Red | NIR | |
| Satellite pixel | 0.112 | 0.113 | 0.090 | 0.345 | |
| MODTRAN simulation | 0.114 | 0.113 | 0.093 | 0.403 | |
| Difference (Satellite−MODTRAN) | −0.002 | 0.000 | −0.003 | −0.058 | |
| Difference (%)(Difference/MODTRAN) | −1.584% | −0.017% | −2.824% | −14.310% | |
| PSB.SD (Reflectance) | Blue | Green | Red | NIR | |
| Satellite pixel | 0.092 | 0.095 | 0.063 | 0.420 | |
| MODTRAN simulation | 0.112 | 0.125 | 0.085 | 0.507 | |
| Difference (Satellite−MODTRAN) | −0.020 | −0.030 | −0.022 | −0.087 | |
| Difference (%) (Difference/MODTRAN) | −18.001% | −23.961% | −25.704% | −17.124% |
Publisher’s Note: MDPI stays neutral with regard to jurisdictional claims in published maps and institutional affiliations. |
© 2022 by the authors. Licensee MDPI, Basel, Switzerland. This article is an open access article distributed under the terms and conditions of the Creative Commons Attribution (CC BY) license (https://creativecommons.org/licenses/by/4.0/).
Share and Cite
Ichikawa, D.; Nagai, M.; Tamkuan, N.; Katiyar, V.; Eguchi, T.; Nagai, Y. Development and Utilization of a Mirror Array Target for the Calibration and Harmonization of Micro-Satellite Imagery. Remote Sens. 2022, 14, 5717. https://doi.org/10.3390/rs14225717
Ichikawa D, Nagai M, Tamkuan N, Katiyar V, Eguchi T, Nagai Y. Development and Utilization of a Mirror Array Target for the Calibration and Harmonization of Micro-Satellite Imagery. Remote Sensing. 2022; 14(22):5717. https://doi.org/10.3390/rs14225717
Chicago/Turabian StyleIchikawa, Dorj, Masahiko Nagai, Nopphawan Tamkuan, Vaibhav Katiyar, Tsuyoshi Eguchi, and Yumiko Nagai. 2022. "Development and Utilization of a Mirror Array Target for the Calibration and Harmonization of Micro-Satellite Imagery" Remote Sensing 14, no. 22: 5717. https://doi.org/10.3390/rs14225717
APA StyleIchikawa, D., Nagai, M., Tamkuan, N., Katiyar, V., Eguchi, T., & Nagai, Y. (2022). Development and Utilization of a Mirror Array Target for the Calibration and Harmonization of Micro-Satellite Imagery. Remote Sensing, 14(22), 5717. https://doi.org/10.3390/rs14225717