Article

Quantifying the Impact of Dust Sources on Urban Physical Growth and Vegetation Status: A Case Study of Saudi Arabia

by
Yazeed Alsubhi
1,
Salman Qureshi
2,*,
Mazen E. Assiri
3 and
Muhammad Haroon Siddiqui
4
1
Department of Meteorology, King Abdulaziz University, Jeddah 22254, Saudi Arabia
2
Institute of Geography (Landscape Ecology), Humboldt University of Berlin, Rudower Chaussee 16, 12489 Berlin, Germany
3
Department of Meteorology, The Center of Excellence for Climate Change Research, King Abdulaziz University, Jeddah 22254, Saudi Arabia
4
Center of Excellence for Climate Change Research, King Abdulaziz University, Jeddah 22254, Saudi Arabia
*
Author to whom correspondence should be addressed.
Remote Sens. 2022, 14(22), 5701; https://doi.org/10.3390/rs14225701
Submission received: 7 September 2022 / Revised: 7 October 2022 / Accepted: 19 October 2022 / Published: 11 November 2022
(This article belongs to the Special Issue Advances and Challenges in Remote Sensing of Atmospheric Mineral Dust)

Abstract

:
Recently, dust has created many problems, including negative effects on health, and environmental and economic costs, for people who live both near to and far from sources of dust. The aim of this study is to evaluate and quantify the impact of dust sources located inside Saudi Arabia on the physical growth and vegetation status of cities. In order to do so, satellite data sets, simulated surface data, and soil data for Saudi Arabia from 2000 to 2021 were used. In the first step, a dust sources map of the study area was generated using multi-criteria decision analysis. Land surface temperature (LST), vegetation cover, soil moisture, precipitation, air humidity, wind speed, and soil erodibility factors were considered as effective criteria in identifying dust sources. In the second step, built-up land and vegetation status maps of major cities located at different distances from dust sources were generated for different years based on spectral indicators. Then, the spatiaotemporal change of built-up land and vegetation status of the study area and major cities were extracted. Finally, impacts of major dust sources on urban physical growth and vegetation were quantified. The importance degrees of soil erodibility, wind speed, soil moisture, vegetation cover, LST, air humidity, and precipitation to identify dust sources were 0.22, 0.20, 0.16, 0.15, 0.14, 0.07, and 0.05, respectively. Thirteen major dust sources (with at least 8 years of repetition) were identified in the study area based on the overlap of the effective criteria. The identified major dust sources had about 300 days with Aerosol Optical Depth (AOD) values greater than 0.85, which indicates that these dust sources are active. The location of the nine major dust sources identified in this study corresponds to the location of the dust sources identified in previous studies. The physical growth rates of cities located <400 km or >400 km from a major dust source (DMDS) are 46.2% and 95.4%, respectively. The reduction rates of average annual normalized difference vegetation index (NDVI) in these sub-regions are 0.006 and 0.002, respectively. The reduction rate of the intensity of vegetation cover in the sub-region close to dust sources is three times higher than that of the sub-region farther from dust sources. The coefficients of determination (R2) between the DMDS and urban growth rate and the NDVI change rate are 0.52 and 0.73, respectively, which indicates that dust sources have a significant impact on the physical growth of cities and their vegetation status.

1. Introduction

Over the past few decades, human activity has disturbed the ecosystem’s balance, leading to increasing numbers of major negative effects on the quality of human life, environmental conditions, and economic activities [1,2,3,4]. One of the most important environmental crises is the destructive phenomenon of desertification and wind erosion, the consequences of which are the occurrence of dust storms and dust transport [5,6,7]. The dust cycle produces about 2 billion tons of particulate matter each year, 75% of which is deposited on land and 25% in the oceans [8]. In recent decades, the frequency and magnitude of dust storms have increased in some regions of the world [9,10,11,12]. The arid regions of the Earth are the major sources of dust storm formation. Dust storms are a natural hazard that affect about 40% of the land surface and a population of more than 2 billion people. Alternatively, dust aerosols can be moved thousands of kilometers away from arid environments during the transfer process [13].
In recent years, the intra-regional and extra-regional effects of dust storms have endangered various aspects of urban and rural life [6,7,14,15,16,17,18]. In general, the most important intra-regional effects are the destruction of regional environments and ecosystems, noticeable reductions in fertile land areas and increasing bare lands, damage to agricultural products, reduced production and productivity, forced migration, and land abandonment. The most important extra-regional effects include cardiovascular disorders, respiratory diseases, and threats of public health in cities and rural areas as a result of sand and dust, sedimentation, plant health, reduced carrying capacity of water transmission canals, closure of communication roads, and disruption of traffic of vehicles and air transportation, visibility reduction, increased costs of maintenance of facilities, factories, and residential and industrial areas. Hence, assessing the risk rate and negative effects of this phenomenon is of great importance. Identifying dust-generating sources, as well as influencing factors in expanding and intensifying the sources and their negative effects, will help decision-makers and policymakers control and plan for the reduction in negative impacts on both natural and human environments.
The models used to identify dust generating sources and effective factors in previous studies can be classified into four categories: statistical and meteorological [19,20], numerical [11,21,22], remote sensing [23,24,25], and hybrid [9,12,26,27,28,29,30] methods. Hybrid methods, unlike other methods, are not limited to one data source and can use any of the environmental parameters involved in the dust process. Some of these studies are based on a combination of remote sensing data and meteorological data. Some studies have also used numerical methods and information from remote sensing data [10,12,27]. Several other studies have also used land surface models (LSM) in combination with remote sensing data [9,31,32]. The results of these studies show that the factors affecting the formation of dust sources include soil characteristics, climatic conditions, vegetation cover, soil surface roughness, and surface topography.
Recently, dust has created many problems, including negative health, environmental, and economic effects for people, regardless of how far they may live from a dust source [33,34,35]. Assessing and quantifying the effects of dust sources on human settlements is important for drawing both local and global attention to the problem and implementing control programs [36,37]. In the past, plenty of studies have been conducted on the negative effects of mineral dust [38,39,40,41]. Assessing the health and environmental effects of urban dust has been one of the most important categories in these studies [38,42,43,44,45,46,47]. Other studies have evaluated the impact of dust on the productive and economic sectors, including agriculture, solar power, and more [48,49,50,51].
Cities are the most important human settlements. One of the damaging consequences of this disturbance is the increase in mineral dust in urban environments [52,53]. The formation and expansion of dust sources throughout the world, especially in hot and dry areas, has posed some major environmental threats to cities located at different distances from these sources [54,55]. Hence, identifying and managing the sources of dust could reduce its harmful impact on the urban environment. This has been a widespread concern of researchers and policy-makers in recent decades, especially in hot and dry areas [56].
The fundamental aim of this study is to evaluate and quantify the impact of dust sources located inside Saudi Arabia on the physical growth and vegetation status of cities. The novelty of this study is the use of remote sensing capabilities to assess the impact of dust sources on vegetation status and the investigation of physical growth of cities located at different distances from dust sources. For this purpose, a multi-criteria decision analysis model was used to combine remote sensing and meteorological data and quantitative models to determine the geographical location of dust sources. Then, based on different satellite images, the trend of urban growth changes and the vegetation status of different cities were studied. Finally, the effect that distance from dust sources has on the vegetation status and physical growth of these cities was evaluated.

2. Study Area

Saudi Arabia is the largest country in the Middle East, covering 80% of the Arabian Peninsula (Figure 1). It is located in a dry region in West Asia, which is one of the most active wind erosion and dust production regions in the world. The country covers an area of 2,218,000 km2 and is located in the 44.2°E and 24.9°N. It has a population of about 35.1 million. According to the Köppen–Geiger climate classification, it has a humid subtropical (Cfa) climate. Saudi Arabia extends from the southwestern heights (1500 to 2943 m a.s.l.), adjacent to the Red Sea, to the flat lands of the northeast (−13 to 200 m a.s.l.).
One of the largest sandy deserts in the world is Rub’al Khali, which has an area of about 647,500 km2. This desert is located in the southeastern part of Saudi Arabia. Moreover, the Ad-Dahna and An-Nafud deserts are located in this country. The Rub’ al Khali and Ad-Dahna deserts are considered to be the sources of sandstorms in the Middle East due to their coarse-grained resources. Northern storms are one of the most important active wind currents in the country. Hence, this area has been selected to assess the impact of dust sources on the vegetation status and physical growth of cities. Saudi Arabia’s 28 major cities, located in different geographical locations with different demographic conditions, were selected as test areas.

3. Data and Methods

3.1. Data

The used data in this research are divided into three categories: satellite data, surface simulated data, and soil data. Satellite data includes Moderate Resolution Imaging Spectroradiometer (MODIS) sensor aboard the Terra satellite and Landsat satellite, as well as Tropical Rainfall Measuring Mission (TRMM) satellite data. Data obtained from the MODIS sensor include monthly Normalized difference vegetation index (NDVI) (MOD13C2), Land Surface Temperature (LST) (MOD11C3) products, and daily Aerosol Optical Depth (AOD) product (MCD19A2).
The spatial resolution of MOD13C2 and MOD11C3 products is 5000 m. Spectral AOD is a parameter often used for remote sensing air pollution measurements. AOD is a measure of the extinction (scattering + absorption) of sunlight due to aerosol particles. The spatial resolution of MCD19A2 is 1000 m. These data are available at https://earthexplorer.usgs.gov/ (accessed on 20 May 2022).
Monthly TRMM satellite data obtained from https://giovanni.gsfc.nasa.gov/giovanni/ (accessed on 13 May 2022) were also employed to extract precipitation information. The spatial resolution of this data is 25,000 m. Global Land Data Assimilation System (GLDAS) was used to create maps of wind speed, soil moisture, evaporation from the soil surface, and absolute air humidity parameters. These data are based on satellite observations and ground controls at global coverage and at different spatial and temporal scales. GLDAS data are available at https://giovanni.gsfc.nasa.gov/giovanni (accessed on 12 April 2022). Moreover, soil moisture data at 10 cm soil depth and wind data recorded at an altitude of 10 m a.g.l. were used. Additionally, the absolute humidity data from the National Oceanic and Atmospheric (NOAH) model (https://giovanni.gsfc.nasa.gov/giovanni/ (accessed on 26 April 2022)) was used to investigate the amount of moisture in the atmosphere of the study area.
Soil information from the Food and Agriculture Organization (FAO) was used to generate a soil constituents map of the study area (percentage of sand, silt, and clay) and its texture (https://www.fao.org/soils-portal/soil-survey/soil-maps-and-databases (accessed on 1 May 2022)). In this study, the amount of sand, silt, and clay per pixel were used to achieve the soil erodibility factor [57]. The spatial resolution of FAO soil data is 1000 m. Moreover, reflective bands of the Landsat 5 and 8 satellites with a spatial resolution of 30 m were used to prepare maps of built-up land in 2000 and 2021. Landsat satellite data can be downloaded from Earth Explorer (https://earthexplorer.usgs.gov (accessed on 28 May 2022)).

3.2. Method

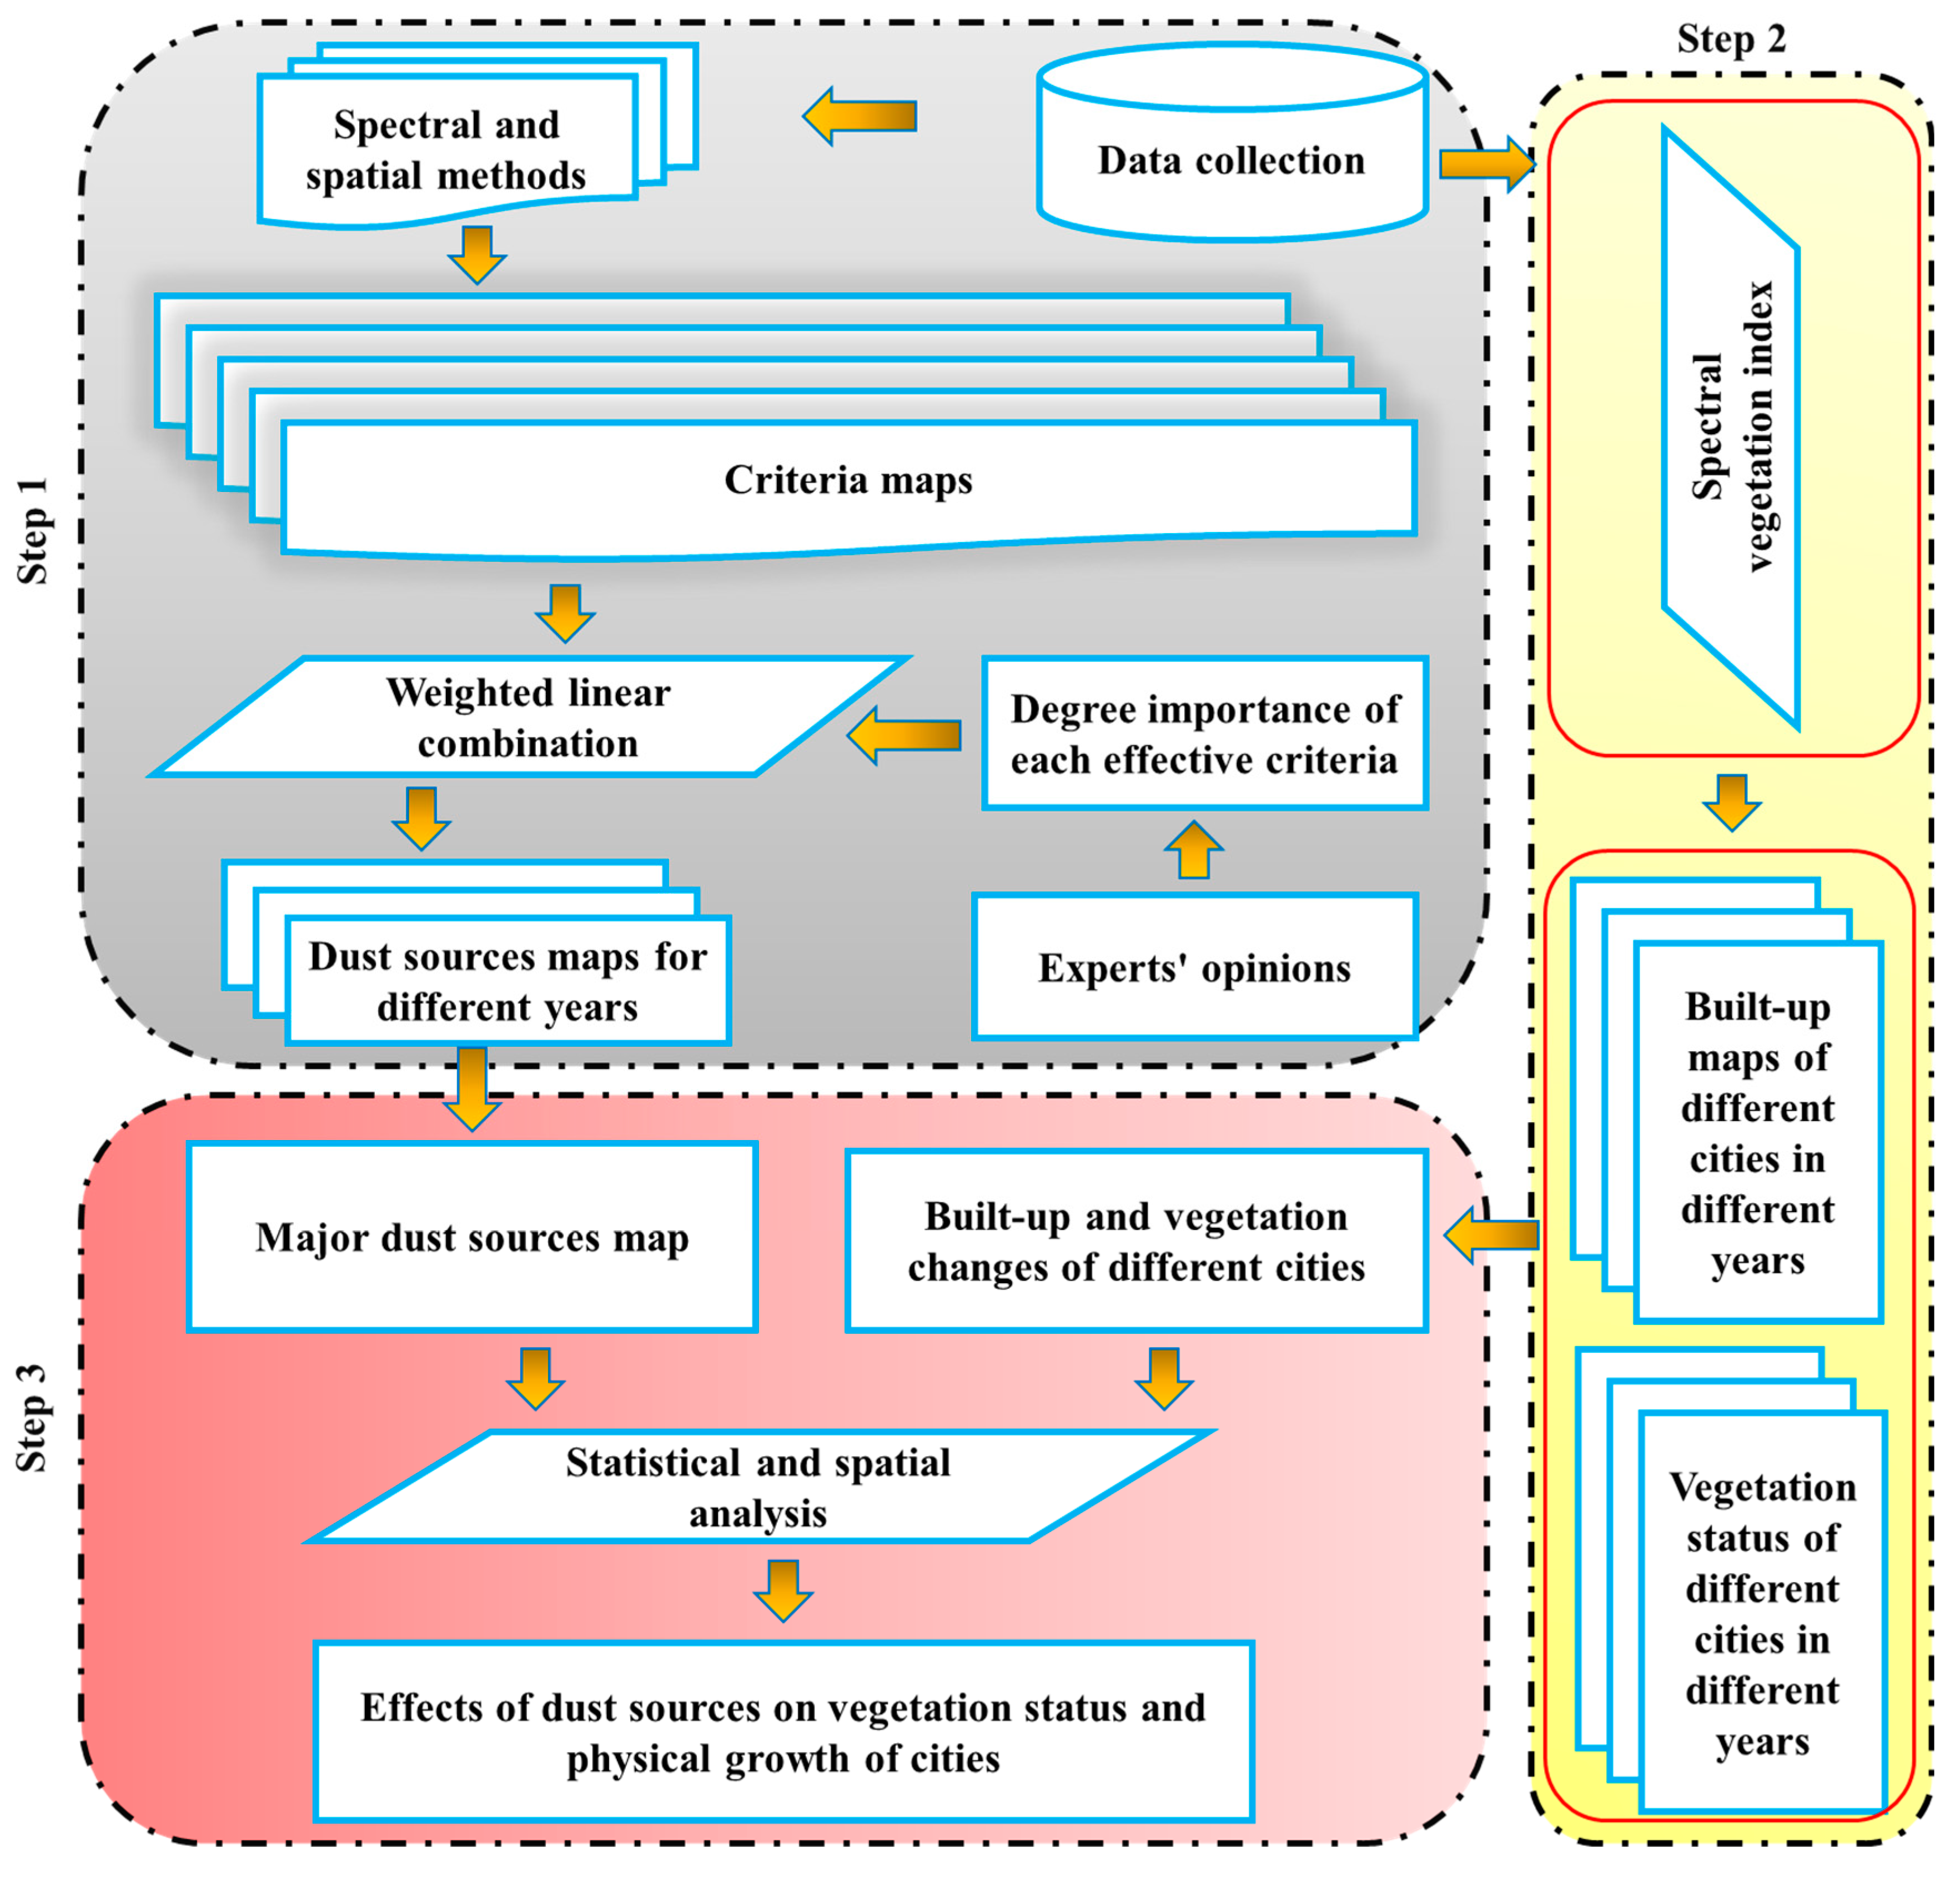
In order to investigate and evaluate the impact of dust sources on urban physical growth and vegetation status, the conceptual model shown in Figure 2 was used. In the first step, a Susceptible Areas to Dust Storm Formation (SADSF) map of the study area was generated using a multi-criteria decision analysis method. At this step, LST, vegetation cover, soil moisture, precipitation, air humidity, wind speed, and soil erodibility were used as effective criteria. The weight of effective criteria was determined based on Analytic Hierarchy Process (AHP). Then by combining the weight and standardized values of effective criteria based on Weighted Linear Combination (WLC), the SADSF map was produced. In the second step, built-up land and vegetation status maps of the study area and major cities generated spectral indicators. For this purpose, the reflective bands of Landsat 5 and 8 images and MOD13C2 product for the years 2000 to 2021 were used. Then, the spatial-temporal change of built-up land and vegetation status in the study area and major cities were extracted. Finally, the impacts of Major SADSFs (MSADSF) on the vegetation status and physical growth of cities was quantified. For this purpose, these steps were briefly followed: (1) The r between the Distance from a Major Dust Source (DMDS) and the urban growth rate of each major city was calculated. (2) The mean values of the urban growth rate for different major cities located within DMDS < 400 km and DMDS > 400 km were calculated. (3) Mean values of the built-up growth rate for sub-regions located within DMDS < 400 km and DMDS > 400 km were calculated. (4) The change trend of the mean of NDVI of sub-regions located within DMDS < 400 km and >400 km was evaluated. (5) The r between the DMDS and NDVI change rate of major cities was calculated.

3.2.1. SADSF Mapping

The first step in this process involves preparing a database of effective parameter maps of SADSF. In the second step, using dust experts’ opinions, the weights of each of the criteria that were effective in identifying SADSF were determined based on the pairwise comparison process. Afterward, these weights were entered into Expert Choice software to obtain the final weight of each criterion using the AHP method [9,58,59,60]. This method is a multi-objective, multi-criteria decision analysis approach that uses a pairwise comparison method to obtain values of preferences among a set of criteria. The AHP consists of three steps: (1) The first step is to make a hierarchy of the decision-making problem which the ultimate objective of the problem is at the top level, followed by criteria groups in the second level, individual criteria in subsequent levels and alternatives at the lower levels. (2) Pairwise comparisons: In the second step, a comparison matrix is formed by making a pairwise comparison between the criteria. (3) The next step of the AHP is to determine the weights for various criteria based on pairwise comparisons. These effective criteria were LST, vegetation cover, soil moisture, precipitation, air humidity, wind speed, and soil erodibility (Table 1). Finally, the minimum and maximum methods were used to standardize the selected criteria [35,61,62,63,64].
In the second step, constraint layers were applied to each pixel. Based on various studies, two criteria of wind speed and vegetation were selected as constraint layers. According to previous studies in west of Asia, wind speed and NDVI threshold were considered at 6.5 m/s and 0.15 [21,65,66,67].
In the third step, standardized values of effective criteria and corresponding weights were aggregated by means of the WLC model [68,69,70] to identify SADSF (Equation (1)).
A i = i = 1 n W i X i
where i is the criterion, n is the number of criteria, W i is the weight of criterion, and X i weight of each criterion. By determining a threshold greater than 0.5 on the outputs from the WLC model, a map of SADSF for each year was determined. Finally, by overlapping the dust maps obtained for each year from 2000 to 2021, a frequency map of SADSF was produced. In order to evaluate the obtained SADSF map, (1) AOD products and (2) prepared SADSF maps from previous studies of this region were used.

3.2.2. Calculation of the Built-Up and Vegetation Changes

The Automated Built-up Extraction Index (ABEI) was used to extract the built-up lands [71,72]. This index makes the maximum difference between the values of ‘pixels within built-up class’ and ‘pixels of other land cover classes’ and the maximum similarity between the values of ‘pixels within the built-up class’. To calculate this index for Landsat 5 and 8, Equations (2) and (3) were used, respectively:
ABEI _ Landsat 5 = 0.825 × Blue 0.086 × Green 0.441 × Red + 0.052 × NIR 0.198 × SWIR 1 + 0.278 × SWIR 2
ABEI _ Landsat 8 = 0.312 × Ultra   Blue + 0.513 × Blue 0.086 × Green 0.441 × Red + 0.052 × NIR 0.198 × SWIR 1 + 0.278 × SWIR 2
where the coefficient value for each spectral band represents the effect of each spectral band on built-up land extraction. Finally, by applying the appropriate thresholds on ABEI, built-up land maps of the study area were produced. A default value of the threshold equal to zero is used to separate built-up and non-built-up pixels. Pixels with a value greater than zero are built-up areas, and pixels with values less than zero are non-built-up areas. However, due to different environmental conditions in different regions, the threshold value for the ABEI was determined according to the ground samples and based on the overall error parameter. For this purpose, the threshold value was changed to 0.001, and with each change, the value of the overall error parameter was calculated. Finally, the optimal threshold for each region was calculated with the condition of minimizing the overall error value. Based on the samples collected from Google Earth images for built-up and non-built-up classes, the accuracy of prepared built-up land maps based on the ABEI was evaluated using the overall, user, and producer accuracies metrics. A map of built-up lands was prepared for the years from 2000 to 2021. For this purpose, the median image based on all Landsat images in each region within each year was procured, and by applying ABEI, the built-up lands map for each region was obtained. Then, by mosaicking the obtained maps for different regions, the map of the built-up lands for the whole study area (for 2000 and 2021) was obtained. Finally, the changes in built-up land areas were calculated on the scale of the study area and each of the cities (physical growth).
To extract the trend of changes in vegetation cover, the following procedure was followed: (1) By averaging the monthly MODIS product, an annual vegetation cover map was procured for the study area. Then, (2) charts of temporal changes in vegetation cover in the major cities and different sub-regions within the study area were prepared.

3.2.3. Evaluation of the Impact of Dust Sources on Urban Physical Growth and Vegetation Status

To evaluate and quantify the impact of dust sources on the physical growth and vegetation status of cities:
  • Areas that were identified as SADSF for at least 8 years were selected as the MSADSF;
  • A map of the distance from the major dust source (DMDS) was procured for the study area;
  • The distance between the MSADSF and each of the major cities located in the study area was calculated;
  • Based on the spatial distribution of the major cities in the study area, the map of the DMDS was classified into two classes of regions: those at distance >400 km and those at a distance <400 km;
  • The Pearson correlation coefficient (r) between the DMDS and the urban growth rate of each major city was calculated;
  • The mean values of the urban growth rate for different major cities located within DMDS < 400 km and DMDS > 400 km were calculated;
  • Mean values of the built-up growth rate for sub-regions located within DMDS < 400 km and DMDS > 400 km were calculated;
  • The change trend of the mean of NDVI of sub-regions located within DMDS < 400 km and >400 km was evaluated;
  • The r between the DMDS and NDVI change rate of major cities was calculated.

4. Results

4.1. SADSF

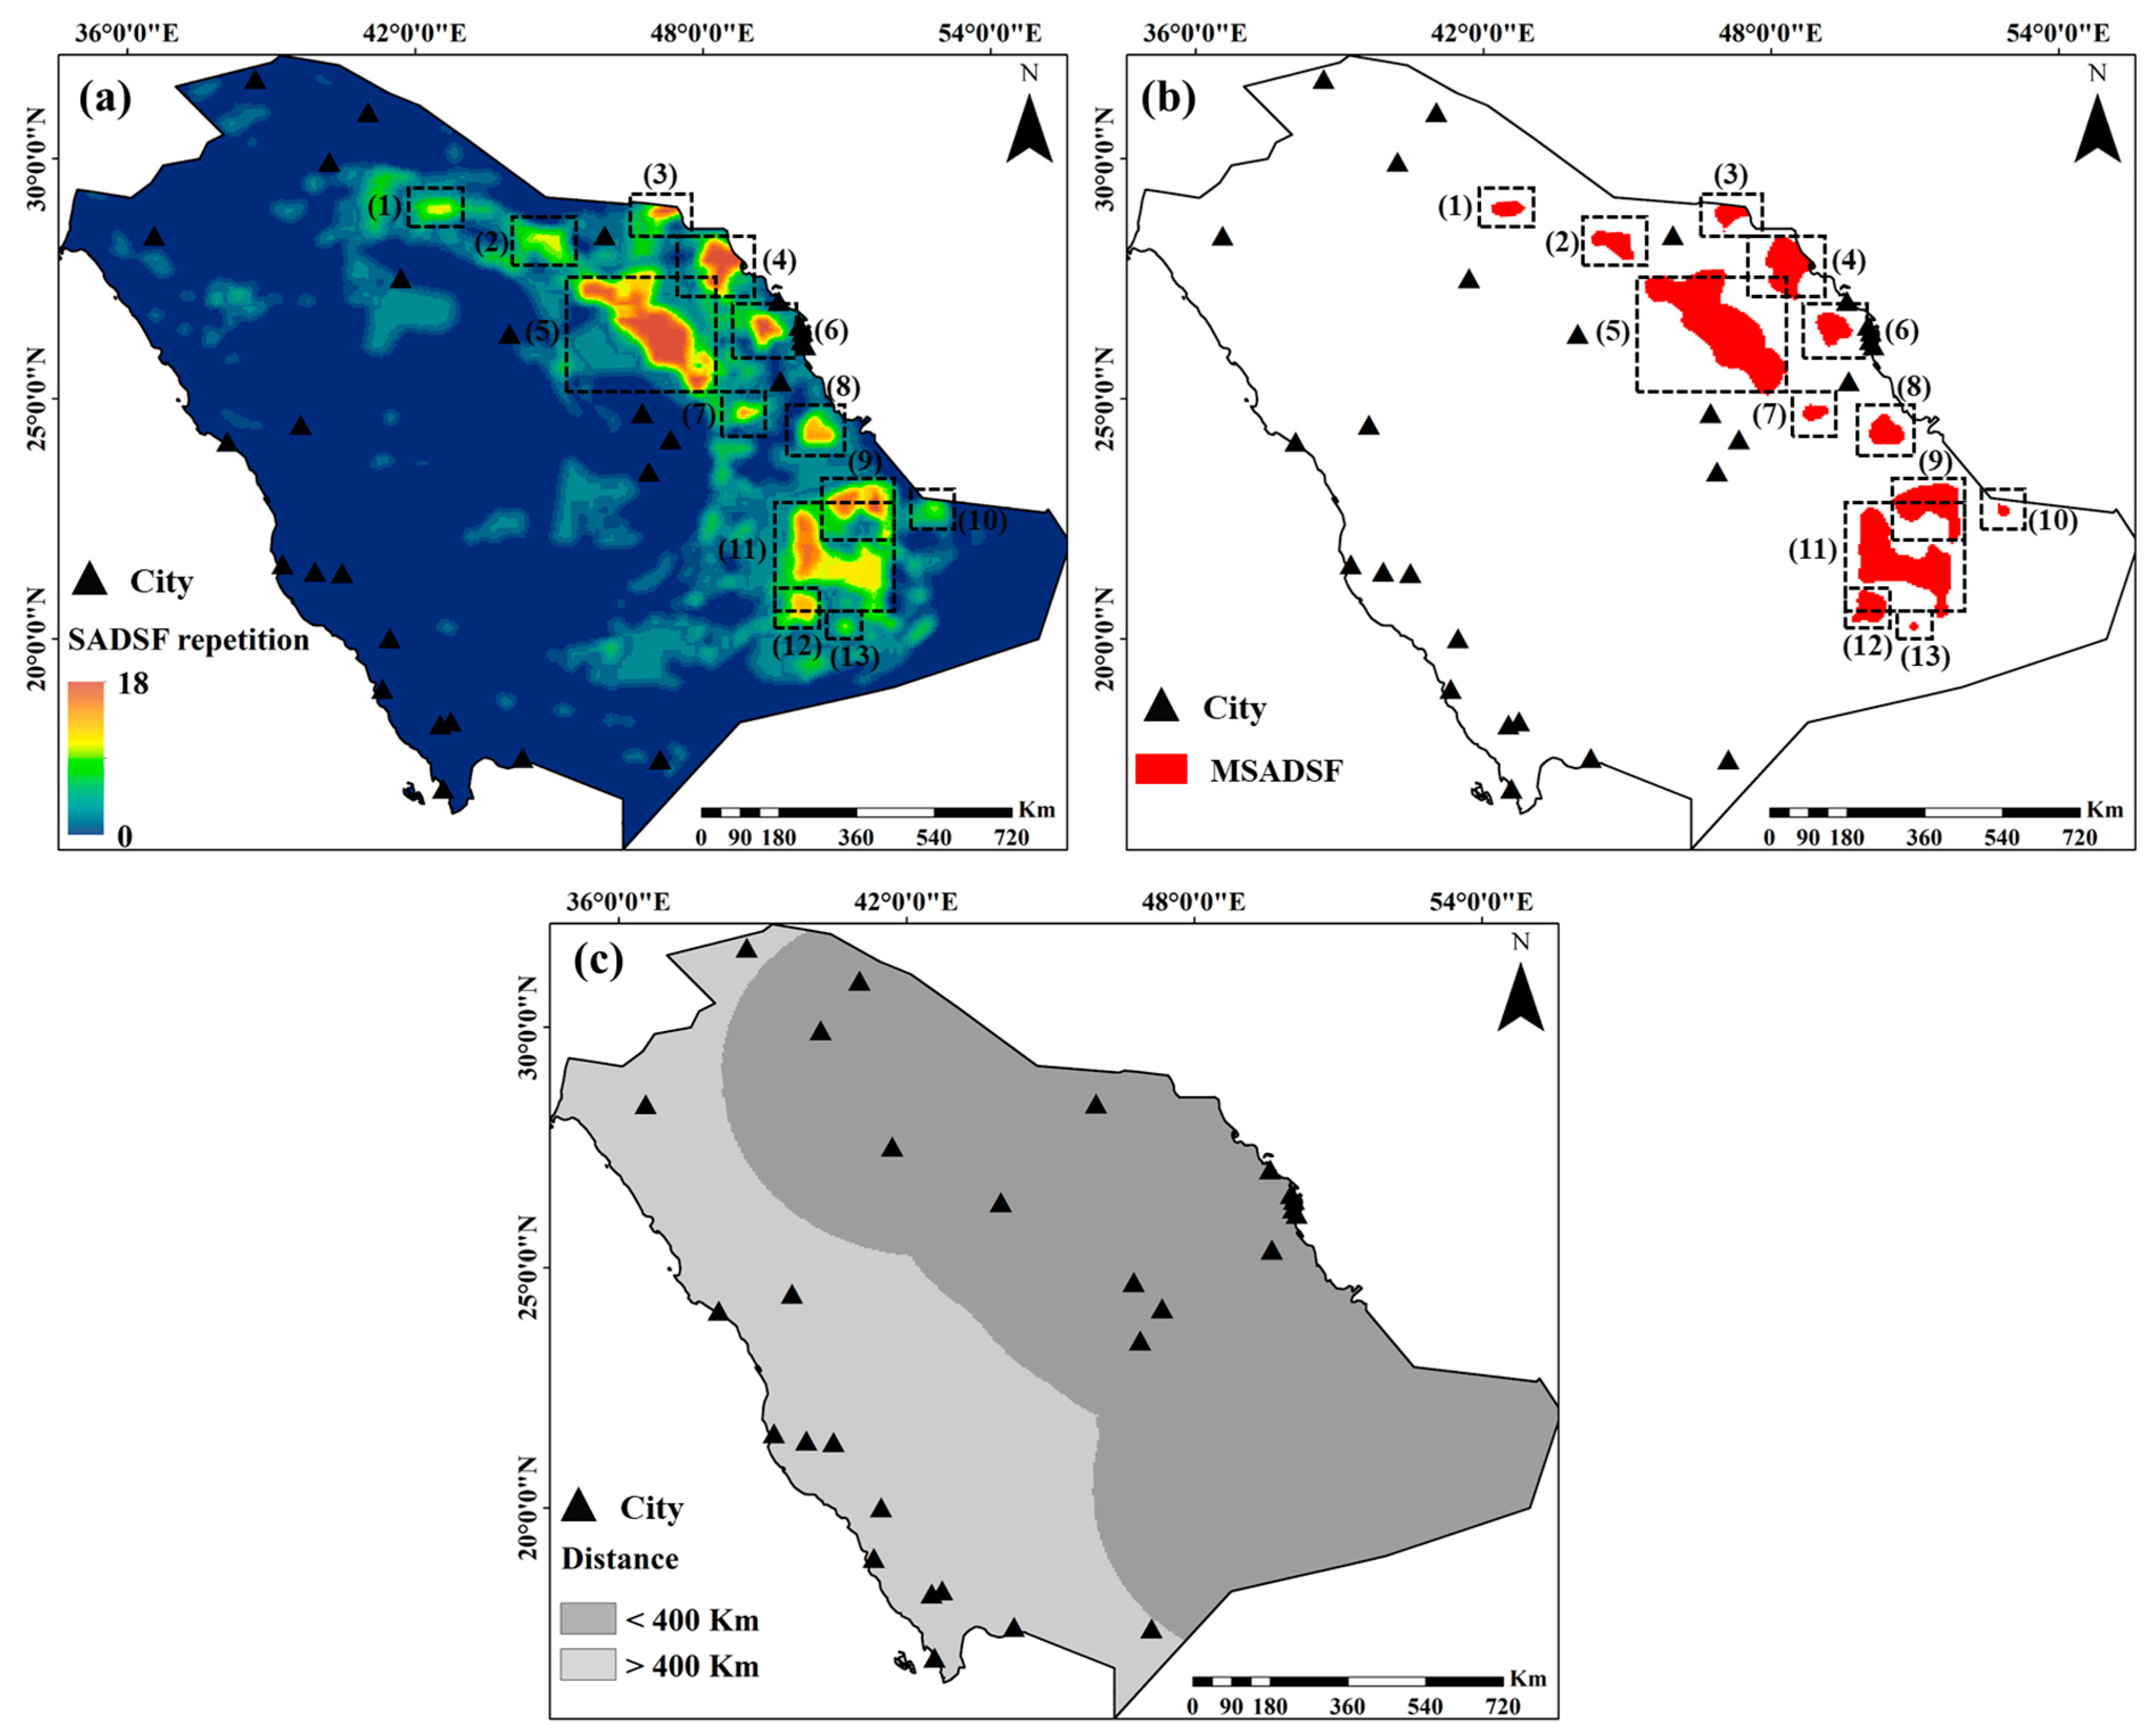
The SADSF repetition map over the period 2000–2021 is shown in Figure 3a. The frequency of dust sources during this period ranging from 0 to 18. 1,388,000 km2 (70%) from the study area were not identified as SADSF in any year during the period 2000–2021. Furthermore, 596,500 km2 (30%) from the study area was identified as SADSF for at least one year. Moreover, 12,925 km2 (0.6%) of the study area was identified as SADSF for 18 years. In this study, 13 major dust sources (with at least 8 years of repetition) were identified. The area of these SADSFs in the whole study area is 168,275 km2 (0.8%). All of the Major SADSF (MSADSF) are located in the eastern part of the region. Among these MSADSFs, 5 and 13, which are located in the Rub’ al Khali and Ad-Dahna deserts, are the largest MSADSFs. Sub-regions with a distance of more and less than 400 km from the SADSF cover 37% and 63% of the study area, respectively (Figure 3b). A number of main cities in the study area, such as Riyadh, Buraydah, Al Qatif, and Hail, are located near the MSADSF. In contrast, other main cities, such as Mecca, Jeddah, Medina, and Taif, are located farther away from the MSADSF. A total of 14 cities of study area are located in areas less than 400 km from the MSADSF, while another 14 cities are located further than 400 km from the MSADSF.
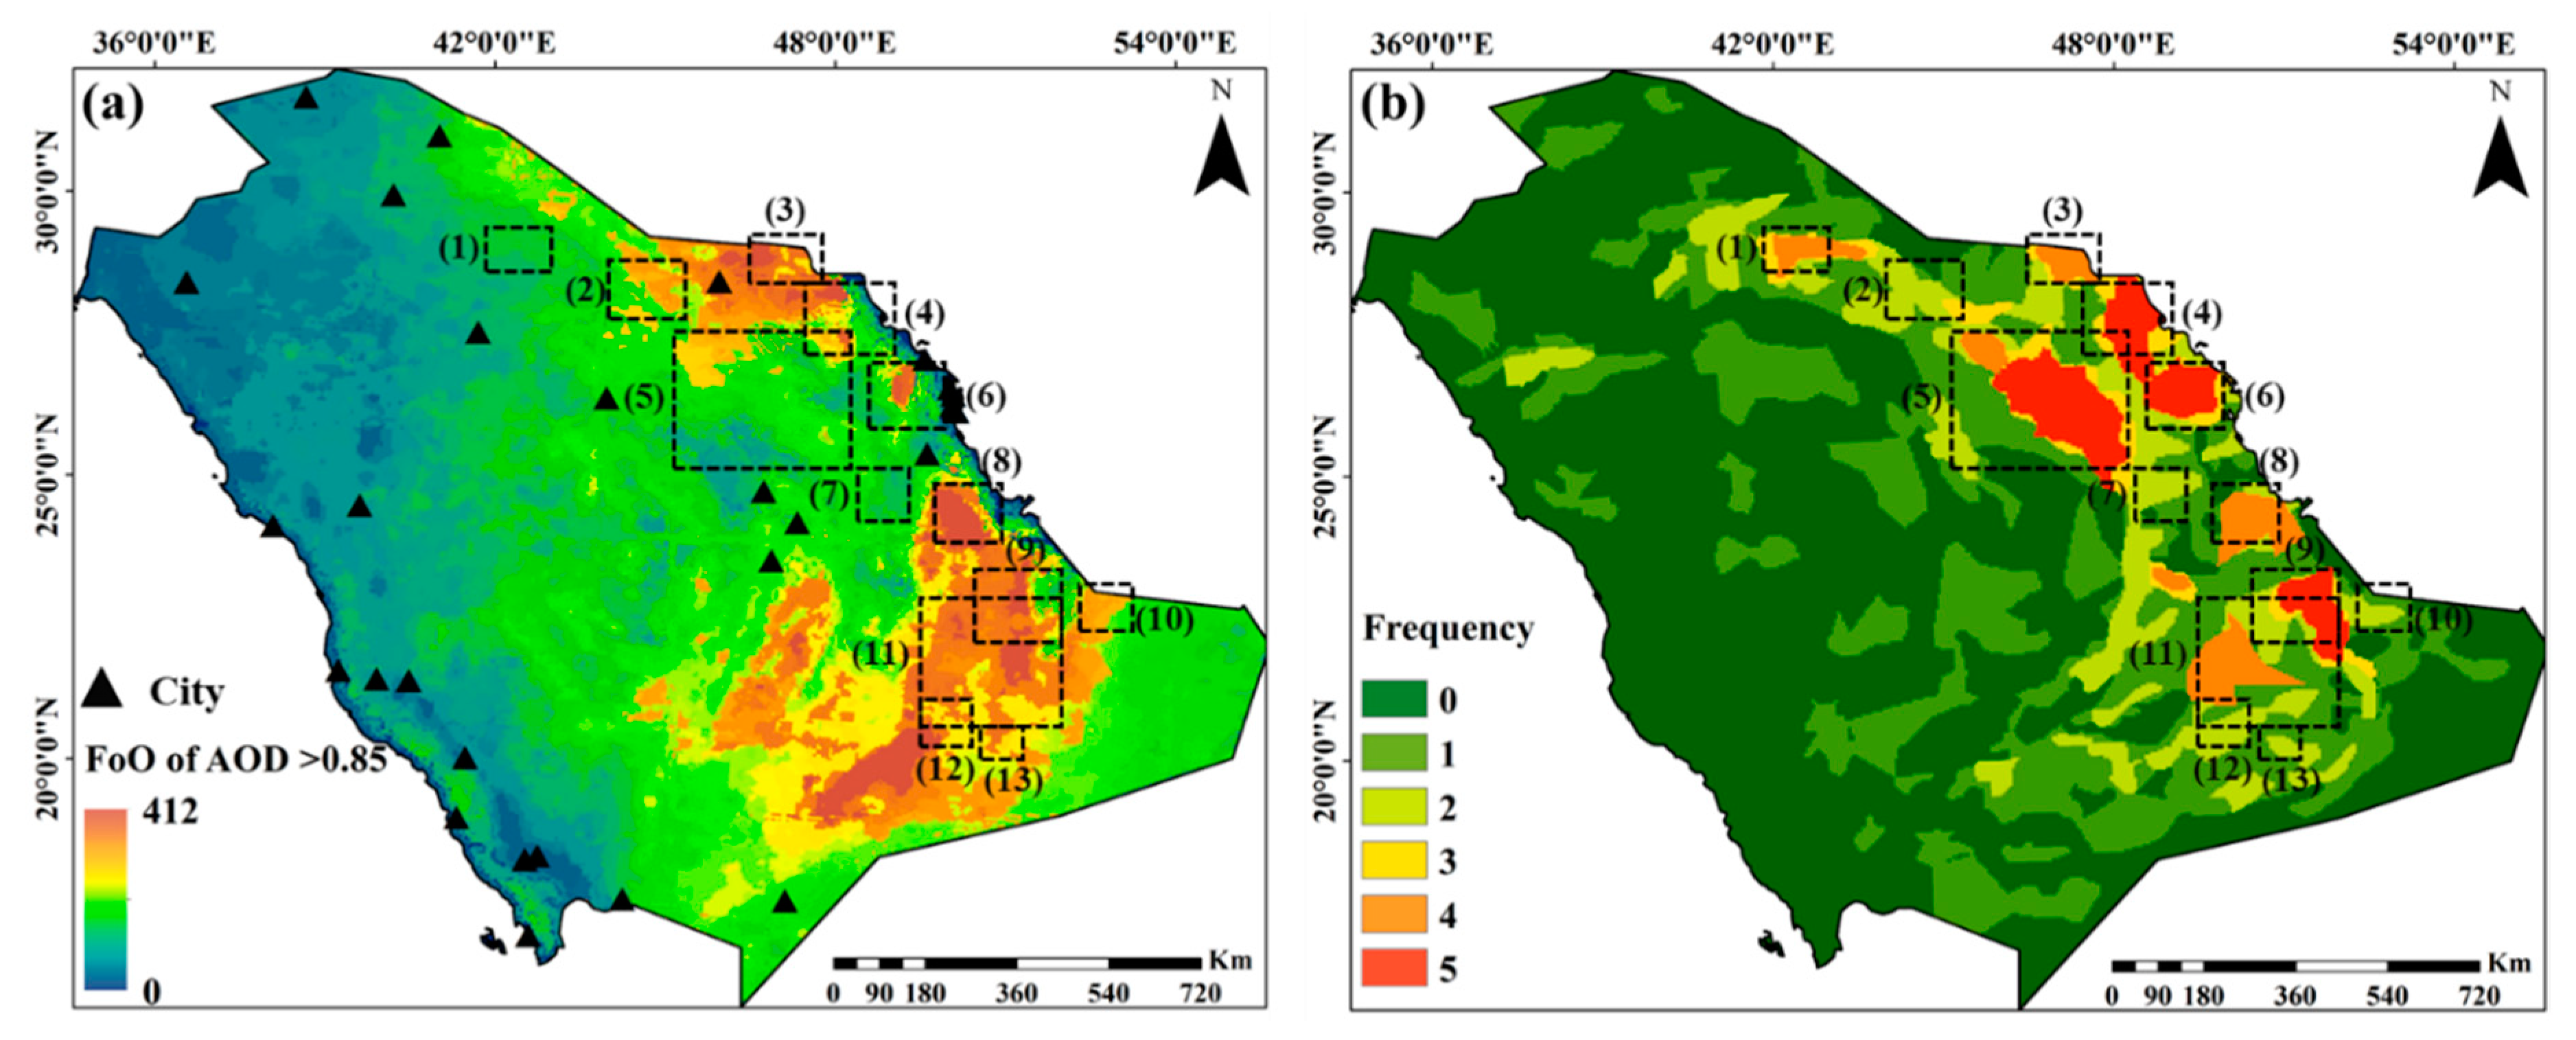
The frequency of occurrence (FoO) of high intensity dust storms (MODIS AOD > 0.85) map from the period of 2001 to 2021 is shown in Figure 4a. In most MSADSFss, the FoO of high intensity dust storms is high. MSADSF 1, 5, and 7 and MSADSF 13, 12, 11, 9, 8, and 3 account for the lowest and highest FoO of high intensity dust storms, respectively. In general, during this period, the MSADSF had about 300 days with AOD values greater than 0.85, which indicates that these dust sources are active. The eastern and southeastern regions of the study area have a large number of days with AOD values greater than 0.85, while this number is low in the western and northeastern regions. The MSADSF map prepared in this study shows results similar to those of the identified sources in previous studies [11,30,73,74,75] (Figure 4b). The identified MSADSF 5, 4, 6, and 9 in this study have also been identified in at least the last five studies. Moreover, MSADSF 1, 3, 8, and 11 have been identified in at least four previous studies. All MSADSFs that were identified in previous studies were also identified in this study [11,30,73,74,75]. The results of the evaluation with AOD products, as well as the results of previous studies, represent the high accuracy of the identified MSADSF in this study.

4.2. Built-Up Lands

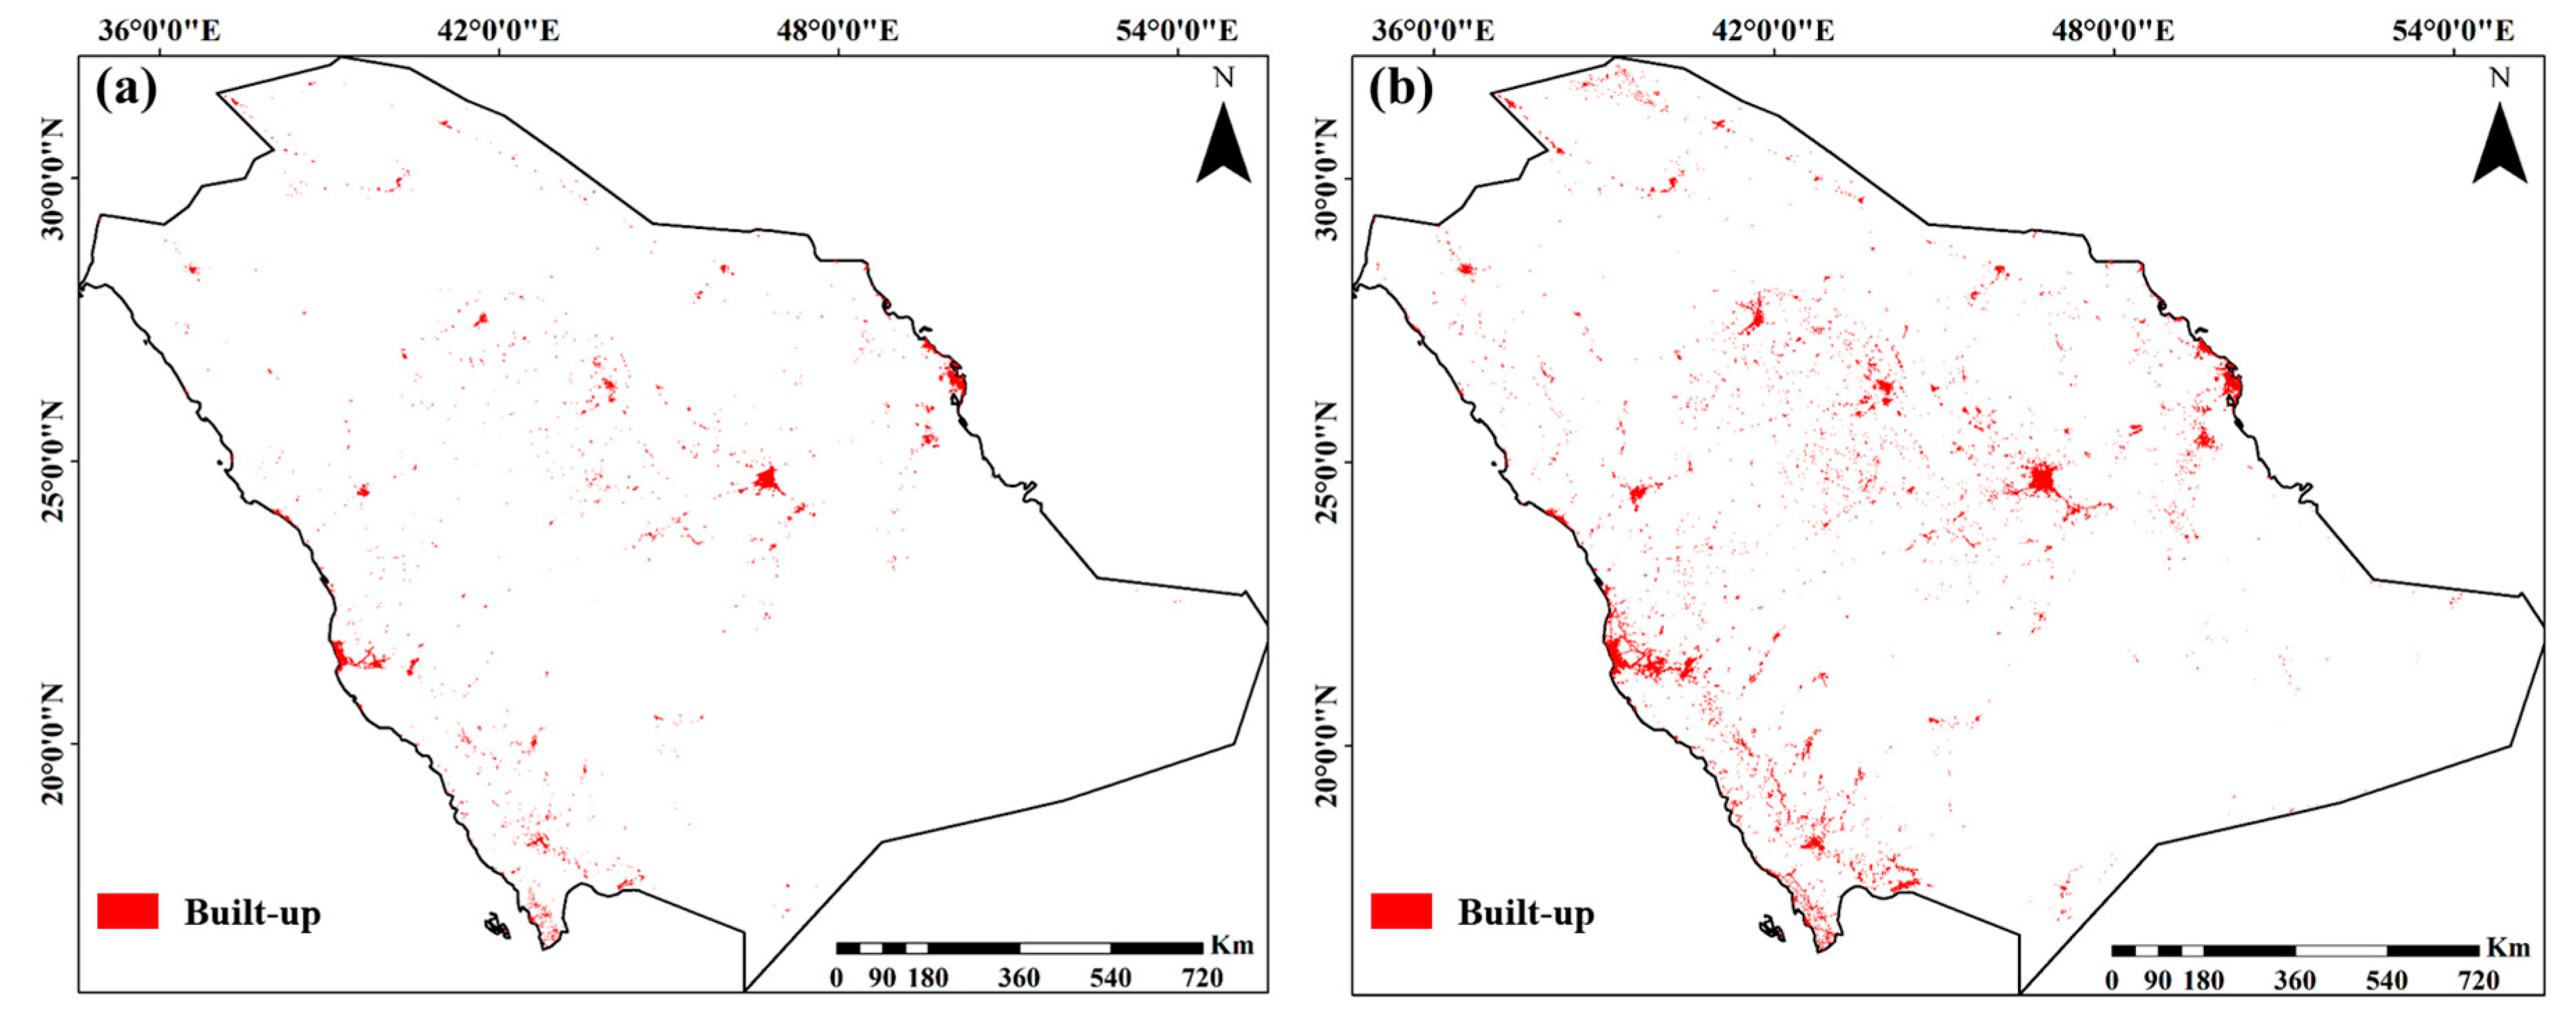
The spatial distribution maps of the built-up lands for the study area in 2000 and 2021 are shown in Figure 5. The built-up lands area of the study area in 2000 and 2021 were 5548 and 11,412 km2, respectively. The area of built-up lands during the period from 2000 to 2021 increased significantly (105%). The majority of the built-up lands are distributed in the eastern, central, western, and southwestern sub-regions of the study area. The physical growth of built-up lands in these sub-regions is also higher than other sub-regions. The southern and southeastern sub-regions of the study area have the lowest built-up lands area.
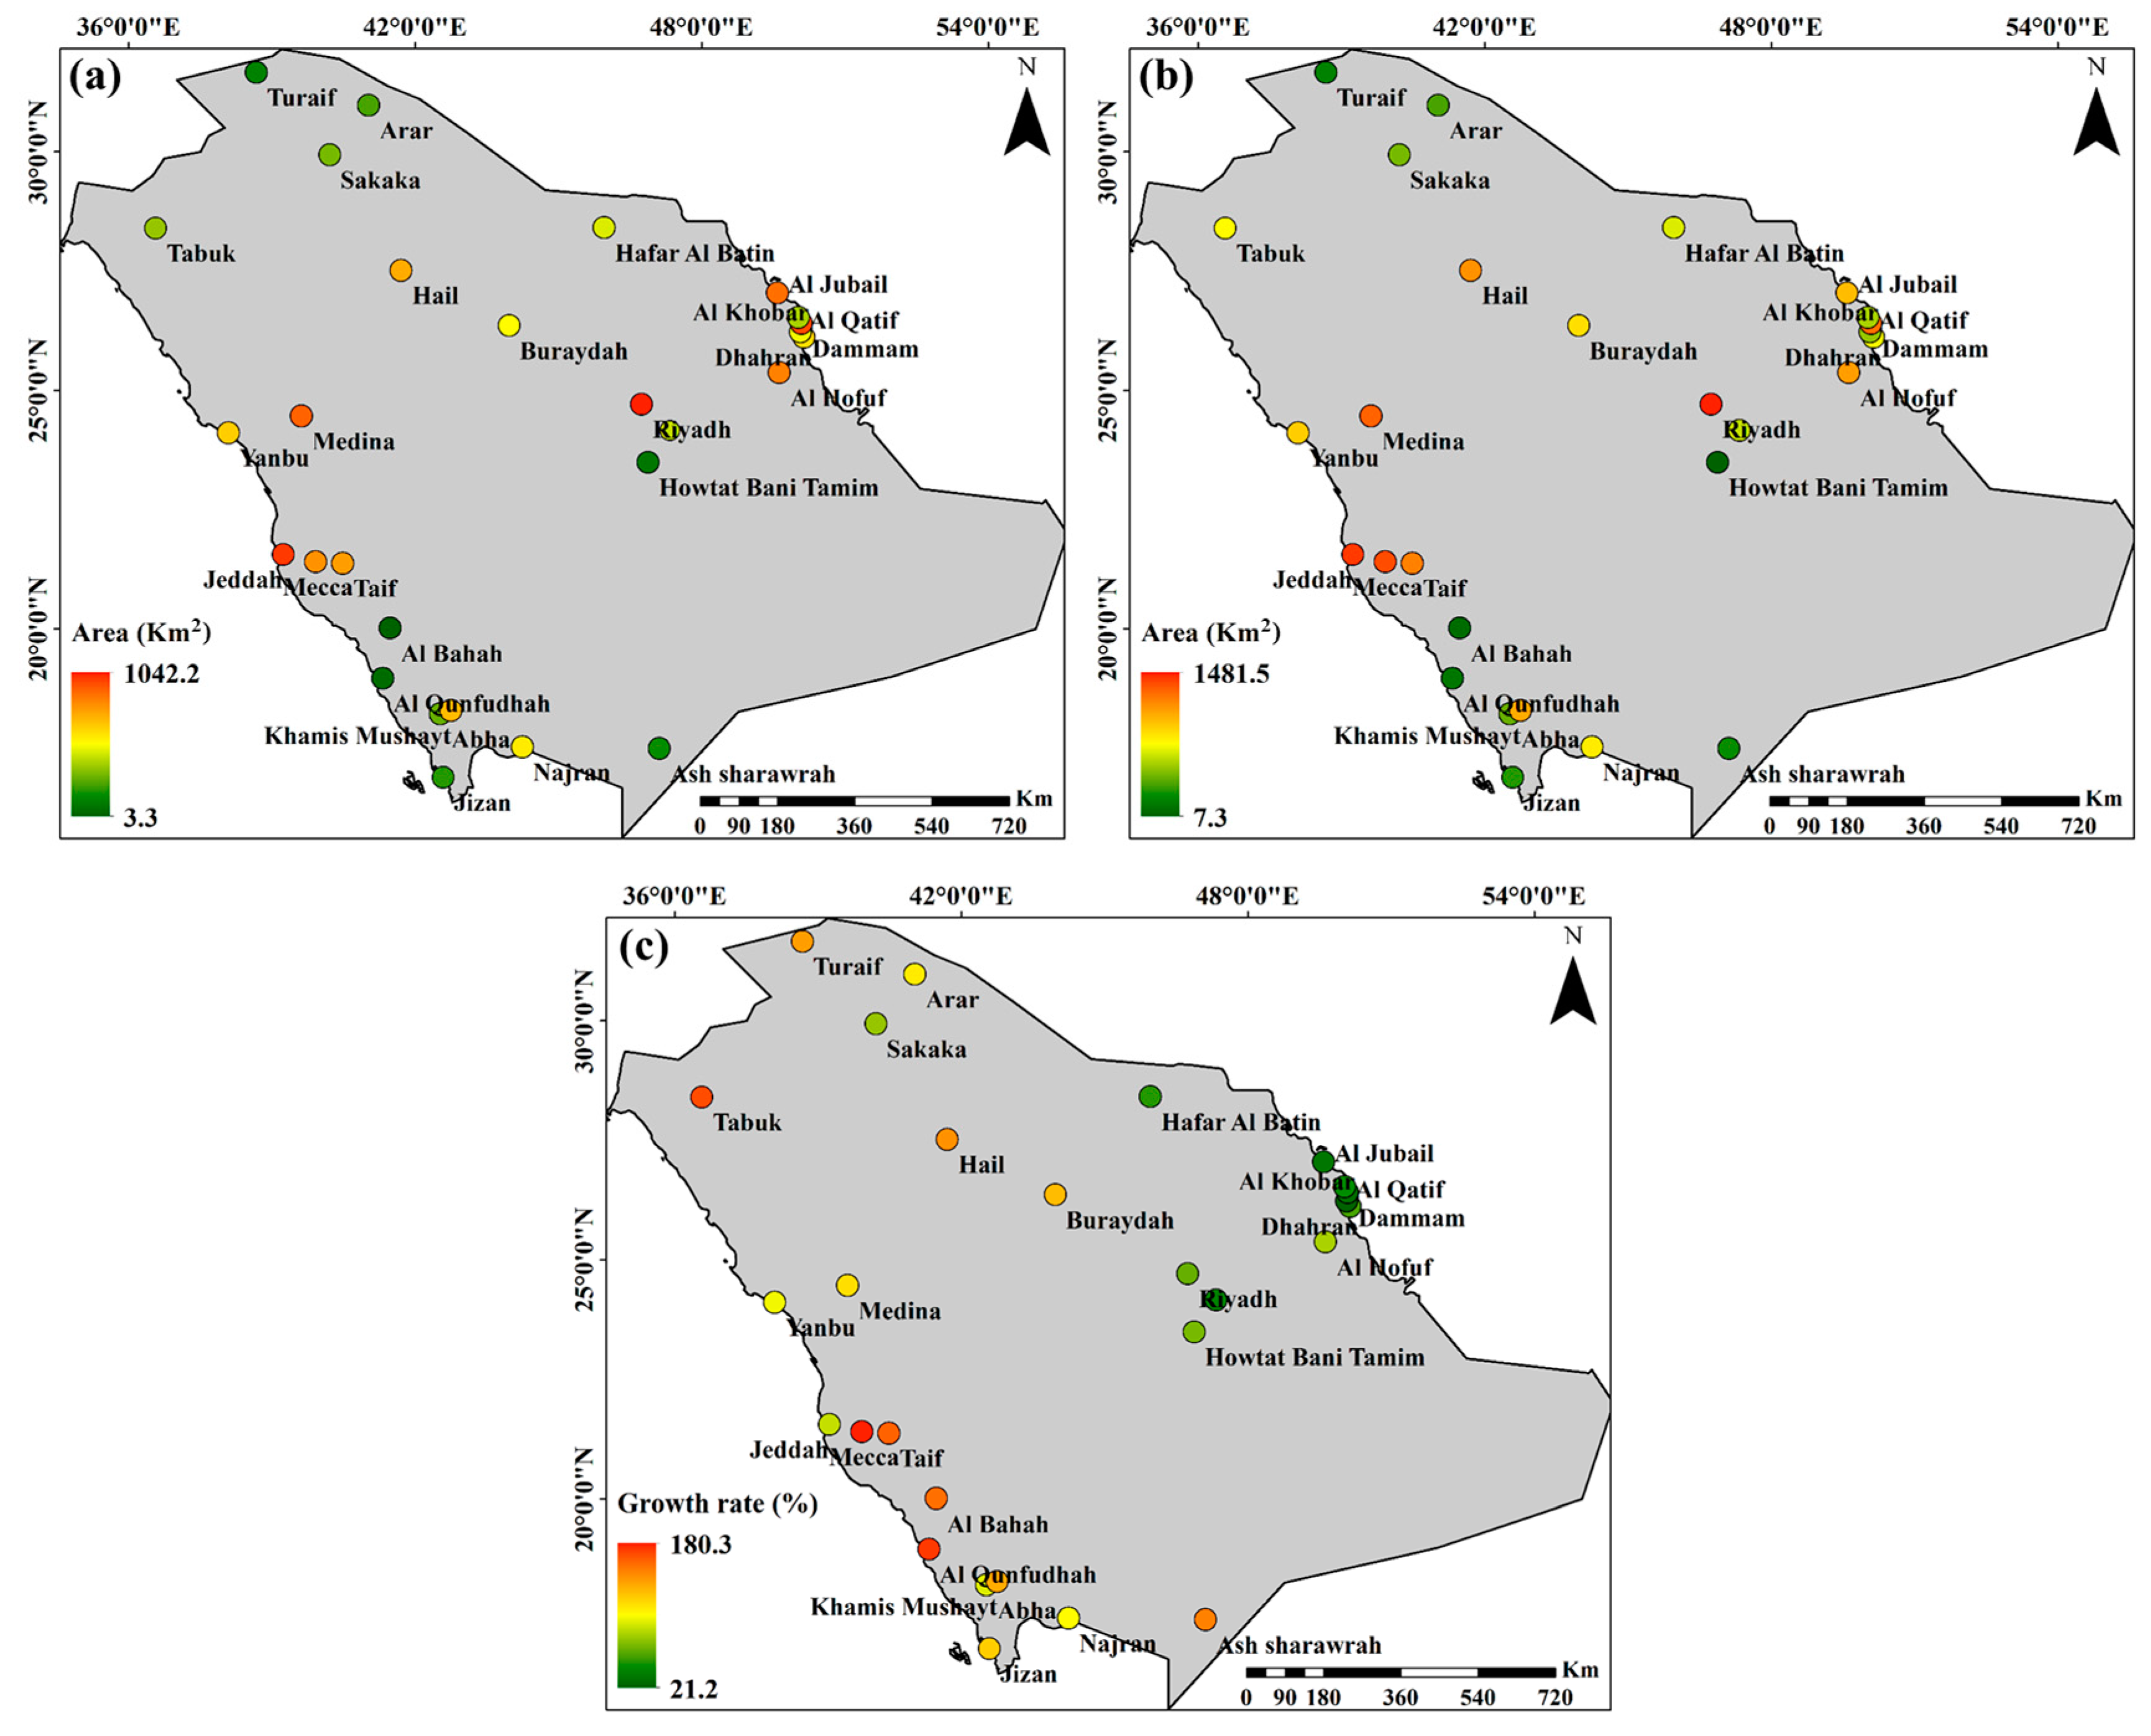
The built-up lands area of the main cities in 2000 and 2021, as well as the amount and the rate of physical growth in these cities, are shown in Figure 6 and Table 2. The lowest and highest areas of built-up lands for the cities under study in 2000 were 3.3 and 1042.2 km2, respectively, reaching 7.3 and 1481.5 km2, respectively, in 2021. The area of built-up lands varies in cities located in different geographical regions. The lowest area of built-up lands was observed in the northern and southwestern cities. The highest and lowest physical growth rate of the cities under study are 21.2% and 180.3%, respectively. The average physical growth rate of these cities was 15%. Moreover, the physical growth rate of cities located in the west is higher than cities located in the east of the study area.
The cities of Riyadh (1481.6 km2), Jeddah (883.1 km2), Mecca (401.2 km2), and Medina (336.4 km2) had the highest built-up lands areas in 2021, while the cities of Howtat Bani Tamim (7.3 km2), Al Bahah (8.5 km2), Al Qunfudhah (10.7 km2), and Turaif (19.7 km2) had the lowest built-up lands areas. The amount of increase in the built-up land areas of the important cities of Riyadh, Jeddah, Mecca, and Medina during the 2000–2021 period was 439.4, 324.0, 258.1, and 158.8 km2, respectively. The highest and lowest urban growth rates in this period were for Mecca (180.3%) and Dhahran (21.2%), respectively. The urban growth rate of the important cities of Mecca and Taif is higher than Riyadh and Al Jubail.

4.3. Trend in Vegetation Cover Changes

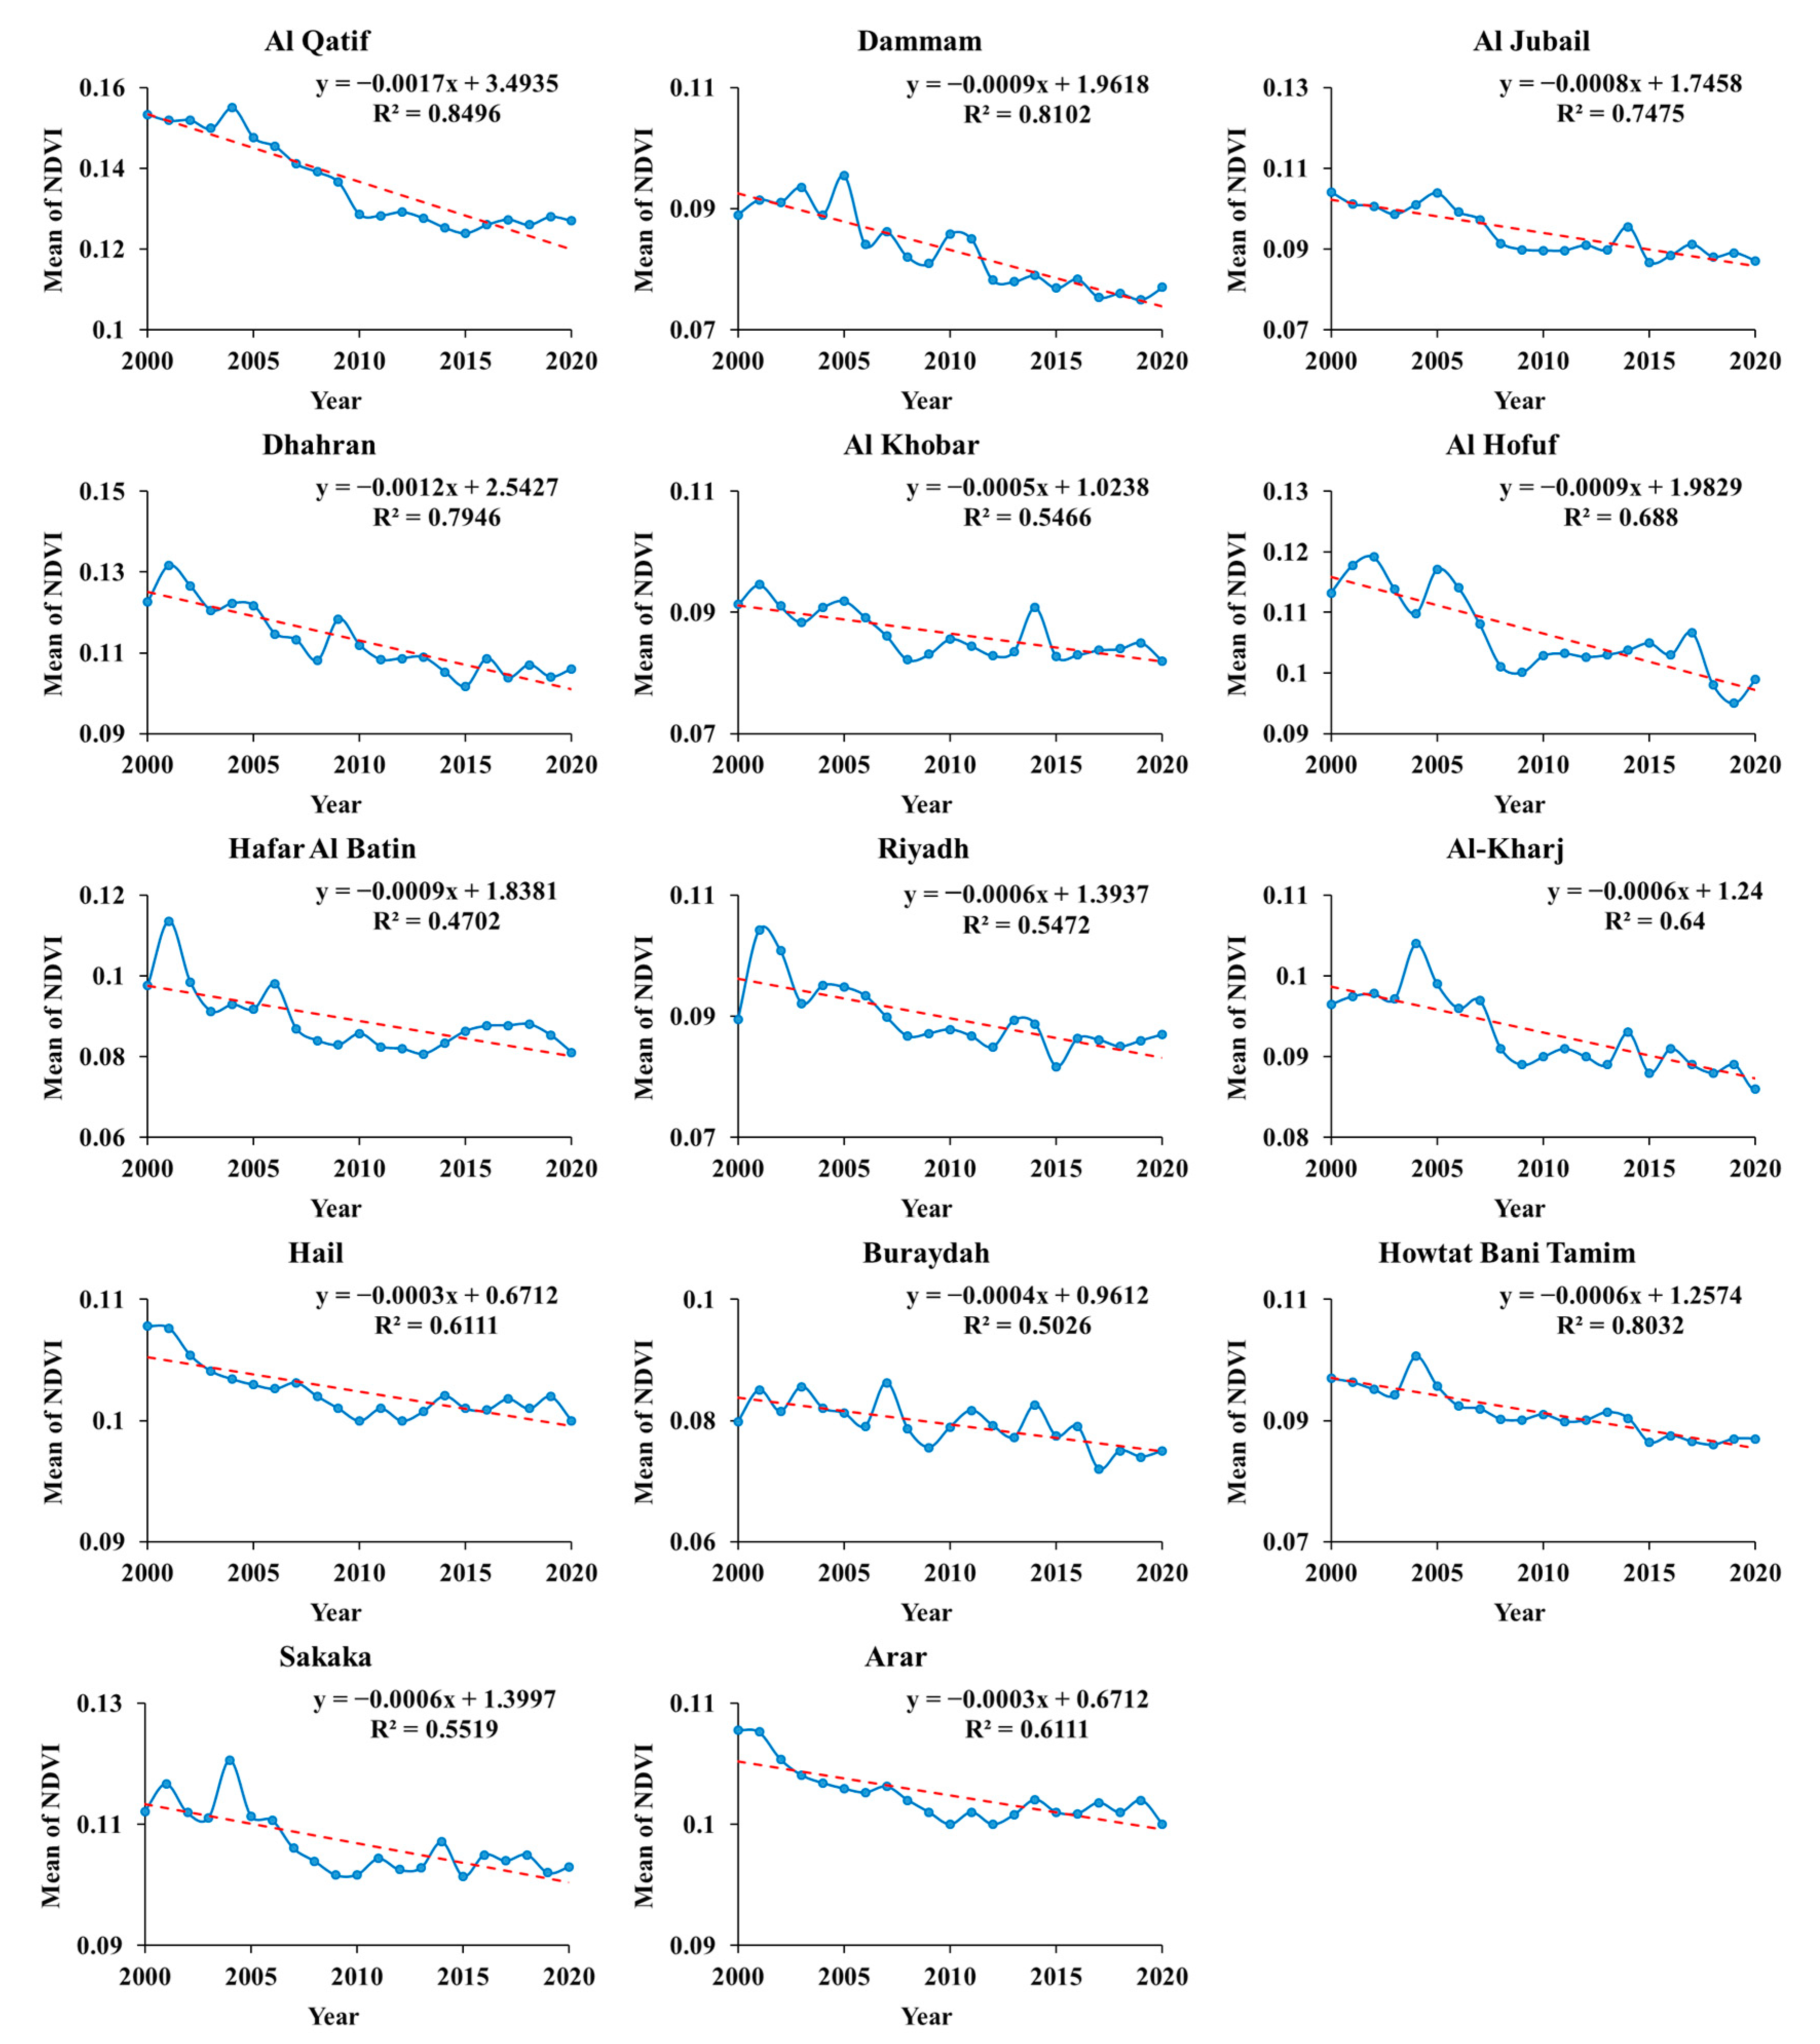
The trend of changes of the mean NDVI of cities located in DMDS < 400 km is shown in Figure 7. In all cities located in this sup-region, the trend of changes of the mean NDVI is negative, which indicates a reduction in vegetation cover in these cities during the 2000–2021 period. The intensity of vegetation cover changes is different for each city. The annual average rate of the mean NDVI reduction for these cities is 0.0009. The highest and lowest annual rate of the mean NDVI reduction was for the cities of Al Qatif (−0.0017) and Hail (−0.003), respectively.
The trend of changes of the mean NDVI of cities located in DMDS > 400 km is shown in Figure 8. The intensity and trend of vegetation cover changes vary across different cities. As can be observed, in Taif, Medina, and Tabuk, the changes trend of the mean NDVI is negative, which indicates a reduction in vegetation cover in these cities during the study period. In contrast, in other cities, such as Al Qunfudhah, Jeddah, Mecca, Al Bahah, and Abha, the changes trend of average NDVI is positive, which indicates increasing vegetation cover in these cities during the study period. The annual average rate of the mean NDVI reduction for these cities is 0.0001. Among different cities, the highest annual rate of the mean NDVI reduction was in Turaif (−0.001). Al Qunfudhah also had the highest rate of increasing vegetation cover in the study period.

4.4. Exploring the Impact of Dust Sources on the Physical Growth of Built-Up Lands

The area of urban built-up lands in sub-regions with DMDS < 400 km in 2000 and 2021 was 2280.0 and 3333.6 km2, respectively (see Table 3). These values for sub-regions with DMDS > 400 km are 1427.0 and 2787.9 km2, respectively. The results showed that the area of built-up lands in sub-regions with DMDS < 400 km is more than in sub-regions in DMDS > 400 km in 2000 and 2021. Nonetheless, the physical growth rate of cities located in sub-regions with DMDS < 400 km is 46.2%, while for cities located in DMDS areas > 400 km, it is 95.4%.
In 2000, the total area of built-up lands located in sub-regions with DMDS < 400 km and DMDS > 400 km was 3187.2 and 2174.8 km2, respectively (Table 4). In 2021, these values reached 5896.6 and 5245.9 km2, respectively. The built-up lands areas for these sub-regions during the period from 2000 to 2021 increased to 2709.4 and 3071.0 km2, respectively. The growth rate of the total built-up lands in the study area, including both urban and rural DMDS < 400 km and DMDS > 400 km areas, is 85.0% and 141.2%, respectively. These results indicate that the growth rate of built-up lands areas in sub-regions farther from the MSADSF is higher than it is in the closer sub-regions.
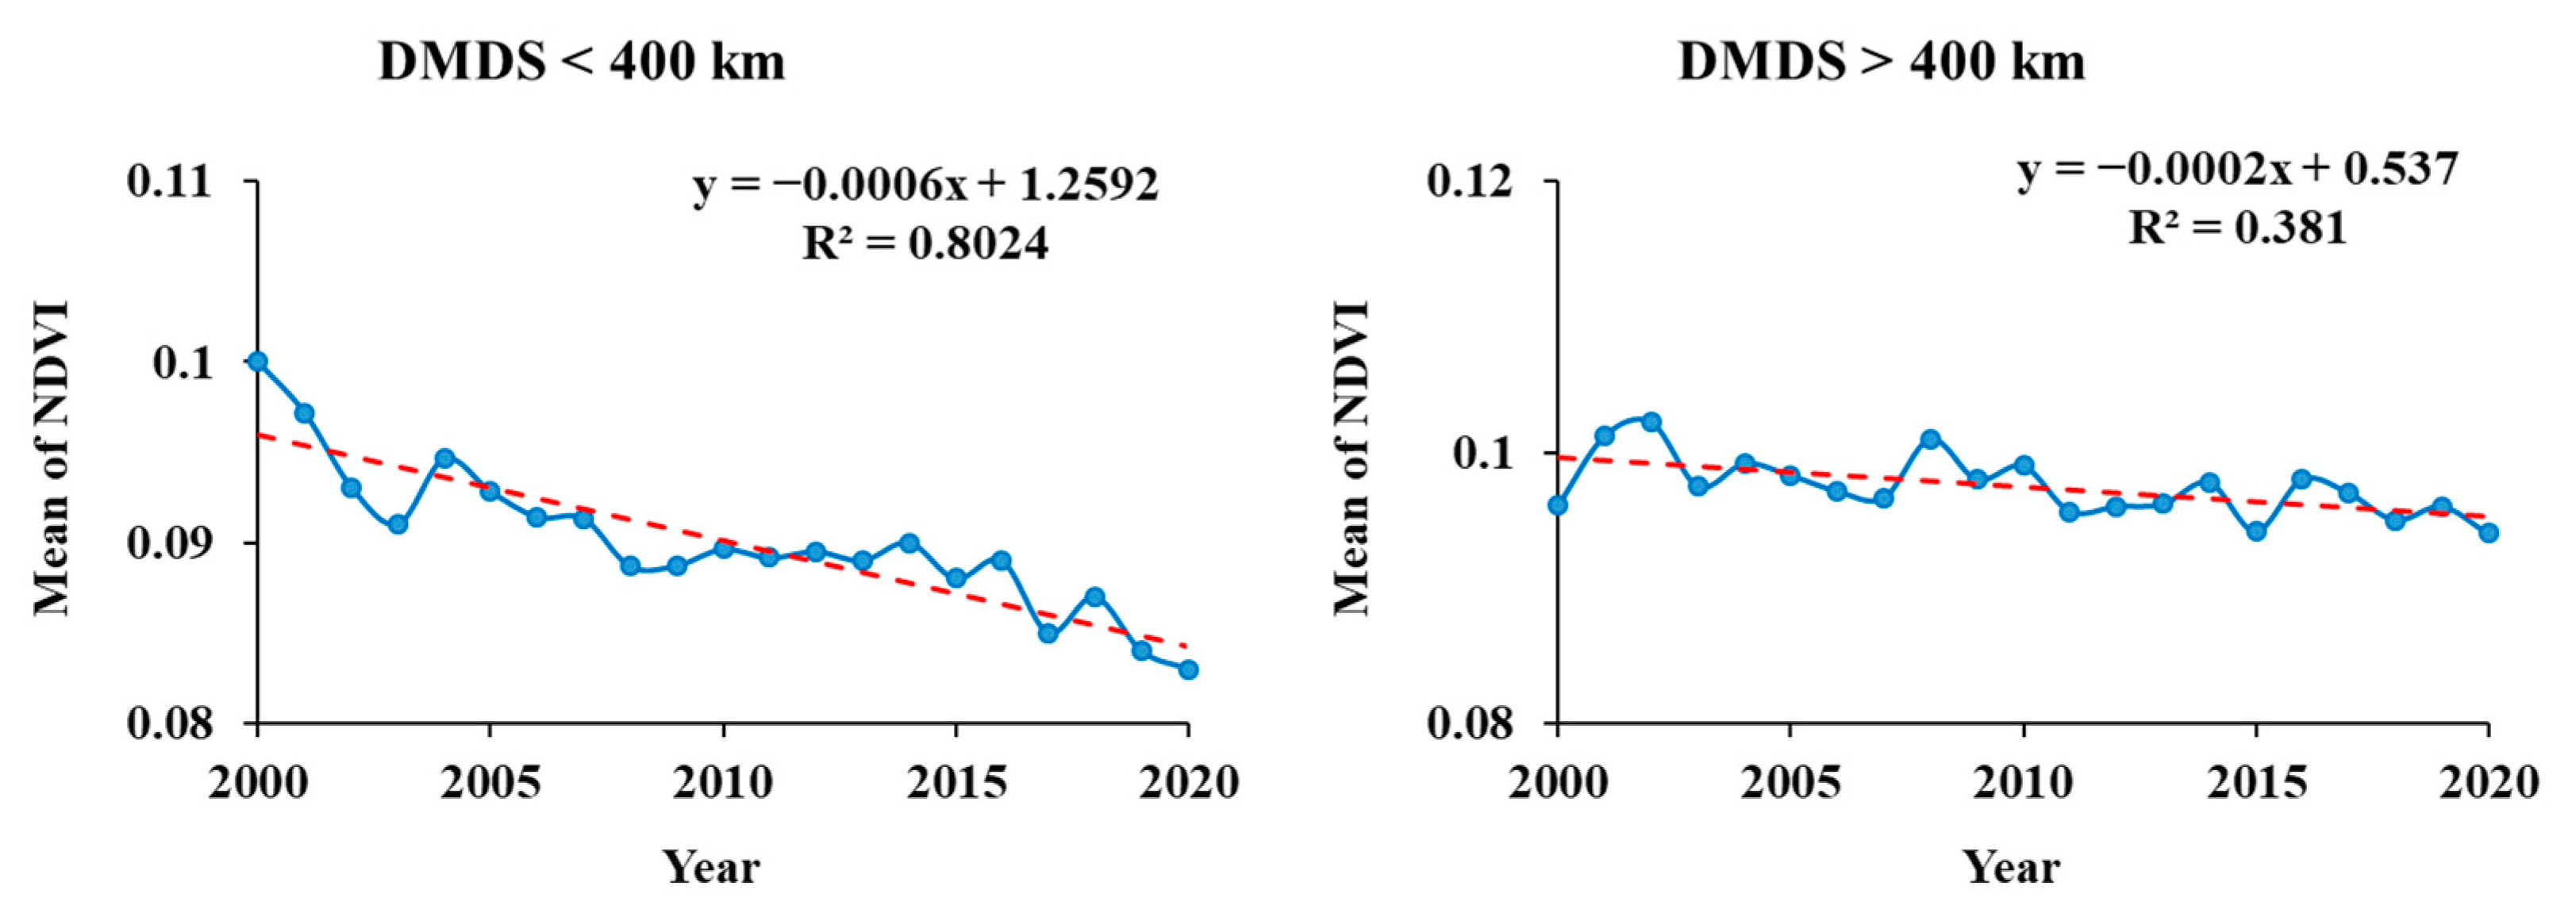
The trend of changes of the mean NDVI for sub-regions located in DMDS < 400 km and >400 km is shown in Figure 9. Vegetation cover decreased in both sub-regions from 2000 to 2021. However, the annual rate of the mean NDVI reduction in the sub-region of the DMDS < 400 km is 0.0006, whereas this value in the DMDS > 400 km sub-region is 0.0002. The reduction rate of vegetation cover in sub-regions close to the MSADSF is three times higher than the sub-regions farther from the MSADSF.
Scatter plots between the distance from major dust source (DMDS) and urban growth rate (UGR) and NDVI change rate are shown in Figure 10. The R2 between the DMDS and urban growth rate and NDVI change rate were 0.52 and 0.73, respectively, which indicates the high impact of dust sources on the physical growth of cities and vegetation status.

5. Discussion

In our contemporary world, dust storms are one of the most important environmental crises. This phenomenon occurs mostly in arid and semi-arid regions, but it sometimes affects their neighboring areas [76]. Dust storms have many negative effects on the economy, the environment, human health, various industries, and more. Therefore, identifying the geographical locations of active dust sources and quantifying their negative effects is valuable.
The models used to identify dust sources in previous studies can be classified into four categories: statistical and meteorological, numerical, remote sensing, and hybrid methods. In meteorological and statistical methods, changes in meteorological parameters and their trends in recent years are examined [19,20]. In numerical modeling, an effort is made to quantitatively model all steps of the particulate cycle (including diffusion, transport, and deposition) using relationships whose components are the parameters involved in wind erosion [11,21,22]. In remote sensing approaches, only data directly extracted from satellite images are used [23,24,25]. Hybrids models, unlike previous models, are not limited to one data source and can use any of the environmental parameters involved in the dust process [9,12,26,27,28,29,30]. In this study, a hybrid model was used to identify dust sources in Saudi Arabia. In this method, which is more efficient than other methods, a set of data obtained from different sources is used to identify dust sources.
In order to identify dust sources based on the proposed hybrid model, parameters of LST, vegetation cover, soil moisture, precipitation, air humidity, wind speed, and soil erodibility were used. All these parameters have been employed in various studies as effective criteria to identify dust sources. Physically, each of these effective criteria have a special effect on the creation of dust sources. Poor land cover causes strong winds to erode bare soils and transport them to other regions [77,78,79,80]. Hence, the lowest cost and most effective method to prevent wind erosion is to use natural vegetation cover, and the greater the vegetation coverage, the more positive effect it has [77]. If the land surface always has natural vegetation cover, wind erosion will be negligible, and dust sources will not form. Alternatively, soil moisture prevents the generation of dust [81]. Another characteristic of soil that is effective in preventing wind erosion is particle adhesion. Greater adhesion of soil particles induces the more resistant the soil to wind erosion [82,83]. Wind speed is another very important parameter in the diffusion and transport of dust particles. The role of wind in erosion is important in two ways. First, wind is the main cause of wind erosion. Second, wind increases evaporation and reduces soil moisture, which makes it prone to wind erosion [84,85]. Precipitation is one of the key parameters in the reduction in dust storms. When precipitation increases in an area, the formation probability of dust storms decreases [86,87]. The temperature parameter decreases soil moisture by increasing the rate of evaporation, subsequently leading to wind erosion [85,86,88,89]. Air humidity indirectly causes dust emissions by affecting the wind speed threshold [90].
This study quantified the impact of dust sources on the vegetation status and physical growth of cities in Saudi Arabia. The results showed that the factor of distance from dust sources effects both the vegetation status and the physical growth of cities. Cities located close to dust sources are more impacted by the negative effects of these sources. Consequently, the rate of physical growth and the reduction rate of vegetation cover in these cities is higher than in other cities. Other studies investigated the physical and chemical effects of dust on plants, including the effects on photosynthesis, respiration, transpiration, infiltration of contaminants into the plant, and reduced plant resistance to drought, all of which reduce the quality and quantity of vegetation cover [91,92].
Moreover, microbiological studies have shown that dust can include a wide range of microorganisms, such as fungi, bacteria, and viruses, which can cause disease in a number of organisms, such as trees, plants, animals, and humans [93]. Moreover, the nearer a city is to dust sources, the greater the threats to the economic and physical health, social security, environmental security, and food and water security of its inhabitants. In turn, the tendency of these city’s inhabitants to migrate is greater than those in other cities. Hence, the physical growth of these cities is less than other cities. By combining remote sensing capabilities and other information systems, this study quantified the effect of dust sources on the vegetation status and physical growth of cities.
Physical growth and vegetation change of cities are affected by various factors including environmental, social, economic, and political conditions. The influence of each of these factors is different. It is even possible that the influence of social, economic, and political factors is more than the environmental factor. Furthermore, environmental factors affecting physical growth and vegetation change of cities can include the distance from dust sources, topography, precipitation and climatic conditions, distance from open waters, distance from the capital and big cities, etc. Quantifying the impact of social, economic, and political factors on the physical growth and vegetation change of cities is complex in terms of access to spatial and temporal data and modeling. Therefore, considering the importance of dust sources in the West Asian region and its environmental challenges, in this study, only the impact of dust sources on the physical growth and vegetation change of cities has been evaluated with an emphasis on remote sensing data. Various analyses have been performed to prove the significance of the negative impact of dust sources on the physical growth and vegetation change of cities. Naturally, in the presented results, there is also the effect of other factors, but the effect of the distance from the dust sources on the physical growth and the change of the vegetation cover of the cities is noticeable. For example, in all the cities located near dust sources, the amount of vegetation has decreased significantly in the past years. However, in some cities located in the western half of the study area (distance > 400 km), the amount of vegetation has even increased. Moreover, our aim is to evaluate the impact of dust sources located inside Saudi Arabia on the physical growth and vegetation of cities. However, dust sources have direct and indirect effects, and their sphere of influence reaches several thousands of kilometers away. As a result, it is probable that the sources of dust outside Saudi Arabia are also effective on the physical growth and vegetation of the studied cities. As a result, we have to determine the boundary of the study area based on a standard. In this study, only dust sources located inside Saudi Arabia have been considered as target effective dust sources. It is suggested to evaluate the impact of dust sources outside Saudi Arabia and other effective parameters such as economic, social, and political factors on the physical growth and vegetation of these cities in future studies.

6. Conclusions

Identifying dust generating sources and factors that affect their expansion and intensification can help policymakers and decision-makers to provide solutions for mitigating the adverse effects on the natural and human environment. Moreover, quantifying the negative effects of dust sources on various aspects of economic, environmental, and human health is of great importance. The aim of this study is to evaluate and quantify the impact of dust sources located inside Saudi Arabia on the physical growth and vegetation status of cities in Saudi Arabia. The results indicate that soil erodibility and wind speed are the most effective criteria in identifying dust sources. In this study, 25 km2 of the study area was not identified as a dust source in any year during the study period, while 15 km2 of the study area was identified as dust sources in at least one year of the study period. Finally, 13 major dust sources (with at least 8 years of repetition) were identified. The results of the evaluation with AOD products, as well as the results of previous studies, indicate the high accuracy of the identified major dust sources in this study. The 14 main cities of the study area are located in the DMDS < 400 km sub-region, while the other 14 cities are located in the DMDS < 400 km sub-region. The area of built-up lands varies in cities located in different geographical locations. Northern and southwestern cities have the lowest built-up lands areas. The physical growth rate of cities located in the west is higher than in cities located in the east of the study area. Compared to the areas closer to dust sources, the growth of built-up lands areas is greater in areas that are farther from dust sources. In all cities located close to dust sources, the trend of changes in the average NDVI is negative, which indicates decreasing vegetation cover in these cities during the period from 2000 to 2021. The reduction rate of vegetation covers in areas close to dust sources is three times higher than in areas farther from dust sources. Hence, it can be concluded that dust sources have a high impact on the physical growth of cities and their vegetation status. The results of this study indicate the significant value of satellite data in identifying dust sources and their negative effects on the urban environment. Future studies should consider the effect of dust sources on other parameters in the urban environment, including water quality and urban ecological conditions. Additionally, spatial predictions of the trends in changes of dust sources based on prediction models such as Cellular Automata (CA)-Markov or neural network could also be useful in managing negative effects.

Author Contributions

Y.A. and S.Q. conceived and designed the research of the first draft and wrote the first draft; Y.A. and S.Q. re-designed the research, S.Q., Y.A., M.E.A., and M.H.S. revised and edited the paper. All authors have read and agreed to the published version of the manuscript.

Funding

This research work was funded by Institutional Fund Projects under grant no. (IFPDP-241-22).

Data Availability Statement

The data used to support the findings of this study are available from the corresponding author upon reasonable request.

Acknowledgments

Therefore, the authors gratefully acknowledge technical and financial support from Ministry of Education and Deanship of Scientific Research (DSR), King Abdulaziz University (KAU), Jeddah, Saudi Arabia. The article processing charge was funded by the Deutsche Forschungsge-meinschaft (DFG, German Research Foundation)—491192747 and the Open Access Publication Fund of Humboldt-Universität zu Berlin.

Conflicts of Interest

The authors declare no conflict of interest.

References

  1. Chi, Y.; Zhang, Z.; Xie, Z.; Wang, J. How human activities influence the island ecosystem through damaging the natural ecosystem and supporting the social ecosystem? J. Clean. Prod. 2020, 248, 119203. [Google Scholar] [CrossRef]
  2. Lindenmayer, D.; Thorn, S.; Banks, S. Please do not disturb ecosystems further. Nat. Ecol. Evol. 2017, 1, 1–3. [Google Scholar] [CrossRef] [PubMed]
  3. Firozjaei, M.K.; Weng, Q.; Zhao, C.; Kiavarz, M.; Lu, L.; Alavipanah, S.K. Surface anthropogenic heat islands in six megacities: An assessment based on a triple-source surface energy balance model. Remote Sens. Environ. 2020, 242, 111751. [Google Scholar] [CrossRef]
  4. Firozjaei, M.K.; Sedighi, A.; Firozjaei, H.K.; Kiavarz, M.; Homaee, M.; Arsanjani, J.J.; Makki, M.; Naimi, B.; Alavipanah, S.K. A historical and future impact assessment of mining activities on surface biophysical characteristics change: A remote sensing-based approach. Ecol. Indic. 2021, 122, 107264. [Google Scholar] [CrossRef]
  5. Moghaddam, M.H.R.; Sedighi, A.; Fasihi, S.; Firozjaei, M.K. Effect of environmental policies in combating aeolian desertification over Sejzy Plain of Iran. Aeolian Res. 2018, 35, 19–28. [Google Scholar] [CrossRef]
  6. Aher, G.; Pawar, G.; Gupta, P.; Devara, P. Effect of major dust storm on optical, physical, and radiative properties of aerosols over coastal and urban environments in Western India. Int. J. Remote Sens. 2014, 35, 871–903. [Google Scholar] [CrossRef]
  7. Gabarrón, M.; Faz, A.; Acosta, J. Soil or dust for health risk assessment studies in urban environment. Arch. Environ. Contam. Toxicol. 2017, 73, 442–455. [Google Scholar] [CrossRef]
  8. Shao, Y.; Wyrwoll, K.-H.; Chappell, A.; Huang, J.; Lin, Z.; McTainsh, G.H.; Mikami, M.; Tanaka, T.Y.; Wang, X.; Yoon, S. Dust cycle: An emerging core theme in Earth system science. Aeolian Res. 2011, 2, 181–204. [Google Scholar] [CrossRef]
  9. Boloorani, A.D.; Kazemi, Y.; Sadeghi, A.; Shorabeh, S.N.; Argany, M. Identification of dust sources using long term satellite and climatic data: A case study of Tigris and Euphrates basin. Atmos. Environ. 2020, 224, 117299. [Google Scholar] [CrossRef]
  10. Kang, L.; Huang, J.; Chen, S.; Wang, X. Long-term trends of dust events over Tibetan Plateau during 1961–2010. Atmos. Environ. 2016, 125, 188–198. [Google Scholar] [CrossRef]
  11. Gherboudj, I.; Beegum, S.N.; Ghedira, H. Identifying natural dust source regions over the Middle-East and North-Africa: Estimation of dust emission potential. Earth-Sci. Rev. 2017, 165, 342–355. [Google Scholar] [CrossRef]
  12. Tsolmon, R.; Ochirkhuyag, L.; Sternberg, T. Monitoring the source of trans-national dust storms in north east Asia. Int. J. Digit. Earth 2008, 1, 119–129. [Google Scholar] [CrossRef] [Green Version]
  13. Middleton, N.J. Desert dust hazards: A global review. Aeolian Res. 2017, 24, 53–63. [Google Scholar] [CrossRef]
  14. Painter, T.H.; Barrett, A.P.; Landry, C.C.; Neff, J.C.; Cassidy, M.P.; Lawrence, C.R.; McBride, K.E.; Farmer, G.L. Impact of disturbed desert soils on duration of mountain snow cover. Geophys. Res. Lett. 2007, 34, 1–6. [Google Scholar] [CrossRef] [Green Version]
  15. Thalib, L.; Al-Taiar, A. Dust storms and the risk of asthma admissions to hospitals in Kuwait. Sci. Total Environ. 2012, 433, 347–351. [Google Scholar] [CrossRef]
  16. Kaiser, J. Mounting evidence indicts fine-particle pollution. Science 2005, 307, 1858–1861. [Google Scholar] [CrossRef]
  17. Amato, F.; Pandolfi, M.; Escrig, A.; Querol, X.; Alastuey, A.; Pey, J.; Pérez, N.; Hopke, P.K. Quantifying road dust resuspension in urban environment by multilinear engine: A comparison with PMF2. Atmos. Environ. 2009, 43, 2770–2780. [Google Scholar] [CrossRef]
  18. Al-Harbi, M. Characteristics and composition of the falling dust in urban environment. Int. J. Environ. Sci. Technol. 2015, 12, 641–652. [Google Scholar] [CrossRef] [Green Version]
  19. Gao, T.; Han, J.; Wang, Y.; Pei, H.; Lu, S. Impacts of climate abnormality on remarkable dust storm increase of the Hunshdak Sandy Lands in northern China during 2001–2008. Meteorol. Appl. 2012, 19, 265–278. [Google Scholar] [CrossRef]
  20. Xin-fa, Q.; Yan, Z.; Qi-long, M. Sand-dust storms in China: Temporal-spatial distribution and tracks of source lands. J. Geogr. Sci. 2001, 11, 253–260. [Google Scholar] [CrossRef]
  21. Xi, X.; Sokolik, I.N. Quantifying the anthropogenic dust emission from agricultural land use and desiccation of the Aral Sea in Central Asia. J. Geophys. Res. Atmos. 2016, 121. [Google Scholar] [CrossRef]
  22. Ginoux, P.; Chin, M.; Tegen, I.; Prospero, J.M.; Holben, B.; Dubovik, O.; Lin, S.J. Sources and distributions of dust aerosols simulated with the GOCART model. J. Geophys. Res. Atmos. 2001, 106, 20255–20273. [Google Scholar] [CrossRef]
  23. Baddock, M.C.; Bullard, J.E.; Bryant, R.G. Dust source identification using MODIS: A comparison of techniques applied to the Lake Eyre Basin, Australia. Remote Sens. Environ. 2009, 113, 1511–1528. [Google Scholar] [CrossRef] [Green Version]
  24. Rivera, N.I.R.; Gill, T.E.; Bleiweiss, M.P.; Hand, J.L. Source characteristics of hazardous Chihuahuan Desert dust outbreaks. Atmos. Environ. 2010, 44, 2457–2468. [Google Scholar] [CrossRef]
  25. Ni, G.; Yun, L.; Xiaoping, W. Quantitative identification dust and sand storm using MODIS data. In Proceedings of the 2005 IEEE International Geoscience and Remote Sensing Symposium, IGARSS’05, Yokohama, Japan, 28 July—2 August 2005; pp. 3630–3633. [Google Scholar]
  26. Leys, J.F.; Heidenreich, S.K.; Strong, C.L.; McTainsh, G.H.; Quigley, S. PM10 concentrations and mass transport during “Red Dawn”–Sydney 23 September 2009. Aeolian Res. 2011, 3, 327–342. [Google Scholar] [CrossRef] [Green Version]
  27. Esmaili, O.; Tajrishy, M.; Arasteh, P.D. Results of the 50 year ground-based measurements in comparison with satellite remote sensing of two prominent dust emission sources located in Iran. In Proceedings of the Remote Sensing of Clouds and the Atmosphere XI, Stockholm, Sweden, 1–14 September 2006; pp. 72–83. [Google Scholar]
  28. Moridnejad, A.; Karimi, N.; Ariya, P.A. A new inventory for middle east dust source points. Environ. Monit Assess 2015, 187, 1–11. [Google Scholar] [CrossRef]
  29. Zoljoodi, M.; Didevarasl, A.; Saadatabadi, A.R. Dust events in the western parts of Iran and the relationship with drought expansion over the dust-source areas in Iraq and Syria. Atmos. Clim. Sci. 2013, 3, 33894. [Google Scholar] [CrossRef]
  30. Cao, H.; Amiraslani, F.; Liu, J.; Zhou, N. Identification of dust storm source areas in West Asia using multiple environmental datasets. Sci. Total Environ. 2015, 502, 224–235. [Google Scholar] [CrossRef]
  31. Nicklin, D.; Darabkhani, H.G. Techniques to measure particulate matter emissions from stationary sources: A critical technology review using Multi Criteria Decision Analysis (MCDA). J. Environ. Manag. 2021, 296, 113167. [Google Scholar] [CrossRef]
  32. Darvishi Boloorani, A.; Samany, N.N.; Mirzaei, S.; Bahrami, H.A.; Alavipanah, S.K. Remote sensing and GIS for dust storm studies in Iraq. In Environmental Remote Sensing and GIS in Iraq; Springer: Berlin/Heidelberg, Germany, 2020; pp. 333–375. [Google Scholar]
  33. Pan, L.; Han, Y.; Lu, Z.; Li, J.; Gao, F.; Liu, Z.; Liu, W.; Liu, Y. Integrative investigation of dust emissions by dust storms and dust devils in North Africa. Sci. Total Environ. 2021, 756, 144128. [Google Scholar] [CrossRef]
  34. Achilleos, S.; Mouzourides, P.; Kalivitis, N.; Katra, I.; Kloog, I.; Kouis, P.; Middleton, N.; Mihalopoulos, N.; Neophytou, M.; Panayiotou, A. Spatio-temporal variability of desert dust storms in Eastern Mediterranean (Crete, Cyprus, Israel) between 2006 and 2017 using a uniform methodology. Sci. Total Environ. 2020, 714, 136693. [Google Scholar] [CrossRef] [PubMed]
  35. Boloorani, A.D.; Shorabeh, S.N.; Samany, N.N.; Mousivand, A.; Kazemi, Y.; Jaafarzadeh, N.; Zahedi, A.; Rabiei, J. Vulnerability mapping and risk analysis of sand and dust storms in Ahvaz, IRAN. Environ. Pollut. 2021, 279, 116859. [Google Scholar] [CrossRef] [PubMed]
  36. Zucca, C.; Middleton, N.; Kang, U.; Liniger, H. Shrinking water bodies as hotspots of sand and dust storms: The role of land degradation and sustainable soil and water management. Catena 2021, 207, 105669. [Google Scholar] [CrossRef]
  37. Middleton, N. Variability and trends in dust storm frequency on decadal timescales: Climatic drivers and human impacts. Geosciences 2019, 9, 261. [Google Scholar] [CrossRef] [Green Version]
  38. Khaniabadi, Y.O.; Daryanoosh, S.M.; Amrane, A.; Polosa, R.; Hopke, P.K.; Goudarzi, G.; Mohammadi, M.J.; Sicard, P.; Armin, H. Impact of Middle Eastern Dust storms on human health. Atmos. Pollut. Res. 2017, 8, 606–613. [Google Scholar] [CrossRef]
  39. Soleimani, Z.; Teymouri, P.; Boloorani, A.D.; Mesdaghinia, A.; Middleton, N.; Griffin, D.W. An overview of bioaerosol load and health impacts associated with dust storms: A focus on the Middle East. Atmos. Environ. 2020, 223, 117187. [Google Scholar] [CrossRef]
  40. Schweitzer, M.D.; Calzadilla, A.S.; Salamo, O.; Sharifi, A.; Kumar, N.; Holt, G.; Campos, M.; Mirsaeidi, M. Lung health in era of climate change and dust storms. Environ. Res. 2018, 163, 36–42. [Google Scholar] [CrossRef]
  41. Han, R.; Feng, C.-C.; Xu, N.; Guo, L. Spatial heterogeneous relationship between ecosystem services and human disturbances: A case study in Chuandong, China. Sci. Total Environ. 2020, 721, 137818. [Google Scholar] [CrossRef]
  42. Ebrahimi-Khusfi, Z.; Mirakbari, M.; Khosroshahi, M. Vegetation response to changes in temperature, rainfall, and dust in arid environments. Environ. Monit. Assess. 2020, 192, 1–21. [Google Scholar] [CrossRef]
  43. Ma, B.; Li, X.; Jiang, Z.; Pu, R.; Liang, A.; Che, D. Dust Dispersion and Its Effect on Vegetation Spectra at Canopy and Pixel Scales in an Open-Pit Mining Area. Remote Sens. 2020, 12, 3759. [Google Scholar] [CrossRef]
  44. Miri, A.; Maleki, S.; Middleton, N. An investigation into climatic and terrestrial drivers of dust storms in the Sistan region of Iran in the early twenty-first century. Sci. Total Environ. 2021, 757, 143952. [Google Scholar] [CrossRef] [PubMed]
  45. Lee, H.; Kim, H.; Honda, Y.; Lim, Y.-H.; Yi, S. Effect of Asian dust storms on daily mortality in seven metropolitan cities of Korea. Atmos. Environ. 2013, 79, 510–517. [Google Scholar] [CrossRef]
  46. Chen, Q.; Wang, M.; Sun, H.; Wang, X.; Wang, Y.; Li, Y.; Zhang, L.; Mu, Z. Enhanced health risks from exposure to environmentally persistent free radicals and the oxidative stress of PM 2.5 from Asian dust storms in Erenhot, Zhangbei and Jinan, China. Environ. Int. 2018, 121, 260–268. [Google Scholar] [CrossRef] [PubMed]
  47. Jaafari, J.; Naddafi, K.; Yunesian, M.; Nabizadeh, R.; Hassanvand, M.S.; Shamsipour, M.; Ghozikali, M.G.; Nazmara, S.; Shamsollahi, H.R.; Yaghmaeian, K. Associations between short term exposure to ambient particulate matter from dust storm and anthropogenic sources and inflammatory biomarkers in healthy young adults. Sci. Total Environ. 2021, 761, 144503. [Google Scholar] [CrossRef] [PubMed]
  48. Sadat, S.A.; Faraji, J.; Nazififard, M.; Ketabi, A. The experimental analysis of dust deposition effect on solar photovoltaic panels in Iran’s desert environment. Sustain. Energy Technol. Assess. 2021, 47, 101542. [Google Scholar]
  49. Taheri, F.; Forouzani, M.; Yazdanpanah, M.; Ajili, A. How farmers perceive the impact of dust phenomenon on agricultural production activities: A Q-methodology study. J. Arid Environ. 2020, 173, 104028. [Google Scholar] [CrossRef]
  50. Masoom, A.; Kosmopoulos, P.; Bansal, A.; Gkikas, A.; Proestakis, E.; Kazadzis, S.; Amiridis, V. Forecasting dust impact on solar energy using remote sensing and modeling techniques. Sol. Energy 2021, 228, 317–332. [Google Scholar] [CrossRef]
  51. Gholizadeh, H.; Zoghipour, M.H.; Torshizi, M.; Nazari, M.R.; Moradkhani, N. Gone with the wind: Impact of soil-dust storms on farm income. Ecol. Econ. 2021, 188, 107133. [Google Scholar] [CrossRef]
  52. Goudie, A.; Middleton, N. Saharan dust storms: Nature and consequences. Earth-Sci. Rev. 2001, 56, 179–204. [Google Scholar] [CrossRef]
  53. Goudie, A.S. Dust storms: Recent developments. J. Environ. Manag. 2009, 90, 89–94. [Google Scholar] [CrossRef]
  54. Lee, H.; Honda, Y.; Lim, Y.-H.; Guo, Y.L.; Hashizume, M.; Kim, H. Effect of Asian dust storms on mortality in three Asian cities. Atmos. Environ. 2014, 89, 309–317. [Google Scholar] [CrossRef]
  55. Eshghizadeh, M. Determining the critical geographical directions of sand and dust storms in urban areas by remote sensing. Remote Sens. Appl. Soc. Environ. 2021, 23, 100561. [Google Scholar] [CrossRef]
  56. Francis, D.; Chaboureau, J.-P.; Nelli, N.; Cuesta, J.; Alshamsi, N.; Temimi, M.; Pauluis, O.; Xue, L. Summertime dust storms over the Arabian Peninsula and impacts on radiation, circulation, cloud development and rain. Atmos. Res. 2021, 250, 105364. [Google Scholar] [CrossRef]
  57. Wischmeier, W.H.; Smith, D.D. Predicting Rainfall Erosion Losses: A Guide to Conservation Planning; United States Department of Agriculture, Science and Education Administration: Wasnigton, DC, USA, 1978.
  58. Saaty, T.L. The analytical hierarchy process, planning, priority. In Resource Allocation; RWS Publications: Boston, MA, USA, 1980. [Google Scholar]
  59. Malczewski, J.; Rinner, C. Multicriteria Decision Analysis in Geographic Information Science; Springer: Berlin/Heidelberg, Germany, 2015. [Google Scholar]
  60. Mijani, N.; Samani, N.N. Comparison of Fuzzy-Based Models in Landslide Hazard Mapping. Int. Arch. Photogramm. Remote Sens. Spat. Inf. Sci. 2017, 42, 407–416. [Google Scholar] [CrossRef] [Green Version]
  61. Kiavarz, M.; Jelokhani-Niaraki, M. Geothermal prospectivity mapping using GIS-based Ordered Weighted Averaging approach: A case study in Japan’s Akita and Iwate provinces. Geothermics 2017, 70, 295–304. [Google Scholar] [CrossRef]
  62. Karimi Firozjaei, M.; Sedighi, A.; Jelokhani-Niaraki, M. An urban growth simulation model based on integration of local weights and decision risk values. Trans. GIS 2020, 24, 1695–1721. [Google Scholar] [CrossRef]
  63. Mijani, N.; Alavipanah, S.K.; Hamzeh, S.; Firozjaei, M.K.; Arsanjani, J.J. Modeling thermal comfort in different condition of mind using satellite images: An Ordered Weighted Averaging approach and a case study. Ecol. Indic. 2019, 104, 1–12. [Google Scholar] [CrossRef]
  64. Firozjaei, M.K.; Nematollahi, O.; Mijani, N.; Shorabeh, S.N.; Firozjaei, H.K.; Toomanian, A. An integrated GIS-based Ordered Weighted Averaging analysis for solar energy evaluation in Iran: Current conditions and future planning. Renew. Energy 2019, 136, 1130–1146. [Google Scholar] [CrossRef]
  65. Kim, D.; Chin, M.; Bian, H.; Tan, Q.; Brown, M.E.; Zheng, T.; You, R.; Diehl, T.; Ginoux, P.; Kucsera, T. The effect of the dynamic surface bareness on dust source function, emission, and distribution. J. Geophys. Res. Atmos. 2013, 118, 871–886. [Google Scholar] [CrossRef]
  66. Abdi Vishkaee, F.; Flamant, C.; Cuesta, J.; Oolman, L.; Flamant, P.; Khalesifard, H.R. Dust transport over Iraq and northwest Iran associated with winter Shamal: A case study. J. Geophys. Res. Atmos. 2012, 117, D03201. [Google Scholar] [CrossRef] [Green Version]
  67. Pye, K.; Tsoar, H. The mechanics and geological implications of dust transport and deposition in deserts with particular reference to loess formation and dune sand diagenesis in the northern Negev, Israel. Geol. Soc. Lond. Spec. Publ. 1987, 35, 139–156. [Google Scholar] [CrossRef]
  68. Drobne, S.; Lisec, A. Multi-attribute decision analysis in GIS: Weighted linear combination and ordered weighted averaging. Informatica 2009, 33, 459. [Google Scholar]
  69. Malczewski, J. On the use of weighted linear combination method in GIS: Common and best practice approaches. Trans. GIS 2000, 4, 5–22. [Google Scholar] [CrossRef]
  70. Mijani, N.; Shahpari Sani, D.; Dastaran, M.; Karimi Firozjaei, H.; Argany, M.; Mahmoudian, H. Spatial modeling of migration using GIS-based multi-criteria decision analysis: A case study of Iran. Trans. GIS 2022, 26, 645–668. [Google Scholar] [CrossRef]
  71. Firozjaei, M.K.; Fathololoumi, S.; Mijani, N.; Kiavarz, M.; Qureshi, S.; Homaee, M.; Alavipanah, S.K. Evaluating the spectral indices efficiency to quantify daytime surface anthropogenic heat island intensity: An intercontinental methodology. Remote Sens. 2020, 12, 2854. [Google Scholar] [CrossRef]
  72. Firozjaei, M.K.; Sedighi, A.; Kiavarz, M.; Qureshi, S.; Haase, D.; Alavipanah, S.K. Automated Built-Up Extraction Index: A New Technique for Mapping Surface Built-Up Areas Using LANDSAT 8 OLI Imagery. Remote Sens. 2019, 11, 1966. [Google Scholar] [CrossRef] [Green Version]
  73. Ginoux, P.; Prospero, J.M.; Gill, T.E.; Hsu, N.C.; Zhao, M. Global-scale attribution of anthropogenic and natural dust sources and their emission rates based on MODIS Deep Blue aerosol products. Rev. Geophys. 2012, 50, RG3005. [Google Scholar] [CrossRef]
  74. Nabavi, S.O.; Haimberger, L.; Samimi, C. Sensitivity of WRF-chem predictions to dust source function specification in West Asia. Aeolian Res. 2017, 24, 115–131. [Google Scholar] [CrossRef]
  75. Yu, Y.; Kalashnikova, O.V.; Garay, M.J.; Lee, H.; Notaro, M. Identification and characterization of dust source regions across North Africa and the Middle East using MISR satellite observations. Geophys. Res. Lett. 2018, 45, 6690–6701. [Google Scholar] [CrossRef]
  76. Yu, H.; Chin, M.; Bian, H.; Yuan, T.; Prospero, J.M.; Omar, A.H.; Remer, L.A.; Winker, D.M.; Yang, Y.; Zhang, Y. Quantification of trans-Atlantic dust transport from seven-year (2007–2013) record of CALIPSO lidar measurements. Remote Sens. Environ. 2015, 159, 232–249. [Google Scholar] [CrossRef]
  77. Mayaud, J.R.; Wiggs, G.F.; Bailey, R.M. Characterizing turbulent wind flow around dryland vegetation. Earth Surf. Process. Landf. 2016, 41, 1421–1436. [Google Scholar] [CrossRef] [Green Version]
  78. Youssef, F.; Visser, S.M.; Karssenberg, D.; Erpul, G.; Cornelis, W.M.; Gabriels, D.; Poortinga, A. The effect of vegetation patterns on wind-blown mass transport at the regional scale: A wind tunnel experiment. Geomorphology 2012, 159, 178–188. [Google Scholar] [CrossRef]
  79. Shinoda, M.; Gillies, J.; Mikami, M.; Shao, Y. Temperate grasslands as a dust source: Knowledge, uncertainties, and challenges. Aeolian Res. 2011, 3, 271–293. [Google Scholar] [CrossRef]
  80. He, Z.; Li, S.; Harazono, Y. Wind-sandy environment and the effects of vegetation on wind breaking and dune fixation in Horqin sandy land, China. In Proceedings of the Wind Erosion: An International Symposium/Workshop, Manhattan, KS, USA, 3–5 June 1997; USDA Agricultural Research Service, Wind Erosion Laboratory: Manhattan, KS, USA, 1997. [Google Scholar]
  81. Fécan, F.; Marticorena, B.; Bergametti, G. Parametrization of the increase of the aeolian erosion threshold wind friction velocity due to soil moisture for arid and semi-arid areas. Ann. Geophys. 1998, 17, 149–157. [Google Scholar] [CrossRef] [Green Version]
  82. Xuan, J.; Sokolik, I.N.; Hao, J.; Guo, F.; Mao, H.; Yang, G. Identification and characterization of sources of atmospheric mineral dust in East Asia. Atmos. Environ. 2004, 38, 6239–6252. [Google Scholar] [CrossRef]
  83. Xu, H.; Cheng, T.; Gu, X.; Yu, T.; Xie, D.; Zheng, F. Spatiotemporal variability in dust observed over the Sinkiang and Inner Mongolia regions of Northern China. Atmos. Pollut. Res. 2015, 6, 562–571. [Google Scholar] [CrossRef] [Green Version]
  84. Wang, S.; Yuan, W.; Shang, K. The impacts of different kinds of dust events on PM10 pollution in northern China. Atmos. Environ. 2006, 40, 7975–7982. [Google Scholar] [CrossRef]
  85. Zhou, X.; Xu, X.; Yan, P.; Weng, Y.; Wang, J. Dynamic characteristics of spring sandstorms in 2000. Sci. China Ser. D Earth Sci. 2002, 45, 921–930. [Google Scholar] [CrossRef]
  86. Baig, M.H.A.; Zhang, L.; Shuai, T.; Tong, Q. Derivation of a tasselled cap transformation based on Landsat 8 at-satellite reflectance. Remote Sens. Lett. 2014, 5, 423–431. [Google Scholar] [CrossRef]
  87. Middleton, N. The Geography of Dust Storms; University of Oxford: Oxford, UK, 1986. [Google Scholar]
  88. Ye, D.-Z.; Chou, J.-F.; Liu, J.-Y. Causes of sand-stormy weather in northern China and control measures. Acta Geogr. Sin.-Chin. Ed. 2000, 55, 513–521. [Google Scholar]
  89. Taufik, A.; Ahmad, S.S.S. Land cover classification of Landsat 8 satellite data based on Fuzzy Logic approach. In IOP Conference Series: Earth and Environmental Science, Proceedings of the 8th IGRSM International Conference and Exhibition on Geospatial & Remote Sensing (IGRSM 2016), Kuala Lumpur, Malaysia, 13–14 April 2016; IOP Publishing: Bristol, UK, 2016; p. 012062. [Google Scholar]
  90. Ravi, S.; D’Odorico, P.; Over, T.M.; Zobeck, T.M. On the effect of air humidity on soil susceptibility to wind erosion: The case of air-dry soils. Geophys. Res. Lett. 2004, 31, L09501. [Google Scholar] [CrossRef]
  91. Burkhardt, J. Hygroscopic particles on leaves: Nutrients or desiccants? Ecol. Monogr. 2010, 80, 369–399. [Google Scholar] [CrossRef]
  92. Farmer, A.M. The effects of dust on vegetation—A review. Environ. Pollut. 1993, 79, 63–75. [Google Scholar] [CrossRef]
  93. Kellogg, C.A.; Griffin, D.W. Aerobiology and the global transport of desert dust. Trends Ecol. Evol. 2006, 21, 638–644. [Google Scholar] [CrossRef] [PubMed]
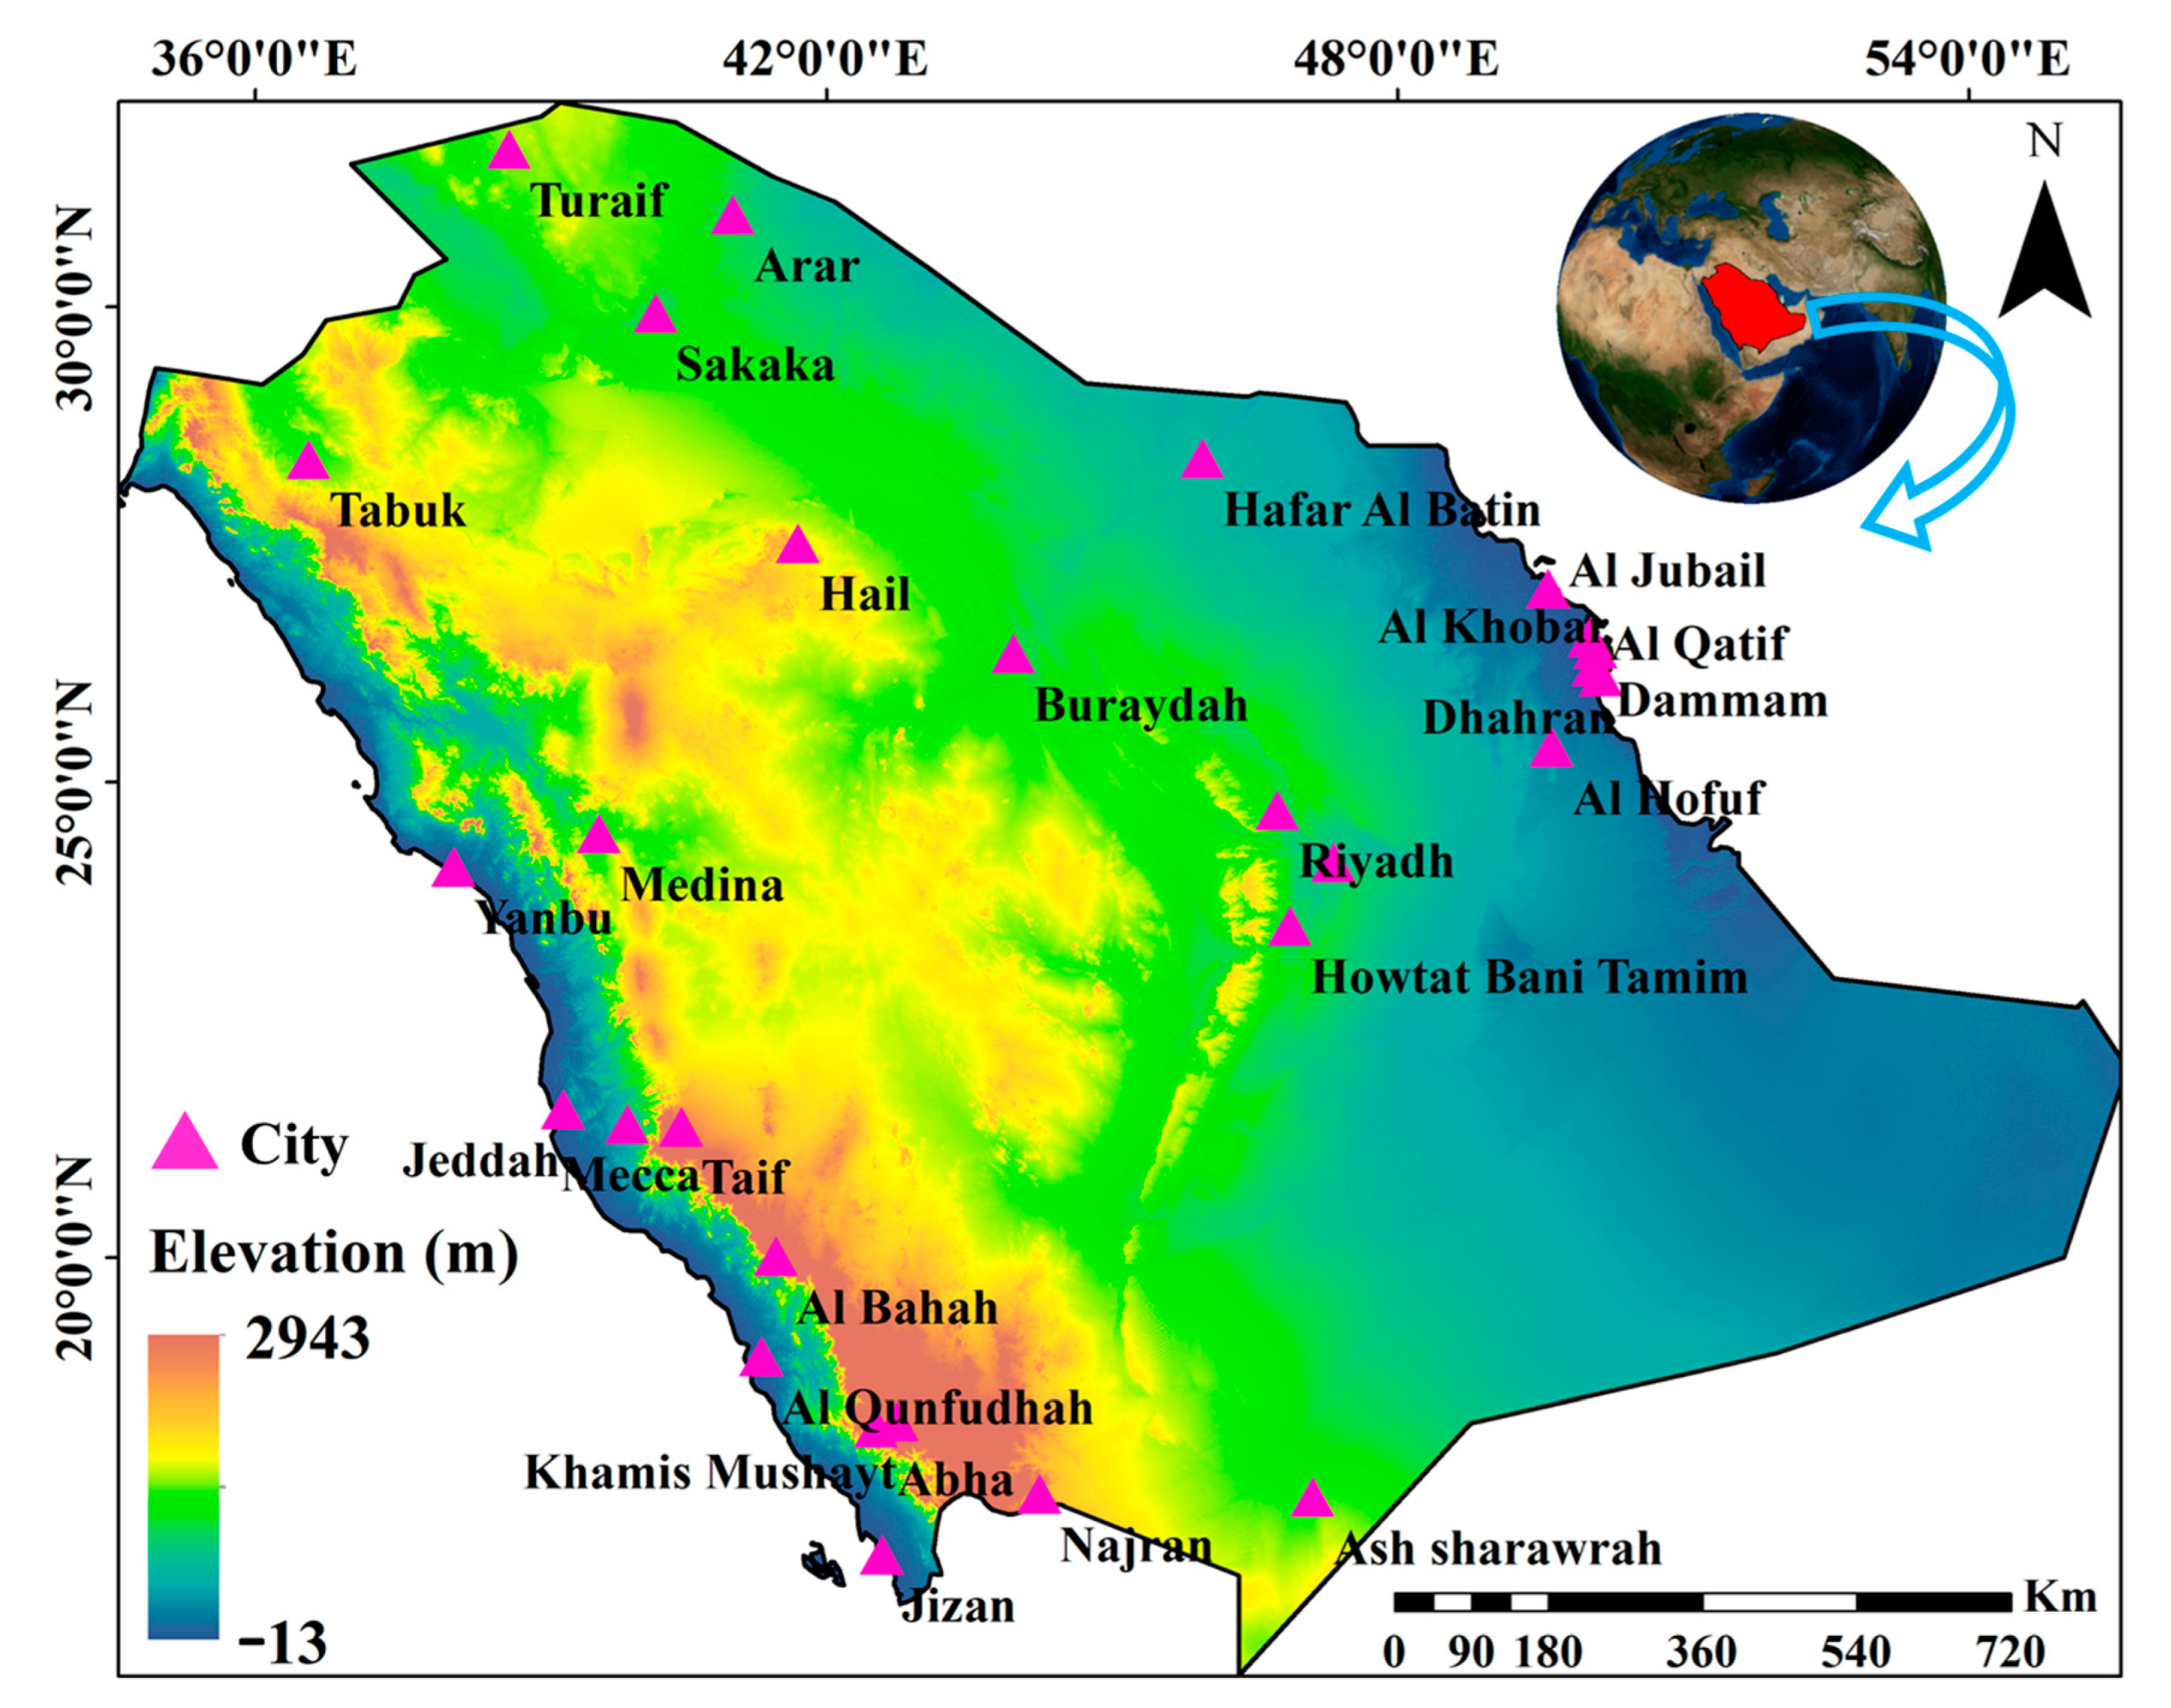
Figure 1. Map of the geographical location of the study area and the major cities located in this area.
Remotesensing 14 05701 g001
Figure 2. Conceptual framework and flow of the study.
Remotesensing 14 05701 g002
Figure 3. Maps of (a) Susceptible Areas to Dust Storm Formation (SADSF) repetition for each pixel over the 22-year period of this study from 2000 to 2021, (b) Major SADSF (MSADSF) with minimum 8 repetitions over the 22-year period, and (c) Sub-regions based on distances greater than and less than 400 km from MSADSF.
Remotesensing 14 05701 g003
Figure 4. Maps of (a) frequency of occurrence (FoO) of high intensity dust storms (MODIS AOD > 0.85) in unit days from 2000 to 2021, and (b) frequency major potential dust sources determined by overlaying the digitized maps obtained from the previous studies.
Remotesensing 14 05701 g004
Figure 5. Built-up lands maps of study area for (a) 2000 and (b) 2021.
Remotesensing 14 05701 g005
Figure 6. Spatial distribution maps of built-up land areas for major cities located in the study area in (a) 2000 and (b) 2021 and (c) urban growth rate.
Remotesensing 14 05701 g006
Figure 7. The trend of changes of the mean of NDVI of major cities located in DMDS < 400 km.
Remotesensing 14 05701 g007
Figure 8. The trend of changes in the mean of NDVI of major cities located in DMDS > 400 km.
Remotesensing 14 05701 g008
Figure 9. The trend of changing the mean of NDVI of sub-regions located in DMDS < 400 km and >400 km.
Remotesensing 14 05701 g009
Figure 10. Scatter plots between the distance from major dust source (DMDS) and urban growth rate (UGR) and NDVI change rate.
Remotesensing 14 05701 g010
Table 1. Effective criteria and the corresponding weights, and their effect on the dust creation. The downward arrow (↓) indicates the inverse relationship, and the upward arrow (↑) indicates the direct relationship of each criterion with the formation of dust sources.
CriteriaCriterion TypeDescriptionWeight
Vegetation coverReduction in wind speed and prevents its direct encountering with the soil surface, reduction in evaporation from the surface and prevents the movement of particles0.152
soil moistureAdhesion of soil particles and increasing wind erosion threshold0.164
Soil texture - Determinative of particle size and the amount of moisture capacity and particle adhesion0.223
Wind speedIt is the main cause of wind erosion and leads to particle separation and movement as well as reduction in surface soil moisture.0.201
PrecipitationIncreasing soil moisture and helping vegetation cover grow0.05
LSTIncreasing the amount of evaporation and thus decreasing surface soil moisture and reduction in particle adhesion0.138
Air humidityHumidity also increases the amount of water in the surface soil layer.0.072
Table 2. Values of urban built-up areas (UBA), urban growth (UG), distance from major dust source (DMDS) and urban growth rate (UGR) for different major cities located in study area.
CitiesUBA (2000) (km2)UBA (2021) (km2)UG (km2)DMDS (km)UGR (%)
Al Qatif69.189.820.731.629.9
Dammam271.4334.663.240.023.3
Al Jubail167.8208.941.140.324.5
Dhahran73.689.215.640.321.2
Al Khobar88.1124.836.755.941.7
Al Hofuf161.0250.489.478.155.5
Hafar Al Batin73.5102.428.990.039.4
Riyadh1042.21481.6439.4111.842.2
Al-Kharj72.190.918.8116.326.1
Hail105.6254.6149.0158.8102.0
Buraydah68.1162.894.7174.4100.0
Howtat Bani Tamim5.07.32.4203.547.4
Sakaka49.073.824.8220.550.6
Arar33.662.529.0248.386.3
Ash sharawrah17.943.525.6421.5142.8
Turaif8.519.711.2456.2131.6
Medina179.6336.4156.8560.387.3
Tabuk56.5148.692.1565.0163.0
Najran83.7149.265.5657.478.2
Yanbu93.6163.770.0679.274.8
Khamis Mushayt99.4227.0127.6769.2128.4
Abha39.665.225.6794.670.2
Taif109.7277.9168.2817.3153.3
Jizan28.953.424.5847.695.4
Al Bahah3.48.55.1848.6152.2
Mecca143.2401.2258.1855.6180.3
Jeddah559.1883.1324.0872.165.9
Al Qunfudhah4.010.76.7898.7166.3
Table 3. Values of urban built-up areas (UBA), urban growth (UG), and urban growth rate (UGR) for different major cities located in DMDS < 400 km and DMDS > 400 km.
Classes UBA (2000) (km2) UBA (2021) (km2) BG (km2) UGR (%)
DMDS < 400 km2280.03333.61053.646.2
DMDS > 400 km1427.02787.91360.995.4
Table 4. Values of built-up areas (BA), built-up growth (BG), and built-up growth rate (BGR) for sub-regions located in DMDS < 400 km and DMDS > 400 km.
Classes BA (2000) (km2) BA (2021) (km2) BG (km2) BGR (%)
DMDS < 400 km3187.25896.62709.485.0
DMDS > 400 km2174.85245.93071.0141.2
Publisher’s Note: MDPI stays neutral with regard to jurisdictional claims in published maps and institutional affiliations.