Communication

A Direct Method for the Estimation of Top-of-Atmosphere Outgoing Longwave Radiation from Himawari-8/AHI Data

1
School of Resources and Environmental Engineering, Wuhan University of Science and Technology, Wuhan 430081, China
2
State Key Laboratory of Resources and Environment Information System, Institute of Geographic Sciences and Natural Resources Research, Chinese Academy of Sciences, Beijing 100101, China
*
Author to whom correspondence should be addressed.
Remote Sens. 2022, 14(22), 5696; https://doi.org/10.3390/rs14225696
Submission received: 15 September 2022 / Revised: 6 November 2022 / Accepted: 7 November 2022 / Published: 11 November 2022

Abstract

:
Top-of-atmosphere (TOA) outgoing longwave radiation (OLR), a key component of the Earth’s energy budget, serves as a diagnostic of the Earth’s climate system response to incoming solar radiation. However, existing products are typically estimated using the traditional two-step method, which may bring extra uncertainties. This paper presents a direct machine learning method to estimate TOA OLR by directly linking Himawari-8/Advanced Himawari Imager (AHI) TOA radiances with TOA OLR determined by Clouds and the Earth’s Radiant Energy System (CERES) and other information, such as the viewing geometry. Models are built separately under clear- and cloudy-sky conditions using a gradient-boosting regression tree. Independent test results show that the root mean square errors (RMSEs) of the clear-sky and cloudy-sky models for estimating instantaneous values are 7.46 W/m2 (3.0%) and 11.61 W/m2 (5.8%), respectively. Daily results are obtained by averaging all the instantaneous results in one day. Intercomparisons of the daily results with CERES TOA OLR data show that the RMSE of the estimated AHI OLR is ~6 W/m2 (3%). The developed high-resolution AHI TOA OLR dataset will be beneficial in analyzing the regional energy budget.

1. Introduction

Outgoing longwave radiation (OLR), emitted from the Earth’s surface and atmosphere, plays a crucial role in modulating the Earth’s energy budget [1]. Since top-of-atmosphere (TOA) OLR instantly indicates complex atmospheric conditions, it has been widely used in weather and climate research [2]. In addition, as thermal anomalies in the atmosphere before an earthquake enhance the OLR flux, it can also serve as a precursor for earthquakes [3]. Therefore, an accurate estimation of the OLR is quite necessary.
Numerous TOA OLR products have been derived since the 1980s, but they were generated by the traditional two-step method, which may lead to the accumulation of errors. The TOA OLR products derived from the broadband sensor include the Earth Radiation Budget Experiment (ERBE) [4], Scanner Radiometer for Radiation Budget (ScaRab) [5], Geostationary Earth Radiation Budget (GERB) [6], and Clouds and the Earth’s Radiant Energy System (CERES) [7]. Multispectral narrowband sensors have also been incorporated to generate TOA OLR products since the 2000s, such as High-Resolution Infrared Radiation Sounder (HIRS) [8], Geostationary Operational Environmental Satellite (GOES) Sounder [9], GOES-R Advanced Baseline Imager [10], and Communication Oceanography Meteorological Satellite (COMS) [11]. Recently, the two-step method has been applied to the geostationary satellite Himawari-8/Advanced Himawari Imager (AHI) data. Specifically, the radiance observed by the channel is converted to irradiance (step 1), and then the obtained irradiance is converted into TOA OLR (step 2). The conversions are conducted using regression coefficients derived from a radiative transfer model (i.e., Santa Barbara DISORT Atmospheric Radiative Transfer (SBDART) model). Although various atmospheric conditions (e.g., water vapor, cloud optical thickness, and cloud height) can be simulated using the model, the accumulation of errors in the two steps has led to large uncertainties in the final results, with the reported root-mean-square-error (RMSE) of 12.21 W/m2 when compared with Clouds and the Earth’s Radiant Energy System (CERES) Single Scanner Footprint (SSF) data [12].
Different from the traditional two-step method, direct retrieval algorithms have been developed to achieve better accuracy. For example, narrowband reflectance has been directly linked to broadband albedo to retrieve surface and TOA albedo in previous studies [13,14,15,16,17]. Better retrieval accuracy also attributes to the direct use of satellite observations, which are assumed to be more accurate than the fluxes from radiative transfer simulations. Recently, a novel algorithm for TOA albedo retrieval, which directly links Advanced Very High-Resolution Radiometer (AVHRR) narrowband reflectances with CERES TOA broadband albedos, was proposed in our previous study [18]. However, it is worth noting that AVHRR–CERES data pairs could only be collected in certain years, i.e., only when the orbital planes of the Terra/Aqua and NOAA satellites coincided. Considering the high temporal resolution of geostationary satellite data (e.g., 10 min for the AHI data), it would be much easier to collect the coincident data pairs between the geostationary satellite and polar orbit satellite data (e.g., AHI–CERES data pairs in this study).
Machine learning methods can learn the relationship between inputs and outputs by fitting flexible models to data. Three widely used machine learning methods (i.e., multivariate adaptive regression splines (MARS), gradient boosting regression tree (GBRT), and random forests (RF)) were compared in our previous study, and the results showed that GBRT and RF outperformed MARS [18]. Considering that RF is much more time-consuming than GBRT, and that GBRT can avoid the overfitting problem, we only use GBRT in this study.
The organization of the remainder of this paper is as follows. Section 2 introduces the dataset used in this study. A brief algorithm description is presented in Section 3, and Section 4 shows the results and the analyses. Conclusions are drawn in Section 5.

2. Data

2.1. Himawari-8/AHI

Himawari-8/AHI, launched in October 2014 with a subsatellite point of 140.6°E, became operational in July 2015. It has 16 bands with a spatial resolution of 0.5 or 1 km for visible and near-infrared bands and 2 km for infrared bands. Additionally, Himawari L1 Gridded data in NetCDF format also provide the AHI data with a spatial resolution of 5 km. Thus, the 5 km Himawari-8/AHI data are used in this study. The temporal resolution is 10 min for full disk and 2.5 min for sectored regions [19]. The Himawari-8/AHI specifications are shown in Table 1 [20]. All 10 infrared bands (in bold) are used to retrieve the TOA OLR in this study.

2.2. CERES

CERES is a broadband instrument measuring shortwave reflected radiation (0.3–5 μm), longwave thermal radiation (8–12 μm), and broadband radiation from 0.3 to 200 μm. The Level-2 Single Scanner Footprint (SSF) data provides the instantaneous TOA OLR with 20 km resolution [21]. The CERES footprint is recorded in an hourly SSF file that contains the observation time. As the accuracy of CERES data is relatively high among the existing TOA OLR products, they are used as “true values” in this study. In addition, the Level-3 Synoptic products, which incorporated the geostationary satellite data, are taken as reference data. They began in March 2000 with 1-degree resolution.

3. Algorithm Description

Figure 1 presents a flowchart of TOA OLR estimation from AHI data, and several major steps are included. First, CERES SSF and AHI data are pre-processed, namely converting the two instantaneous data to a 20 km regular grid. Next, the TOA radiances are extracted from the AHI data, and the viewing geometries and observation times of the AHI and CERES data are also recorded. Collecting AHI–CERES data pairs is a key step in the retrieval process. Thus, we set strict criteria, which include: (1) the observation time of the two datasets is limited to 150 s (determined by multiple trials), (2) the difference of the viewing zenith angle (VZA) is less than 5°, and (3) the datasets are collocated with 20 km spatial resolution.
After applying these criteria, a training dataset containing 661,979 samples (575,639 for the cloudy-sky model and 86,340 for the clear-sky model) was established from coincident AHI observations and the CERES TOA OLR product from four months in 2016. The dataset is established based on instantaneous observations. Although the models are built based on the data pairs collected at 20 km spatial resolution, they could still be applied to the original 5 km AHI data under the assumption that the TOA observations of each AHI pixel in the 4 × 4 window corresponding to one CERES pixel have the same relationship with its TOA OLR. In the training dataset, CERES TOA OLR is taken as labels while the AHI radiances and VZAs are taken as input features (Equation (1)). The dataset is randomly divided into two groups, 90% of which is used for training and the remaining is used for testing. Thus, models are established based on the training dataset with cloud masks using the GBRT method.
OLR = f TOA   radiances ,   VZAs  
GBRT, an advanced statistical model, has been widely used in both classification and prediction. As it does not require assumptions on the training dataset, it can deal with the uneven distribution of data attributes. In addition to the lack of limitation for any hypothesis of input data, the extensive usage of the GBRT method also attributes to its better predictive capacity than a single decision tree and its ability to deal with data of huge size. The basic idea of the GBRT model is generating a strong classifier by constructing M amount of different weak classifiers through multiple iterations. Each iteration is used to improve the previous result by reducing the residuals of the previous model and building a new combination model in the gradient direction [22]. Using this model, we obtained clear-sky and cloudy-sky models for TOA OLR estimation. The former was defined as no cloud coverage, while conditions with cloud fractions larger than 0% were used for the latter.

4. Results

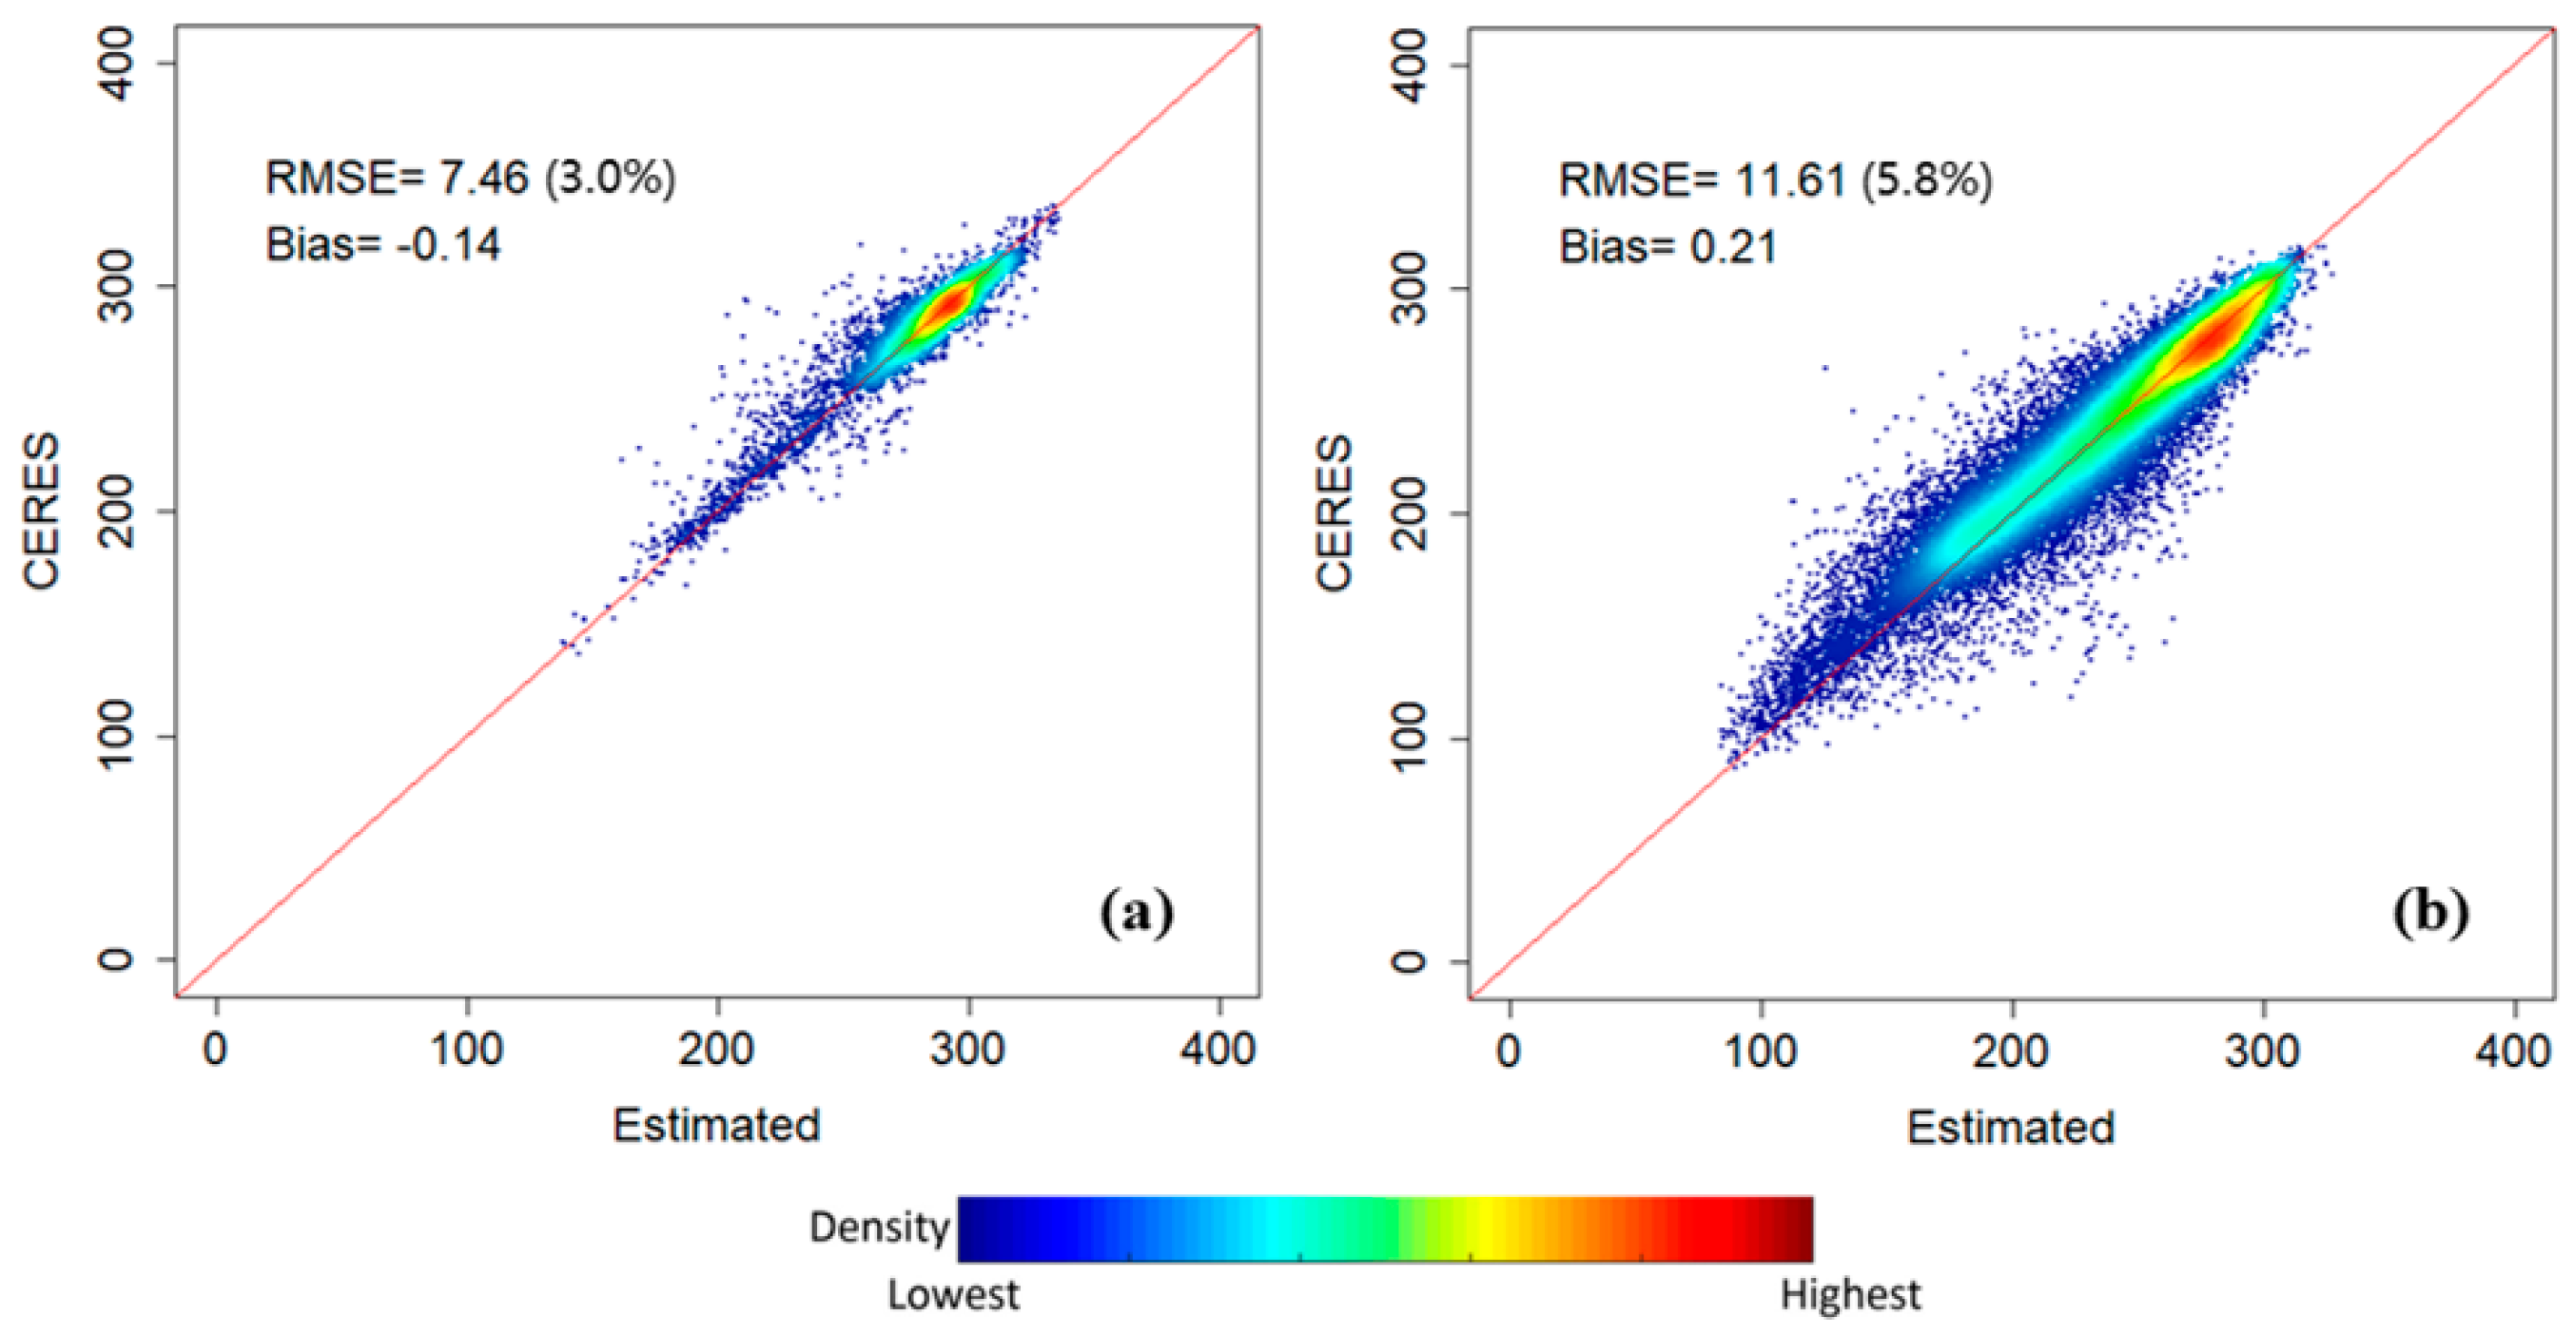
The inputs for the machine learning model used in this study included AHI TOA radiance (channels 7–16) and VZA, while the CERES SSF TOA OLR products were taken as “true values”. The test results obtained via the GBRT method are shown in Figure 2. The RMSEs of the instantaneous GBRT results under the clear-sky and cloudy-sky conditions are 7.46 W/m2 (3.0%) and 11.61 W/m2 (5.8%), while the biases are −0.14 W/m2 and 0.21 W/m2, respectively. The sample number of the clear-sky condition is much less than that of cloudy-sky condition. The range of the TOA OLR values under the clear-sky condition is mostly around 250–320 W/m2, while they are around 150–320 W/m2 under the cloudy-sky condition. This is due to the low cloud-top temperatures under the cloudy-sky condition. To illustrate the effects of part of the input features (i.e., band 7–10 and VZAs) on the model training accuracy, corresponding RMSEs and Bias are derived by training the model with their removal, and the results are shown in Table 2. From the table, one can see that the RMSEs increase when either bands 7–10 or VZAs are removed, indicating their positive effects on the model training accuracy.
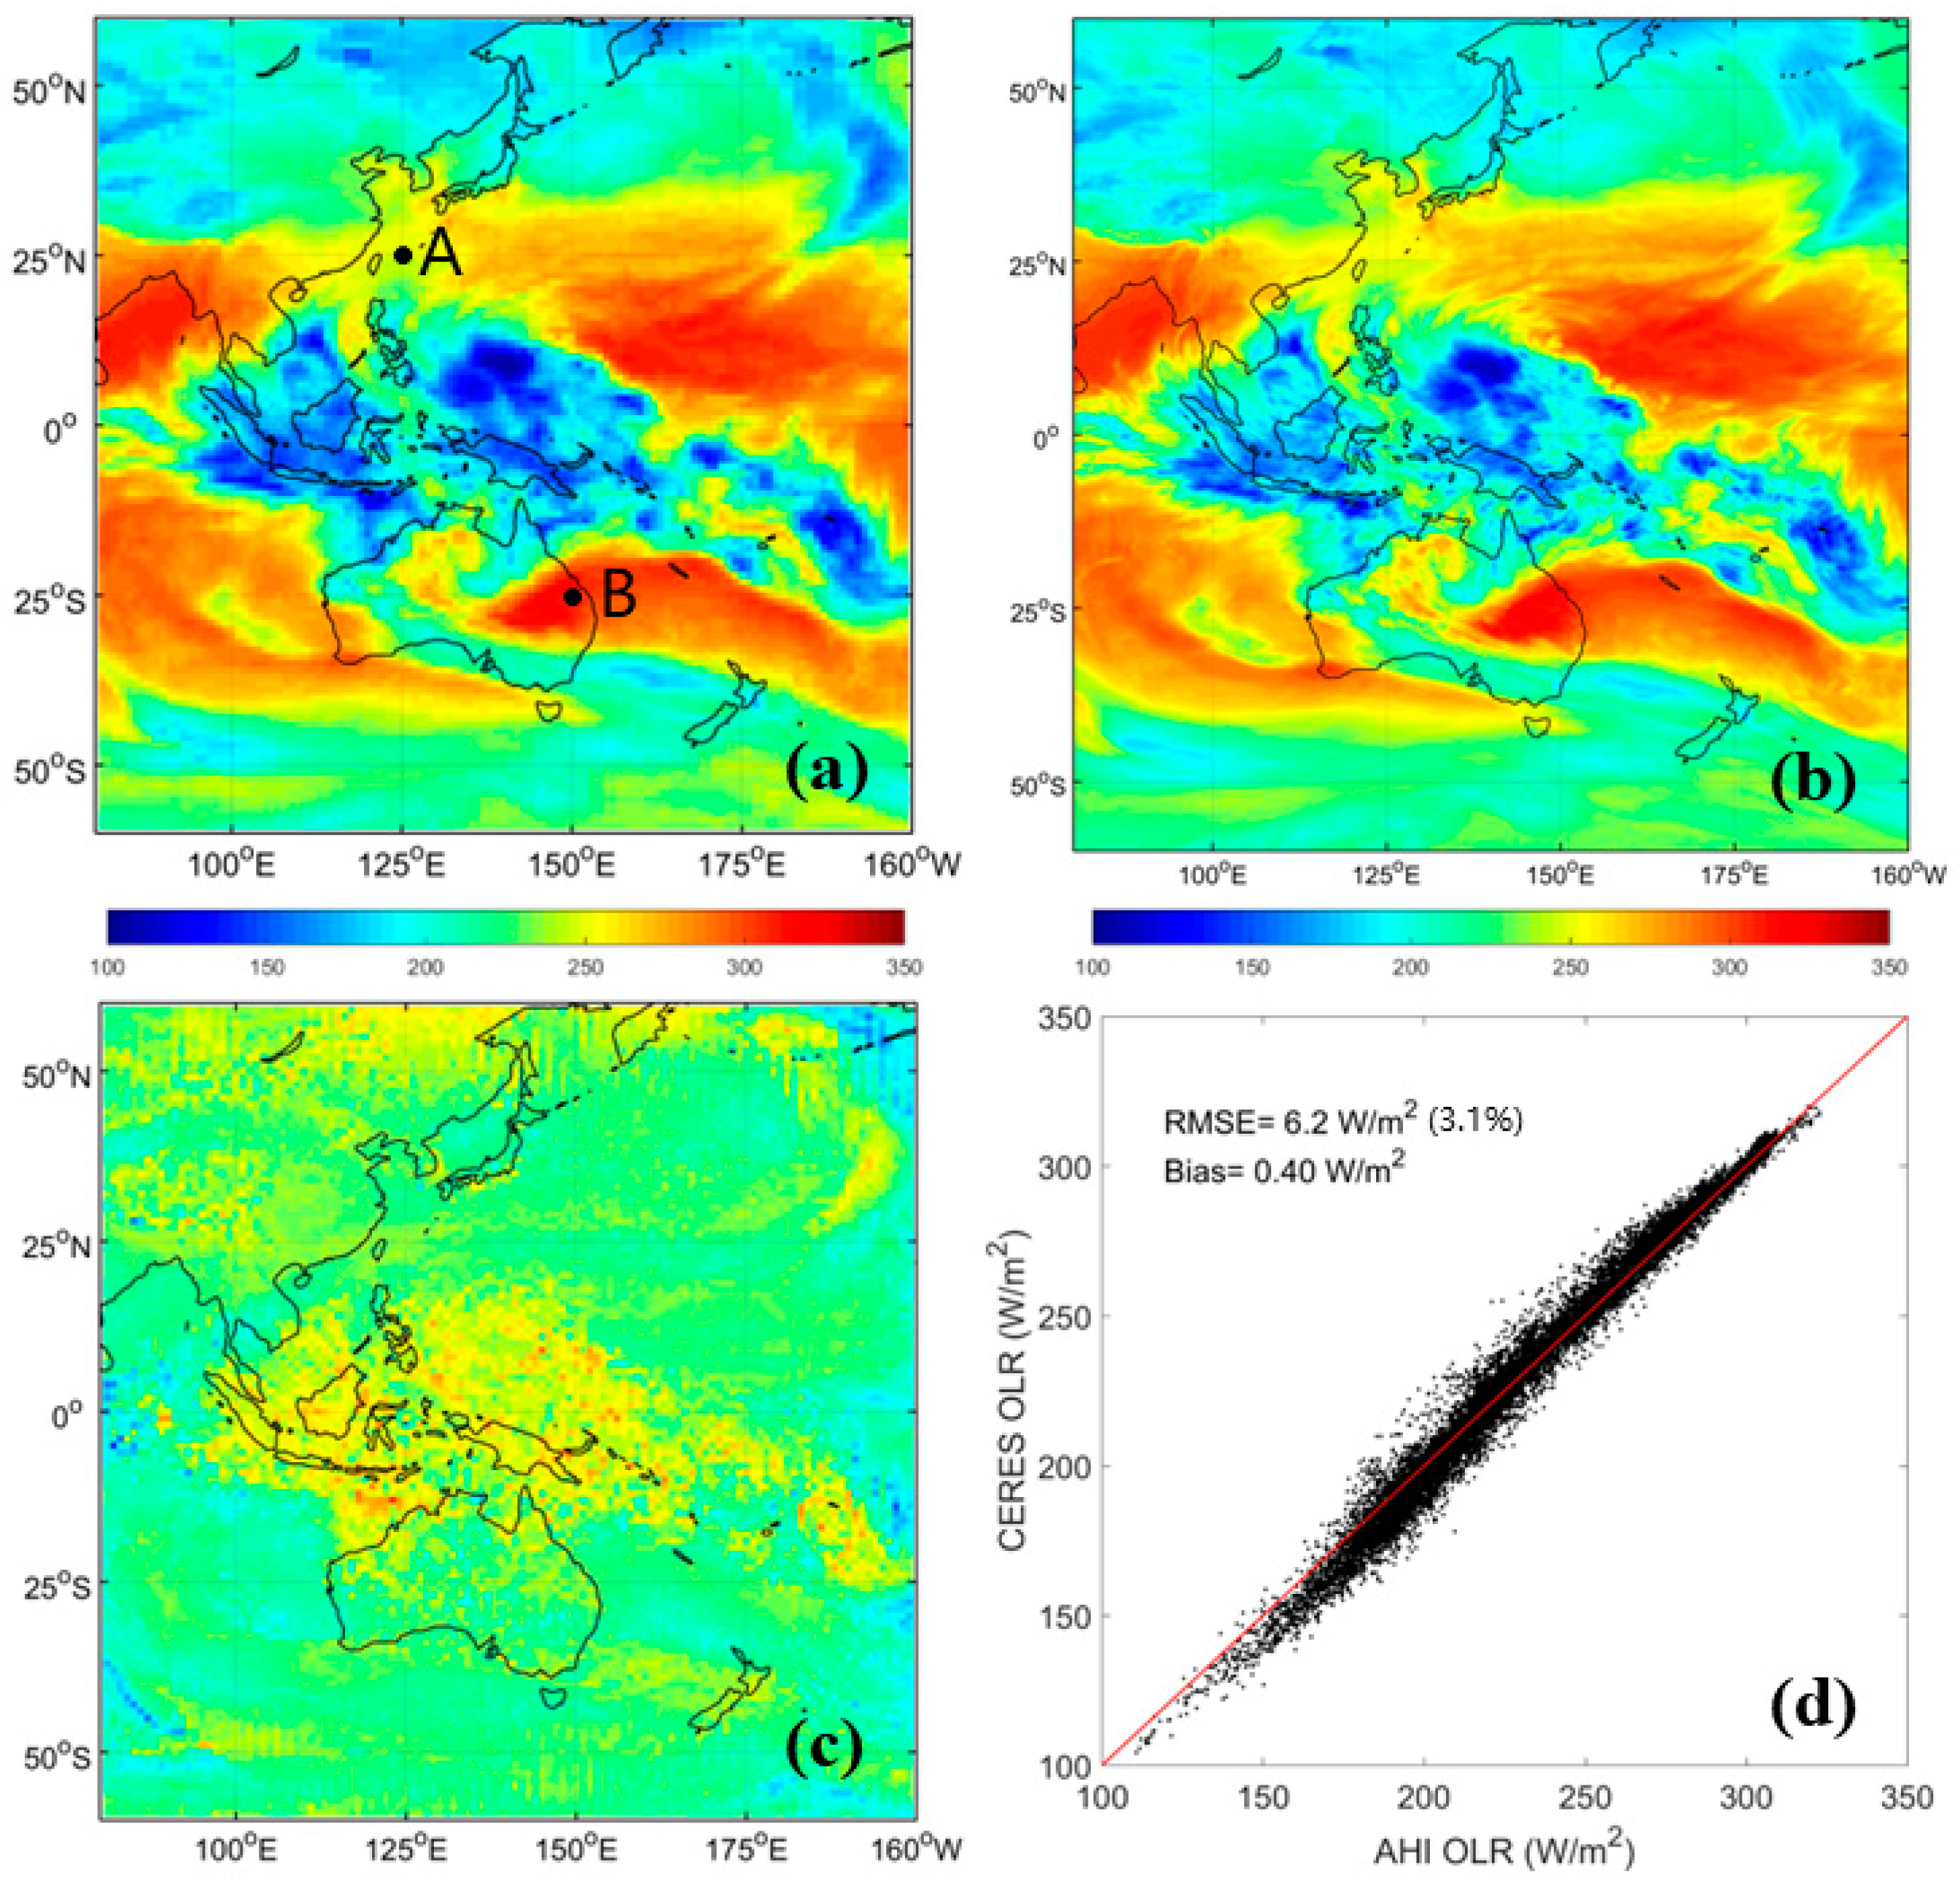
Compared to the instantaneous OLR, daily OLR is more useful in analyzing the Earth’s energy budget. Therefore, we obtain the daily AHI OLR by averaging 142 instantaneous results. Figure 3 shows the results on 1 February, 2017. The CERES TOA OLR is used as a baseline with which to compare the estimated AHI OLR. Figure 3 shows an example of the high-resolution OLR map (Figure 3b) estimated from AHI imagery, and the corresponding CERES OLR map is also presented for comparison (Figure 3a). The overall patterns of the two OLR maps are quite similar, with much lower values in the center. However, the high-resolution (5 km) AHI OLR map shows more spatial details, which are essential for the study of Earth’s energy budget at a local scale. Figure 3c shows the differences between the two maps at 1° spatial resolution. Overestimations are found in the center region, and obvious underestimations are shown on the edge. Overall, most of the differences are quite small. The result indicates that the RMSE of the estimated daily AHI OLR is 6.2 W/m2 (3.1%), and the bias is 0.4 W/m2 when compared with CERES OLR data (Figure 3d). To illustrate the seasonal variation of retrieval accuracy, we select one day per quarter in 2017 for comparison, and the results are shown in Table 3. From the table, one can see that the retrieval accuracy is ~6 W/m2 for all four days, and it is slightly higher on 1 May and 1 November, whose bias is also the lowest among the four days.
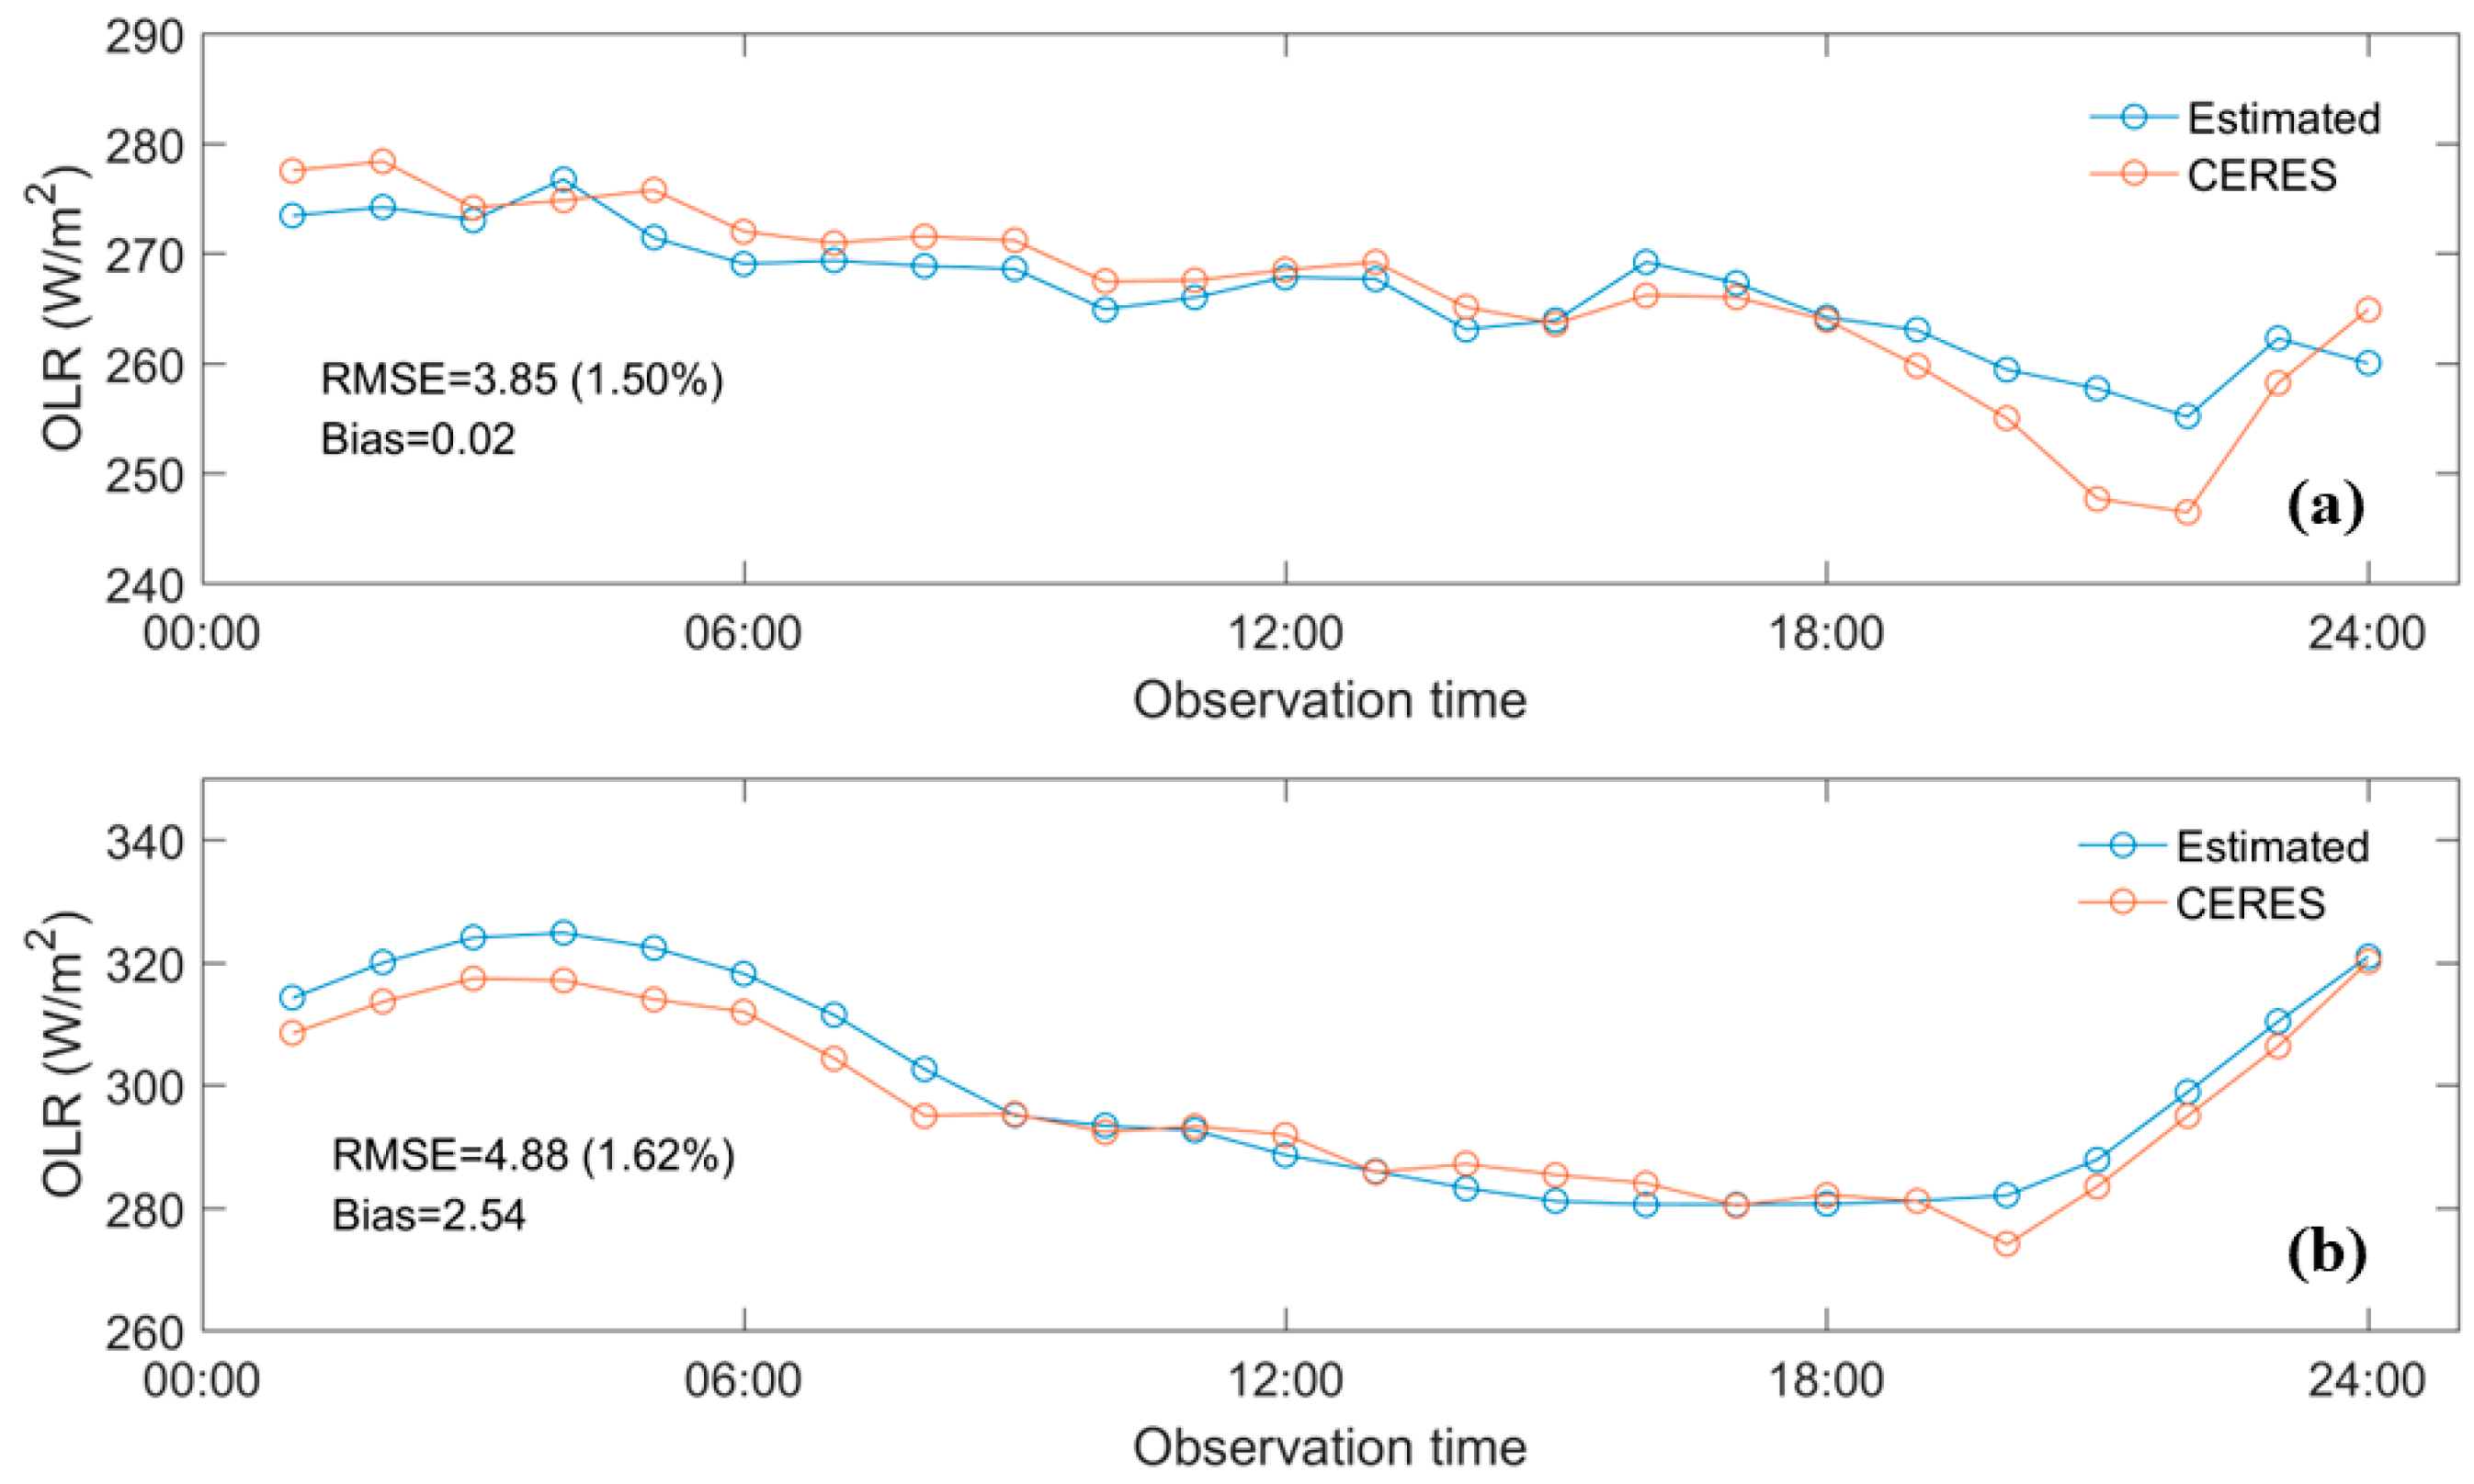
Another advantage of the AHI OLR is its high temporal resolution. Therefore, we select two pixels (A (25°N, 125°E) and B (25°S, 150°E)), and make intercomparisons between the estimated AHI and CERES TOA OLR at these two pixels. Results are shown in Figure 4. From the figure, one can see that overall the two datasets match very well, with the RMSE of 3.85 W/m2 (1.50%) and 4.88 W/m2 (1.62%) for pixels A and B, respectively. Despite the relatively large differences during some periods (e.g., 21:00 and 22:00 for pixel A and 01:00–08:00 for pixel B); overall, the estimated AHI OLR can capture the diurnal variations when compared to the CERES hourly dataset.

5. Conclusions

TOA OLR is a vital component of the Earth’s energy budget, and numerous TOA OLR products have been generated using the two-step method. This study proposes a direct method to retrieve the OLR from Himawari-8/AHI data. The method directly links the AHI TOA radiances and TOA OLR. A widely used machine learning method (i.e., GBRT) is used for model building. The CERES SSF TOA OLR product is taken as the “true values”, and cloud masks are used to build clear-sky and cloudy-sky models separately.
The instantaneous test results show that the RMSEs of the clear-sky and cloudy-sky models are 7.5 W/m2 (3.0%) and 11.6 W/m2 (5.8%), respectively. As daily OLR is more commonly used in analyzing the Earth’s energy budget, we convert the estimated instantaneous OLR to daily results by averaging the 142 instantaneous results. The comparison results show the RMSE of the estimated daily AHI OLR is 6.2 W/m2 (3.1%). The proposed TOA OLR retrieval algorithm is robust, and the developed dataset using the algorithm will be valuable in analyzing the regional Earth’s energy budget.

Author Contributions

Conceptualization, C.Z. and Y.J.; methodology, C.Z.; validation, Y.C. and Z.M.; investigation, X.Z. and J.L.; writing—original draft preparation, C.Z.; writing—review and editing, Y.J., Y.C., Z.M., X.Z. and J.L. All authors have read and agreed to the published version of the manuscript.

Funding

This study was funded by the National Natural Science Foundation of China [42001306].

Data Availability Statement

The CERES datasets are downloaded at https://ceres-tool.larc.nasa.gov/ord-tool/jsp/SYN1degEd4Selection.jsp (accessed on 1 August 2022). The Himawari-8/AHI data are downloaded at https://www.eorc.jaxa.jp/ptree/ (accessed on 1 August 2022).

Acknowledgments

We would like to thank the anonymous reviewers for their constructive comments and suggestions.

Conflicts of Interest

The authors declare no conflict of interest.

References

  1. Liang, S.; Wang, D.; He, T.; Yu, Y. Remote sensing of earth’s energy budget: Synthesis and review. Int. J. Digit. Earth 2019, 12, 737–780. [Google Scholar] [CrossRef] [Green Version]
  2. Schmetz, J.; Liu, Q. Outgoing longwave radiation and its diurnal variation at regional scales derived from Meteosat. J. Geophys. Res. Atmos. 1988, 93, 11192–11204. [Google Scholar] [CrossRef]
  3. Chakraborty, S.; Sasmal, S.; Chakrabarti, S.K.; Bhattacharya, A. Observational signatures of unusual outgoing longwave radiation (OLR) and atmospheric gravity waves (AGW) as precursory effects of May 2015 Nepal earthquakes. J. Geodyn. 2018, 113, 43–51. [Google Scholar] [CrossRef]
  4. Barkstrom, B.R. The earth radiation budget experiment (ERBE). Bull. Am. Meteorol. Soc. 1984, 65, 1170–1185. [Google Scholar] [CrossRef]
  5. Kandel, R.; Viollier, M.; Raberanto, P.; Duvel, J.P.; Pakhomov, L.; Golovko, V.; Trishchenko, A.P.; Mueller, J.; Raschke, E.; Stuhlmann, R.; et al. The ScaRaB earth radiation budget dataset. Bull. Am. Meteorol. Soc. 1998, 79, 765–784. [Google Scholar] [CrossRef]
  6. Harries, J.E.; Russell, J.; Hanafin, J.; Brindley, H.; Futyan, J.; Rufus, J.; Kellock, S.; Matthews, G.; Wrigley, R.; Last, A.; et al. The geostationary earth radiation budget project. Bull. Am. Meteorol. Soc. 2005, 86, 945–960. [Google Scholar] [CrossRef] [Green Version]
  7. Loeb, N.G.; Doelling, D.R.; Wang, H.; Su, W.; Nguyen, C.; Corbett, J.G.; Liang, L.; Mitrescu, C.; Rose, F.G.; Kato, S. Clouds and the earth’s radiant energy system (CERES) energy balanced and filled (EBAF) top-of-atmosphere (TOA) edition-4.0 data product. J. Clim. 2018, 31, 895–918. [Google Scholar] [CrossRef]
  8. Lee, H.-T.; Gruber, A.; Ellingson, R.G.; Laszlo, I. Development of the HIRS outgoing longwave radiation climate dataset. J. Atmos. Ocean. Technol. 2007, 24, 2029–2047. [Google Scholar] [CrossRef] [Green Version]
  9. Ba, M.B.; Ellingson, R.G.; Gruber, A. Validation of a technique for estimating OLR with the GOES sounder. J. Atmos. Ocean. Technol. 2003, 20, 79–89. [Google Scholar] [CrossRef]
  10. Lee, T.F.; Hawkins, J.; Kuciauskas, A.; Miller, S. Applications and Training for Next-Generation Imagers. Am. Meteorol. Soc. 2010, 91, 727–740. [Google Scholar] [CrossRef]
  11. Park, M.-S.; Ho, C.-H.; Cho, H.; Choi, Y.-S. Retrieval of outgoing longwave radiation from COMS narrowband infrared imagery. Adv. Atmos. Sci. 2015, 32, 375–388. [Google Scholar] [CrossRef]
  12. Kim, B.-Y.; Lee, K.-T.; Jee, J.-B.; Zo, I.-S. Retrieval of outgoing longwave radiation at top-of-atmosphere using Himawari-8 AHI data. Remote Sens. Environ. 2018, 204, 498–508. [Google Scholar] [CrossRef]
  13. He, T.; Liang, S.; Wang, D.; Chen, X.; Song, D.-X.; Jiang, B. Land surface albedo estimation from Chinese HJ satellite data based on the direct estimation approach. Remote Sens. 2015, 7, 5495–5510. [Google Scholar] [CrossRef] [Green Version]
  14. Qu, Y.; Liu, Q.; Liang, S.; Wang, L.; Liu, N.; Liu, S. Direct-estimation algorithm for mapping daily land-surface broadband albedo from MODIS data. IEEE Trans. Geosci. Remote Sens. 2013, 52, 907–919. [Google Scholar] [CrossRef]
  15. Tang, B.; Li, Z.-L.; Zhang, R. A direct method for estimating net surface shortwave radiation from MODIS data. Remote Sens. Environ. 2006, 103, 115–126. [Google Scholar] [CrossRef]
  16. Wang, D.; Liang, S. Estimating high-resolution top of atmosphere albedo from Moderate Resolution Imaging Spectroradiometer data. Remote Sens. Environ. 2016, 178, 93–103. [Google Scholar] [CrossRef]
  17. Song, Z.; Liang, S.; Wang, D.; Zhou, Y.; Jia, A. Long-term record of top-of-atmosphere albedo over land generated from AVHRR data. Remote Sens. Environ. 2018, 211, 71–88. [Google Scholar] [CrossRef]
  18. Zhan, C.; Liang, S. Improved estimation of the global top-of-atmosphere albedo from AVHRR data. Remote Sens. Environ. 2022, 269, 112836. [Google Scholar] [CrossRef]
  19. Letu, H.; Nakajima, T.Y.; Wang, T.; Shang, H.; Ma, R.; Yang, K.; Baran, A.J.; Riedi, J.; Ishimoto, H.; Yoshida, M.; et al. A new benchmark for surface radiation products over the East Asia-Pacific region retrieved from the Himawari-8/AHI next-generation geostationary satellite. Bull. Am. Meteorol. Soc. 2022, 103, E873–E888. [Google Scholar] [CrossRef]
  20. Bessho, K. An Introduction to Himawari-8/9-Japan’s New-Generation Geostationary Meteorological Satellites. J. Meteorol. Soc. Jpn. 2016, 94, 151–183. [Google Scholar] [CrossRef]
  21. Loeb, N.G.; Manalo-Smith, N.; Su, W.; Shankar, M.; Thomas, S. CERES top-of-atmosphere earth radiation budget climate data record: Accounting for in-orbit changes in instrument calibration. Remote Sens. 2016, 8, 182. [Google Scholar] [CrossRef] [Green Version]
  22. Friedman, J.H. Greedy function approximation: A gradient boosting machine. Ann. Stat. 2001, 29, 1189–1232. [Google Scholar] [CrossRef]
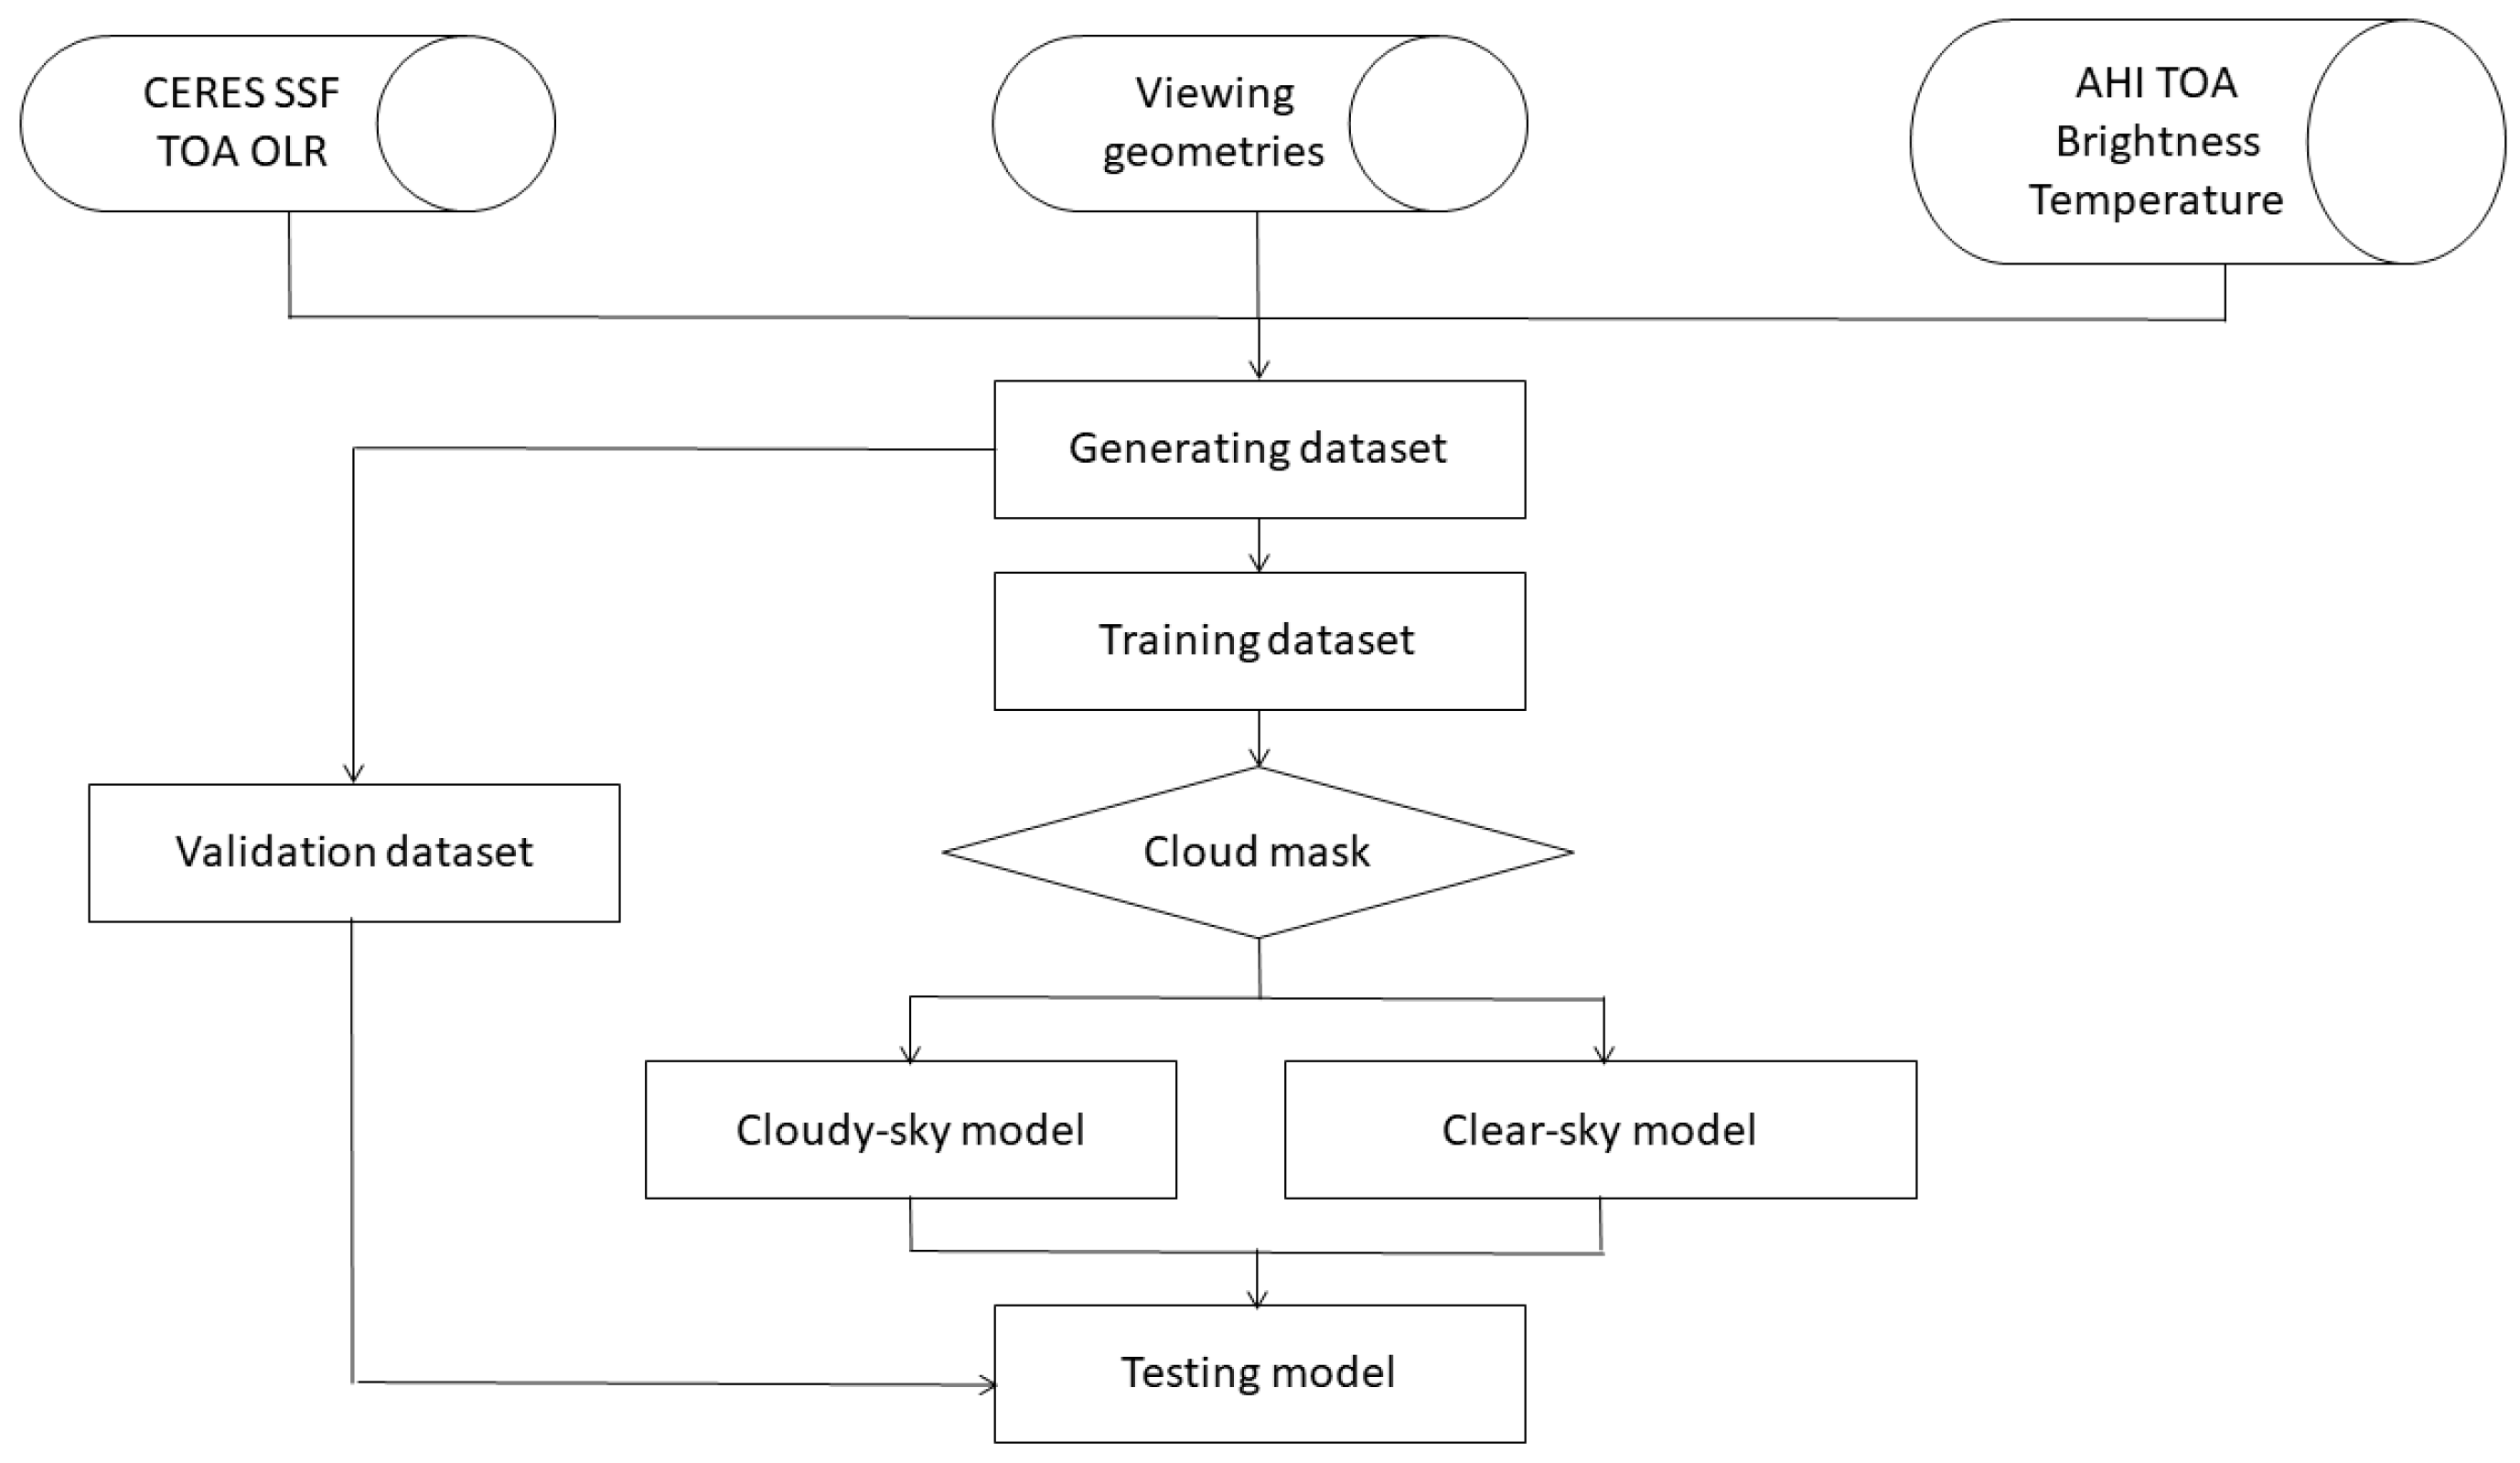
Figure 1. Flowchart of TOA OLR estimation from AHI data.
Remotesensing 14 05696 g001
Figure 2. Test results of the TOA OLR using GBRT under (a) clear−sky, (b) cloudy−sky conditions.
Remotesensing 14 05696 g002
Figure 3. Daily TOA OLR on 1 February 2017. (a) CERES SYN OLR, (b) estimated AHI OLR, (c) differences between AHI and CERES OLR, and (d) comparison between AHI and CERES OLR.
Remotesensing 14 05696 g003
Figure 4. Intercomparison of the AHI and CERES hourly TOA OLR on 1 November 2017 at (a) (25°N, 125°E) and (b) (25°S, 150°E).
Remotesensing 14 05696 g004
Table 1. The AHI bands specifications.
BandWavelength (μm)Spatial Resolution (km)
10.471
20.511
30.640.5
40.861
51.62
62.32
73.92
86.22
96.92
107.32
118.62
129.62
1310.42
1411.22
1512.42
1613.32
Table 2. Statistics of the test results with different model input configurations.
ConfigurationRMSE (W/m2)Bias (W/m2)
Clear-SkyCloudy-SkyClear-SkyCloudy-Sky
Band 11–1610.22 (3.9%)13.47 (6.5%)−2.39−0.22
Band 7–168.50 (3.3%)12.51 (6.2%)−1.87−0.06
Band 11–16 and VZA9.12 (3.6%)13.13 (6.3%)−0.540.21
Band 7–16 and VZA7.46 (3.0%)11.61 (5.8%)−0.140.21
Table 3. RMSE and Bias of the estimated daily AHI OLR on four selected days in 2017.
DateRMSE (W/m2)Bias (W/m2)
1 February6.2 (3.1%)0.40
1 May5.3 (2.4%)−0.45
1 August6.3 (2.8%)−0.60
1 November5.3 (2.4%)−0.29
Publisher’s Note: MDPI stays neutral with regard to jurisdictional claims in published maps and institutional affiliations.