Abstract
Exploring the influence range of early cities is significant for understanding the mechanisms behind ancient settlement systems and human-environment interactions. Due to a lack of effective research methods, the evolution processes and impact mechanisms of the influence ranges of prehistoric cities are still ambiguous. In this study, we chose the Songshan Mountain region for research, which witnessed the origin and development of Chinese civilization. Using GIS spatial analyses such as the ‘average nearest neighbor’ and ‘Thiessen polygon’, we explored the spatial-temporal distributions and influence ranges of Neolithic-Bronze Age cities in the region. The roles of human culture and the natural environment in the process were also investigated. The results indicated that the spatial distributions of early cities were random during the Yangshao (7000–5000 BP) and Longshan (5000–4000 BP) cultures. During the Erlitou culture (3800–3500 BP) and Shang Dynasty (3600–3046 BP), the spatial distributions changed into dispersed models. During the Zhou Dynasty (3046–2256 BP), the spatial distribution model was random again. Correspondingly, the influence range of early cities during the Erlitou culture is the largest, followed by those of the Longshan culture, Yangshao culture, Shang Dynasty, and Zhou Dynasty. This is different from the conventional view that the ancient city’s influence range continuously expands as time advances. Both the natural environment and human culture are believed to impact this evolutional process. Specifically, the Holocene climate variation and the consequent cyclic river downcutting and silting affect the city site selection and thus the spatial-temporal distribution and influence range of early cities. The enfeoffment system occurring during the Erlitou culture should also have played a vital role in this evolution. In general, the natural environment is more important for the spatial distribution and influence range of early cities during Yangshao, Longshan, and Erlitou cultures, while human culture represented by the enfeoffment system plays a dominant role during Shang and Zhou Dynasties when the natural environment is relatively stable.
1. Introduction
The city is a relatively high-class and large-population settlement form in human society, and it always affects surrounding lower-level settlements, such as villages and towns, through input, output, and the exchange between material flow, energy flow, and information flow [1,2,3]. Therefore, the city is associated with an influence range where its social and economic activities can cover [2]. This influence range of cities also represents their status and roles in the human settlement system and has been the research focus of several relevant disciplines, such as geography, sociology, and anthropology.
Embryonic cities can date back to prehistoric times in China. Some large settlements not only gathered large numbers of populations but also built some large projects such as large moat systems or city walls that required the integration of labor from neighboring settlements at that time [4]. These early cities also can affect the surrounding subordinate settlements and present a certain influence range. The influence range of early cities was constantly changing. In general, the changes are considered to follow a linear evolution model that the influence range continued to grow with time. However, this hypothesis has been lacking the support of specific research cases. Meanwhile, understanding the spatial-temporal evolution of this range and the mechanisms responsible for this evolution is vital for investigating the operation law of early human society, elucidating the interaction between early humans and the natural environment, and clarifying the process of early city origin. However, it is still ambiguous due to data insufficiency and a lack of effective methods [5,6]. The application of advanced technology to systematically and scientifically organize, comb, and analyze these limited data of prehistoric cities is considered the currently most practical approach to potentially solving this problem.
At present, spatial information techniques, represented by remote sensing (RS), global positioning systems (GPS), geographic information systems (GIS), virtual reality (VR), and three-dimensional (3D) visualization, are developing rapidly. These techniques are favored by their power in acquiring, analyzing, and displaying spatial information. Their advantages for finding useful information in archaeological and historic data are becoming more and more obvious. Therefore, they have been widely applied to unknown historic site detection, settlement pattern analysis, and virtual presentation of archaeological results [7,8,9,10,11]. By combining RS, GIS, and GPS approaches, Luo et al. found many suspected sites along the Guazhou-Shazhou section of the ancient Silk Road [12]. Lu et al. identified numerous large-scale linear heritages of ancient humans in the eastern Henan plain from early remote sensing images [13]. Garcia investigated the Palaeolithic site location preferences in the Western Cantabrian of the northern Iberian Peninsula using a GIS approach [14]. Li et al. studied the scale level of the Neolithic-Bronze Age settlements in the Qinghai and Gansu Provinces with the GIS spatial analysis [15]. A similar study was performed on the area surrounding Songshan Mountain by Lu et al. [16]. With the GIS technology, several studies are implemented to investigate the spatial-temporal distributions of early settlements in the east coast area of China, the Guanting Basin of the northeastern Qinghai-Tibet plateau, the upper-stream valley of the Yellow River, and the area around Songshan Mountain, respectively [17,18,19,20]. Using the Thiessen polygon analysis, Wu et al. analyzed the spatial evolution of the Neolithic site in the Huaibei plain, Anhui Province, China [21]. Fang et al. studied the spatiotemporal pattern of prehistoric settlements in Linfen Basin [22]. Although numerous similar studies have been reported, research on the influence range of early cities using spatial information technology is still rare. Scientific and effective technical methods for this area are also lacking. Nonetheless, the spatial information technology, in particular the GIS technique with powerful spatial analysis functionality, clearly brings opportunities to rationally exploit the limited data of early cities.
With the GIS spatial analysis techniques such as the average nearest neighbor and Thiessen polygons, this research investigated the distribution patterns and influence ranges of Neolithic-Bronze Age cites in a core area of the Chinese civilization origin (namely the Songshan Mountain region). The influence range evolution of the early cities was reviewed according to the five periods of civilization, including the Yangshao culture (7000–5000 BP), Longshan culture (5000–4000 BP), Erlitou culture (3800–3500 BP), Shang Dynasty (3600–3046 BP), and Zhou Dynasty (3046–2256 BP). Its relationship with natural environment and human society was also discussed. The results are of great significance for understanding the influence range of early cities and its impact mechanism, while the adopted technique and methodology can also provide methodological references for analogous studies in other regions.
2. Regional Setting
The Songshan Mountain region covers Zhengzhou, Luoyang, Xuchang, and Pingdingshan cities and their adjacent places with Songshan Mountain as the center (Figure 1). This area belongs to the warm temperate continental monsoon climate with an annual average temperature of around 14 °C and annual precipitation of about 640 mm [23,24]. The region lies in the transition zone between the Loess Plateau and North China Plain [25]. The terrain is generally high in the west and low in the east, with an altitude of 1500–50 m. There are many rivers in the region that belong to two river systems of the Yellow River and Huaihe River, respectively. The Yellow River passes through the northern part of the area and receives many tributaries from the west, such as the Yi River and Luo River. The Jialu River in the east and the Ying River, Beiru River, and Shahe River in the south all belong to the Huaihe River basin. Besides these major rivers, some smaller rivers (e.g., the Shuangji River and the Suoxu River) also play vital roles in the development of the regional early culture [26,27].
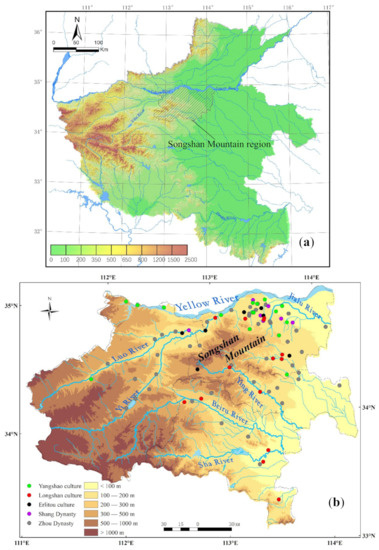
Figure 1.
(a) The location of Songshan Mountain region. (b) The Neolithic-Bronze cities in Songshan Mountain region.
As early as hundreds of thousands of years ago in the Paleolithic Age, humans lived in the Songshan Mountain region [28]. During the Neolithic Age, the regional culture presented a strong momentum of growth. In the Lijiagou site of Xinmi City, Henan Province, the early Neolithic accumulation of 10,500–8600 BP was discovered [29]. After the Lijiagou culture, the middle-late Neolithic Peiligang culture (9000–7000 BP), Yangshao culture (7000–5000 BP), and Longshan culture (5000–4000 BP) emerged in the region [30]. During the Bronze Age, the Erlitou Culture (3800–3500 BP), Shang Dynasty (3600–3046 BP), and Zhou Dynasty (3046–2256 BP) successively developed [31].
The Songshan Mountain region is also a place where ancient cities are of the earliest occurrences, highest temporal continuity, most diversified types, largest quantity, and greatest distribution density. The regional embryonic cities are moat-surrounded settlements which can be traced back to the Peiligang culture during 9000–7000 BP [32]. In the late Yangshao period around 5000 BP, the city-wall settlement occurred in the region. The Xishan site in Zhengzhou City was found with the rammed-earth city wall constructed during 5000–5300 BP [33]. It is the oldest city ever discovered in the Yellow River basin so far. The area has the long-term presence of the Neolithic-Bronze Age cities, which were never interrupted since their emergence [34]. Therefore, a complete evolution process of early cities exists in the study area including moat settlements, city-wall settlements, central settlements and complex capital-town systems. There are over 100 city sites of the Neolithic-Bronze Age, with a distribution density of 0.003 city sites/km2. Such a large quantity and a high distribution density of prehistoric cities are very rare even in the world. Hence, the area is ideal for studying the influence range and its evolution mechanism of early cities.
3. Materials and Methods
3.1. Research Strategy
The Shang and Zhou Dynasties implemented a system of enfeoffment, in which lands of the country are allocated to members of the royal family, meritorious statesmen, or descendants of ancient emperors [35]. For these enfeoffed feudal princes, the top priority was to build a city as soon as they reach their feuds [36]. Hence, the distance between cities can, to some extent, reflect the influence range of each city. Research indicates the formation of such a system of enfeoffment experiences a prolonged evolution process that can be dated back to the Xia Dynasty, represented by the Erlitou culture. Although it is unclear whether or not the feudal system was already present during the Neolithic Age, the spatial distribution pattern of cities is no doubt an important factor for the influence range.
Based on the theories above, we first digitalized the Neolithic-Bronze Age cities in the study area as points. Secondly, the average nearest neighbor (ANN) analysis was performed to identify the distribution pattern of early cities and the boundaries of influence ranges of city groups in different periods. Thirdly, using the Thiessen polygon analysis, the influence range of each ancient city was analyzed. Fourthly, city influence ranges were characterized based on the analysis of polygon features, accompanied by investigations into the evolution features. At last, the evolution mechanisms of the influence ranges of Neolithic-Bronze Age cities were discussed from perspectives of natural environments and human cultures.
3.2. Data Basis
The evolution of Neolithic-Bronze Age cities in the study area has roughly experienced a process of moat settlement, city-wall settlement, regional central settlement, and complex capital-city system (Figure 2) [37]. With three sources, the data for these four types of settlements are carefully combed and systematically organized. The first source is Atlas of Chinese Cultural Relics: Henan Volume [38], in which the Henan ancient city maps pertinent to the cities of the study area were fully collected and reorganized. The second source is the latest data from archaeological investigation and excavation [39], in which ancient cities related to this study have also been sorted out one by one. The third source is the latest research results [40,41], from which the content of relevant ancient cities was extracted. The collected ancient cities were mainly formed during five periods, namely, the Yangshao periods (7.0–5.0 ka BP), Longshan Periods (5.0–4.0 ka BP), Erlitou periods (3.8–3.5 ka BP), Shang periods (3.6–3.0 ka BP), and Zhou periods (3.0–2.2 ka BP) (Table 1). Due to a solid foundation of archaeological research in the studied region, these archaeological data, although perhaps incomplete, can reflect the overall characteristics of the changes in the number of early cities. Then these cities were assigned with spatial attributes based on the geographic coordinates and placed on a standard topographic map.
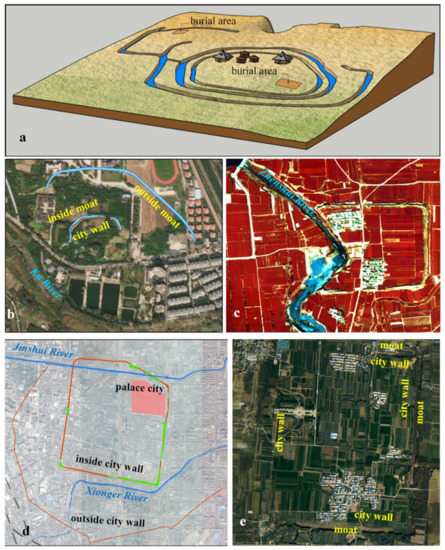
Figure 2.
The images of some early cities in the Songshan region. (a) The triple moat system of the Shuanghuaishu site which is considered a regional central settlement of the late Yangshao period (5300–5000 BP) [42]; (b) the regional earliest city walls in the Xishan site [43]. The image is from ESRI. (c) Most city walls of the Guchengzhai site of the late Longshan culture (4000 BP) are still standing on the ground. (d) There are triple city walls in the Zhengzhou Shang City which is the capital of early Shang Dynasty (3600–3300 BP) [44]. The existing city walls are marked in green. (e) The Jingxiang city is a feudal state of Zheng State which is also a feudal princedom of East Zhou Dynasty (770–256 BC). The image is from MAP WORLD.

Table 1.
Neolithic-Bronze cities.
3.3. Average Nearest Neighbor Analysis
The Neolithic-Bronze Age cities in the study area vary from period to period in both quantities and morphological characteristics of spatial distribution. During some periods, early cities are concentrated in a certain zone, while during other periods, they are commonly distributed across the whole study area. Consequently, we need to identify the distribution pattern of early city groups of each period and at first.
While implementing the average nearest neighbor analysis (ANN), the distribution pattern of ancient cities within an area is identified. The workflow of the ANN analysis is detailed below:
Firstly, the distance between the centroids of each geographic feature and its nearest neighbor geographic feature is computed. Then, the average distance for all of these nearest neighbors is calculated. If the calculated average distance is smaller than the average distance of the assumed random distribution, the spatial distribution pattern of analyzed geographic features will be identified as the centralization mode. On the contrary, the spatial distribution pattern of geographic features is considered to be in a dispersed mode if the computed average distance exceeds that of the assumed random distribution [45].
The ANN ratio is calculated below:
where is the average distance between the centroids of a specific feature and its nearest neighbor feature:
is the average feature spacing for the random distribution:
where di represents the distance between the feature i and its nearest neighbor feature; n is the number of features in the area; A is the envelope area of all features.
ANN larger than 1 suggests the dispersed distribution, while ANN below 1 indicates the centralization distribution.
The spatial analyst toolbox of ArcGIS software has a built-in ANN analysis function that performs automatic ANN analysis of point features.
3.4. Thiessen Polygon Analysis
The Thiessen polygon method is invented by A.H. Thiessen, a climatologist of the Netherlands. The Thiessen polygon consists of a set of connected polygons with no overlap, formed by the perpendicular bisector of any two adjacent points [46]. Thiessen polygons are constructed via the following workflow:
Providing that there is a set of discrete points (Xi, Yj) (i = 1, 2, 3, …, k; j = 1, 2, 3, …, k; k is the total quantity of points) across the planar area B, and B was demarcated into k polygons adjoining each other by a set of straight segments in a way that:
- (1)
- Within each polygon, there is one and merely one discrete point;
- (2)
- In the B area, for any point (x1, y1) lying inside the polygon containing the discrete point (xi, yi), the following inequation always holds, when i ≠ j:
- (3)
- In the B area, for any point (x1, y1) on the common edge of two polygons containing the discrete point (xi, yi), the following equation holds:
The resultant polygons are called Thiessen polygons.
Thiessen polygons are characterized by the fact that any position within the polygon is the closest to the sample point of this polygon and farthest to the sample point of the adjacent polygon; each polygon contains one and only one sample point. Due to their spatial bisecting nature, they can be used to solve the problems such as the closest point and minimum closed circle. It is highly applicable to research on the influence range of early cities.
Most GIS software has built-in functionality of the Thiessen polygon analysis. In this research, ArcGIS of ESRI (Version 9.3.1) was used.
3.5. Calculation of the Cost-Weighted Distance
Considering the effect of topography, we use the cost-weighted distance for Thiessen polygon analysis. We choose elevation, slope, topographic relief and river types as the evaluation factors according to the related research of adjacent areas with similar natural conditions [22]. Combined with regional characteristics and existing research results [22], we also assign categorical values and weights to each factor (Table 2). Then a cost raster map was produced by assigning the value of a weighted sum of all factors to each raster in the region (Figure 3). As opposed to the Euclidean distance, the cost-weighted distance of each ancient city was recorded in the cost distance matrix consisting of a series of valuable grids.
Table 2.
Cost values and weights of factors.
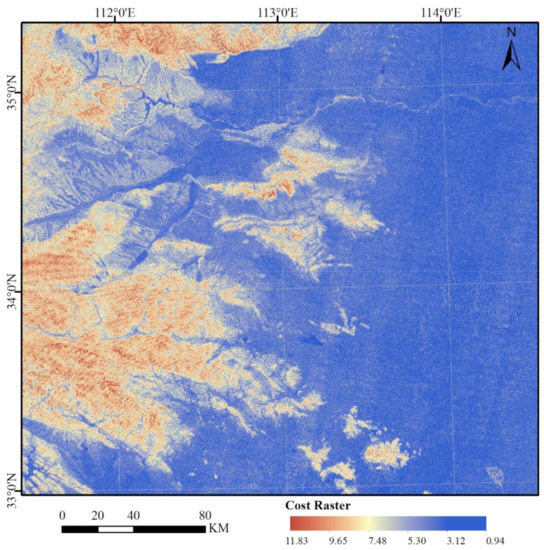
Figure 3.
Cost raster map.
4. Results
4.1. Spatial-Temporal Distribution Characteristics of Neolithic-Bronze Age Cities
The ANN analysis (Figure 4 and Table 3) indicates that the expected average distance between the Yangshao culture cities in the study area is 13.625 km; the measured average distance is 16.016 m; the nearest neighbor ratio is 1.175; the p-value is 0.179; the z-score is 1.343. These suggest random distribution.
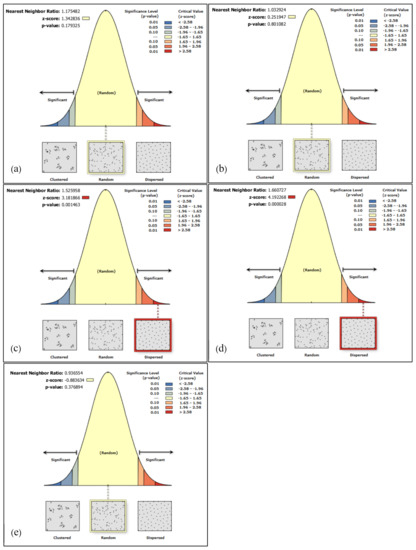
Figure 4.
Results of ANN analysis. (a) Yangshao Culture. Given the z-score of 1.34, the pattern does not appear to be statistically significantly different from a random distribution; (b) Longshan Culture. Given the z-score of 0.25, the pattern does not appear to be statistically significantly different from a random distribution; (c) Erlitou Culture. Given the z-score of 3.18, there is a less than 1% likelihood that this dispersed pattern could be a result of randomness; (d) Shang Dynasty. Given the z-score of 4.19, there is a less than 1% likelihood that this dispersed pattern could be a result of randomness; (e) Zhou Dynasty. Given the z-score of −0.88, the pattern does not appear to be statistically significantly different from a random distribution.
Table 3.
Results of average nearest neighbor analysis.
The regional Longshan culture cities have an expected average distance of 18.549 km, a measured average distance of 19.159 km, the nearest neighbor ratio of 1.033, a p-value of 0.801, and a z-score of 0.252. These also imply random spatial distribution.
The Erlitou culture cities have an expected average distance of 15.635 km, a measured average distance of 23.858 km, the nearest neighbor ratio of 1.526, a p-value of 0.001, and a z-score of 3.182, which demonstrate the dispersed spatial distribution.
City sites of the Shang Dynasty have an expected average distance of 10.652 km, a measured average distance of 17.690 km, the nearest neighbor ratio of 1.661, a p-value of 0.000028, and a z-score of 4.192, which demonstrate the dispersed spatial distribution.
The city sites of the Zhou Dynasty have an expected average distance of 11.407 km, a measured average distance of 10.683 km, the nearest neighbor ratio of 0.937, a p-value of 0.377, and a z-score of −0.884, which demonstrate the random spatial distribution.
4.2. Morphological Characteristics of Constructed Thiessen Polygons for Early Cities
According to the measured average distance (Table 3), the regional influence range of the city site group of each period in the Neolithic-Bronze Age was demarcated. Specifically, based on the outermost city in each period and the corresponding measured average distance of city sites, the enclosing rectangle was drawn and used as the boundary for the Thiessen polygon analysis.
As indicated in Figure 5, the influence area of Yangshao Culture city sites is 28,865 km2, composed of 16 polygons with an average area of 1804 km2. For the Longshan culture city sites, the influence area is 44,958 km2, consisting of 18 polygons with an average area of 2810 km2. the influence area of Erlitou cities is 29,838 km2, including 10 polygons, with an average area of 2984 km2. The influence area of Shang Dynasty cities is 14,776 km2, composed of 11 polygons, with an average of 1343 km2. At last, the influence area of Zhou Dynasty cities is 45,711 km2, consisting of 53 polygons, with an average of 914 km2.
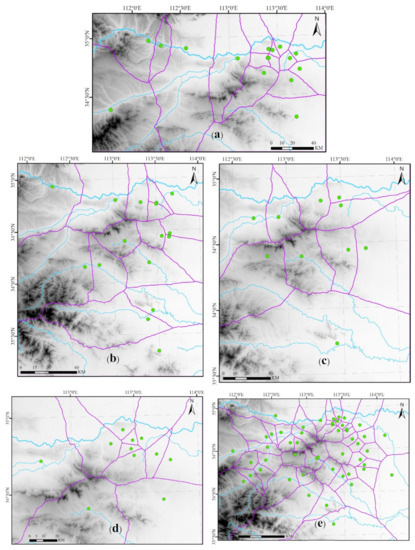
Figure 5.
Thiessen analysis for regional early cities. The green dots are the locations of ancient cities at different times. The blue lines are rivers. (a) Yangshao periods; (b) Longshan periods; (c) Erlitou periods; (d) Shang dynasty; (e) Zhou dynasty.
4.3. Influence Range Evolution of Neolithic-Bronze Age Cities
As indicated in Table 4, the Zhou Dynasty and Longshan culture are associated with the widest city distribution, which nearly involves 20% of the whole study area. The second is found in the Yangshan and Erlitou cultures, which cover 10% of the total study area. The smallest city influence range is that of the Shang Dynasty cities, covering about 5% of the total study area. The influence range of a single city is mainly represented by the minimum and average areas. These two also indexes characterize the influence range evolution of cities within the same area. The influence ranges from small to large are successively those of the Zhou Dynasty, Shang Dynasty, Yangshao culture, Longshan culture, and Erlitou culture, which deviates from the conventional view that the city influence range constantly expands with time.
Table 4.
Thiessen polygon analysis results.
5. Discussion
5.1. Social Changes Suggested by the Evolution of Influence Ranges of Early Cities
The spatial distribution pattern and influence range of early cities are, to some extent, the manifestation of the social organization structure and its variation. The spatial distributions of cities of the Yangshao and Longshan cultures are both random, which reflects the randomness of city site selection, thereby indicating the loosened connection and equal social status among cities. For the city sites of the Erlitou culture and Shang Dynasty, the spatial distributions are dispersed, which may result from the relatively small number of principalities granted by the Xia and Shang Dynasty central authorities during the initial implementation of this feudal system. When it comes to the Zhou Dynasty, most regional cities are built during the Spring and Autumn and the Warring States Periods (770–256 BC, the Eastern Zhou Dynasty), and only four cities are built during the Western Zhou Dynasty (1046–771 BC) [47]. The spatial distribution of the Zhou Dynasty cities changes back to a random type, which may result from two facts. Firstly, some relatively powerful principalities also started to implement the feudal system, as the governance of the central authority declined, resulting in the considerable growth of the city quantity and the random selection of city locations. Secondly, numerous new cities were built by principalities for national defense, as wars among principalities were fairly frequent during the Warring States Period (770–476 BC). This also contributed to the higher randomness of the city’s spatial location at that time.
The influence range of early cities during different periods increases in the order of Zhou Dynasty, Shang Dynasty, Yangshao culture, Longshan culture, and Erlitou culture. As stated above, this deviates from the conventional view that the city’s influence range should constantly expand with time. Furthermore, the spatial distributions of city groups in each period may present geometrical characteristics inconsistent with those of the corresponding influence range. The city groups of the Yangshao, Longshan, and Eerlitou cultures and Shang Dynasty are rather concentrated with narrow distribution ranges. On the contrary, the Zhou Dynasty city groups spread all over the study area, with a rather large distribution range. It is clear that due to a large number of principalities under the extensive enforcement of the feudal system, the city of the Zhou Dynasty is commonly associated with a small influence range. Moreover, the distribution range of the Shang Dynasty city group is limited and so is the city influence range at that time. For Yangshao and Longshan cultures, cities are relatively fewer and less connected, and accordingly, the influence range of each city is relatively large. Finally, for the Erlitou culture, the governance of the capital city-level settlement in the study area is considerably strengthened and the central authority appears to have thorough planning on city development. Meanwhile, the city’s quantity is relatively small. These two factors endow the Erlitou culture with the largest city influence range during the Neolithic-Bronze Age.
5.2. Interaction between the Early City Evolution and Natural Environment
The Holocene environment of the study area has experienced the following process (Figure 6). During the Early Holocene (10,000–8000 BP), with the ceasing of the last glacial period, the regional climate changed from arid and cold to humid and warm [45,46,47,48]. Consequently, the long-lasting river silting since the Pleistocene was ended by a large-scale river incision at 10,000 BP, followed by silting again at 9000 BP [49]. During the Middle Holocene (8000–4000 BP), the regional climate was warm and humid for a rather long time. Nevertheless, two monsoon events occurred around the late Yangshao period (5300 BP) and late Longshan period (4200 BP), respectively, resulting in an arid and cool climate which was accompanied by the long-term river silting and sudden river downcutting at 4000 BP. During the late Holocene (4000 BP–present), the regional climate changed toward arid and cold, with considerable declines in both temperature and rainfall. During the Eastern Zhou Dynasty, river downcutting since 4000 BP ceased, followed by a prolonged silting process. As indicated by the C14 record in Figure 5 [50], the intensity of human activities in the study area grows in a fluctuating manner and peaks during the Xia-Shang Dynasties.
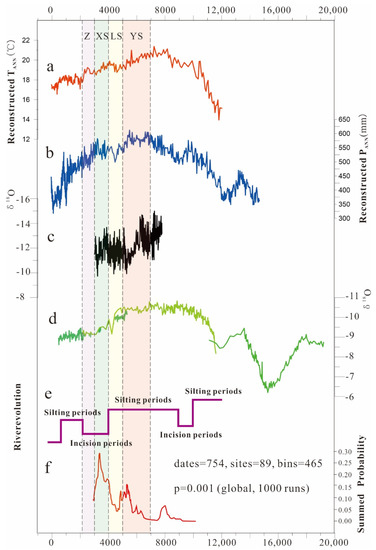
Figure 6.
The Holocene climate change, fluvial landform evolution and the SPD of radiocarbon dates in Central China. (a) Holocene temperature reconstruction in the location (141.8°E, 36°N) [48]; (b) Holocene precipitation reconstruction from Gonghai Lake [51]; (c) δ18O record of stalagmite from the southeastern Fergana Valley [52]; (d) δ18O record of stalagmite from Sanbao Cave [53]; (e) the regional fluvial landform evolution [49]; (f) the SPD of radiocarbon dates indicated that there was a cultural trough during 5.0–4.5 ka BP in Central China [50].
The evolution of early cities in the study area interacts with the natural environment. During the Yangshao culture, precipitation was high, accompanied by prevalent river silting. Under such circumstances, the climate was warm and humid and the river level was relatively high. Therefore, the Yangshao people tended to develop their settlements on the loess hills and tablelands, with constructed moats for water drainage. Consequently, moat-surrounded settlements constituted the prototypes of early cities. Nevertheless, since these early cities were mostly located on loess hills and tablelands, they had smaller influence ranges. During the Longshan culture, the regional temperature and precipitation declined, and people started to exploit the lower geomorphic units, thereby resulting in wider distribution and larger influence ranges of early cities. After the river downcutting event at 4000 BP, the river channel in the plain area began to be fixed and the river flooding was gradually mitigated. Consequently, people developed cities in the broad plain area and the city influence range became larger than that of the Longshan culture. During the Shang and Zhou Dynasties, the zones suitable for city development increased in the context of constantly decreasing temperature and rainfall and prolonged river downcutting. At this time, people could select locations for city construction across the broad area according to their preferences. In general, the distribution and influence range of cities of the Xia-Shang period are primarily influenced by human culture and secondarily impacted by the natural environment.
6. Conclusions
Using the GIS spatial analysis and including the average nearest neighbor and Thiessen polygon analyses, we investigated the spatial-temporal distribution and influence range of Neolithic-Bronze Age cities in the Songshan Mountain surrounding area, followed by explorations of the roles of human culture and natural environment in the evolution of these cities. The following conclusions were drawn:
- (1)
- Spatial distributions of early cities in the study area are random during the Yangshao and Longshan cultures, dispersed during the Erlitou culture and Shang Dynasty, and again random during the Zhou Dynasty.
- (2)
- Influence ranges of early cities are the largest during the Erlitou culture, followed by those of the Longshan culture, Yangshao Culture, and Shang Dynasty. This fact is different from the conventional view that the city’s influence range should continuously expand with time.
- (3)
- The Holocene climate variation and the consequent cyclic river downcutting and silting affect the city site selection and thus the spatial-temporal distribution and influence range of early cities. The enfeoffment system occurring during the Erlitou culture also plays a key role.
- (4)
- In general, the natural environment is more important for the spatial distribution and influence range of early cities during Yangshao and Erlitou cultures, while human culture plays a dominant role during Xia and Shang Dynasties when the natural environment is relatively stable.
Author Contributions
Data curation, P.C., L.Z. and L.G.; Formal analysis, Y.T. and P.L.; Investigation, S.Y. and Q.W.; Methodology, P.C. and Z.W.; Project administration, P.L.; Resources, H.Y.; Software, X.Z. and R.L.; Writing–original draft, Y.T. All authors have read and agreed to the published version of the manuscript.
Funding
This research was funded by the National Key R&D Program of China (2020YFC1521900), the National Natural Science Foundation of China (Grant Nos. 41971016 and 41671014), the National Social Science Foundation of China (Grant No. 19ZDA227), the Study of Environment Archaeology in Zhengzhou, the Digital Environment Archaeology Specially-appointed Researcher of Henan, China (Grant No. 210501002), and the Science and Technology Open Cooperation Project (Grant No. 210901006) and the Science and Technology Think-Tank Project of Henan Academy of Sciences (Grant No. 210701002).
Conflicts of Interest
The authors declare no conflict of interest.
References
- Lu, P.; Chen, P.; Tian, Y.; He, Y.; Mo, D.; Yang, R.; Lasaponara, R.; Masini, N. Reconstructing settlement evolution from neolithic to Shang dynasty in Songshan mountain area of central China based on self-organizing feature map. J. Cult. Herit. 2019, 36, 23–31. [Google Scholar] [CrossRef]
- Gu, C.; Chai, Y.; Cai, J.; Niu, Y.; Sun, Y.; Chen, T.; Ye, J. Chinese Urban Geography; The Commercial Press: Beijing, China, 1999. [Google Scholar]
- Xu, X.; Zhou, Y.; Ning, Y. Urban Geography; Higher Education Press: Beijing, China, 1997. [Google Scholar]
- Xu, H. Pre-Qin City Archaeology; Gold Wall Press and Xiyuan Press: Beijing, China, 2017. [Google Scholar]
- Lu, P. Review on prehistoric settlement geography research. Prog. Geogr. 2013, 32, 1286–1295. [Google Scholar]
- Lu, P.; Yang, R. Overview on the researches of the prehistoric settlement in the digital environment archaeology. Areal Res. Dev. 2013, 32, 165–169. [Google Scholar]
- Nakoinz, O.; Knitter, D. Modelling Human Behaviour in Landscapes; Quantitative Archaeology and Archaeological Modelling; Springer: Cham, Switzerland, 2016. [Google Scholar] [CrossRef]
- O’Sullivan, D.; Unwin, D. Geographic Information Analysis; John Wiley & Sons Inc.: Hoboken, NJ, USA, 2002. [Google Scholar]
- Bevan, A.H.; Lake, M. (Eds.) Computational Approaches to Archaeological Spaces; Left Coast Press: Walnut Creek, CA, USA, 2013. [Google Scholar]
- Inomata, T.; Triadan, D.; López, V.A.V.; Fernandez-Diaz, J.C.; Omori, T.; Bauer, M.B.M.; Hernández, M.G.; Beach, T.; Cagnato, C.; Aoyama, K.; et al. Monumental architecture at Aguada Fénix and the rise of Maya civilization. Nature 2020, 582, 530–533. [Google Scholar] [CrossRef] [PubMed]
- Ayala, G.; Wainwright, J.; Walker, J.; Hodara, R.; Lloyd, J.M.; Leng, M.; Doherty, C. Palaeoenvironmental reconstruction of the alluvial landscape of Neolithic Çatalh€oyük, central southern Turkey: The implications for early agriculture and responses to environmental change. J. Archaeol. Sci. 2017, 87, 30–43. [Google Scholar] [CrossRef]
- Luo, L.; Wang, X.; Liu, C.; Guo, H.; Du, X. Integrated RS, GIS and GPS approaches to archaeological prospecting in the Hexi Corridor, NW China: A case study of the royal road to ancient Dunhuang. J. Archaeol. Sci. 2014, 50, 178–190. [Google Scholar] [CrossRef]
- Lu, P.; Yang, R.; Chen, P.; Guo, Y.; Chen, F.; Masini, N.; Lasaponara, R. On the use of historical archive of aerial photographs for the discovery and interpretation of ancient hidden linear cultural relics in the alluvial plain of eastern Henan, China. J. Cult. Herit. 2017, 23, 20–27. [Google Scholar] [CrossRef]
- Garcia, A. GIS-based methodology for Palaeolithic site location preferences analysis. A case study from Late Palaeolithic Cantabria (Northern Iberian Peninsula). J. Archaeol. Sci. 2013, 40, 217–226. [Google Scholar] [CrossRef]
- Li, Y.; Lu, P.; Mao, L.; Chen, P.; Yan, L.; Guo, L. Mapping spatiotemporal variations of Neolithic and Bronze Age settlements in the Gansu-Qinghai region, China: Scale grade, chronological development, and social organization. J. Archaeol. Sci. 2021, 129, 105357. [Google Scholar] [CrossRef]
- Lu, P.; Tian, Y.; Yang, R. The study of size-grade of prehistoric settlement in the Circum-Songshan area based on SOFM network. J. Geogr. Sci. 2013, 23, 538–548. [Google Scholar] [CrossRef]
- Zheng, H.; Zhou, Y.; Yang, Q.; Hu, Z.; Ling, G.; Zhang, J.; Gu, C.; Wang, Y.; Cao, Y.; Huang, X.; et al. Spatial and temporal distribution of Neolithic sites in coastal China: Sea level changes, geomorphic evolution and human adaption. Sci. China Earth Sci. 2018, 61, 123–133. [Google Scholar] [CrossRef]
- Cui, Y.; Liu, Y.; Ma, M. Spatiotemporal evolution of prehistoric Neolithic-Bronze Age settlements and influencing factors in the Guanting Basin, northeast Tibetan Plateau. Sci. China Earth Sci. 2018, 61, 149–162. [Google Scholar] [CrossRef]
- Dong, G.; Jia, X.; Elston, R.; Chen, F.; Li, S.; Wang, L.; Cai, L.; An, C. Spatial and temporal variety of prehistoric human settlement and its influencing factors in the upper Yellow River valley, Qinghai Province, China. J. Archaeol. Sci. 2013, 40, 2538–2546. [Google Scholar] [CrossRef]
- Yan, L.; Shi, Y.; Yang, R.; Lu, P. Prehistoric settlement sites selection preference zoning around Songshan area. J. Tongji Univ. (Nat. Sci.) 2013, 41, 624–629. [Google Scholar]
- Wu, L.; Zhou, H.; Li, J.; Li, K.; Sun, X.; Lu, S.; Li, L.; Zhu, T.; Guo, Q. Thiessen polygon analysis and spatial pattern evolution of Neolithic cultural sites (8.0–4.0 ka BP) in Huaibei Plain of Anhui, East China. Quat. Int. 2019, 521, 75–84. [Google Scholar] [CrossRef]
- Fang, L.; Yu, L.; Nie, Y.; Zhu, J. Spatiotemporal analysis of prehistoric settlement clustering based on terrain constraints in the Linfen area of China. Geoarchaeology 2019, 34, 509–521. [Google Scholar]
- Shi, Z. Henan Natural Conditions and Natural Resources; Henan Science and Technology Press: Zhengzhou, China, 1983. [Google Scholar]
- Wang, W.; Mao, J. The Geography Annals of Henan; Henan people’s Publishing House: Zhengzhou, China, 1990. [Google Scholar]
- You, L.; Yang, J. Chinese Geomorphology; Science Press: Beijing, China, 2013. [Google Scholar]
- Zhou, K.; Zhang, S.; Zhang, Z.; Yang, R.; Cai, Q.; Song, G.; Song, Y.; Mo, D.; Wang, H.; Lu, P.; et al. Mountain Song culture circle. Cent. Plains Cult. Relics 2005, 1, 12–20. [Google Scholar]
- Zhang, Z.; Zhou, K.; Yang, R.; Zhang, S.; Cai, Q.; Lu, P.; Hao, L.; Wang, C. Environmental archaeology in the Shuangji River Basin. Quat. Sci. 2007, 27, 453–460. [Google Scholar]
- Wang, Y.; Gu, W.; Xia, Z.; Zhang, J.; He, J.; Qu, T.; Chen, Y.; Zhao, J.; Lin, Y.; Gao, X.; et al. Study on the Development of Late Pleistocene Hominid Culture in Central China; Science Press: Beijing, China, 2022. [Google Scholar]
- Wang, Y.; Xia, Z.; Wang, S. Lijiagou Site and Paleolithic-Neolithic Transition-Agricultural Origin Research in the East Piedmont of Songshan Mountain; Science Press: Beijing, China, 2018. [Google Scholar]
- Liu, Q.; Han, G. The archaeological observation on the evolution of the history and culture in the Central Plains area. Acta Archeol. 2016, 3, 293–318. [Google Scholar]
- Expert Group of Xia, Shang and Zhou Dynasty Chronology Project. The Report of Xia, Shang and Zhou Dynasty Chronology Project; Science Press: Beijing, China, 2022. [Google Scholar]
- Zhang, S.; Xin, Y.; Hu, Y.; Yan, F. Excavation of Peiligang culture remains in Tanghu site of Xinzheng, Henan. Archaeology 2008, 5, 3–20. [Google Scholar]
- Zhang, Y.; Zhao, X.; Qiao, L. Excavation of a Yangshao site of city in the Outskirts of Zhengzhou. Cult. Relics 1999, 7, 4–15. [Google Scholar]
- Zhang, G. A Comprehensive Study of Early Cities in the Central China; Science Press: Beijing, China, 2018. [Google Scholar]
- Zhao, C. The Neolithic Settlement Evolution in Zhengzhou-Luoyang Region; Peking University Press: Beijing, China, 2001. [Google Scholar]
- Bo, X. General History of China; Huaxia Publishing Co. LTD: Beijing, China, 2016. [Google Scholar]
- Ge, Z. Study on Enfeoffment System in Zhou Dynasty; Heilongjiang People’s Publishing House: Haerbin, China, 1992. [Google Scholar]
- Li, X. The Formation of Ancient Civilization and the State of China; Beijing China Social Sciences Press: Beijing, China, 2007. [Google Scholar]
- National Cultural Heritage Administration of China. Atlas of Chinese Cultural Relics: Henan Volume; SinoMaps Press: Beijing, China, 1991.
- Gu, W. Civilizational Light–Exploration and Research on Ancient City of Zhengzhou; Science Press: Beijing, China, 2016. [Google Scholar]
- Zhang, Y. Study on the Changes of Cities from Eastern Zhou to Qin-Han Dynasties around Songshan Region; Zhengzhou University: Zhengzhou, China, 2019. [Google Scholar]
- Zhengzhou Institute of Cultural Relics and Archaeology, The Institute of Archaeology, Chinese Academy of Social Sciences. The archaeological report of Neolithic culture within Shuanghuaishu site. Archaeology 2021, 7, 747–768. [Google Scholar]
- Training Course for Archeological Team Leaders of State Cultural Heritage Administration. Excavation of Xishan Yangshao Era city site in Zhengzhou. Cult. Relics 1997, 7, 4–15. [Google Scholar]
- Liu, Y.; Wu, Q.; Xue, B. A new investigation of the city layout and the trend of the outline wall of Zhengzhou in Shang Dynast. J. Zhengzhou Univ. (Philos. Soc. Sci. Edn.) 2010, 43, 164–168. [Google Scholar]
- Wang, F. Quantitative Methods and Applications in GIS; Taylor & Francis Group: Abingdon, UK, 2006. [Google Scholar]
- Zhang, H.; Wen, Y.; Liu, A. Algorithm Foundation of Geographic Information System; Science Press: Beijing, China, 2006. [Google Scholar]
- Ren, W.; Liu, Y. Archaeology Zhengzhou; Science Press: Beijing, China, 2019. [Google Scholar]
- Marcott, S.A.; Shakun, J.D.; Clark, P.U.; Mix, A.C. A Reconstruction of Regional and Global Temperature for the Past 11,300 Years. Sciences 2013, 339, 1198–1201. [Google Scholar] [CrossRef]
- Lu, P.; Lv, J.; Zhuang, Y.; Chen, P.; Wang, H.; Tian, Y.; Mo, D.; Xu, J.; Gu, W.; Hu, Y.; et al. Evolution of Holocene alluvial landscapes in the northeastern Songshan Region, Central China: Chronology, models and socio-economic impact. Catena 2021, 197, 104956. [Google Scholar] [CrossRef]
- Ren, X.; Xu, J.; Wang, H.; Storozum, M.; Lu, P.; Mo, D.; Li, T.; Xiong, J.; Kidder, T. Holocene fluctuations in vegetation and human population demonstrate social resilience in the prehistory of the Central Plains of China. Environ. Res. Lett. 2021, 16, 055030. [Google Scholar] [CrossRef]
- Chen, F.; Xu, Q.; Chen, J.; Birks, H.J.B.; Liu, J.; Zhang, S.; Jin, L.; An, C.; Telford, R.J.; Cao, X.; et al. East Asian summer monsoon precipitation variability since the last deglaciation. Sci. Rep. 2015, 5, 11186. [Google Scholar] [CrossRef]
- Tan, L.; Dong, G.; An, Z.; Edwards, R.; Li, H.; Li, D. Megadrought and cultural exchange along the proto-Silk Road. Sci. Bull 2021, 66, 602–610. [Google Scholar] [CrossRef]
- Wang, Y.; Cheng, H.; Edwards, R.; Kong, X.; Shao, X.; Chen, S.; Wu, J.; Jiang, X.; Wang, X.; An, Z. Millennial- and orbital-scale changes in the East Asian monsoon over the past 224,000 years. Nature 2008, 451, 1090–1093. [Google Scholar] [CrossRef]
Publisher’s Note: MDPI stays neutral with regard to jurisdictional claims in published maps and institutional affiliations. |
© 2022 by the authors. Licensee MDPI, Basel, Switzerland. This article is an open access article distributed under the terms and conditions of the Creative Commons Attribution (CC BY) license (https://creativecommons.org/licenses/by/4.0/).