Abstract
Feature matching between high-resolution satellite stereos plays an important role in satellite image orientation. However, images of changed regions, weak-textured regions and occluded regions may generate low-quality matches or even mismatches. Furthermore, matching throughout the entire satellite images often has extremely high time cost. To compute good matching results at low time cost, this paper proposes an image block selection method for high-resolution satellite stereos, which processes feature matching in several optimal blocks instead of the entire images. The core of the method is to formulate the block selection into the optimization of an energy function, and a greedy strategy is designed to compute an approximate solution. The experimental comparisons on various satellite stereos show that the proposed method could achieve similar matching accuracy and much lower time cost when compared with some state-of-the-art satellite image matching methods. Thus, the proposed method is a good compromise between matching accuracy and matching time, which has great potential in large-scale satellite applications.
1. Introduction
Feature matching is a preliminary step in satellite image orientation that aims to find correspondences between satellite images [1]. The feature matching accuracy will significantly influence the orientation results. Therefore, it is still one of the research hotspots in both photogrammetry and computer vision communities [2].
Compared with feature matching in aerial or terrestrial scenarios, the feature matching of satellite stereos meets several unique challenges, such as large image sizes [3], large weak-textured regions [4], geometric distortions [5], cloud occlusions and seasonal changes [6]. The above challenges will greatly increase matching time complexity and influence the final orientation results since the correspondences in these challenging regions are often of low accuracy [7]. In order to achieve good matching results, current work either finds correspondences throughout whole image pairs to guarantee enough good matches for orientation or utilizes some constraints (e.g., pyramid strategy and epipolar strategy) for the efficiency purpose [3]. Therefore, the feature matching of satellite stereos can be categorized into: (1) robustness-first algorithms and (2) efficiency-first algorithms.
The robustness-first algorithms focus on improving the robustness and accuracy of feature matching between satellite stereos, especially in geometric distortion, radiometric distortion and weak-textured scenarios. Traditional methods utilized some famous descriptors (e.g., SIFT [8], SURF [9], ORB [10], BRISK [11] and AKAZE [12]) in satellite image matching, which is able to obtain robust matching results against Euclidean geometric distortions and local linear radiometric distortions [5,13,14,15,16]. However, these traditional ones may meet challenges in the scenarios of more complex geometric and radiometric distortions, which are common in off-track or multi-source satellite stereos. To further improve the matching robustness of satellite stereos, some work either improves the descriptors themselves by merging variant traditional features [17] and integrating affine invariant features [18,19,20] and intensity invariant features [21,22] or imposes spatial regularization constraints to reduce the matching ambiguity [7,23,24]. In recent years, a convolutional neural network (CNN) has been utilized in feature matching, which is able to extract more accurate and more robust deep features, especially in several challenging scenarios [6,25,26,27,28,29,30]. However, to guarantee finding enough good matches, such methods usually involve the entire images in feature matching, which greatly increases the time complexity of feature matching.
The efficiency-first algorithms focus on improving the matching efficiency of satellite stereos. Some work utilized epipolar lines and image pyramids to predict the potential positions of correspondences, which greatly reduce the search space of feature matching [3,4,31,32]. On the other hand, Ling et al. obtained matches from evenly distributed image blocks instead of the whole images, which is an alternative way to reduce the matching time cost [33]. However, the above methods did not distinguish the ready-to-match regions, and the regions in the challenging scenarios may bring obvious mismatches in the next orientation process. Moreover, the image block-based matching algorithm cannot be applied in the scenarios of large positioning errors (e.g., hundreds of pixels) of satellite stereos, since large positioning errors may bring wrong image block pairs in stereos.
For the purpose of efficient and robust feature matching, this paper proposes an image-matching block selection algorithm with the basic assumption that the matches of only a few image blocks could achieve competitive orientation results with the ones of the entire image stereos. The core of the proposed method is to formulate the image block selection into the three-step optimization of a discrete energy function. Since the optimization is an NP-hard problem, a greedy solution is utilized for an approximate optimal result. The proposed method is able to avoid difficult matching regions (e.g., water, clouds) and select optimal image blocks, thus resulting in high-quality matches for orientation. Furthermore, the proposed method imposes block enlargement constraints in the optimization, which can achieve robust matching results against the positioning errors of hundreds of meters. The main contribution of the proposed method is to greatly reduce the matching time cost of satellite stereos while maintaining robust matching results.
2. Methodology
2.1. Workflow
This paper aims to reduce matching time costs while keeping the matching accuracy of satellite stereos at a sub-pixel level by selecting a few optimal image blocks for matching. The basic idea is that evenly distributed, textured and photo-consistency blocks tend to provide good matches for high-accuracy orientation. Therefore, this paper proposes an optimal image block selection method with three-step optimizations, which selects optimal image blocks step by step with the constraints of block textures, block distributions and photo consistency between block pairs. In general, the input of the proposed method is high-resolution (HR) satellite stereos with the corresponding geographic configuration (i.e., rational polynomial coefficient (RPC) files); the workflow is shown in Figure 1. Before block selection, both satellite stereos were rectified on a common height plane so that their GSDs were unified and the rotation distortions could be eliminated, which could simplify the next block selection process.

Figure 1.
Workflow of the proposed method.
This paper takes any one of satellite stereos as the basic image and the other is denoted as . Before optimization, both images were automatically zoomed out, and the optimization process was conducted on the zoomed image for the computation efficiency purpose. In this paper, the zoomed-out ratio is set as 4 throughout the paper for two reasons: (1) high-resolution satellite images already have sub-meter resolutions (e.g., GSD: 0.5 m) so that the zoomed images with 4× ratio (e.g., GSD: 2.0 m) still have enough texture information for the block selection; (2) the original image block size is set as 2000 × 2000 pixels in this paper, and the larger ratios (>4) will lead to much smaller zoomed sizes (<500 × 500 pixels), which is too small to select optimal blocks. In the first step of the optimization, the overlap regions between the zoomed basic images and are divided into a series of nonoverlap fixed blocks, and several candidate optimal blocks are selected according to their textures and distributions (e.g., red rectangles in Figure 1a), where is the ith block in . Due to seasonal changes or cloud occlusions, it is possible that the potential optimal blocks in are not fit for . Therefore, this paper further considers the texture information in , where the blocks in are obtained by forward–backward projections on a common height plane, as shown in Figure 1b. The common height plane is acquired by averaging elevations of SRTM within the geographic scope of satellite stereos. Only the blocks with rich textures in both images are selected, e.g., the blue rectangles in Figure 1b. These selected blocks in the second optimization step are termed with being the ith block pair in both and . Due to the underlying positioning errors of satellite images, the projected blocks in may be inconsistent with the ones in . This paper therefore enlarges the projected blocks in to guarantee containing the consistent information with the blocks in , as shown in Figure 1b. In the third optimization step in Figure 1c, this paper imposes photo-consistency constraints between block pairs in through feature matching techniques, and selects optimal block pairs with good matches, e.g., the green rectangle in Figure 1c. Finally, the sizes of the projected blocks in are refined to guarantee that the block sizes in both and are similar. These optimal blocks are then resampled in original GSD (ground sampling distance) for feature matching and orientation.
The time complexity of the three-step optimizations is low, which only takes a few seconds. Though feature matching is still used in the optimization to guarantee the photo-consistency between block pairs, the number of these ready-to-match blocks is small after the first and the second optimization. Moreover, the image pyramid strategy also greatly reduces the time complexity. Therefore, the proposed method could achieve good matching results at low time cost.
2.2. Formulation
2.2.1. Global Energy Function
Given a satellite stereo and the corresponding zoomed-out stereo , this paper formulates the image block selection problem as the minimization of an energy function in Equation (1), which consists of cost term and regularization term with the former representing the probability of being selected for each block and the latter imposing spatial distance constraints among blocks.
Here, is the designed energy function, whose optimal solution is the selected blocks for feature matching; is the set of the selected blocks; is the pre-defined block number for selection; is the set of candidate blocks, whose block number is normally larger than . The essence of Equation (1) is to select blocks that minimize the energy function. In general, and have different meanings in different steps of the optimization. In order to distinguish different and in different steps, the subscripts are added as and , . In the first-step optimization, represents the set of all blocks in , and represents the number of blocks for the optimal solution of the first step. In the second-step optimization, its input block set is exactly the solution of the first-step optimization; therefore, the element number of is . After the optimization, the optimal block number is reduced to with being the number scaling factor. Similarly, the input block is exactly the solution of the former optimization, and the optimal block number is reduced to . The scaling factor s is related to the solution number during three-step optimization. The larger scaling factor s will increase the time cost of block selection, while the smaller one may ignore some good block pairs. Thus, the scaling factor should be appropriately determined. The candidate block sets from the solution of the former-step optimization may contain more inappropriate blocks than appropriate ones, especially in some difficult matching scenarios (e.g., cloudy imagery). Thus, the solution number should be smaller than half the size of the candidate block set, i.e., > 2. On the other hand, the time efficiency of the proposed method requires the smallest . Thus, this paper set = 3 by considering the above two factors.
The first term of Equation (1) serves as the cost term, which quantitatively evaluates the texture information and photo consistency information of image blocks and sums these evaluation results limited by the predefined block number. The lower cost means the higher probability of being selected. In the first term, is any one block in and is the cost of at label . In the optimization of Equation (1), each block only has binary labels. For example, label 1 means “selected blocks” and label 0 means “not selected blocks”. Since each step of the optimizations considers different cost constraints (e.g., textures in for the first-step optimization, textures in both and for the second-step optimization and the photo-consistency information for the third-step optimization), the cost terms in each step have different mathematical formulations, which will be introduced in Section 2.2.2.
The second term of Equation (1) serves as the regularization term, which tries to make the selected blocks stay away from each other for the purpose of evenly distributed matches. In the second term, is a penalty coefficient, which is used to balance the impact of the regularization term on the block selection results. The optimal value of will be analyzed in the experimental part. are any two blocks in and measures the center distances between and . Detailed descriptions about the regularization term will be introduced in Section 2.2.3.
2.2.2. Cost Term
To achieve a good compromise between matching accuracy and time cost, the proposed method optimizes the block selection results step by step. Each step has different formulations of the cost term. In the first-step optimization, the cost term only considers texture information in so that several textured blocks could be efficiently selected from hundreds of candidate blocks. In this paper, intensity gradients are used to evaluate textures due to its low time cost. The cost term of the first-step optimization is therefore represented as:
where is the cost term in the first-step optimization and is a pixel which is located in the block . is the intensity gradient of , which is computed by the Sobel operator in this paper. When the block is selected (i.e., ), the cost term is the summation of ; otherwise, it is zero.
Due to seasonal changes and cloud occlusions, the textured block in may not be suitable for . Thus, the cost term of the second-step optimization considers the texture information not only in , but also in . In the second-step optimization, only the selected blocks from the former step are considered in the texture evaluation, which is helpful in reducing the time cost. The formulation of the cost term in the second-step optimization is as follows:
where is the cost term in the second-step optimization; is a block pair with being a block in and being a block in ; is the intensity gradient in ; represents the intensity gradient in . Considering the positioning errors of high-resolution satellite images, this paper sets the sizes of being three times larger than the ones of , which is able to improve the robustness of the texture evaluations in .
To ensure that the block pairs are fit for matching, this paper imposes photo-consistency constraints in the third-step optimization through feature matching techniques. Though some feature matching algorithms are complex, the limited block number from the former step will greatly reduce the matching time cost. In the third-step optimization, this paper formulates the photo-consistency constraints as the number of matches, as follows:
where is the cost term in the third-step optimization and is a function of counting the matches between the block pair . In the experimental part, SIFT descriptors are used in the feature matching. means that the blocks with more matches have higher probabilities of being selected.
To balance the amount of each cost term, this paper additionally normalizes the cost term by dividing it by the absolution of the minimum cost term, as follows. After the normalization, the penalty coefficient in Equation (1) can be fixed throughout the three-step optimizations.
Here, is the normalized cost term in the kth optimization and means the minimum cost among the set of .
2.2.3. Regularization Term
The evenly distributed matches tend to generate high-accuracy orientation results. Therefore, this paper defines the regularization term to separate the image blocks so that the matches from these selected blocks are evenly distributed. The regularization term is formulated as the center distances between image blocks (as shown in Equation (6)), which encourages the selected blocks to stay away from each other.
Here, and are the center coordinates of the block and .
To balance the amount of the cost terms and the regularization terms, this paper also normalizes the regularization term by dividing it by the diagonal length of the image, which is able to reduce the regularization term to the range [0, 1].
2.3. Solution
The optimization of the global energy function in Equation (1) is an NP-hard problem. For the purpose of efficient matching, this paper proposes a greedy solution, which is able to obtain an approximate optimal result at low time cost. The greedy solution is divided into stepwise iterations. In each iteration, the greedy solution always selects one local optimal result; thus, the iteration times depends on the predefined number of optimal blocks.
Given the current block set and the optimal block set , the task of the greedy solution is to select the optimal blocks from and add these optimal blocks into . Each step of the optimization has a different block set, which is termed as and with being the step ID of the optimization. In the first-step optimization, is the set containing all image blocks in , and in the next-step optimization, is defined as the optimal results of the former-step optimization. In this paper, the element number of is three times larger than that of . In the experimental part, the optimal element number of will be analyzed and discussed.
All steps of the optimization share the same greedy strategies which iteratively select local optimal results. At the beginning of the iteration, the regularization term is set as zero due to the empty . Thus, the local optimal solution at the beginning is obtained by selecting the block with the minimum cost, e.g., the green rectangle in Figure 2a. The optimal block of the beginning iteration is added into with . In the next iteration, the distances between the remaining blocks in and the ones in are formulated as regularization terms, as shown in Figure 2b, where the red rectangles represent blocks in , and the green one is the block in . The current local optimal result is obtained by selecting the block with the minimum summation of the cost term and the regularization term. The greedy solution is iterated until the number of the selected blocks reaches the pre-defined value.
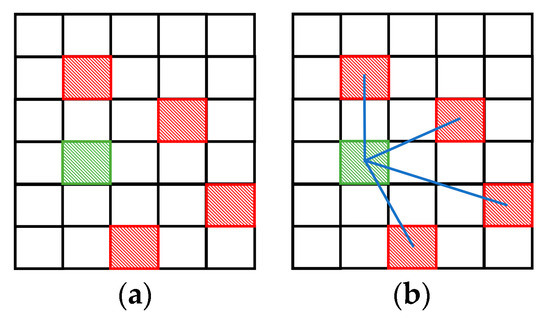
Figure 2.
Greedy solution process. (a) The beginning iteration. (b) The next iteration.
In general, the proposed greedy solution can be formulated as follows:
where is the local optimal solution in the ith iteration; is an image block in the set ; is a block in the set . The greedy solution in Equation (7) iteratively selects optimal blocks until the element number of reaches the predefined value.
2.4. Post-Processing
After the three-step optimization, several optimal blocks in both stereo images are selected. However, considering positioning errors, the block sizes in are much larger than the ones in , thus only a small region in the blocks of is available for matching. In order to further improve the matching efficiency, this paper searches for such available regions through post processing and defines them as the optimal blocks in , as shown in Figure 3. The blue circles represent the matches between block pairs after the three-step optimization. To accurately locate the available regions in , a block (red rectangle) with the same size of the one in moves at a fixed pace in both row and column directions. During this movement, the number of matches within the moving block is counted, and the block with the maximum matches is selected as the optimal block in . Finally, both optimal blocks in and are zoomed to the original sizes for feature matching. In all experimental comparisons, the moving pace is set as 10 pixels.
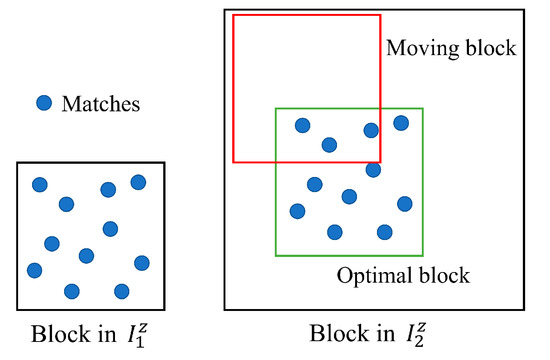
Figure 3.
Post processing.
3. Study Areas and Data
The proposed method was tested on high-resolution satellite stereos including a WorldView-3 satellite dataset with a GSD of 0.3 m and one pair of Gaofen-7 satellites with a GSD of 0.7 m. The WorldView-3 satellite data were off-track stereos, as shown in Figure 4a–c. The first one was near Jacksonville with the imaging time being November 2015 and May 2015, respectively; the second one was near Omaha with the imaging time being September 2015 and October 2015, respectively; the third one was near Buenos Aires with the imaging time being March 2015, June 2015, September 2015 and October 2015, respectively. Both WorldView-3 stereos were provided by the intelligence advanced research projects activity (IARPA) and DigitalGlobe [34,35,36]. On the other hand, the Gaofen-7 stereo was the in-track one near Tibet with the imaging time being March 2021. These satellite stereos would meet challenges in matching with the first one in Figure 4a having large areas of seawater, the second one in Figure 4b having significantly changed farmlands, the third one in Figure 4c having serious radiometric distortions and the last one in Figure 4d having large areas of snow.
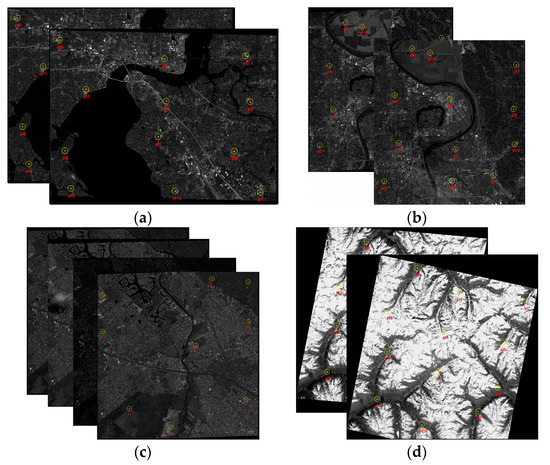
Figure 4.
Experimental data. (a) WorldView-3 pair near Jacksonville. (b) WorldView-3 pair near Omaha. (c) WorldView-3 pairs near Buenos Aires. (d) Gaofen-7 pair near Tibet.
To evaluate the feature matching accuracy of the proposed method, this paper manually selected 12 matching points as checking points for the satellite data in Figure 4a,b,d and 9 matching points for the ones in (c), which are illustrated as yellow circles in Figure 4. In experimental comparisons, four metrics were used to comprehensively evaluate the performances of the proposed method, including: (1) matching time ; (2) inlier number ; (3) inlier percentage ; (4) orientation accuracy . The matching time metric measures the time cost of the whole matching processing, including the block selection process and the feature matching process, which can evaluate the efficiency of different matching algorithms. The inlier number metric finds inliers from the feature matching results by computing their distances to the corresponding epipolar lines. Matches with the epipolar distance shorter than three pixels are selected as inliers. To ensure the geometric accuracy of the epipolar lines, this paper first used the checking points in orientation, and then computed epipolar lines through the true orientation results. The inlier percentage metric computes the percentage of the inliers in the whole matching results, which indicates the robustness of the feature descriptors. The orientation accuracy metric is the average distances of all checking points to the epipolar lines which are derived from the orientation results of all matches. indicates the actual performances of all matches in the later orientation process. The formulation of the four metrics is shown in Equation (8). Moreover, considering mismatches, the orientation process in this paper utilized the iteration method with variable weights [33], which is able to increase the weights of inliers and decrease the weights of mismatches in the adjustment.
Here, is the time cost of the block selection optimization; is the time cost of feature matching in the original GSD; is the set of all matches; is a match in ; is the distance of to the epipolar line which is computed from the orientation results of checking points; is a function to count the number of points that satisfy a certain condition; is the set of checking points; is any one checking point in ; is the distance of to the epipolar line which is computed from the orientation results of matches in ; is a function to average the elements that satisfy a certain condition.
In all experiments, the distance ratio criteria were used before obtaining the final matching results, which firstly found distances between feature points and their candidate matching points in the feature space, and then measured the ratio between the minimum distance and the second minimum distance. The matches with a distance ratio less than 0.4 were eliminated, and the remaining high-confidence matches were used in the experimental accuracy evaluations.
4. Results
This paper utilized the proposed method to select optimal blocks, and then applied SIFT to find matches in these blocks. Since the performances of the proposed method are related to the optimal block number and the penalty coefficient in Equation (1), this paper first analyzed the above two parameters of the proposed method on the Jacksonville data in Section 4.1. The best values of the two parameters were then fixed in all the following experiments. Section 4.2 shows the ability of the positioning error correction of the proposed method, which was tested on Omaha data by manually adding various systematic errors into the corresponding RPC parameters. Section 4.3 compared the proposed method with other state-of-the-art methods in the metrics of , , and . The compared methods include: (1) SIFT matching with fixed image blocks (SFB) [33]; (2) SIFT matching with all image blocks (SAB) [5]; (3) heterologous images matching (HIM) [20] which considers the anisotropic weighted moment and absolute phase orientation in feature descriptors. Finally, the proposed method was further tested on more satellite stereos of Buenos Aires data, which aimed at finding the limitation of the proposed method. In all experiments, the SIFT matching in SFB, SAB and the proposed method were conducted on the same compute configuration with a single core of Intel i9-12900HX, while the proposed block selection optimization used full cores of Intel i9-12900HX. On the other hand, HIM is applied with a single core of AMD 5900HX. The reference clock frequencies of i9-12900HX and 5900HX are similar with the frequency of i9-12900HX being 3.60 GHz and 5900HX being 3.30 GHz. Thus, the small compute configuration differences did not impact the conclusion of the time efficiency comparisons. In the experiments of Section 4.1, Section 4.2 and Section 4.3, the SIFT descriptor was applied after the block selection of the proposed method, and the original block sizes were set as 2000 2000 pixels. However, in order to verify that the block selection results were also fit for other feature descriptors, this paper applied SuperPoint descriptors in Section 4.3 and set the original block sizes as 1500 1500 pixels, which is recommended in [25,37].
4.1. Analysis on Optimal Parameters of the Proposed Method
The performances of the proposed method are related to two parameters: optimal block number and penalty coefficient of the regularization term . The former influences the matching time as well as the orientation accuracy. Higher will guarantee the orientation accuracy but increase matching time; otherwise, lower will reduce the matching time while potentially decreasing the orientation accuracy. On the other hand, the penalty coefficient influences the balances between the block texture information and the block spatial distributions. Lower will increase the texture richness of the blocks but cannot ensure their even distribution. Higher will enhance the even distributions of blocks while potentially decreasing the texture information in the blocks. Therefore, both and should be analyzed for the best performances of the proposed method.
Jacksonville data with image sizes as 43,032 32,805 pixels in Figure 4a were used in the analysis about the optimal value of and . This paper firstly set the block number as six and computed the optimal value of by gradually increasing the values of from 0 to 2.5 and then evaluating the performances of the proposed method with the various in the metrics of and . The evaluation result is shown in Figure 5. The horizontal axis represents the various values of from 0 to 2.5. The vertical axes represent the evaluation results in and , respectively. The figures in the bottom of Figure 5 show the spatial distributions of the optimal blocks of the proposed method with a given value of .
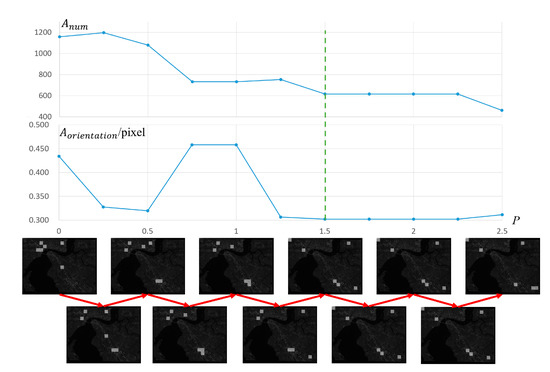
Figure 5.
Analysis of .
The trend of in Figure 5 shows that the number of inliers decreases with the increasing . This is because the increasing will reduce the weight of the cost term in the optimization and generate blocks with less texture information, thus resulting in fewer matching points. However, the orientation accuracy has a trend of being higher with the increasing , though the inlier number decreases. This is because the larger brings more evenly distributed matching points, as shown in the bottom figures of Figure 5. When , most blocks concentrate on the left tops of Jacksonville data, which are the most textured regions in Jacksonville. With the increasing , the image blocks are more evenly distributed. In all the cases of , the corresponding image blocks always avoid seawater regions, thus providing more robust matches.
In Figure 5, the trend of inlier number becomes convergent when , and the highest orientation accuracy is found at . Therefore, this paper sets in all the following experiments.
In the analysis of , this paper varied the value of from 1 to 10 and evaluated the matching results in the metrics of , and , as shown in Figure 6. The horizontal axis represents the various values of from 1 to 10. The vertical axes represent the evaluation results in , and , respectively. The figures in the bottom of Figure 6 show the spatial distributions of the optimal blocks of the proposed method with a given value of .
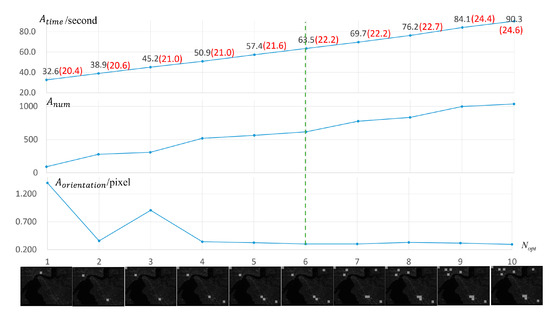
Figure 6.
Analysis of .
Figure 6 shows the trends of , and with various . In the sub-figure of , the total matching time is increasing with the increase of the block number , since more blocks means more feature matching computations. The black digits mean the entire time cost (block optimization time + feature matching time), and the red digits mean the block optimization time of the proposed method. The difference between the minimum and the maximum optimization time is only 4.2 s, which shows that the optimization time of the proposed method is rarely affected by the block number. Furthermore, for the matching in the stereo with the size as 43,032 32,805 pixels, the maximum matching time is only 90.3 s at , which shows the potential ability of the proposed method in the efficient matching.
In Figure 6, the sub-figure of shows that the inlier number is increasing with the increasing block number. However, the corresponding orientation accuracy did not have the same trend with , which shows that more matches cannot guarantee more accurate orientation results. The trend tends to be convergent when , and it has the top third orientation accuracy at 6, 7 and 10. Since the time cost of 6 is less than other two cases, this paper sets 6 in all the following experiments.
In general, this paper sets 1.5 and 6 in all the following experiments, which is considered a good compromise between time cost and orientation accuracy. It should be noted that good satellite stereos with rich texture information could provide more optimal blocks, which will result in more matches. Nevertheless, the core idea of the proposed method is that a few high-quality, evenly distributed matches are enough to support high-accuracy orientation results at low time cost. Thus, this paper only selects several optimal blocks instead of all good blocks in matching. The block number is fixed in all the following experiments, no matter how rich the texture information is that the stereos have.
4.2. Analysis on Positioning Error Correction of the Proposed Method
The block selection results are dependent on the positioning accuracy of the satellite stereos since the blocks in are obtained by forward–backward projections of the blocks in . Large positioning errors may lead to wrong blocks in , which are not consistent with the ones in . To reduce the influence of the positioning errors, this paper enlarges the block sizes in during the optimization so that enough consistent image information could be contained. To test the validation of the proposed method against the positioning errors, this paper tested the matching results of the proposed method on Omaha data with image sizes as 43,210 50,471 pixels. Various positioning errors from 0 m to 1000 m were added into the RPC of Omaha data, and the corresponding matching results were evaluated in the metrics of and , as shown in Figure 7.
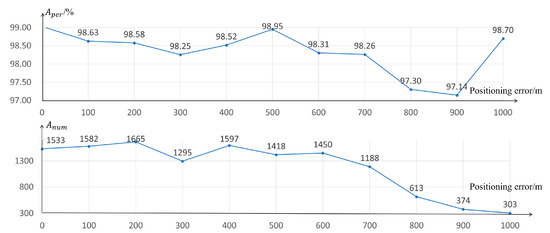
Figure 7.
The performances of the proposed method against various positioning errors.
The sub-figure of shows that the inlier number is similar when the positioning errors are smaller than 600 m, which verifies the ability of the proposed method against the positioning errors. The proposed method set image block size as 2000 2000 pixels. The block sizes in are three times larger than the ones in during the three-step optimization. Thus, the proposed method can theoretically correct positioning errors of 2000 pixels. Since the GSD of Omaha data is 0.3 m, the lossless positioning error correction of the proposed method on Omaha data is at most 600 m. However, when the positioning errors are larger than 600 m, the inlier number is significantly decreasing, since the block pairs in the stereo only have small overlaps. These extremely large positioning errors (>600 m) can be further corrected by further expanding the block sizes in . However, the expanding operation will increase the time cost, and it is rare to find stereos with positioning errors larger than 600 m. Therefore, this paper still set the block enlargement ratio to three times during the three-step optimization. In the other sub-figure, has no obvious differences in all cases of positioning errors with the maximum percentage being 98.95% and the minimum one being 97.14%, due to the robustness of SIFT descriptors.
To comprehensively verify the ability of the positioning error correction of the proposed method, this paper selected any one of the optimal blocks in and visually illustrated the corresponding blocks in with/without positioning error corrections separately. The visual comparisons are shown in Figure 8. The first row in Figure 8 is the image block in , which is the reference block for the visual comparisons. The third to sixth rows represent the corresponding image blocks in with various positioning errors. When the positioning error is zero, both scenarios with and without corrections could achieve consistent blocks with the reference block. However, with the increase of positioning errors, the blocks without corrections only had smaller overlaps with the reference block. When the positioning errors were larger than 600 m, the blocks without corrections had no overlap with the reference one, thus generating no matches. On the other hand, the proposed method could keep the consistent blocks with the reference one when the positioning errors are smaller than 600 m. Even in the worst case (error = 1000 m), the proposed method still finds partial overlap between the blocks of the stereo, which shows that the proposed method has a strong ability against the positioning errors.
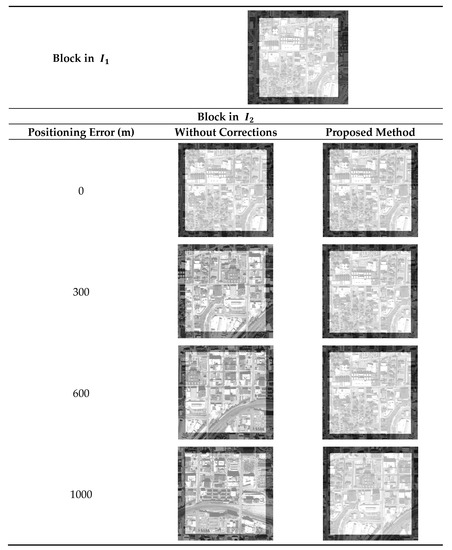
Figure 8.
Visual comparisons with/without positioning error corrections.
4.3. Comparison of Experimental Results
To verify the validation of the proposed method, this paper further compared the proposed method with other developed ones, including: (1) SFB [33]; (2) SAB [5]; (3) HIM [20]. This paper tested these methods on Omaha data with image sizes set to 43,210 50,471 pixels and Tibet data with image sizes set to 42,676 41,249 pixels, and evaluated their matching results in the metrics of , , and , as shown in Figure 9a,b. Both SAB and HIM involved the entire stereos in matching with a large number of matches. The comparisons with them aim to check whether a smaller number of evenly distributed matches from the optimal blocks could achieve competitive orientation results.
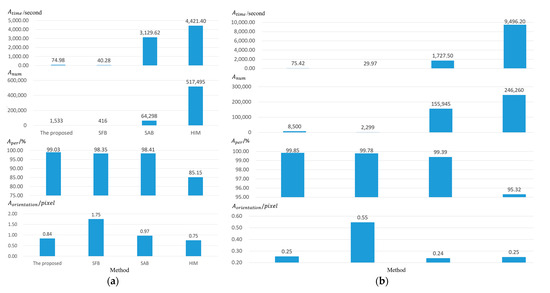
Figure 9.
Evaluations of different methods. (a) Omaha data. (b) Tibet data.
The sub-figure of in Figure 9 shows that the matching time of SFB and the proposed method is much less than that of SAB and HIM, since both SFB and the proposed method selected only a few blocks for matching. SAB and HIM methods found matches throughout the entire images, thus resulting in high time cost. The time cost of the proposed method is slightly higher than SFB due to the optimization process of the proposed method. In general, the proposed method can achieve low time cost around 75 s in large satellite stereos, which is at least 22 times and 58 times faster than SAB and HIM methods, respectively. Contrary to , both SAB and HIM could obtain many more matches than SFB and the proposed method, since both methods found matches throughout the entire images instead of a few blocks. The HIM method found the most matches due to its robustness descriptors against geometric and radiometric distortions. Though the block number of SFB and the proposed method is the same, the proposed method found many more matches than SFB due to its block selection optimizations. The third row of Figure 9 shows the inlier percentages of each method, where SFB, SAB and the proposed method have similar inlier percentages, since all these methods adopted SIFT descriptors in matching. HIM methods had the lowest inlier percentages, while its large number of matches can still guarantee the robustness of the next orientation process.
In the sub-figure of , SFB achieved the lowest orientation accuracy since the matches in the fixed blocks may be of low quality, as shown in Figure 10a. The first row in Figure 10a shows the matching blocks of SFB, which simply selected blocks at fixed intervals. However, these blocks may fall in changed regions (e.g., the block in the top left of Omaha data in (a) and weak-textured regions (e.g., the blocks in the top right of Omaha data in (a)), thus providing low-quality matches or even mismatches. Therefore, SFB achieved the lowest orientation accuracy. The proposed method obtained the average accuracy of 0.545 pixels on Omaha data and Tibet data, which is slightly higher than SAB with an average accuracy of 0.605 pixels. Considering the inlier number of SAB is much higher than the proposed method, the comparison results show that the orientation accuracy is not totally dependent on the inlier number. The proposed method selected optimal image blocks with even spatial distributions and rich texture information (as shown in Figure 10b), where good-quality inliers can be matched for accurate orientation at low time cost. Finally, HIM achieved the highest orientation accuracy with an average of 0.50 pixels, while its time cost is much higher than the proposed method.
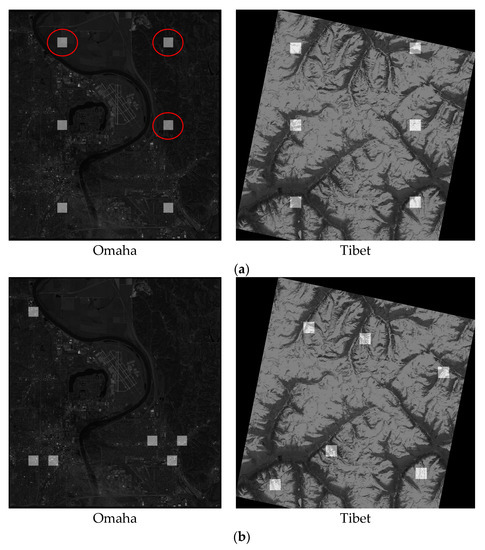
Figure 10.
Image block distributions of SFB and the proposed method. (a) SFB. (b) The proposed method.
Though the inlier number of the proposed method is much less than SAB and HIM, it could achieve an average of 62 times faster time efficiency while keeping similar matching accuracy, which shows that a few evenly distributed, good matches are enough to support high-accuracy orientation results. In general, the proposed method is a good, compromised solution between matching accuracy and matching time, which can compute accurate matching results at low time cost.
In order to find the limitations of the proposed method, this paper further tested the proposed method on the Buenos Aires dataset, which consists of four overlapping images and therefore generates six pairs of satellite stereos. This paper still utilized SIFT to select photo-consistency blocks during the optimization of block selection. However, after the block selection, SuperPoint descriptors were utilized within the optimal blocks for feature matching, which aims at testing the transferability of the proposed method. In general, this paper compared the proposed method with SFB in the metrics of and , and recorded the time cost of block selection for each pair, as shown in Figure 11a,b. The horizontal axis shows the stereo pair ID in the format of - with , being the image ID in the Buenos Aires dataset.
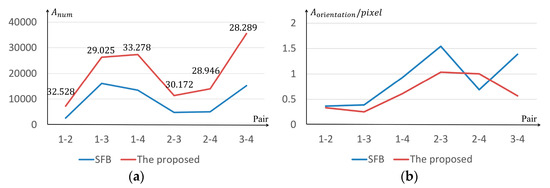
Figure 11.
Comparisons with Buenos Aires dataset. (a) Comparisons in . (b) Comparisons in .
The digits above the orange line in Figure 11a show the time cost of the block selection of the proposed method. Since the original block sizes and the block numbers are the same for SFB and the proposed method, the time cost differences between the two methods mainly focused on the block selection process. The proposed method needs to take extra time in the optimal block selection, which causes higher time cost than SFB. Figure 11a shows that the time cost of the optimal block selection did not change much for different stereo pairs. The average time cost is only 30.373 s, which is acceptable when compared with the time cost of feature matching.
Figure 11a shows that the inlier number of the proposed method is always higher than the ones of SFB. Both methods utilized SuperPoint to find matches within image blocks. During the optimization of the block selection, the proposed method considers texture information constraints and prefers selecting textured blocks. Thus, the proposed method could obtain 2.13 times more inliers than SFB. On the other hand, Figure 11b shows that the orientation accuracy of the proposed method is higher than SFB in most cases with an average accuracy improvement of 28.27%, which shows that the block selection results help to provide more high-quality matches. However, the orientation accuracy of the proposed method is lower than SFB in Pair 2–4 due to the inability of the photo-consistency block selection of the proposed method. This paper adopted the SIFT descriptor in the photo-consistency block selection, though the SIFT matching results may not be reliable, especially in some challenging scenarios. For example, there are serious seasonal changes and radiometric distortions between Pair 2–4, as shown in Figure 12; the SIFT descriptors only found 16 matches from the stereo pair, in which case the photo-consistency constraint is unreliable and therefore disturbs the final block selection results. Adopting more reliable feature descriptors is helpful in improving the block selection results. In general, the proposed method performed well in both time efficiency and orientation accuracy.
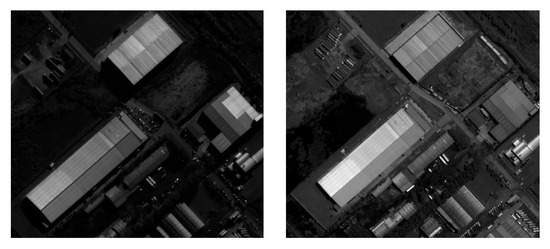
Figure 12.
An example image tile in Pair 2–4.
5. Conclusions
This paper proposed a novel matching method for high-resolution satellite stereos by selecting optimal image blocks and formulating the block selection as a three-step optimization of an energy function. A greedy strategy is designed to obtain an approximate solution at low time cost. The main contributions of the proposed method include: (1) the proposed method only selects optimal image blocks for matching, which could greatly reduce the matching time cost while keep competitive matching accuracy with the entire-image-based matching algorithms; (2) the proposed method could generate robust matching results against large positioning errors of satellite stereos. Since the proposed method only involves block selections, it can combine various matching descriptors in addition to SIFT. Experiments on high-resolution satellite datasets (including two pairs of WorldView-3 satellites and one pair of Gaofen-7 satellites) show that the proposed method has strong matching abilities for satellite stereos against the positioning errors at most 1 km. When compared with other developed matching methods, the proposed method could achieve the best compromise between the matching time cost and the orientation accuracy. In both the WorldView-3 dataset and the Gaofen-7 dataset, the proposed method could achieve the average time cost of 75.20 s, which is almost 62 times faster than those entire-image-based matching methods (e.g., SAB and HIM) while retaining similar matching accuracy. Though the time cost of the proposed method is about 30–40 s higher than SFB, its matching accuracy is higher than SFB by 28.27%. Thus, the proposed method is able to greatly reduce the matching time cost while retaining high matching accuracy. However, the proposed method is only fit for stereo feature matching instead of the multi-view cases. In future work, the block selection method in multi-view cases will be further developed.
Author Contributions
Conceptualization, D.G.; methodology, D.G. and X.H.; software, D.G. and X.H.; validation, X.H. and Y.Y.; formal analysis, X.H.; investigation, X.H. and J.Z.; resources, X.H. and D.G.; data curation, X.H. and D.G.; writing—original draft preparation, X.H. and J.Z.; writing—review and editing, D.G. and Y.H.; visualization, X.H.; supervision, X.H.; project administration, X.H.; funding acquisition, D.G. and X.H. All authors have read and agreed to the published version of the manuscript.
Funding
This research was funded by the National Natural Science Foundation of China (grant number 41701540), Basic Startup Funding of Sun Yat-sen University (grant number 76230-18841205), and 3D reconstruction technology based on high-resolution aerospace line array images (grant number 76230-71020009).
Data Availability Statement
Not applicable.
Acknowledgments
The authors would like to thank the intelligence advanced research projects activity (IARPA) and DigitalGlobe for providing the WorldView-3 satellite imagery in the CORE3D public dataset.
Conflicts of Interest
The authors declare no conflict of interest.
References
- Prakash, P. Introduction to Satellite Photogrammetry, 1st ed.; OrangeBooks Publication: Bhilai, India, 2021. [Google Scholar]
- Kocanaogullari, A.; Ataer-Cansizoglu, E. Active Descriptor Learning for Feature Matching. In Proceedings of the European Conference on Computer Vision (ECCV) Workshops, Munich, Germany, 8–14 September 2018. [Google Scholar]
- Ling, X.; Zhang, Y.; Xiong, J.; Huang, X.; Chen, Z. An image matching algorithm integrating global SRTM and image segmentation for multi-source satellite imagery. Remote Sens. 2016, 8, 672. [Google Scholar] [CrossRef]
- Yuan, X.; Chen, S.; Yuan, W.; Cai, Y. Poor textural image tie point matching via graph theory. ISPRS J. Photogramm. 2017, 129, 21–31. [Google Scholar] [CrossRef]
- Tahoun, M.; Shabayek, A.E.R.; Nassar, H.; Giovenco, M.M.; Reulke, R.; Emary, E.; Hassanien, A.E. Satellite Image Matching and Registration: A Comparative Study Using Invariant Local Features. In Image Feature Detectors and Descriptors: Foundations and Applications; Awad, A.I., Hassaballah, M., Eds.; Springer International Publishing: Cham, Switzerland, 2016; pp. 135–171. [Google Scholar]
- Luo, Q.-Y.; Zhang, J.-D.; Zhu, L.-C.; Huang, X. Research on Feature Matching of High-Resolution Optical Satellite Stereo Imagery under Difficult Conditions. In Proceedings of the 8th China Hight Resolution Earth Observation Conference (CHREOC); Springer: Singapore, 2022. [Google Scholar]
- Huang, X.; Wan, X.; Peng, D. Robust Feature Matching with Spatial Smoothness Constraints. Remote Sens. 2020, 12, 3158. [Google Scholar] [CrossRef]
- Lowe, D.G. Distinctive image features from scale-invariant keypoints. Int. J. Comput. Vis. 2004, 60, 91–110. [Google Scholar] [CrossRef]
- Bay, H.; Ess, A.; Tuytelaars, T.; Van Gool, L. Speeded-up robust features (SURF). Comput. Vis. Image Underst. 2008, 110, 346–359. [Google Scholar] [CrossRef]
- Rublee, E.; Rabaud, V.; Konolige, K.; Bradski, G. ORB: An efficient alternative to SIFT or SURF. In Proceedings of the 2011 International Conference on Computer Vision, Barcelona, Spain, 6–13 November 2011; pp. 2564–2571. [Google Scholar]
- Leutenegger, S.; Chli, M.; Siegwart, R.Y. BRISK: Binary Robust Invariant Scalable Keypoints. In Proceedings of the IEEE International Conference on Computer Vision, Barcelona, Spain, 6–13 November 2011; pp. 2548–2555. [Google Scholar]
- Alcantarilla, P.F.; Solutions, T. Fast explicit diffusion for accelerated features in nonlinear scale spaces. IEEE Trans. Pattern Anal. Mach. Intell. 2011, 34, 1281–1298. [Google Scholar]
- Kuriakose, E.; Viswan, A. Remote sensing image matching using sift and affine transformation. Int. J. Comput. Appl. 2013, 80, 22–27. [Google Scholar] [CrossRef]
- Tahoun, M.; Shabayayek, A.E.R.; Hassanien, A.E. Matching and co-registration of satellite images using local features. In Proceedings of the International Conference on Space Optical Systems and Applications, Kobe, Japan, 7–9 May 2014. [Google Scholar]
- Zheng, M.; Wu, C.; Chen, D.; Meng, Z. Rotation and affine-invariant SIFT descriptor for matching UAV images with satellite images. In Proceedings of the 2014 IEEE Chinese Guidance, Navigation and Control Conference, Yantai, China, 8–10 August 2014; pp. 2624–2628. [Google Scholar]
- Li, X.-X.; Luo, X.; Wu, Y.-X.; Li, Z.-T.; Xu, W.-B. Research on Stereo Matching for Satellite Generalized Image Pair Based on Improved SURF and RFM. In Proceedings of the IGARSS 2020—2020 IEEE International Geoscience and Remote Sensing Symposium, Waikoloa, HI, USA, 26 September–2 October 2020; pp. 2739–2742. [Google Scholar]
- Karim, S.; Zhang, Y.; Brohi, A.A.; Asif, M.R. Feature Matching Improvement through Merging Features for Remote Sensing Imagery. 3D Res. 2018, 9, 52. [Google Scholar] [CrossRef]
- Cheng, L.; Li, M.; Liu, Y.; Cai, W.; Chen, Y.; Yang, K. Remote sensing image matching by integrating affine invariant feature extraction and RANSAC. Comput. Electr. Eng. 2012, 38, 1023–1032. [Google Scholar] [CrossRef]
- Sedaghat, A.; Ebadi, H. Remote Sensing Image Matching Based on Adaptive Binning SIFT Descriptor. IEEE Trans. Geosci. Remote Sens. 2015, 53, 5283–5293. [Google Scholar] [CrossRef]
- Yao, Y.; Zhang, Y.; Wan, Y.; Liu, X.; Guo, H. Heterologous Images Matching Considering Anisotropic Weighted Moment and Absolute Phase Orientation. Geomat. Inf. Sci. Wuhan Univ. 2021, 46, 1727–1736. [Google Scholar]
- Xiang, Y.; Wang, F.; You, H. OS-SIFT: A robust SIFT-like algorithm for high-resolution optical-to-SAR image registration in suburban areas. IEEE Trans. Geosci. Remote Sens. 2018, 56, 3078–3090. [Google Scholar] [CrossRef]
- Chen, J.; Yang, M.; Peng, C.; Luo, L.; Gong, W. Robust Feature Matching via Local Consensus. IEEE Trans. Geosci. Remote Sens. 2022, 60, 1–16. [Google Scholar] [CrossRef]
- Li, J.; Hu, Q.; Ai, M. 4FP-Structure: A Robust Local Region Feature Descriptor. Photogramm. Eng. Remote Sens. 2017, 83, 813–826. [Google Scholar] [CrossRef]
- Liu, Y.-X.; Mo, F.; Tao, P.-J. Matching Multi-Source Optical Satellite Imagery Exploiting a Multi-Stage Approach. Remote Sens. 2017, 9, 1249. [Google Scholar] [CrossRef]
- De Tone, D.; Malisiewicz, T.; Rabinovich, A. Superpoint: Self-supervised interest point detection and description. In Proceedings of the IEEE Conference on Computer Vision and Pattern Recognition Workshops, Salt Lake City, UT, USA, 18–22 June 2018; pp. 224–236. [Google Scholar]
- He, H.; Chen, M.; Chen, T.; Li, D. Matching of remote Sensing Images with Complex Background Variations via Siamese Convolutional Neural Network. Remote Sens. 2018, 10, 355. [Google Scholar] [CrossRef]
- Yang, Z.; Dan, T.; Yang, Y. Multi-Temporal Remote Sensing Image Registration Using Deep Convolutional Features. IEEE Access 2018, 6, 38544–38555. [Google Scholar] [CrossRef]
- Fan, D.; Dong, Y.; Zhang, Y. Satellite image matching method based on deep convolution neural network. Acta Geod. Cartogr. Sin. 2018, 47, 844–853. [Google Scholar]
- Dong, Y.; Jiao, W.; Long, T.; Liu, L.; He, G.; Gong, C.; Guo, Y. Local Deep Descriptor for Remote Sensing Image Feature Matching. Remote Sens. 2019, 11, 430. [Google Scholar] [CrossRef]
- Xu, C.; Liu, C.; Li, H.; Ye, Z.; Sui, H.; Yang, W. Multiview Image Matching of Optical Satellite and UAV Based on a Joint Description Neural Network. Remote Sens. 2022, 14, 838. [Google Scholar] [CrossRef]
- Xiong, J.-X.; Zhang, Y.-J.; Zheng, M.-T.; Ye, Y.-X. An SRTM assisted image matching algorithm for long-strip satellite imagery. J. Remote. Sens. 2013, 17, 1103–1117. [Google Scholar]
- Du, W.-L.; Li, X.-Y.; Ye, B.; Tian, X.-L. A fast dense feature-matching model for cross-track pushbroom satellite imagery. Sensors 2018, 18, 4182. [Google Scholar] [CrossRef] [PubMed]
- Ling, X.; Huang, X.; Zhang, Y.; Zhou, G. Matching Confidence Constrained Bundle Adjustment for Multi-View High-Resolution Satellite Images. Remote Sens. 2020, 12, 20. [Google Scholar] [CrossRef]
- Brown, M.; Goldberg, H.; Foster, K.; Leichtman, A.; Wang, S.; Hagstrom, S.; Bosch, M.; Almes, S. Large-Scale Public Lidar and Satellite Image Data Set for Urban Semantic Labeling. In Proceedings of the SPIE Defense + Security, Orlando, FL, USA, 15–19 April 2018. [Google Scholar]
- SpaceNet on Amazon Web Services (AWS). Available online: https://spacenetchallenge.github.io/datasets/datasetHomePage.html (accessed on 15 October 2018).
- Dataset Was Created for the IARPA CORE3D Program. Available online: https://www.iarpa.gov/index.php/research-programs/core3d (accessed on 24 April 2022).
- Sarlin, P.E.; De Tone, D.; Malisiewicz, T.; Rabinovich, A. SuperGlue: Learning Feature Matching with Graph Neural Networks. In Proceedings of the 2020 IEEE Conference on Computer Vision and Pattern Recognition (CVPR), Seattle, WA, USA, 13–19 June 2020; pp. 4937–4946. [Google Scholar]
Publisher’s Note: MDPI stays neutral with regard to jurisdictional claims in published maps and institutional affiliations. |
© 2022 by the authors. Licensee MDPI, Basel, Switzerland. This article is an open access article distributed under the terms and conditions of the Creative Commons Attribution (CC BY) license (https://creativecommons.org/licenses/by/4.0/).