Article

Coastal High-Temporal Sea-Surface Altimetry Using the Posterior Error Estimations of Ionosphere-Free PPP and Information Fusion for Multi-GNSS Retrievals

1
Department of Navigation Engineering, Naval University of Engineering, Wuhan 430033, China
2
Key Laboratory of Geological Survey and Evaluation of Ministry of Education, China University of Geosciences, Wuhan 430074, China
3
College of Geomatics and Geoinformation, Guilin University of Technology, Guilin 541004, China
4
Naval Institute of Marine Environment, Tianjin 300061, China
*
Author to whom correspondence should be addressed.
Remote Sens. 2022, 14(21), 5599; https://doi.org/10.3390/rs14215599
Submission received: 6 September 2022 / Revised: 3 November 2022 / Accepted: 4 November 2022 / Published: 6 November 2022

Abstract

:
Ocean tidal variation is a key parameter for ensuring coastal safety, monitoring marine climate, and maintaining elevation datum. Recently, the ground-based global navigation satellite system reflectometry (GNSS-R) technique has been applied for regional tidal measurements, which is somewhat restricted in terms of temporal and spatial resolutions. A convenient method to improve temporal resolution of measurements is to combine multi-GNSS observations. This paper proposes a new sea-surface altimetry method using the posterior errors (PE) of dual-frequency carrier-phase signals derived from the ionosphere-free Precise Point Positioning (IF-PPP). Considering that the number of initial retrievals is obviously unsuitable for minute-level tidal measurements, both the time sliding window based on the Lomb–Scargle periodogram and a weighted cubic spline smoothing function are significant processing steps for estimating the reflector heights between the sea surface and antenna center. Measurements from two coastal GNSS stations with different tidal amplitudes are used to test the proposed method and compare it with the tide gauge and the signal-to-noise ratio (SNR) methods, respectively. The experimental results show that the multi-GNSS PE combination method can be used to estimate a minute-level sea level time series, and its root-mean-squared errors (RMSE) are about 12.5 cm. In terms of correlation, for all results, the corresponding coefficients exceed 0.97. Moreover, this combined PE method demonstrates a significant advantage in increasing temporal resolution, which is beneficial for application on high-frequency sea-level monitoring.

1. Introduction

The annual variation in mean sea surface height (MSSH) has been approximately 3.3 mm since the early 1990s, and the rising sea level height caused by global warming has become one of the main slow-onset disasters threatening humankind [1,2]. Accurately monitoring the ocean surface height in the global reference frame and its continuously high-frequency variations is of great significance and value. This can not only can help us to interpret the ocean circulation and physical mechanism of global climate change, but also provide the basic data for developing the global vertical datum. Sea surface heights (SSH) measured by conventional techniques, i.e., satellite altimetry and ground-based tide gauges (TG) [3], have covered most of the global ocean area; however, there are still spatial and temporal gaps and finer-scale variations in tidal height that may be overlooked, particularly in coastal regions. Moreover, the extensive SSH measurements around the world are limited by a decreasing number of TGs and the distorted echo waveforms of altimetry near the coastline. Thus far, the main applications of the global navigation satellite system (GNSS) have been for positioning, navigation, and timing (PNT) services. Focus has been on positioning, navigation, timing, remote sensing, and communication (PNTRC) [4,5]. In recent years, a novel integrated concept of passive remote sensing technique, called GNSS reflectometry (GNSS-R), has been put forward to monitor sea surface characteristics, such as tide [6] and wind speed [7,8], with a low cost, low energy consumption, and large-scale coverage. The GNSS positioning technique can obtain the coordinates of the GNSS observatory and its combination with the ground-based GNSS-R retrievals can measure the absolute SSH parameters.
Previous studies [9,10] have indicated that the ground-based GNSS-R platforms on estimating SSH mainly consist of two observation patterns: Double Antenna Pattern (DAP) and Single Antenna Pattern (SAP). The DAP-based satellite receivers are simultaneously equipped with a low-gain Right-Handed Circular Polarization (RHCP) antenna and a high-gain Left-Handed Circular Polarization (LHCP) antenna and are available for various receiving platforms, such as ground-based GNSS-R, spaceborne GNSS-R, etc. These methods are costly and sensitive to retrieving sea-level height, sea wind speed, and significant wave height with a high resolution. Since the early 1990s, the concept of PARIS (Passive Reflectometry and Interferometry System) was first adopted for sensing small features in the sea-level observations [11]. The Zeeland Bridge I in the Netherlands was then used as an example to test the potential of the PARIS-based SSH estimation approach using the relative delays between the direct and reflected signals [12]. Moreover, Löfgren et al. [13] also applied a DAP-based receiver to analyze three-month SSH results and compare them with independent measurements from two stilling well gauges, which showed a high correlation of 0.96.
Studies on the GNSS-R SSH retrieval algorithm with a standard geodetic receiver have been carried out by multiple research teams since the early 21st century, when the concept of interference patterns was first put forward by Anderson [14]. This method only used the interference components of signal-to-noise ratio (SNR) data from both the direct and reflected signals received by a zenith-looking geodetic antenna to measure the height information above the reflection layer, which is significant and applicable for monitoring ocean characteristics such as sea surface height. Subsequently, a great deal of analysis and many studies involve the SAP-based GNSS-R technique for altimetry, and this technique is generally termed GNSS-interferometric/multipath reflectometry (GNSS-IR/-MR) [15]. Larson et al. [16,17] clearly described how to establish the inversing model between the amplitude or carrier phase of SNR signal change affected by the surface around the GNSS receiver and environmental parameters (soil moisture and snow depth). After that, Larson et al. [18,19] further applied the SNR-based GNSS-R model and the raw SNR data outputted from the existing GPS network to retrieve SSH on the static or dynamic ocean surface. They also pointed out that the dynamic sea state has a negative effect on the accuracy of the SNR model for retrieving sea-level changes. To address this sea state bias (SSB) induced by waves, Roussel et al. [9] presented a SNR-based GNSS-IR altimetric methodology for monitoring the dynamic SSH change, which introduced a classical Least Square Method (LSM) adjustment to conjointly estimate the reflector height and its variation rate. On the basis of the dynamic SNR method, Wang et al. [20] verified the performance of the improved quad-constellation GNSS-IR approach using both sliding windows and robust strategy at a Multi-GNSS EXperiment (MGEX) site and the solution showed better accuracy for tidal height measurements. In general, these SNR-based sea surface altimetry approaches rely on spectral methods, such as the conventional Lomb–Scargle periodogram (LSP) algorithm [21,22]. However, because the effects of temporal reflector height variations should be taken into consideration during a measurement time span, Strandberg et al. [23] proposed an SNR-based inverse modeling using a B-spline smooth function, and it showed an increase in the accuracy of sea surface height. Later, the Kalman filters were introduced to optimize the inverse modeling for near-real-time SSH retrievals [24].
Recently, except for the studies on the SNR models, multipath effects on both pseudorange and carrier-phase observations obtained from a single-antenna GNSS receiver have also been successfully applied for height information measurements such as sea-level change and snow depth [15,25]. These solving algorithms based on the new observations can be categorized into two methods, including the single-frequency and multi-frequency signals. The first method is a combination of single-frequency pseudorange and carrier-phase observations. It is mentioned that the combined single-frequency method and the SNR method can be adopted for any GNSS receivers. Li et al. [26] found a relationship between reflector height and peak frequency of the multiple effects extracted from the combined single-frequency GNSS observations and evaluated the performance of this method for snow-depth estimations. Zhang et al. [27] extended the application to the rough sea-level retrieval for the first time, and the proposed second-order dynamic model improved sea-level retrieval accuracy by introducing the factor of the vertical acceleration. The second method is a combination of multi-frequency GNSS measurements, and it uses multiple error signals of two or more frequencies. A geometry-free linear combination (L4) of the GNSS dual-frequency (DF) carrier phase at low elevation angles is initially used to estimate sea-level changes [28], with results that are similar to those derived from the corresponding SNR arcs. However, compared with the single-frequency GNSS-IR method, the number and quality of such combined GNSS measurements with different oscillation components will decrease. So far, the temporal resolution of SSH estimations derived from the existing GNSS-IR methods could reach approximately hour-level measurement, and the estimations at low elevation angles cannot cover the whole observation period because of the uneven distribution. Thus, these techniques are not able to meet the accurate application of hydrologic monitoring. Thus, it is important to develop a simple approach to further improve the temporal and spatial resolution.
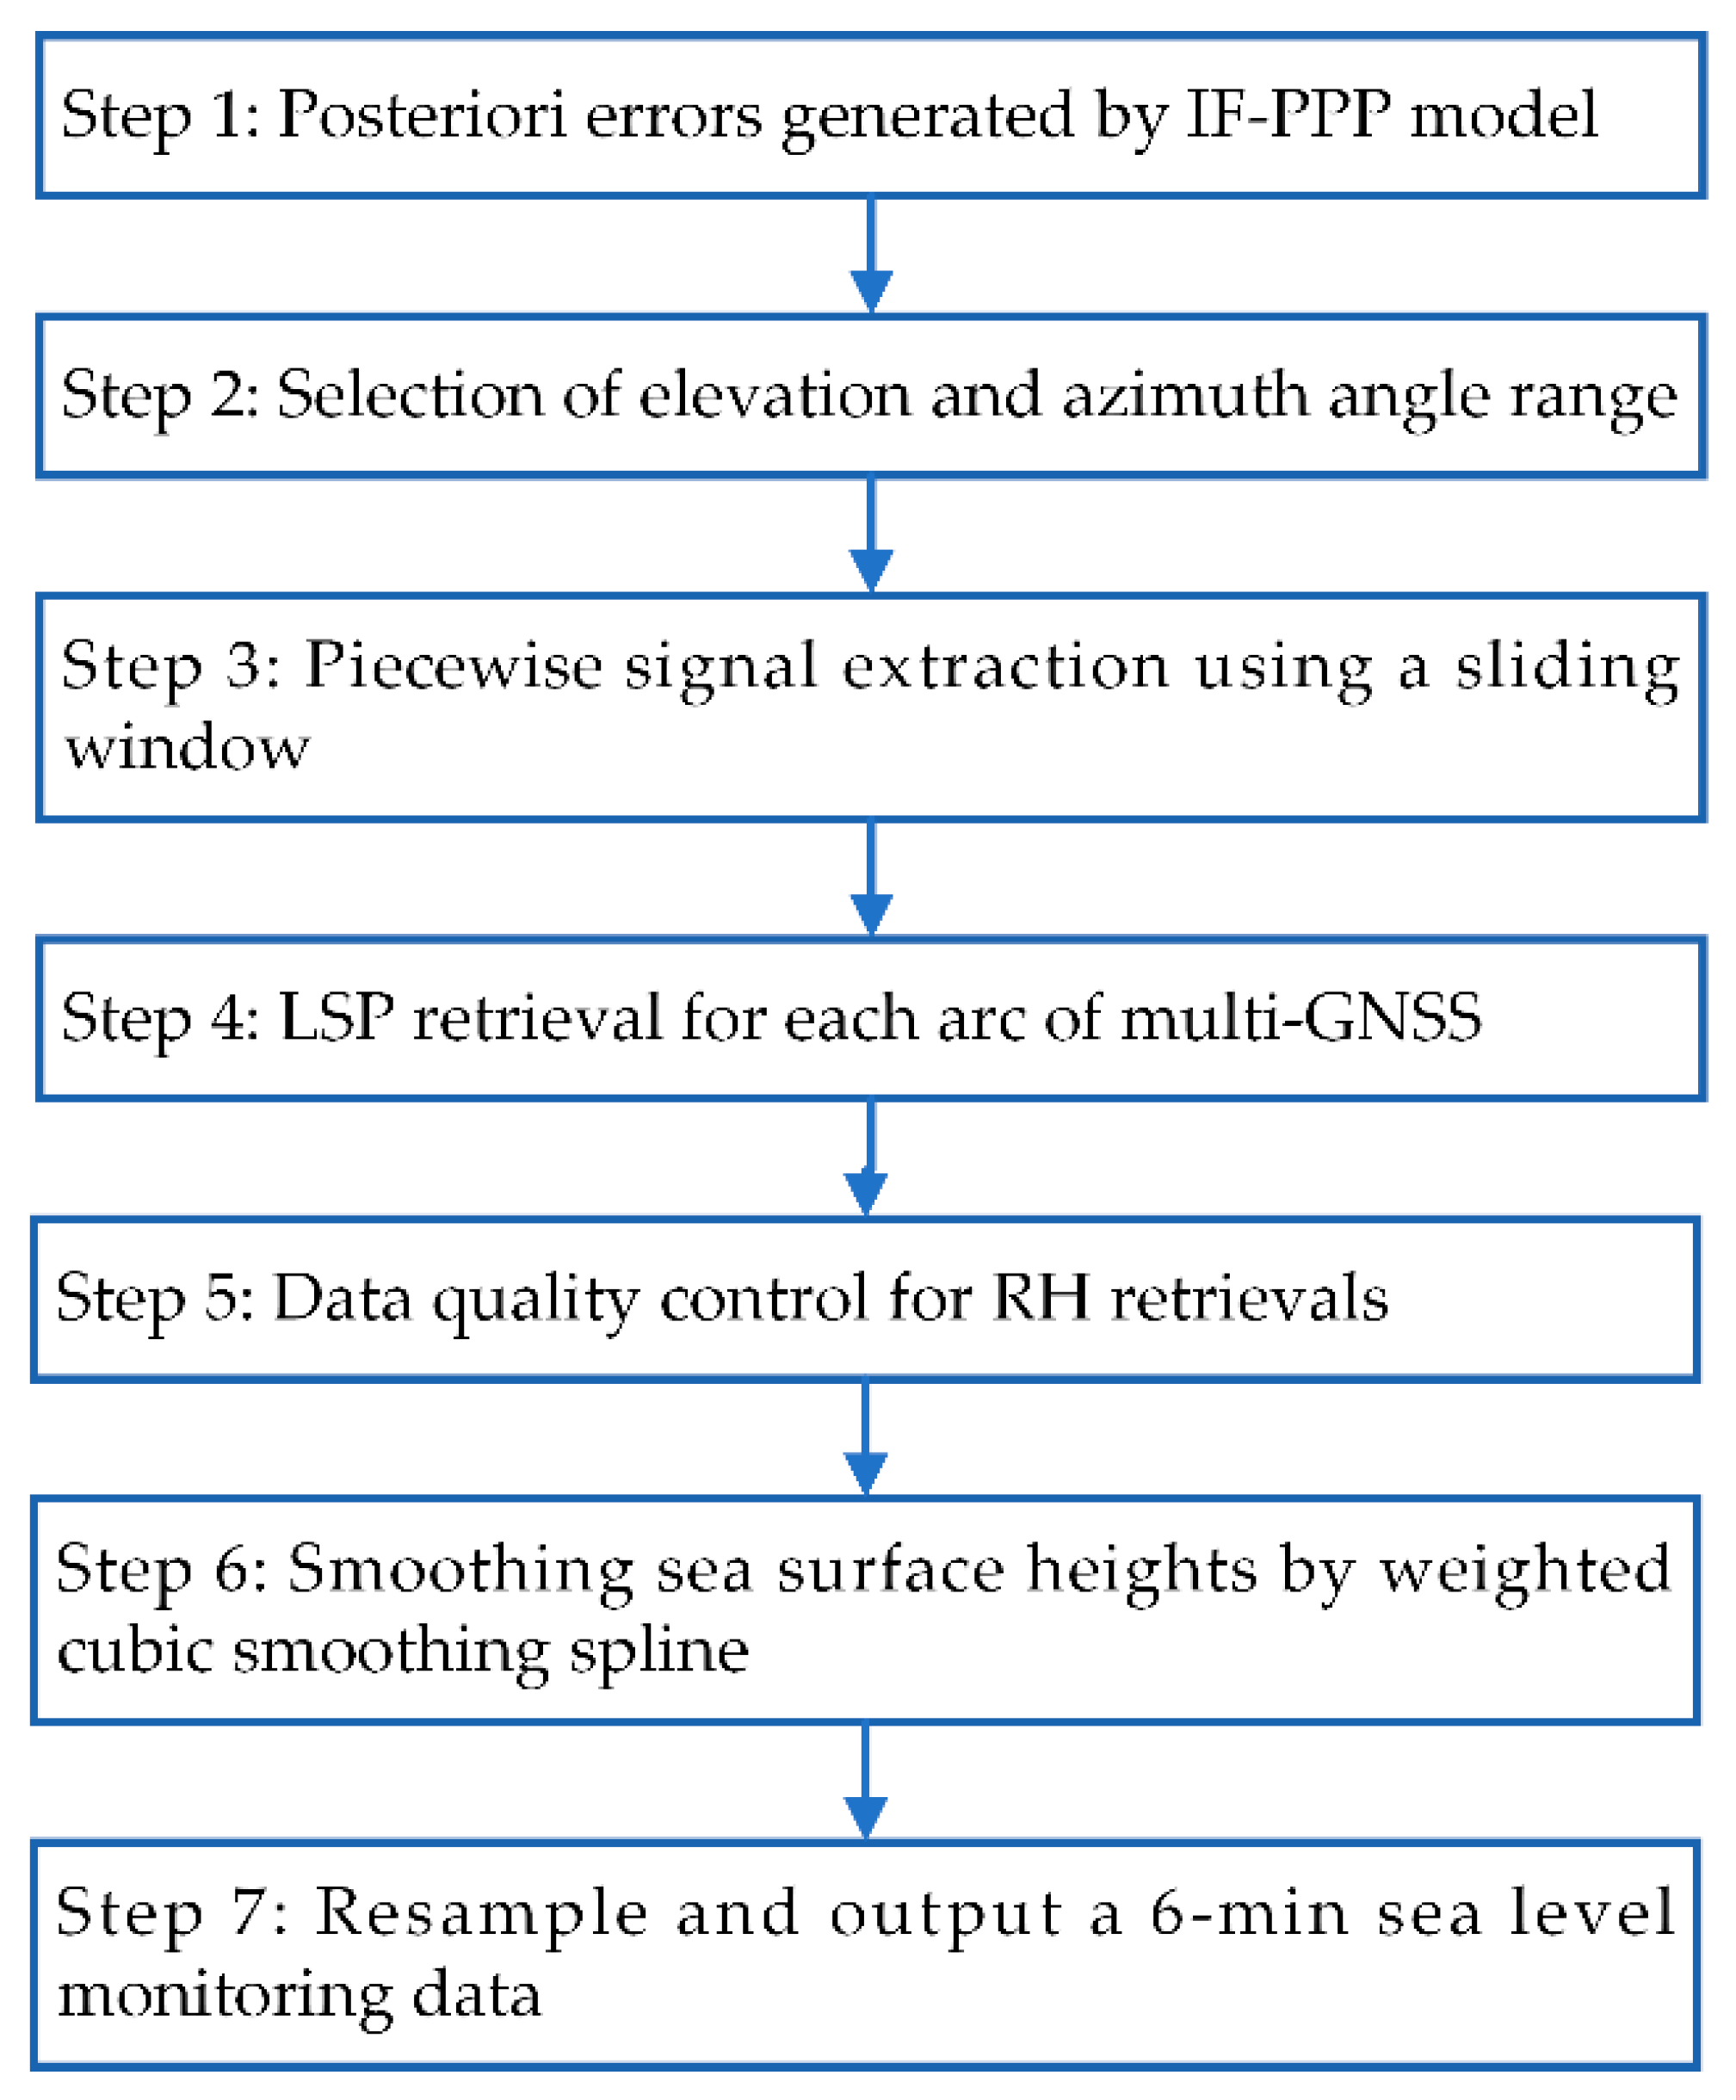
In this paper, we propose a novel ground-based GNSS-IR approach using the posterior errors (PE) of DF carrier-phase signals obtained from ionosphere-free precise point positioning (IF-PPP) [29,30] to retrieve the sea surface height time series at a 6 min interval. The main purpose is not to improve accuracy, but to prove the possibility of high-temporal SSH estimation using the GNSS PEs. The data processing of the GNSS PPP technique has corrected several errors of the carrier-phase measurements, and the remaining PEs contain multiple errors and noise signals, which are difficult to model or estimate. Therefore, the outliers of the SSHs retrieved from the PEs are possibly removed by utilizing the spectral analysis of the LSP method as a data quality control. Herein, a time-sliding window method [31] is used to divide each PE arc with low elevation into several signal intervals, and each signal interval can retrieve the corresponding reflector height (RH). After processing the data quality control, we employ a weighted cubic spline function to smooth the daily RH time series. Finally, resampling the smoothing RH series at the a 6-min interval is essential for SSH retrievals.

2. Materials and Methods

2.1. Site Description and Experimental Dataset

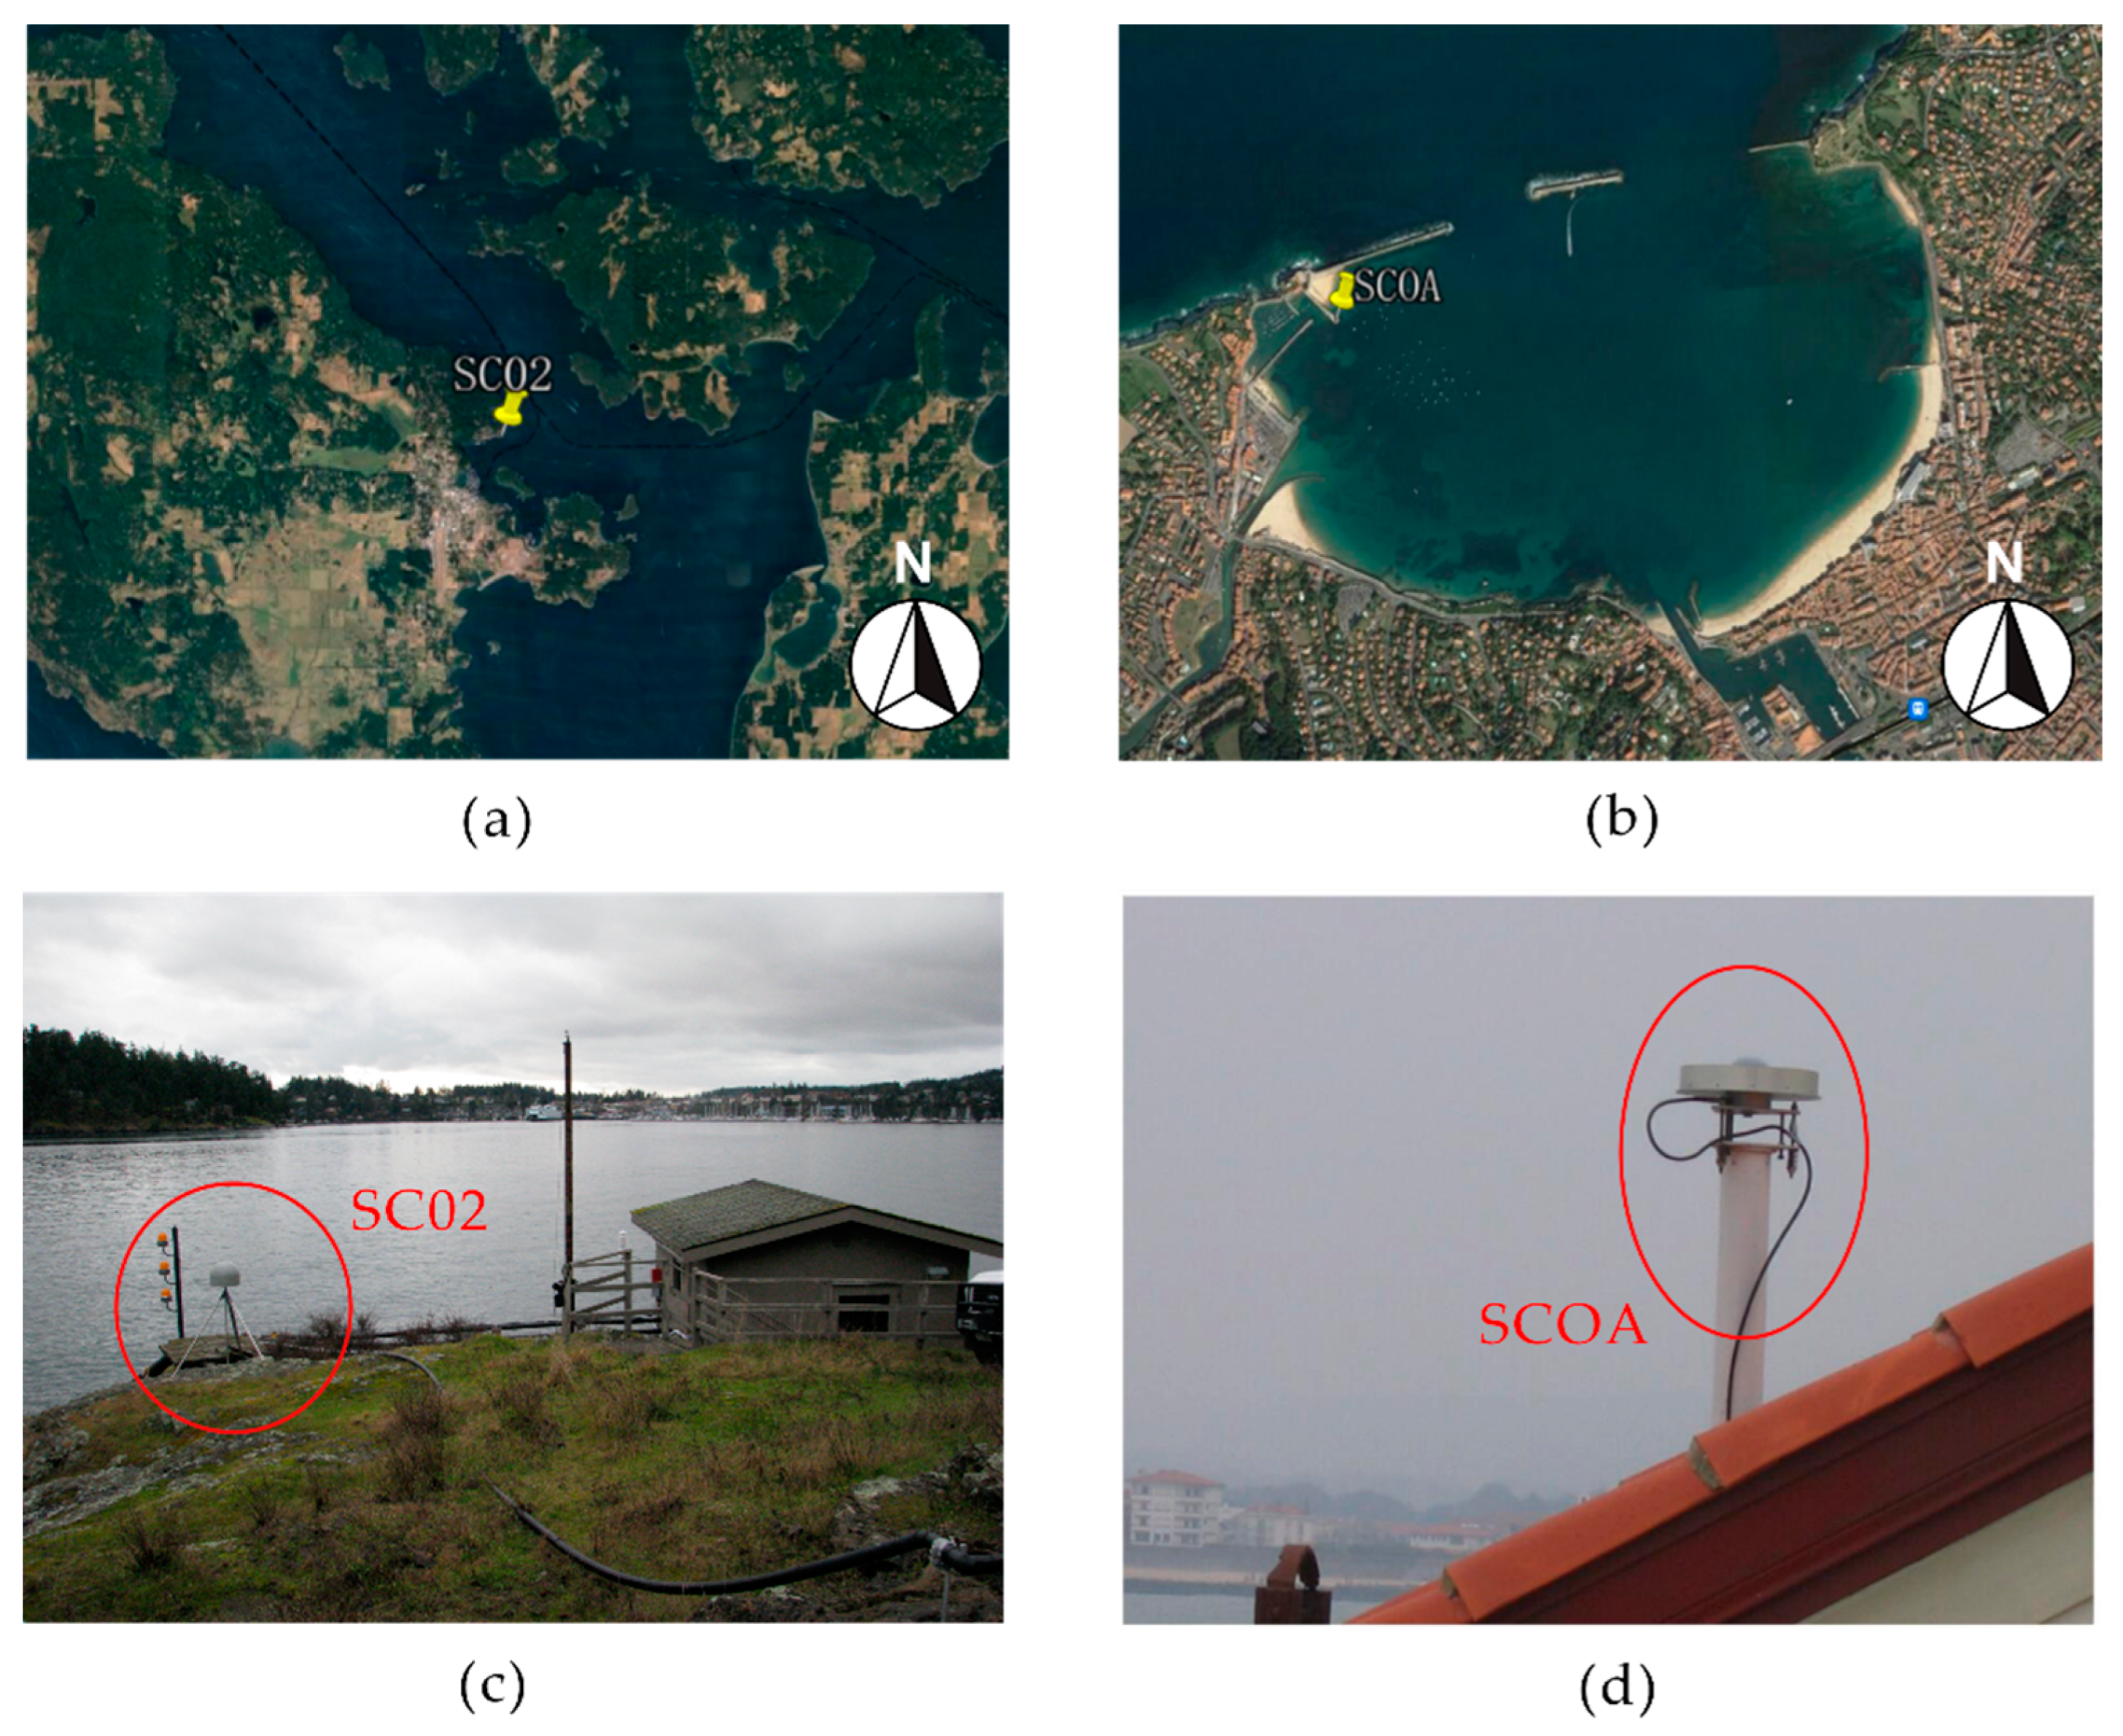
Sea-surface-height sensing utilizes the PEs of GNSS DF carrier-phase observations from the geodetic networks. We have selected two GNSS stations as the experimental examples to obtain the PE data (Figure 1), and these measurements from both stations have been analyzed in some previous studies [27,32]. The tidal reference values measured by tide gauges around the selected GNSS stations are applied to assess the performance of the proposed method. In addition, some details about sites and datasets are described in the following part.

2.1.1. Site-Specific Summary

The PBO station SC02 (Figure 2c) was specifically installed in 2001 for geophysics research, and it is located in Friday Harbor (48.5462°N, 123.0076°W, −15.049 m), 130 km northwest of Seattle, Washington (US). The mean vertical height difference between the phase center of the antenna and sea surface is approximately 6.0 m [27], with the largest tidal fluctuations of ~4 m. As shown in Figure 2a, SC02 was built within the gulf, surrounded by several islands, which is rarely subject to extreme weather. The triangular steel installation consists of a Trimble TRM29659.00 choke-ring antenna with a hemispherical radome, which is connected to a Trimble NETRS GPS receiver that records GNSS observation with a 15 s sampling interval. The co-located tide gauge (the horizontal distance of about 350 m) at Friday Harbor is operated by the U.S. National Oceanic and Atmospheric Administration (NOAA, available at https://tidesandcurrents.noaa.gov/stations.html?type=Water+Levels (accessed on 18 August 2022)) [34]. The Friday Harbor tide gauge (SCOTG) is equipped with a standard acoustic aquatrak gauge; its sampling interval was 6 min.
Station SCOA (43.3952°N, 1.6817°W, 59.486 m; Figure 2b), located in the east of the Biscay Bay of Saint Jean-De-Luz, along the French Atlantic coast of France, is managed by RGP (Réseau GNSS Permanent—http://rgp.ign.fr/ (accessed on 18 August 2022)) from the IGN [35]. The mean vertical height is approximately 11.0 m, with a tidal range of about 5 m in spring. In Figure 2d, the steel installation of SCOA is placed against the wall of the building and comprises a Trimble TRM55971.00 antenna without a radome, which is connected to a LEICA GR25 receiver that records data with a 30 s sampling period. Recently, it has been upgraded with the multi-GNSS receiver capable of obtaining carrier signals from triple-constellation satellites. The co-located tide gauge, Socoa, is operated by the Permanent Service for Mean Sea Level (PSMSL) of the Service Hydrographique et Océanographique de la Marine (France, available at http://www.ioc-sealevelmonitoring.org/station.php?code=scoa2#mess (accessed on 18 August 2022)), 2 m apart horizontally from the GNSS station. The Socoa station is equipped with radar; its sampling interval was 1 min.
Figure 2. Photographs of the two GNSS reference station SC02 and SCOA: (a,b) the aerial view [36]; (c,d) the surrounding environment. These images are obtained from https://www.unavco.org/instrumentation/networks/status/nota/overview/SC02 (accessed on 18 August 2022) and https://www.sonel.org/ (accessed on 18 August 2022), respectively.
Remotesensing 14 05599 g002

2.1.2. Characteristics of Signal

For the two experimental sites in this study, we have chosen multi-GNSS data, including carrier-phase and SNR, on DOYs 350–365, 2021 and DOYs 1–31, 2022. At the end of January 2022, some raw GNSS observations for site SCOA were missing. A combination of DF L-band carrier signals extracted from multi-constellation satellites corresponded to different PE arcs. Both SC02 and SCOA recorded the phase and SNR data of L1 and L2 from GPS, of R1 and R2 from GLONASS, and of E1 and E5a from Galileo. As the corresponding type of signal from BeiDou satellites is only single-frequency observations and has a lower number of measurements at a low elevation angle for the experimental site, the SSH estimations based on BeiDou cannot be studied in this work. The detailed parameters of both phase and SNR types obtained from two GNSS stations are shown in Table 1.

2.1.3. Selection of Azimuth and Elevation

For a data processing method for RH estimation above the sea surface, it is essential to preliminarily select the available masks of the azimuth/elevation angle. As shown in Figure 3, we used an open-source GNSS-IR Web App developed by Larson et al. [36,37] to plot the first Fresnel zone (FFZ) for two GNSS sites at the elevation angles of 5° to 15°, and these FFZs are projected onto a Google Earth image.
Figure 3 shows the local environment around the GNSS receiver and the coverage area of the FFZ with different elevation angles for each site. It can be clearly seen that the surrounding regions for the two GNSS sites comprise open water and land, and thus the border between both reflection layers can determine the range of the azimuth angle. Wang et al. [38] proposed a grid map method using the power spectral density (PSD) of RH values with different azimuths to explore the azimuth range for site SC02. The result showed that the azimuth angles of 50°–240° can be refined as the available range. Similarly, we used this grid map method to examine the coverage areas for the site SCOA, and its azimuth range is approximately 30° to 230°. In addition, through the analysis of Larson et al. [19], the available masks of SSH retrievals for both sites are generally in the elevation angle range of 5°–20°.

2.2. Basic Principle of GNSS-IR-Based Sea Surface Altimetry

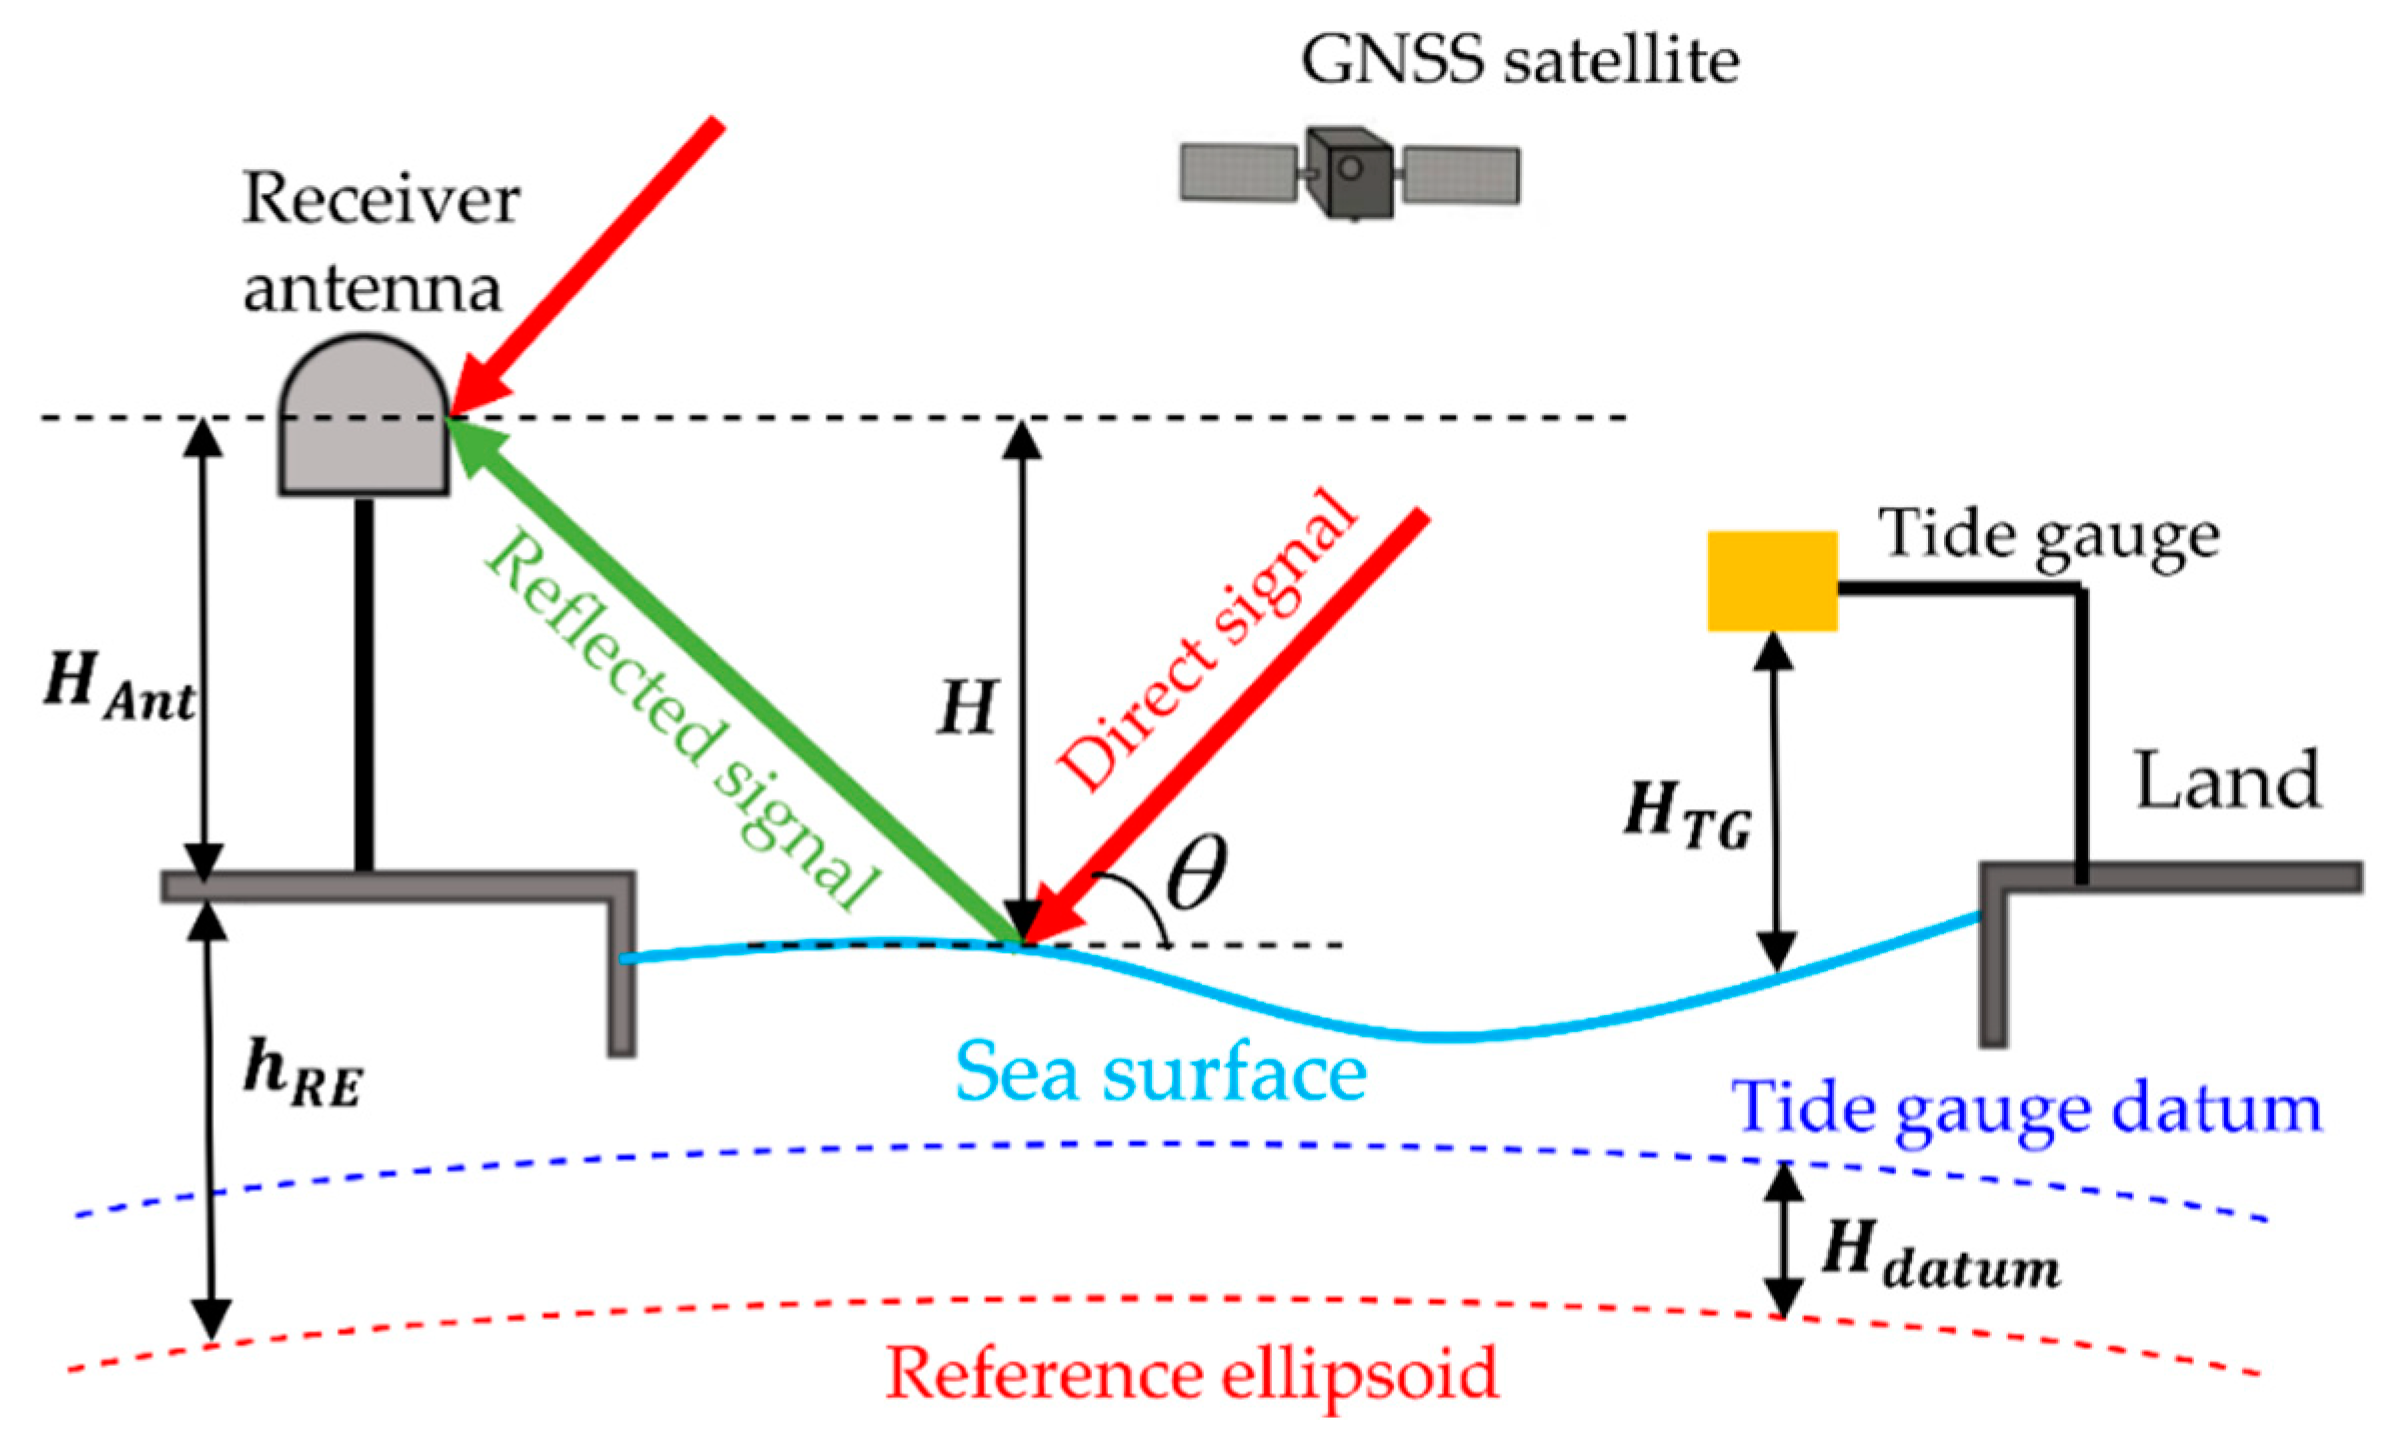
The traditional ground-based GNSS-IR sea surface height retrieval model was proposed by Larson et al. [18,39]. Here, while the major component of the complex GNSS signal is directly obtained by a geodetic antenna, its minor component also comes into the antenna after at least one reflection above sea level (Figure 4). Thus, there is a path delay between the direct component and reflected component because of the time difference. The relative phase angle ϕ related to the additional path can be expressed as follows:
ϕ = 4 π H · sin θ λ
where λ is the wavelength of the GNSS single-frequency signal. Then, there is a linear relationship in the variation rate between the relative phase offset ϕ and sine of the elevation angle θ , equal to [18]:
d ϕ d sin θ = 4 π H λ = 2 π f ϕ
where f ϕ is the frequency caused by the multipath oscillation. In general, the frequency f ϕ can be calculated by using an LSP method. We thus obtain the reflector height:
H = λ f ϕ 2
Because the RH values measured by the GNSS-IR technique show the relative variations in sea level for one period, they should be converted into the absolute sea level in a reference frame based on the tide gauge datum. Moreover, the height within a reference ellipsoid can be obtained from the GNSS PPP technique. Through the analysis of Figure 4, the Equation of the absolute sea level is given by
H s e a = H A n t + h R E + H D a t u m H
It may be mentioned here that the value of H A n t + h R E + H D a t u m is a constant. Finally, to test the possibility of the proposed method on SSH estimation, we can compare the SSH estimation H s e a with the measured tidal dataset H T G .
For the data processing of GNSS positioning, apart from the SNR observation which is mainly applied to assess signal quality, the measurement function of the carrier-phase data L (in units of meter) for GNSS DF signal can be modeled as [26]:
L 1 = ρ + c t r t s I 1 + T + M 1 + λ 1 N 1 + ε 1 L 2 = ρ + c t r t s I 2 + T + M 2 + λ 2 N 2 + ε 2
where ρ is the geometrical distance between the GNSS satellite and antenna center; c is the speed of light; t r and t s are the clock bias of the receiver and satellite, respectively; I and T denote the ionospheric error and tropospheric delay, respectively; N stands for an integer ambiguity; ε represents the complex random noise signal; M is the multiple effect extracted from the carrier-phase observation. To obtain the multiple effect of GNSS PE arcs, we used an IF combination method to remove ionospheric delay. We thus obtain:
L I F = α L 1 β L 2
α = f 1 2 f 1 2 f 2 2 β = f 2 2 f 1 2 f 2 2
where f 1 and f 2 denote the GNSS dual frequencies. Therefore, a combination of Equations (5)–(7) can be simplified into the following formula:
L I F = ρ + c t r t s + α λ 1 N 1 β λ 2 N 2 + T + α M 1 β M 2 + α ε 1 β ε 2
Equation (8) shows that the combination of dual-frequency carrier-phase observations is ionosphere-free. The IF-PPP method is one of the popular GNSS point precise positioning methods. Accurate modeling of orbit error, satellite clock error, ionospheric error, tropospheric error, and various signal delay deviations is of great significance in PPP processing. For the IF-PPP method, the details of the data-processing strategy for these parameters in Equation (8) are given in Table 2.
After carrying out data processing of the IF-PPP model, all parameters except for M and ε in Equation (8) can be isolated [30]. In fact, the PE data of GNSS carrier-phase observations is one of the by-products calculated from the IF-PPP method. Here, the multiple errors of GNSS PE arcs are as follows:
M = λ 2 π tan 1 μ · sin ϕ 1 + μ · cos ϕ
where μ denotes amplitude factor, which can thus be approximated equal to A r / A d . Assuming tan 1 x = x and μ 1 , Formula (9) can be simplified as [26]
M = λ 2 π · μ · sin 4 π H · sin θ λ
Since the multiple errors M derived from GNSS PEs are far larger than those of the random noise α ε 1 β ε 2 , the noise component can be ignored [40]. Then, taking sin θ as an independent variable x and f = 2 H λ , the PE arc can then be written as:
L ˜ I F α M 1 β M 2 = α λ 1 β λ 2 2 π · μ · sin 2 π · f · x
The existing GNSS-IR method using carrier-phase observations is a linear combination of dual-frequency carrier-phase measurements, called the L4 method. The L4 method directly removed the geometric distance, clock errors, and tropospheric delays. Then, a high-degree polynomial fit method can be used to remove the ionospheric delays, integer ambiguity, and random noise. Compared with the L4 method, the PE method can correctly estimate these individual parameters and remove the corresponding errors.
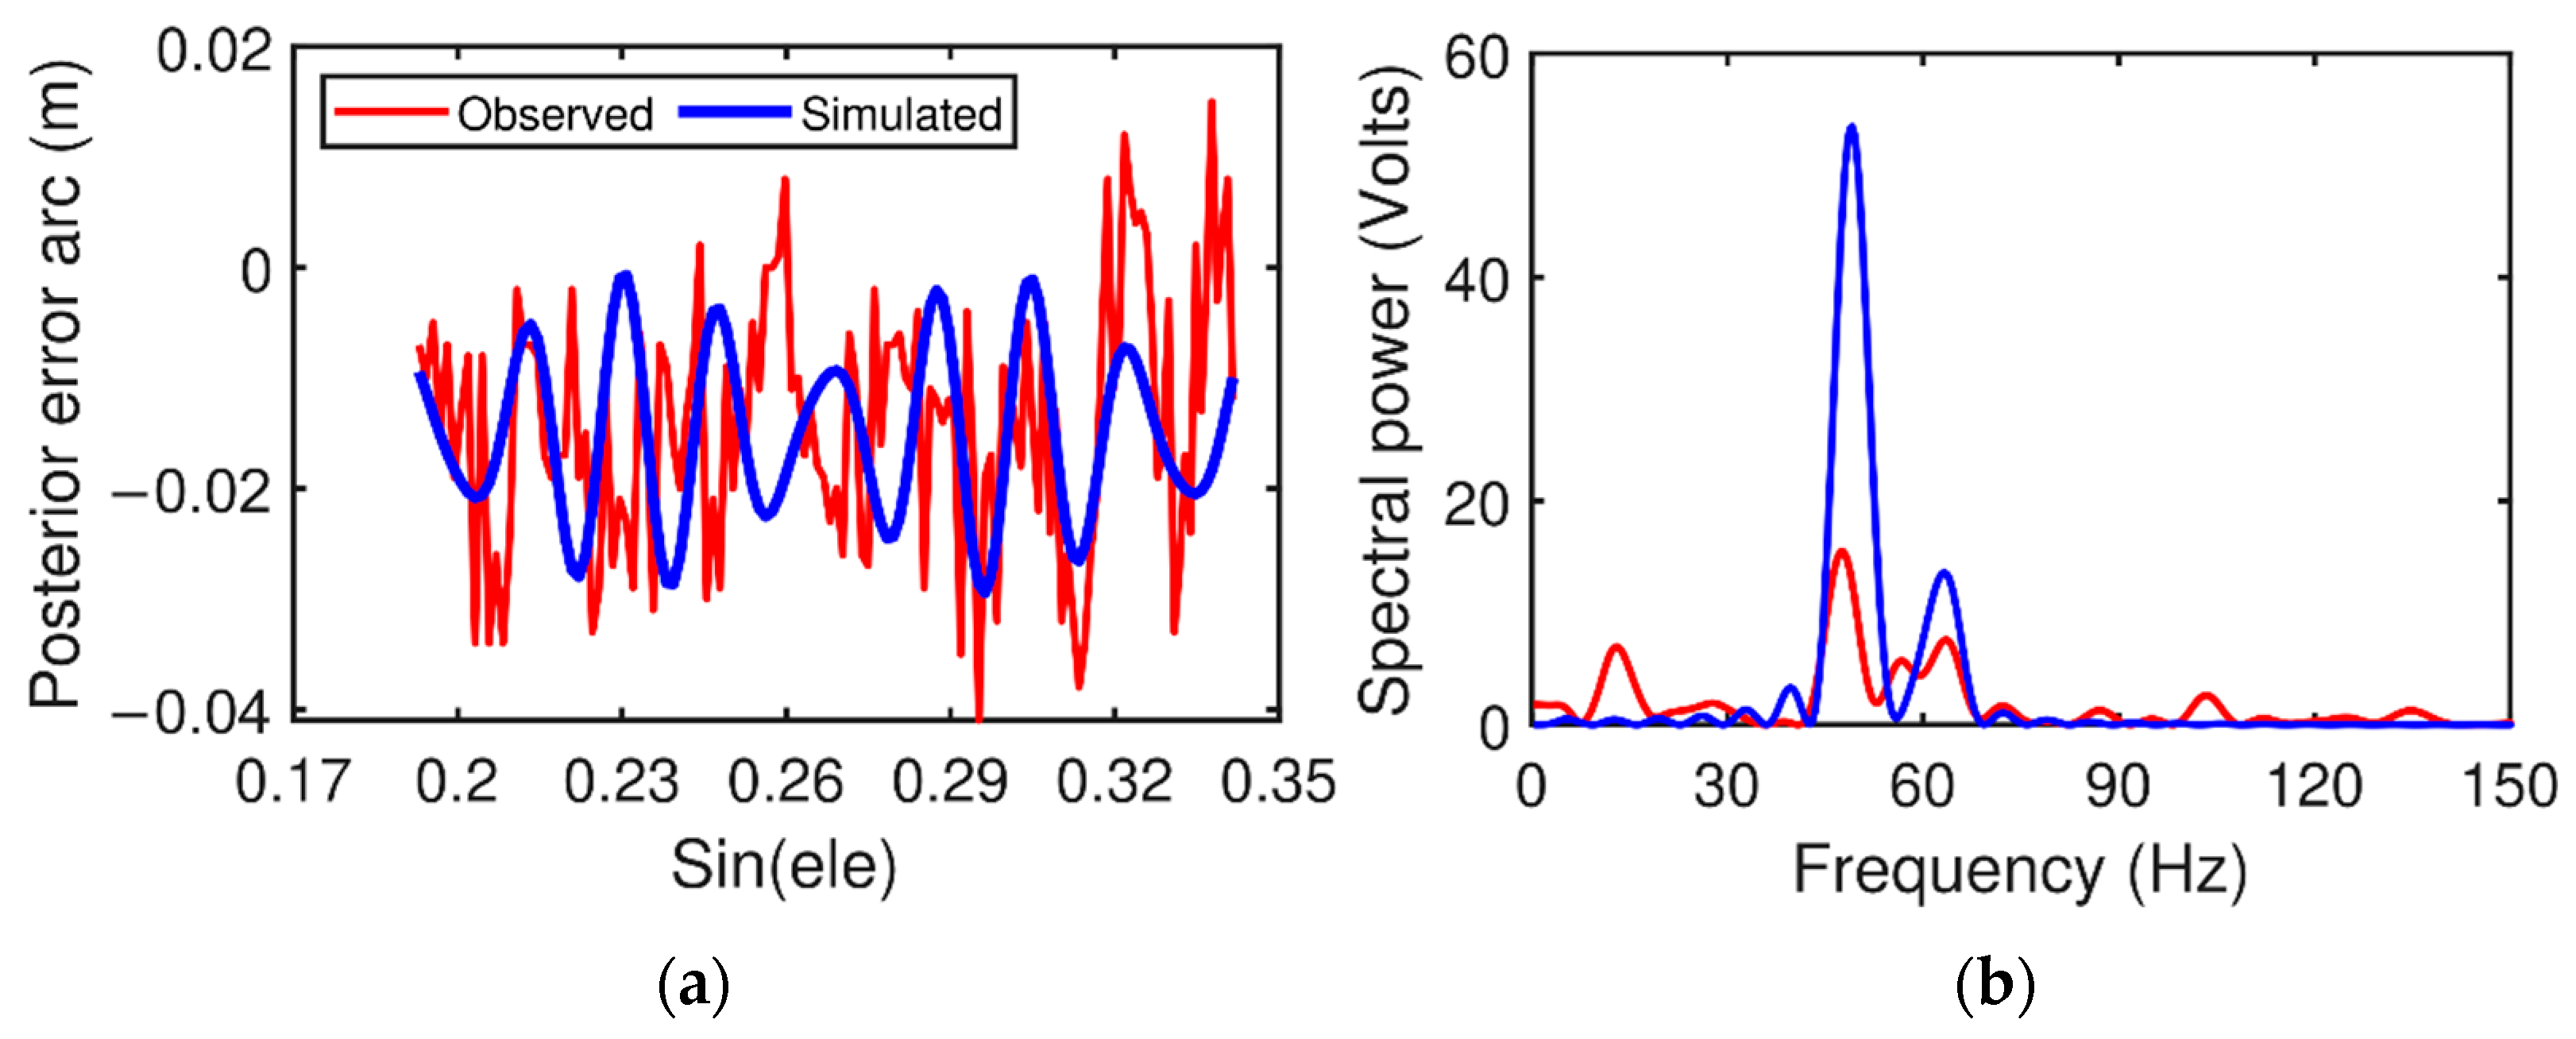
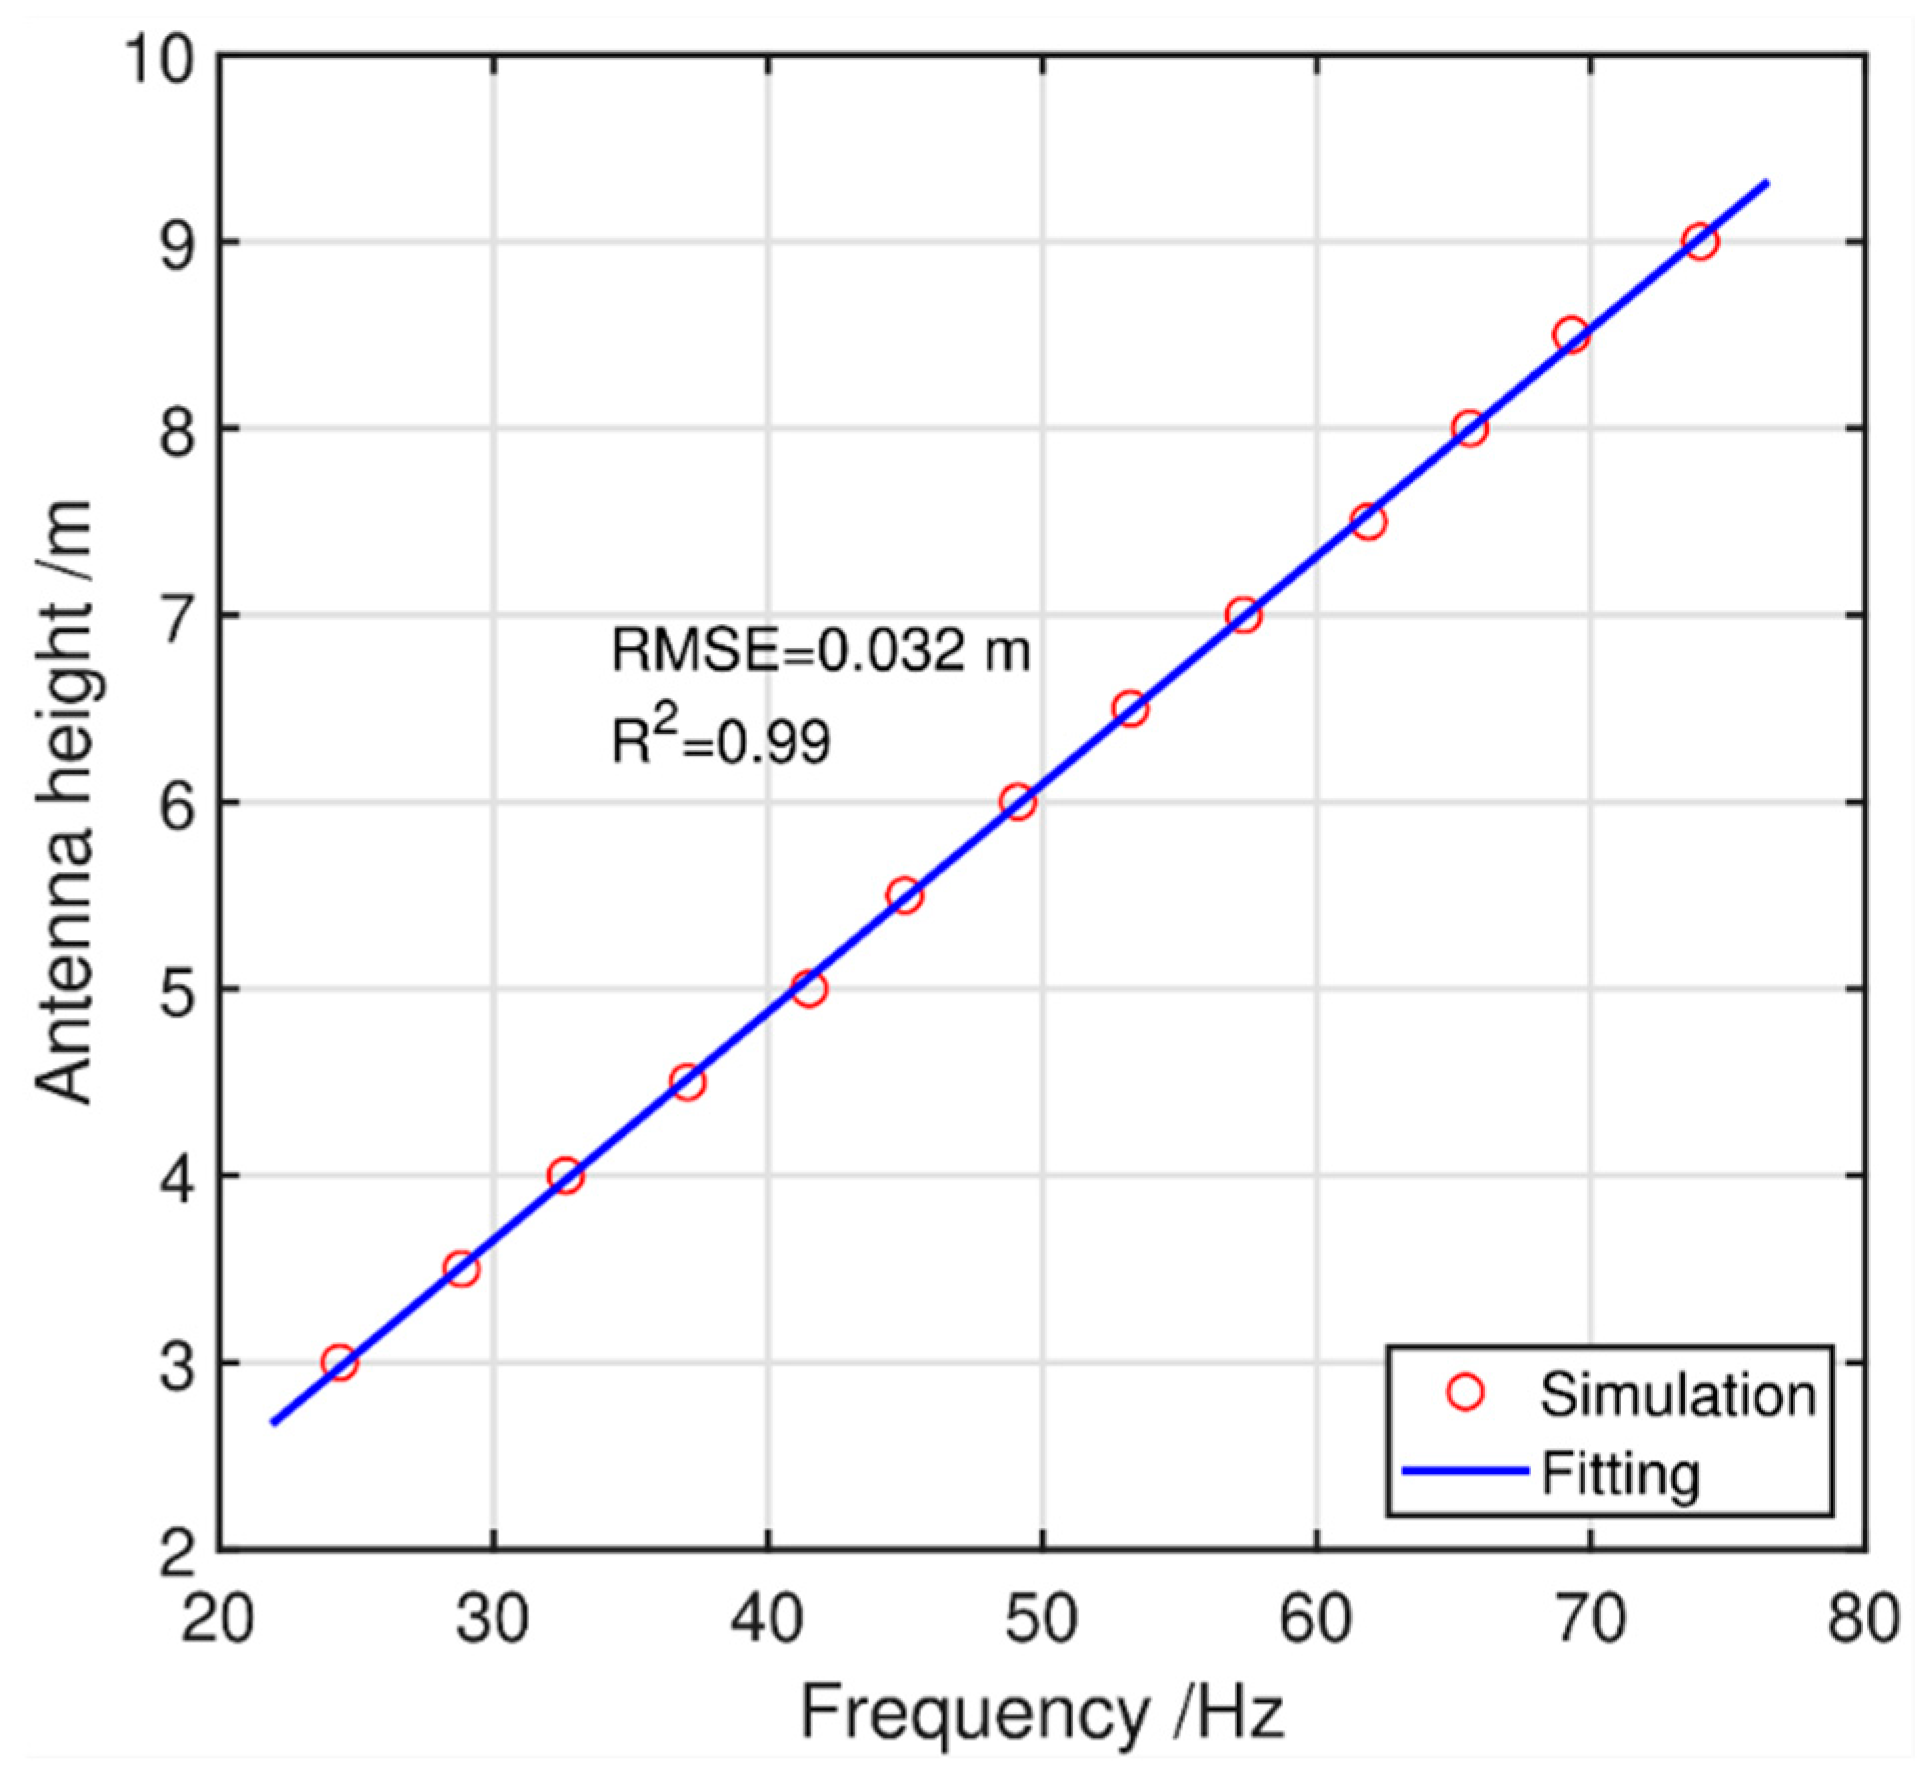
According to Equation (11), L ˜ I F is approximately a sinusoidal function with the independent variable x and frequency f (Figure 5a). Similar to the SNR model, we thus directly used the LSP method to analyze Equation (11). As shown in Figure 5b, there are two obvious peaks for the LSP results derived from the observed and simulated arcs. Previous work [26] indicated that the higher peak is related to the reflector height, and a linear function between GNSS antenna height and the frequency is described as
H = a · f + b
where a and b are the linear fitted coefficients. The linear model between the antenna height and frequency related to the higher peak derived from the simulated observations is presented in Figure 6. Table 3 showed the specific fitting coefficients for different satellite constellations. The parameter of a is approximately equal to half of the higher wavelength for the GNSS DF signal. After estimating the RH for each arc, Equation (4) can convert the RHs into the absolute SSH.

2.3. Strategy of Data Processing

2.3.1. Signal Extraction Based on a Sliding Window

For the classical LSP method, each track for a single satellite can only obtain one retrieval. The spatial and temporal resolution of an existing tide gauge is far better than that of the shore-based GNSS-IR technique based on a single satellite track. Since the temporal resolution of SSH retrieved by the GNSS-IR method is related to the number of the rising or setting satellite tracks, it is difficult to achieve the purpose of high-frequency sea-level monitoring when the observing status of a GNSS satellite is poor. Larson et al. [19] used the LSP method to estimate the frequency values of the SNR arcs adjusted by a data length window, and the results indicate that the LSP method based on the length window is an improved approach with similar accuracy and higher estimation points. In addition, the frequency value for a longer observation arc derived from a dynamic ocean is not fixed during a satellite pass [23].
Generally, the available data length captured by the elevation and azimuth ranges is approximately within the range of 20 to 40 min. To obtain more observation arcs, we applied a 15 min time window length with 5 min overlap of the time length to cut off a PE arc in sequence; each segmented arc can retrieve the corresponding RH value by using the LSP method. Because the PE arc is generated from the GNSS data processing, its multiple effects can be affected by the unmodeled random noise. Therefore, a significant quality control method is essential for all RH estimations, which can guarantee the accuracy of these estimations.

2.3.2. Data Quality Control for RH Retrievals

Similar to the study of Larson et al. [19], we limited all RH retrievals to the available range due to this RH range being related to sea surface height. Three steps are used for the combined retrievals derived from multi-GNSS measurements in our study: firstly, the spectral amplitude calculated by the LSP method is a key element. When the ratio of the amplitude peak value to the average amplitude values is above 3, the corresponding RHs are considered significant. As shown in Figure 7, some gross errors should be removed from these remaining RHs. Thus, the second step is a rejection of the gross errors based on the RH results. Specifically, we can divide the daily tidal height dataset into two tidal intervals, i.e., higher tide and lower tide. Then, we calculate the mean μ and standard deviation σ of these RHs for each tidal interval, respectively, and those gross errors are rejected outside the confidence interval of μ 2 σ ,   μ + 2 σ . Furthermore, due to the precision of the sea level estimated by the observed arcs with a lower elevation angle being better than that of the observed arcs with higher elevation angle, the minimum value of the elevation angle range for each PE arc should be below 15°.

2.3.3. Smoothing Retrievals by Weighted Cubic Smoothing Spline

As discussed before, these data quality control steps can guarantee the precision of the combined sea-level retrievals derived from multi-GNSS PE arcs. However, the excessive retrievals within one observation period will cause a considerable redundancy. In principle, a piecewise modeling is a simple solution but results in discontinuities at the nodes. The studies of Hobiger et al. [41] and Strandberg et al. [23] demonstrated that a B-spline function can overcome such deficits but not show enough stability for the initial node or terminal node. To solve this problem, Pan et al. [42] noted that the tidal amplitudes obtained by using a cubic spline interpolation are highly smooth and reject some weak oscillations.
In order to achieve the stable and high-frequency sea-level estimations, we applied a weighted cubic smoothing spline function to improve the sampling rate. The specific methods are: firstly, we determine the combined SSH retrieval points at 1-day intervals, and the daily n points are defined as T D O Y = t 1 , t 2 , t 3 , , t n . Secondly, a weighted cubic smoothing spline function is used to fit the whole set of points for each interval T D O Y . Detailed information of a cubic smoothing spline can be found in Appendix B of Pan et al. [42]. Finally, we decided to resample the fitting curve of SSH retrievals in a 6 min interval.
The following flow chart shows the specific steps of the proposed GNSS-IR method for SSH estimation (Figure 8):

3. Results and Discussions

In Section 2.2 and Section 2.3, we introduce the theory of GNSS-IR method based on PE arcs and several data processing strategies. Because the two experimental GNSS stations can capture the DF carrier-phase observations, we retrieved the coastal high-temporal SSH time series by using the PE and SNR, respectively, and verified the possibility of sea surface height retrieval using the proposed method.

3.1. Experimental Results in Friday Harbor, USA

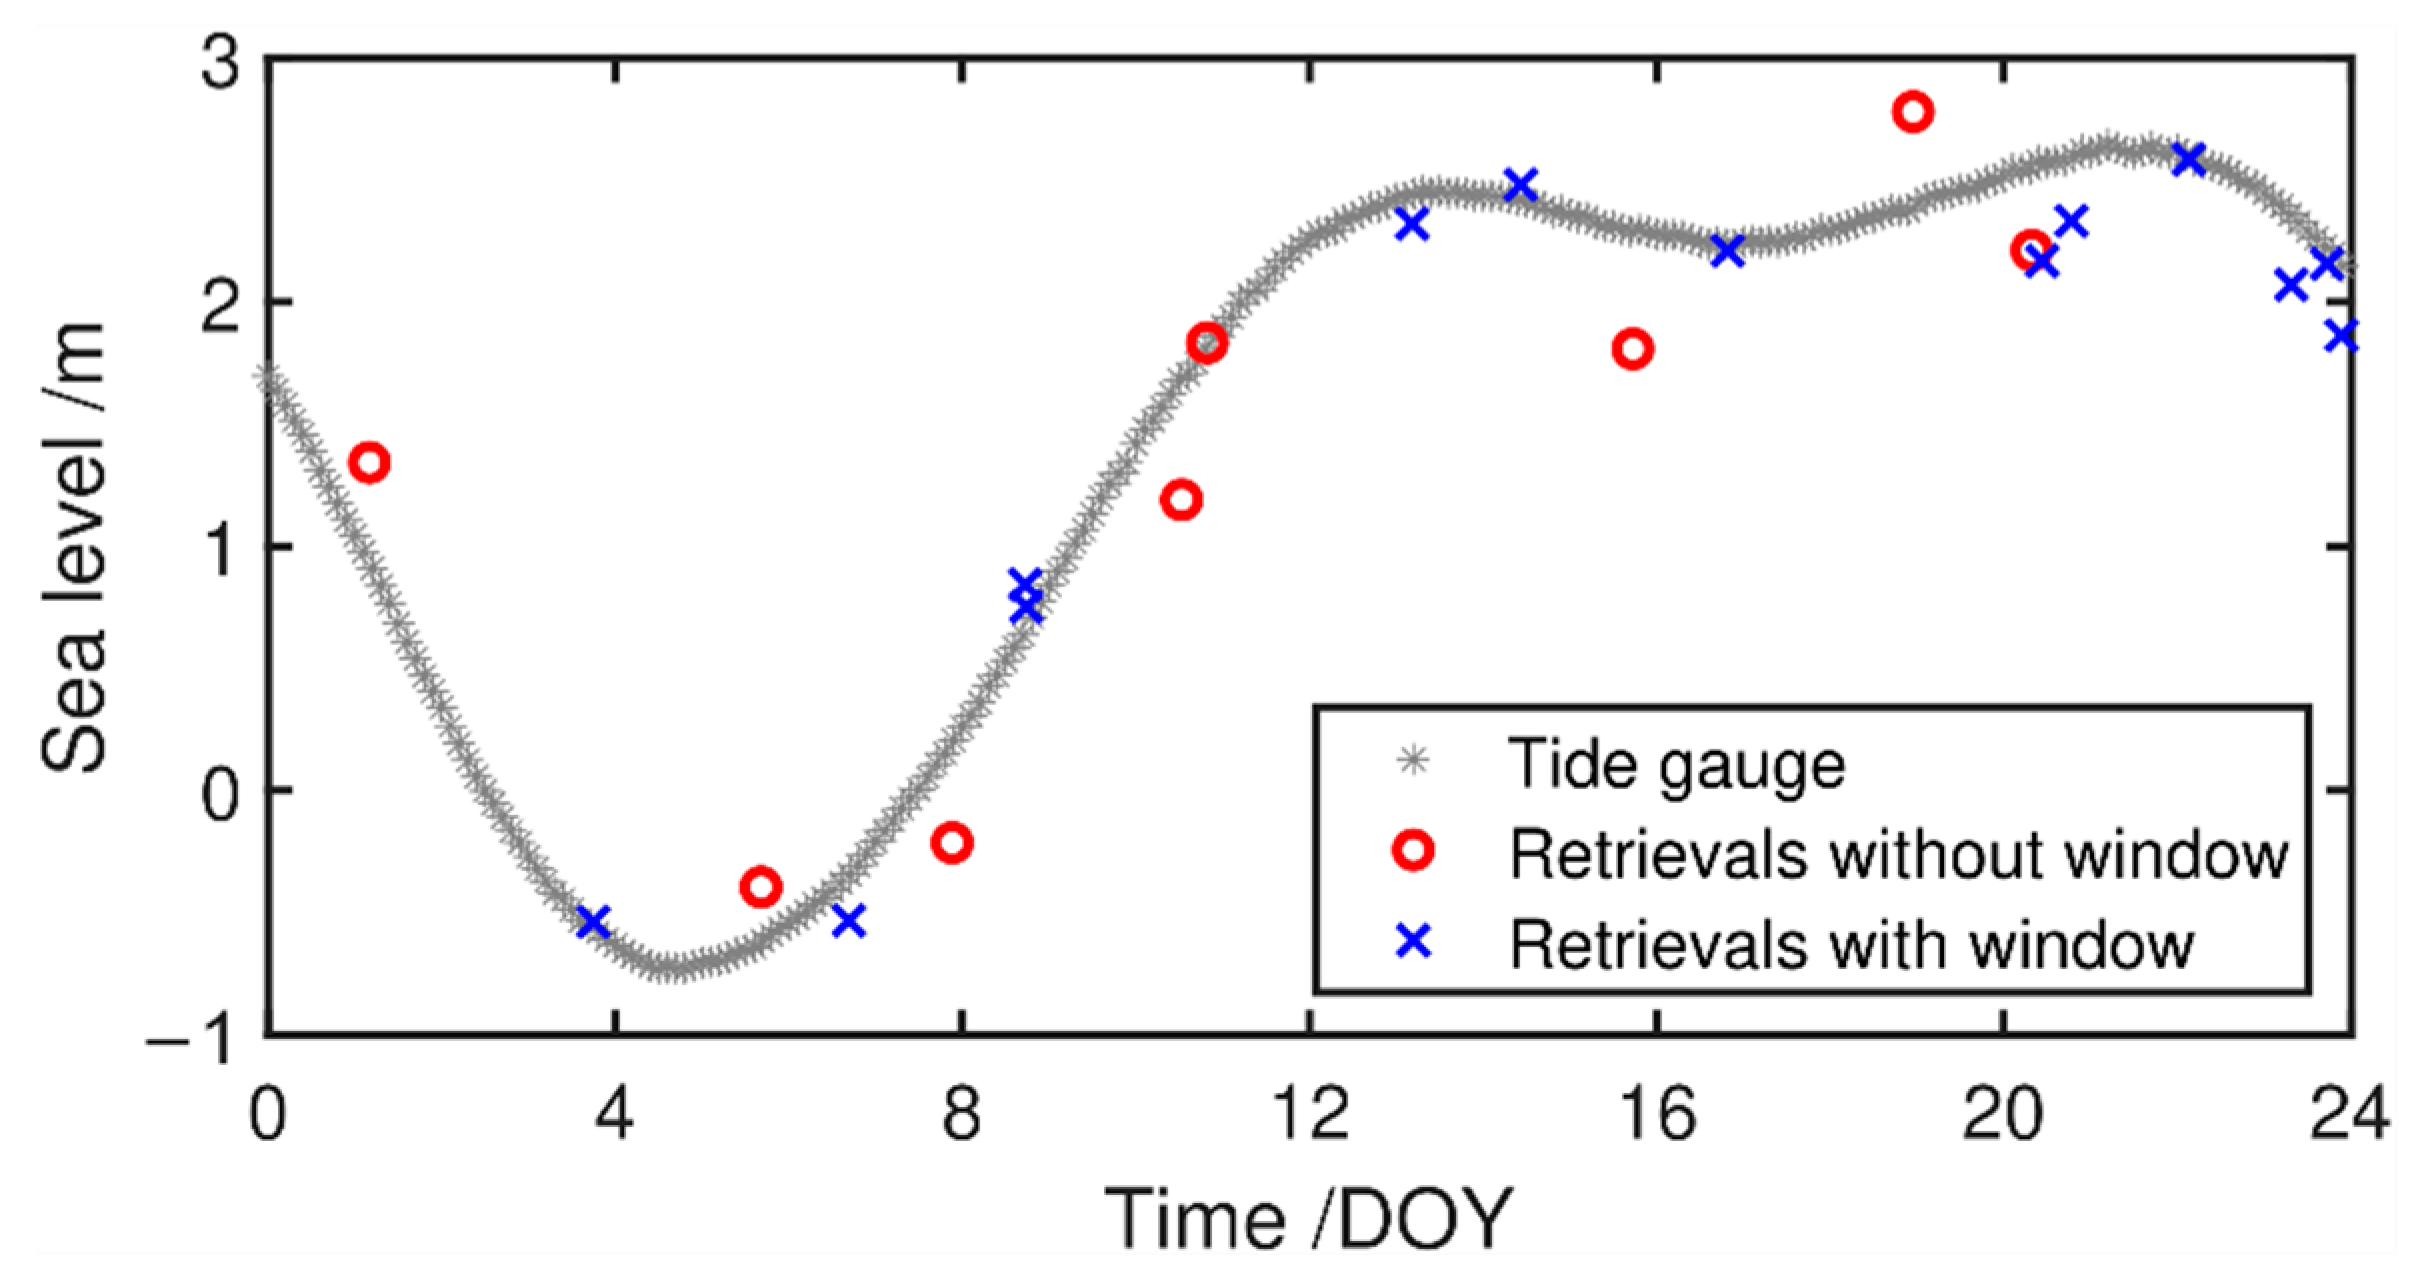
From mid-December 2021 to January 2022, a nearshore ground-based experiment was conducted in Friday Harbor, Washington, USA. When Wang et al. [38] studied the sea-level measurements for site SC02, they selected the available azimuth angle range between 50° and 240°. Based on their results, we also selected these same azimuth angle constraints in a PE arc of GNSS DF carrier-phase observations. There are dozens of arc measurements in 20–35 min for each satellite constellation. As shown in Figure 9, the specific number of the daily PE arcs without a sliding window at site SC02 is about 38 for GPS, about 20 for GLONASS, and about 25 for Galileo. Note that, each individual PE arc can only estimate an RH value at a certain time. Thus, we used a sliding time window to separate the arcs with low elevation angles, and the corresponding numbers for different constellations increased several times, especially for Galileo. After processing the LSP estimation for each fragmented arc and carrying out data quality control, the RH series for each constellation per day can be obtained. Figure 10 shows the absolute SSH variation time series related to RH retrievals for GPS tracks recorded by site SC02 on DOY 001, 2022.
In Figure 10, good agreement can be seen between the SSH estimations and in situ measurements from the tide gauge. The number of raw observation arcs for GPS PE arcs is 8, and this increased to around 20 after using a sliding window. The RMSE values of retrievals derived from both methods are 25.7 and 18.7 cm, respectively. In addition, it can be seen that more retrievals covered more variations in sea level. These results indicate that the spatial and temporal resolution of SSH retrievals can be significantly improved with increasing GNSS observations.
An initial study by Wang et al. [20] found that a longer wavelength corresponds to an SNR type with better quality, e.g., GPS S2X, GLONASS S2C, and Galileo S5X, and it shows a better accuracy of retrieval for these signals. Thus, to preliminarily test the relationship on the sea-level retrievals for different constellations between the PE and SNR methods, we also applied the same type of SNR signal to estimate SSH time series at site SC02. Figure 11 shows that the sea surface heights derived from the PE and SNR methods correspond well to the measured SSH variations, all of which convincingly recreated the overall trend of the in situ tide gauge. In Figure 12, there is a simple linear relationship between in situ measurements and retrievals for GNSS PE arcs, and Van de Casteele diagrams show the residuals between the retrievals and the corresponding in situ measurements. In addition, the average number of SSH retrieval points per day, RMSE, and linear correlation coefficient (R2) for each GNSS-IR estimation method are presented in Table 4.
Figure 11 indicates a generally excellent performance of GNSS-IR SSH retrievals for different constellations recorded from site SC02, compared to the corresponding tide gauge. Additionally, the combined retrievals for both PE and SNR methods can further improve the temporal resolution. Notice that most of clusters for the PE-based GNSS-IR SSH retrievals are concentrated on larger and lower tidal levels per day, especially for GLONASS and Galileo. Conversely, those clusters derived from the SNR method are evenly distributed in the whole experimental period, which may be partially responsible for more retrieval points (Table 4). The RMSE between the SSH measured from the tide gauge and those estimated by the GPS carrier-phase combination (red dots in top image of Figure 11) is 20.8 cm, which is larger than that of GPS SNR method by 4.0 cm. The linear slope of SSH estimations determined by the carrier-phase combination (top left image of Figure 12) amounts to 0.965 m/m, and its correlation is 0.973. For GLONASS-based SSH retrievals, the RMSEs and correlations for both GNSS-IR methods are similar to the results derived from GPS. The RMSE for Galileo S5X (blue squares in bottom image of Figure 11) is also superior to that of the corresponding phase combination (red dots in bottom image of Figure 11). The slope is 0.956 m/m, and the correlation (top right image of Figure 12) is 0.968. Furthermore, three Van de Casteele diagrams of Figure 12 show residuals between the co-located tide gauge and retrievals for the carrier-phase combination method. We can see a similar scale of deviations for three SSH retrieval time series, and they may result from the sea surface wind and atmospheric delay [20].
To sum up, these studies indicate that the PE arcs of the single constellation enable monitoring of sea-level variations. As shown in Table 4, the average estimation points derived from the SNR method per day are far beyond those of the carrier-phase combination method, and the RMSE value of the former is lower than that of the latter by about 4.0 cm. Interestingly, there is good performance of sea-level estimation for the GNSS carrier-phase combination at high and low tide, and the SNR method shows a significant advantage on SSH retrievals during a transition period between the tides. Except for reasons of signal quality, the IF-PPP method might offset the multiple effects of carrier-phase observation to obtain the better accuracy of positioning. Moreover, it should be noted that no obvious inter-frequency bias was observed from the SSH retrievals in Figure 12 and Table 4.

3.2. Experimental Results in Socoa, France

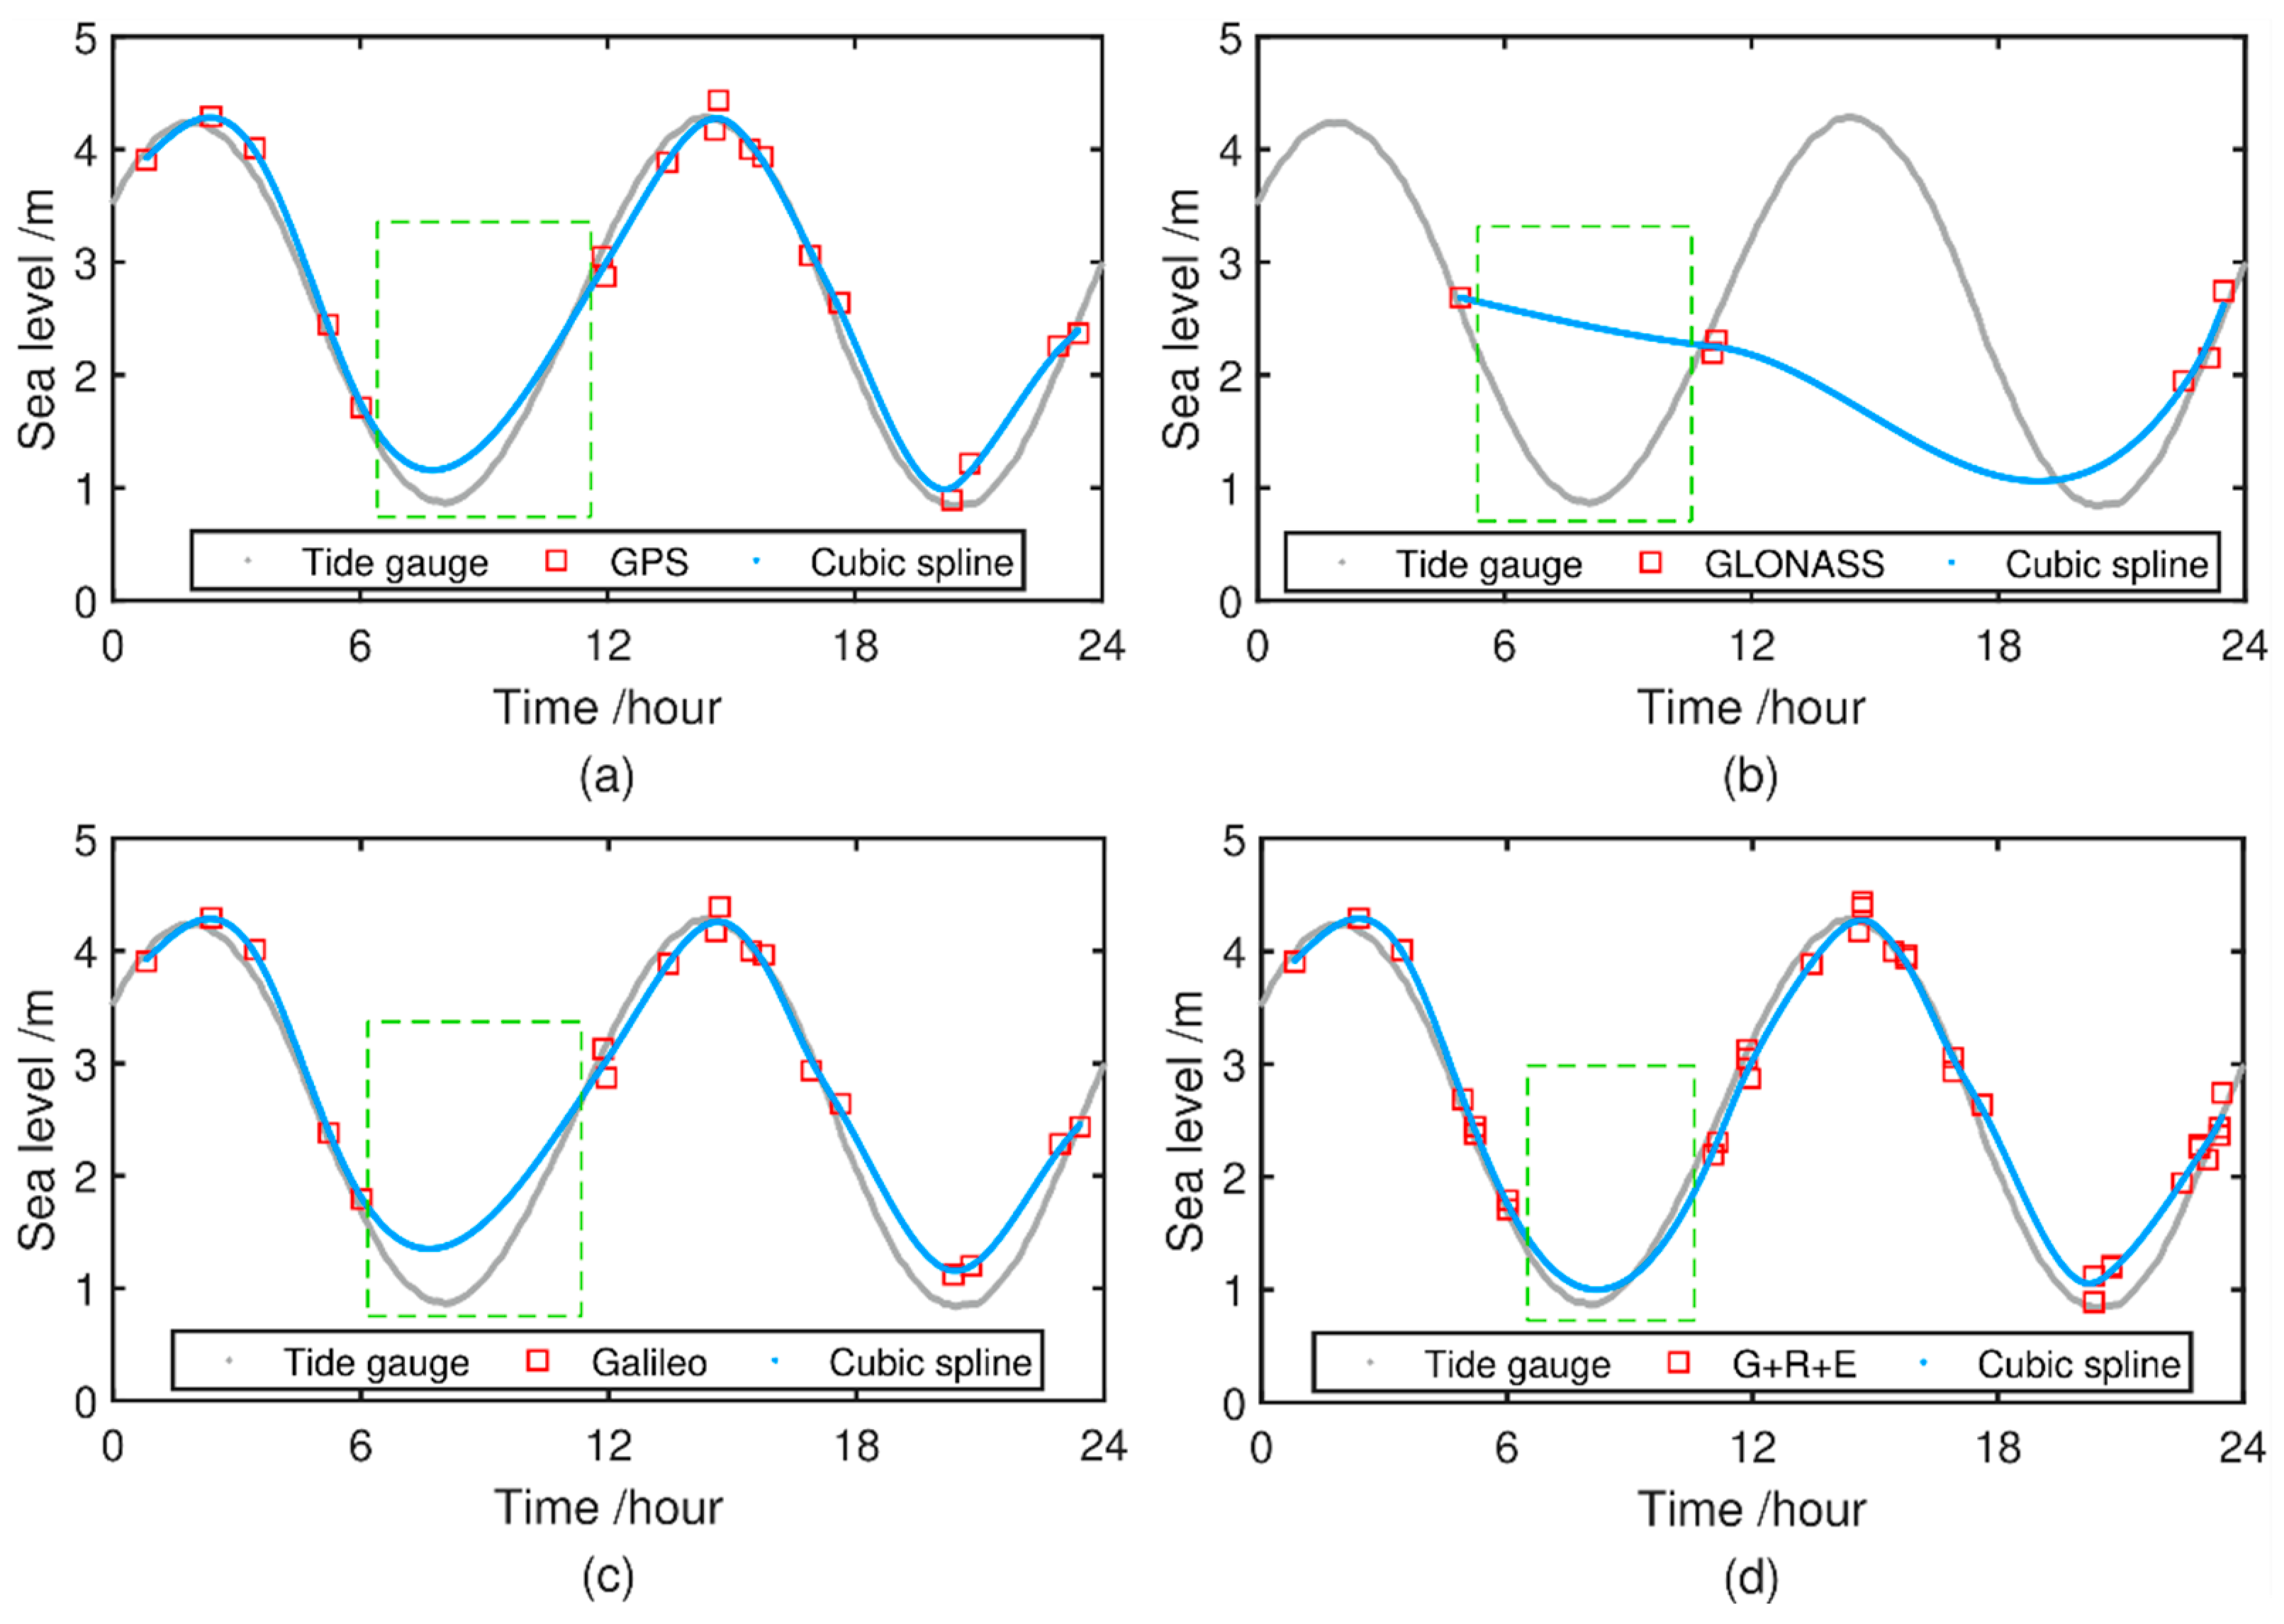
To verify the feasibility of the proposed method on SSH estimation, the retrieval results derived from the PE of GNSS are compared with those of the co-located tide gauge. For the two reference tide gauges used in our study, the sampling intervals of the measurements are 6 min and 1 min, respectively, and thus we decide to resample the SSH time series for the tide gauge Socoa at a 6 min interval. Additionally, we selected the GNSS measurements for the same observation period to estimate SSH time series. For the selected elevation and azimuth ranges in Section 2.1.3, there are approximately 80 PE arcs in about 30 min for the combined multi-GNSS signals. The number of available PE arcs increased by about 110 after using a 20 min time sliding window with 5 min intervals of the satellite epoch to divide each PE arc with elevation angles of 5°–20°. Each obtained GNSS PE fragment has 40 measurements. To prove the advantages of the combined multi-PE arcs, we chose multi-GNSS PE measurements on DOY 1, 2022 to retrieve SSH time series, presented in Figure 13.
Figure 13 shows that the SSH estimations for different constellations correspond fairly to those measured by tide gauge. However, the performance of these SSH time series smoothed by a cubic spline method has a difference due to the different numbers of estimations. The multi-GNSS PE combination method has the least deviations, followed by GPS, Galileo, and GLONASS, which has the worst precision at site SCOA. Therefore, this result shows that a cubic spline method can use more retrieval nodes to regenerate SSH with high accuracy and temporal resolution. Figure 14 shows the SSH time series retrieved by both observation combination methods and the linear regression between GNSS-based estimations and measured sea level. Table 5 summarizes the average number of retrievals per day, slope of regression, RMSE, and correlation for both combination methods.
The comparison shows a great agreement between GNSS-based SSH estimations and the referenced sea-level measurements (Figure 14), with all correlations above 0.97, and they demonstrate a generally strong linear relationship. As shown in Table 5, for retrievals for both methods, there was no significant difference in the number of retrieval point and regression slopes. The RMSE of the estimated SSH series for the PE method (blue triangles in the top image of Figure 14) is 18.4 cm, which is higher than that of the SNR method (red diamonds in the middle image of Figure 14) by about 2 cm. Moreover, we can see that the SSH time series for the SNR combination has fewer retrieval points in several periods, e.g., DOYs 350–351 in 2021, DOYs 7–9, DOY 13, and DOY 29 in 2022, which may result from differences in signal quality for each GNSS station. During the corresponding observation periods, the PE combination can be an effective supplement for monitoring SSH.
During the experimental period, the similar results between SC02 and SCOA indicate that the performance (terms of RMSE) of a PE combination is generally slightly poorer than that of a SNR combination, with a few exceptions when the number of usable satellite tracks decreases. In addition, after processing the multi-GNSS PE combination, a cubic spline further improved the temporal resolution of retrievals.
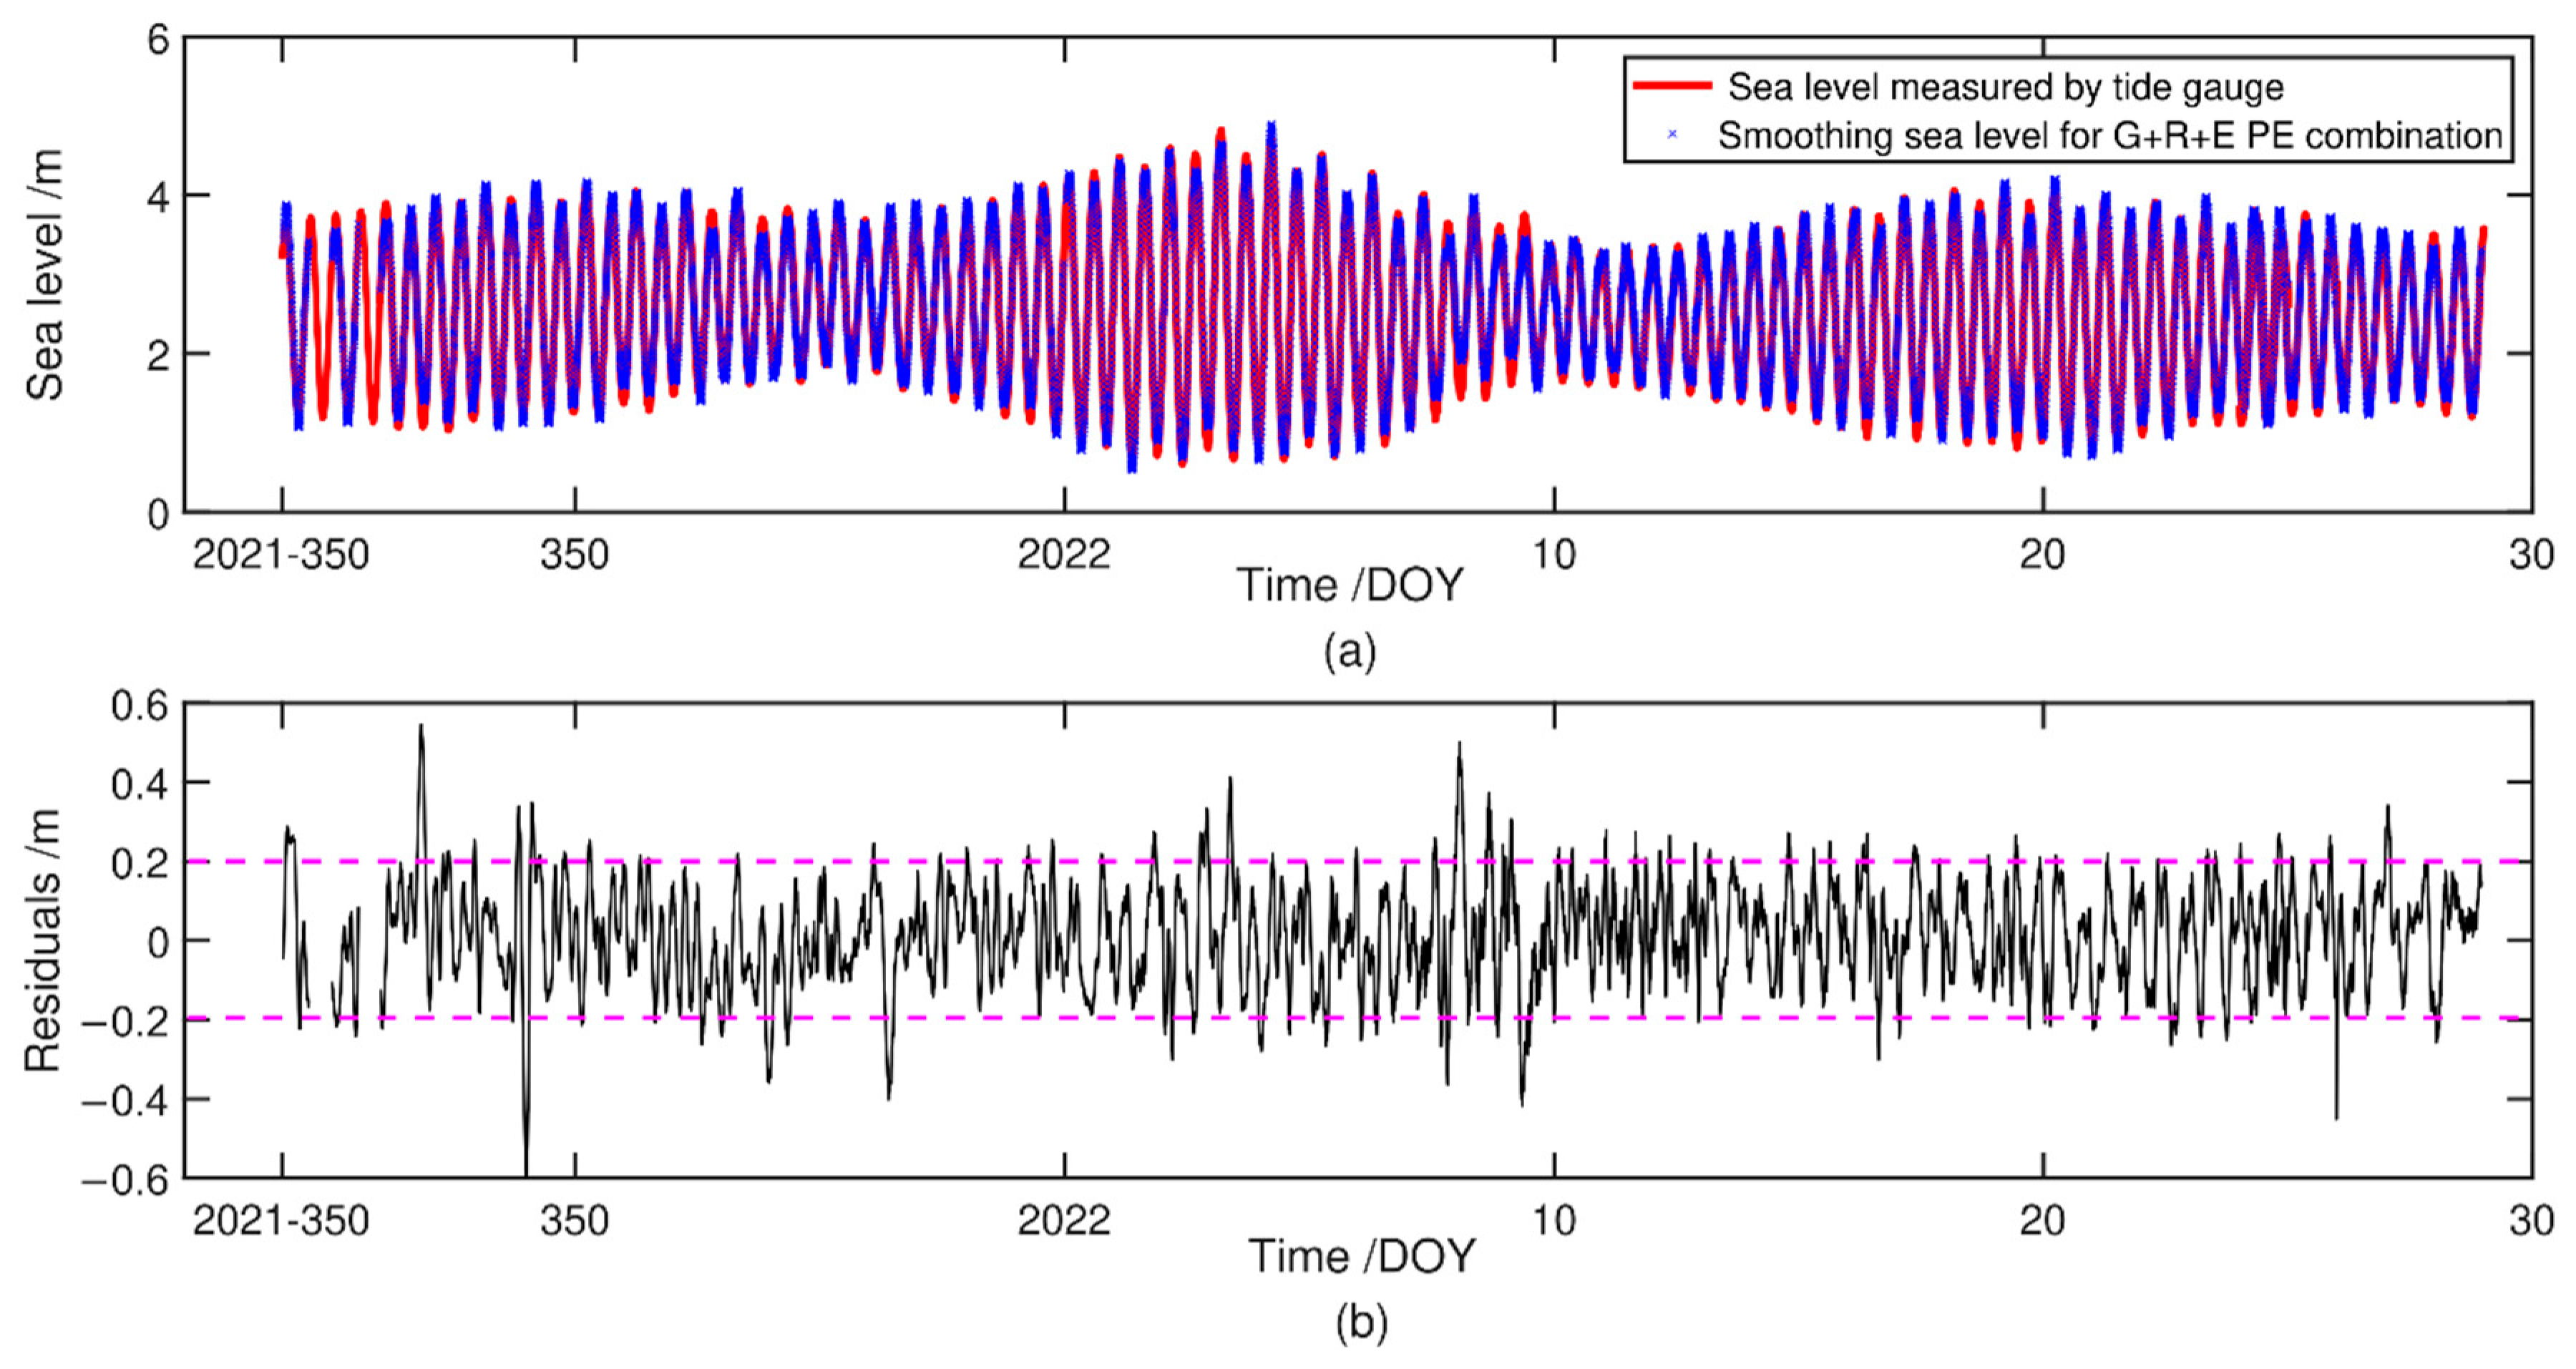
The multi-GNSS PE combination method was applied to retrieve all RHs, and a weighted cubic spline method with a 6 min interval smoothing was applied to those obtained to reduce data redundancy, as shown in Figure 15.
The combined SSH estimation time series (blue dots in top image of Figure 15) excellently correspond to the overall trend of measured sea-level variations, even at high tide and low tide. Notice that a range of the estimated residuals is almost between −20 and 20 cm, which appears to be a normal distribution (Figure 16). The correlation and RMSE between the 6 min combined retrievals and in situ measurements for the corresponding tide gauge were 0.988 and 12.5 cm, respectively, and the average residual was approximately 1.5 cm. In Figure 16, we also show the standard deviation σ of these residuals and the residual distribution of multi-PE-based SSH time series in two intervals of 2 σ ,   2 σ and σ ,   σ . It shows that the rates of residuals within both intervals are up to 0.966 and 0.677, respectively. These remaining residuals may mainly be attributed to significant wave height resulting from a wave. The study achieved hour-to-minute-scale resolution in ground-based GNSS-IR SSH estimation. The high-temporal SSH monitoring benefitted from the combination of more satellite tracks, good data quality, and a decrease in redundancy data per day.

4. Conclusions

This study proposed a new high-frequency sea-surface altimetry method that uses the PE measurements derived from GNSS DF carrier-phase observations after precise point positioning. These PE measurements are different from the traditional SNR method, which can be generated after using IF-PPP technique at GNSS receivers. GNSS datasets collected from two near-shore stations are used to test the feasibility of the proposed GNSS-IR method. The results demonstrate that the SSH series estimated from the carrier-phase PE arc show a good agreement with the in-situ tidal dataset, with the correlation coefficient exceeding 0.96 and 0.97 at both sites, which is close to the SNR method during the experimental period. These results indicate that the GNSS PE method can also be used to monitor sea level as an alternative observation in case SNR data is not obtained.
The double peaks were found in the LSP estimation result for one PE arc derived from the IF-PPP technique, which is also shown in the L4 method [28,43]. The double peak problem in Figure 5b is caused by the dual-frequency observation combination, and the double peaks correspond to the frequency of different signals. Through the analysis of Table 3, the parameter of a in Equation (12) is approximately equal to half of the higher wavelength for the combined signal. That is, the first peak that is related to the higher wavelength can be used to estimate RH between the sea surface and antenna phase center. Based on this conclusion, we established a linear relationship between the corresponding frequency for the GNSS signal with high wavelength and RH. Then, due to the unmodeled noise signals in PE arcs, an essential data quality control method is applied to remove the gross errors. Thus, the results of this work achieve the first contribution to verify the possibility of long-term SSH retrieval series using the LSP method and PE measurements with different constellations for the first time, especially for estimation results from GLONASS and Galileo signals.
Temporal resolution for the coastal GNSS-IR method is a crucial and necessary step. In Figure 9a, the number of raw PE arcs for an individual constellation per day at site SC02 is less than 50, which is not available for dynamic sea levels. To solve this problem, a sliding window method further adjusts the PE arc by the fixed time window. Then, the number of PE arcs adjusted by the window increased by about 5 times, as shown in Figure 9b. Figure 13 shows that more retrievals provide better characteristics of sea surface height variations. After the data processing of sliding window and quality control, the average number of PE-based retrievals per day for an individual constellation at site SC02 is below 20. In addition, the RMSE values of PE-based retrievals for an individual constellation at site SC02 are from 20 to 22 cm. Note that there is no significant inter-frequency bias for these retrieval results. It implies that the inter-frequency bias may be related to the receiver or antenna.
Previous studies [20,44] indicate that the combination of multi-GNSS retrievals can improve precision and/or temporal sampling. In the development of ground-based GNSS-R technique, the GNSS stations equipped with antennas that can track all GNSS signals are to be recommended [45]. The second contribution is to increase the temporal resolution of the combined multi-GNSS PE method using the weighted cubic spline method. As shown in Figure 14, the RMSE values for both combination methods at site SCOA are approximately 18 and 16 cm, respectively. However, the distribution of SSH retrievals is not uniform in most case. To process the data redundancy in a short observation period, the weighted cubic spline method is introduced to smooth those retrievals per day in a 95% confidence interval, which can regenerate a 6-min-level SSH time series. Finally, this study achieved a minute-scale SSH estimation, and its RMSE up to 12.5 cm.
Compared with the existing GNSS-IR methods based on the carrier-phase observation, the proposed method has a unique advantage in the generation of data. The PE data correctly estimates and removes individual parameters including the orbit error bias, satellite clock error, ionospheric error, tropospheric error, and various signal delay deviations. Because PE data is a by-product in GNSS precision positioning, the complex pre-processing is not required. Furthermore, this is an initial study for the PE-based GNSS-IR technique, and further studies may focus on the improvement of the raw signal model, frequency extraction, and the adaptability of BeiDou signals. Meanwhile, the method is worth developing to monitor storm surge, snow depth, and so on.

Author Contributions

Conceptualization, W.Z. and S.B.; methodology, W.Z., Y.L. and L.L.; software, Y.L.; validation, L.H.; resources, G.Z.; writing—original draft preparation, W.Z.; writing—review and editing, L.H. and C.C.; funding acquisition, S.B. and H.L. All authors have read and agreed to the published version of the manuscript.

Funding

This research was funded by the National Natural Science Foundation of China (Nos. 41971416, 41974005, 42064002, 42104004), the National Science Foundation for Outstanding Young Scholars (No. 42122025), the Independent Project of Naval University of Engineering (No. 2019055); the Graduate Innovation Foundation for Naval University of Engineering (DQCXJ2021004, DQCXJ2021005).

Data Availability Statement

Not applicable.

Acknowledgments

The authors are grateful to relevant authorities for providing free GNSS and tidal datasets from UNAVCO, IGN, NOAA, and PSMSL, respectively.

Conflicts of Interest

The authors declare no conflict of interest.

References

  1. Feng, W.; Zhong, M. Global sea level variations from altimetry, GRACE and Argo data over 2005–2014. Geod. Geodyn. 2015, 6, 274–279. [Google Scholar] [CrossRef] [Green Version]
  2. Nicholls, R.J.; Cazenave, A. Sea-level rise and its impact on coastal zones. Science 2010, 328, 1517–1520. [Google Scholar] [CrossRef] [PubMed]
  3. Cipollini, P.; Calafat, F.M.; Jevrejeva, S.; Melet, A.; Prandi, P. Monitoring Sea Level in the Coastal Zone with Satellite Altimetry and Tide Gauges. Surv. Geophys. 2017, 38, 33–57. [Google Scholar] [CrossRef] [PubMed] [Green Version]
  4. Li, D.; Shen, X.; Li, D.; Li, S. On Civil-Military Integrated Space-Based Real-Time Information Service System. Geomat. Inform. Sci. Wuhan Univ. Chin. 2017, 42, 1501–1505. [Google Scholar] [CrossRef]
  5. Huang, L.; Mo, Z.; Xie, S.; Liu, L.; Chen, J.; Kang, C.; Wang, S. Spatiotemporal characteristics of GNSS-derived precipitable water vapor during heavy rainfall events in Guilin, China. Satell. Navig. 2021, 2, 13. [Google Scholar] [CrossRef]
  6. Jin, S.; Qian, X.; Wu, X. Sea level change from BeiDou Navigation Satellite System-Reflectometry (BDS-R): First results and evaluation. Glob. Planet. Chang. 2017, 149, 20–25. [Google Scholar] [CrossRef]
  7. Garrison, J.L.; Komjathy, A.; Zavorotny, V.U.; Katzberg, S.J. Wind speed measurement using forward scattered GPS signals. IEEE Trans. Geosci. Remote Sens. 2002, 40, 50–65. [Google Scholar] [CrossRef] [Green Version]
  8. Löfgren, J.S.; Haas, R. Sea level measurements using multi-frequency GPS and GLONASS observations. EURASIP J. Adv. Signal Process 2014, 2014, 50. [Google Scholar] [CrossRef] [Green Version]
  9. Roussel, N.; Ramillien, G.; Frappart, F.; Darrozes, J.; Gay, A.; Biancale, R.; Striebig, N.; Hanquiez, V.; Bertin, X.; Allain, D. Sea level monitoring and sea state estimate using a single geodetic receiver. Remote Sens. Environ. 2015, 171, 261–277. [Google Scholar] [CrossRef]
  10. Song, M.; He, X.; Wang, X.; Jia, D.; Xiao, R.; Shi, H.; Wu, Y. Study on the Exploration of Spaceborne GNSS-R Raw Data Focusing on Altimetry. IEEE J. Sel. Top. Appl. Earth Obs. Remote Sens. 2020, 13, 6142–6154. [Google Scholar] [CrossRef]
  11. Martin-Neira, M. A pasive reflectometry and interferometry system (PARIS) application to ocean altimetry. ESA J. 1993, 17, 331–355. [Google Scholar]
  12. Martin-Neira, M.; Caparrini, M.; Font-Rossello, J.; Lannelongue, S.; Vallmitjana, C.S. The PARIS concept: An experimental demonstration of sea surface altimetry using GPS reflected signals. IEEE Trans. Geosci. Remote Sens. 2001, 39, 142–150. [Google Scholar] [CrossRef] [Green Version]
  13. Löfgren, J.S.; Haas, R.; Scherneck, H.-G.; Bos, M.S. Three months of local sea level derived from reflected GNSS signals. Radio Sci. 2011, 46, RS0C05. [Google Scholar] [CrossRef]
  14. Anderson, K.D. Determination of Water Level and Tides Using Interferometric Observations of GPS Signals. J. Atmos. Ocean. Technol. 2000, 17, 1118–1127. [Google Scholar] [CrossRef]
  15. Yu, K.; Ban, W.; Zhang, X.; Yu, X. Snow Depth Estimation Based on Multipath Phase Combination of GPS Triple-Frequency Signals. IEEE Trans. Geosci. Remote Sens. 2015, 53, 5100–5109. [Google Scholar] [CrossRef]
  16. Larson, K.M.; Small, E.E.; Gutmann, E.; Bilich, A.; Axelrad, P.; Braun, J. Using GPS multipath to measure soil moisture fluctuations: Initial results. GPS Solut. 2008, 12, 173–177. [Google Scholar] [CrossRef]
  17. Larson, K.M.; Gutmann, E.D.; Zavorotny, V.U.; Braun, J.J.; Williams, M.W.; Nievinski, F.G. Can we measure snow depth with GPS receivers? Geophys. Res. Lett. 2009, 36, L17502. [Google Scholar] [CrossRef] [Green Version]
  18. Larson, K.M.; Löfgren, J.S.; Haas, R. Coastal sea level measurements using a single geodetic GPS receiver. Adv. Space Res. 2013, 51, 1301–1310. [Google Scholar] [CrossRef] [Green Version]
  19. Larson, K.M.; Ray, R.D.; Nievinski, F.G.; Freymueller, J.T. The Accidental Tide Gauge: A GPS Reflection Case Study From Kachemak Bay, Alaska. IEEE Geosci. Remote Sens. Lett. 2013, 10, 1200–1204. [Google Scholar] [CrossRef] [Green Version]
  20. Wang, X.; He, X.; Zhang, Q. Evaluation and combination of quad-constellation multi-GNSS multipath reflectometry applied to sea level retrieval. Remote Sens. Environ. 2019, 231, 111229. [Google Scholar] [CrossRef]
  21. Lomb, N.R. Least-squares frequency analysis of unequally spaced data. Astrophys. Space Sci. 1976, 39, 447–462. [Google Scholar] [CrossRef]
  22. Scargle, J.D. Studies in astronomical time series analysis. II. Statistical aspects of spectral analysis of unevenly spaced data. Astrophys. J. 1982, 263, 835–853. [Google Scholar] [CrossRef]
  23. Strandberg, J.; Hobiger, T.; Haas, R. Improving GNSS-R sea level determination through inverse modeling of SNR data. Radio Sci. 2016, 51, 1286–1296. [Google Scholar] [CrossRef] [Green Version]
  24. Strandberg, J.; Hobiger, T.; Haas, R. Real-time sea-level monitoring using Kalman filtering of GNSS-R data. GPS Solut. 2019, 23, 61. [Google Scholar] [CrossRef] [Green Version]
  25. Ozeki, M.; Heki, K. GPS snow depth meter with geometry-free linear combinations of carrier phases. J. Geod. 2012, 86, 209–219. [Google Scholar] [CrossRef] [Green Version]
  26. Li, Y.; Chang, X.; Yu, K.; Wang, S.; Li, J. Estimation of snow depth using pseudorange and carrier phase observations of GNSS single-frequency signal. GPS Solut. 2019, 23, 118. [Google Scholar] [CrossRef]
  27. Zhang, Z.; Guo, F.; Zhang, X.; Pan, L. First result of GNSS-R-based sea level retrieval with CMC and its combination with the SNR method. GPS Solut. 2021, 26, 20. [Google Scholar] [CrossRef]
  28. Wang, N.; Xu, T.; Gao, F.; Xu, G. Sea Level Estimation Based on GNSS Dual-Frequency Carrier Phase Linear Combinations and SNR. Remote Sens. 2018, 10, 470. [Google Scholar] [CrossRef] [Green Version]
  29. Liu, Y.; Zhou, W.; Ji, B.; Yu, D.; Bian, S.; Gu, S.; Li, D. Effect of Stochastic Modeling for Inter-Frequency Biases of Receiver on BDS-3 Five-Frequency Undifferenced and Uncombined Precise Point Positioning. Remote Sens. 2022, 14, 3595. [Google Scholar] [CrossRef]
  30. Geng, J.; Yang, S.; Guo, J. Assessing IGS GPS/Galileo/BDS-2/BDS-3 phase bias products with PRIDE PPP-AR. Satell. Navig. 2021, 2, 17. [Google Scholar] [CrossRef]
  31. Huang, L.; Zhu, G.; Liu, L.; Chen, H.; Jiang, W. A global grid model for the correction of the vertical zenith total delay based on a sliding window algorithm. GPS Solut. 2021, 25, 98. [Google Scholar] [CrossRef]
  32. Wang, X.; Zhang, Q.; Zhang, S. Water levels measured with SNR using wavelet decomposition and Lomb–Scargle periodogram. GPS Solut. 2017, 22, 22. [Google Scholar] [CrossRef]
  33. Larson, K.M.; Nievinski, F.G. GPS snow sensing: Results from the EarthScope Plate Boundary Observatory. GPS Solut. 2013, 17, 41–52. [Google Scholar] [CrossRef]
  34. Liu, Q.; Zhang, S. An improved sea level retrieval method using the differential evolution of GNSS SNR data. Adv. Space Res. 2021, 67, 975–984. [Google Scholar] [CrossRef]
  35. Vu, P.L.; Ha, M.C.; Frappart, F.; Darrozes, J.; Ramillien, G.; Dufrechou, G.; Gegout, P.; Morichon, D.; Bonneton, P. Identifying 2010 Xynthia Storm Signature in GNSS-R-Based Tide Records. Remote Sens. 2019, 11, 782. [Google Scholar] [CrossRef] [Green Version]
  36. Roesler, C.; Larson, K.M. Software tools for GNSS interferometric reflectometry (GNSS-IR). GPS Solut. 2018, 22, 80. [Google Scholar] [CrossRef] [Green Version]
  37. Geremia-Nievinski, F.; Silva, M.F.E.; Boniface, K.; Monico, J.F.G. GPS Diffractive Reflectometry: Footprint of a Coherent Radio Reflection Inferred From the Sensitivity Kernel of Multipath SNR. IEEE J. Sel. Top. Appl. Earth Obs. Remote Sens. 2016, 9, 4884–4891. [Google Scholar] [CrossRef]
  38. Wang, X.; Zhang, Q.; Zhang, S. Azimuth selection for sea level measurements using geodetic GPS receivers. Adv. Space Res. 2018, 61, 1546–1557. [Google Scholar] [CrossRef]
  39. Nievinski, F.G.; Larson, K.M. Forward modeling of GPS multipath for near-surface reflectometry and positioning applications. GPS Solut. 2013, 18, 309–322. [Google Scholar] [CrossRef]
  40. Aram, M.; El-Rabbany, A.; Krishnan, S.; Anpalagan, A. Single Frequency Multipath Mitigation Based on Wavelet Analysis. J. Navig. 2007, 60, 281–290. [Google Scholar] [CrossRef]
  41. Hobiger, T.; Haas, R.; Löfgren, J. Software-Defined Radio Direct Correlation GNSS Reflectometry by Means of GLONASS. IEEE J. Sel. Top. Appl. Earth Obs. Remote Sens. 2016, 9, 4834–4842. [Google Scholar] [CrossRef]
  42. Pan, H.; Lv, X.; Wang, Y.; Matte, P.; Chen, H.; Jin, G. Exploration of Tidal-Fluvial Interaction in the Columbia River Estuary Using S_TIDE. J. Geophys. Res. Oceans 2018, 123, 6598–6619. [Google Scholar] [CrossRef]
  43. Qian, X.; Jin, S. Estimation of Snow Depth from GLONASS SNR and Phase-Based Multipath Reflectometry. IEEE J. Sel. Top. Appl. Earth Obs. Remote Sens. 2016, 9, 4817–4823. [Google Scholar] [CrossRef]
  44. Larson, K.M.; Ray, R.D.; Williams, S.D.P. A 10-Year Comparison of Water Levels Measured with a Geodetic GPS Receiver versus a Conventional Tide Gauge. J. Atmos. Ocean. Technol. 2017, 34, 295–307. [Google Scholar] [CrossRef] [Green Version]
  45. Tabibi, S.; Geremia-Nievinski, F.; Dam, T.V. Statistical Comparison and Combination of GPS, GLONASS, and Multi-GNSS Multipath Reflectometry Applied to Snow Depth Retrieval. IEEE Trans. Geosci. Remote Sens. 2017, 55, 3773–3785. [Google Scholar] [CrossRef]
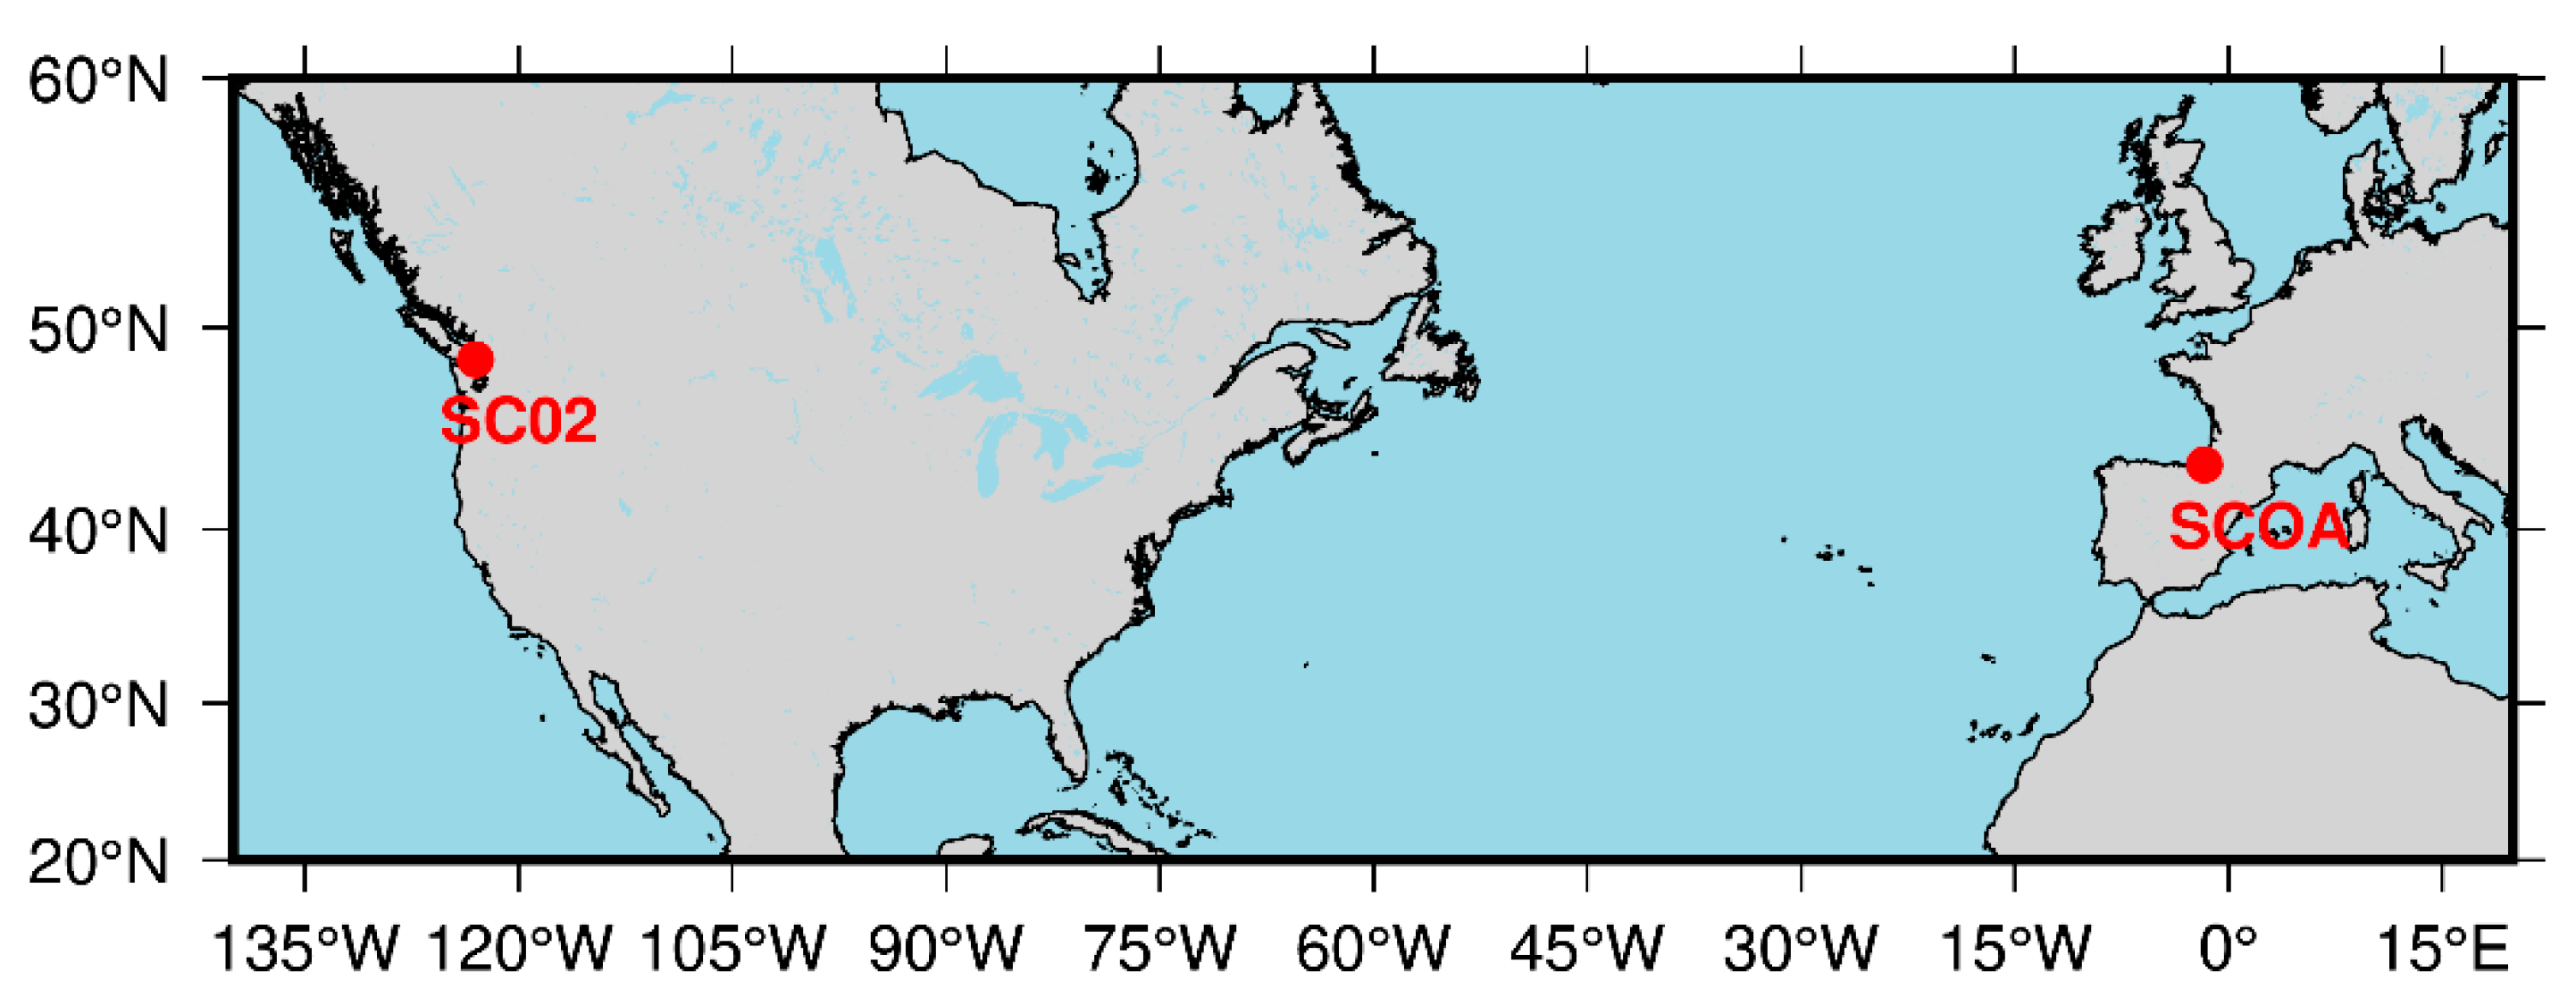
Figure 1. Location of two GNSS reference stations. Both SC02 and SCOA are operated by the EarthScope Plate Boundary Observatory (PBO, https://www.unavco.org/data/gps-gnss/gps-gnss.html (accessed on 22 July 2022)) [33] and Institut National de L’Information Géographique et Forestière (IGN), respectively.
Remotesensing 14 05599 g001
Figure 3. Screenshots of the FFZs for site SC02 (a) and site SCOA (b) at elevation angles of 5° (yellow), 10° (blue), and 15° (red), respectively. A fixed reflector height is projected onto the aerial image provided from Google Earth App [36].
Remotesensing 14 05599 g003
Figure 4. Simplified geometric chart of shore-based GNSS-IR sea surface altimetry. H is the reflector height between the antenna center and sea surface; H A n t is the vertical height from the antenna center and land surface; H T G is the tidal dataset collected from the tide gauge; H D a t u m is the difference between the reference ellipsoid and tide gauge datum; and θ is the satellite elevation angle.
Remotesensing 14 05599 g004
Figure 5. (a) PE arc of the DF carrier-phase combination (red) for GPS PRN01 received from site SC02 on DOY 1, 2022 and the simulated arc (blue); (b) the corresponding LSP results.
Remotesensing 14 05599 g005
Figure 6. A linear model between the antenna height and frequency related to higher peak with the elevation angle range of 5°–20°. Herein, the parameters of a and b are given in Table 3.
Remotesensing 14 05599 g006
Figure 7. Absolute SSH series retrieved from the peak RHs at site SCOA are compared with measurements of the tide gauge on DOY 1, 2022.
Remotesensing 14 05599 g007
Figure 8. Flow chart of a high-temporal GNSS-IR sea-level retrieval method.
Remotesensing 14 05599 g008
Figure 9. Number of daily PE arcs for GPS, GLONASS, and Galileo carrier-phase observations recorded from site SC02 during the experimental period. (a) Initial observation arcs; (b) extended observation arcs based on a sliding window.
Remotesensing 14 05599 g009
Figure 10. Sea surface heights estimated from GPS PE arcs for site SC02 on DOY 1, 2022. Red: LSP results for raw observation arcs; Blue: the additional LSP results after using a sliding window.
Remotesensing 14 05599 g010
Figure 11. Sea surface height of site SC02 estimated from the PE arcs of multi-GNSS DF carrier-phase observation (red), SNR arcs of the corresponding single-frequency signal (blue), and those measured by the Friday Harbor tide gauge (gray). (a) GPS; (b) GLONASS; (c) Galileo.
Remotesensing 14 05599 g011
Figure 12. Performance of sea surface height with different GNSS observations for site SC02. (ac): Linear relationship of sea-level variations estimated from GNSS PE arcs versus the in situ results recorded by tide gauge; (df): Van de Casteele diagrams (GNSS-estimated sea-level residuals versus in situ measurements).
Remotesensing 14 05599 g012
Figure 13. Smoothed SSH time series of site SCOA estimated by PE measurements for different constellations on DOY 1, 2022. (a) GPS; (b) GLONASS; (c) Galileo; (d) multi-GNSS combination.
Remotesensing 14 05599 g013
Figure 14. Sea surface height of site SCOA estimated by the combined PE and SNR arcs for different constellations, respectively, and linear relationship between retrievals and in situ tidal data. (a) A combination of multi-GNSS PE arcs; (b) a combination of SNR arcs collected from GPS S2X, GLONASS S2C, and Galileo S5X; (c) the corresponding linear relationship for GNSS PEs; (d) the corresponding linear relationship for GNSS SNR.
Remotesensing 14 05599 g014
Figure 15. Sea surface heights derived from multi-GNSS PE combination arcs and its residuals with tide gauge. (a) Sea surface height estimation; (b) residuals between the estimations and in situ measurements.
Remotesensing 14 05599 g015
Figure 16. Statistics residual distribution histograms of SSHs estimated from the multi-GNSS PE combination method.
Remotesensing 14 05599 g016
Table 1. Specific parameters of GNSS observation for multi-constellation satellites received by two GNSS receivers.
SystemFrequency BandFrequency (MHz)Phase CodeSNR Code
GPSL11575.42L1CS1C
L21227.60L2XS2X
GLONASSR11602 + k × 9/16 1L1CS1C
R21246 + k × 7/16L2CS2C
GalileoE11575.42L1XS1X
E5a1176.45L5XS5X
1 For GLONASS constellations, the parameter k is the number for each satellite.
Table 2. The specific data-processing strategy of the IF-PPP method for GNSS dual-frequency observations.
TermsData-Processing Strategy
ObservationsGPS: L1/L2; GLONASS: G1/G2; Galileo: E1/E5a
MethodIF-PPP
Cut-off elevation angle
EstimatorKalman filter (Backward and Forward)
Receiver positionEstimated from the PRIDE software [30]
Receiver clockWhite noise model
Satellite orbit and clockPrecise ephemeris and clock products
Integer ambiguityConstant model (each ambiguity parameter corresponds to one observation arc per satellite)
Inter-frequency biasesWhite noise model
Troposphere delaysZenith Dry Delay (ZDD): Global Pressure and Temperature (GPT3) model; Zenith Wet Delay (ZWD): Random-walk model (5 × 10⁻⁸ m2/s)
Ionospheric delaysIF combination method
Table 3. Fitting coefficients calculated from the simulated arcs for different satellite constellations.
SystemFrequency CombinationFitting Coefficients
ab
GPSL1 + L20.1222−0.011
GLONASSG1 + G20.1203−0.020
GalileoE1 + E5a0.1273−0.012
Table 4. The average number of retrieval points per day, RMSE, and correlation coefficients (R2) for each observation type at site SC02.
SystemObservation CodeAverage Number of Retrievals per DayRMSE (cm)R2
GPSL1 + L21920.80.973
S2X4016.50.972
GLONASSR1 + R21121.90.970
S2C2817.10.977
GalileoE1 + E5a1222.00.968
S5X2817.90.963
Table 5. The average number of retrieval points per day, slope of regression line, RMSE, and correlation for both PE combination and SNR combination methods.
GNSS ObservationAverage Number of Retrievals per DaySlope (m/m)RMSE (cm)R2
PE combination350.95218.40.973
SNR combination450.97616.50.988
Publisher’s Note: MDPI stays neutral with regard to jurisdictional claims in published maps and institutional affiliations.