Abstract
The Weihe River Basin (WRB) of China is located in an arid and water-scarce semi-arid region with a fragile ecological environment, and it is meaningful to study the spatial and temporal changes in vegetation and terrestrial water storage changes in a small-scale inland basin. This study uses normalized difference vegetation index (NDVI) data and Gravity Recovery and Climate Experiment (GRACE) and GRACE Follow-On (GRACE-FO) time-variable gravity field models to derive changes in vegetation cover and water storage in the WRB from 2002 to 2020. Firstly, taking NDVI as the breakthrough point, the temporal and spatial characteristics of vegetation were analyzed by trend analysis method and F-test. Then, GRACE and GRACE-FO were used to derive water storage variations. Finally, the correlation between NDVI and water storage variations is discussed using the Pearson correlation analysis. The results show that the overall trend of NDVI is increasing, and the increasing trend is more evident before 2014, and after that, there is a significant fluctuation. The spatial distribution shows a large spatial variability, but the growing area still accounts for the majority, and the change varies by vegetation type, among which the cultivated vegetation is more influential. The overall change in terrestrial water storage showed a decreasing trend of −0.09 cm/yr, and also reflected a solid intra-annual regular cycle, i.e., reaching a trough from October to November and a peak from May to June each year. The correlation is 0.6 on the time scale, and there was a 3-month lag between NDVI and TWS. On the spatial scale, the percentage of areas with a negative correlation was about 95.4%, probably due to increased water consumption and evapotranspiration. The study’s results can help to understand the relationship between vegetation and water storage in the WRB and provide scientific support for local environmental management.
1. Introduction
Vegetation is a fundamental element of terrestrial ecosystems. It is the natural link between soil, water, and the environment and plays an essential role in the terrestrial carbon balance and the regulation of the climate system [1]. Terrestrial water storage (TWS) usually includes the total amount of water stored in groundwater, soil water, surface water (lakes, rivers, and reservoirs), glaciers, and snow. It is a major component of the global water cycle [2,3,4,5]. It also plays a vital role in protecting the ecological environment and forming extreme hydrological events. Meanwhile, terrestrial water is also an important prerequisite for keeping vegetation green, regulating about half of the vegetation growth in global ecosystems and thus strongly influencing the global carbon cycle [6,7,8,9]. In addition, vegetation as an essential component of terrestrial ecosystems is important for regulating water balance at regional and global scales [10]. Therefore, a clear understanding of terrestrial water and vegetation is needed. Similarly, a clear understanding of the interactions between terrestrial water and vegetation greenness is particularly crucial for predicting future water cycles, especially in arid and semi-arid regions [11]. In this regard, the Normalized Difference Vegetation Index (NDVI) is considered to be a good indicator for identifying vegetation areas and long-term changes in their condition [12,13,14,15]. An increase in NDVI usually indicates enhanced vegetation growth and a decrease in NDVI usually indicates reduced plant growth [9]. The study of vegetation response mechanisms to changes in terrestrial water storage has become an important element of regional ecological conservation and healthy development, which has significant ecological, social, and economic impacts.
In recent years, it has been shown how land greenness affects the global water cycle and regional terrestrial water balance, such as by altering the terrestrial water cycle [16]. Papagiannopoulou et al. [17] showed that water availability is the primary driver of global vegetation greenness anomalies, and that 61% of vegetation has limited land surface water resources despite the relative importance of Northern Hemisphere temperatures during the growing season. At the same time, the impact of climate warming has strengthened the water dependence of mountain vegetation [18,19]. The increase in vegetation cover also means more water demand [20].
The time-variable gravity field models from the Gravity Recovery and Climate Experiment (GRACE) or GRACE Follow-On (GRACE-FO) provide a unique opportunity [21] to quantify and investigate changes in terrestrial water storage (TWS) on regional and global scales. They have become an essential hydrological tool for quantifying basin-scale TWS [22]. The TWS obtained from GRACE has become a valuable data source for studying vegetation–soil–moisture relationships [23]. Yang et al. [24] reported that the TWS observed by GRACE is a better measure to explain the dynamics of Australian vegetation than precipitation. Xie et al. [25] demonstrated a consistent trend of statistical significance between vegetation greenness and GRACE TWS on a global scale. They showed that increasing vegetation greenness is an important cause of declining water storage in northern and western China. Andrew et al. [26] further explored the relationship between the TWS anomaly (TWSA) and vegetation using the discrete wavelet transform technique. Their results showed that the decomposed TWSA explained the changes in vegetation better than the original TWSA. Different vegetation types have different degrees of one-way or two-way causality between NDVI and TWS [27]. It has also been shown that vegetation captures only part of the total precipitation, and precipitation provides only indirect information on plant water status [24,27]. In summary, TWS is a more direct indicator of soil moisture available for plant growth, and therefore, correlates with vegetation changes to a greater extent. However, most of the literature aims to investigate the relationship between changes at large scales, and very little literature has examined the response between NDVI and TWS of vegetation in small-scale inland basins.
Studies have shown that vegetation change and water resources interact and restrict each other [28,29]. Human activities also intensify the balance between them [30]. Li et al. [31] demonstrated that changes in vegetation conditions can lead to significant changes in water storage, especially in the Yellow River basin, where the effect of vegetation changes is more pronounced, and different vegetation types contribute differently. The WRB, as part of the Yellow River Basin, also has this effect. With the implementation of the “Grain for Green Project” and the “Three North Protection Forest Project” [32], the vegetation cover rate has increased significantly [33]. Correspondingly, the increased vegetation consumes more water resources [34], especially the excessive consumption of soil water [35]. The contradiction between the excessive consumption of soil water and the sustainability of the restored vegetation is becoming more and more prominent, further threatening the sustainability of the ecosystem and socio-economic development. Therefore, it is of great scientific significance and social value to monitor WRB water reserves and explore the response relationship between water reserves and vegetation, which can rationally utilize and effectively manage regional water resources and improve the ecological environment.
This study investigates the relationship between WRB vegetation and TWS using NDVI products and GRACE and GRACE-FO time-variable gravity field models. The second part of the paper introduces the study area and data; the third part explains the data processing methods used; the fourth part gives the corresponding results; the fifth part gives a specific analysis of the results; and the sixth part gives the conclusion.
2. Study Area and Datasets
2.1. Study Area
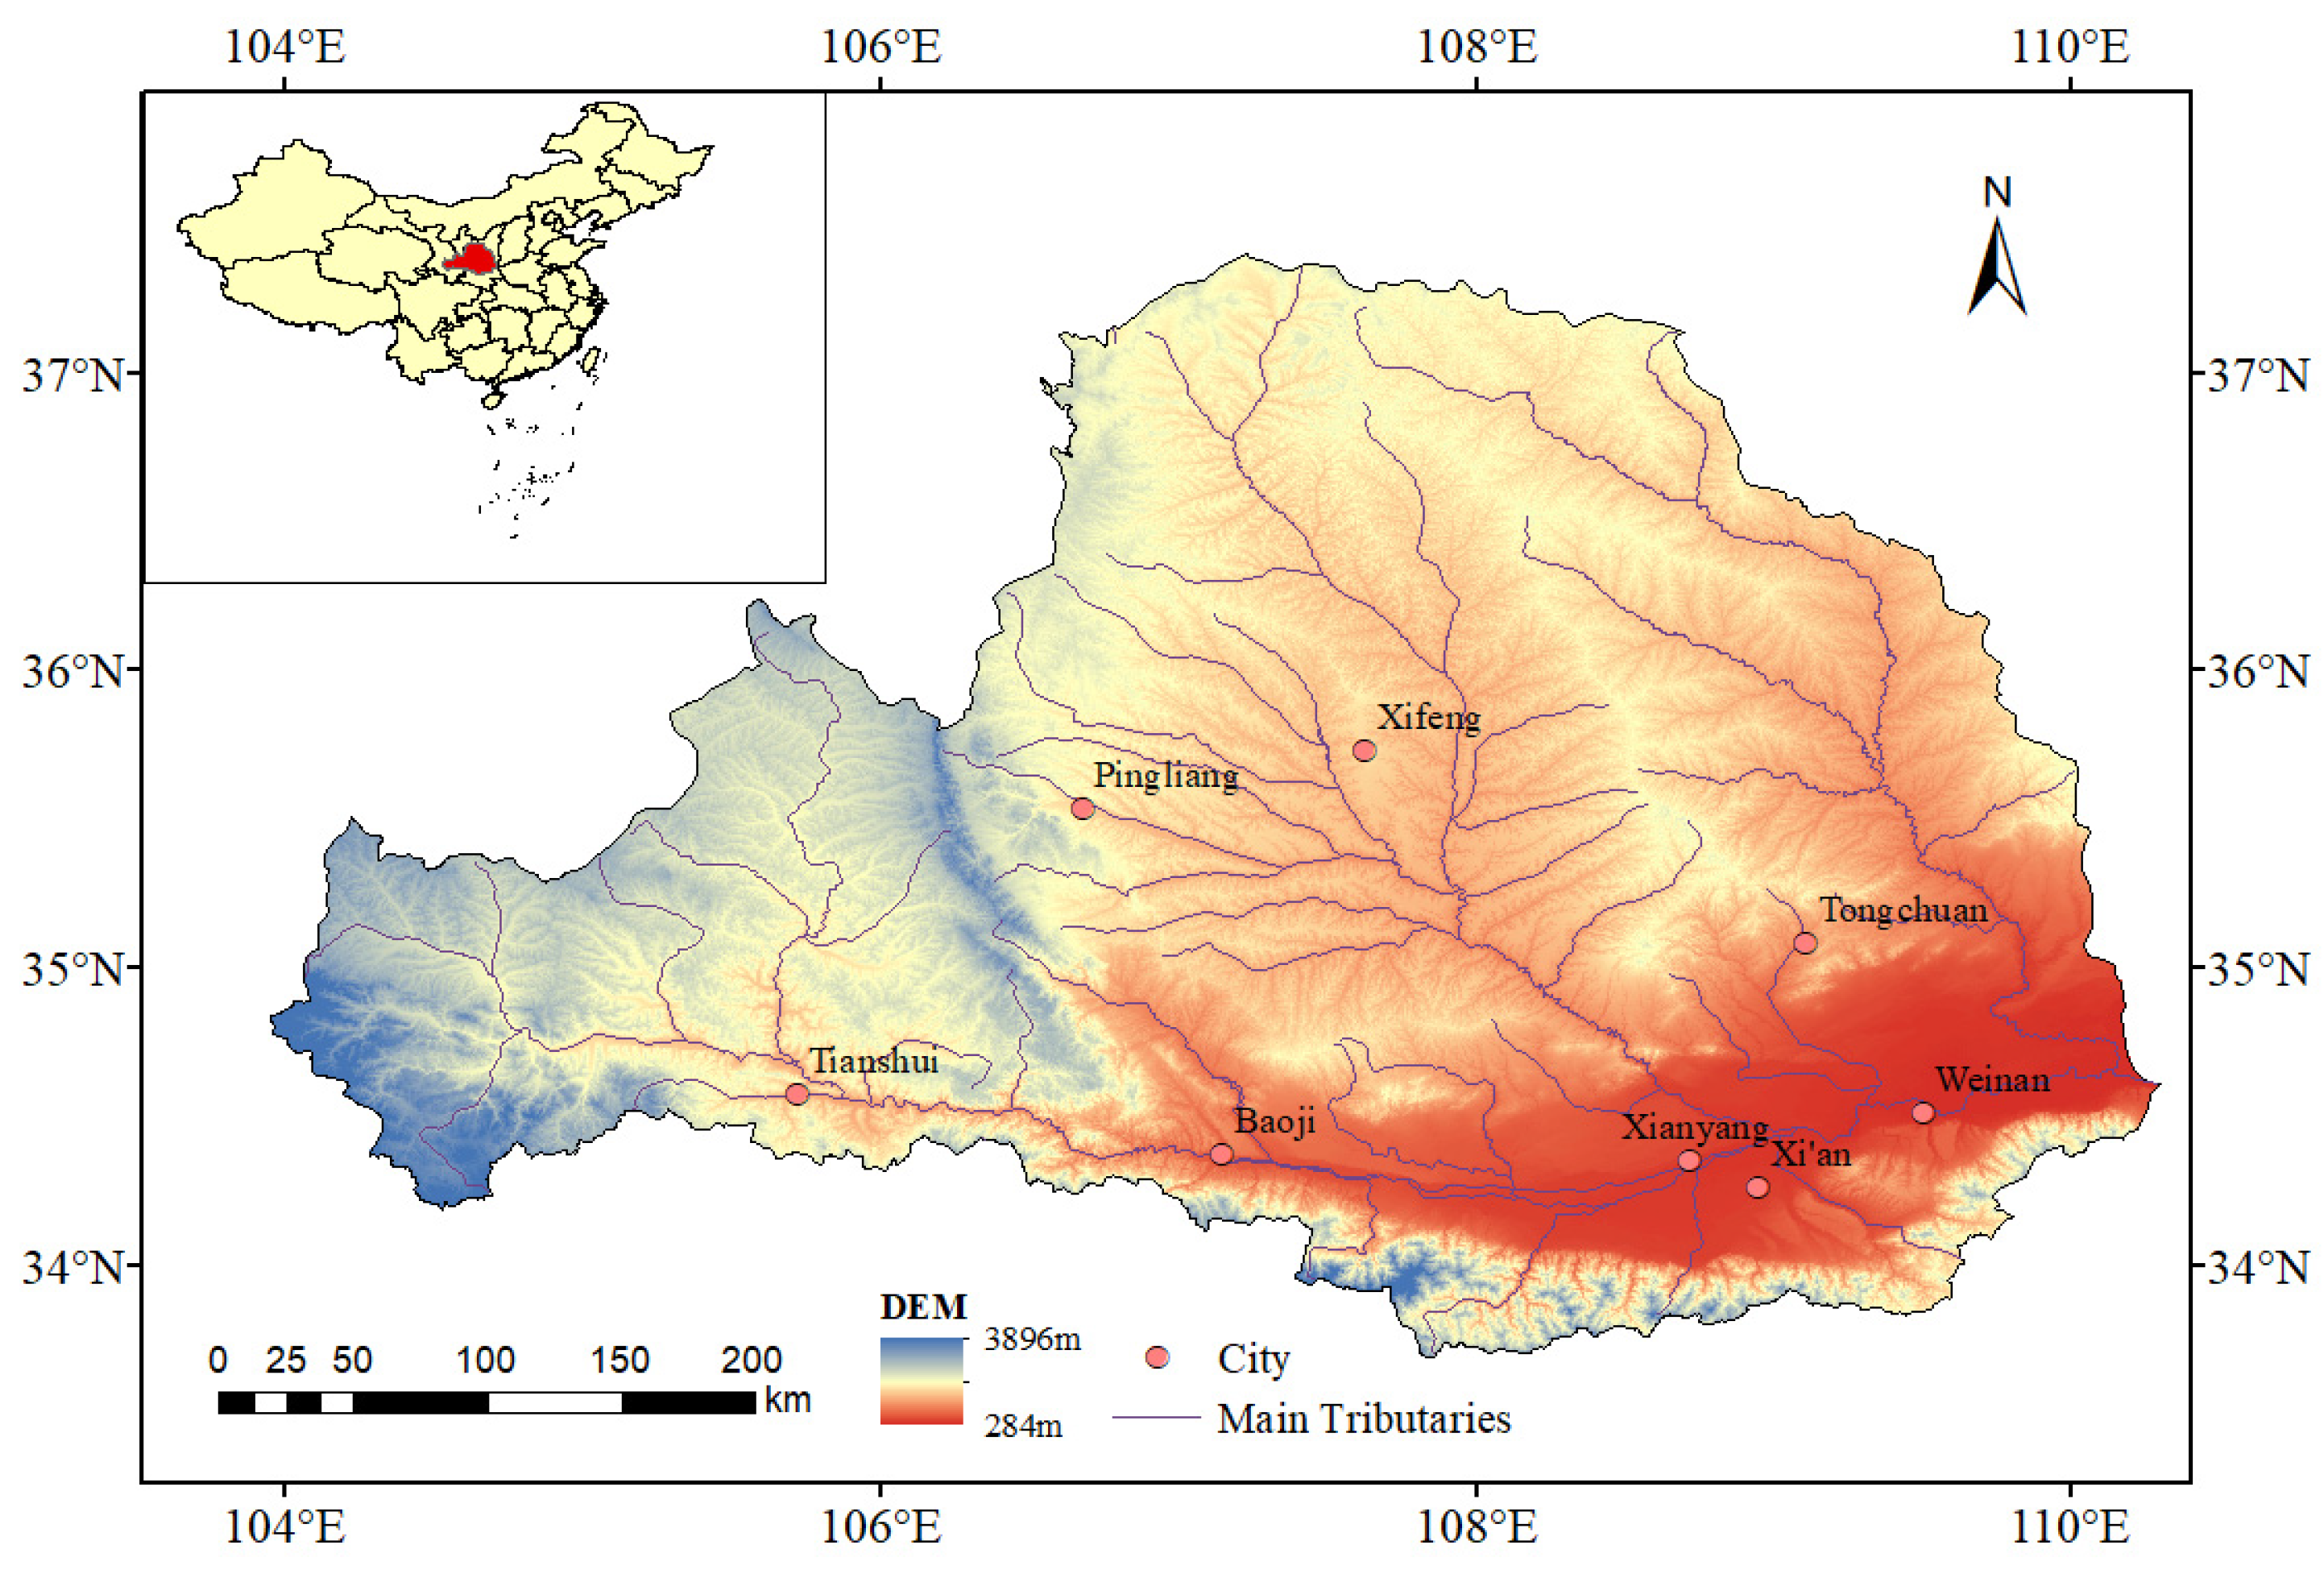
The Weihe River Basin (WRB) is the region where the Weihe River, the largest tributary of the Yellow River in China, is located. The Wei River originates in the Bird Rat Mountains of Gansu and flows through three provinces (autonomous regions) of Gansu, Ningxia, and Shaanxi [36], eventually injecting into the Yellow River. It is located between 33.5–37.5°N and 103.5–110.5°E, with a total area of nearly 1.35 × 10⁵ km2. The WRB can be divided into two parts: the western part is the Loess Hills and Gullies area, and the eastern part is the Guanzhong Plain area, with a high topography in the northwest and a low topography in the southeast. The topography of the watershed is high in the northwest and low in the southeast, and the mountains on both sides are tilted towards the mainstream of the Wei River. The area is characterized by severe soil erosion and fragile ecosystems. It is located in a semi-arid region with aridity and water scarcity, with a warm spring and little rain, hot and rainy summer with drought, a calm and wet autumn, and cold and dry winter with little rainfall [37]. The WRB is rich in vegetation resources and has a wide variety of vegetation types. Because most of the WRB has excellent conditions for agricultural production, cultivated plants are most widely distributed in the WRB, with an area of 83,500 km2, accounting for more than half of the total basin area [38]. The geographical location is shown in Figure 1.
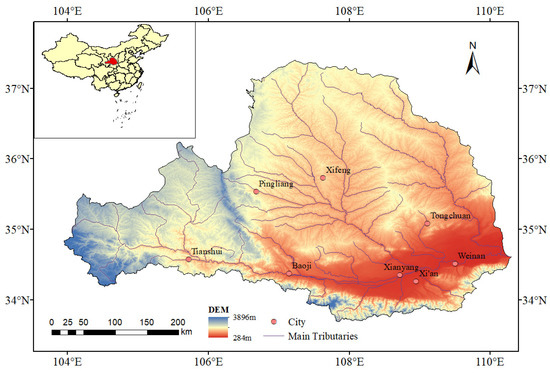
Figure 1.
The geographical location of the study area and some densely populated cities.
Human activities in the WRB have become increasingly widespread in recent decades. Surface water extraction and groundwater extraction have increased rapidly due to the increase in population, industry, and agricultural land area. As the economy is growing, agricultural activities are still increasing, which leads to an increase in agricultural water use. According to the statistics of the Ministry of Water Resources, in 2008, the irrigated area taken from WRB was about 9500 km2. Additionally, due to the water consumption of irrigated farmland, excessive irrigation directly reduces regional drainage [39]. In addition, about 130 reservoirs were built after 1949, with a total capacity of 1.67 billion m3 [40]. The construction of these reservoirs has led to an increase in evaporation due to the rising water surface area in the WRB, which has exacerbated the water shortage. With climate change, the water shortage in the WRB has become severe, and more severe drought events have occurred [41].
2.2. Datasets
The TWS was determined from the mass changes detected by the Gravity Recovery and Climate Experiment (GRACE) satellite [42], while the GRACE and GRACE-FO data were obtained from ICGEM (http://icgem.gfz-potsdam.de/series/10.5067/GFL20-MC060, accessed on 7 November 2021.) release of UTCSR monthly gravity field data, selected for the time period April 2002 to May 2020. The data are all GSM model data from RL06 [43], where the accuracy of the C20 term coefficients is very low, and the corresponding coefficients of the original data need to be replaced using the C20 term coefficients provided by the Global Satellite Laser Ranging System [44]. The sliding polynomial method of Swenson et al. [45] is used to decorrelate the data, and the Gaussian filter with a smooth radius of 300 km is used to denoise the data. The spatial resolution of the final terrestrial water storage is 0.25° × 0.25°. There also are some missing data in the GRACE dataset, and the missing data in these months are filled by the dataset of reconstructed terrestrial water storage change in China based on precipitation by Zhong et al. [46,47].
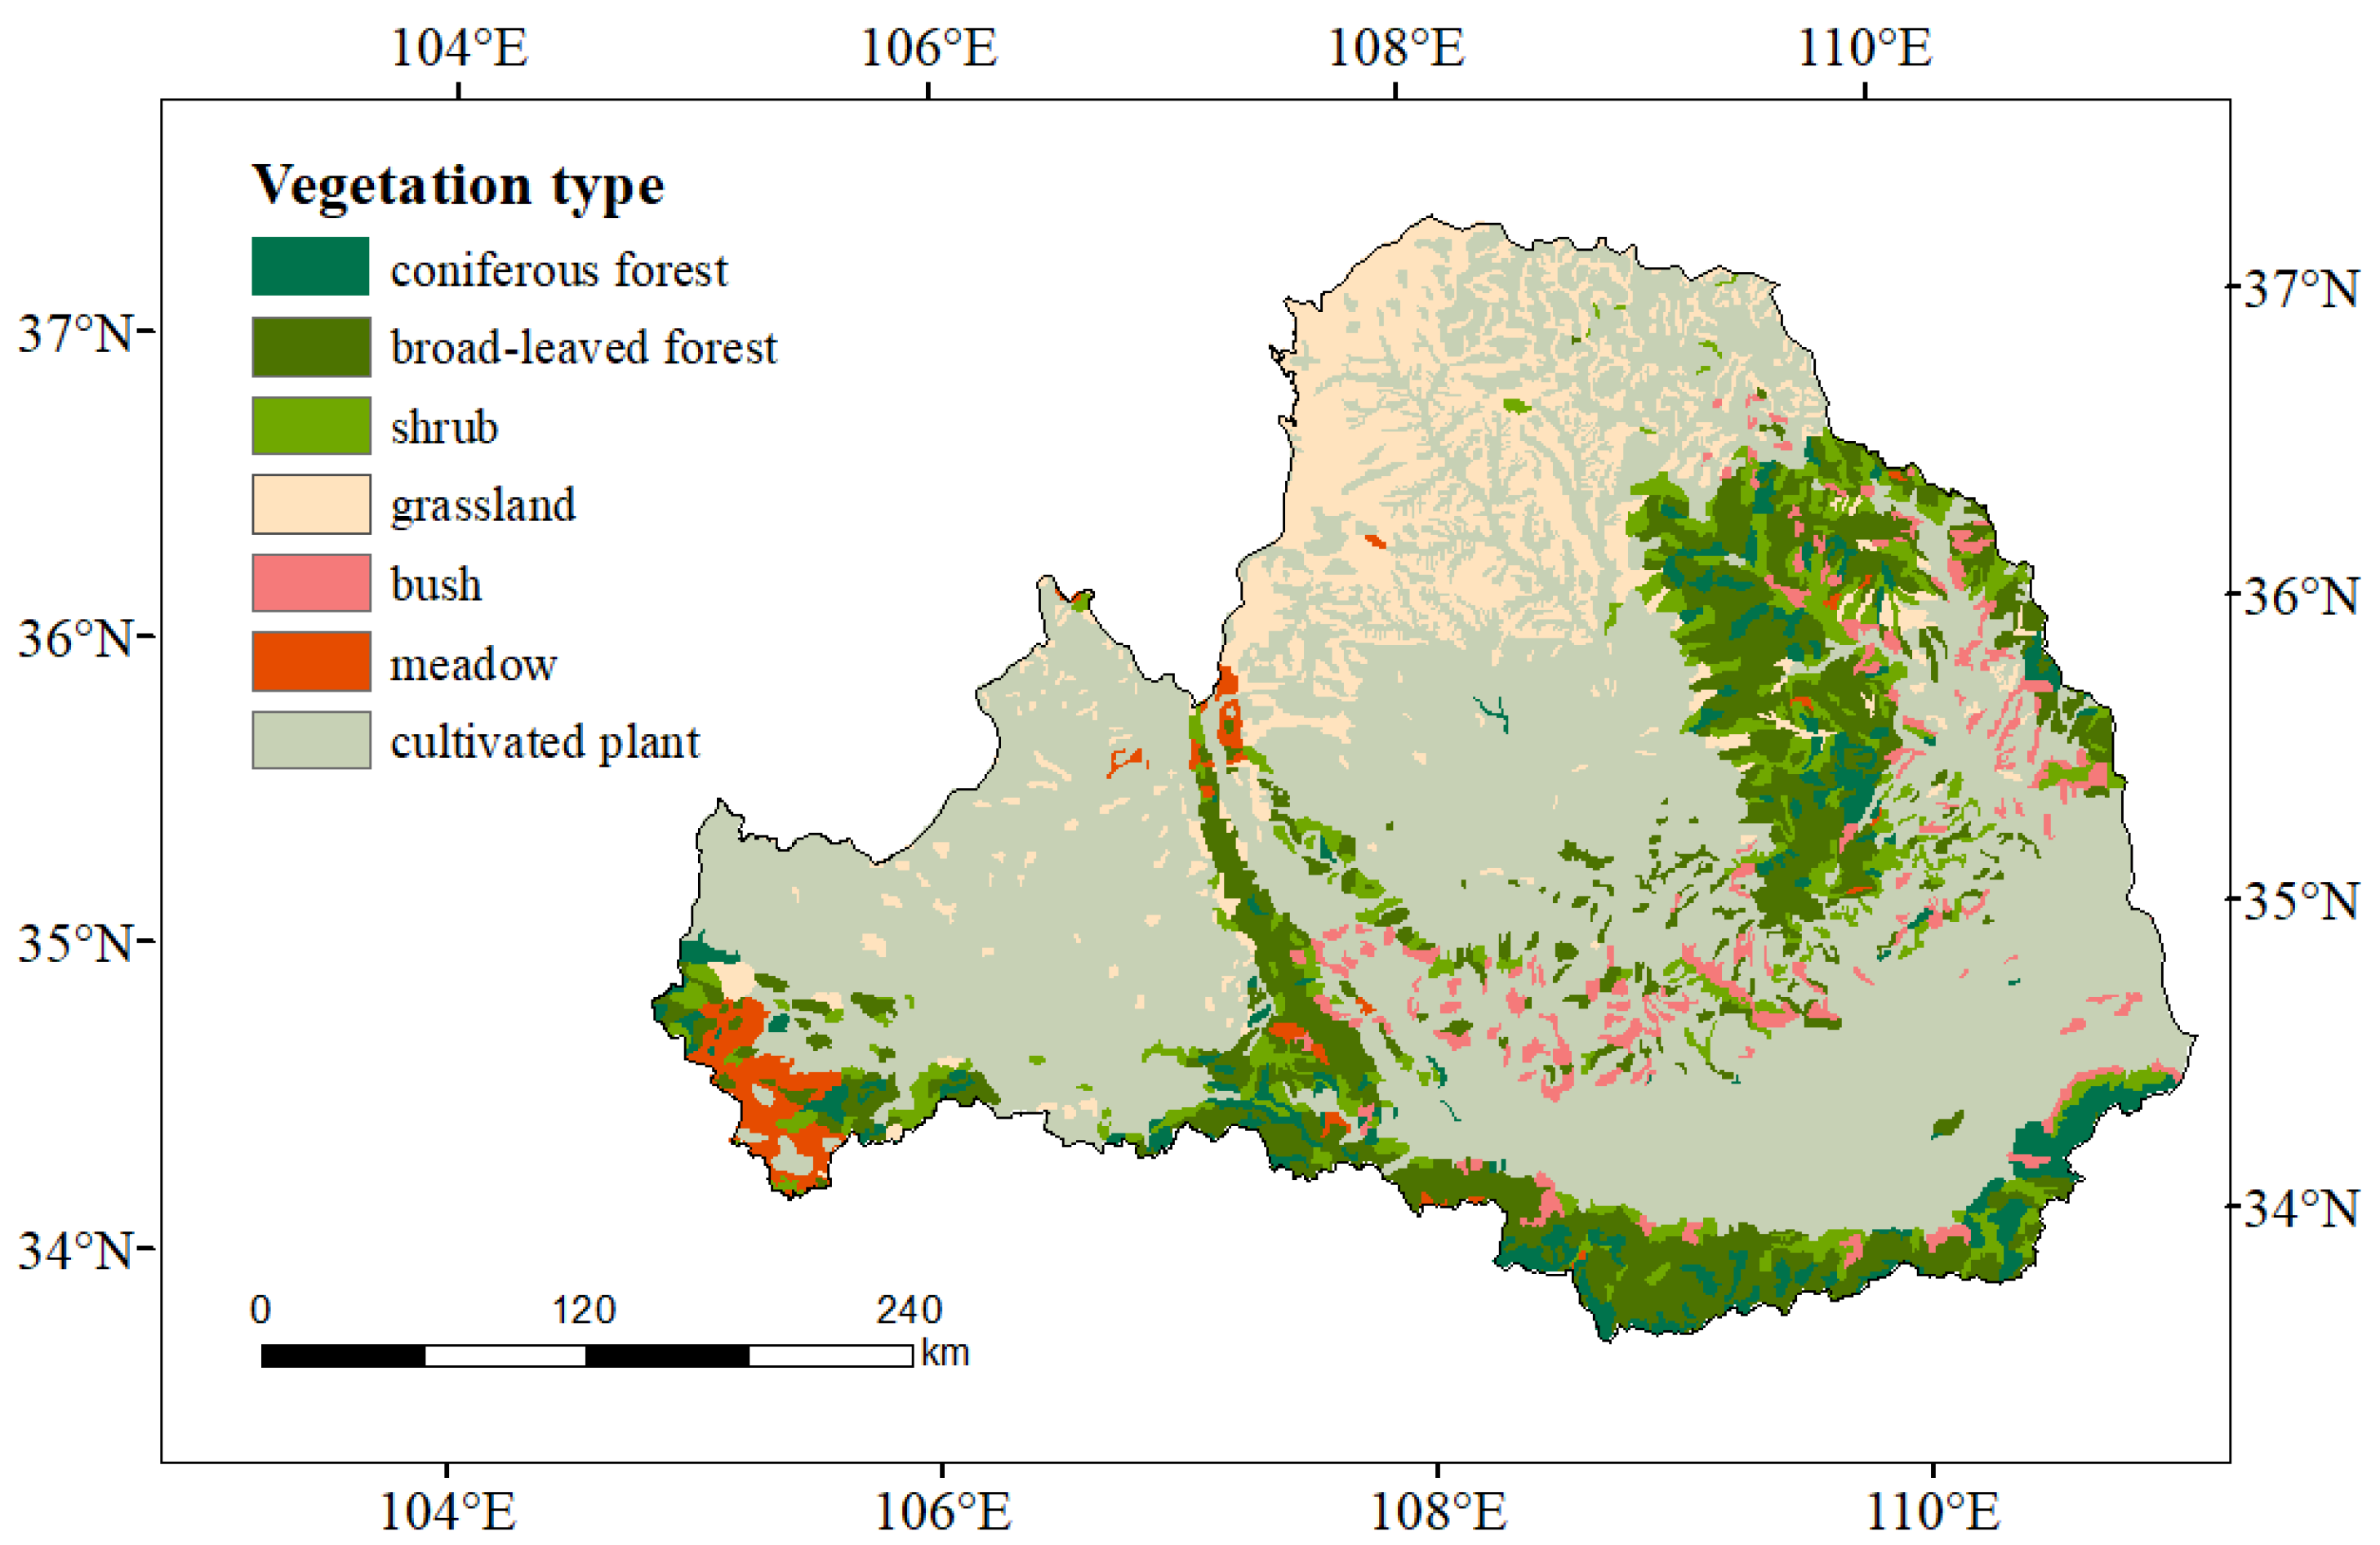
The NDVI data selected in this paper are MOD13A3 data of the same period as GRACE data, which are obtained from the NASA website with a temporal resolution of one month and a spatial resolution of 1000 m. The data were rescaled using the resampling tool in ArcGIS to match the GRACE cell size. MODIS-NDVI products are data that have been processed for water, cloud, and heavy aerosol data processing, so its data products have certain quality assurance. Because MODIS-NDVI products are widely used in research fields such as regional vegetation cover change [37]. The WRB vegetation type data are obtained from the Data Center for Resource and Environmental Sciences of the Chinese Academy of Sciences, as shown in Figure 2.
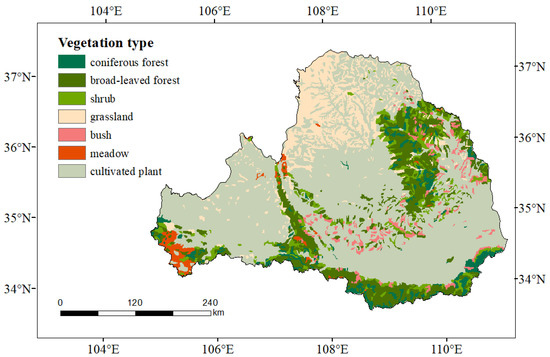
Figure 2.
Vegetation types in WRB.
Precipitation, evapotranspiration, and temperature data are from the 5th generation reanalysis data ERA5-Land, one of the most advanced reanalysis data officially released by the European Centre for Medium-Range Weather Forecasts (ECMWF) in 2019. Its spatial resolution is 0.1° × 0.1°and the time resolution is one month. Its time coverage is from 1950 to now. The data can be downloaded from the official website (https://cds.climate.copernicus.eu/cdsapp#!/home, accessed on 5 July 2022).
3. Method
3.1. Trend Analysis
Trend analysis is a method that reflects the direction and rate of NDVI change by performing linear regression analysis on variables that change over time, thereby predicting their trends. The calculation formula for trend analysis is as follows [48]:
where is the gradient of the image regression equation, is the mean NDVI in the first year of , and is the length of time of the study. When , NDVI tends to increase; when , NDVI tends to decrease.
3.2. F Test
To further evaluate the vegetation change status, the F-test was used to analyze the significance of NDVI change trends and indicate the level of confidence in the trend change.
where is the study time series, is the error sum of squares, is the regression sum of squares, is the fitted regression value, is the value of , and is the mean of . The sample size in this study is 19, and the significance levels of and are selected. and are obtained by checking the table. Based on the obtained values of and , the spatial trends of NDVI were classified into the following six levels [49], i.e., slowly decrease , significantly decrease , extremely significant decrease , slowly increase , significantly increase , and extremely significant increase .
3.3. Correlation Analysis
The Pearson correlation analysis is a method to study the degree of correlation between elements. By calculating the correlation coefficient R between water storage and NDVI, it can effectively point out the degree of influence between the two. The range of R is [−1, 1]. If R > 0, the two are positively correlated. If R < 0, the two are negatively correlated. If R = 0, there is no linear correlation. The formula for calculating the Pearson correlation coefficient of variables and is as follows.
where is the sample size; and are the values of the two variables and for the first year ; and are the mean values of and .
3.4. Calculation Method of Water Storage Change Based on GRACE/GRACE-FO Data
In the time-varying gravity level data of GRACE/GRACE-FO, tidal effects (including ocean tides, solid tides, and polar tides generated by the Earth rotation) and non-tidal effects have been deducted in the GRACE/GRACE-FO data processing. Therefore, except for the calculation error of the gravity level model and the model error of atmospheric and marine tides, the GRACE/GRACE-FO time-varying gravity field reflects the mass change of non-atmospheric and oceanic parts, i.e., the change of land water volume. The basic equation for the inversion of surface mass redistribution from time-varying gravity levels is as follows [50]:
In the above equation, is the radius of the Earth, is the mean density of the Earth, and are the geocentric colatitude and longitude, and are the degree and order of the spherical harmonic expansion, is load Love numbers of the solid earth, is the variation of the surface density of the surface material, and are the variations of the Stokes coefficient, is fully normalized Legendre function of degree l and order m.
The land surface mass change can be expressed in terms of Equivalent Water Height (EWH), i.e., converting the mass change to water height change :
In the absence of violent crustal movements such as earthquakes, we can approximate that the change in the Earth’s land surface mass is caused by the change in water storage [51], so the change in land water storage can be calculated from Equation (9).
4. Results and Analysis
4.1. Spatial and Temporal Characteristics of Interannual Vegetation NDVI
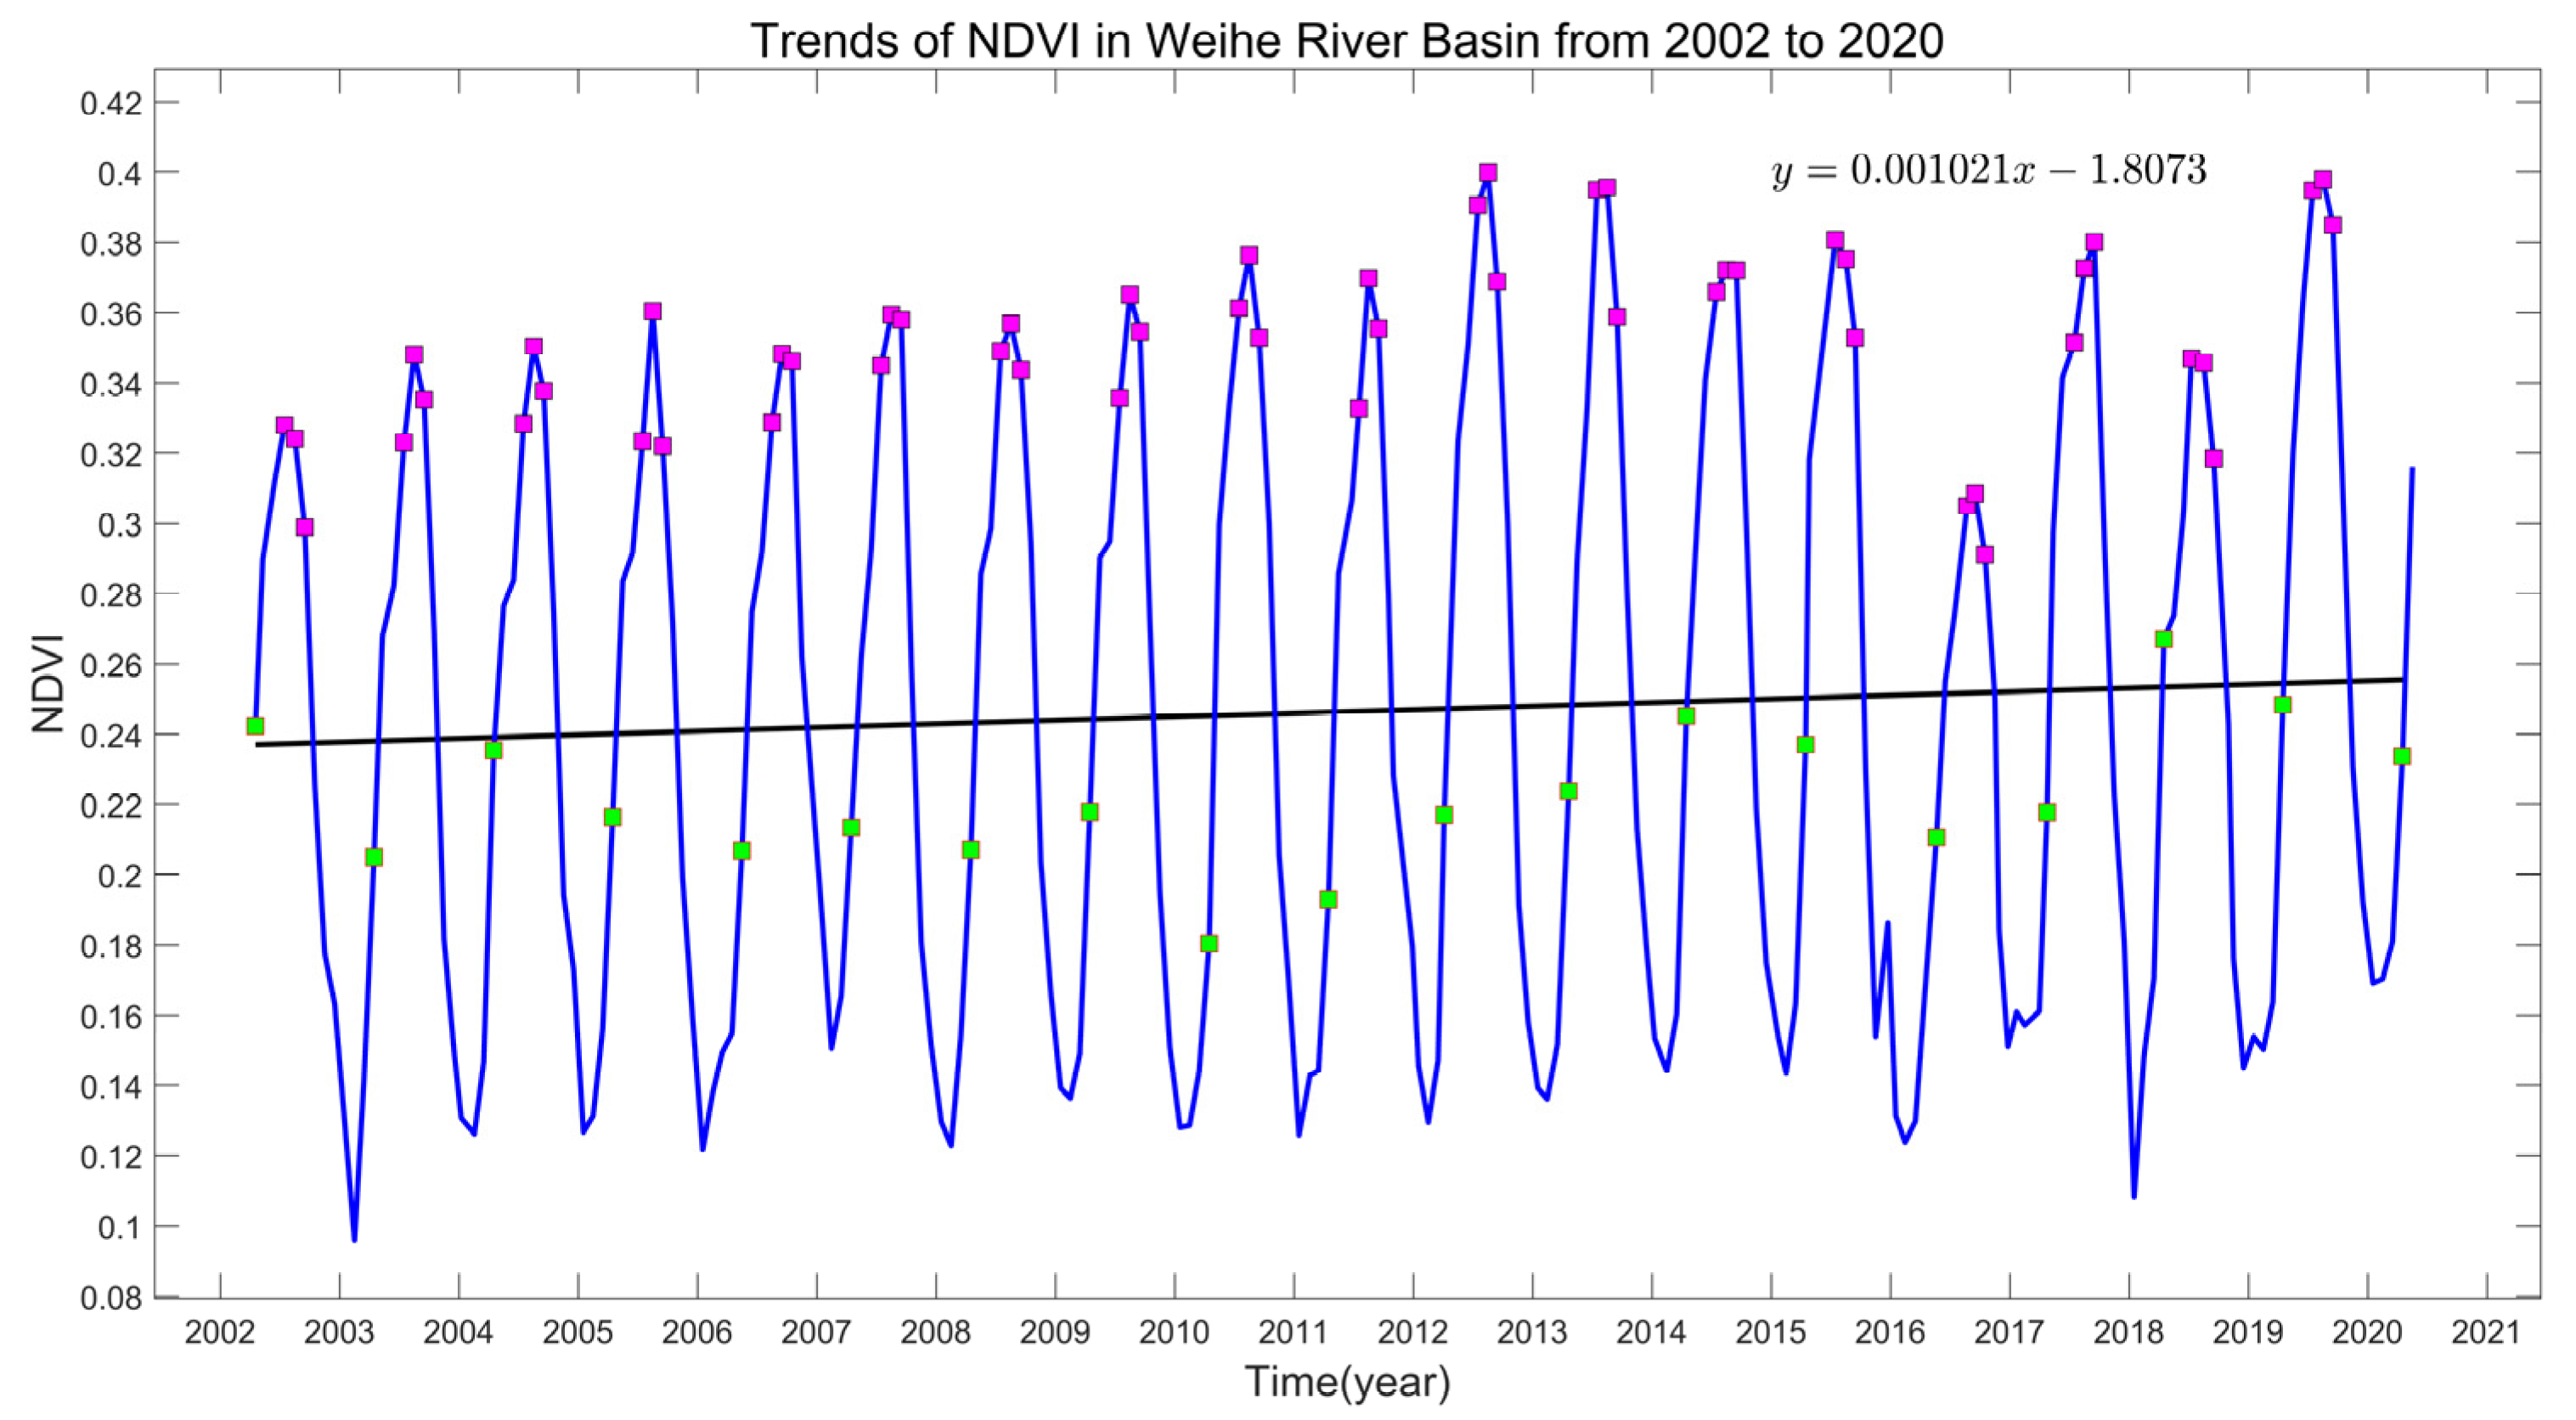
By averaging the NDVI values for each month in the WRB from 2002 to 2020 to represent the average NDVI level for that month, we obtained the NDVI time series variation graph (i.e., Figure 3). We can know that NDVI shows strong seasonal characteristics with significant intra-annual variation, starting roughly from April when the NDVI starts to return to green, almost peaking in July, August, and September, and then starting to decline after that. On the whole, it shows a slight upward trend.
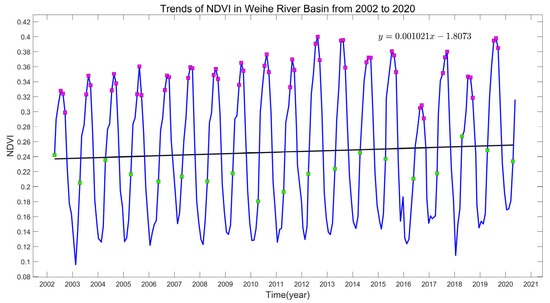
Figure 3.
Time series of NDVI changes (Green rectangles indicate NDVI values for April and purple rectangles indicate NDVI values for July, August, and September).
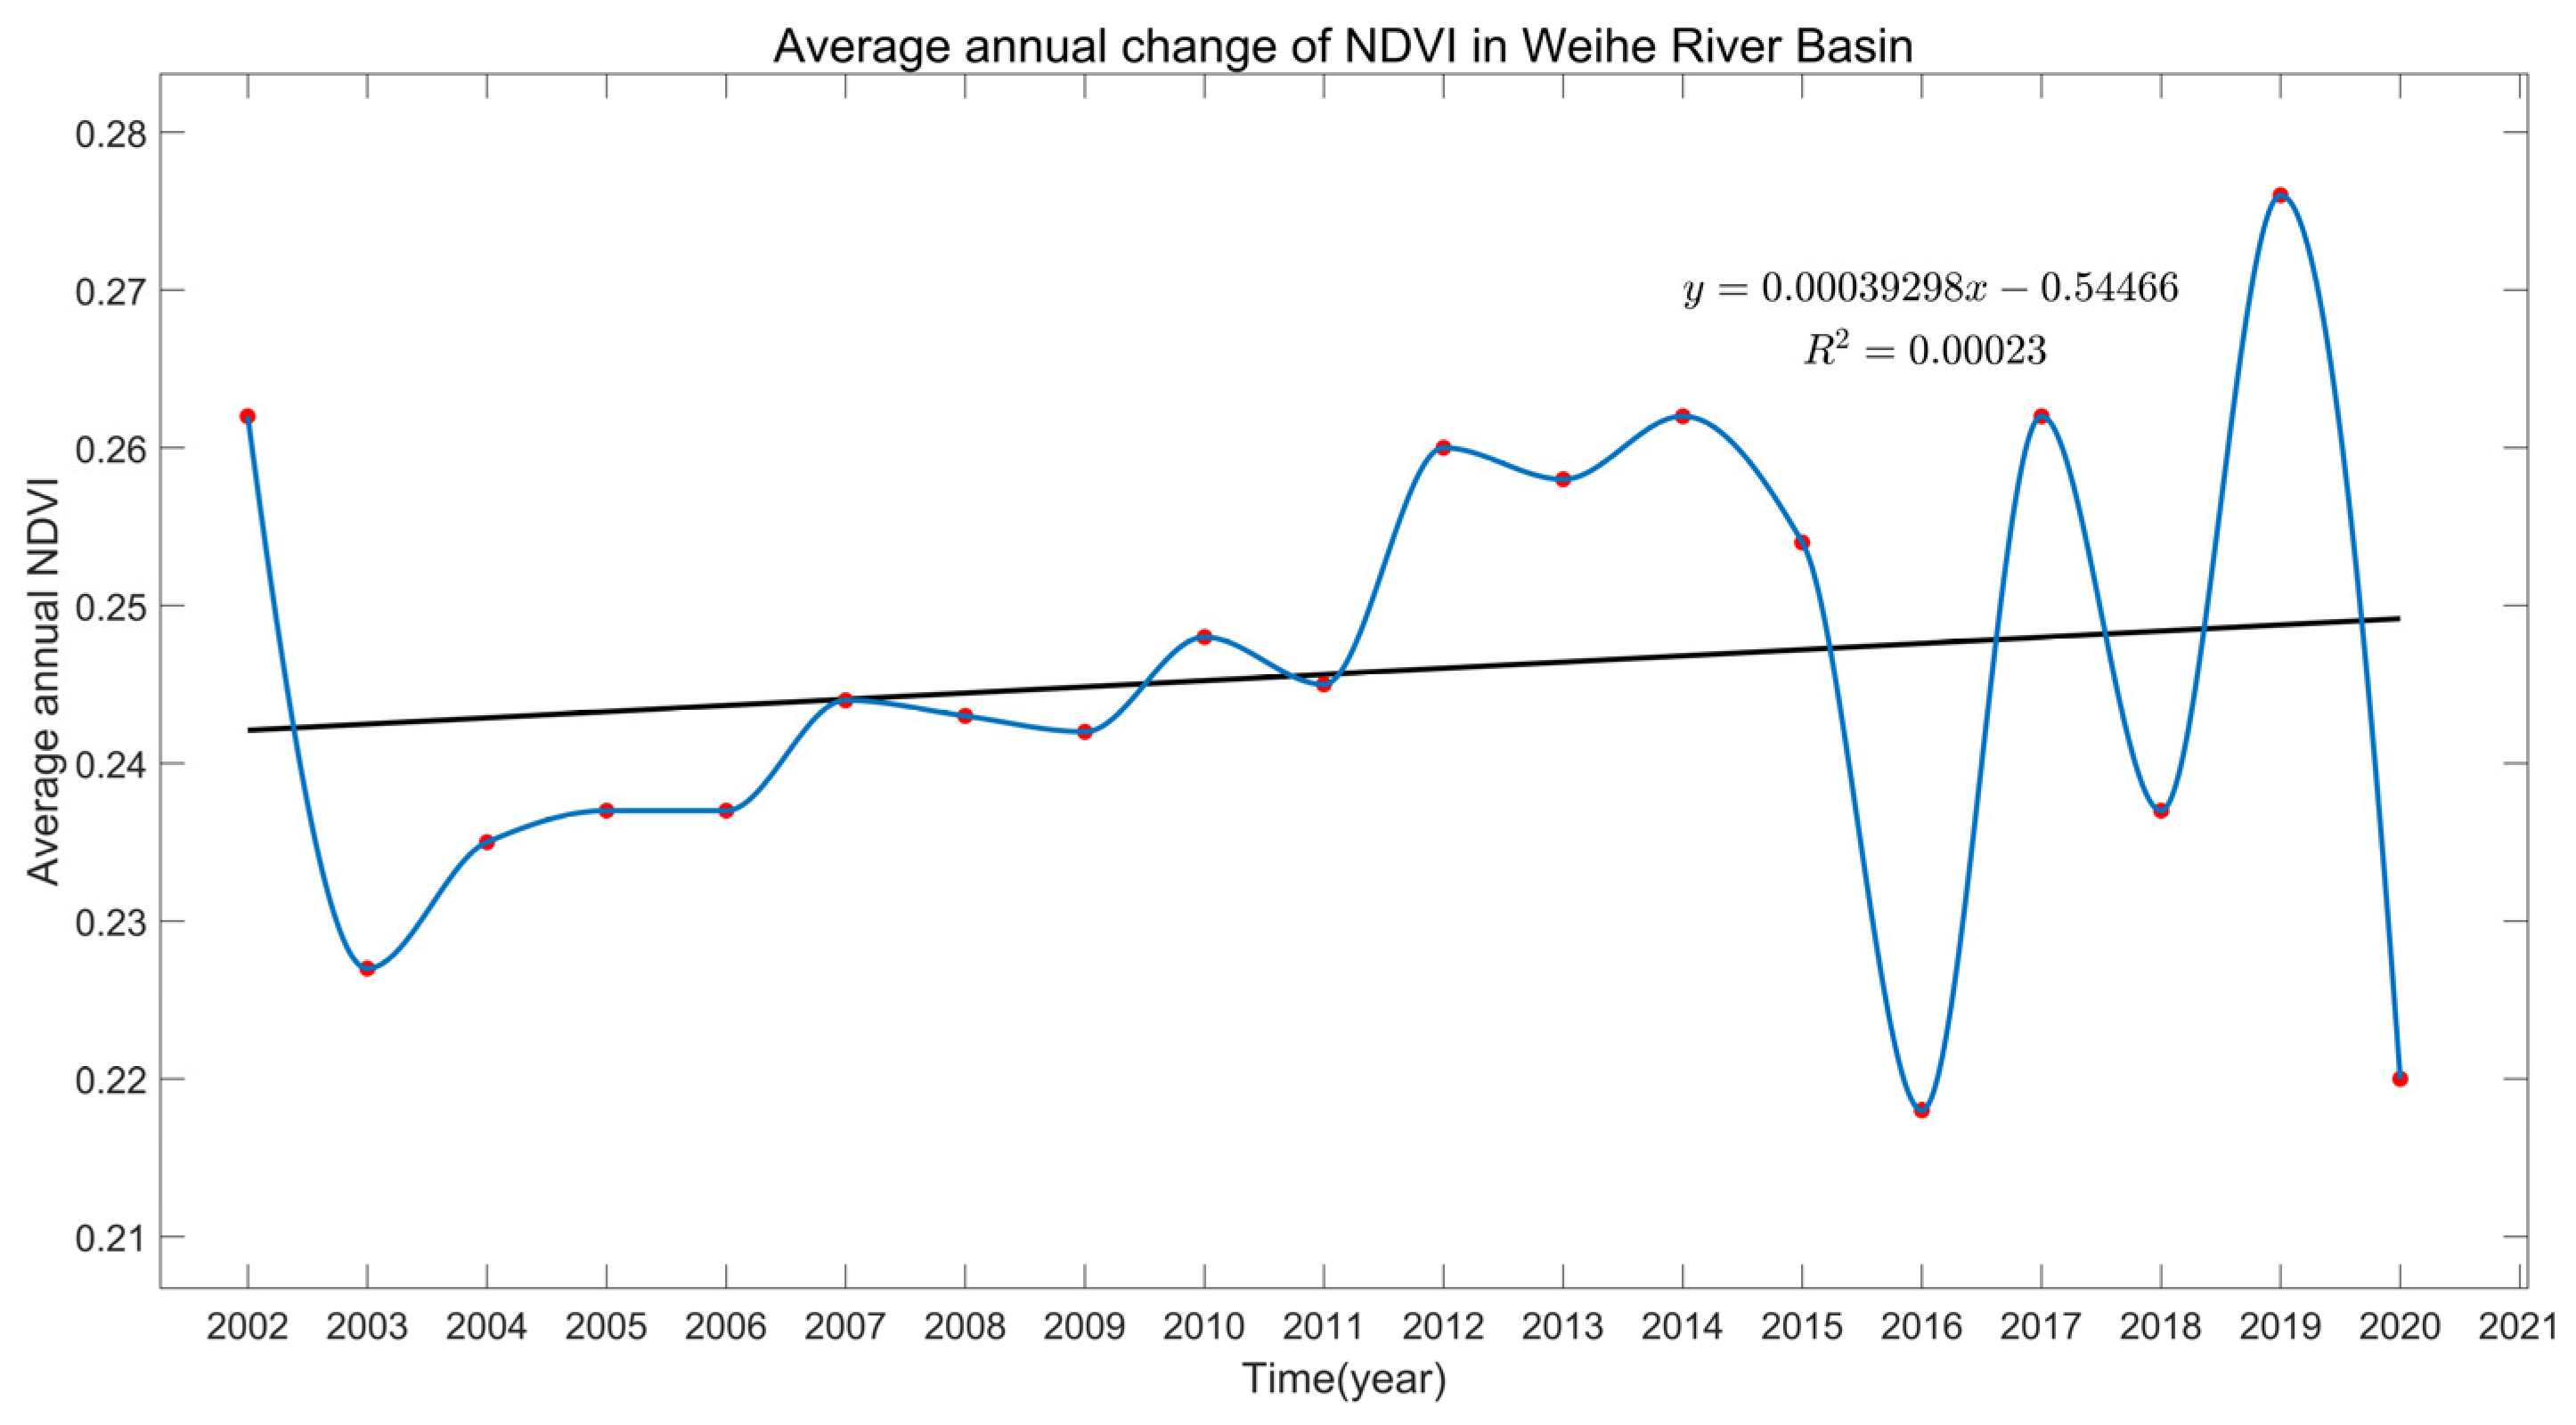
The interannual variation of the average NDVI in WRB is shown in Figure 4. The interannual variation of NDVI in the region during the study period shows a weak greening trend and the distribution of NDVI ranges from 0.214 to 0.262, with an annual average NDVI of 0.245. In addition, there was a big browning trend from 2002 to 2003, and then there was a greening trend from then until 2014, and then there was a big fluctuation after 2014, and the trend was down-up down.
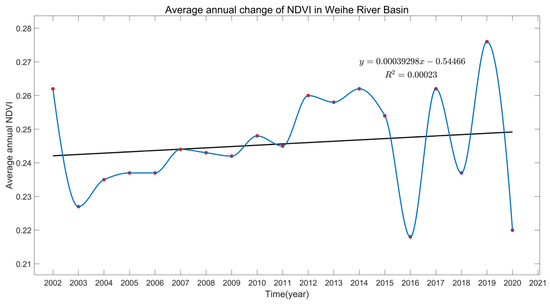
Figure 4.
Annual average NDVI changes.
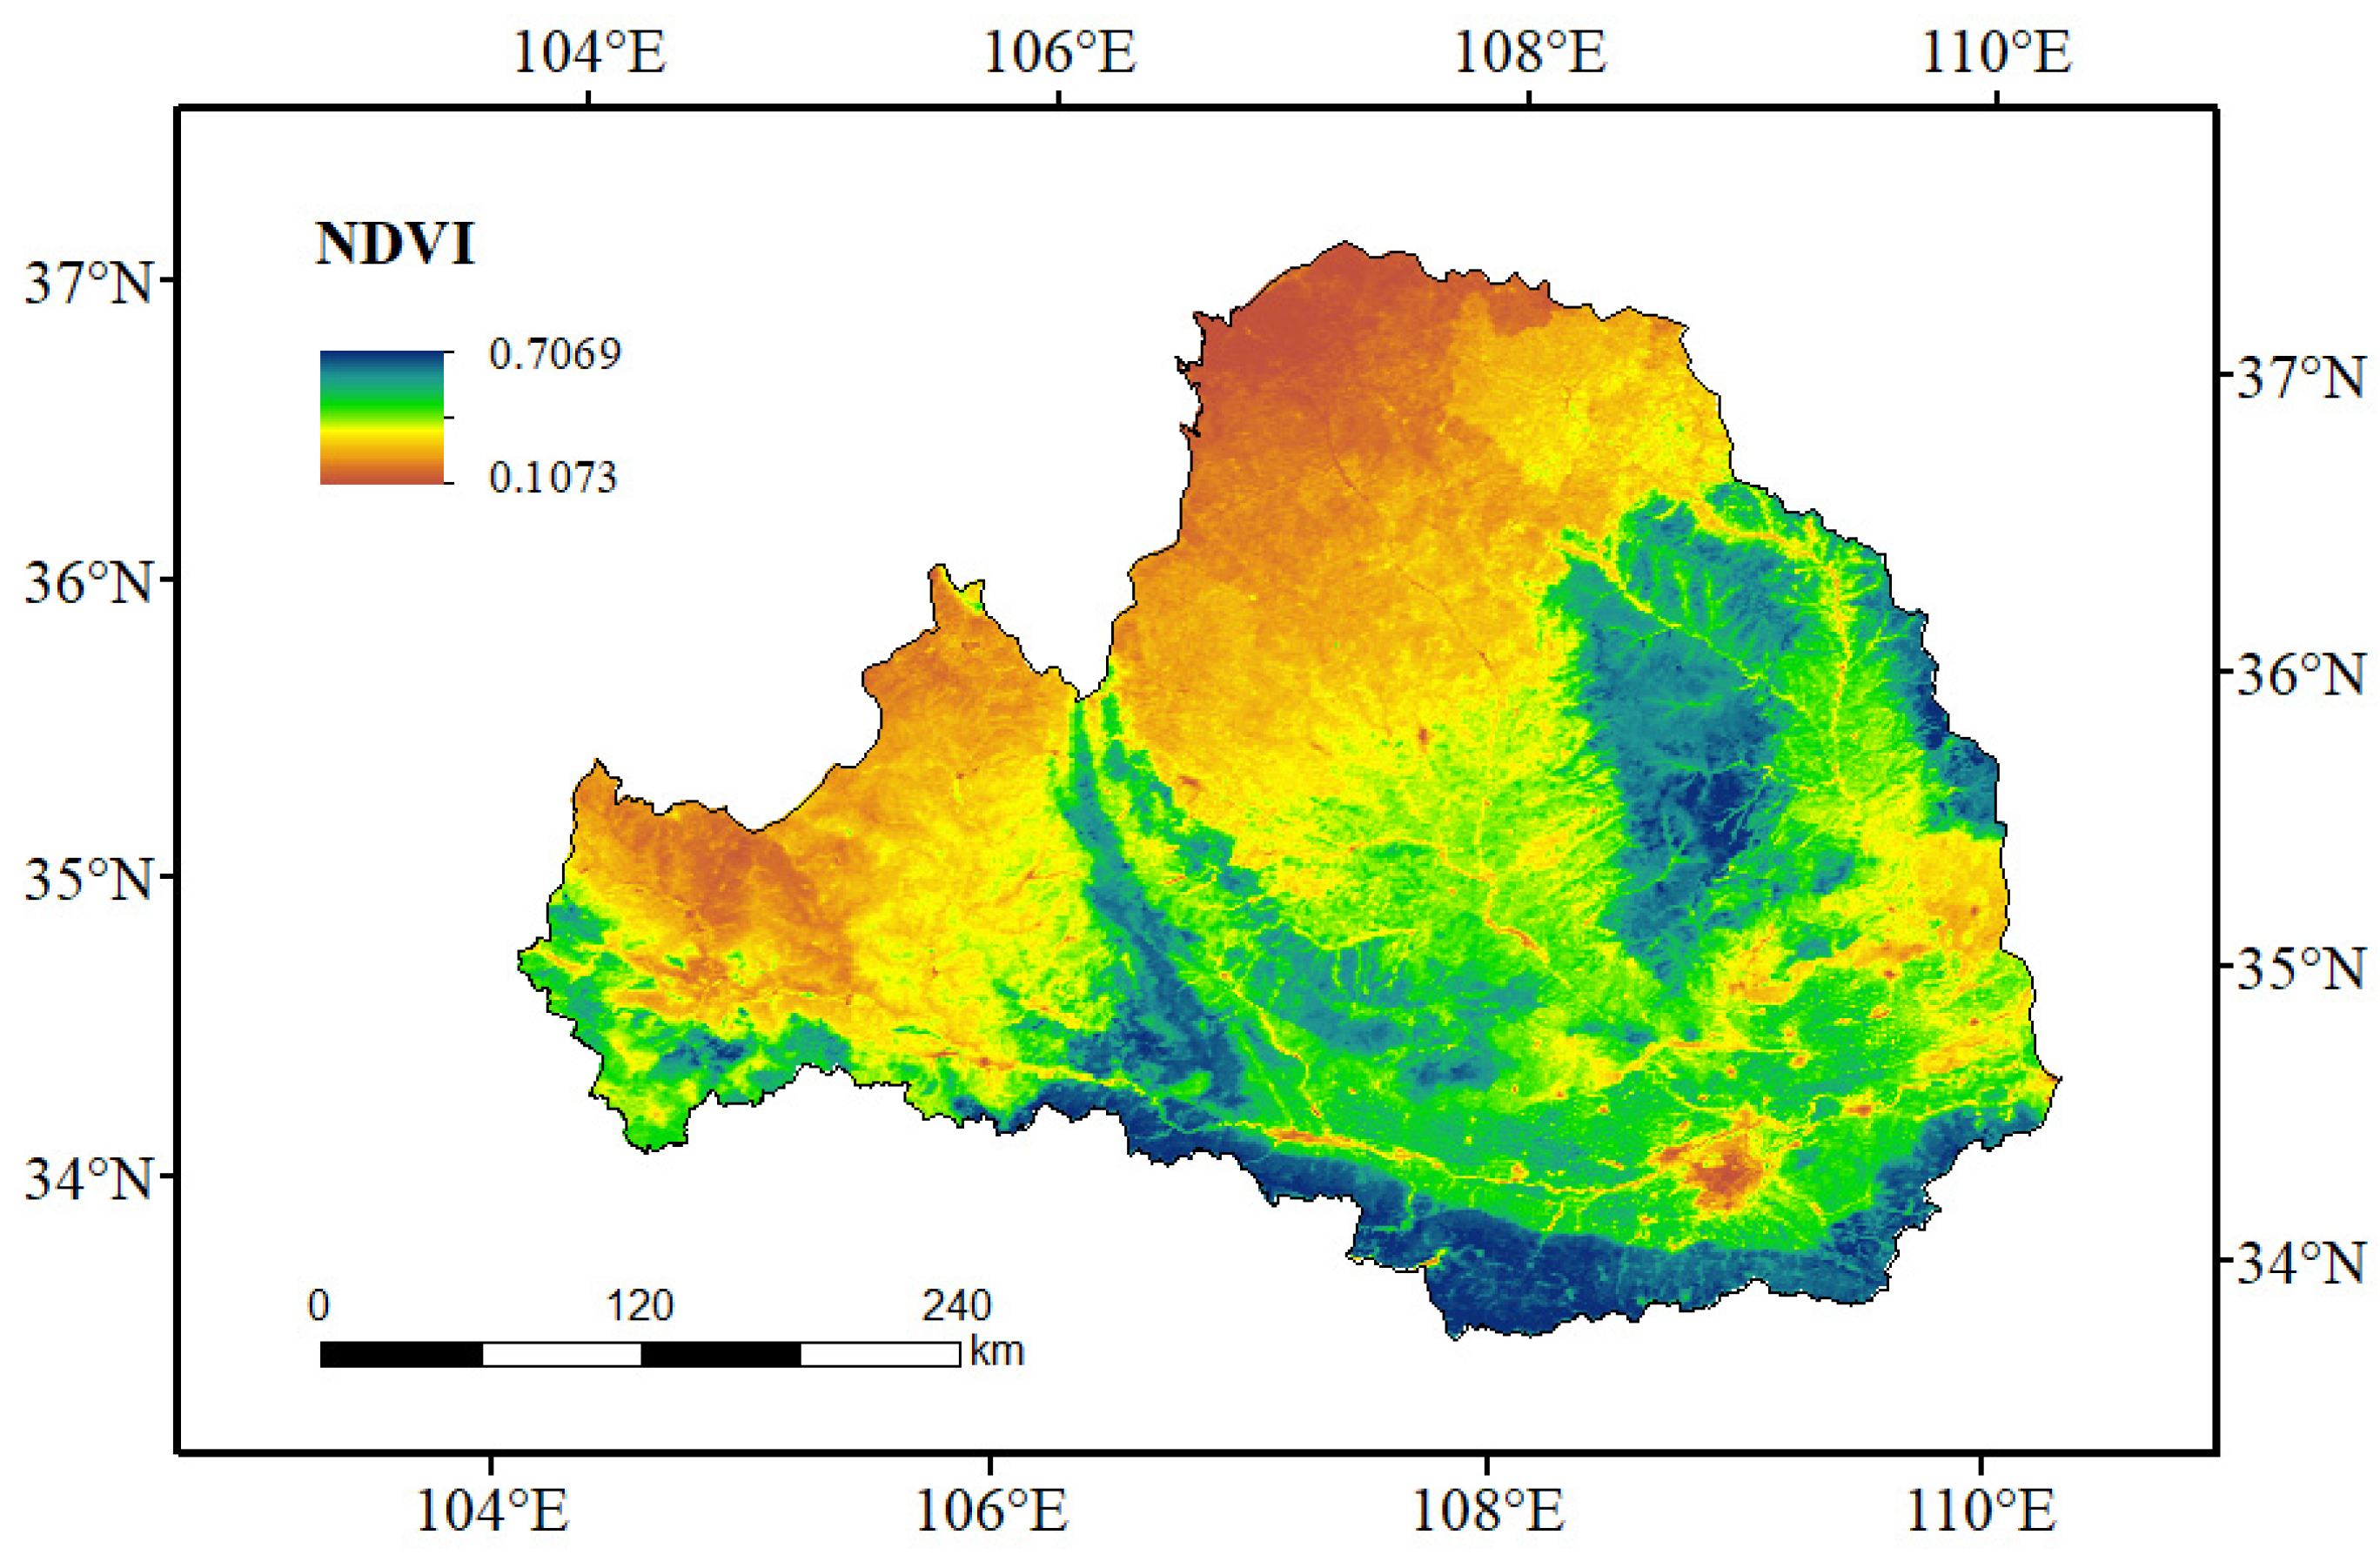
The average annual NDVI of WRB is shown in Figure 5. The spatial NDVI in the WRB varies widely, ranging from 0.1073 to 0.7069, with higher NDVI values in the south and smaller NDVI values in the northwest, gradually increasing from northwest to southeast. Geographically, the NDVI presents characteristics that are more consistent with the geographical characteristics. The mountainous areas such as the northern Qinling Mountains, Liupan Mountains, Ziwu Mountains, and Huanglong Mountains have dense forests and high vegetation coverage, so the NDVI in these areas is more prominent, generally greater than 0.6. The NDVI in the Guanzhong Plain is between 0.3 and 0.6, and the vegetation types in this area are more comprehensive. At the same time, agricultural land accounts for most of the land, so the NDVI value is in the middle position. Along the WRB, some areas are densely populated urban areas, which are affected by human activities, so the NDVI value of this area is low. In the northwest region, this area is a gully area of the Loess Plateau, with low vegetation cover and a few grassland types, so the NDVI is generally less than 0.2.
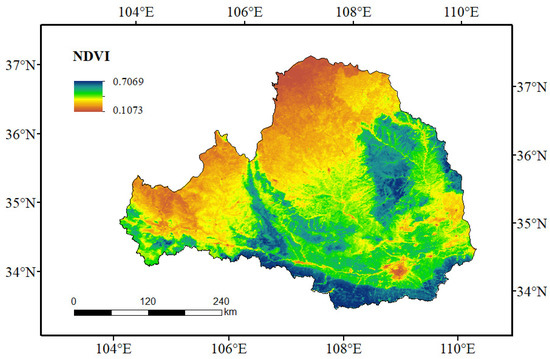
Figure 5.
Spatial distribution of annual average NDVI in the WRB from 2002 to 2020.
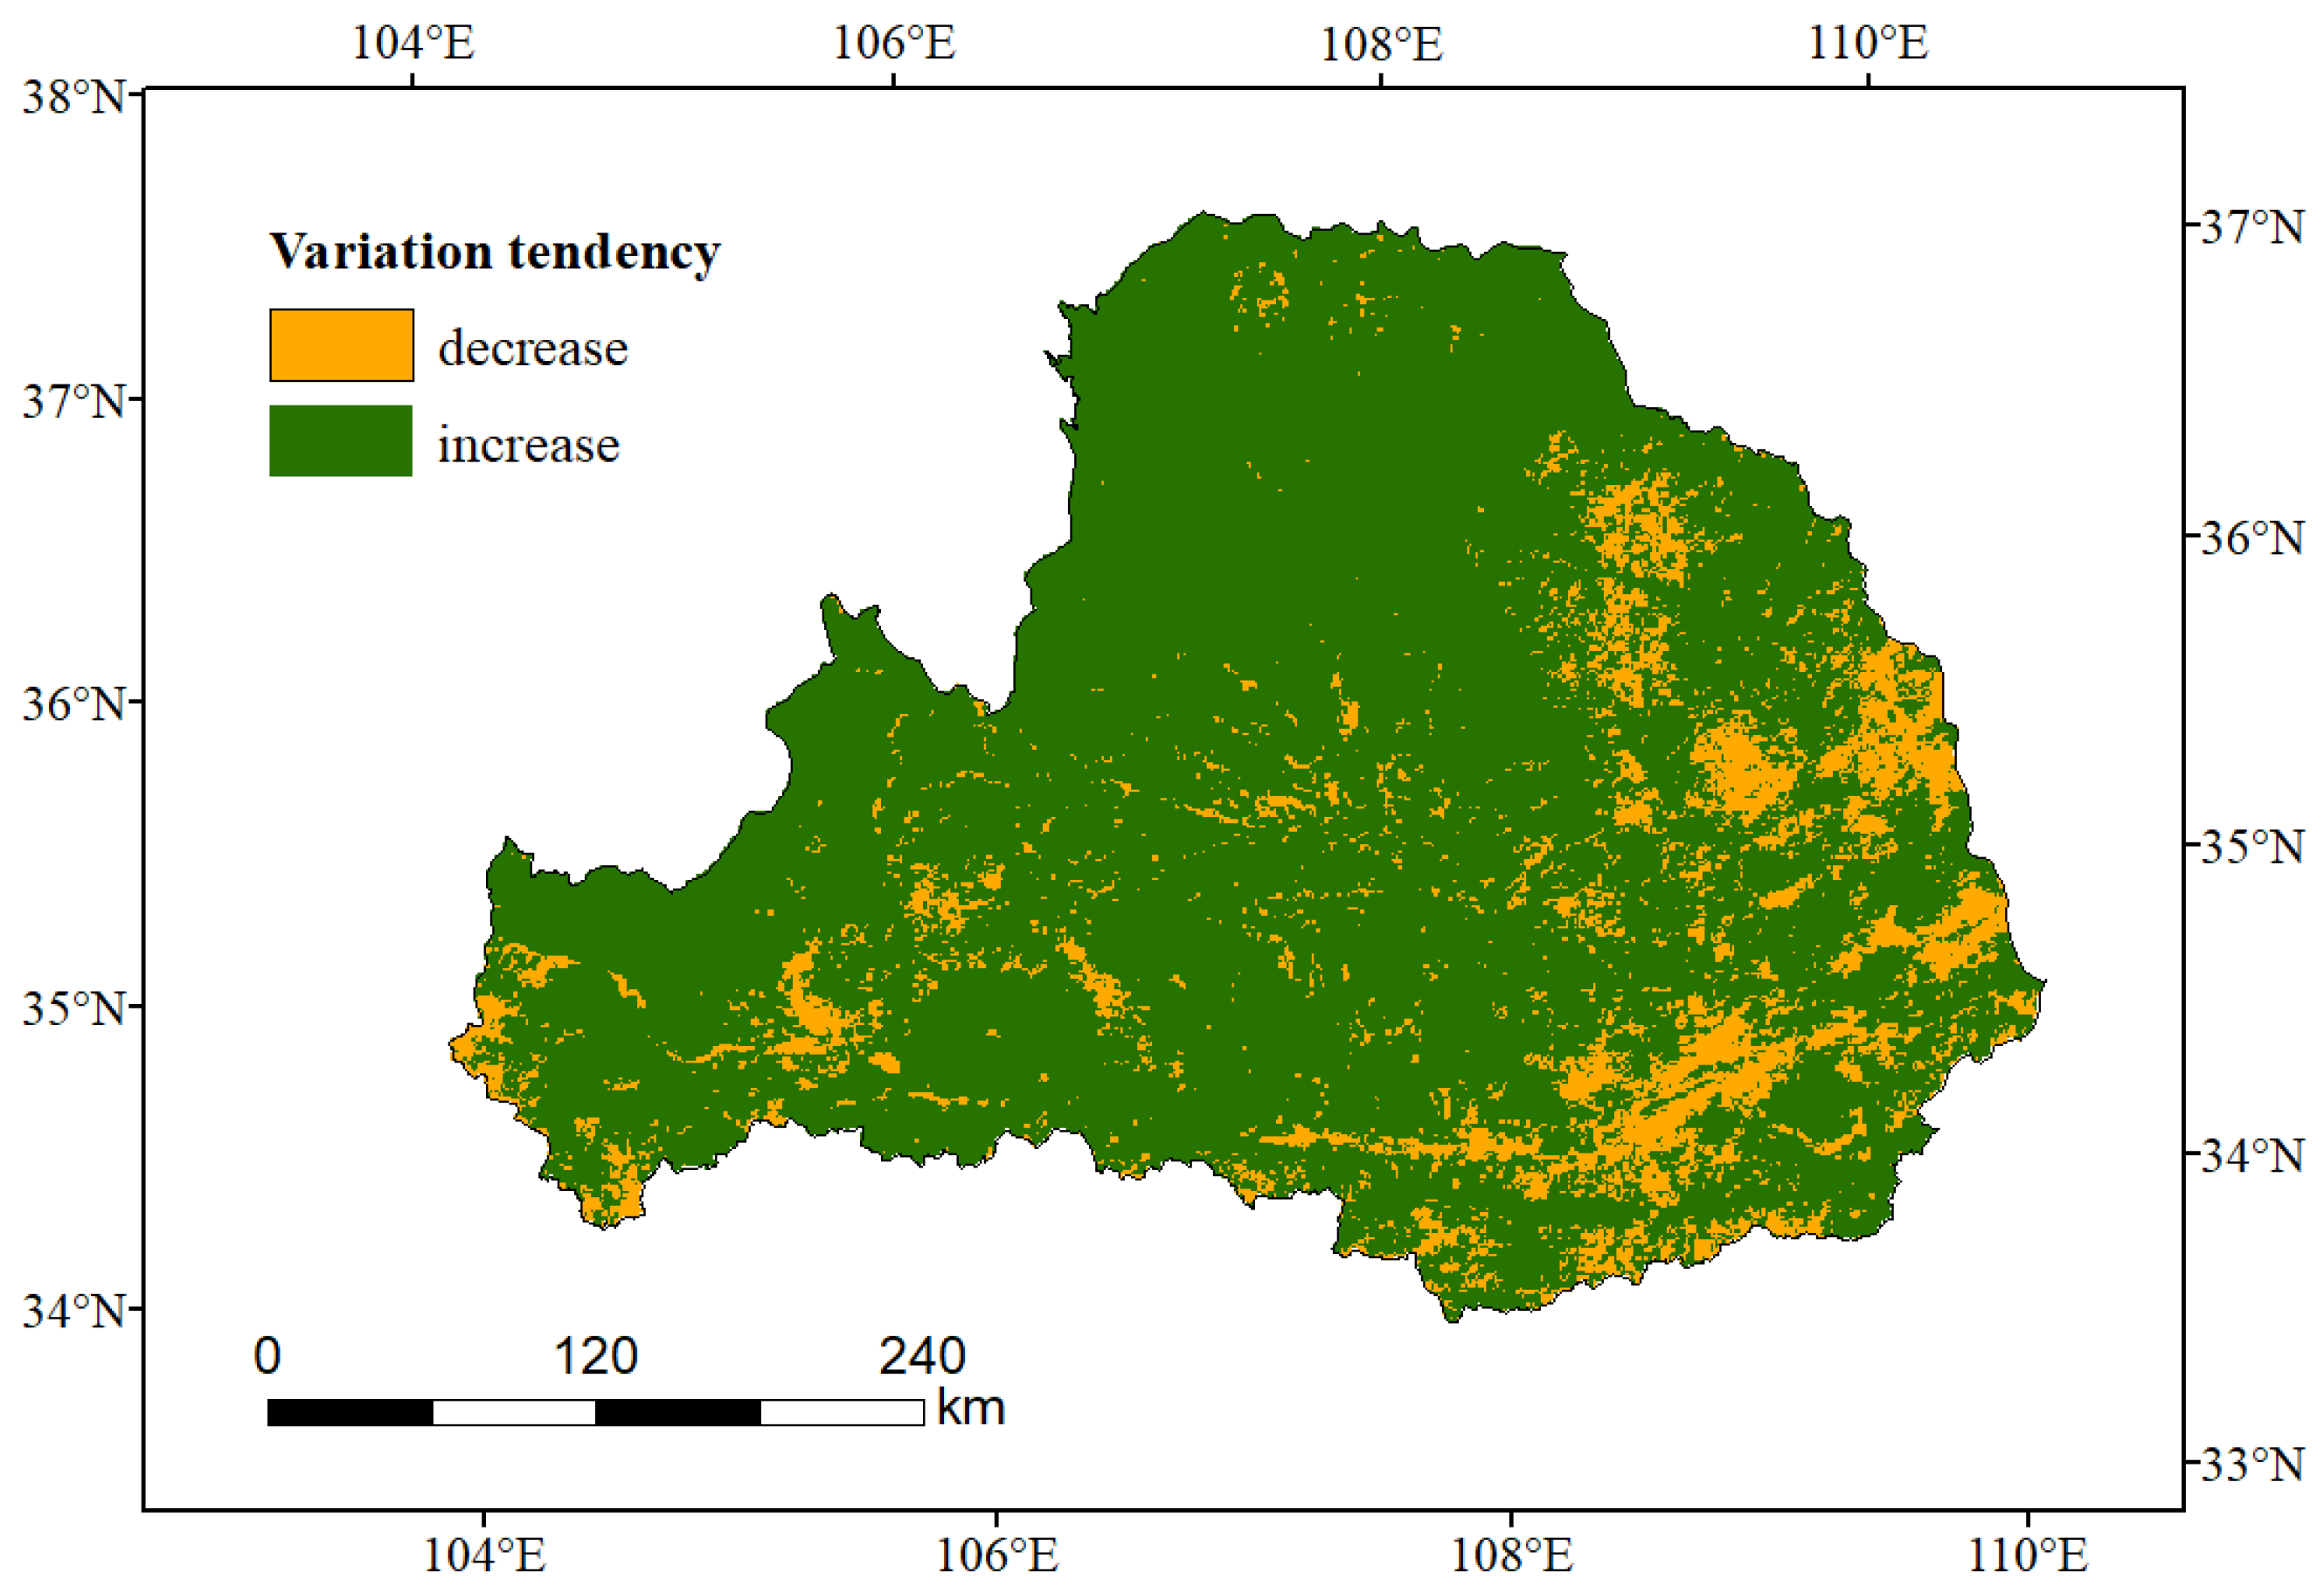
The spatial trends in WRB are shown in Figure 6. The statistics on Slope are tabulated in Table 1. According to Table 1, 86.8% of the WRB has shown an increase over the years, and only 13.2% shows a decreased trend.
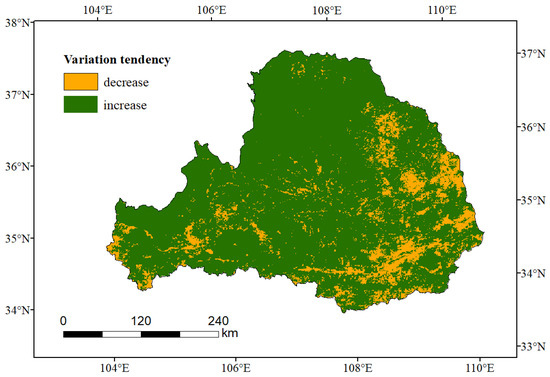
Figure 6.
Variation tendency of NDVI.

Table 1.
Graded statistics of NDVI trend.
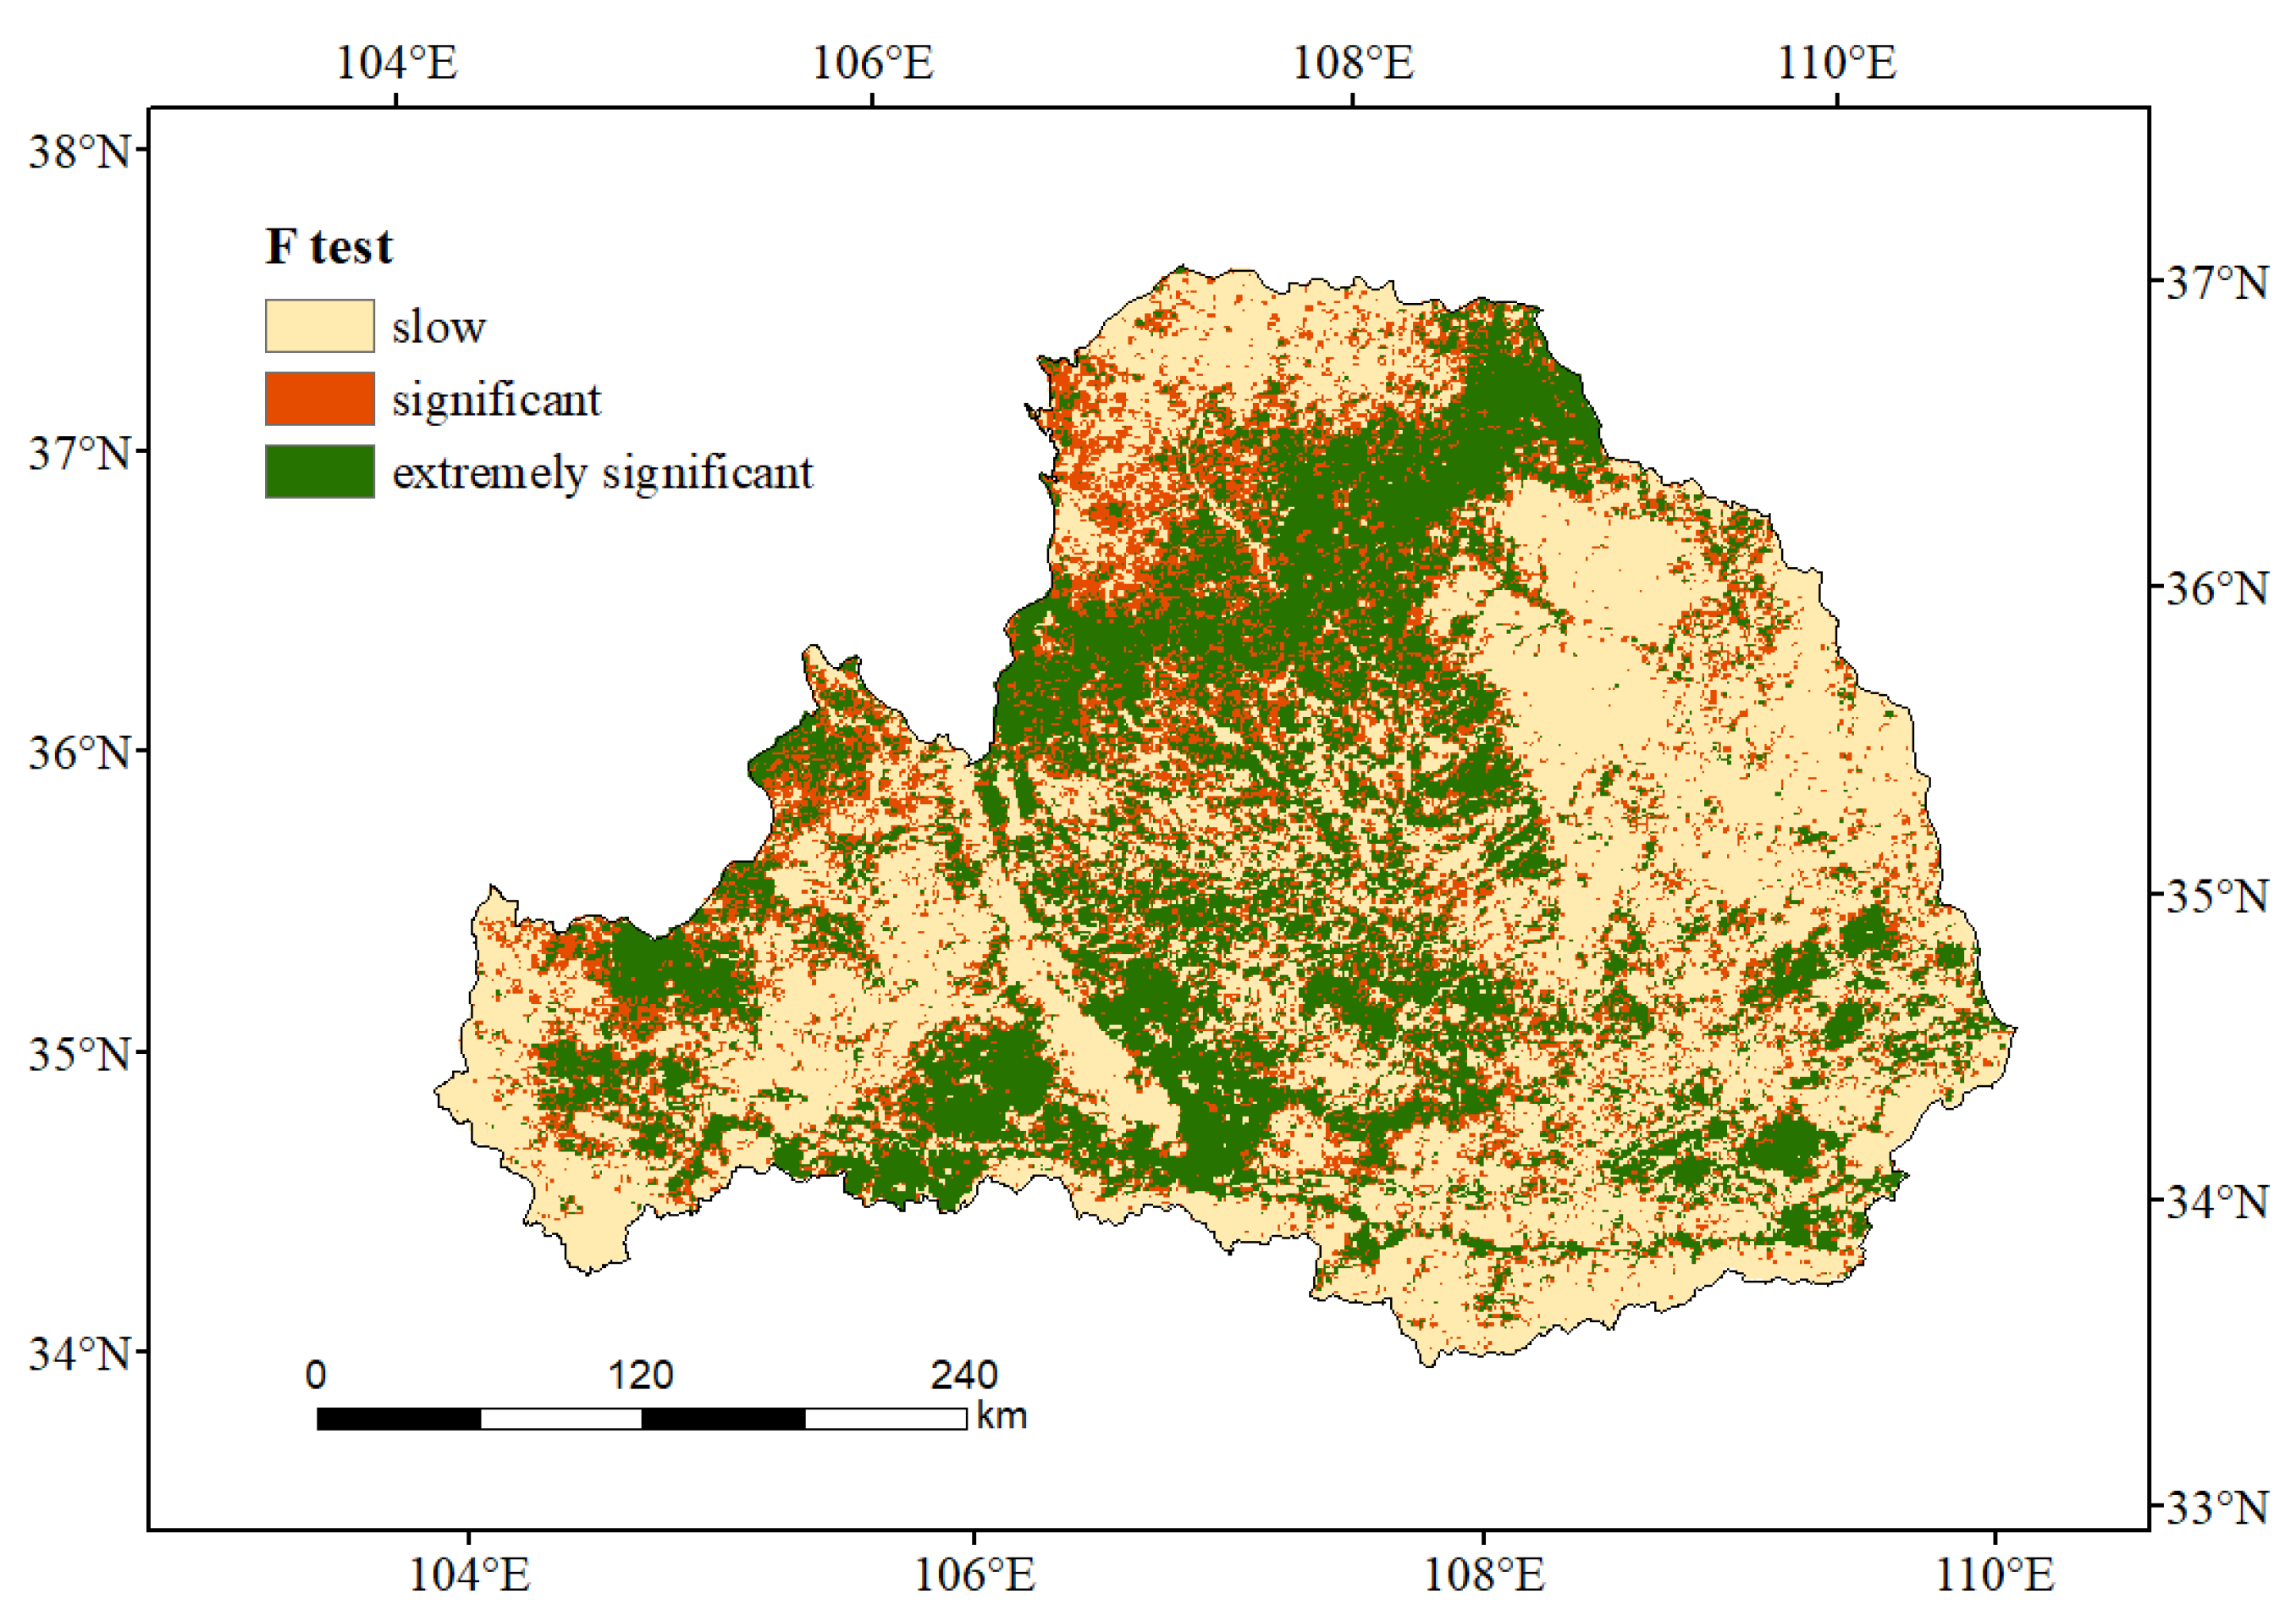
The significance of NDVI changes in the WRB can be obtained by F-test. The results are shown in Figure 7, and the statistics of their classification results are shown in Table 2. The proportion of slowly changing areas and significantly changing areas in the WRB are about half each, among which the slowly changing areas are roughly located in areas with high original NDVI, while the significantly changing areas are located in areas with low original NDVI. Therefore, it can be considered that the significance of NDVI change is influenced by the original NDVI.
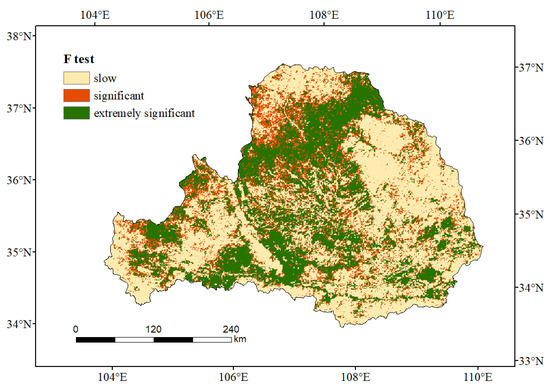
Figure 7.
F-test results of NDVI changes.

Table 2.
Statistics of F-test results for NDVI changes.
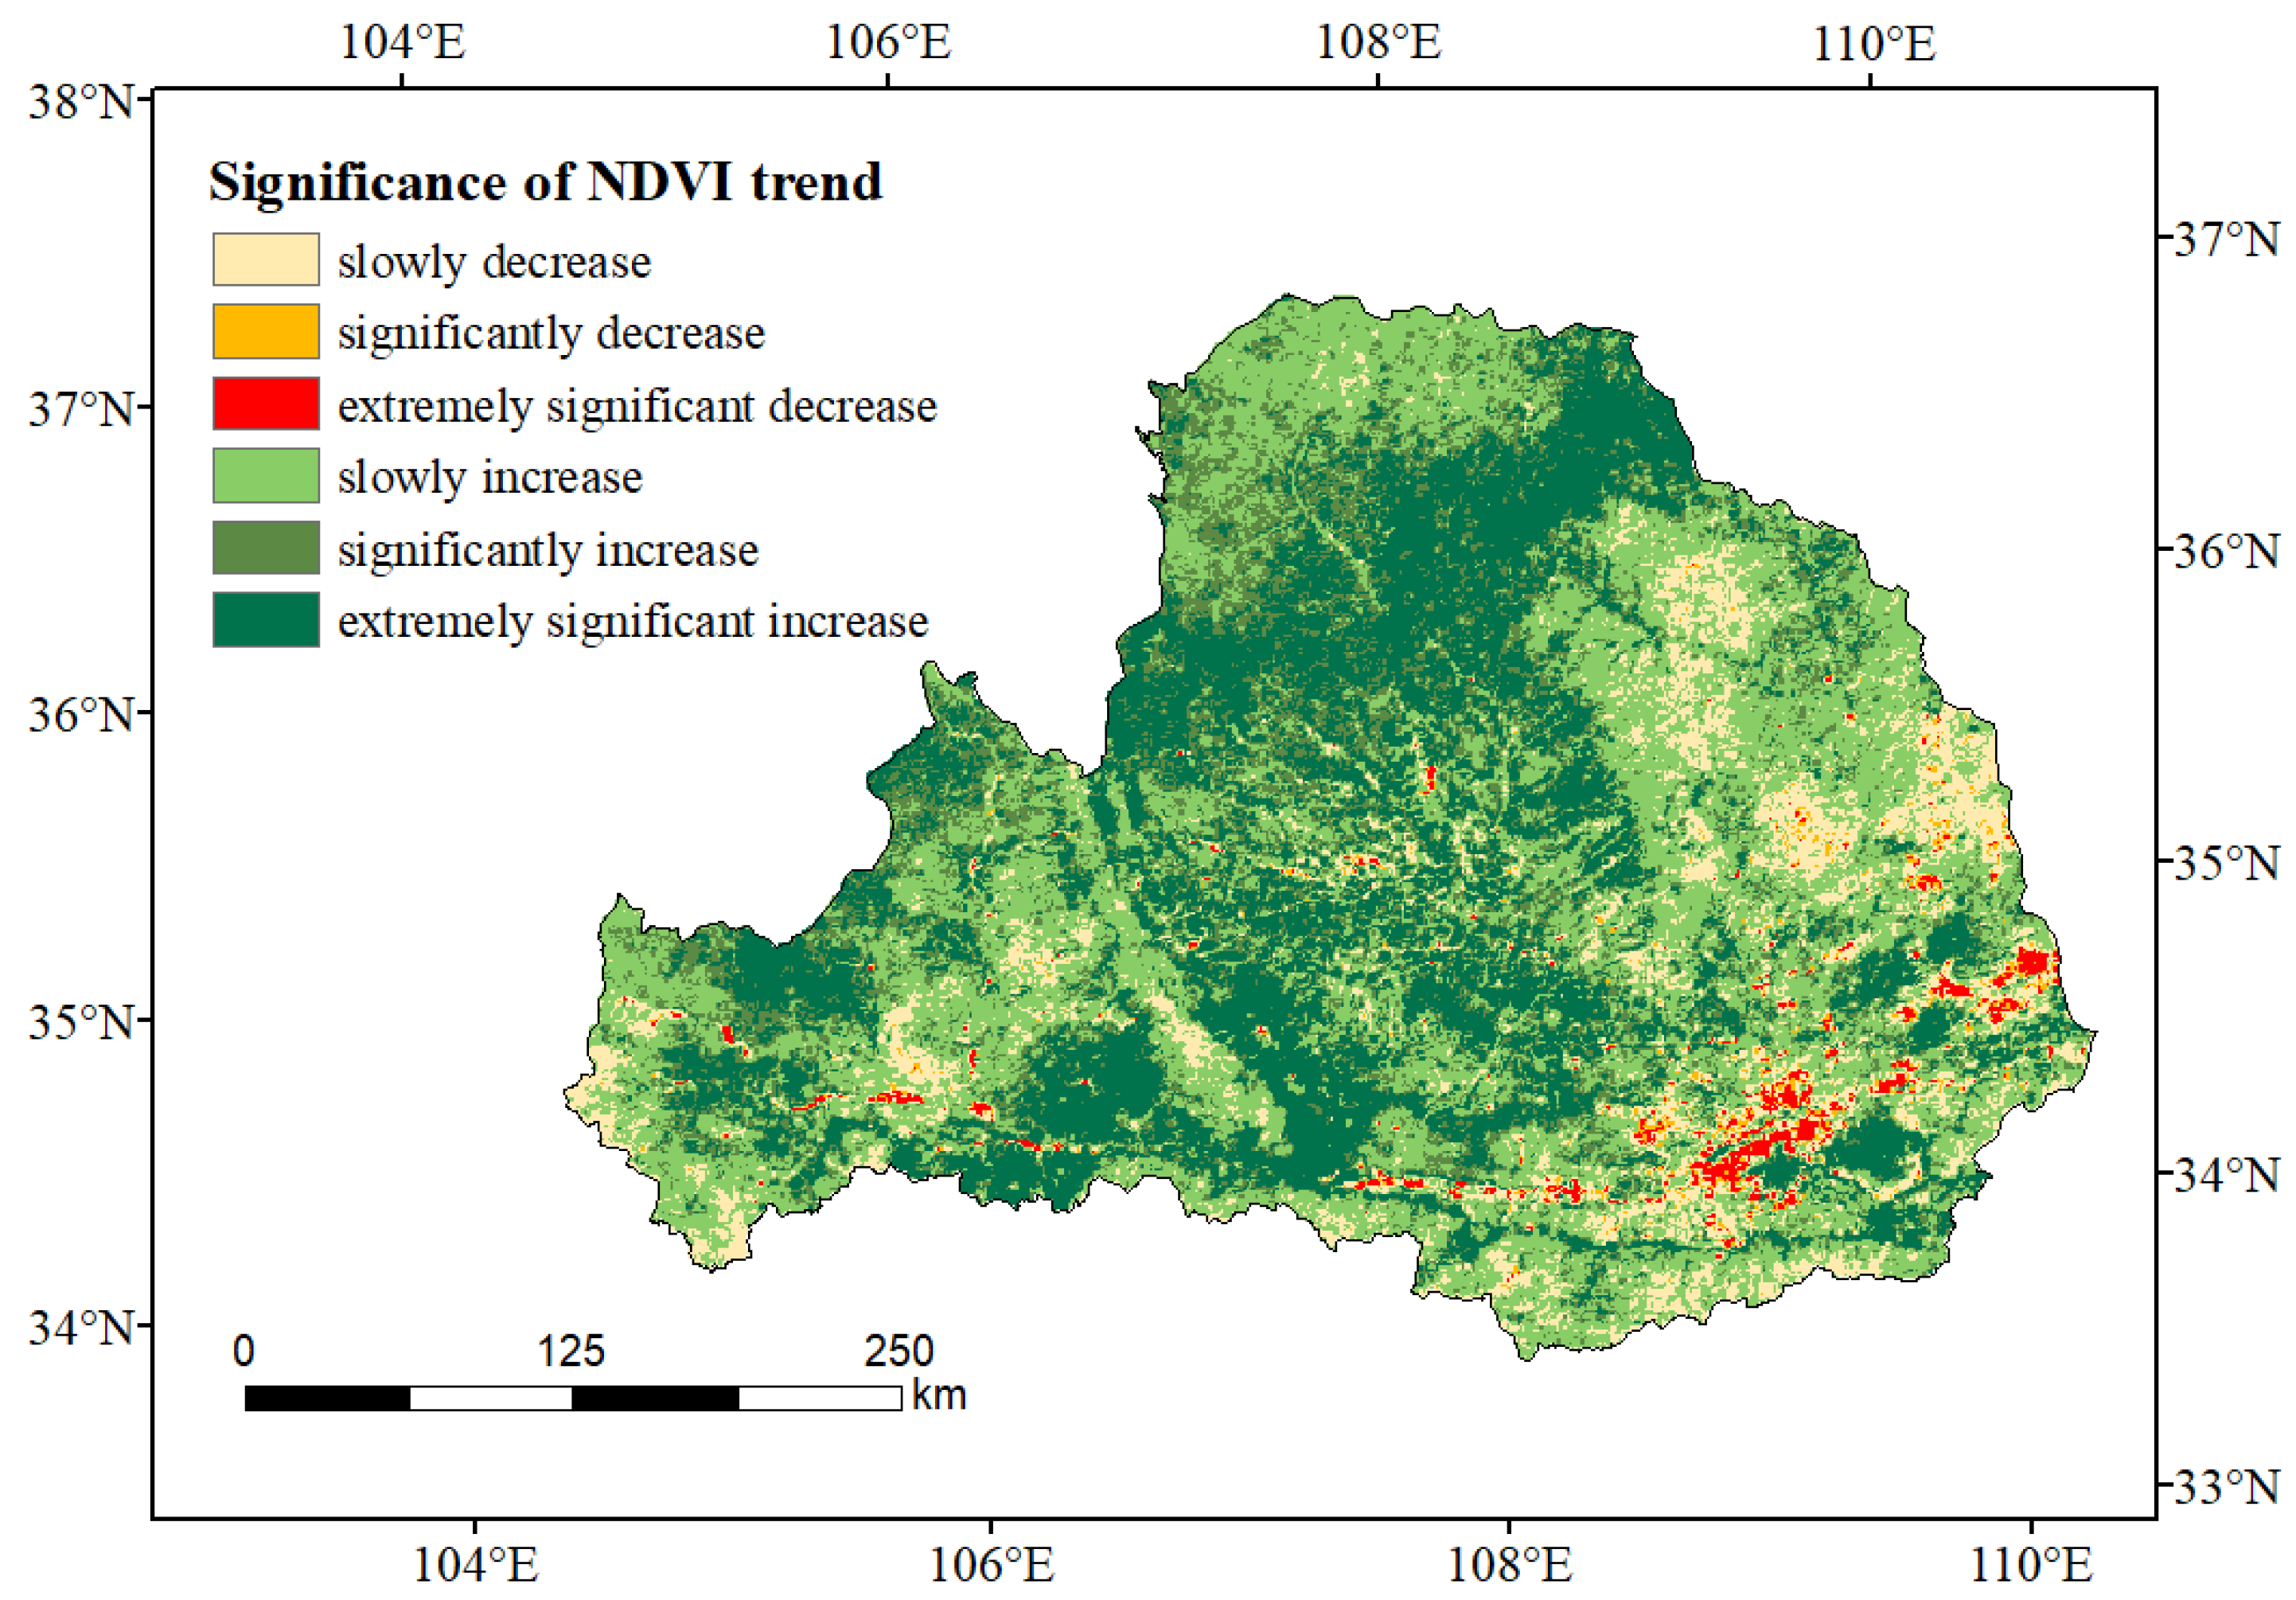
To calculate the trend of NDVI changes in the WRB for each image element and to indicate the intensity of the changes at the same time, the results of the F-test were analyzed by superimposing the results with the slope of the trend. The NDVI trends were divided into six categories and the percentage of the image elements was counted at the same time, and the results are shown in Figure 8 and Table 3. About 23.1% of the WRB showed a decrease in NDVI. The highly significant decrease in NDVI is found in the cities along the Wei River, such as Baoji and Xi’an, which are densely populated and have mostly construction land, as confirmed in other studies [52]. Meanwhile, the highly significant increase in NDVI is 30.1% and is located in the northwestern Loess Plateau region, which proves that the vegetation cover is increasing greatly. The ecological environment is believed to have been significantly improved.
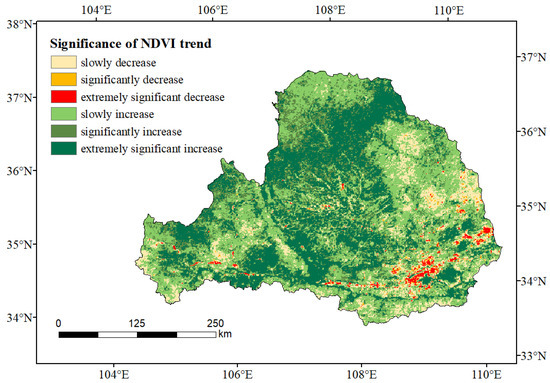
Figure 8.
Significance of NDVI trends.

Table 3.
Statistical results of significance classification of NDVI trends.
4.2. Spatial and Temporal Characteristics of Terrestrial Water Storage
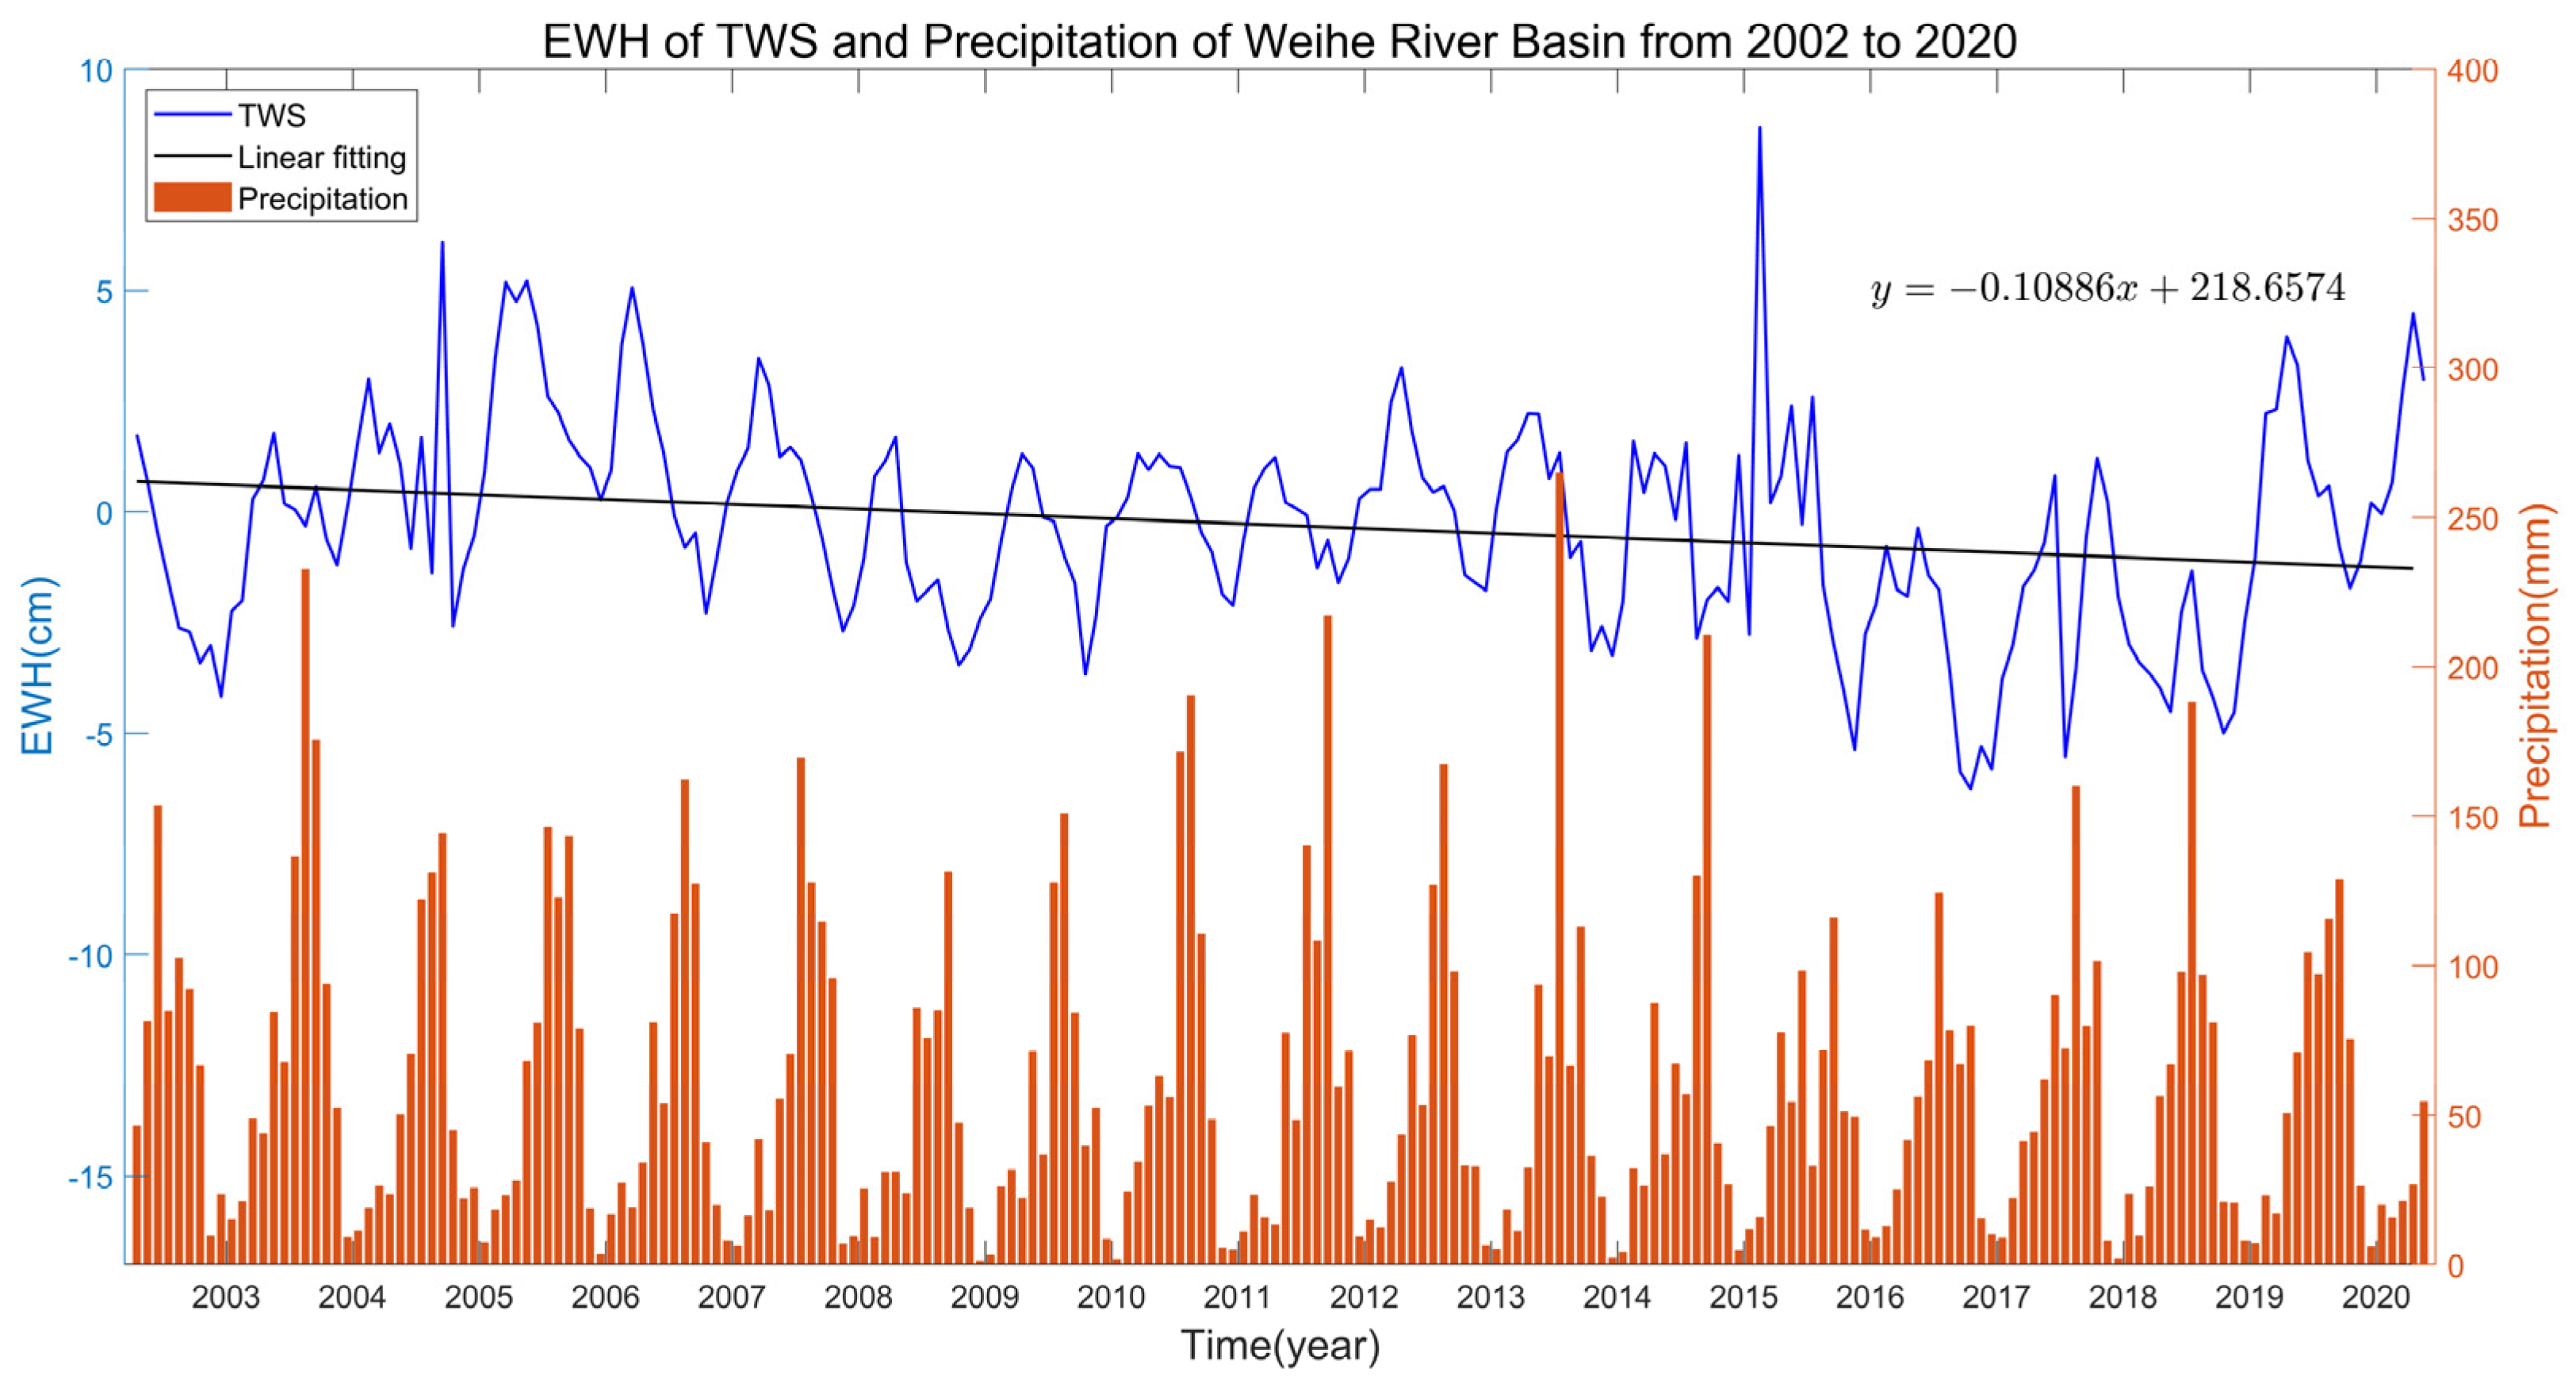
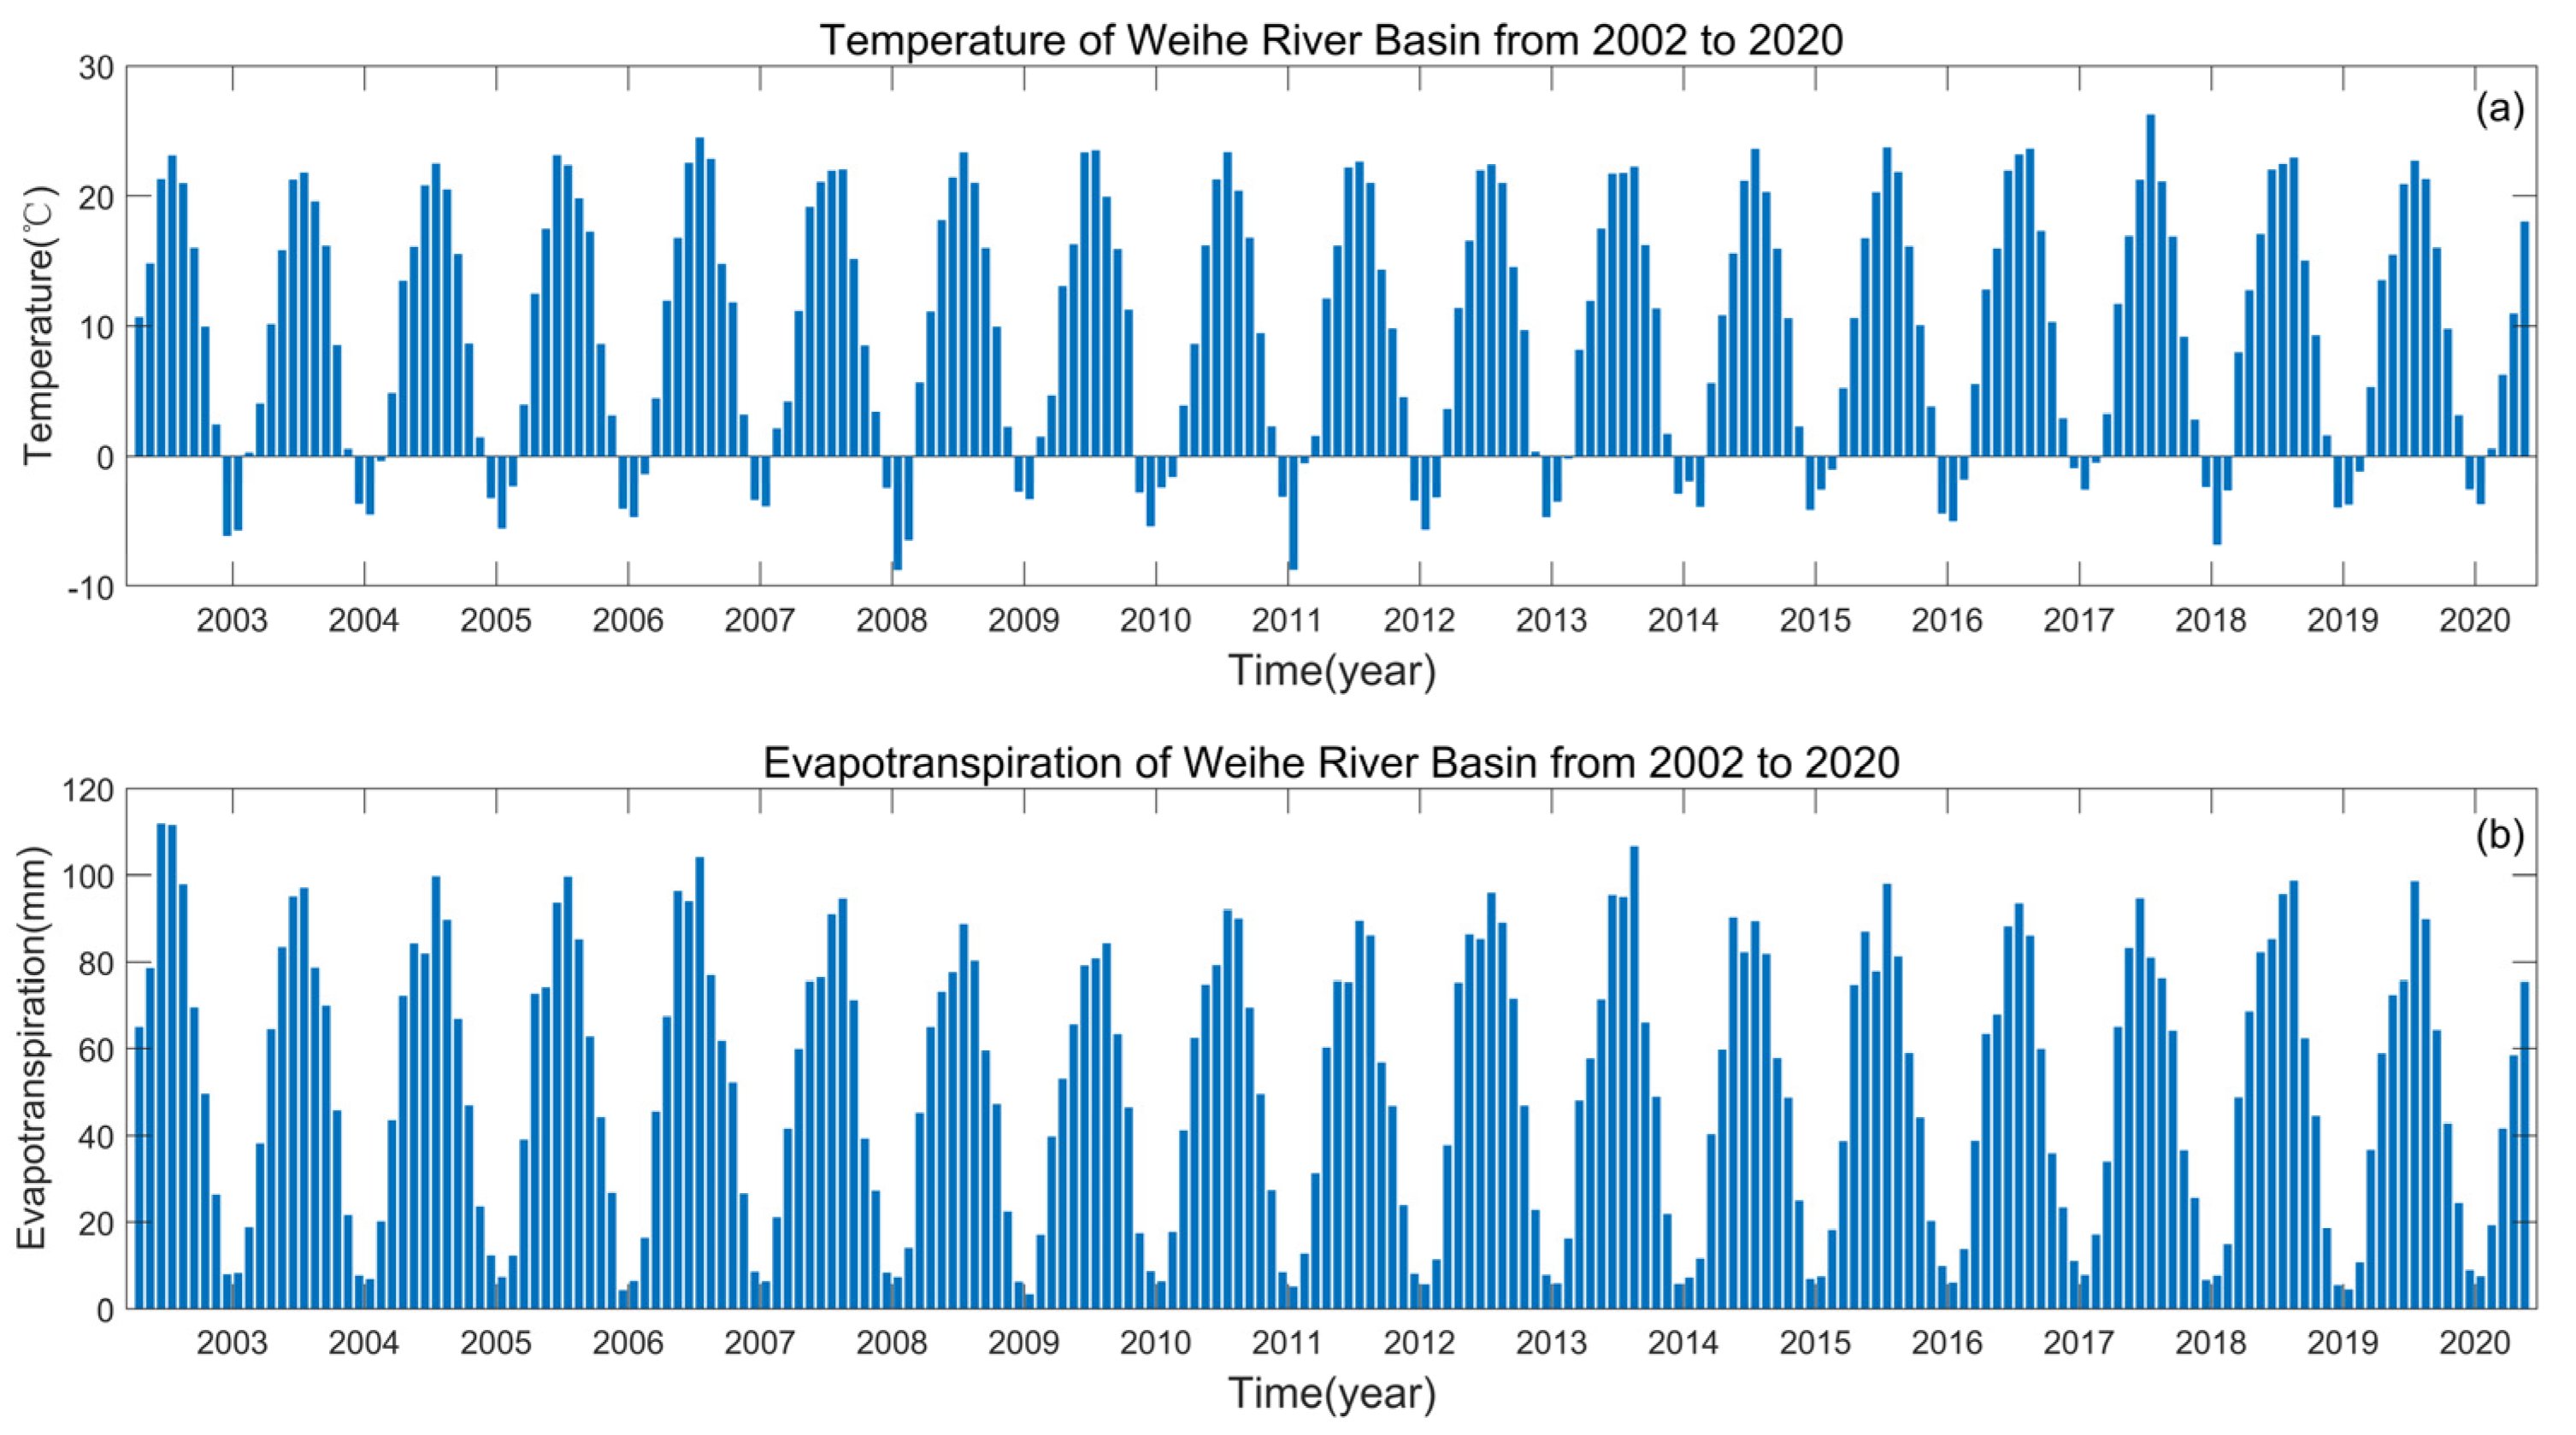
Figure 9 shows the variation of water storage in the WRB obtained by inversion of the GRACE and GRACE-FO data, and the regularity can be seen to some extent. As a whole, it is still in a decreasing trend of −0.09 cm/yr, as found by linear fitting. A comparison with rainfall data shows that fluctuations in water storage are broadly consistent with fluctuations in rainfall. In particular, the sudden decline in water storage after 2015 was also influenced by the significant reduction in rainfall. Figure 10 shows the skin temperature and total evapotranspiration of WRB. In Figure 10a, the variation in water storage over most of the time period is inversely proportional to the variation in temperature. What is more apparent is that water storage is at a lower level from 2006 to 2010, but the temperature is at a higher level. Similarly, water storage declines more rapidly after 2015, when the temperature is also at a higher level. This would suggest that changes in water storage are also influenced by temperature. In Figure 10b, changes in water storage from 2002 to 2013 are more consistent with evapotranspiration. However, particularly from 2015 to 2018, water storage declined significantly and evapotranspiration was at a high level. This also suggests that evapotranspiration has little effect on TWS when water storage is on a relatively increasing trend. When evapotranspiration is high, this has an impact on water storage changes.
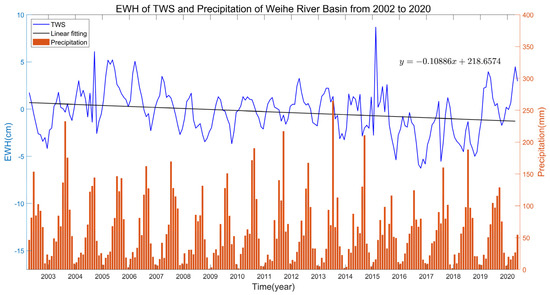
Figure 9.
Time series of EWH and Precipitation in WRB.
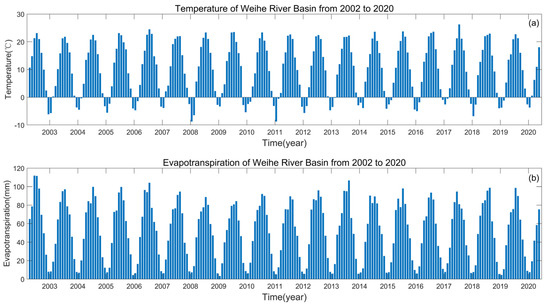
Figure 10.
(a) Skin temperature and (b) Total evapotranspiration of WRB.
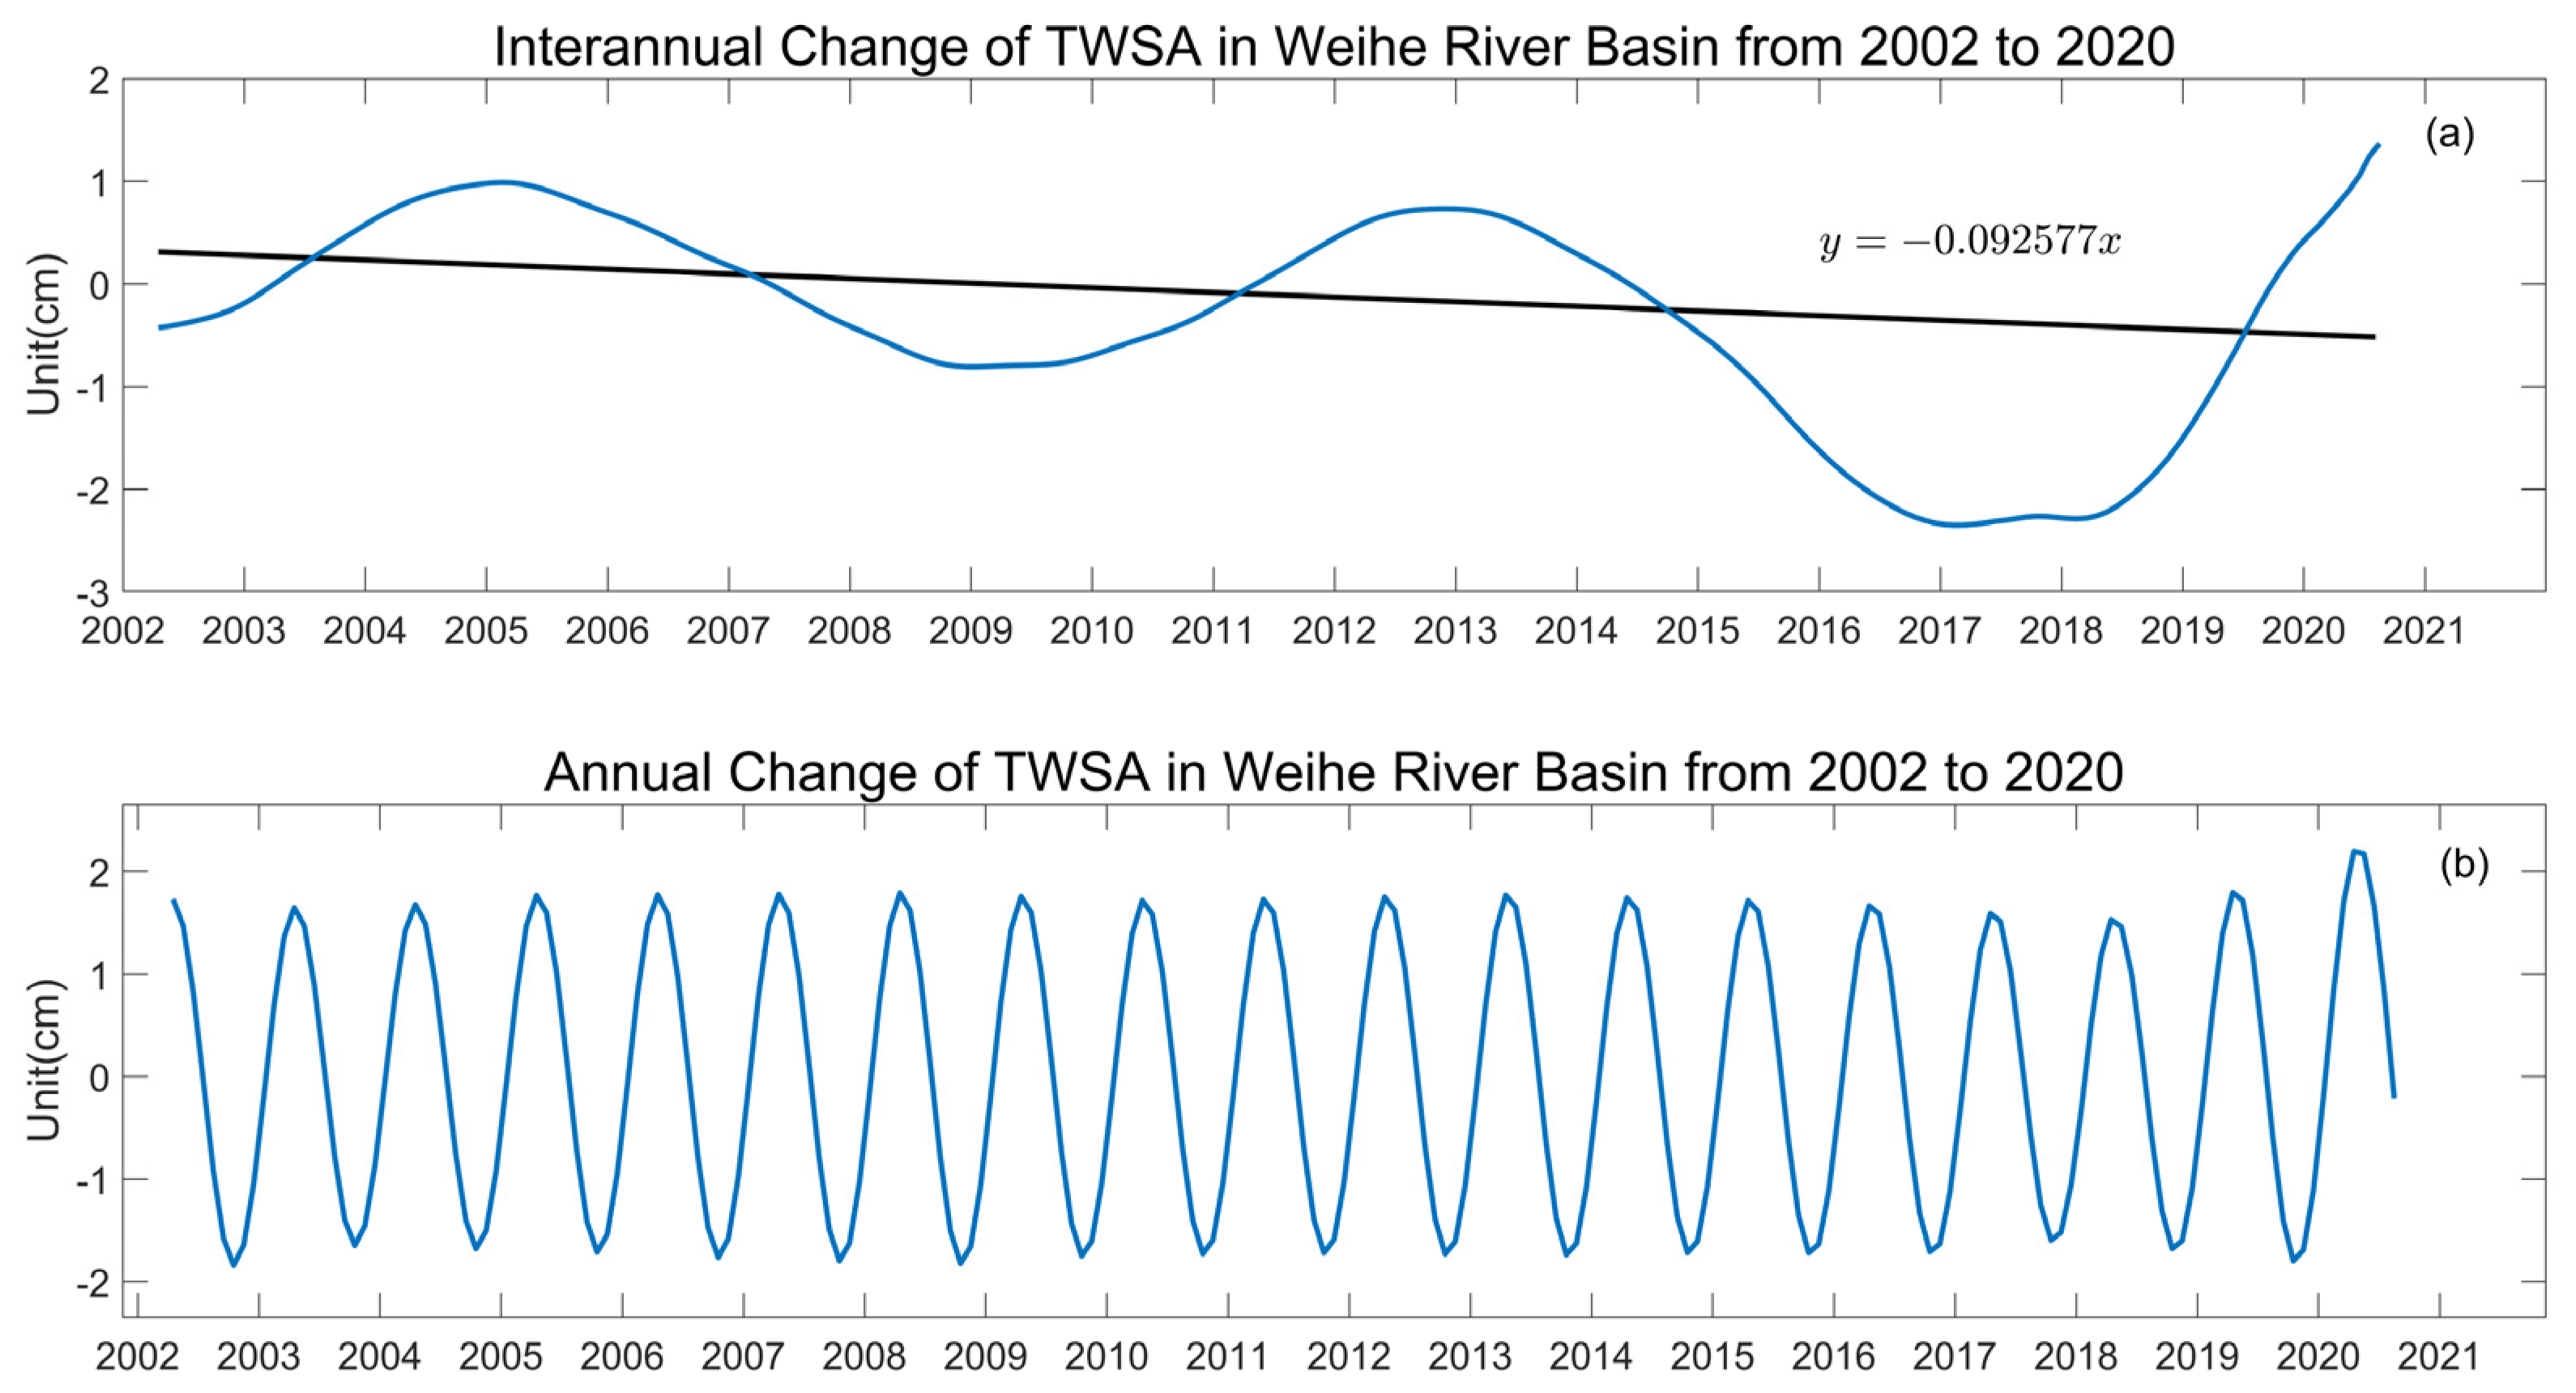
The time series of water storage is further analyzed, and the interannual long trend changes are obtained by signal extraction, as shown in Figure 11a. It offers an overall downward trend of −0.09 cm/yr, and presents different rise and fall in different periods, showing repeated rise and fall in these nearly two decades, especially in 2017 and 2018 when the downward trend increases. Figure 11b is the result obtained by extracting the periodic signal, seeing that the water storage changes also show a robust intra-annual variation pattern, with an overall regular periodicity, reaching a valley from October to November and a peak from May to June.
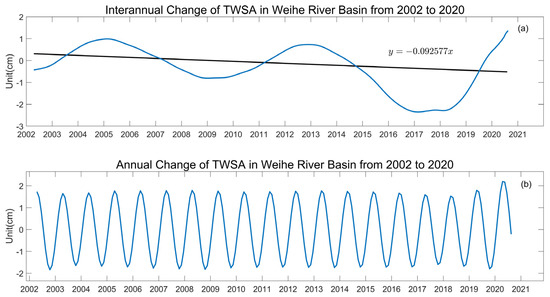
Figure 11.
TWS time series extraction, (a) interannual trend variation, (b) annual cycle variation.
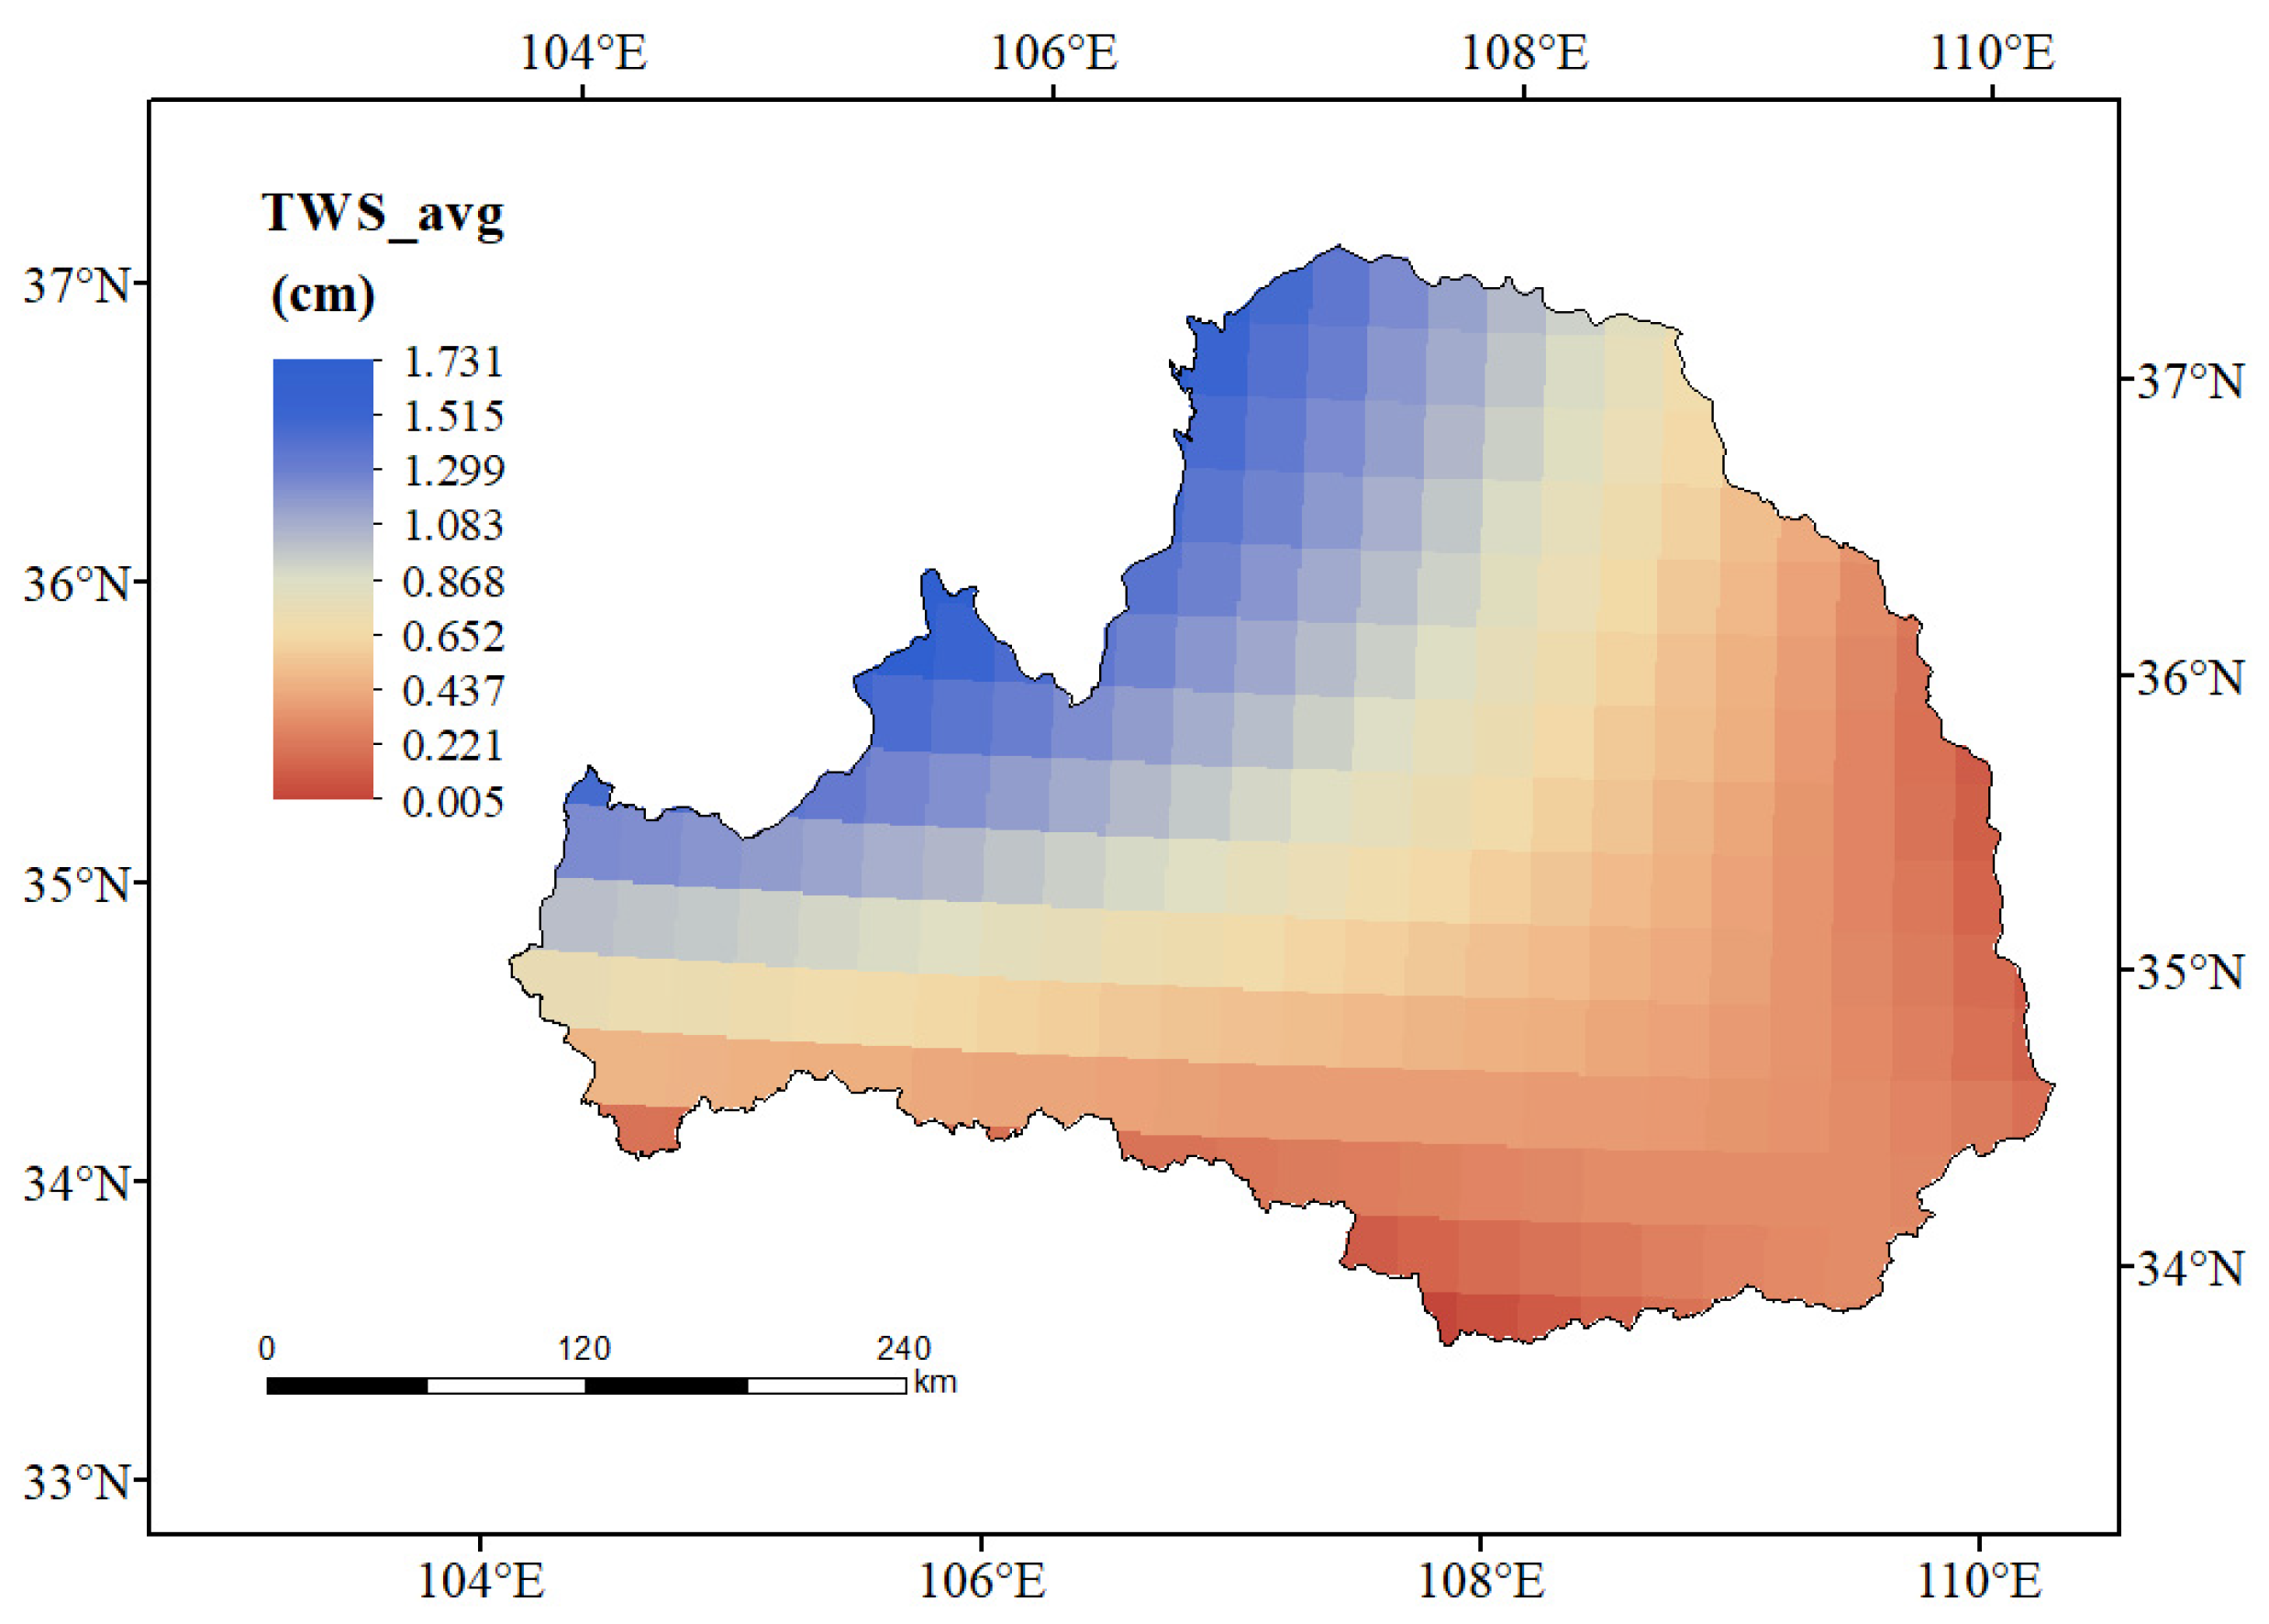
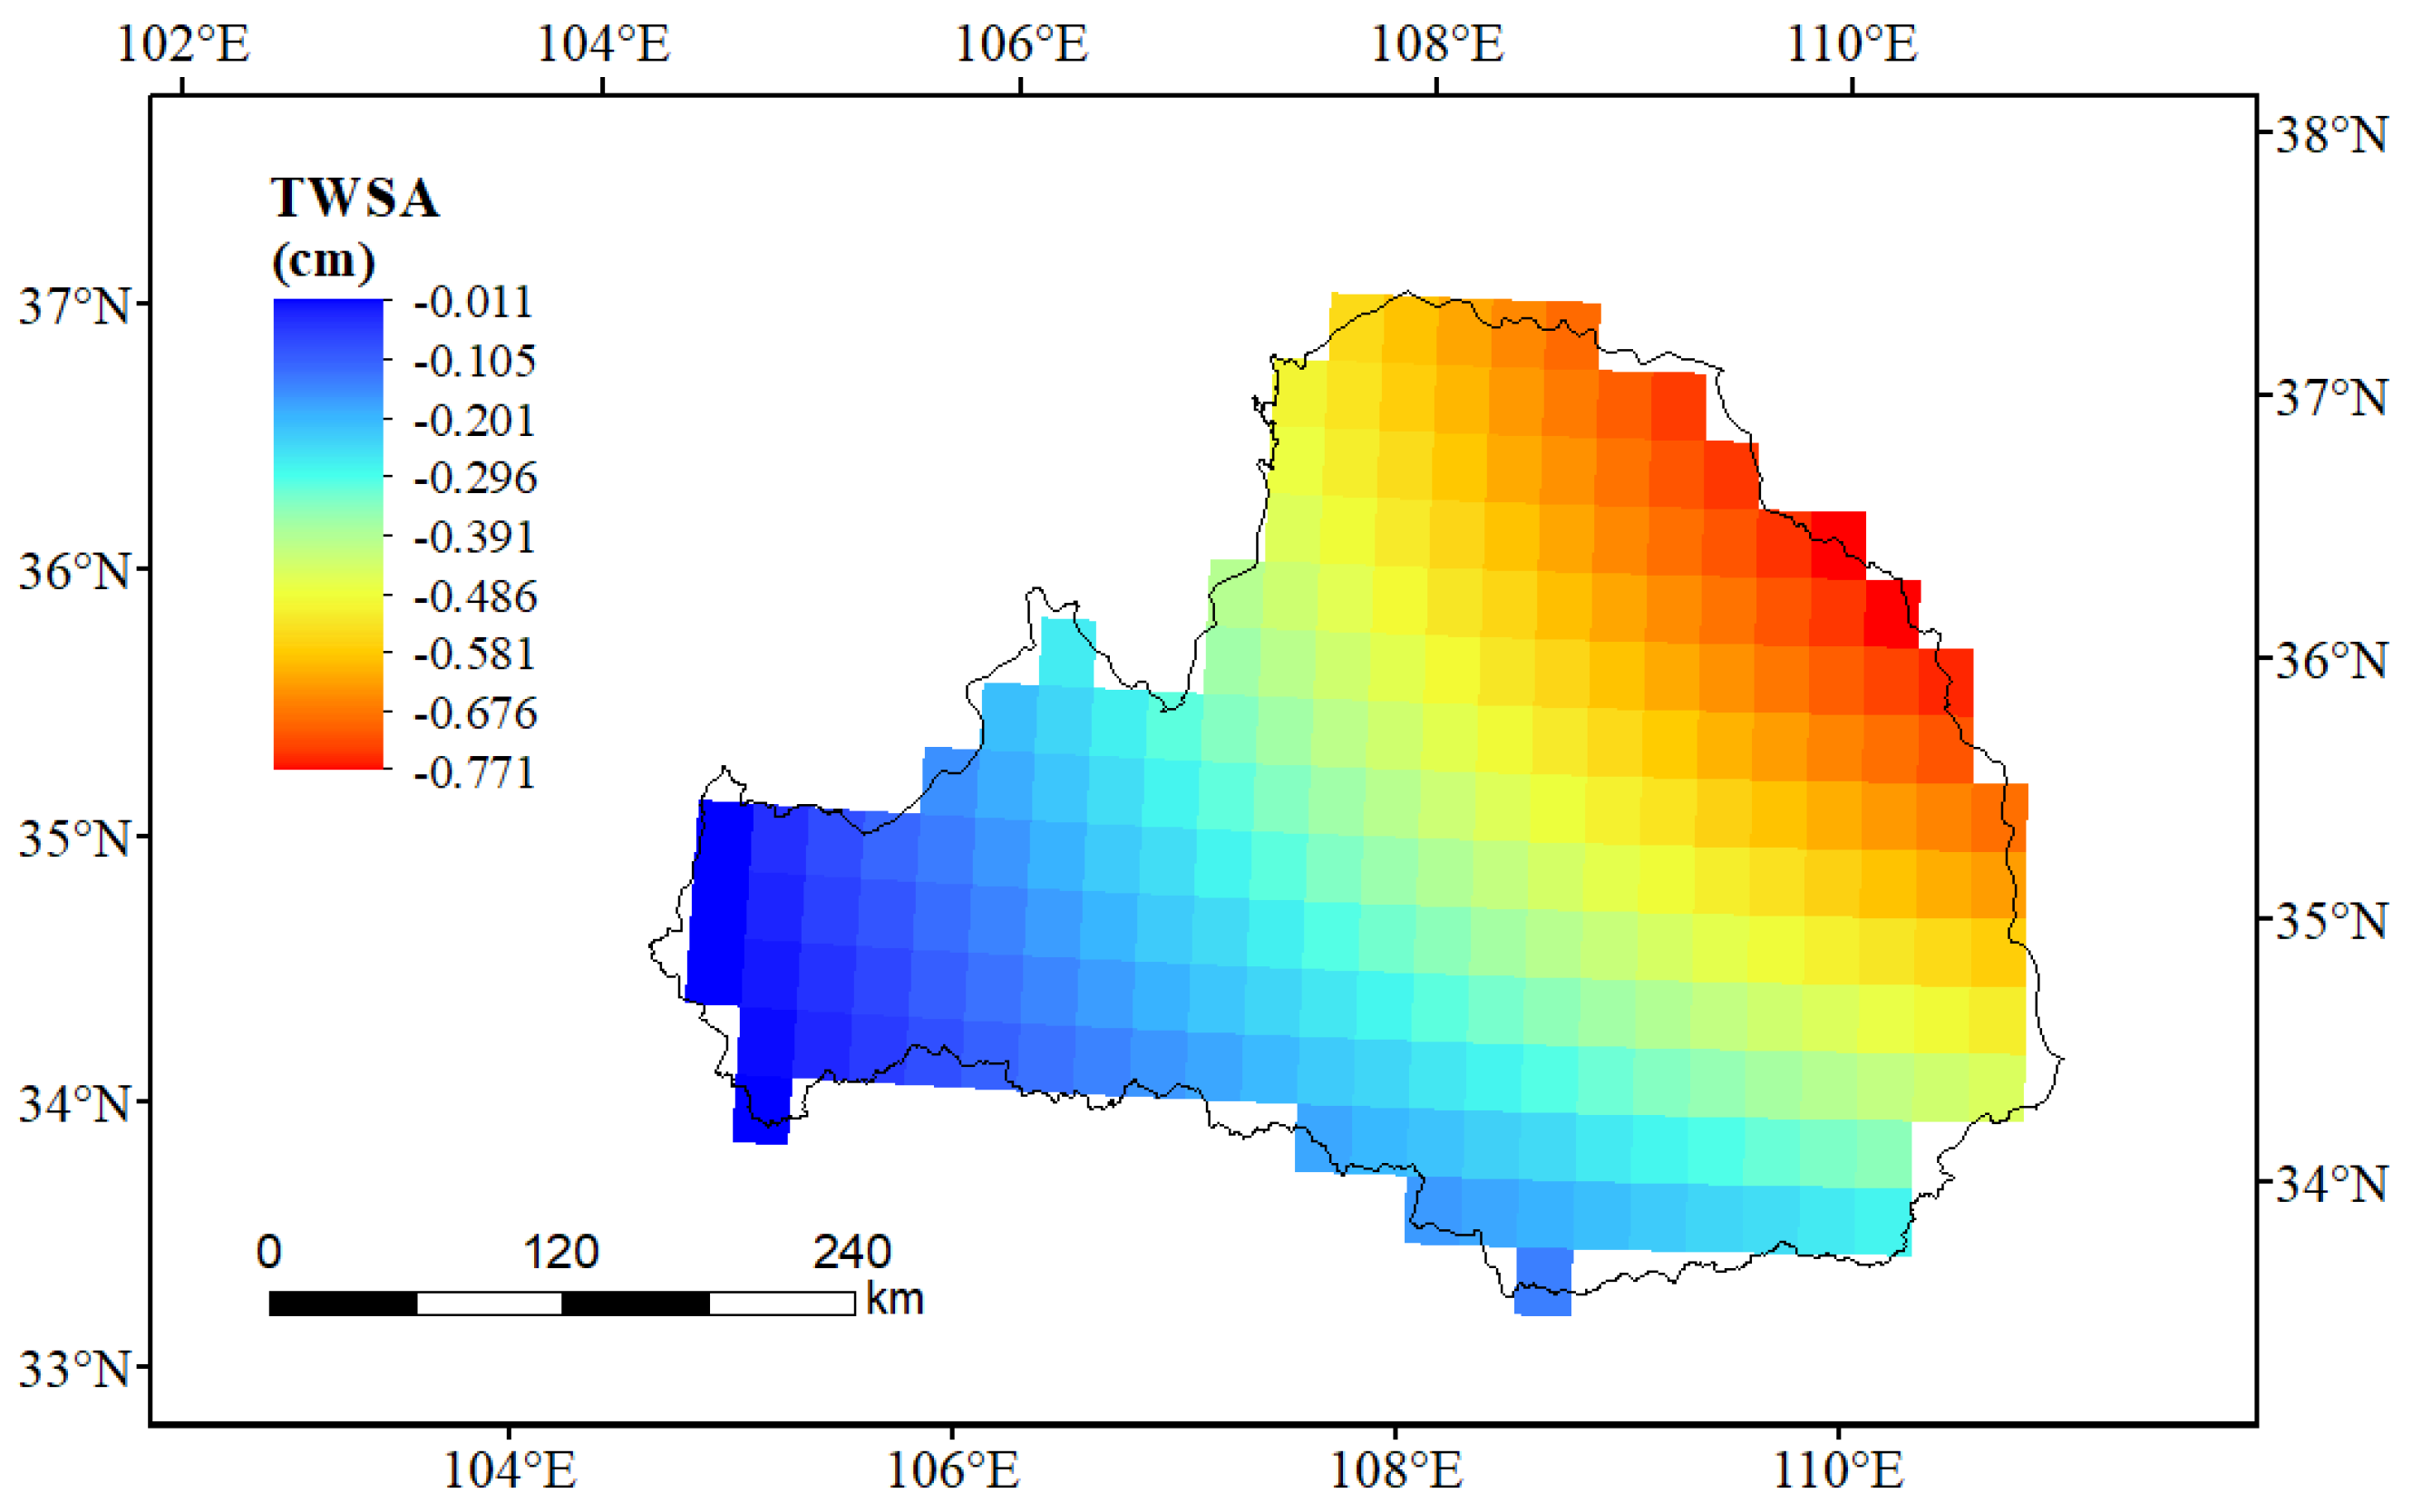
Taking the average of the TWS of the WRB from April 2002 to July 2020 to reflect the water storage in the region as shown in Figure 12. The water storage in the WRB shows a gradual decrease from the northwest to the southeast, which may be because the area is in an arid and semi-arid region with low precipitation. The northwest area is not suitable for planting due to its high terrain, so the vegetation type is single. There are also studies showing that in grassland and forest-steppe areas, the soil water consumption of natural vegetation and artificial vegetation is significantly different, with artificial vegetation consuming more soil water than natural vegetation [53]. In addition, densely populated areas, such as Xi’an and Baoji, are also located in this area, and more water is used for agricultural irrigation [54]. These artificial disturbances increase water consumption and make water storage less.
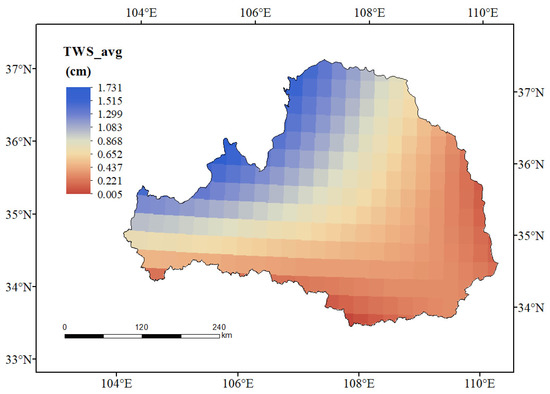
Figure 12.
Annual average TWS in WRB.
Figure 13 shows the changes in water storage during the study period. As a whole, the water reserves in this area are gradually decreasing, and gradually increasing from the west to the northeast, which to some extent, is also in accordance with the characteristics of more precipitation in the south and less precipitation in the north.
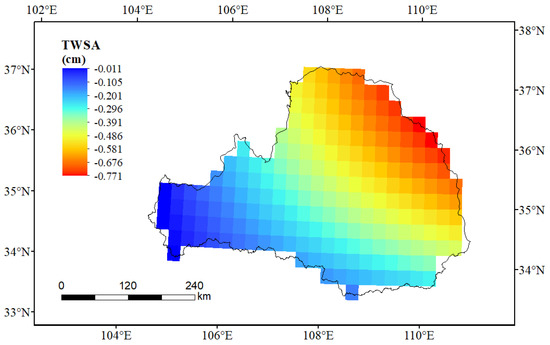
Figure 13.
Trend of TWS in the WRB.
In response to the inconsistency between the distribution of annual average water storage and the trend of WRB, it has been shown that water consumption increases during the process of extensive vegetation restoration, and evapotranspiration increases at a rate of 4.39 mm a−1 in the Loess Plateau where the WRB is located [55]. Li et al. showed that the most critical factor of vegetation type affecting water storage in the Yellow River basin is agricultural land, followed by forests, grasslands, shrubs, and others [31]. The northeastern part of the WRB is the main concentration of broadleaf forests. In contrast, the northwestern part is the main concentration of grasslands, and the central part is the main cultivation area for crops, so it is somewhat consistent with the variation of water storage reflected in Figure 12. In addition, the western part of the WRB is higher in elevation and less populated. At the same time, the terrain gently slopes down to the northeast, and the population density increases to varying degrees, so the influence of human activities may also affect the changes in water storage to some extent.
4.3. NDVI and Terrestrial Water Storage Correlation Analysis
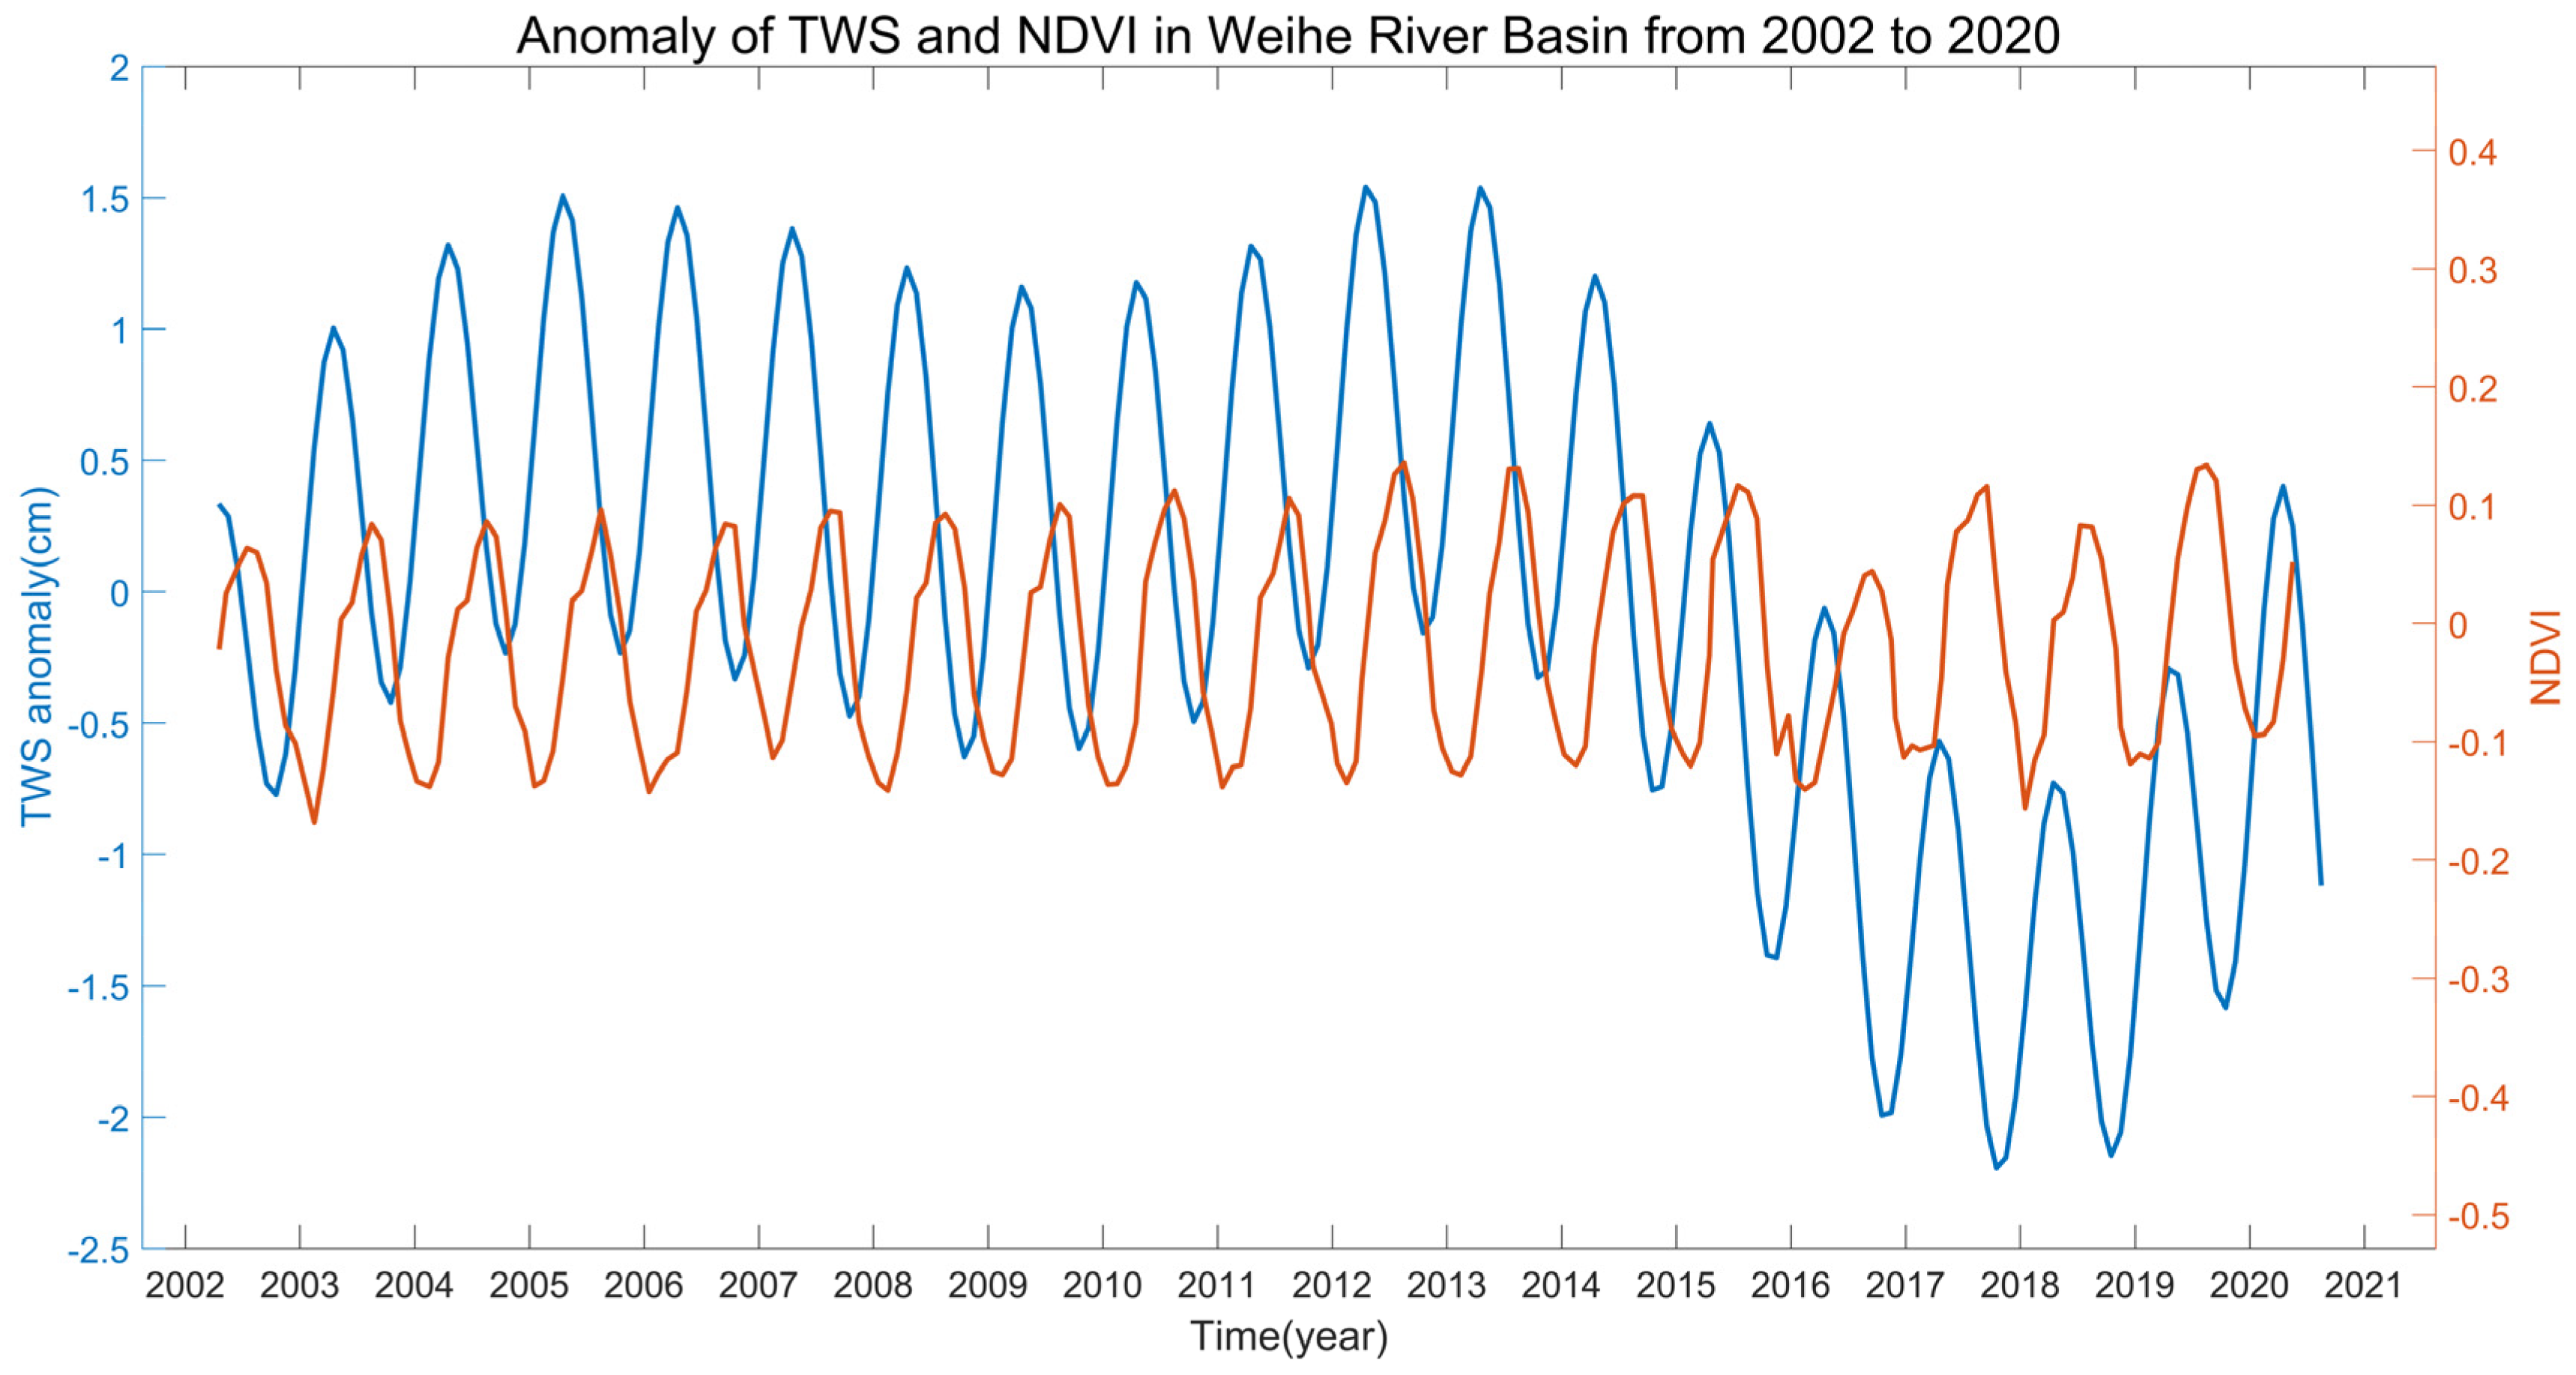
Figure 14 shows the interannual signal of water storage and the curve of variation in NDVI. Both water storage and NDVI in the region show more fluctuations, and seasonal characteristics are more obvious. Overall, there is a consistent trend and intra-annual pattern, which indicates some consistency in the changes in water storage and NDVI in the region.
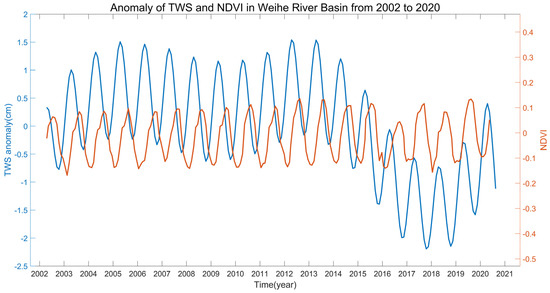
Figure 14.
Time series of interannual variation of water storage and NDVI.
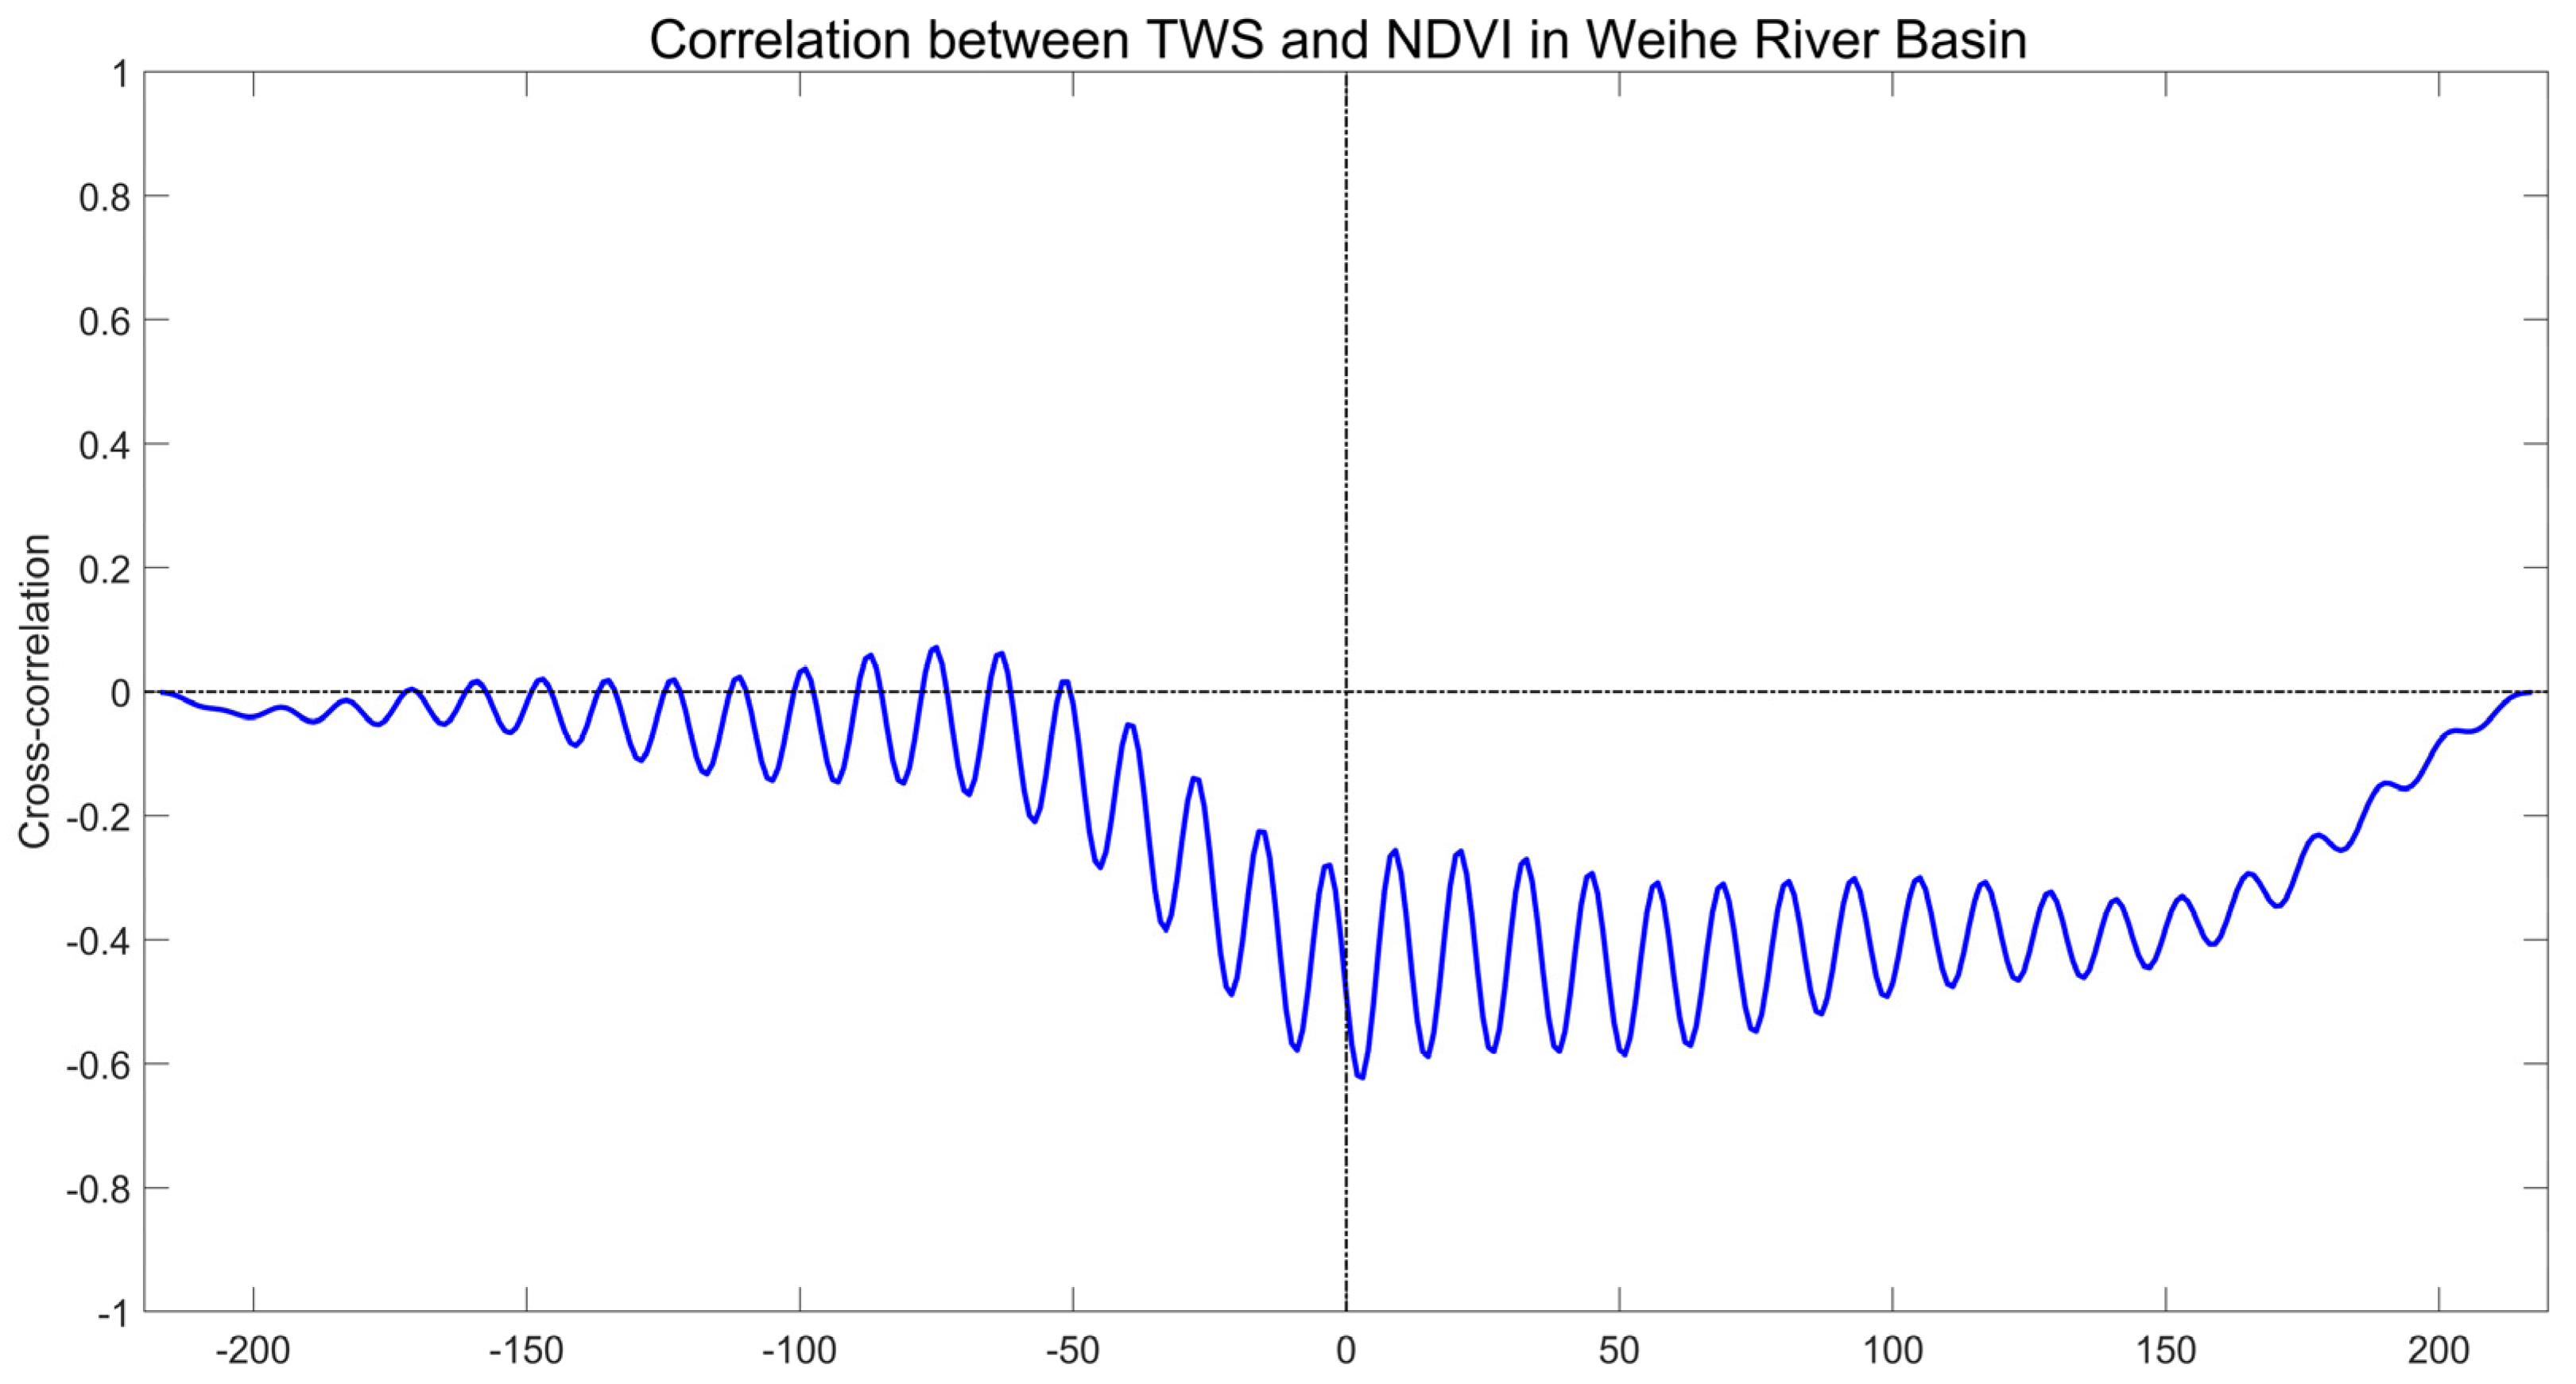
Figure 15 shows the correlation between water storage in the WRB and NDVI on a time scale, and it can be seen that there is a significant correlation between the two, with a maximum correlation coefficient of 0.6. There is also a certain lag in NDVI compared to water storage changes, with a lag time of 3 months, which is consistent with the study of Zhong et al. [56]. It can be understood that the change in water storage makes NDVI change gradually with it, and would not produce an immediate effect.
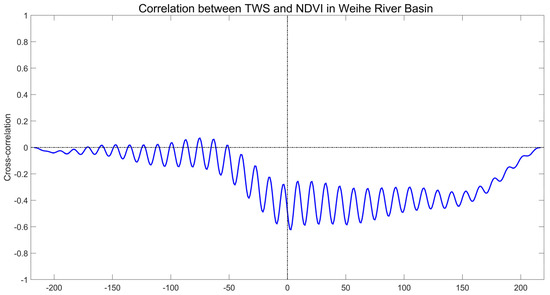
Figure 15.
Correlation between water storage and NDVI.
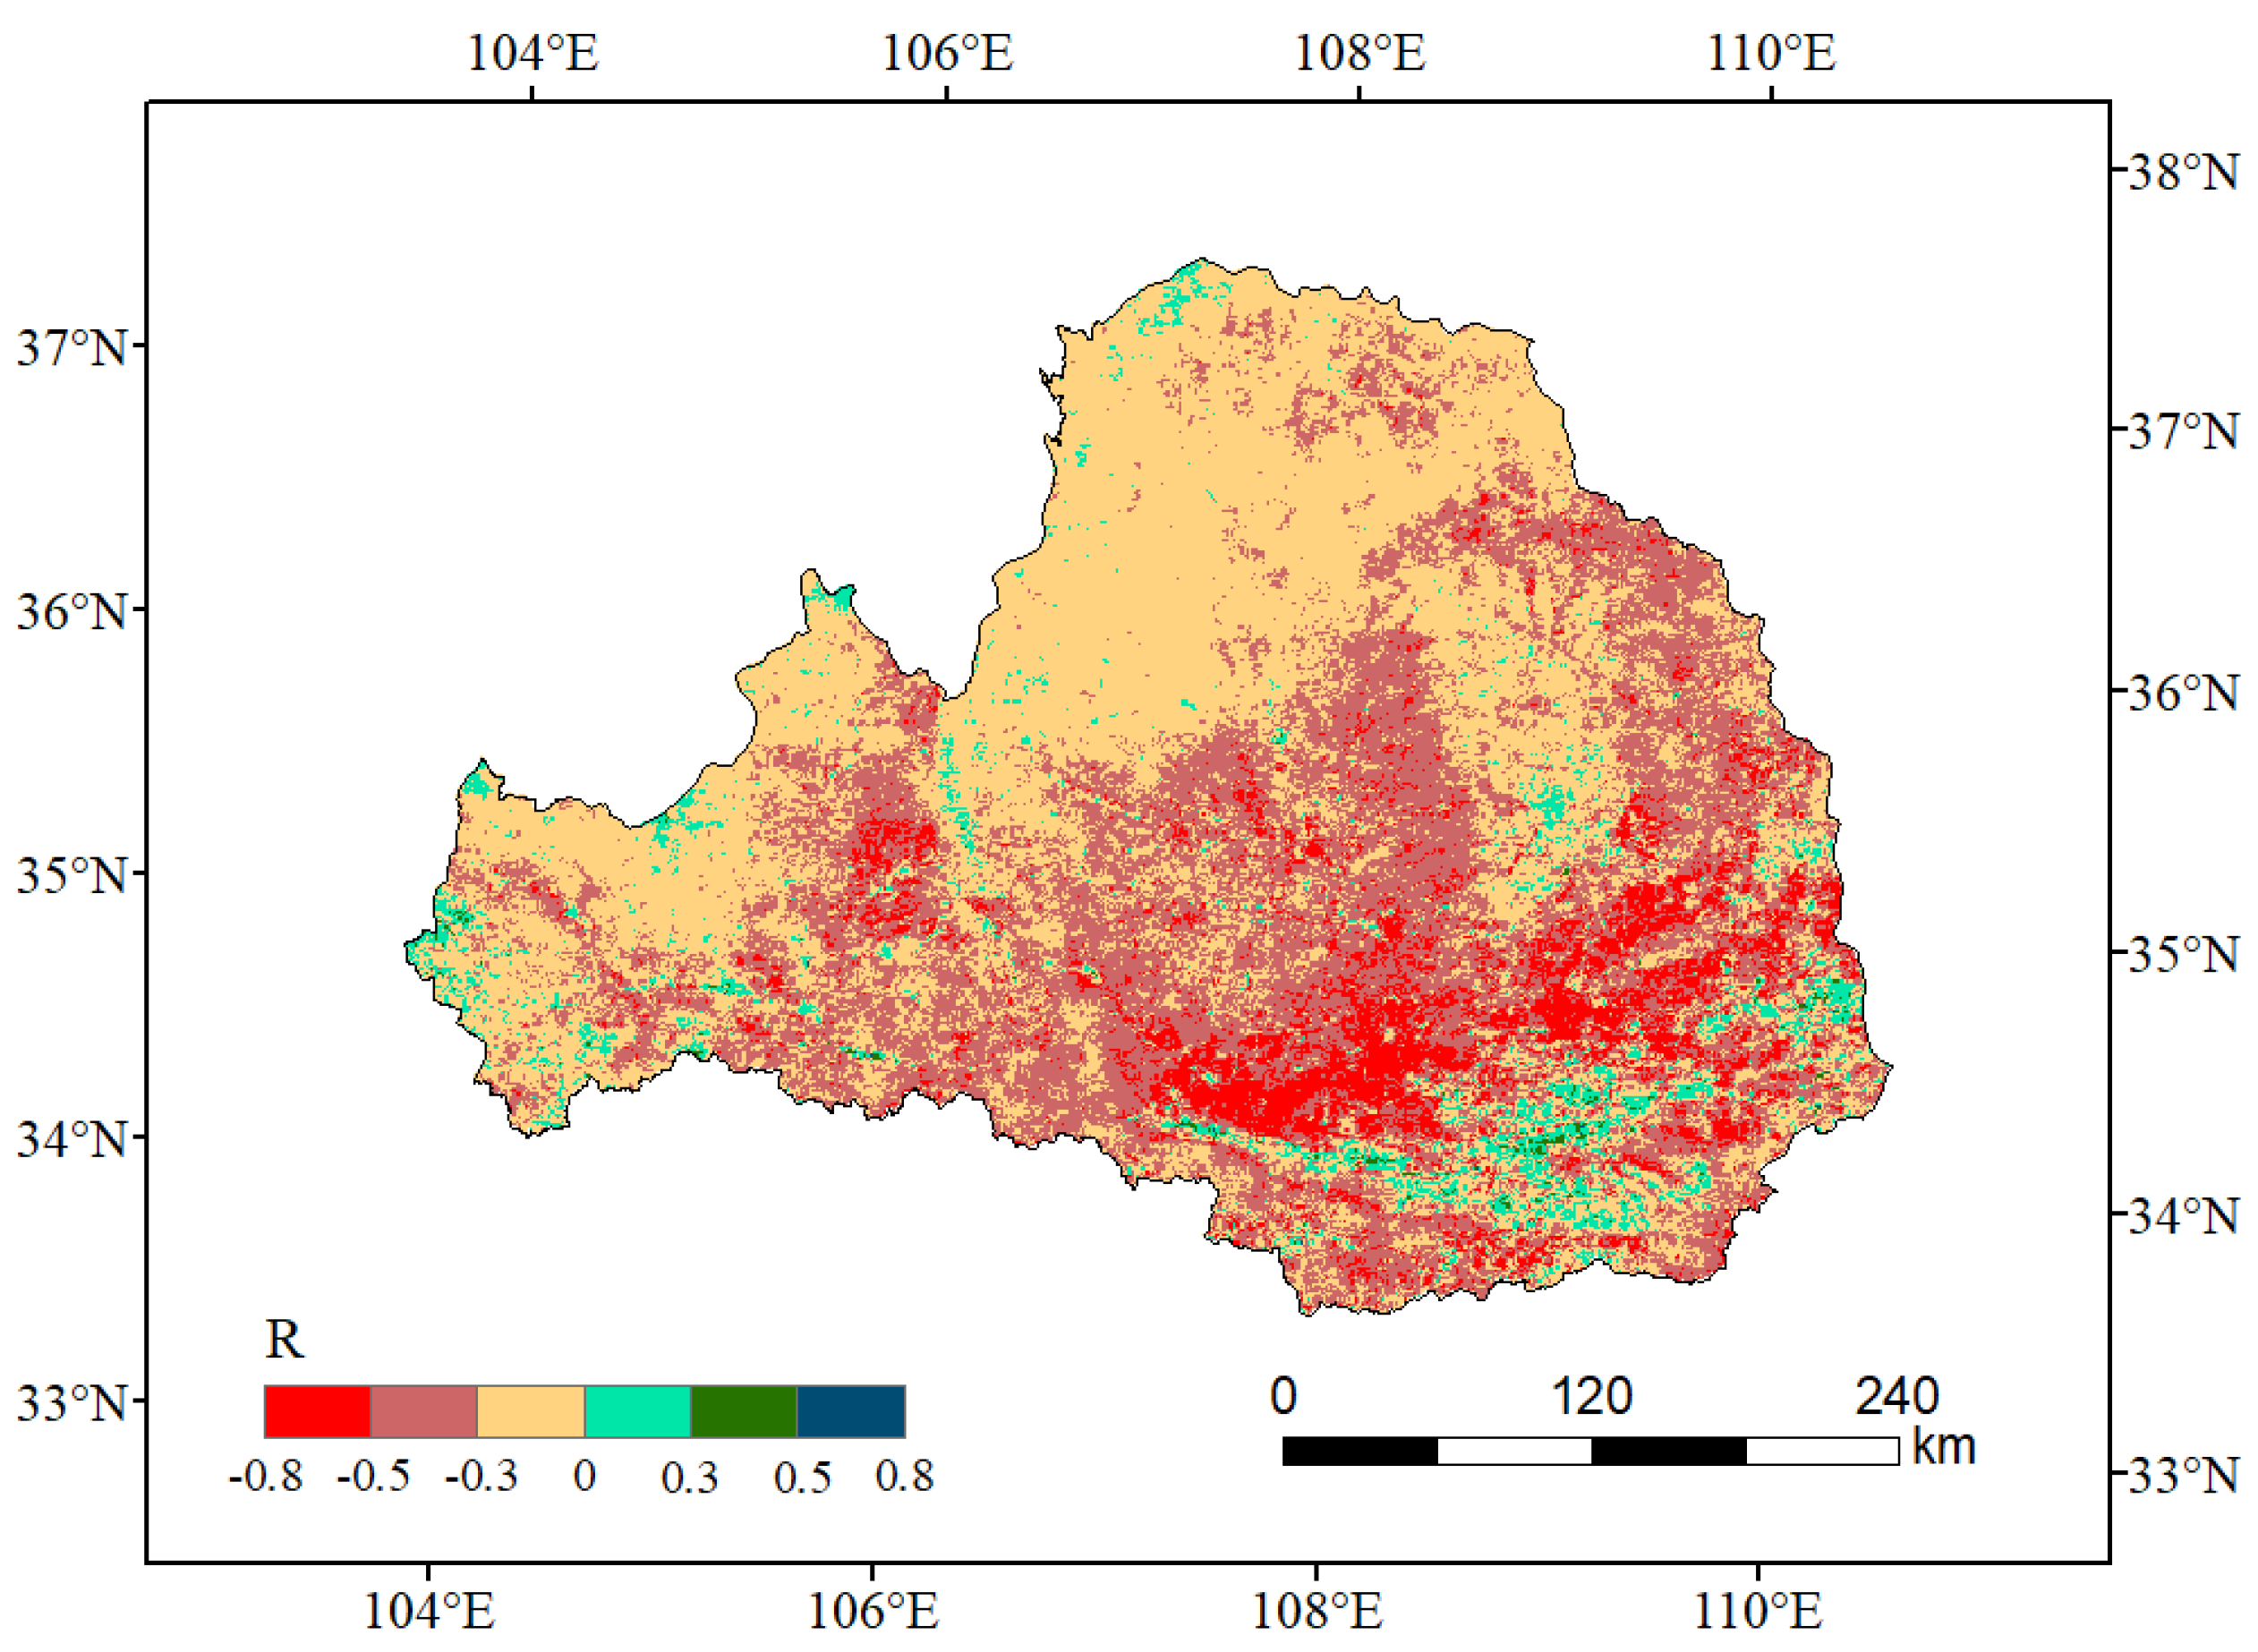
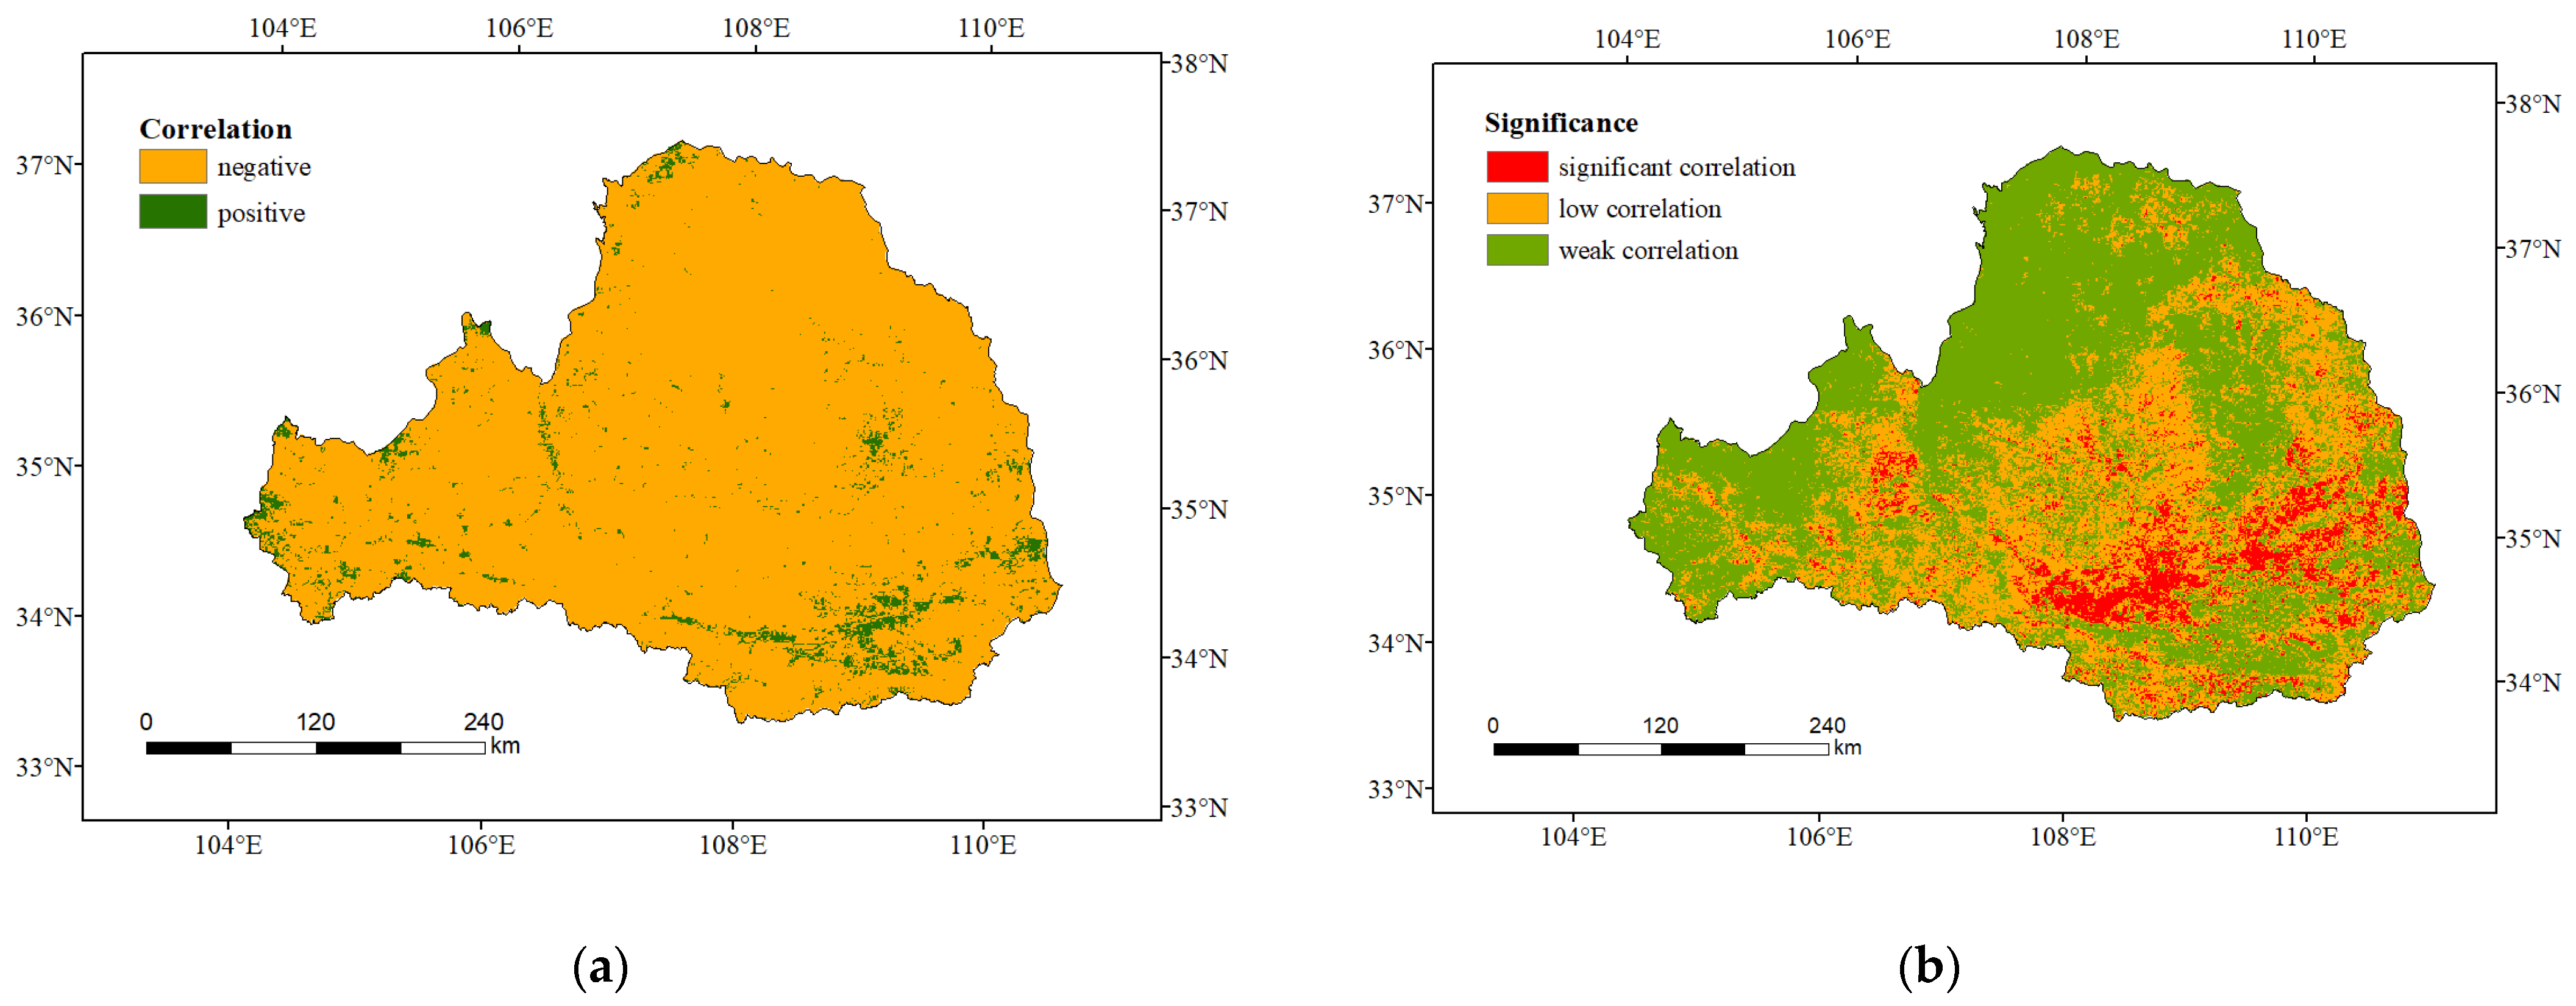
The spatial correlation between water storage variation and NDVI in the WRB is shown in Figure 16. It can be seen that there are significant differences in the response of water storage changes and NDVI, with correlation coefficients ranging from −0.8 to 0.8. According to Figure 16 and Table 4, the NDVI of vegetation in the region mainly showed negative correlations, and the areas with negative correlation coefficients accounted for 95.4%. In comparison, the areas with positive correlations accounted for 4.6%, primarily distributed along the WRB.
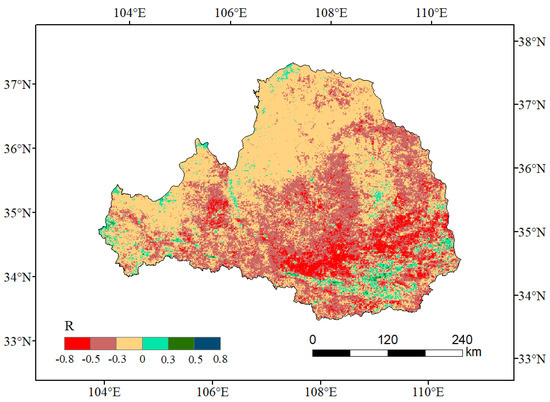
Figure 16.
Spatial-scale correlation between water storage and NDVI.

Table 4.
Spatial-scale correlation grade classification statistics.
To more intuitively see the impact and significance of the correlation between water storage and NDVI at this site, the correlation coefficients were divided into positive and negative correlations, and the significance was divided into weak, low, and significant correlations. According to Figure 17 and Table 5 and Table 6, the spatial correlation between water storage and NDVI in the WRB is mainly negative, accounting for 95.4% of the study area. In comparison, the positive correlation only accounts for 4.6%, mainly in the coastal and western areas of the WRB. The weak correlations are mainly in the Loess Plateau hills and valleys in the northwest, where the elevation is high and the vegetation cover is low. Xi‘an and other densely populated cities also show a weak correlation. The areas with low correlation are mainly the central areas, especially agricultural planting areas. And the significant correlations are in the central grassland areas and the forest areas in the south. Therefore, it is also understandable why there is a large probability of a negative correlation between TWS and NDVI in WRB, which has been confirmed by Zhao et al. [57] and Ghorbanian et al. [58]. Therefore, it shows the degree of correlation in this region is highly correlated with vegetation type.
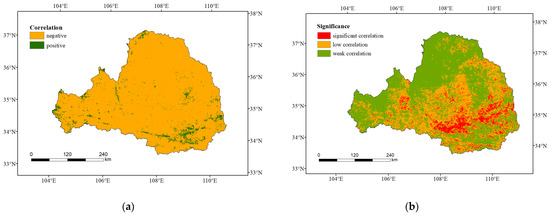
Figure 17.
(a) Spatial scale correlation classification of water storage and NDVI; (b) significance classification.

Table 5.
Spatial-scale correlation statistics of water storage and NDVI.

Table 6.
Spatial scale significance classification statistics of water storage and NDVI.
5. Discussion
5.1. Main Influencing Factor of TWS
In our study, we also use precipitation, temperature, and evapotranspiration to discuss their effects on TWS. Obviously, the main reason for the change of TWS is the influence of precipitation, with evapotranspiration and temperature accounting for a small part. It is not difficult to understand that precipitation can be regarded as the main source of water storage input, while evapotranspiration is one of the destinations of TWS output, and the change in temperature will affect precipitation and evapotranspiration to a certain extent. Because of the implementation of the ecological policy, the vegetation in this study area has obviously turned green. Some studies [59,60] show that the water consumption function of vegetation in arid and semi-arid areas exceeds the water storage function. Zhou et al. [61] show that the water consumption function of vegetation in the Loess Plateau is dominant. This is consistent with the result that the change in water reserves is negatively correlated with NDVI in a large area. Therefore, the increase in NDVI is also one of the factors that affect the decrease in TWS in WRB.
5.2. Main Influencing Factor of NDVI
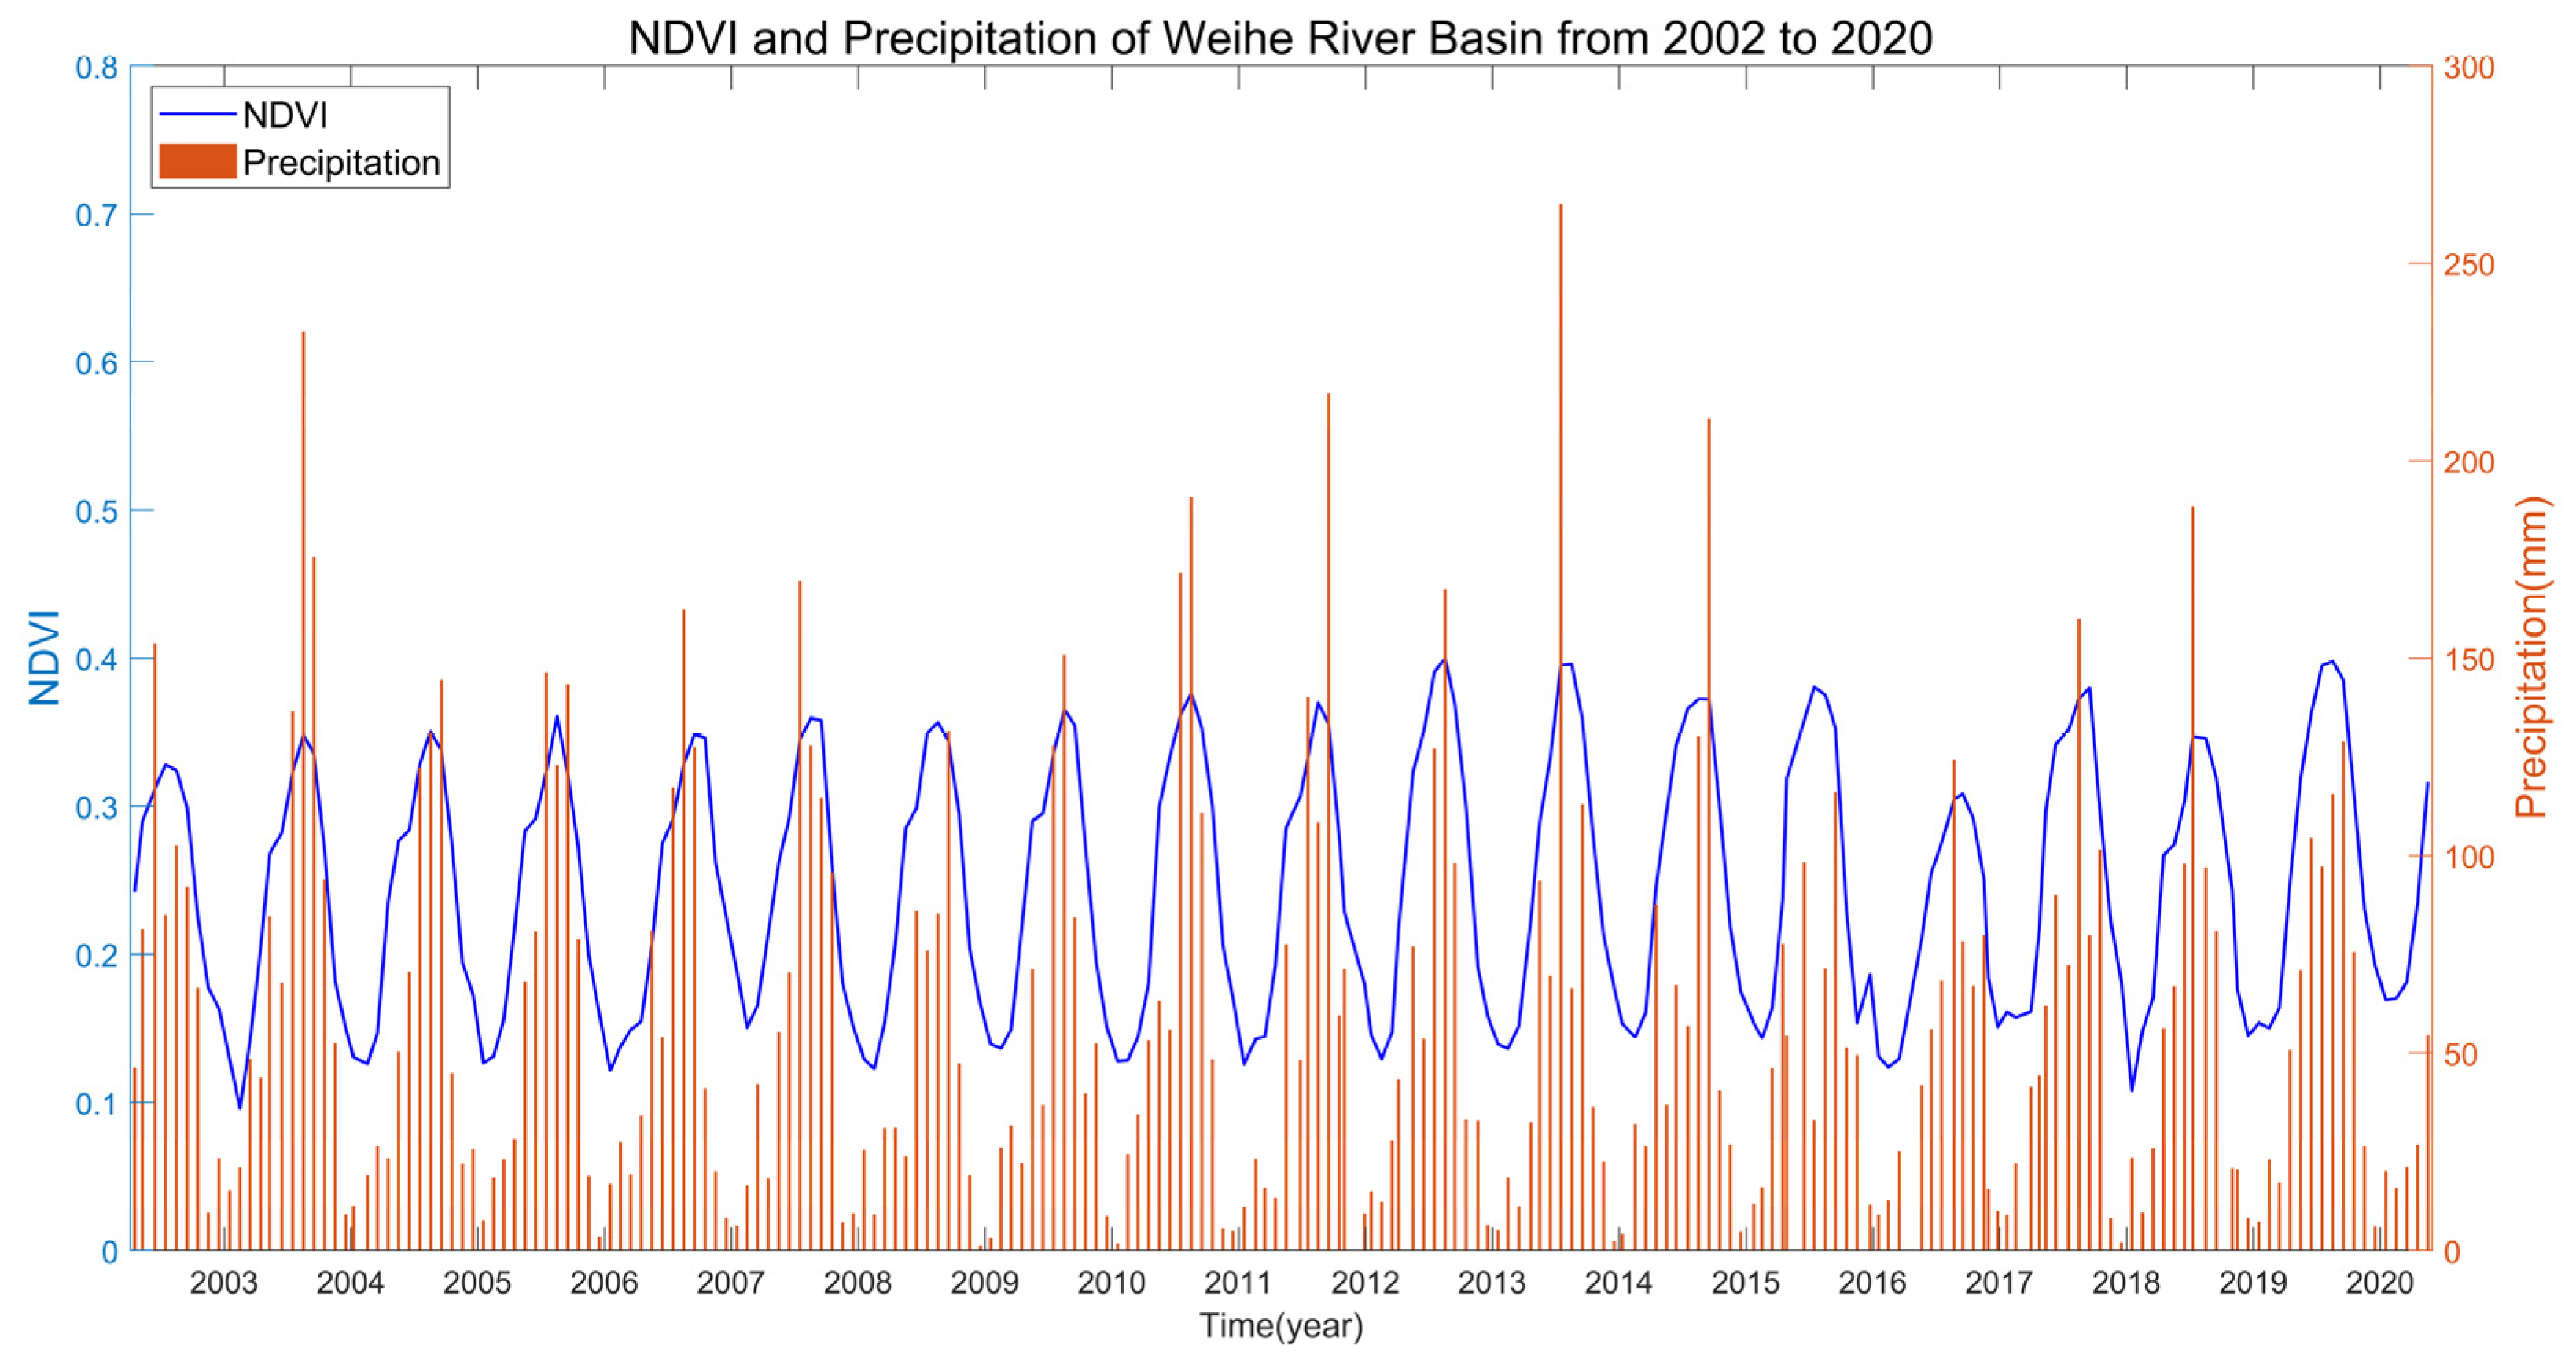
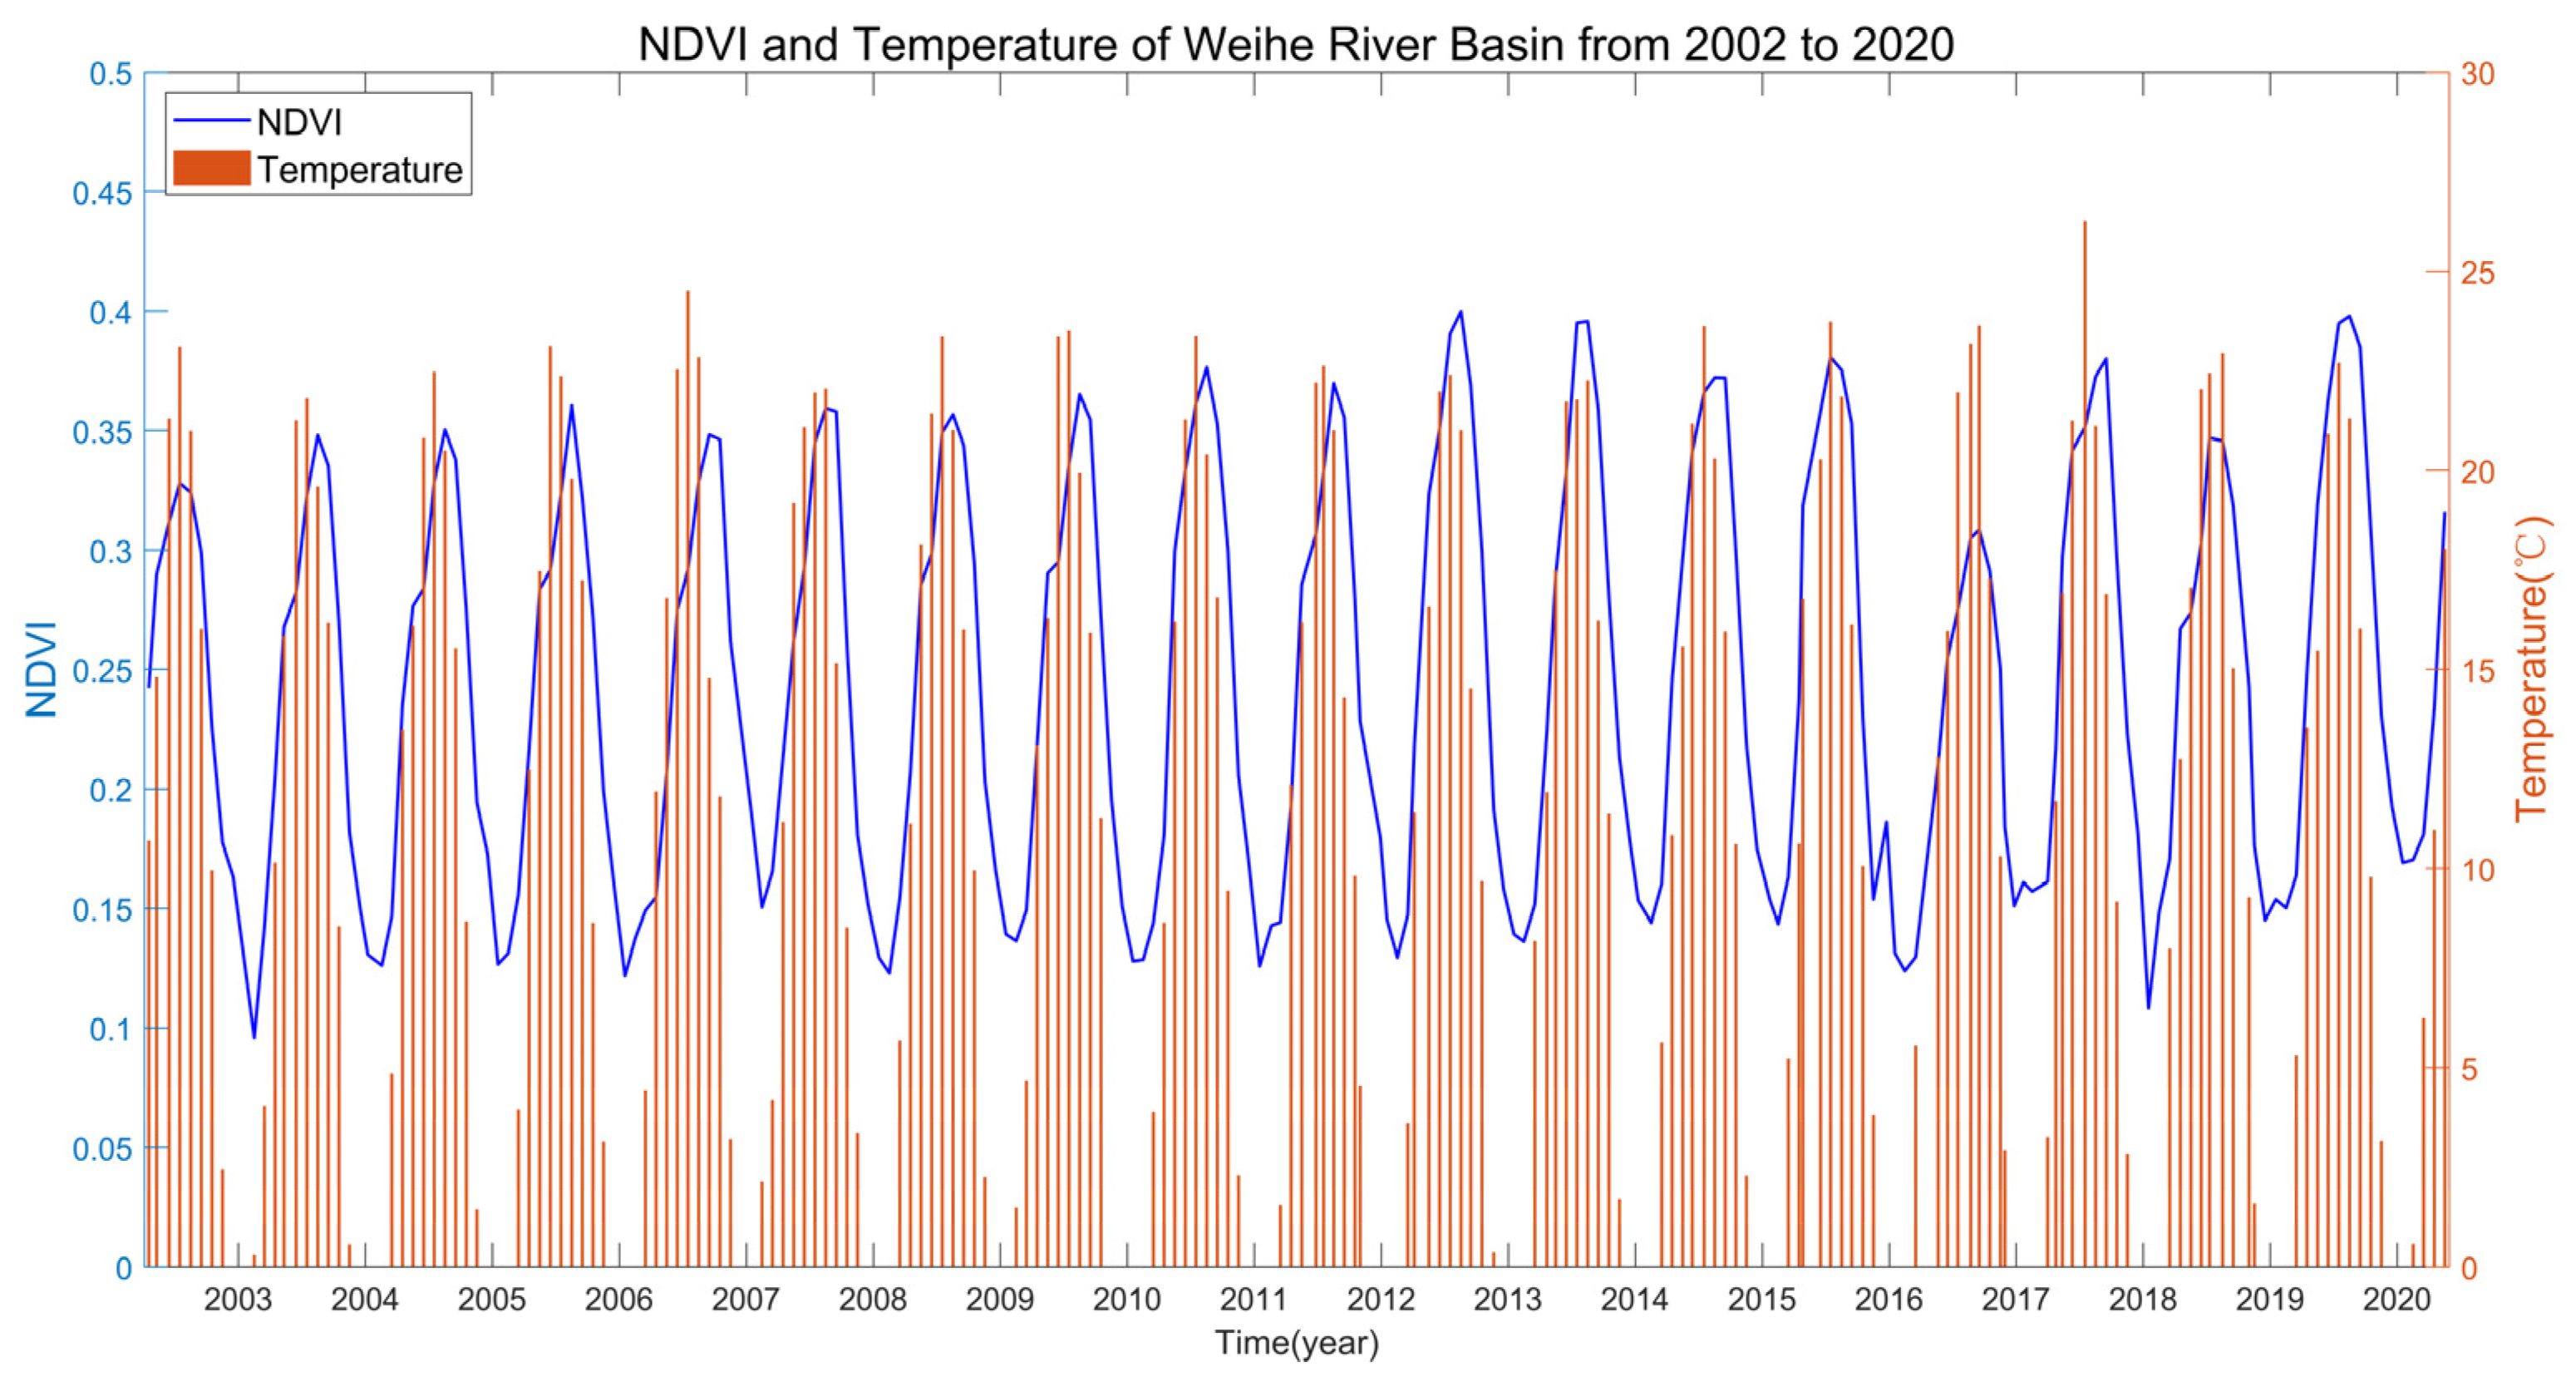
We all know that precipitation and temperature are the direct factors of vegetation growth, so we combine them with NDVI for analysis. The results are shown in Figure 18 and Figure 19. Through calculation, we get that the correlation between precipitation and NDVI is 0.9, and the correlation between temperature and NDVI is 0.88. Therefore, the change of NDVI is mainly influenced by precipitation and temperature.
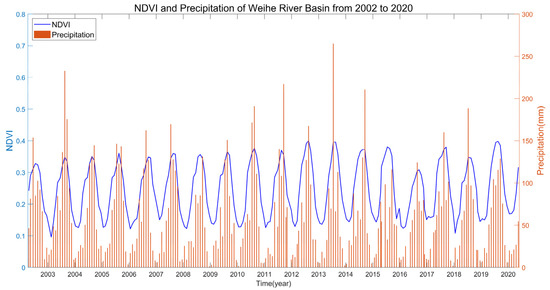
Figure 18.
NDVI and Precipitation in WRB.
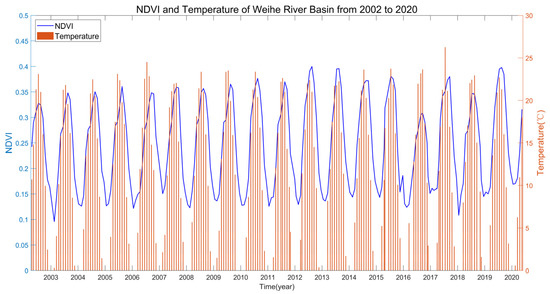
Figure 19.
NDVI and Temperature in WRB.
5.3. NDVI and TWS Correlation Analysis
As for the reason for the 3-month lag between the change in water storage and the change of NDVI, it is understandable to us because the growth of plants does not have an immediate effect on the change of water.
For the spatial scale, 95.4% of the regional area shows a negative correlation and the correlation is not high, which is something we should explore. First of all, if the influence of rainfall temperature on NDVI is greater, then the influence of TWS on NDVI will be lower. Then, WRB terrain is high in the northwest and low in the southeast, which leads to less water reserves in areas with high terrain and more water reserves in areas with gentle terrain. However, due to the dense population and abundant agricultural production in the plain area, a large amount of irrigation water makes the consumption of water reserves increase, even in a downward trend. However, due to the large-scale restoration of local vegetation, NDVI shows a large-scale increasing trend, which will lead to this large-scale negative correlation trend. It has also been shown that this is due to the response of vegetation growth to water and climate varies with vegetation type [7], as well as the different sensitivity of vegetation to TWS [62], and the increase in vegetation cover is the main reason for the increase in evapotranspiration and the decrease in TWS [31]. Within this, there are different degrees of negative correlations, the vegetation type in the northwest is mainly sparse grassland, and the correlation with water is mainly weak, despite the increasing trend of NDVI. In the Jinghe and Beiluohe regions, the impact on vegetation is also significantly increased due to the more abundant water storage. Still, the vegetation type is mainly cultivated plants and disturbed by human factors, so the region shows a low correlation. In the Qinling and Ziwuling forest areas, the growth trend of NDVI is weak. Although dense trees consume a lot of water, they also have strong water and soil conservation ability, and the change in water reserves is not obvious, so the correlation of forest areas will also show a low correlation. In the Jing River Valley and the Beiluo River Valley, this area is the gathering place of shrubs and other vegetation, and it is also the best area for agricultural cultivation, which consumes a lot of water resources. At the same time, NDVI increases significantly, resulting in a highly significant negative correlation. Of course, these are the results based on the discussion of this study, and the specific causes are certainly more complex, which is subject to further research.
6. Conclusions
Weihe River is the largest tributary of the Yellow River of China. To better understand the ecological change in WRB, this study investigated the spatial and temporal variation of NDVI of vegetation in the WRB from April 2002 to May 2020 and the variation of TWS, and discussed the response relationship between them. The results demonstrate the following.
The NDVI in the WRB shows a prominent increasing trend, with higher NDVI values in the south and smaller NDVI values in the northwest, gradually increasing from northwest to southeast. In addition, the overall trend of NDVI is more obvious, and the browning rate is higher than the greening rate. Only 23.1% of the areas show a decreasing trend of NDVI, among which, the extremely significant decreasing areas are located in the densely populated urban areas. Meanwhile, the extremely significant increasing areas account for 30.1% and are located in the Loess Plateau area in the northwest, which proves that the vegetation cover is increasing at a great rate. Water storage in the WRB shows a decreasing trend, with the annual average water storage showing a gradual decrease from the northwest to the southeast, and the sharpness of the decline in water storage gradually aggravates from the west to the northeast. It is probably the result of multiple factors. In particular, rainfall was the main factor. Temperature and evaporation dispersion also have an effect.
The correlation analysis shows a consistent trend and intra-annual pattern between TWS and NDVI, which indicates some consistency between the changes in water storage and NDVI in the region. There is a great correlation between them in time scale, and the lag of NDVI to TWS is about 3 months. On the spatial scale, there is a significant difference in the response relationship between them, mainly showing a negative correlation, and the significant degree is different, mainly as follows: the correlation is weak in the hilly areas of the Loess Plateau with low vegetation coverage and high altitude areas, and densely populated cities such as Xi’an; the middle agricultural planting area is a low correlation; the significant correlation areas are the grass gathering area in the middle and the forest area in the south, which also indicates that the correlation degree is related to vegetation types.
Overall, the existing results have confirmed the basic feasibility of using GRACE TWS as a tool to explore the hydrological impact of plant greenness and the interaction between vegetation greenness and land water conditions. In particular, TWS is considered as an ideal index to study the impact of vegetation change on land water conditions [25]. Therefore, the interaction between TWS and vegetation in the WRB studied in this paper is feasible and helps to improve the understanding of the relationship between terrestrial water and vegetation change in the region. However, this study only provides preliminary progress of the relationship between TWS and vegetation NDVI in the WRB, which needs to be investigated further. The next step is to further study the specific reasons for the correlation between TWS and NDVI.
Author Contributions
Conceptualization, Z.W. and X.W.; methodology, Z.W. and X.W.; software, Z.W.; validation, Z.W.; formal analysis, X.W.; investigation, Z.W. and X.W.; resources, X.W.; data curation, Z.W.; writing—original draft preparation, Z.W.; writing—review and editing, Z.W. and X.W; supervision, X.W.; funding acquisition, X.W. All authors have read and agreed to the published version of the manuscript.
Funding
This study was supported National Natural Science Fundation of China (No. 42074017) and the Fundamental Research Funds for the Central Universities (No. 2-9-2022-701).
Institutional Review Board Statement
Not applicable.
Informed Consent Statement
Not applicable.
Data Availability Statement
The NDVI datasets supporting the reported results of this paper are publicly available from the Google Earth Engine data catalog. The GRACE and GRACE-FO can be downloaded from website: http://icgem.gfz-potsdam.de/series/10.5067/GFL20-MC060, accessed on 7 November 2021.
Acknowledgments
The authors would like to thank the National Tibetan Plateau Data Center (http://data.tpdc.ac.cn, accessed on 15 November 2021.) for providing the dataset used in this study. We also would like to thank ICGEM for providing GRACE and GRACE-FO data. We also sincerely thank the ECMWF for providing reanalysis data. (https://cds.climate.copernicus.eu/cdsapp#!/home, accessed on 5 July 2022).
Conflicts of Interest
The authors declare no conflict of interest.
References
- Zhang, J.X.; Zhang, D.Y.; Liu, W.F.; Zhang, Y.L. Analysis on the change trend of vegetation index in the wei river basin of the Loess Plateau from 2000 to 2016. In Proceedings of the 3rd International Workshop on Renewable Energy and Development (IWRED), Guangzhou, China, 8–10 March 2019. [Google Scholar]
- Rodell, M.; Famiglietti, J.S. Detectability of variations in continental water storage from satellite observations of the time dependent gravity field. Water Resour. Res. 1999, 35, 2705–2723. [Google Scholar] [CrossRef]
- Behrangi, A.; Gardner, A.S.; Reager, J.T.; Fisher, J.B. Using GRACE to constrain precipitation amount over cold mountainous basins. Geophys. Res. Lett. 2017, 44, 219–227. [Google Scholar] [CrossRef]
- Zhang, G.Q.; Yao, T.D.; Shum, C.K.; Yi, S.; Yang, K.; Xie, H.J.; Feng, W.; Bolch, T.; Wang, L.; Behrangi, A.; et al. Lake volume and groundwater storage variations in Tibetan Plateau’s endorheic basin. Geophys. Res. Lett. 2017, 44, 5550–5560. [Google Scholar] [CrossRef]
- Meng, F.C.; Su, F.G.; Li, Y.; Tong, K. Changes in Terrestrial Water Storage During 2003-2014 and Possible Causes in Tibetan Plateau. J. Geophys. Res. Atmos. 2019, 124, 2909–2931. [Google Scholar] [CrossRef]
- Chen, C.; Park, T.; Wang, X.; Piao, S.; Xu, B.; Chaturvedi, R.K.; Fuchs, R.; Brovkin, V.; Ciais, P.; Fensholt, R.; et al. China and India lead in greening of the world through land-use management. Nat. Sustain. 2019, 2, 122–129. [Google Scholar] [CrossRef]
- Chu, H.; Venevsky, S.; Wu, C.; Wang, M. NDVI-based vegetation dynamics and its response to climate changes at Amur-Heilongjiang River Basin from 1982 to 2015. Sci. Total Environ. 2019, 650, 2051–2062. [Google Scholar] [CrossRef]
- Pakeman, R.J.; Fielding, D.A.; Everts, L.; Littlewood, N.A.; Thompson, D. Long-term impacts of changed grazing regimes on the vegetation of heterogeneous upland grasslands. J. Appl. Ecol. 2019, 56, 1794–1805. [Google Scholar] [CrossRef]
- Pan, N.; Feng, X.; Fu, B.; Wang, S.; Ji, F.; Pan, S. Increasing global vegetation browning hidden in overall vegetation greening: Insights from time-varying trends. Remote Sens. Environ. 2018, 214, 59–72. [Google Scholar] [CrossRef]
- Sidi Almouctar, M.A.; Wu, Y.; Kumar, A.; Zhao, F.; Mambu, K.J.; Sadek, M. Spatiotemporal analysis of vegetation cover changes around surface water based on NDVI: A case study in Korama basin, Southern Zinder, Niger. Appl. Water Sci. 2020, 11, 4. [Google Scholar] [CrossRef]
- Hu, R.; Wang, Y.; Chang, J.; Istanbulluoglu, E.; Guo, A.; Meng, X.; Li, Z.; He, B.; Zhao, Y. Coupling water cycle processes with water demand routes of vegetation using a cascade causal modeling approach in arid inland basins. Sci. Total Environ. 2022, 840, 156492. [Google Scholar] [CrossRef]
- Fu, B.; Burgher, I. Riparian vegetation NDVI dynamics and its relationship with climate, surface water and groundwater. J. Arid Environ. 2015, 113, 59–68. [Google Scholar] [CrossRef]
- Seydi, S.T.; Amani, M.; Ghorbanian, A. A Dual Attention Convolutional Neural Network for Crop Classification Using Time-Series Sentinel-2 Imagery. Remote Sens. 2022, 14, 498. [Google Scholar] [CrossRef]
- Amani, M.; Mahdavi, S.; Kakooei, M.; Ghorbanian, A.; Brisco, B.; DeLancey, E.; Toure, S.; Reyes, E.L. Wetland Change Analysis in Alberta, Canada Using Four Decades of Landsat Imagery. IEEE J. Sel. Top. Appl. Earth Obs. Remote Sens. 2021, 14, 10314–10335. [Google Scholar] [CrossRef]
- Petersen, L. Real-Time Prediction of Crop Yields From MODIS Relative Vegetation Health: A Continent-Wide Analysis of Africa. Remote Sens. 2018, 10, 1726. [Google Scholar] [CrossRef]
- Koirala, S.; Jung, M.; Reichstein, M.; de Graaf, I.E.M.; Camps-Valls, G.; Ichii, K.; Papale, D.; Ráduly, B.; Schwalm, C.R.; Tramontana, G.; et al. Global distribution of groundwater-vegetation spatial covariation. Geophys. Res. Lett. 2017, 44, 4134–4142. [Google Scholar] [CrossRef]
- Papagiannopoulou, C.; Miralles, D.G.; Dorigo, W.A.; Verhoest, N.E.C.; Depoorter, M.; Waegeman, W. Vegetation anomalies caused by antecedent precipitation in most of the world. Environ. Res. Lett. 2017, 12, 074016. [Google Scholar] [CrossRef]
- Xu, S.; Yu, Z.; Lettenmaier, D.P.; McVicar, T.R.; Ji, X. Elevation-dependent response of vegetation dynamics to climate change in a cold mountainous region. Environ. Res. Lett. 2020, 15, 094005. [Google Scholar] [CrossRef]
- Zhang, H.; Zhan, C.; Xia, J.; Yeh, P.J. Responses of vegetation to changes in terrestrial water storage and temperature in global mountainous regions. Sci. Total Environ. 2022, 851, 158416. [Google Scholar] [CrossRef]
- Zhao, M.; Wang, Y.; Liu, S.; Zhong, P.A.; Liu, H.; Li, R. Correlation assessment of NDVI and land use dynamics with water resources for the southern margin of Mu Us Sandy Land, China. Environ. Sci. Pollut. Res. Int. 2022, 29, 17049–17061. [Google Scholar] [CrossRef]
- Tapley, B.D.; Watkins, M.M.; Flechtner, F.; Reigber, C.; Bettadpur, S.; Rodell, M.; Sasgen, I.; Famiglietti, J.S.; Landerer, F.W.; Chambers, D.P.; et al. Contributions of GRACE to understanding climate change. Nat. Clim. Change 2019, 5, 358–369. [Google Scholar] [CrossRef]
- Hu, L.; Jiao, J.J. Calibration of a large-scale groundwater flow model using GRACE data: A case study in the Qaidam Basin, China. Hydrogeol. J. 2015, 23, 1305–1317. [Google Scholar] [CrossRef]
- Zeng, Z.; Piao, S.; Li, L.Z.X.; Wang, T.; Ciais, P.; Lian, X.; Yang, Y.; Mao, J.; Shi, X.; Myneni, R.B. Impact of Earth Greening on the Terrestrial Water Cycle. J. Clim. 2018, 31, 2633–2650. [Google Scholar] [CrossRef]
- Yang, Y.; Long, D.; Guan, H.; Scanlon, B.R.; Simmons, C.T.; Jiang, L.; Xu, X. GRACE satellite observed hydrological controls on interannual and seasonal variability in surface greenness over mainland Australia. J. Geophys. Res. Biogeosci. 2014, 119, 2245–2260. [Google Scholar] [CrossRef]
- Xie, X.; He, B.; Guo, L.; Miao, C.; Zhang, Y. Detecting hotspots of interactions between vegetation greenness and terrestrial water storage using satellite observations. Remote Sens. Environ. 2019, 231, 111259. [Google Scholar] [CrossRef]
- Andrew, R.L.; Guan, H.; Batelaan, O. Large-scale vegetation responses to terrestrial moisture storage changes. Hydrol. Earth Syst. Sci. 2017, 21, 4469–4478. [Google Scholar] [CrossRef]
- Chen, A.; Guan, H.; Batelaan, O. Non-linear interactions between vegetation and terrestrial water storage in Australia. J. Hydrol. 2022, 613, 128336. [Google Scholar] [CrossRef]
- Chen, Y.; Yang, Q.; Luo, Y.; Shen, Y.; Pan, X.; Li, L.; Li, Z. Ponder on the issues of water resources in the arid region of northwest China. Arid Land Geogr. 2012, 35, 1–9. [Google Scholar]
- Meng, X.; Chen, H.; Li, Z.; Zhao, L.; Zhou, B.; Lu, S.; Deng, M.; Liu, Y.; Li, G. Review of Climate Change and Its Environmental Influence on the Three-River Regions. Plateau Meteorol. 2020, 39, 1133–1143. [Google Scholar]
- Zuo, D.P.; Xu, Z.X.; Wu, W.; Zhao, J.; Zhao, F.F. Identification of Streamflow Response to Climate Change and Human Activities in the Wei River Basin, China. Water Resour. Manag. 2014, 28, 833–851. [Google Scholar] [CrossRef]
- Li, C.; Zhang, Y.; Shen, Y.; Yu, Q. Decadal water storage decrease driven by vegetation changes in the Yellow River Basin. Sci. Bull. 2020, 65, 1859–1861. [Google Scholar] [CrossRef]
- Zhang, D.; Zuo, X.; Zang, C. Assessment of future potential carbon sequestration and water consumption in the construction area of the Three-North Shelterbelt Programme in China. Agric. For. Meteorol. 2021, 303, 108377. [Google Scholar] [CrossRef]
- Han, Y.; Xia, F.; Huang, H.; Mu, W.; Jia, D. Impact of the Grain for Green Project on water resources and ecological water stress in the Yanhe River Basin. PLoS ONE 2022, 17, e0259611. [Google Scholar] [CrossRef] [PubMed]
- Wang, Z.; Peng, D.; Xu, D.; Zhang, X.; Zhang, Y. Assessing the water footprint of afforestation in Inner Mongolia, China. J. Arid Environ. 2020, 182, 104257. [Google Scholar] [CrossRef]
- Liu, Y.; Miao, H.-T.; Huang, Z.; Cui, Z.; He, H.; Zheng, J.; Han, F.; Chang, X.; Wu, G.-L. Soil water depletion patterns of artificial forest species and ages on the Loess Plateau (China). For. Ecol. Manag. 2018, 417, 137–143. [Google Scholar] [CrossRef]
- Jiang, C.; Wang, F.; Mu, X. Changes of Relative Humidity and Vegetation Coverage and Their Reciprocal Response in Weihe River Basin. Bull. Soil Water Conserv. 2012, 32, 122–127. [Google Scholar]
- Pang, J.; Duan, J.; Zhang, R.; Lyu, J. Characteristics of Spatiotemporal Evolution and Climate Response of Vegetation Cover in the Wei River Basin from 2000to 2019. Res. Soil Water Conserv. 2021, 28, 230–237. [Google Scholar]
- Zhang, Y.; Zhang, B.; Yao, R.; Wang, L. Temporal and spatial changes of vegetation coverage and water production in theWeihe River Basin from 2000 to 2020. J. Desert Res. 2022, 42, 223–233. [Google Scholar]
- Chang, J.X.; Wang, Y.M.; Istanbulluoglu, E.; Bai, T.; Huang, Q.; Yang, D.W.; Huang, S.Z. Impact of climate change and human activities on runoff in the Weihe River Basin, China. Quat. Int. 2015, 380, 169–179. [Google Scholar] [CrossRef]
- Dawei, X.; Yaorong, W.; Yufang, Z. Influence and cause analysis for the runoff change in Weihe River. J. Water Resour. Water Eng. 2007, 18, 1–4. [Google Scholar]
- Yuan, F.; Ma, M.W.; Ren, L.L.; Shen, H.R.; Li, Y.; Jiang, S.H.; Yang, X.L.; Zhao, C.X.; Kong, H. Possible Future Climate Change Impacts on the Hydrological Drought Events in the Weihe River Basin, China. Adv. Meteorol. 2016, 2016, 2905198. [Google Scholar] [CrossRef]
- Nemani, R.R.; Keeling, C.D.; Hashimoto, H.; Jolly, W.M.; Piper, S.C.; Tucker, C.J.; Myneni, R.B.; Running, S.W. Climate-driven increases in global terrestrial net primary production from 1982 to 1999. Science 2003, 300, 1560–1563. [Google Scholar] [CrossRef] [PubMed]
- Chang, L.; Sun, W. Consistency analysis of GRACE and GRACE-FO data in the study of global mean sea level change. Geod. Geodyn. 2022, 13, 321–326. [Google Scholar] [CrossRef]
- Chen, J.L.; Wilson, C.R. Low degree gravitational changes from earth rotation and geophysical models. Geophys. Res. Lett. 2003, 30, 2257. [Google Scholar] [CrossRef]
- Swenson, S.; Wahr, J. Post-processing removal of correlated errors in GRACE data. Geophys. Res. Lett. 2006, 33, L08402. [Google Scholar] [CrossRef]
- Yulong, Z.; Wei, F.; Min, Z.; Zutao, M. Dataset of Reconstructed Terrestrial Water Storage in China Based on Precipitation (2002–2019); National Tibetan Plateau Data Center: Beijing, China, 2020. [Google Scholar] [CrossRef]
- Zhong, Y.; Feng, W.; Humphrey, V.; Zhong, M. Human-Induced and Climate-Driven Contributions to Water Storage Variations in the Haihe River Basin, China. Remote Sens. 2019, 11, 3050. [Google Scholar] [CrossRef]
- Gao, W.D.; Zheng, C.; Liu, X.H.; Lu, Y.D.; Chen, Y.F.; Wei, Y.; Ma, Y.D. NDVI-based vegetation dynamics and their responses to climate change and human activities from 1982 to 2020: A case study in the Mu Us Sandy Land, China. Ecol. Indic. 2022, 137, 108745. [Google Scholar] [CrossRef]
- Yang, T.; Huang, F.; Li, Q.; Bai, L.; Li, L. Spatial-temporal Variation of NDVI for Growing Season and Its Relationship with Winter Snowfall in Northern Xinjiang. Remote Sens. Technol. Appl. 2017, 32, 1132–1140. [Google Scholar]
- Wahr, J.; Molenaar, M.; Bryan, F. Time variability of the Earth’s gravity field: Hydrological and oceanic effects and their possible detection using GRACE. J. Geophys. Res. Solid Earth 1998, 103, 30205–30229. [Google Scholar] [CrossRef]
- Wahr, J.; Swenson, S.; Zlotnicki, V.; Velicogna, I. Time-variable gravity from GRACE: First results. Geophys. Res. Lett. 2004, 31, L11501. [Google Scholar] [CrossRef]
- Tian, F.; Yang, J.-H.; Du, R.-H.; Lin, J.-Y.; Chen, M.; Wu, J.-J. Sustained vegetation greening enhanced ecosystem water-use efficiency in the Loess Plateau of China in recent 20 years. Ecol. Eng. 2022, 184, 106768. [Google Scholar] [CrossRef]
- Yang, Y.; Fan, Y.; Basang, C.M.; Lu, J.; Zheng, C.; Wen, Z. Different biomass production and soil water patterns between natural and artificial vegetation along an environmental gradient on the Loess Plateau. Sci. Total Environ. 2022, 814, 152839. [Google Scholar] [CrossRef] [PubMed]
- Zhang, T.; Su, X.; Zhang, G.; Wu, H.; Wang, G.; Chu, J. Evaluation of the impacts of human activities on propagation from meteorological drought to hydrological drought in the Weihe River Basin, China. Sci. Total Environ. 2022, 819, 153030. [Google Scholar] [CrossRef] [PubMed]
- Zhang, B.; Shao, R.; Zhao, X.; Wu, P. Effects of Large-scale Vegetation Restoration on Eco-hydrological Processes Over the Loess Plateau, China. J. Basic Sci. Eng. 2020, 28, 594–606. [Google Scholar]
- Zhong, S.B.; Sun, Z.H.; Di, L.P. Characteristics of vegetation response to drought in the CONUS based on long-term remote sensing and meteorological data. Ecol. Indic. 2021, 127, 107767. [Google Scholar] [CrossRef]
- Zhao, Y.; Feng, Q.; Lu, A. Spatiotemporal variation in vegetation coverage and its driving factors in the Guanzhong Basin, NW China. Ecol. Inform. 2021, 64, 101371. [Google Scholar] [CrossRef]
- Ghorbanian, A.; Mohammadzadeh, A.; Jamali, S. Linear and Non-Linear Vegetation Trend Analysis throughout Iran Using Two Decades of MODIS NDVI Imagery. Remote Sens. 2022, 14, 3683. [Google Scholar] [CrossRef]
- Yang, L.; Wei, W.; Chen, L.D.; Chen, W.L.; Wang, J.L. Response of temporal variation of soil moisture to vegetation restoration in semi-arid Loess Plateau, China. Catena 2014, 115, 123–133. [Google Scholar] [CrossRef]
- Wang, Z.Q.; Liu, B.Y.; Liu, G.; Zhang, Y.X. Soil water depletion depth by planted vegetation on the Loess Plateau. Sci. China Ser. D Earth Sci. 2009, 52, 835–842. [Google Scholar] [CrossRef]
- Zhou, M.L.; Wang, X.L.; Sun, L.; Luo, Y. Spatial Variations in Terrestrial Water Storage with Variable Forces across the Yellow River Basin. Remote Sens. 2021, 13, 3416. [Google Scholar] [CrossRef]
- Liu, X.; Lai, Q.; Yin, S.; Bao, Y.; Qing, S.; Mei, L.; Bu, L. Exploring sandy vegetation sensitivities to water storage in China’s arid and semi-arid regions. Ecol. Indic. 2022, 136, 108711. [Google Scholar] [CrossRef]
Publisher’s Note: MDPI stays neutral with regard to jurisdictional claims in published maps and institutional affiliations. |
© 2022 by the authors. Licensee MDPI, Basel, Switzerland. This article is an open access article distributed under the terms and conditions of the Creative Commons Attribution (CC BY) license (https://creativecommons.org/licenses/by/4.0/).

