Article

Urban Flood-Related Remote Sensing: Research Trends, Gaps and Opportunities

1
Key Laboratory of Subsurface Hydrology and Ecological Effects in Arid Region, Ministry of Education, Chang’an University, Xi’an 710054, China
2
School of Water and Environment, Chang’an University, Xi’an 710054, China
3
Xi’an Monitoring, Modelling and Early Warning of Watershed Spatial Hydrology International Science and Technology Cooperation Base, Chang’an University, Xi’an 710054, China
4
Architectural Engineering College, Zhanjiang University of Science and Technology, Zhanjiang 524094, China
5
Shaanxi Key Laboratory of Earth Surface System and Environmental Carrying Capacity, College of Urban and Environmental Sciences, Northwest University, Xi’an 710127, China
6
School of Civil Engineering, Sun Yat-sen University, Guangzhou 510650, China
7
Guangdong Key Laboratory of Integrated Agro-Environmental Pollution Control and Management, Institute of Eco-environmental and Soil Sciences, Guangdong Academy of Sciences, Guangzhou 510650, China
*
Author to whom correspondence should be addressed.
Remote Sens. 2022, 14(21), 5505; https://doi.org/10.3390/rs14215505
Submission received: 12 September 2022 / Revised: 4 October 2022 / Accepted: 5 October 2022 / Published: 1 November 2022
(This article belongs to the Special Issue Remote Sensing in Natural Resource and Water Environment)

Abstract

:
As a result of urbanization and climate change, urban areas are increasingly vulnerable to flooding, which can have devastating effects on the loss of life and property. Remote sensing technology can provide practical help for urban flood disaster management. This research presents a review of urban flood-related remote sensing to identify research trends and gaps, and reveal new research opportunities. Based on the Preferred Reporting Items for Systematic Reviews and Meta-Analyses (PRISMA), the systematic literature search resulted in 347 documents classified as geography, disaster management application, and remote sensing data utilization. The main results include 1. most of the studies are located in high-income countries and territories and inland areas; 2. remote sensing for observing the environment was more popular than observing the building; 3. the most often applied disaster management activities were vulnerability assessment and risk modeling (mitigation) and rapid damage assessment (response); 4. DEM is often applied to simulate urban floods as software inputs. We suggest that future research directions include 1. coastal urban study areas in non-high-income countries/territories to help vulnerable populations; 2. understudied disaster management activities, which often need to observe the buildings in more urban areas; 3. data standardization will facilitate integration with international standard methods for assessing urban floods.

Graphical Abstract

1. Introduction

Floods have become one of the most common extreme natural events and represent a significant threat worldwide [1,2]. In the long term, floods cause more deaths than other weather-related events [3]. Recently, flood disasters have shown a growing frequency and intensity and account for 47% of extreme natural events [4,5,6]. Flooding is a multifaceted problem that can have a complex network of impacts affecting many sectors of the economy because floods can destroy buildings, roads, and bridges; cause mudslides; tear out trees; devastate agriculture; and threaten human lives [7,8]. Frequent floods can cause heavy property damage and threaten human health, especially in densely populated urban areas. Flooding in cities has a negative impact on people in both developed and developing countries [9,10,11]. Due to the rapid growth of the cities, the intense urbanization process, and dense population, with the rapid development of many areas, often with insufficient infrastructure, cities are at increased risk of flooding, and loss from flooding is expected to increase in urban areas substantially [12]. An increasing number of urban floods severely threatened sustainable urban development and people’s safety, leading to significant loss and damage [13,14]. In order to adapt and mitigate flooding risks, performing disaster management in urban flooding is indispensable and significant.
Disaster management usually consists of mitigation, preparedness, response, and recovery, whose missions are to mitigate disaster risk, prepare for disasters, save lives and minimize economic losses in disasters, and promote post-disaster recovery [15,16,17]. Remote sensing technology has played a crucial role in supporting disaster management functions, especially for rapid and sudden urban flood hazards [18]. An example of the remote-sensing-based mitigation function was the modeling software HAZUS (GIS risk assessment) developed by FEMA, which applies digital elevation models (DEM) based on remote sensing technology to predict floods and tsunamis [19,20,21]. An example of the preparedness function was the digitization and manual interpretation of remote sensing imagery by the Copernicus Emergency Management Service (EMS) to form pre-disaster baseline data reflecting natural and built features [22,23]. An example of the response function was rapid building damage mapping by Copernicus EMS based on a manual comparison of pre-disaster and post-disaster remote sensing images and flood extent mapping based on a semi-automatic analysis of pre-disaster and post-disaster remote sensing images [24]. An example of the recovery function was the monitoring reconstructions by the Copernicus EMS based on a manual comparison of multi-temporal remote sensing images [25,26,27].
In addition, the classification of remote sensing technology can be determined according to the type of sensor, as this is a variable identified in the study. Therefore, the sensor is defined as the instrument or device used to acquire remote sensing data. Depending on the radiation source, the sensor can be passive or active [28]. Remote sensing technology with passive sensors is based on the application of information obtained exclusively with passive sensors that detect radiation (natural energy) that is reflected or emitted from t objects depending on an external radiation source (sunlight) [29]. These methods allow classifying objects on the surface, determining land cover, etc. Remote sensing technology with active sensors: compared with passive sensors, active sensors are based on their own radiation source, which sends pulses to objects on the earth’s surface and measures the backscattering reflected back to the sensor [30].
Many articles have reviewed the applications of remote sensing technology in urban flooding [31,32,33]. These research works comprehensively interpreted specific applications related to urban flooding: detection, monitoring, risk assessment and modeling, impact assessment, protection structure inspection, and reconstruction monitoring. Most articles also provided relevant information on remote sensing platforms, data collection, data analysis, data processing, advantages, challenges, and limitations [34,35,36,37]. Existing knowledge on urban flood applications has contributed to the awareness of operational uses and potential standards of remote sensing to support disaster management, whereas most existing studies only provide a snapshot of the current development of the applications of remote sensing technology in urban flooding, show a partial view, and focus on a limited number of selected methods and approaches (mainly developed by researchers). Moreover, previous reviews do not allow us to comprehensively understand the development trends of the applications of remote sensing technology in urban flooding or introduce the research gaps and emerging fields. Only comprehensive analysis based on the disaster management applications, methodological consistency, and collective geography of existing studies can enable us to understand the research trends, gaps, and opportunities in the applications of remote sensing technology in urban flooding.
Systematic reviews are very scarce in the field of urban flood-related remote sensing. Based on existing knowledge, this research comprehensively reviews urban flood-related remote sensing to support the preparedness, mitigation, response, and recovery of urban flood disasters. The main objective of this research was to review the remote-sensing-related articles comprehensively. The remainder of this article is structured as follows. Section 2 applies a systematic literature search based on PRISMA. Section 3 summarizes statistics based on geography, disaster management application, and remote sensing data utilization, as well as explores urban flood-related remote sensing research trends and gaps. Section 4 presents recommendations for urban flood-related remote sensing research.

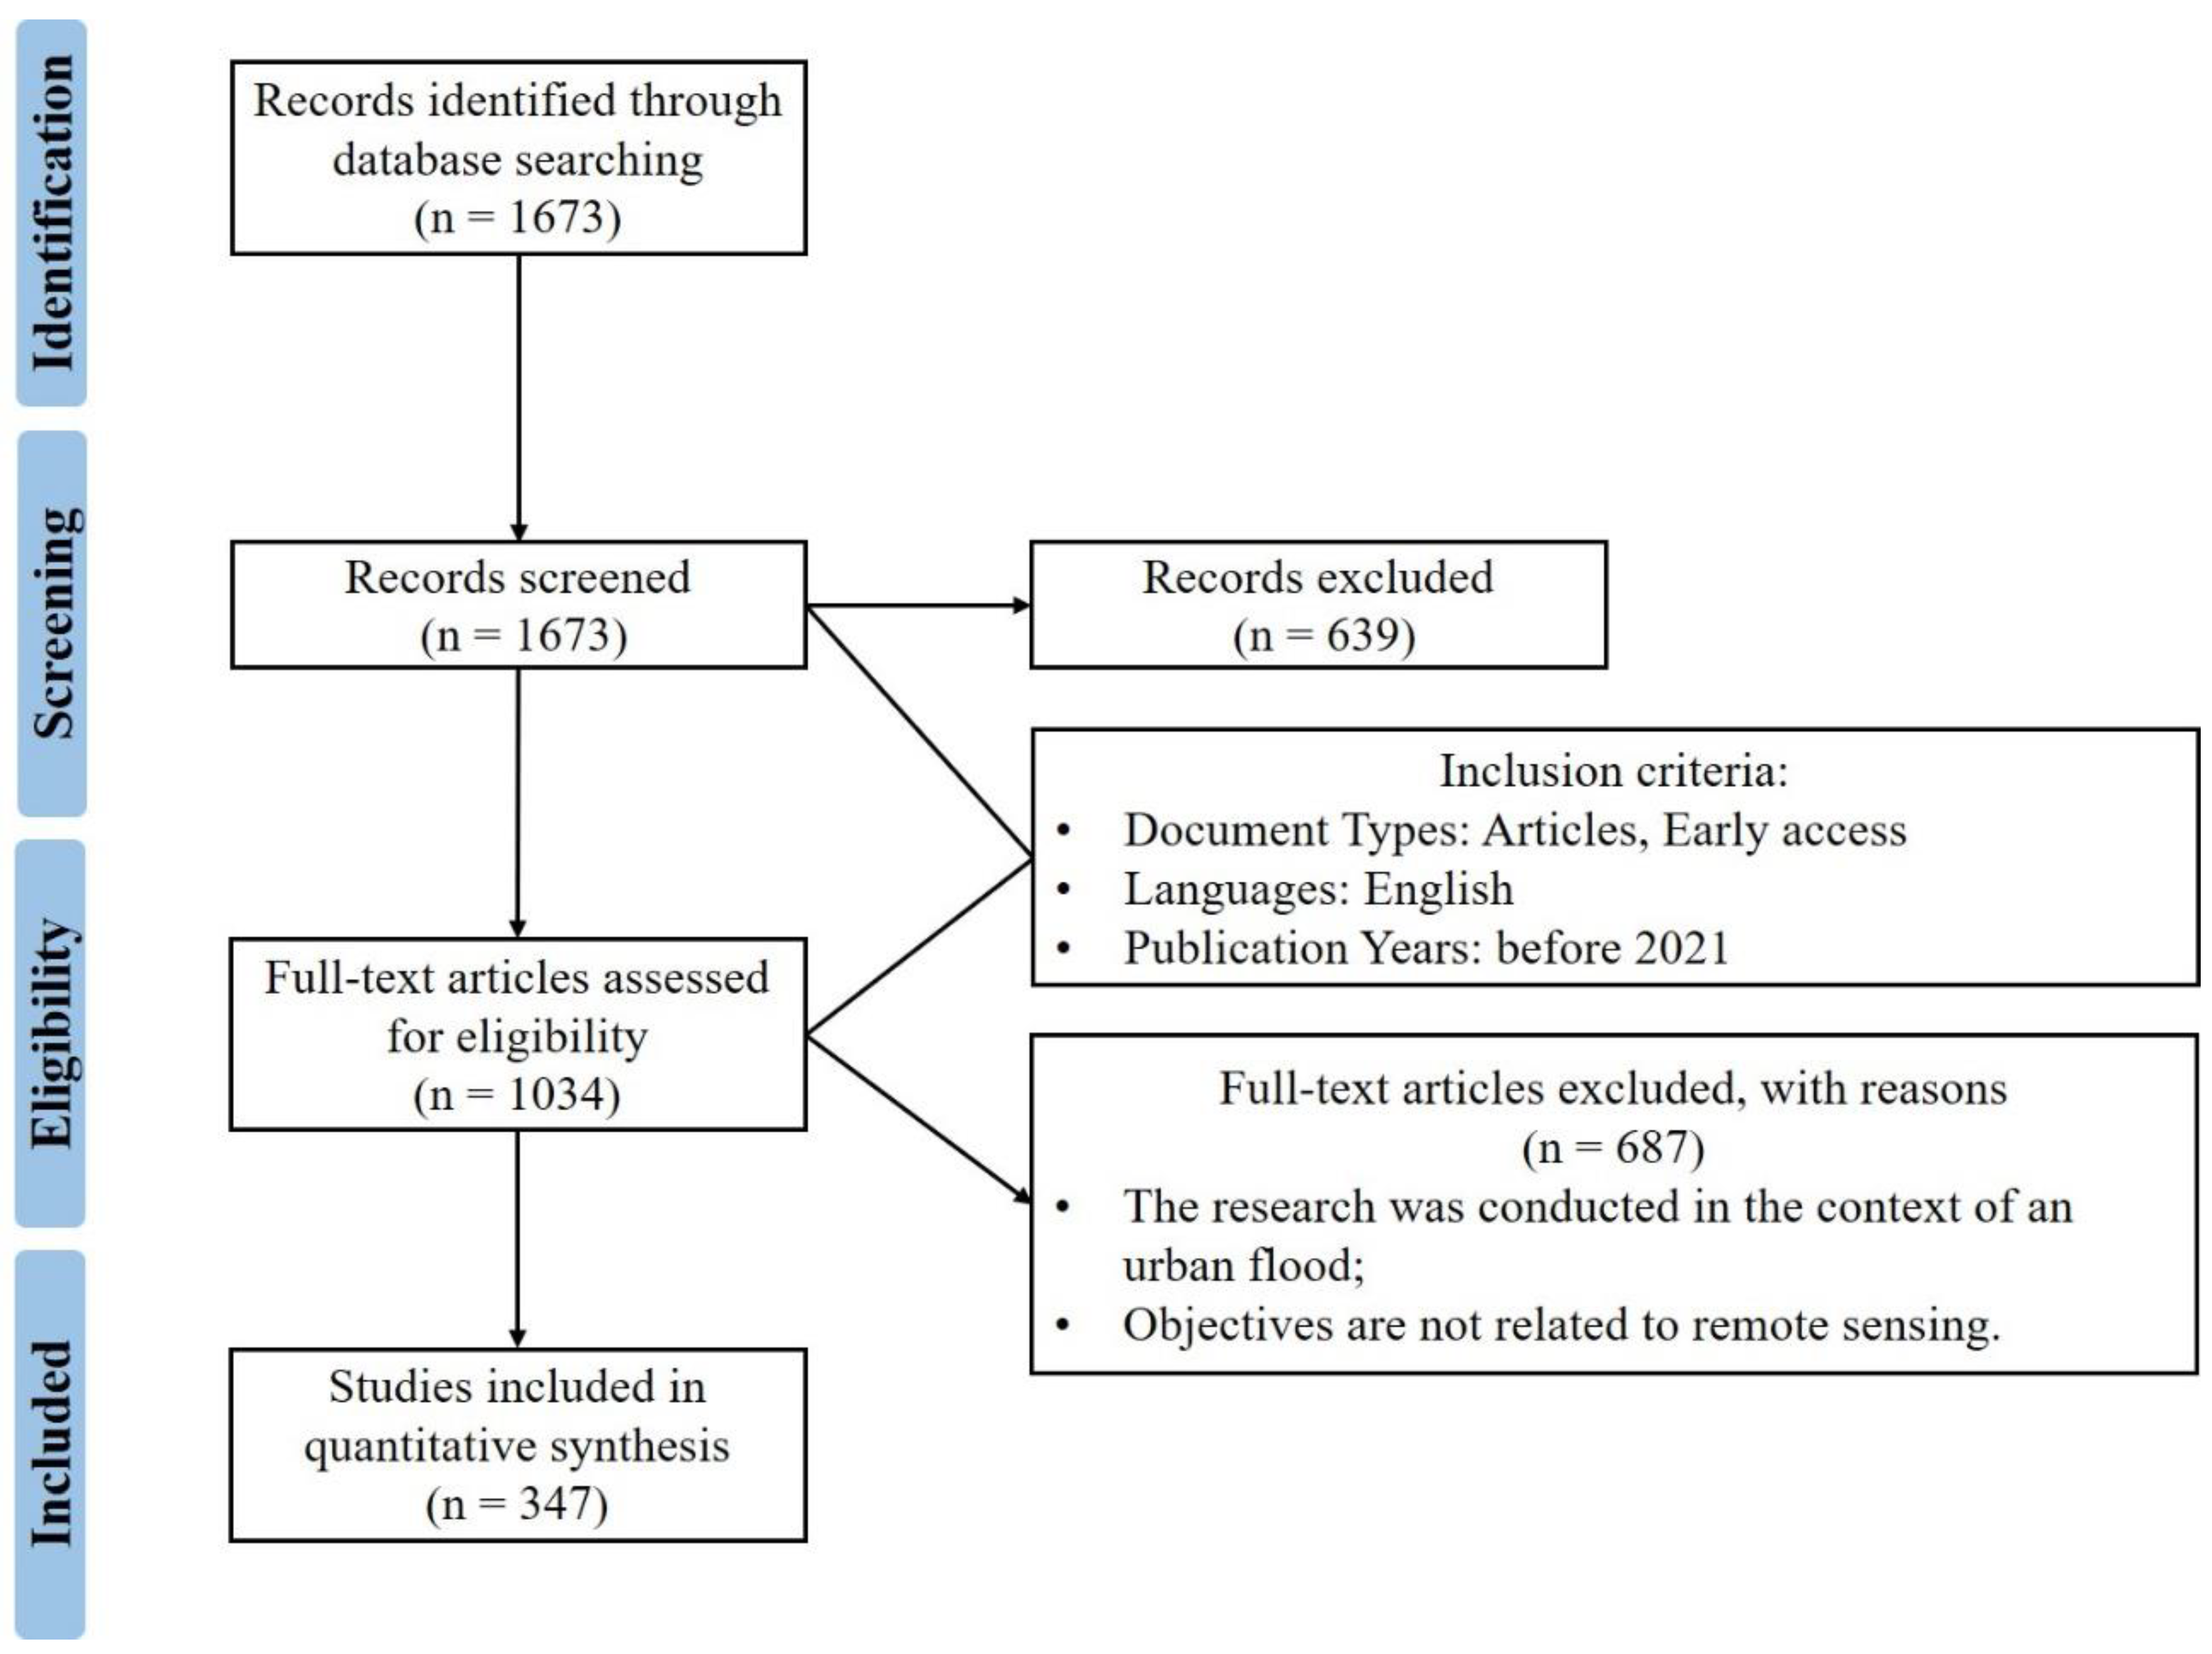
2. Materials and Methods

Literature retrieval was conducted systematically based on a reproducible method. Table 1 shows the Web of Science (WoS; http://www.webofknowledge.com (accessed on 16 March 2022)) databases used, retrieval terms, retrieval strategy, and final records. Three terms were used to generate retrieval results: term 1 contains urban, term 2 contains flood, and term 3 contains remote sensing. The retrieval strategies include: the titles, abstracts, and keywords of the articles retrieved; and combining terms 1, 2, and 3 based on the AND operators. The entire query strings for the WoS database can be found in Supplementary Materials. The final retrieval date was 23 April 2022, and the records for WoS were 1673.
The definition of the Preferred Reporting Items for Systematic Reviews and Meta-Analyses (PRISMA) is divided into two parts. A systematic review is a review of a formulated problem that uses an explicit and systematic method to select, identify, and critically evaluate relevant studies and to collect and analyze data from the studies included in the review. The term “meta-analysis” refers to using statistical techniques to integrate the results of included studies in a systematic review [38,39]. The PRISMA flow diagram was provided to record the process of identification, screening, eligibility assessment, and inclusion in Figure 1. Record identification consisted of 1673 unique records from WoS databases. Record screening was performed using the following inclusion criteria:
The language of documents was utilized in English only;
The type of documents was limited to “Article” only;
The documents were published before 2021.
In screening, records were excluded if they were nonconformant with these inclusion criteria. Overall, 639 records were excluded from screening, and 1034 were used for eligibility. Because of the language ability limitation and the lack of translation resources, the language of documents is considered English only. This language constraint might have led to the exclusion of high-quality and high-impact other-language documents, which may have influenced the main conclusions of the study. Furthermore, the document type constraint also might have led to the exclusion of high-quality and high-impact documents of different types, which may have influenced the study’s main findings. The year 2022 was excluded because looking only at some months can provide misleading (non-homogeneous) results. The full-text eligibility assessment was performed using the following inclusion criteria:
The research was conducted in the context of an urban flood;
Remote sensing technology was applied in the research.
Records were excluded during full-text eligibility assessment if the document indicated nonconformance with these inclusion criteria. The full-text assessment showed that 347 records satisfied both criteria, while 687 were excluded. Finally, 347 records included in the study were applied to fill in a table consisting of the following fields:
Publication year;
Source;
Study area country;
Study area economy classification;
Study area location;
Study area size;
Disaster management function;
Disaster management activity;
Observation(s);
Observation category;
Remote sensing technology type(s);
Remote sensing method(s);
Remote sensing data type(s);
Data analysis method(s).
The table extracted frequency statistics based on publication, geography, disaster management application, and remote sensing data utilization.

3. Results

To analyze our data, we estimated the dataset listing the 347 documents, their attributes, and field descriptions (Supplementary File S2). The 347 documents selected during screening were published between 2007 and 2021, with the number of documents steadily increasing per year (Figure 2). This result is consistent with other remote-sensing-related review papers [40,41,42]. The top 10 productive sources are shown in Table 2, which covers a number of disciplines, including hydrological sciences, water resources, remote sensing, risk management, and engineering. The following sections will describe research trends in geography (Section 3.1), disaster management applications (Section 3.2), and remote sensing data utilization (Section 3.3).

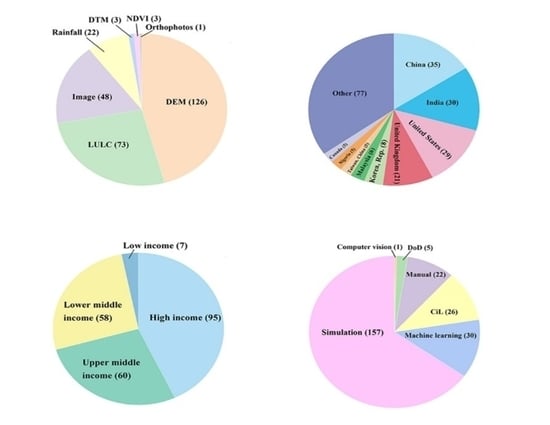
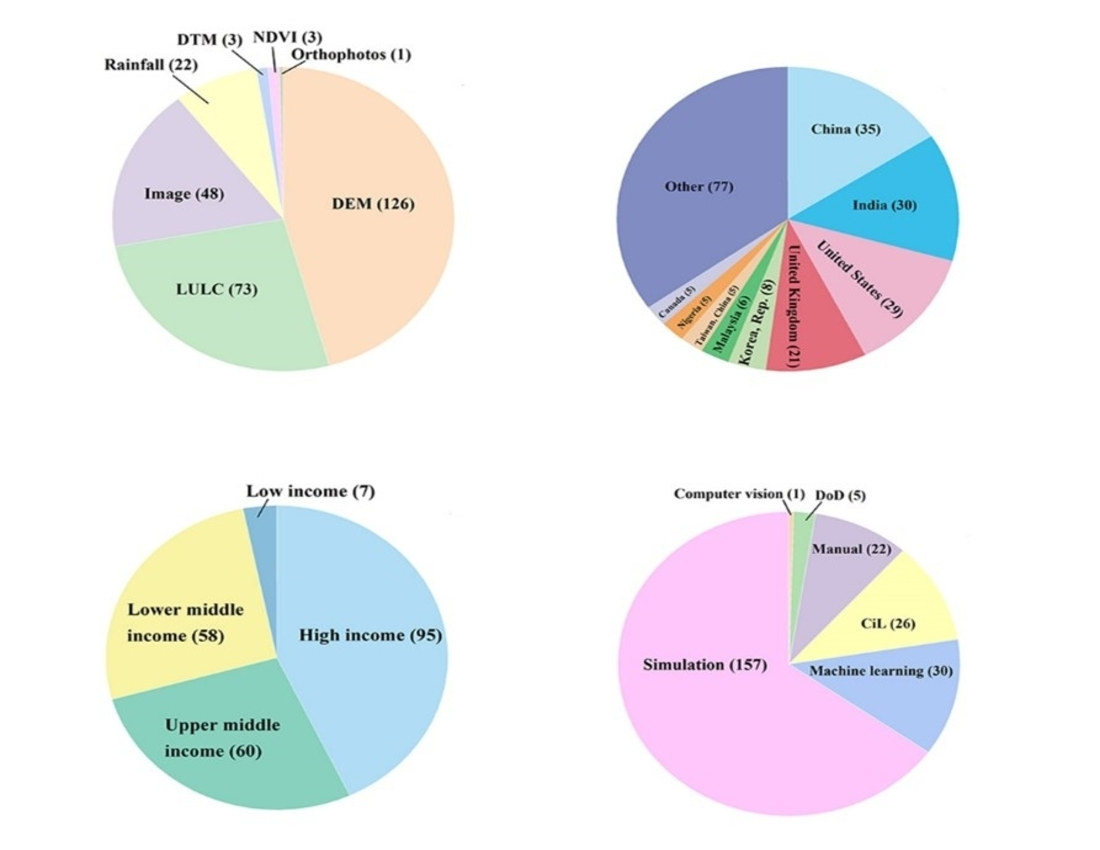
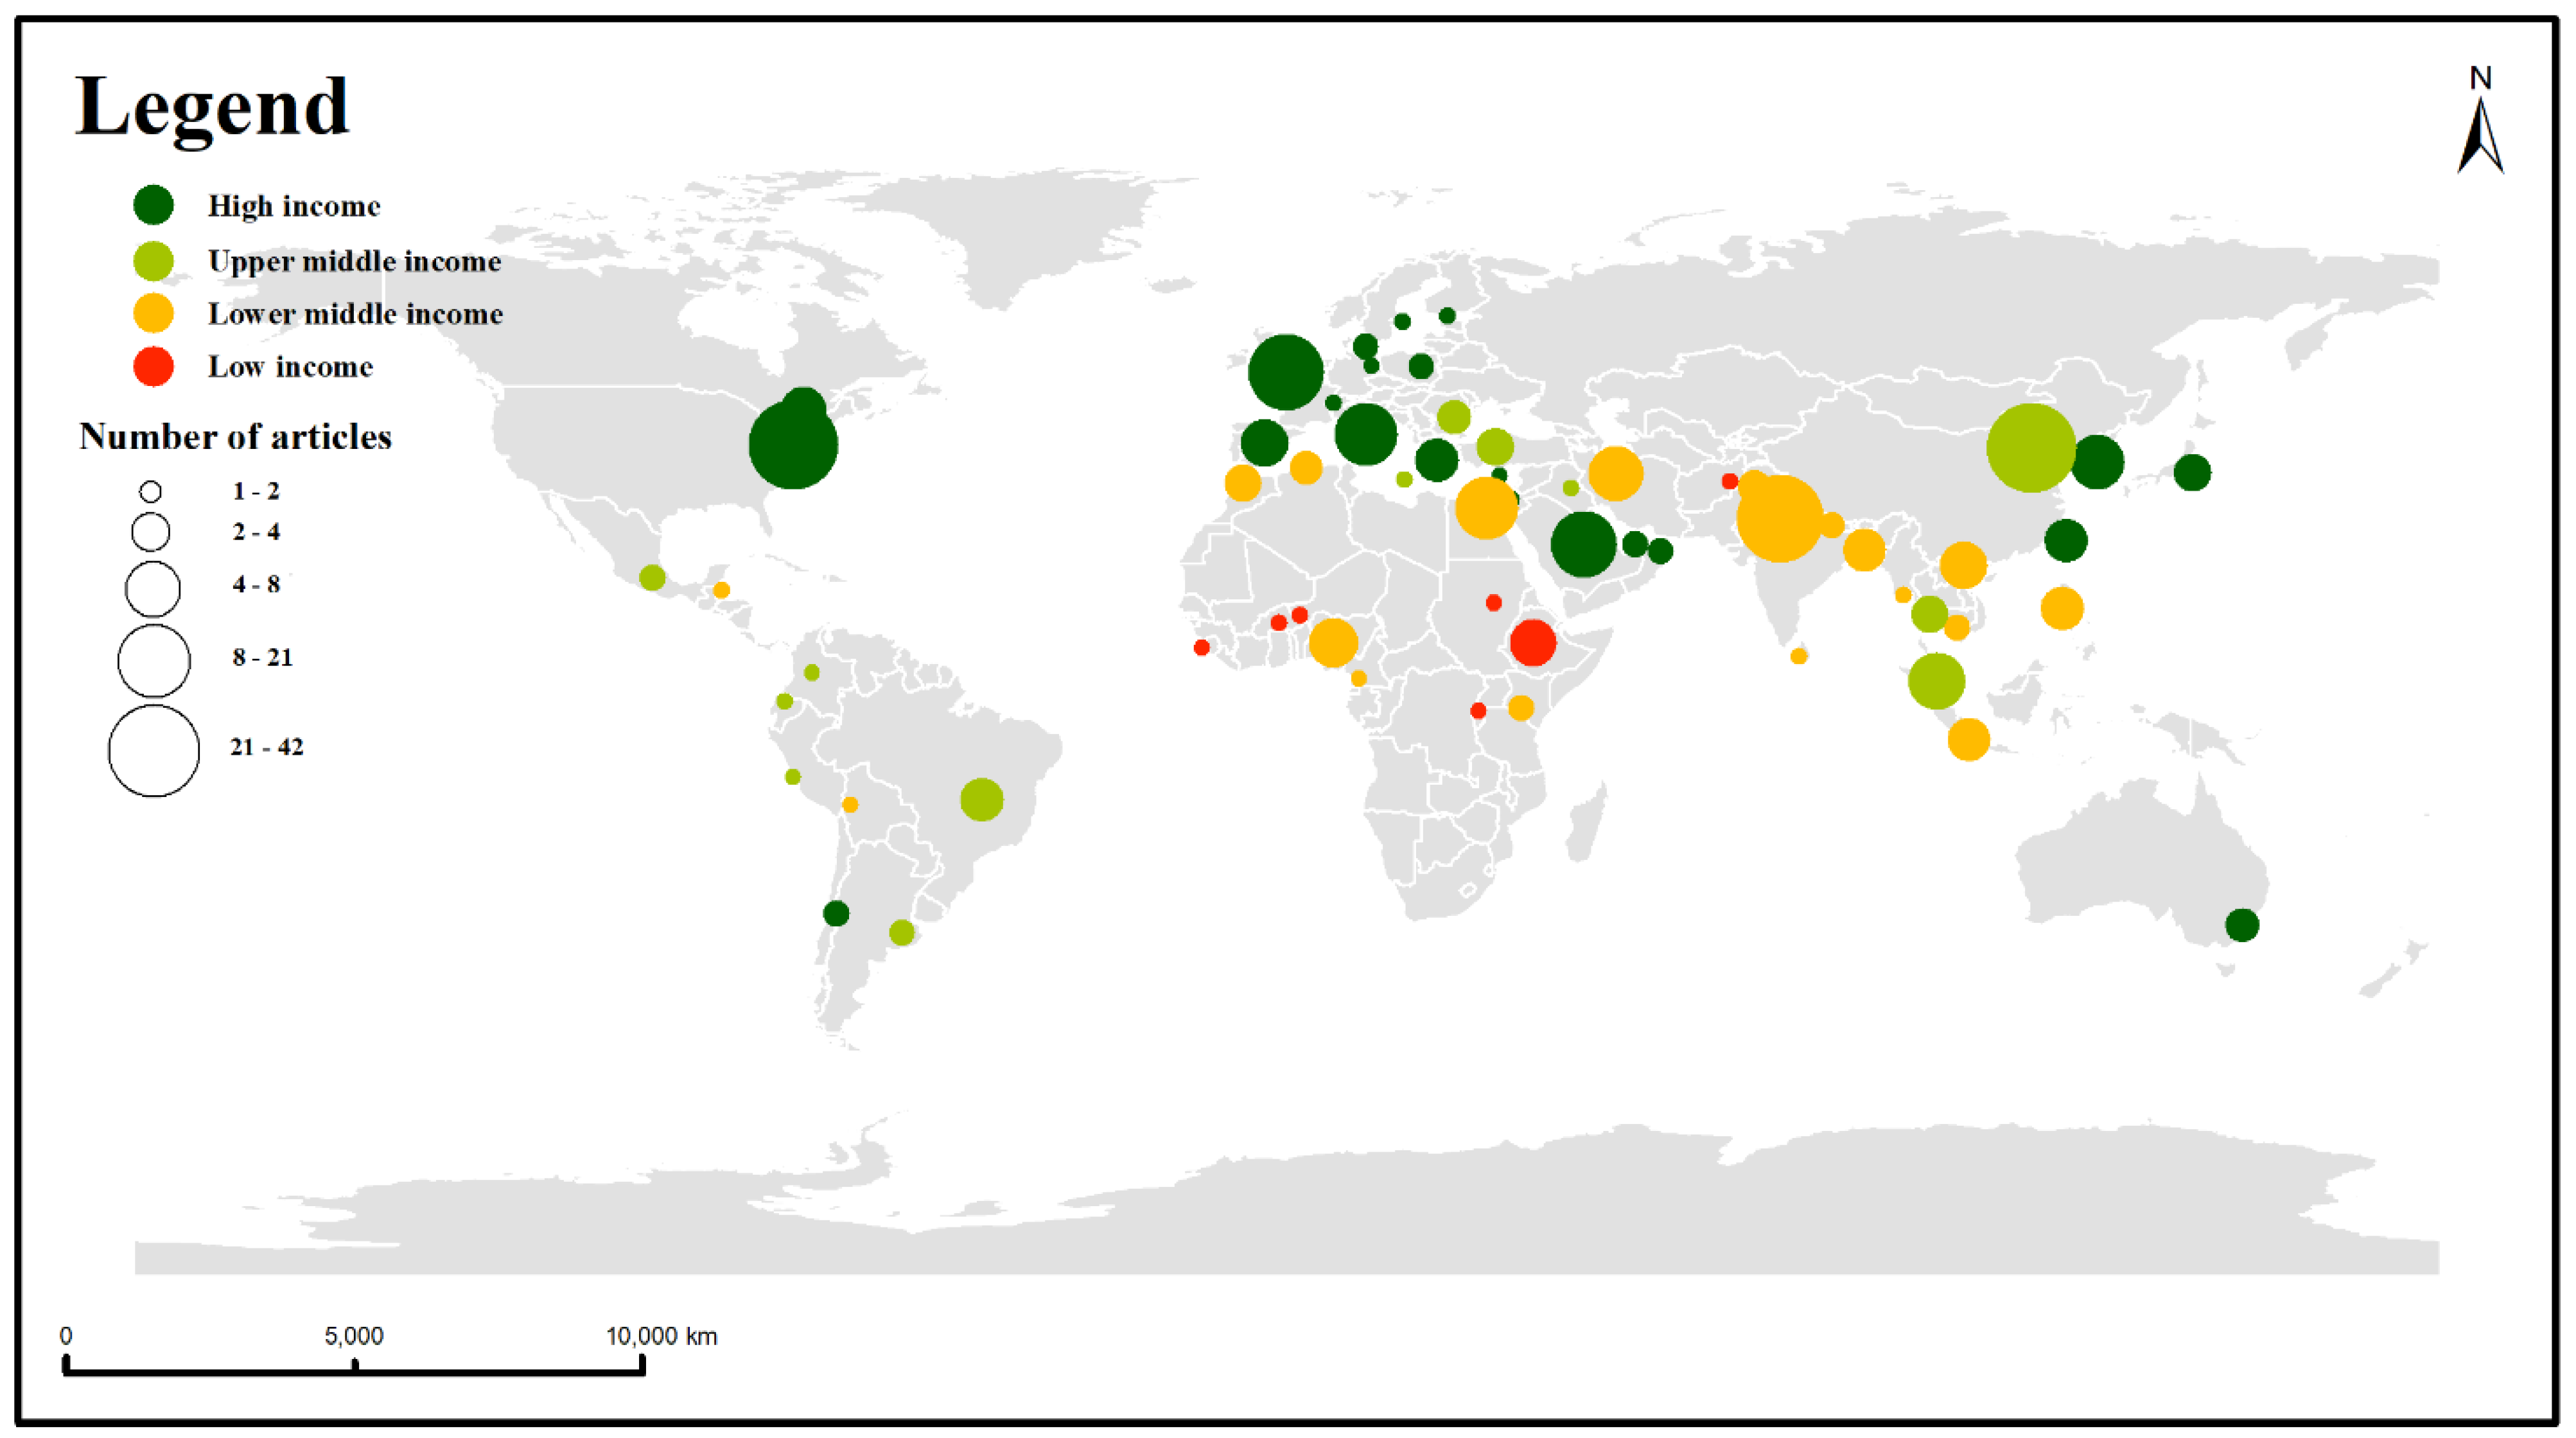
3.1. Research Trends in Geography

The frequency and distribution of study areas from the 347 articles and the World Bank’s economic classification of study areas (Figure 3) were provided. The most productive countries include China (n = 42), the United States (n = 41), India (n = 39), the United Kingdom (n = 23), and Saudi Arabia (n = 15). We found that 43 % of the study areas are located in high-income countries/territories (Figure 3), which may be due to the more available research resources and scientific institutions than in lower-income countries/territories. Moreover, countries that are more prone to flood hazards should conduct more urban flood disaster research. For example, as a lower-middle income country, India has many more flood studies than the United Kingdom.
Concerning study area location, 35% was coastal urban, while 65% was inland urban. The situation may relate to the compound flooding in coastal urban areas, where flooding is often accompanied by the combined effects of typhoons, heavy rainfall, high tide levels, and upstream flooding, leading to the lack of effective study of compound flood risk [43]. Moreover, the broad coverage may be sufficient to justify the scientific basis of remote sensing applications. However, this finding may also be related to satellite remote sensing technologies, which usually have an extensive visual line of sight [44,45,46].

3.2. Research Trends in Disaster Management Application

Table 3 reveals that 89% of the articles showed mitigation application of disaster management functions, most of which (84%) were vulnerability assessment and risk modeling of the disaster management activity. The second most prominent disaster management function was response application (7% of the articles), of which rapid damage assessment was the most prominent disaster management activity. The third disaster management function was preparedness. It should be noted that 310 articles displayed mitigation functions, most of which (68%) were applied based on the simulated scenario, not the real event. Moreover, of the 25 articles displaying response functions, the majotiry (64%) were applied based on the simulated scenario. The research data on search and rescue was collected in emergencies. Under strict time constraints, response functions require pre-established and rehearsed data collection, analysis, and processing. The least frequent disaster management function was recovery, with three studies showing in-depth damage assessment after a disaster [47,48,49].
The majority of articles (99%) had the environment as the observation category, which is in line with the most common disaster management activities, while the other observation categories were building (building damage) and human (for search and rescue activities) (supplementary file S2). Because some articles applied more than one observation, we counted the data instead of a percentage of the article. The observations as a percentage of the articles (n = 347) were: topography for flood risk mapping/modeling (223 articles); land cover for flood risk mapping/modeling (120 articles); flood events (61 articles); rainfall for flood risk mapping/modeling (30 articles); building damage (2 articles); and humans (1 article; Figure 4).

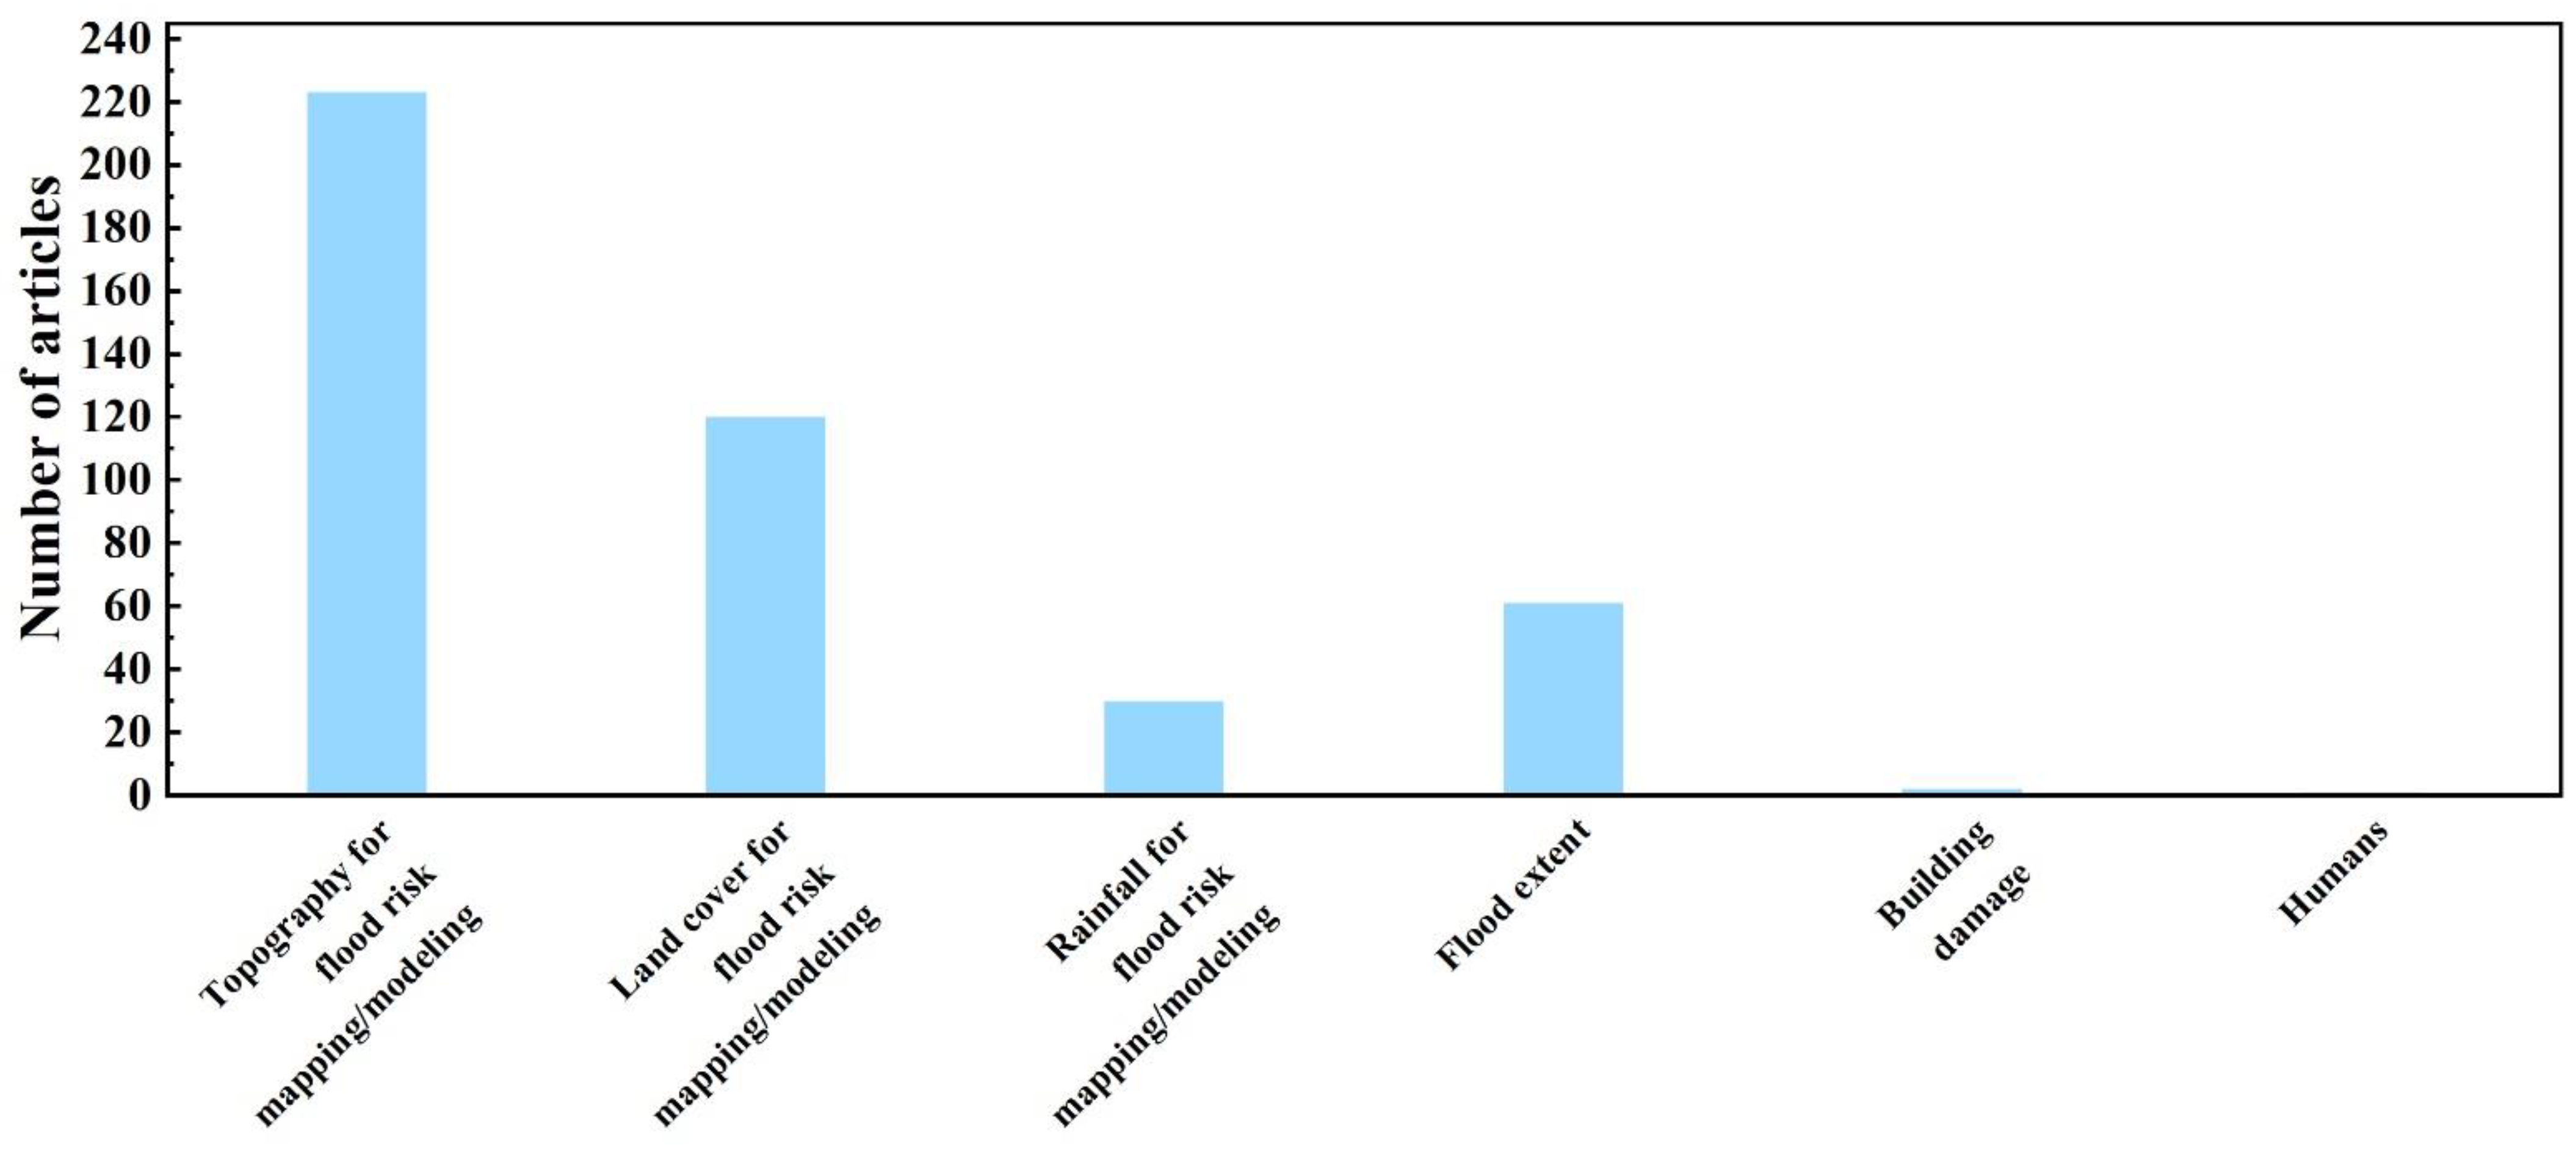
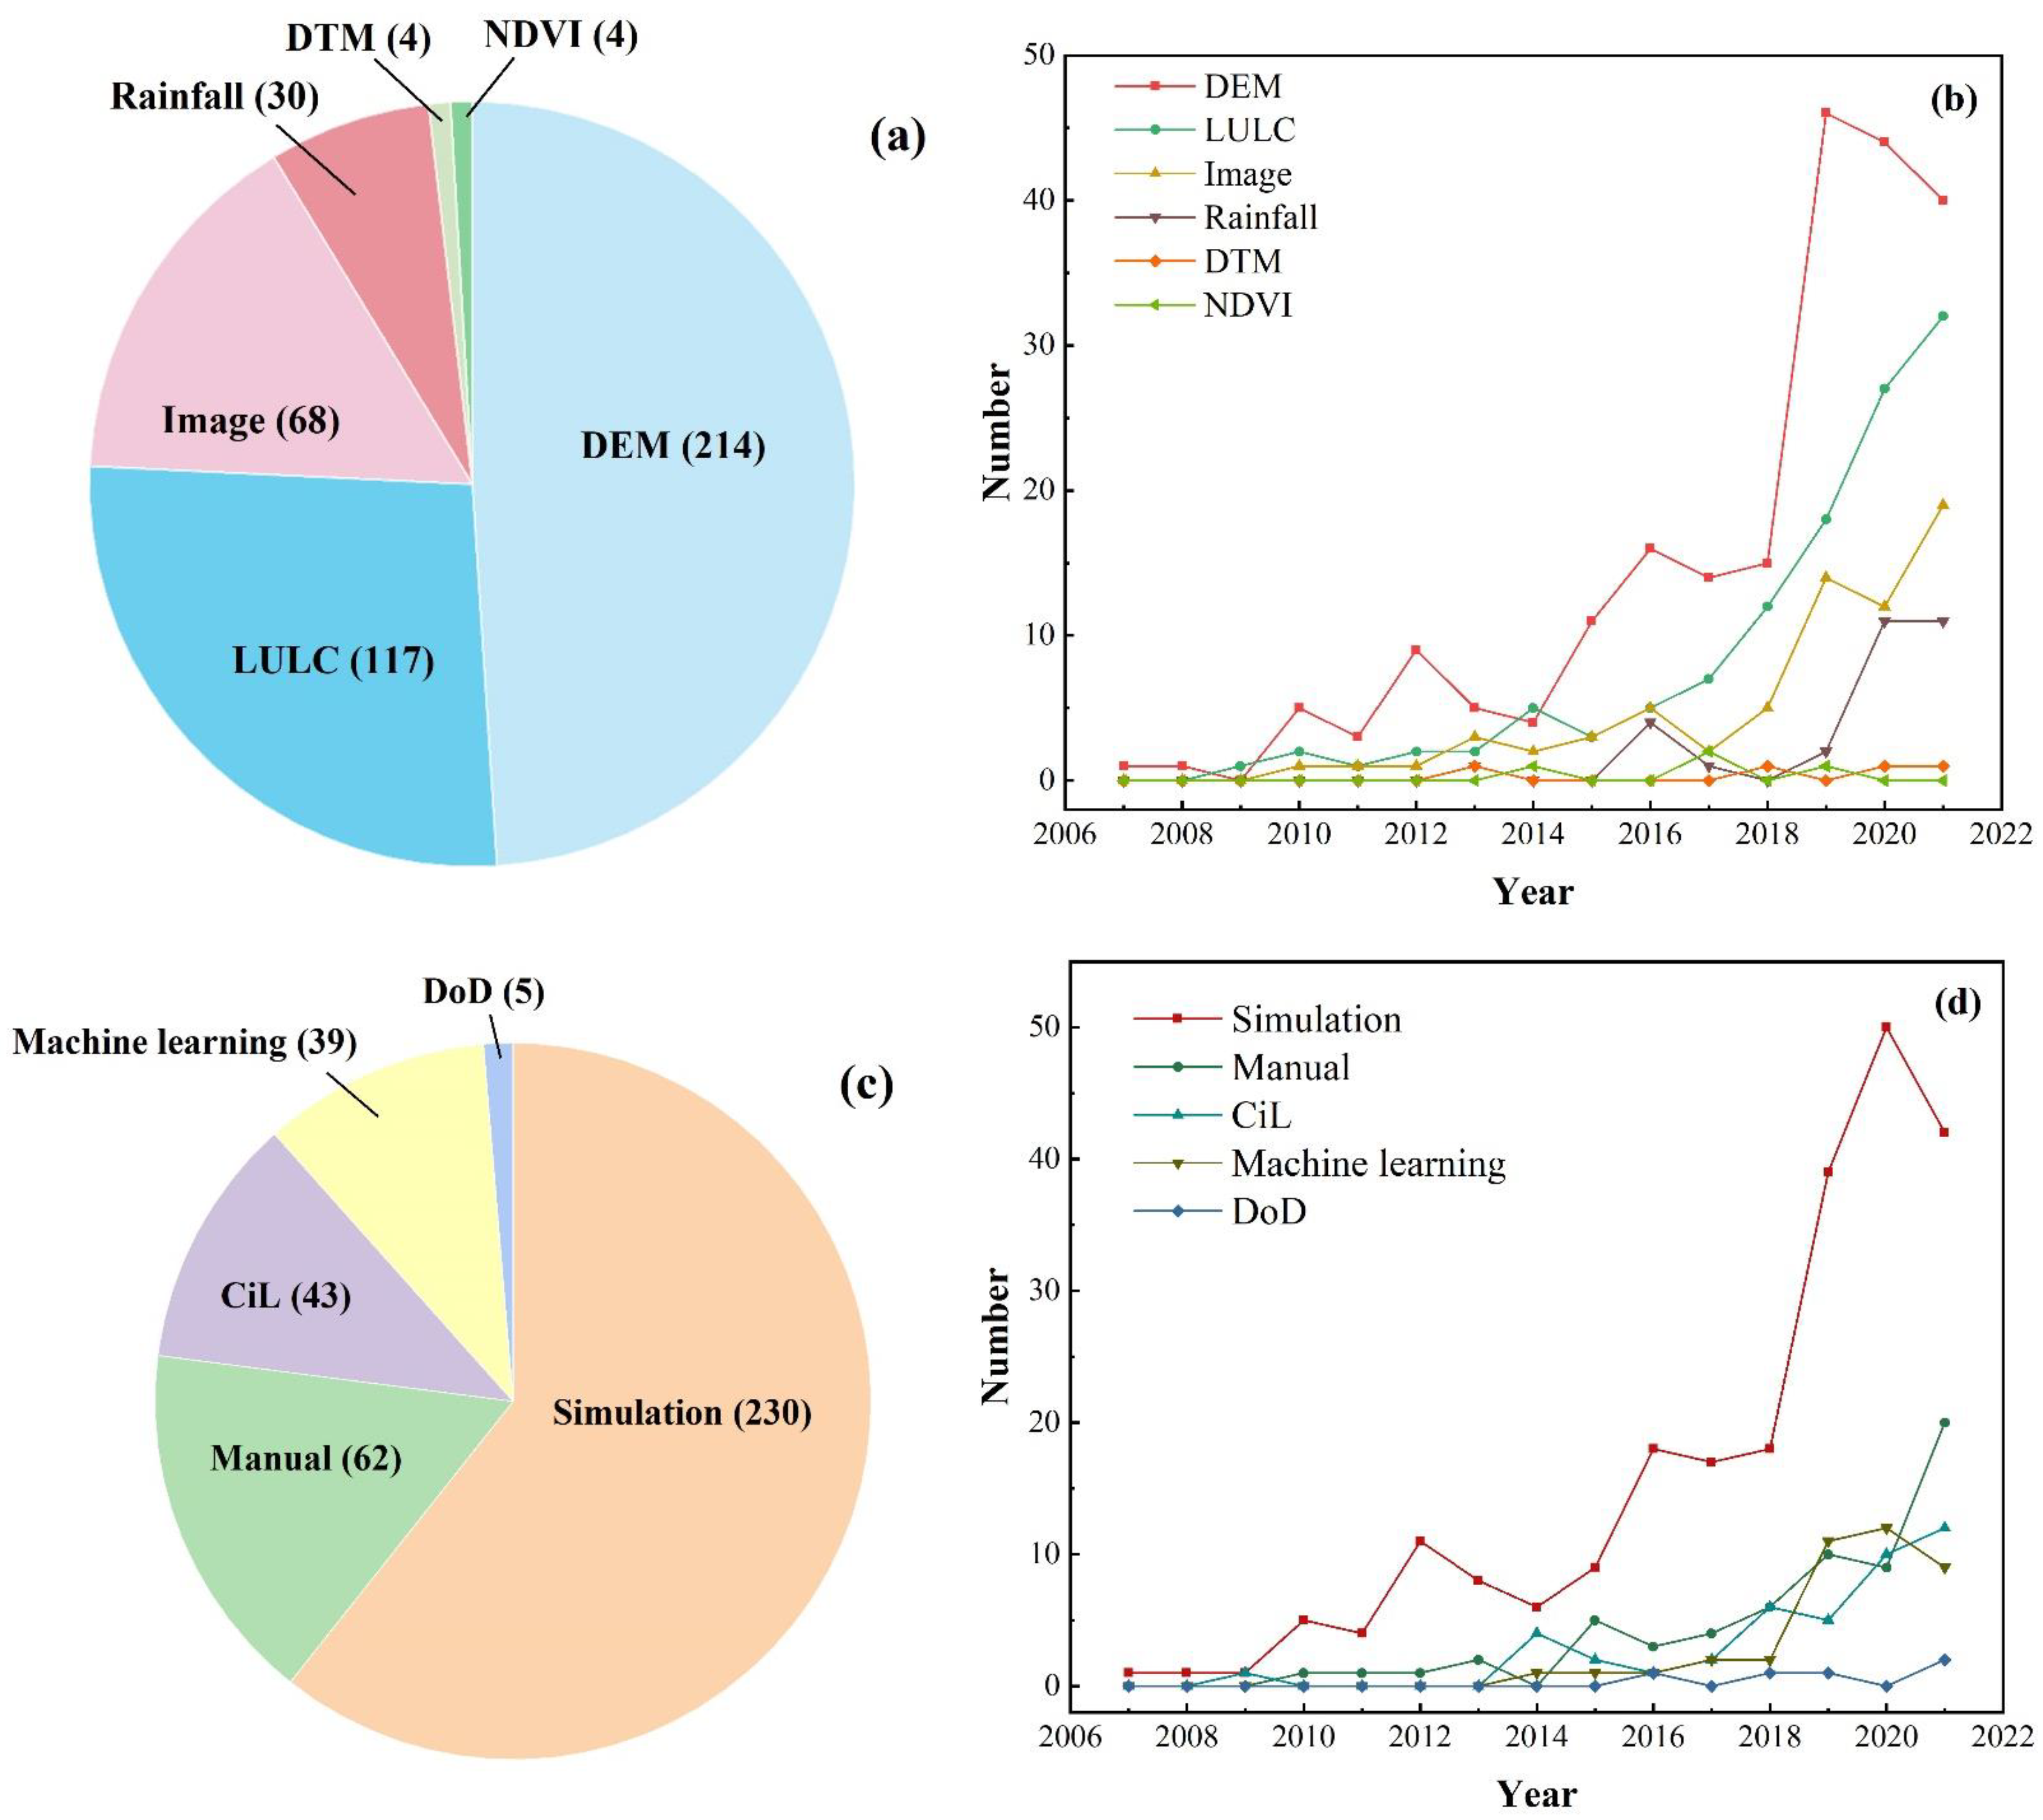
3.3. Research Trends in Remote Sensing Data Utilization

The most representative remote sensing technology type was satellite technology (70%; 244 articles). The rapid development of satellite technology has greatly promoted the progress of remote sensing technology (Supplementary File S2). The rest of the remote sensing technology types were airborne technology (108 articles) and terrestrial technology (17 articles). In addition, among airborne remote sensing technologies, it is worth noting that unmanned aerial vehicles (UAV) technology (14 articles) has been increasingly used in recent years. Concerning the remote sensing method, 48% applied active sensors (165 articles), 29% applied passive sensors (102 articles), and 23% applied both (80 articles; supplementary file S2). Moreover, the most popular remote sensing data type was the DEM (214 articles), which commonly provided topography data for vulnerability assessment, risk modeling, and rapid damage assessment (Figure 5a). Land use/land cover (LULC) was the second most representative remote sensing data type (117 articles), which often provided land cover data for risk modeling and rapid damage assessment. The following representative data type is the raw image (68 articles), often used for observing building damage, flood events, and humans. Rainfall data types were less commonly applied (30 articles), commonly providing rainfall data for vulnerability assessment, risk modeling, and rapid damage assessment. Digital terrain model (DTM) and normalized difference vegetation index (NDVI) were rarely applied (four and four articles, respectively) and most often for providing data and observing building damage.
DEM and LULC have been continuously used since 2007 and 2009, respectively, and their usage has increased significantly in the past six years (Figure 5b). Images and rainfall data started being continuously used in 2010 and 2013, followed by relatively slow growth over time. NDVI was sporadically applied during the publication period and started being used in 2014. This situation may be due to the similar functions of NDVI and LULC in urban flood applications. DTM was rarely used until 2013. The lag in the utilization of DTM may be due to their function (providing topography data) in urban flood applications, with a similar function to DEM.
The most popular remote sensing data analysis method was to simulate urban flood risk in software (230 articles) (Figure 5c) and has been continuously used for the most prolonged period starting in 2007 (Figure 5d), with a similar growth trend to DEM (Figure 5b). Manual interpretation of remote sensing data products has also been an often-used data analysis method since 2010 (62 articles), followed by relatively slow growth over time. Furthermore, remote sensing data was also commonly applied to assess the spatial and temporal impacts of Change in LULC (CiL) on urban flooding (43 articles).
The fourth most representative remote sensing data analysis method was machine learning (39 articles). Although it has only been in use since 2014, machine learning is rapidly gaining popularity, especially with the rapid growth of related research after 2018 (Figure 5d). The situation may be because machine learning has higher generalization abilities and reported classification accuracies than traditional classifiers, which makes it more and more popular in the field of remote sensing [50,51,52]. Moreover, regarding the elevation data analysis, the most representative method was to perform a DEM of Difference (DoD; 5 articles), which reveals differences between multi-temporal DEMs to determine the height of features (buildings and vegetation). This data analysis method has been applied since 2016 (Figure 5d), which follows the DEM application starting in 2007 (Figure 5b).
Of the observations in Section 3.2, most seemed to be close to standardization in terms of remote sensing analysis method and data type. For example, many articles that observed the topography for flood risk mapping/modeling were to apply DEM and DTM along with simulation analysis, machine learning, and DoD analysis. The LULC and NDVI were the most common for observing land cover, although CiL analysis, simulation analysis, and machine learning have also been used. The observation of flood events was commonly performed using images, simulation analysis, and machine learning. For observing rainfall, we found that rainfall products were often combined with machine learning, simulation analysis, and manual interpretation, respectively. Moreover, DTM and machine learning were used most prevalently for response-related building damage. However, UAV (airborne) images and manual interpretation most represented recovery-related building damage. Finally, UAV (airborne) images and manual interpretation were also often used to observe humans for search and rescue activities.

4. Discussion

Based on the systematic retrieval of the research articles on urban flood-related remote sensing, 347 documents were ascertained and applied from geography, disaster management applications, and remote sensing data utilization. The systematic review of studies reveals several research trends, gaps, and opportunities. In addition, the following sections provide limitations of this study (Section 4.1), recommendations for future studies on geography (Section 4.2, Section 4.3 and Section 4.4), disaster management applications (Section 4.5 and Section 4.6), and remote sensing data utilization (Section 4.7).

4.1. Limitations of This Study

This systematic review is not comprehensive enough because of the limitations of the retrieval tool and database. Using only the WoS database has both advantages and disadvantages over other studies that combine multiple databases. Multiple sources can reduce the potential for sample bias, but using a high-quality database means that the research sample is homogeneous, avoiding the requirement to eliminate duplicate records [53]. Moreover, the Google databases and the criteria for classification, keyword searches, and record selection have been criticized for more than a decade [54,55,56]. Finally, the language of documents was limited to English only. This language constraint might have led to the exclusion of high-quality and high-impact other-language documents, which may have influenced the main conclusions of the study.
The document type constraint might have led to the exclusion of high-quality and high-impact documents of other types, which may have influenced the main conclusions of the study. It is important to note that the systematic analysis results are incomplete when the grey literature on urban flood-related remote sensing is excluded. The influence of excluding the grey literature, especially with a greater focus on the practical application of this research in management and practice, will make a difference. However, the complete integration of all the grey literature is an endless task, and it is impossible to carry out objectively and homogeneously. Furthermore, as we pointed out earlier, their inclusion breaks with the homogeneity linked to the use of the WoS database regarding quality, accessibility, or the field expert peer-review process of manuscripts. In future research, we will consider more sources such as Chinese literature, meeting proceedings, grey literature, media and other databases (Scopus, etc.) and consider more comprehensive keywords in our searches to obtain more detailed results.

4.2. Recommendation 1: Smaller Study Areas

While large area coverage is sufficient to observe the overall impact of flood events, the impacts associated with urban flood hazards also need to be reflected in smaller areas. Data collection on a smaller scale will challenge the continued application of the most representative type of platform, namely satellites (70% of articles). UAV (airborne) has advantages, including affordability, centimeter-level spatial resolution, flexible deployment, and ease of operation, which can well compensate for this gap. However, UAV (airborne) was also limited by regulatory requirements, such as remaining in the line of sight of operators and maximum altitudes (unless specifically approved).
We found that future research on urban floods does not need to identify remote sensing coverage of the entire affected areas. On the contrary, the advantage of UAV (airborne) can be complemented by the wide-extent observation of traditional remote sensing platforms. For example, the satellite images were used by Copernicus EMS to identify varying degrees of infrastructure and building damage in the entire affected areas after a flood event [57,58]. These data can be used to “triage” higher-resolution remote sensing areas with UAVs (airborne) to provide information for in-depth damage assessments, prioritizing highly damaged areas. The UAV (airborne) survey should be used to increase the productivity of information extraction and data collection and encourage reporting of the time required to collect and process data per unit area. Moreover, although manned aircraft can achieve a similar spatial resolution, it is not affordable for all countries. Therefore, it is crucial to develop UAV (airborne) applications.

4.3. Recommendation 2: Coastal Study Areas

According to previous studies, the most economic losses, people affected, and deaths caused by floods occur in more urbanized coastal areas with a high concentration of population and assets [59,60,61]. Our findings are consistent with previous studies in which most of the study areas were inland (65%), and the observation category was the environment (63%). However, previous studies tended to focus mainly on inland areas and observation of the environment, and more research is necessary to identify the application of remote sensing to buildings in coastal areas. At present, the primary constraint is the complexity of the coastal urban flood; in general, coastal urban flooding is often accompanied by the combined effects of typhoons, heavy rainfall, high tide levels, and upstream flooding, leading to the lack of compound flood risk being effectively studied. Therefore, it is necessary to research remote sensing applications for compound flood risks in coastal urban areas.

4.4. Recommendation 3: Study Areas in Lower-Income Countries/Territories

Most of the study areas (43%) were located in high-income countries or territories. Although this result may be due to more available research resources and scientific institutions in these countries/territories, it must be noted that urban flood disasters have a disproportionate impact on low-income countries/territories [62]. In addition, lower-income countries/territories can be said to benefit most from the high accessibility of remote sensing with respect to their affordability. Few resources are demanded to obtain remote sensing data.
The scarcity of detailed DEM can be regarded as a significant but not sole obstacle of the limited related research in lower-income countries/territories. In most lower-income countries/territories, the best data can be chosen from the 30 m spatial resolution DEM based on the Advanced Spaceborne Thermal Emission Reflection Radiometer (ASTER) project, the Shuttle Radar Topography Mission (SRTM) project, the ‘Bare-Earth’ DEM derived from SRTM and the Multi-Error-Removed Improved-Terrain (MERIT) DEM [63]. Moreover, this dilemma will continue for a long time.
One promising solution to this challenge is the continuous development of the WeRobotics Flying Labs network, which localizes the UAV (airborne) application for geographically relevant public health, environmental, and humanitarian issues [64,65,66]. Most WeRobotics Flying Labs (85%) are not located in the high-income countries/territories (https://flyinglabs.org/; accessed 11 May 2022). WeRobotics Flying Labs promote local remote sensing capacity through the following methods: 1. training and workshops; 2. collaboration among academic institutions, government, businesses, and not-for-profit organizations; 3. working with civil aviation authorities to establish and refine regulatory processes; 4. working with technology suppliers for free or discounted products. There are numerous articles on this project and disaster management activities on the WeRobotics webpage (https://blog.werobotics.org; accessed 11 May 2022).
It is crucial to apply machine learning based on remote sensing data for future research in non-high-income countries/territories. For machine learning techniques to be applied to low-income countries/territories, these countries/territories’ data should be used to train models because different geographic environments lead to variations in the appearance of ground objects (buildings, roads, and vegetation). Usually, geographic environments are essential for establishing local disaster management applications.

4.5. Recommendation 4: Response Functions

Rapid damage assessment (response functions) is critical to timely reducing economic losses and casualties during urban floods. However, in disaster management functions, the response accounts for only 7% of all studies (Table 3). In addition, less than half of the articles on response function pertained to real flood events, and only nine articles indicated that remote sensing data were used in the emergency phase. The lack of research on the response function based on actual events may reflect the strict requirements of the response function, including the timely availability of data resources and pre-establishment and rehearsing for data collection, processing, and analysis.
It is worth noting that machine learning technology has been widely used in response functions (32% of articles). It reveals that machine learning technology has unique advantages (higher computation speed, lesser data requirements, and more robust results) in rapid damage assessment and has been paid attention to by relevant researchers. Moreover, the access cycles of remote sensing technology are long because of the limitation of low spatiotemporal resolution of data and lack of easy satellite due to cloud obscuration [67,68,69,70]. However, urban floods are often of short duration, requiring high-temporal-resolution data [71]. This limitation can be well compensated by street surveillance, onboard vehicle cameras, social media, and crowdsourced data, which deserves attention [72,73,74].

4.6. Recommendation 5: Disaster Management Activities

Most disaster management activities focused on vulnerability assessment and risk modeling (84 % of articles; mitigation) (Table 3). The rest of the disaster management activities were rarely reflected by the articles. These disaster management activities include rapid damage assessment (7% of articles; response); hazard detection (5 % of articles; mitigation); provision of baseline data (2% of articles; preparedness); in-depth damage assessment (1% of articles; recovery); and search and rescue (1% of articles; response). Shifting the focus of the study to these disaster management activities will require that the study area be located in a more populated region, as the observations are usually associated with built features. For example, the observations of search and rescue may include management facilities and road obstacles.
We cannot provide the best standards or practices because few studies demonstrate these disaster management activities. Furthermore, this research serves as a start, and readers can apply our complete database (Supplementary File S2) to find articles representing these disaster management activities. For instance, only showing the built articles by filtering the “observation category” reveals many examples of remote-sensing-based infrastructure inspections, including buildings, facade openings, and roads. As there is a significant overlap in the observations of various disaster management activities, this research can be applied to guide the future direction in under-demonstrated research fields.

4.7. Recommendation 6: Data Standardization

Since the future research direction is understudied disaster management activities, data standardization of remote sensing data analysis methods and data types may emerge. For instance, most observations seem to be approaching data standardization in terms of remote sensing data analysis method and data type (Section 3.3). There is no data standard in the observation of building damage, and we recommend that future research focuses on establishing data standards for observations related to the recovery and response of building damage [75,76,77]. Standardizing remote sensing data analysis methods and data types will facilitate integration with standard methods for assessing urban flood impacts [78,79]. The standard methods for assessing urban floods are as follows:
1. The MIRA is a response function that initially assesses flooding impacts within the earliest three days after its occurrence (https://www.humanitarianresponse.info/en/programme-cycle/space/document/multi-sector-initial-rapid-assessment-guidance-revision-july-2015; accessed on 15 May 2022);
2. The GRADE is a recovery function that reports flooding impacts within two weeks after its occurrence (https://www.gfdrr.org/sites/default/files/publication/DRAS_web_04172018.pdf; acessed on 15 May 2022);
3. The PDNA also is a recovery function that assesses flooding impacts within two to six weeks after its occurrence (https://recovery.preventionweb.net/build-back-better/post-disaster-needs-assessments; accessed on 15 May 2022). Finally, with the development of remote sensing technology, data standardization will be established to ease integration with international standard methods for assessing urban floods.

5. Conclusions

This research performed a systematic review of the articles on urban flood-related remote sensing technology. The search based on the WoS database resulted in 347 relevant articles, which were classified and summarized according to geography, disaster management application, and remote sensing data utilization. This research showed that most of the studies are located in high-income countries and territories and inland areas. The mitigation function and response function were the most representative disaster management functions, of which the most often applied disaster management activities were vulnerability assessment and risk modeling (mitigation) and rapid damage assessment (response). Remote sensing for observing the environment was more popular than observing the building. The most representative remote sensing technology type was satellite technology. The most popular remote sensing data type was DEM, which is often applied to simulate urban floods as software inputs. In recent years, machine learning has also been widely used. Based on the observations, the remote sensing analysis method and data type seem to be approaching standardization.
According to these results, we found some future research opportunities. We suggested that more research should be performed in non-high-income countries/territories because urban flood disasters have a disproportionate impact on low-income countries/territories. This geographic environment is essential for machine learning applications because observations from different geographic environments can be used to train models. Moreover, we also suggested that more research should be focused on understudied disaster management activities, most of which need to observe the buildings in more urban areas. These disaster management activities include rapid damage assessment (response); hazard detection (mitigation); provision of baseline data (preparedness); in-depth damage assessment (recovery); and search and rescue (response). More research on these neglected disaster management activities will promote the practical applications of urban flood-related remote sensing. Ultimately, data standardization will emerge based on extensive research. Data standardization will facilitate integration with international standard methods for assessing urban floods.

Supplementary Materials

The following supporting information can be downloaded at: https://www.mdpi.com/article/10.3390/rs14215505/s1.

Author Contributions

Conceptualization, W.Z.; Data curation, W.Z. and Z.C.; Formal analysis, W.Z. and Z.T.; Funding acquisition, P.L.; Investigation, W.Z.; Methodology, W.Z.; Resources, P.L.; Software, W.Z.; Supervision, P.L., Y.Z., M.H. and B.H.; Validation, W.Z. and Z.C.; Visualization, W.Z.; Writing—original draft, W.Z. and P.L.; Writing—review and editing, W.Z. and P.L. All authors have read and agreed to the published version of the manuscript.

Funding

This study is supported by the the Third Xinjiang Scientific Expedition Program (Grant No. 2022xjkk0107), National Key R&D Program of China (2018YFE0103800), China Scholarship Council (Grant No.: Liujinmei [2022] No. 45; Liujinxuan [2022] No. 133), International Education Research Program of Chang’an University (300108221102), Project of Ningxia Natural Science Foundation (2022AAC03700), Youth Innovation Talent Program for Guangdong Universities in 2022 (2022KQNCX143), China National Social Science Fund Project (20XKS006), General Project of Shaanxi Provincial Key R&D Program—Social Development Field (2021SF-454), GDAS Special Project of Science and Technology Development (2020GDASYL-20200102013, 2020GDASYL-20200301003), Guangdong Foundation for Program of Science and Technology Research (2019QN01L682, 2020B1111530001), the National Natural Science Foundation of China (NSFC: 41930865, 42177065) and Asia-Pacific Network for Global Change Research APN project (CRRP2020-03MY-He). The funders had no role in study design, data collection and analysis, decision to publish, or preparation of the manuscript. We also appreciate the reviewers for providing valuable comments.

Institutional Review Board Statement

Not applicable.

Informed Consent Statement

Not applicable.

Data Availability Statement

Conflicts of Interest

The authors declare no conflict of interest.

References

  1. Mai, T.; Mushtaq, S.; Reardon-Smith, K.; Webb, P.; Stone, R.; Kath, J.; An-Vo, D.A. Defining flood risk management strategies: A systems approach. Int. J. Disaster Risk Reduct. 2020, 47, 101550. [Google Scholar] [CrossRef]
  2. Zope, P.; Eldho, T.; Jothiprakash, V. Impacts of land use–land cover change and urbanization on flooding: A case study of Oshiwara River Basin in Mumbai, India. Catena 2016, 145, 142–154. [Google Scholar] [CrossRef]
  3. Klemas, V. Remote sensing of floods and flood-prone areas: An overview. J. Coast. Res. 2015, 31, 1005–1013. [Google Scholar] [CrossRef] [Green Version]
  4. Thanvisitthpon, N.; Shrestha, S.; Pal, I.; Ninsawat, S.; Chaowiwat, W. Assessment of flood adaptive capacity of urban areas in Thailand. Environ. Impact Assess. Rev 2020, 81, 106363. [Google Scholar] [CrossRef]
  5. Luo, P.; Zheng, Y.; Wang, Y.; Zhang, S.; Yu, W.; Zhu, X.; Huo, A.; Wang, Z.; He, B.; Nover, D. Comparative Assessment of Sponge City Constructing in Public Awareness, Xi’an, China. Sustainability 2021, 14, 11653. [Google Scholar] [CrossRef]
  6. Singkran, N. Flood risk management in Thailand: Shifting from a passive to a progressive paradigm. Int. J. Disaster Risk Reduct. 2017, 25, 92–100. [Google Scholar] [CrossRef]
  7. Mavhura, E. Analysing drivers of vulnerability to flooding: A systems approach. S. Afr. Geogr. J. 2019, 101, 72–90. [Google Scholar] [CrossRef]
  8. Luo, P.; Mu, Y.; Wang, S.; Zhu, W.; Mishra, B.K.; Huo, A.; Zhou, M.; Lyu, J.; Hu, M.; Duan, W.; et al. Exploring sustainable solutions for the water environment in Chinese and Southeast Asian cities. Ambio 2021, 51, 1199–1218. [Google Scholar] [CrossRef]
  9. Bertilsson, L.; Wiklund, K.; de Moura Tebaldi, I.; Rezende, O.M.; Veról, A.P.; Miguez, M.G. Urban flood resilience–A multi-criteria index to integrate flood resilience into urban planning. J. Hydrol. 2019, 573, 970–982. [Google Scholar] [CrossRef]
  10. Luo, P.; Xu, C.; Kang, S.; Huo, A.; Lyu, J.; Zhou, M.; Nover, D. Heavy metals in water and surface sediments of the Fenghe River Basin, China: Assessment and source analysis. Water Sci. Technol. 2021, 84, 3072–3090. [Google Scholar] [CrossRef]
  11. Zha, X.; Luo, P.; Zhu, W.; Wang, S.; Lyu, J.; Zhou, M.; Huo, A.; Wang, Z. A bibliometric analysis of the research on Sponge City: Current situation and future development direction. Ecohydrology 2021, 14, e2328. [Google Scholar] [CrossRef]
  12. De Silva, M.; Kawasaki, A. A local-scale analysis to understand differences in socioeconomic factors affecting economic loss due to floods among different communities. Int. J. Disaster Risk Reduct. 2020, 47, 101526. [Google Scholar] [CrossRef]
  13. Wang, P.; Li, Y.; Yu, P.; Zhang, Y. The analysis of urban flood risk propagation based on the modified Susceptible Infected Recovered model. J. Hydrol. 2021, 603, 127121. [Google Scholar] [CrossRef]
  14. Wei, X.; Yang, J.; Luo, P.; Lin, L.; Lin, K.; Guan, J. Assessment of the variation and influencing factors of vegetation NPP and carbon sink capacity under different natural conditions. Ecol. Indic. 2022, 112, 108834. [Google Scholar] [CrossRef]
  15. Kundzewicz, Z.W.; Su, B.; Wang, Y.; Xia, J.; Huang, J.; Jiang, T. Flood risk and its reduction in China. Adv. Water Resour. 2019, 130, 37–45. [Google Scholar] [CrossRef]
  16. Zhu, W.; Wang, S.; Luo, P.; Zha, X.; Cao, Z.; Lyu, J.; Zhou, M.; He, B.; Nover, D. A Quantitative Analysis of the Influence of Temperature Change on the Extreme Precipitation. Atmosphere 2022, 13, 612. [Google Scholar] [CrossRef]
  17. Carvalho, D.J.; Costa, M.E.L.; Costa, J.D.; Koide, S. Modelling runoff in watershed without Calibration using PCSWMM. In Proceedings of the International Conference on Urban Drainage Modelling, Palermo, Italy, 23–26 September 2018. [Google Scholar] [CrossRef]
  18. Wang, S.; Cao, Z.; Luo, P.; Zhu, W. Spatiotemporal Variations and Climatological Trends in Precipitation Indices in Shaanxi Province, China. Atmosphere 2022, 13, 744. [Google Scholar] [CrossRef]
  19. Mangalathu, S.; Soleimani, F.; Jeon, J.-S. Bridge classes for regional seismic risk assessment: Improving HAZUS models. Eng. Struct. 2017, 148, 755–766. [Google Scholar] [CrossRef]
  20. Chen, J.; Hill, A.A.; Urbano, L.D. A GIS-based model for urban flood inundation. J. Hydrol. 2009, 373, 184–192. [Google Scholar] [CrossRef]
  21. Huo, A.; Peng, J.; Cheng, Y.; Luo, P.; Zhao, Z.; Zheng, C. Hydrological Analysis of Loess Plateau Highland Control Schemes in Dongzhi Plateau. Front. Earth Sci. 2020, 8, 528632. [Google Scholar] [CrossRef]
  22. Donezar, U.; De Blas, T.; Larrañaga, A.; Ros, F.; Albizua, L.; Steel, A.; Broglia, M. Applicability of the multitemporal coherence approach to sentinel-1 for the detection and delineation of burnt areas in the context of the copernicus emergency management service. Remote Sens. 2019, 11, 2607. [Google Scholar] [CrossRef] [Green Version]
  23. Zhu, Y.; Luo, P.; Zhang, S.; Sun, B. Spatiotemporal analysis of hydrological variations and their impacts on vegetation in semiarid areas from multiple satellite data. Remote Sens. 2020, 12, 4177. [Google Scholar] [CrossRef]
  24. Wania, A.; Joubert-Boitat, I.; Dottori, F.; Kalas, M.; Salamon, P. Increasing timeliness of satellite-based flood mapping using early warning systems in the Copernicus Emergency Management Service. Remote Sens. 2021, 13, 2114. [Google Scholar] [CrossRef]
  25. Salamon, P.; Mctlormick, N.; Reimer, C.; Clarke, T.; Bauer-Marschallinger, B.; Wagner, W.; Martinis, S.; Chow, C.; Böhnke, C.; Matgen, P.; et al. The new, systematic global flood monitoring product of the copernicus emergency management service. In Proceedings of the 2021 IEEE International Geoscience and Remote Sensing Symposium IGARSS, Brussels, Belgium, 11–16 July 2021. [Google Scholar]
  26. Wang, C.; Hou, J.; Miller, D.; Brown, I.; Jiang, Y. Flood risk management in sponge cities: The role of integrated simulation and 3D visualization. Int. J. Disaster Risk Reduct. 2019, 39, 101139. [Google Scholar] [CrossRef] [Green Version]
  27. Ushio, T.; Sasashige, K.; Kubota, T.; Shige, S.; Okamoto, K.I.; Aonashi, K.; Inoue, T.; Takahashi, N.; Iguchi, T.; Kachi, M.; et al. A Kalman filter approach to the Global Satellite Mapping of Precipitation (GSMaP) from combined passive microwave and infrared radiometric data. J. Meteorol. Soc. Jpn. 2009, 87, 137–151. [Google Scholar] [CrossRef] [Green Version]
  28. García-Pardo, K.A.; Moreno-Rangel, D.; Domínguez-Amarillo, S.; García-Chávez, J.R. Remote Sensing for the Assessment of Ecosystem Services Provided by Urban Vegetation. A review of the methods applied. Urban For. Urban Green 2022, 74, 127636. [Google Scholar] [CrossRef]
  29. Zhu, W.; Zha, X.; Luo, P.; Wang, S.; Cao, Z.; Lyu, J.; Zhou, M.; He, B.; Nover, D. A quantitative analysis of research trends in flood hazard assessment. Stoch. Environ. Res. Risk Assess. 2022. in print. [Google Scholar] [CrossRef]
  30. Luo, P.; Luo, M.; Li, F.; Qi, X.; Huo, A.; Wang, Z.; He, B.; Takara, K.; Nover, D.; Wang, Y. Urban flood numerical simulation: Research, methods and future perspectives. Environ. Model. Softw. 2022, 156, 105478. [Google Scholar] [CrossRef]
  31. Wang, X.; Xie, H. A review on applications of remote sensing and geographic information systems (GIS) in water resources and flood risk management. Water 2018, 10, 608. [Google Scholar] [CrossRef]
  32. Ghaffarian, S.; Kerle, N.; Filatova, T. Remote sensing-based proxies for urban disaster risk management and resilience: A review. Remote Sens. 2018, 10, 1760. [Google Scholar] [CrossRef] [Green Version]
  33. Liu, D.; Tian, F.; Lin, M.; Sivapalan, M. A conceptual socio-hydrological model of the co-evolution of humans and water: Case study of the Tarim River basin, western China. Hydrol. Earth Syst. Sci. 2015, 19, 1035–1054. [Google Scholar] [CrossRef] [Green Version]
  34. Giordan, D.; Hayakawa, Y.; Nex, F.; Remondino, F.; Tarolli, P. The use of remotely piloted aircraft systems (RPASs) for natural hazards monitoring and management. Nat. Hazards Earth Syst. Sci. 2018, 18, 1079–1096. [Google Scholar] [CrossRef] [Green Version]
  35. Yan, X.; Xu, K.; Feng, W.; Chen, J. A rapid prediction model of urban flood inundation in a high-risk area coupling machine learning and numerical simulation approaches. Int. J. Disaster Risk Sci. 2021, 12, 903–918. [Google Scholar] [CrossRef]
  36. Ye, P.; Li, Y.; Zhang, H.; Shen, H. Bibliometric analysis on the research of offshore wind power based on web of science. Econ. Res.-Ekon. Istraživanja 2020, 33, 887–903. [Google Scholar] [CrossRef] [Green Version]
  37. Luo, P.; Liu, L.; Wang, S.; Ren, B.; He, B.; Nover, D. Influence assessment of new Inner Tube Porous Brick with absorbent concrete on urban floods control. Case Stud. Constr. Mater. 2022, 17, e01236. [Google Scholar] [CrossRef]
  38. Liberati, A.; Altman, D.G.; Tetzlaff, J.; Mulrow, C.; Gøtzsche, P.C.; Ioannidis, J.P.; Clarke, M.; Devereaux, P.J.; Kleijnen, J.; Moher, D. The PRISMA statement for reporting systematic reviews and meta-analyses of studies that evaluate health care interventions: Explanation and elaboration. J. Clin. Epidemiol. 2009, 62, e1–e34. [Google Scholar] [CrossRef] [PubMed] [Green Version]
  39. Moher, D.; Liberati, A.; Tetzlaff, J.; Altman, D.G.; PRISMA Group*. Preferred reporting items for systematic reviews and meta-analyses: The PRISMA statement. Ann. Intern. Med. 2009, 151, 264–269. [Google Scholar] [CrossRef] [Green Version]
  40. Mishra, A.; Mukherjee, S.; Merz, B.; Singh, V.P.; Wright, D.B.; Villarini, G.; Paul, S.; Kumar, D.N.; Khedun, C.P.; Niyogi, D.; et al. An overview of flood concepts, challenges, and future directions. J. Hydrol. Eng. 2022, 27, 03122001. [Google Scholar] [CrossRef]
  41. Lin, T.; Liu, X.; Song, J.; Zhang, G.; Jia, Y.; Tu, Z.; Zheng, Z.; Liu, C. Urban waterlogging risk assessment based on internet open data: A case study in China. Habitat Int. 2018, 71, 88–96. [Google Scholar] [CrossRef]
  42. Lei, X.; Gao, L.; Wei, J.; Ma, M.; Xu, L.; Fan, H.; Li, X.; Gao, J.; Dang, H.; Chen, X. Contributions of climate change and human activities to runoff variations in the Poyang Lake Basin of China. Phys. Chem. Earth Parts A/B/C 2021, 123, 103019. [Google Scholar] [CrossRef]
  43. Wahl, T.; Jain, S.; Bender, J.; Meyers, S.D.; Luther, M.E. Increasing risk of compound flooding from storm surge and rainfall for major US cities. Nat. Clim. Change 2015, 5, 1093–1097. [Google Scholar] [CrossRef]
  44. Kucharczyk, M.; Hugenholtz, C.H. Remote sensing of natural hazard-related disasters with small drones: Global trends, biases, and research opportunities. Remote Sens. Environ. 2021, 264, 112577. [Google Scholar] [CrossRef]
  45. Smith, E.A.; Asrar, G.; Furuhama, Y.; Ginati, A.; Mugnai, A.; Nakamura, K.; Adler, R.F.; Chou, M.D.; Desbois, M.; Durning, J.F.; et al. International global precipitation measurement (GPM) program and mission: An overview. In Measuring Precipitation from Space; Springer: Berlin/Heidelberg, Germany, 2007; pp. 611–653. [Google Scholar] [CrossRef]
  46. Soares-Frazão, S.; Lhomme, J.; Guinot, V.; Zech, Y. Two-dimensional shallow-water model with porosity for urban flood modelling. J. Hydraul. Res. 2008, 46, 45–64. [Google Scholar] [CrossRef]
  47. Tayyab, M.; Zhang, J.; Hussain, M.; Ullah, S.; Liu, X.; Khan, S.N.; Baig, M.A.; Hassan, W.; Al-Shaibah, B. GIS-Based Urban Flood Resilience Assessment Using Urban Flood Resilience Model: A Case Study of Peshawar City, Khyber Pakhtunkhwa, Pakistan. Remote Sens. 2021, 13, 1864. [Google Scholar] [CrossRef]
  48. Manawadu, L.; Wijeratne, V. Anthropogenic drivers and impacts of urban flooding—A case study in Lower Kelani River Basin, Colombo Sri Lanka. Int. J. Disaster Risk Reduct. 2021, 57, 102076. [Google Scholar] [CrossRef]
  49. Rivas Casado, M.; Irvine, T.; Johnson, S.; Palma, M.; Leinster, P. The use of unmanned aerial vehicles to estimate direct tangible losses to residential properties from flood events: A case study of Cockermouth Following the Desmond Storm. Remote Sens. 2018, 10, 1548. [Google Scholar] [CrossRef] [Green Version]
  50. Kucharczyk, M.; Hay, G.J.; Ghaffarian, S.; Hugenholtz, C.H. Geographic object-based image analysis: A primer and future directions. Remote Sens. 2020, 12, 2012. [Google Scholar] [CrossRef]
  51. Sun, F.; Wang, Y.; Chen, Y.; Li, Y.; Zhang, Q.; Qin, J.; Kayumba, P.M. Historic and Simulated Desert-Oasis Ecotone Changes in the Arid Tarim River Basin, China. Remote Sens. 2021, 13, 647. [Google Scholar] [CrossRef]
  52. Bai, H.; Li, Z.; Guo, H.; Chen, H.; Luo, P. Urban Green Space Planning Based on Remote Sensing and Geographic Information Systems. Remote Sens. 2022, 14, 4213. [Google Scholar] [CrossRef]
  53. Paez, A. Gray literature: An important resource in systematic reviews. J. Evid.-Based Med. 2017, 10, 233–240. [Google Scholar] [CrossRef]
  54. Nunberg, G. Google’s Book Search: A Disaster for Scholars; The Chronicle of Higher Education: Washington, DC, USA, 2009; p. 31. [Google Scholar]
  55. Rango, A.; Shalaby, A.I. Operational applications of remote sensing in hydrology: Success, prospects and problems. Hydrol. Sci. J. 1998, 43, 947–968. [Google Scholar] [CrossRef]
  56. Meesuk, V.; Vojinovic, Z.; Mynett, A.E.; Abdullah, A.F. Urban flood modelling combining top-view LiDAR data with ground-view SfM observations. Adv. Water Resour. 2015, 75, 105–117. [Google Scholar] [CrossRef]
  57. Inès, J.-B.; Annett, W.; Simone, D. Manual for CEMS-Rapid Mapping Products; Publications Office of the European Union: Luxembourg, 2020. [CrossRef]
  58. Wang, Y.; Chen, A.S.; Fu, G.; Djordjević, S.; Zhang, C.; Savić, D.A. An integrated framework for high-resolution urban flood modelling considering multiple information sources and urban features. Environ. Model. Softw. 2018, 107, 85–95. [Google Scholar] [CrossRef]
  59. Jongman, B.; Ward, P.J.; Aerts, J.C.J.H. Global exposure to river and coastal flooding: Long term trends and changes. Glob. Environ. Change 2012, 22, 823–835. [Google Scholar] [CrossRef]
  60. Bates, P.D.; Quinn, N.; Sampson, C.; Smith, A.; Wing, O.; Sosa, J.; Savage, J.; Olcese, G.; Neal, J.; Schumann, G.; et al. Combined modeling of US fluvial, pluvial, and coastal flood hazard under current and future climates. Water Resour. Res. 2021, 57, e2020WR028673. [Google Scholar] [CrossRef]
  61. Vousdoukas, M.I.; Mentaschi, L.; Voukouvalas, E.; Verlaan, M.; Jevrejeva, S.; Jackson, L.P.; Feyen, L. Global probabilistic projections of extreme sea levels show intensification of coastal flood hazard. Nat. Commun. 2018, 9, 2360. [Google Scholar] [CrossRef] [PubMed] [Green Version]
  62. Guo, B.; Wang, X.; Pei, L.; Su, Y.; Zhang, D.; Wang, Y. Identifying the spatiotemporal dynamic of PM2. 5 concentrations at multiple scales using geographically and temporally weighted regression model across China during 2015–2018. Sci. Total Environ. 2021, 751, 141765. [Google Scholar] [CrossRef]
  63. Díez-Herrero, A.; Garrote, J. Flood risk analysis and assessment, applications and uncertainties: A bibliometric review. Water 2020, 12, 2050. [Google Scholar] [CrossRef]
  64. Zwęgliński, T. The use of drones in disaster aerial needs reconnaissance and damage assessment–three-dimensional modeling and orthophoto map study. Sustainability 2020, 12, 6080. [Google Scholar] [CrossRef]
  65. Yasir, M.; Hui, S.; Binghu, H.; Rahman, S.U. Coastline extraction and land use change analysis using remote sensing (RS) and geographic information system (GIS) technology—A review of the literature. Rev. Environ. Health 2020, 35, 453–460. [Google Scholar] [CrossRef]
  66. Yang, J.; Zhang, H.; Ren, C.; Nan, Z.; Wei, X.; Li, C. A cross-reconstruction method for step-changed runoff series to implement frequency analysis under changing environment. Int. J. Environ. Res. Public Health 2019, 16, 4345. [Google Scholar] [CrossRef] [PubMed] [Green Version]
  67. Schnebele, E.; Cervone, G.; Kumar, S.; Waters, N. Real time estimation of the Calgary floods using limited remote sensing data. Water 2014, 6, 381–398. [Google Scholar] [CrossRef] [Green Version]
  68. Sheng, Z.; Feng, J. A Hydrology Metadata Visualization Method Based on XML Schema. Chin. J. Electron Devices 2013, 36, 540–545. [Google Scholar] [CrossRef]
  69. Sheng, J.G.; Dan, Y.D.; Liu, C.S.; Ma, L.M. Study of Simulation in Storm Sewer System of Zhenjiang Urban by Infoworks ICM Model. Appl. Mech. Mater. 2012, 193–194, 683–686. [Google Scholar] [CrossRef]
  70. Hamrick, J.M. A Three-Dimensional Environmental Fluid Dynamics Computer Code: Theoretical and Computational Aspects; The College of William and Mary, Virginia Institute of Marine Science: Williamsburg, VA, USA, 1992. [Google Scholar] [CrossRef]
  71. Xu, L.; Chen, N.; Chen, Z.; Zhang, C.; Yu, H. Spatiotemporal forecasting in earth system science: Methods, uncertainties, predictability and future directions. Earth-Sci. Rev. 2021, 222, 103828. [Google Scholar] [CrossRef]
  72. Dhaya, R.; Kanthavel, R. Video Surveillance-Based Urban Flood Monitoring System Using a Convolutional Neural Network. Intell. Autom. Soft Comput. 2022, 32, 183–192. [Google Scholar] [CrossRef]
  73. Zhang, Y.; Chen, Z.; Zheng, X.; Chen, N.; Wang, Y. Extracting the location of flooding events in urban systems and analyzing the semantic risk using social sensing data. J. Hydrol. 2021, 603, 127053. [Google Scholar] [CrossRef]
  74. Song, Z.; Tuo, Y. Automated flood depth estimates from online traffic sign images: Explorations of a convolutional neural network-based method. Sensors 2021, 21, 5614. [Google Scholar] [CrossRef]
  75. Deng, H.; Pepin, N.C.; Chen, Y.N.; Guo, B.; Zhang, S.; Zhang, Y.; Chen, X.; Gao, L.; Liu, M.; Chen, Y. Dynamics of Diurnal Precipitation Differences and Their Spatial Variations in China. J. Appl. Meteorol. Climatol. 2022, 61, 1015–1027. [Google Scholar] [CrossRef]
  76. Duan, W.; Zou, S.; Christidis, N.; Schaller, N.; Chen, Y.; Sahu, N.; Li, Z.; Fang, G.; Zhou, B. Changes in temporal inequality of precipitation extremes over China due to anthropogenic forcings. Npj Clim. Atmos. Sci. 2022, 5, 1–13. [Google Scholar] [CrossRef]
  77. Duan, W.; Maskey, S.; Chaffe, P.L.; Luo, P.; He, B.; Wu, Y.; Hou, J. Recent advancement in remote sensing technology for hydrology analysis and water resources management. Remote Sens. 2021, 13, 1097. [Google Scholar] [CrossRef]
  78. Cao, Z.; Zhu, W.; Luo, P.; Wang, S.; Tang, Z.; Zhang, Y.; Guo, B. Spatially Non-Stationary Relationships between Changing Environment and Water Yield Services in Watersheds of China’s Climate Transition Zones. Remote Sens. 2022, 14, 5078. [Google Scholar] [CrossRef]
  79. Wang, Z.; Luo, P.; Zha, X.; Xu, C.; Kang, S.; Zhou, M.; Nover, D.; Wang, Y. Overview assessment of risk evaluation and treatment technologies for heavy metal pollution of water and soil. J. Clean. Prod. 2022, 134043. [Google Scholar] [CrossRef]
Figure 1. PRISMA flow diagram.
Remotesensing 14 05505 g001
Figure 2. Number of documents per publication year.
Remotesensing 14 05505 g002
Figure 3. The number of articles and World Bank economy classification for study area country/territory.
Remotesensing 14 05505 g003
Figure 4. Number of articles corresponding to observations.
Remotesensing 14 05505 g004
Figure 5. Remote sensing data type: the number of documents (a) all publication years; (b) each publication year. Remote sensing data analysis method: the number of documents (c) all publication years; (d) each publication year.
Remotesensing 14 05505 g005
Table 1. Retrieval terms, strategy, databases, and records.
ComponentAttributes
Retrieval terms
Term 1 (urban): “urban*” OR “city*” OR “metropolitan*”
Term 2 (flood): “ flood*” OR “ flood* hazard*” OR “ flood* analysis*” OR “ flood* modeling*”
Term 3 (remote sensing): “remote* sens*” OR map* OR inspection* OR surve* OR imag* OR “search* area” OR “structure from motion” OR SFM* OR photograph* OR photogrammetr* OR LIDAR OR “laser scan*” OR “synthetic aperture radar” OR “light detection and ranging” OR infrared OR thermal OR hyperspectral OR multispectral OR “red green blue” OR RGB OR video* OR camera* OR “point cloud*” OR orthophoto* OR orthomosaic* OR raster* OR “digital terrain model*” OR “digital elevation model*” OR “elevation model*” OR “digital surface model*” OR “digital terrain” OR DTM OR DTMs OR DEM OR DEMs OR DSM OR DSMs OR 3D OR “3 dimensional” OR “three dimensional” OR “deep learning” OR “computer vision” OR “convolutional neural network*” OR convnet* OR “pixel based” OR “object based” OR “informatics tool*” OR “target detection”
Retrieval strategy
Titles, abstracts, and keywords
Term 1 AND Term 2 AND Term 3
DatabasesWeb of Science
Records (as of 2022-04-26)1673
Table 2. Top 10 Sources.
SourcesNumber
Natural Hazards38
Water34
Remote Sensing28
Journal of Hydrology18
Journal of Flood Risk Management10
Sustainability9
Water Resources Management7
Journal of Hydrologic Engineering7
Arabian Journal of Geosciences7
Water Resources Research6
Table 3. Disaster management function and activity.
Disaster Management FunctionDisaster Management ActivityNumber of DocumentsPercentage (n = 347)
MitigationVulnerability assessment and risk modeling29084%
Hazard detection205%
PreparednessProvision of baseline data72%
ResponseSearch and rescue11%
Rapid damage assessment247%
RecoveryIn-depth damage assessment51%
Publisher’s Note: MDPI stays neutral with regard to jurisdictional claims in published maps and institutional affiliations.

