Abstract
When integrating railway constructions and refurbishments into an existing infrastructure, it is beneficial to have knowledge of the exact state, geometry, and placement of the connected assets. While new constructions and the maintenance of existing lines can directly use existing digital models and incorporate them into their processes, existing railways often predate digital technologies. This gap in digital models leaves the planning processes of new constructions and refurbishments to primarily rely on non-automated and analogue workflows. With a multitude of asset types, layouts and country-specific standards, the automatic generation of adequate detection models is complicated and needs to be tailored to the current project environment, generating considerable overhead. Addressing this issue, this paper presents the concept of priming. Priming increases the adaptation performance to highly volatile, low-data environments by leveraging previous, existing CAD projects. We introduce a translation scheme that converts the existing 3D models into realistic, project-specific, synthetic surveys and a complemental dialled-in training routine. When applied to a convolutional neural network, we show that the primed training will converge faster and with greater stability, especially when using sparse training data. Our experiments show that priming can reduce the time for network adaptation by over 50%, while also improving resilience to underrepresented object types.
1. Introduction
The European railway network is the second most relevant rail network worldwide and is vital for cargo and passenger transport. In some European countries, trains are responsible for hauling over 40% of the freight [1] and 17% of recorded passenger–kilometres [2]. However, with the increasing demand for robust and energy-efficient transportation, lower-performing service lines need to be completely modernised, replaced or refurbished [3]. Due to the long lifespan of service lines, the documentation is often lost or does not live up to modern standards. Even if documentation is available, only the most recent projects are fully digitalised.
As digitalisation in the infrastructure context progresses, pure 2D planning in railway construction is gradually being replaced with BIM-based approaches using semantic-geometric models. High-quality geometric-semantic models of the existing infrastructure are essential for model-supported planning and maintenance. For some applications, the as-planned model may suffice, and the track can be refurbished from existing plans. Often, the as-planned model is insufficient, and an accurate as-is model is needed. The missing information can be abstracted from extensive surveys. For both the as-planned and the as-is strategy, experts need to invest a notable amount of hours into recreating the assets by painstakingly digitalising them by hand.
Since different projects often come with different documentation depths and standards, concepts based on surveying and removing the necessity of existing documentation are receiving growing interest. In theory, such approaches can enhance the re-usability of assets between existing and new projects. Naturally, the quality of these survey-based concepts comes down to the quality of the available survey. Modern survey technologies based on LiDAR scanners can record tracks with speeds above 60 km/ while maintaining high precision. With the decreasing cost and increased coverage, the limiting factor for survey-based concepts’ viability is the translation of recordings to suitable semantic models. Methods have been proposed to automate or semi-automate this process, however, due to the diversity of railway infrastructure assets and country regulations, none succeeded in lowering the cost and effort. Despite the challenges, recent prototypes have shown prospecting performance at some required processing steps. This new generation of systems integrates artificial intelligence to segment, classify and recognise objects. These systems provide very good detection on basic object types and, with careful tuning, can be deployed to practice. With further refinement and extension, these systems are sufficient to recognise advanced object types and show great promise for reflecting the actual complexity of railway structures.
However, one unexplored question is how these systems behave in unknown and uncontrollable environments and how the decrease in performance due to operation outside of the specification of selected training datasets can be mitigated. Currently, simple changes including different capturing devices, modified boundary conditions or additional requirements might lead to diverging results and expectations. A system which works flawlessly in one specific environment will most certainly fail in another. This problem is directly tied to the high diversity of European railway designs. Different European countries use different assets, some of which might have never been processed before. Therefore, for almost all railway projects, the detection classifier needs to be revised, extended, and most importantly, validated. This revision is not only costly but also time-consuming. Nevertheless, as adaption and validation ensure the quality of the resulting geometric-sematic model and indirectly influence the maintenance and planning stages, it should not be skipped or bypassed.
In the worst-case scenario, the adjustment of the algorithms may present a bottleneck, which delays other subsequent processes. All required steps, retraining, updating and verification involve manual labour, for which specialists are needed. Consequently, quick adjustments and robust operation are the keys to a wider adoption of automated mapping of railway infrastructures.
This research contribution is a proposal for enhancing the robustness and flexibility of data-driven methods by creating an independent synthetic data source and combining it with an optimised training routine. The new data source is based on repurposed CAD models, which are now exaptations, and dynamically converts the models into realistic labelled point clouds for training and verification. The dynamic part ensures that for each new project, the data match the new project’s specific requirements and maximises the effect. With a modified training routine, which primes the data-driven method, this by-product increases the adoption rates between railway projects and reduces the in-between project effort for data generation. Therefore, the priming methodology directly aims at the operation, preparation, and feasibility of new survey-based methods and grows with the increasing complexity of newer projects.
Starting with a brief summary of existing approaches in the background chapter Section 2, we introduce our priming methodology, described in three steps in Section 3. After a short overview, this section introduces the challenge and the concept of semantic unification (see Section 3.1). This section directly ties into Section 3.2, which integrates the unification concept and describes the core of the priming concept, the entire preparation of synthetic training data. The last part, Section 3.3, concludes our methodology by explaining our improved training methodology. In Section 5, we introduce the physical and synthetic datasets and their objectification in the described experiments. This synthetic, infinite resource of simulated recordings is the foundation of the follow-up case studies in Section 6 in which we use two identified scenarios to study the effect of the priming method on the adoption rate and quality. In conjunction with transfer learning, we showcase how our methodology can reduce the effort and increase flexibility while working with point cloud network architectures. In each study, the methodology is validated with real-world rail cart surveys, and the adaptation rate is measured. Finally, we conclude our findings by explaining the scope of the results and the application of our concept to other neural network architectures (Section 7). The source code of our prototype can be reviewed at the https://github.com/FelixEickeler/RailTwin-Virtualizer (accessed on 25 July 2022) (GitHub Repository) [4].
2. Background
Railway surveying systems have two major distinctive attributes, the platform, e.g., the vessel of the sensors, and the type of sensors mounted to it. Surveys need to span multiple track kilometres and the area around them. Aside from special solutions that use flying carriers, rail carts are the widely adopted platform choice. Rail carts have lower operating costs and move inside the asset, which lets them cover all regions of interest.
The primary sensor types when recording railway infrastructure are LiDAR and/or cameras. While the latter can provide highly detailed information about the objects themselves, the 3D geometry is missing or needs to be time-consumingly reconstructed. These image-based reconstructions display poor geometric accuracy [5]. Due to this limitation, image-based approaches have been exclusively used for maintenance or inventory assessment. Some maintenance examples can be found in [6,7,8]. In contrast, LiDAR-based systems can provide the high geometric accuracy needed for remodelling. This geometry can be used as a 3D skeleton to attach further semantics.
After the recording, multiple processing steps have to be completed until the LiDAR-based survey is interpreted and results in a rich and accurate model. Independently of the survey type, the generic tasks for this conversion are:
- 1.
- Filtering—Relevant recorded points need to be selected. There are two main goals to this process: One, to reduce the influence of noise and recording artefacts, and two, to reduce the computational load.
- 2.
- Segmenting and Locating—The filtered, unordered point cloud needs to be segmented, e.g., object categories or object instances need to be identified. Generally, point clouds solely describe the surfaces of objects. As such, objects need to be complemented, and their »true« location needs to be determined.
- 3.
- Refining—After the segmentation process, the next step is to refine and agglomerate single pieces of information into more descriptive details. This process can utilise the relation of objects to identify important relationships. One example is the relation of the left and right rail in the context of railways.
- 4.
- Rearranging—The extracted information needs to be converted into design and maintenance parameters for the use and integration in any architecture, engineering, or construction context.
While all survey evaluations need some form of algorithmic backend to perform these tasks, the explicit approach is dependent on the survey type and the data quality.
2.1. Rule-Based Segmentation
Early approaches for railway remodelling used single features and logical coherence to separate points into different classes. Elberink et al. [9] mainly used the height to identify coherent sets of points, which were then further processed with model fitting and symmetric relations. This paper intelligently uses the relation between 1 m × 1 m grid-cells and the common gauge. The specific cell size, which has a diagonal that is less than the common gauge, automatically singles out objects and improves the processing time, therefore improving model accuracy. While the process delivers good quality on close to original datasets, different railway cross-sections need adjustment to the internal thresholds. Elberink also only provides a basic recognition of terrain, rails, masts, contact wires and catenary. Additional key components were recognised by the methodology of Arastounia [10]; its core concepts were later extended by incorporating more information such as GNSS or scan angles [11,12].
A more contemporary take on rule-based recognition follows a more simplistic approach by leveraging the relation between catenary masts and the track layout [13]. The recorded track is divided using singular value decomposition, and each chunk is processed separately. Similarly to Elberink and Khoshelham [14], the main components are separated by fitting rails with a RANSAC variant. The relation between the masts and centrelines of the preprocessed point clouds is used to reduce the computational load. Special care was taken in processing catenary wires. The main contribution of Ariyachandra and Brilakis [15] is the integration of industry foundation classes, which relate to a basic form of rearrangement. However, the rail-bed is modelled as a triangulated surface, and the assets are not c2-continous. Additional approaches for converting segmented assets into IFC were investigated by [16]. However, the processing step of rearranging is not the current focus of this research.
Gézero and Antunes [17] used additional by-products of the railway recording to detect rails with high fidelity. Their approach of using scan angles, usually provided in the LAZ format, is limited to the use of rail carts. Because of this limitation, the extraction works directly on the point cloud without prefiltering.
2.2. Data-Driven Segmentation
Naturally, as an extension to the previously listed rule-based 3D scene segmentation approaches, data-driven approaches have significantly improved 3D scene segmentation. Sánchez-Rodríguez et al. [18] integrated machine learning algorithms as an extension to pure procedural detection. Their mixed approach, targeting tunnels, uses support vector machines to segment the rails from the railbed. Similar ideas have also been applied to road infrastructure [19]. Chen et al. [20] achieved remarkable results analysing the overhead catenary system. Their methodology is based around density-based spatial clustering. They detected contact wires, catenary cables, masts and return current cables with high accuracy and precision.
The concept of decision trees to pointwise classify the survey was investigated by Guinard et al. [21]. In a follow-up, they refined the results using a cut-pursuit algorithm. Guinard et al. [21] used five classes to verify their approach. A more sophisticated approach was conducted by Grandio et al. [22] in which they used PointNet++ to segment eight classes. In an extensive study, they trained the networks on approximately 1.9 billion points with a high learning rate. The results range from 50.76% for droppers to 99% for masts. Another new methodology with axially symmetrical convolutions was developed by Manier et al. [23]. The specific convolution kernel geometry addresses the point distribution of the structural gauge delivering robust results with varying point densities.
2.3. Transfer Learning
A substantial driver of the domain adoption of deep learning has been the concept of transfer learning. Transfer learning is the process of improving the capabilities of an ML agent (machine learning agent) based on different datasets from adaptable domains. Transfer learning (TL) can be differentiated into homogeneous and heterogeneous TL. Homogeneous TL describes the same features while heterogeneous TL describes a different feature stack [24]. For point cloud segmentation, the feature stack is often set by the available sensors and additional properties defined by the engineer. If the domain is not related, the extra bias of the domain might lead to negative TL. A concept for best applying weights from other domains was developed in Chronopoulou et al. [25], which gradually unlocked gradients for the best possible outcome while using a combined cost function for the layer.
The first paper to use TL on railway detection studied the adaption of the KPConv and the PointNet architecture. An existing model was adapted and compared with a newly trained ML model. Previous results from Sánchez-Rodríguez et al. [18] were used as training and test data [26]. The transfer learning is homogenous, and the task is comparable, as only a so-called class mismatch occurs [24]. The paper only distinguishes between four different classes and states a very high learning rate and low learning rate decay. The paper mentions overfitting, which does not seem plausible with the chosen network and training configuration.
The deep learning architecture based on KPConv conceptualises nearest-neighbour influences in a ResNet-style encoder–decoder structure [27,28]. For the encoder, a lattice-like kernel is projected to the point cloud. For each feature and each position of the kernel, the influence of the neighbouring points is calculated. These kernel points define the input of the convolution. The spatial information is reduced to latent code in a mixture of strided and unstrided blocks. This latent code is then passed into the decoder that uses the closest neighbour for decoding. In a few fully connected layers, the KPConv assigns the objects. A direct comparison between the KPConv’s 3D convolution and 2D convolutions is visualised in Thomas Hugues’ thesis [29]. Networks based on the KPConv architecture provided state-of-the-art machine learning models, which, from internal evaluation, work very well for larger outdoor scenes.
2.4. Problem Description Adaptation
There are mainly two complications when applying TL in rail infrastructure projects. The first complication () occurs when the premise of the construction project changes. The requirements of each project differ slightly from one another. As a result, the recognition task needs to be redefined with the new requirements in mind. These changes invalidate the previously validated ML models. The second complication () materialises when the model’s performance cannot be guaranteed because of certain external factors. Such factors could be unusual recording conditions or unknown surroundings.
For , the need to adapt the outputs of the neural network arises. complications could happen if a new project also needs to include a new object type, which might not be present in the old ML model. Such project differences resemble the notion of a class mismatch in homogenous TL. Consecutively, the architecture of the model needs to be adapted and the layers updated. As the latent space of most well-trained networks will rarely be affected, simple requirement changes will only trigger a reconfiguration of the output layers.
The second complication, , is present when the recorded environment does not have enough similarity to previous surveys used for training. In this case, the abstraction capabilities of the existing ML model are not enough to compensate. Such missing abstraction capabilities can be noticed when evaluating the model on a small part of the new survey. If the score regresses for individual object types, the asset might be of a different shape or presented in a different context. If the performance regresses equally over all classes, one can assume different recording conditions. Addressing is more complicated as multiple possible error sources exist: uniform original training data, inherent feature differences or domain mismatches. Two possible solutions to counter both complication types are evident:
- Retrain the whole model with a more diverse dataset, including parts from the new survey; or
- Use transfer learning to adapt the current model to the new project.
While transfer learning might promise good results with lower effort, it also bears the risk of less flexibility. Nevertheless, with a limited, repetitive survey environment, the trade-off accuracy might be more important than generalisation. No matter which case, retraining or transfer learning, essential layers of the current ML model must be fitted. In conclusion, parts of the new project’s survey need to be annotated, which results in considerable effort and cost. The inherent training of the ML model adds additional time and complexity.
3. Methodology
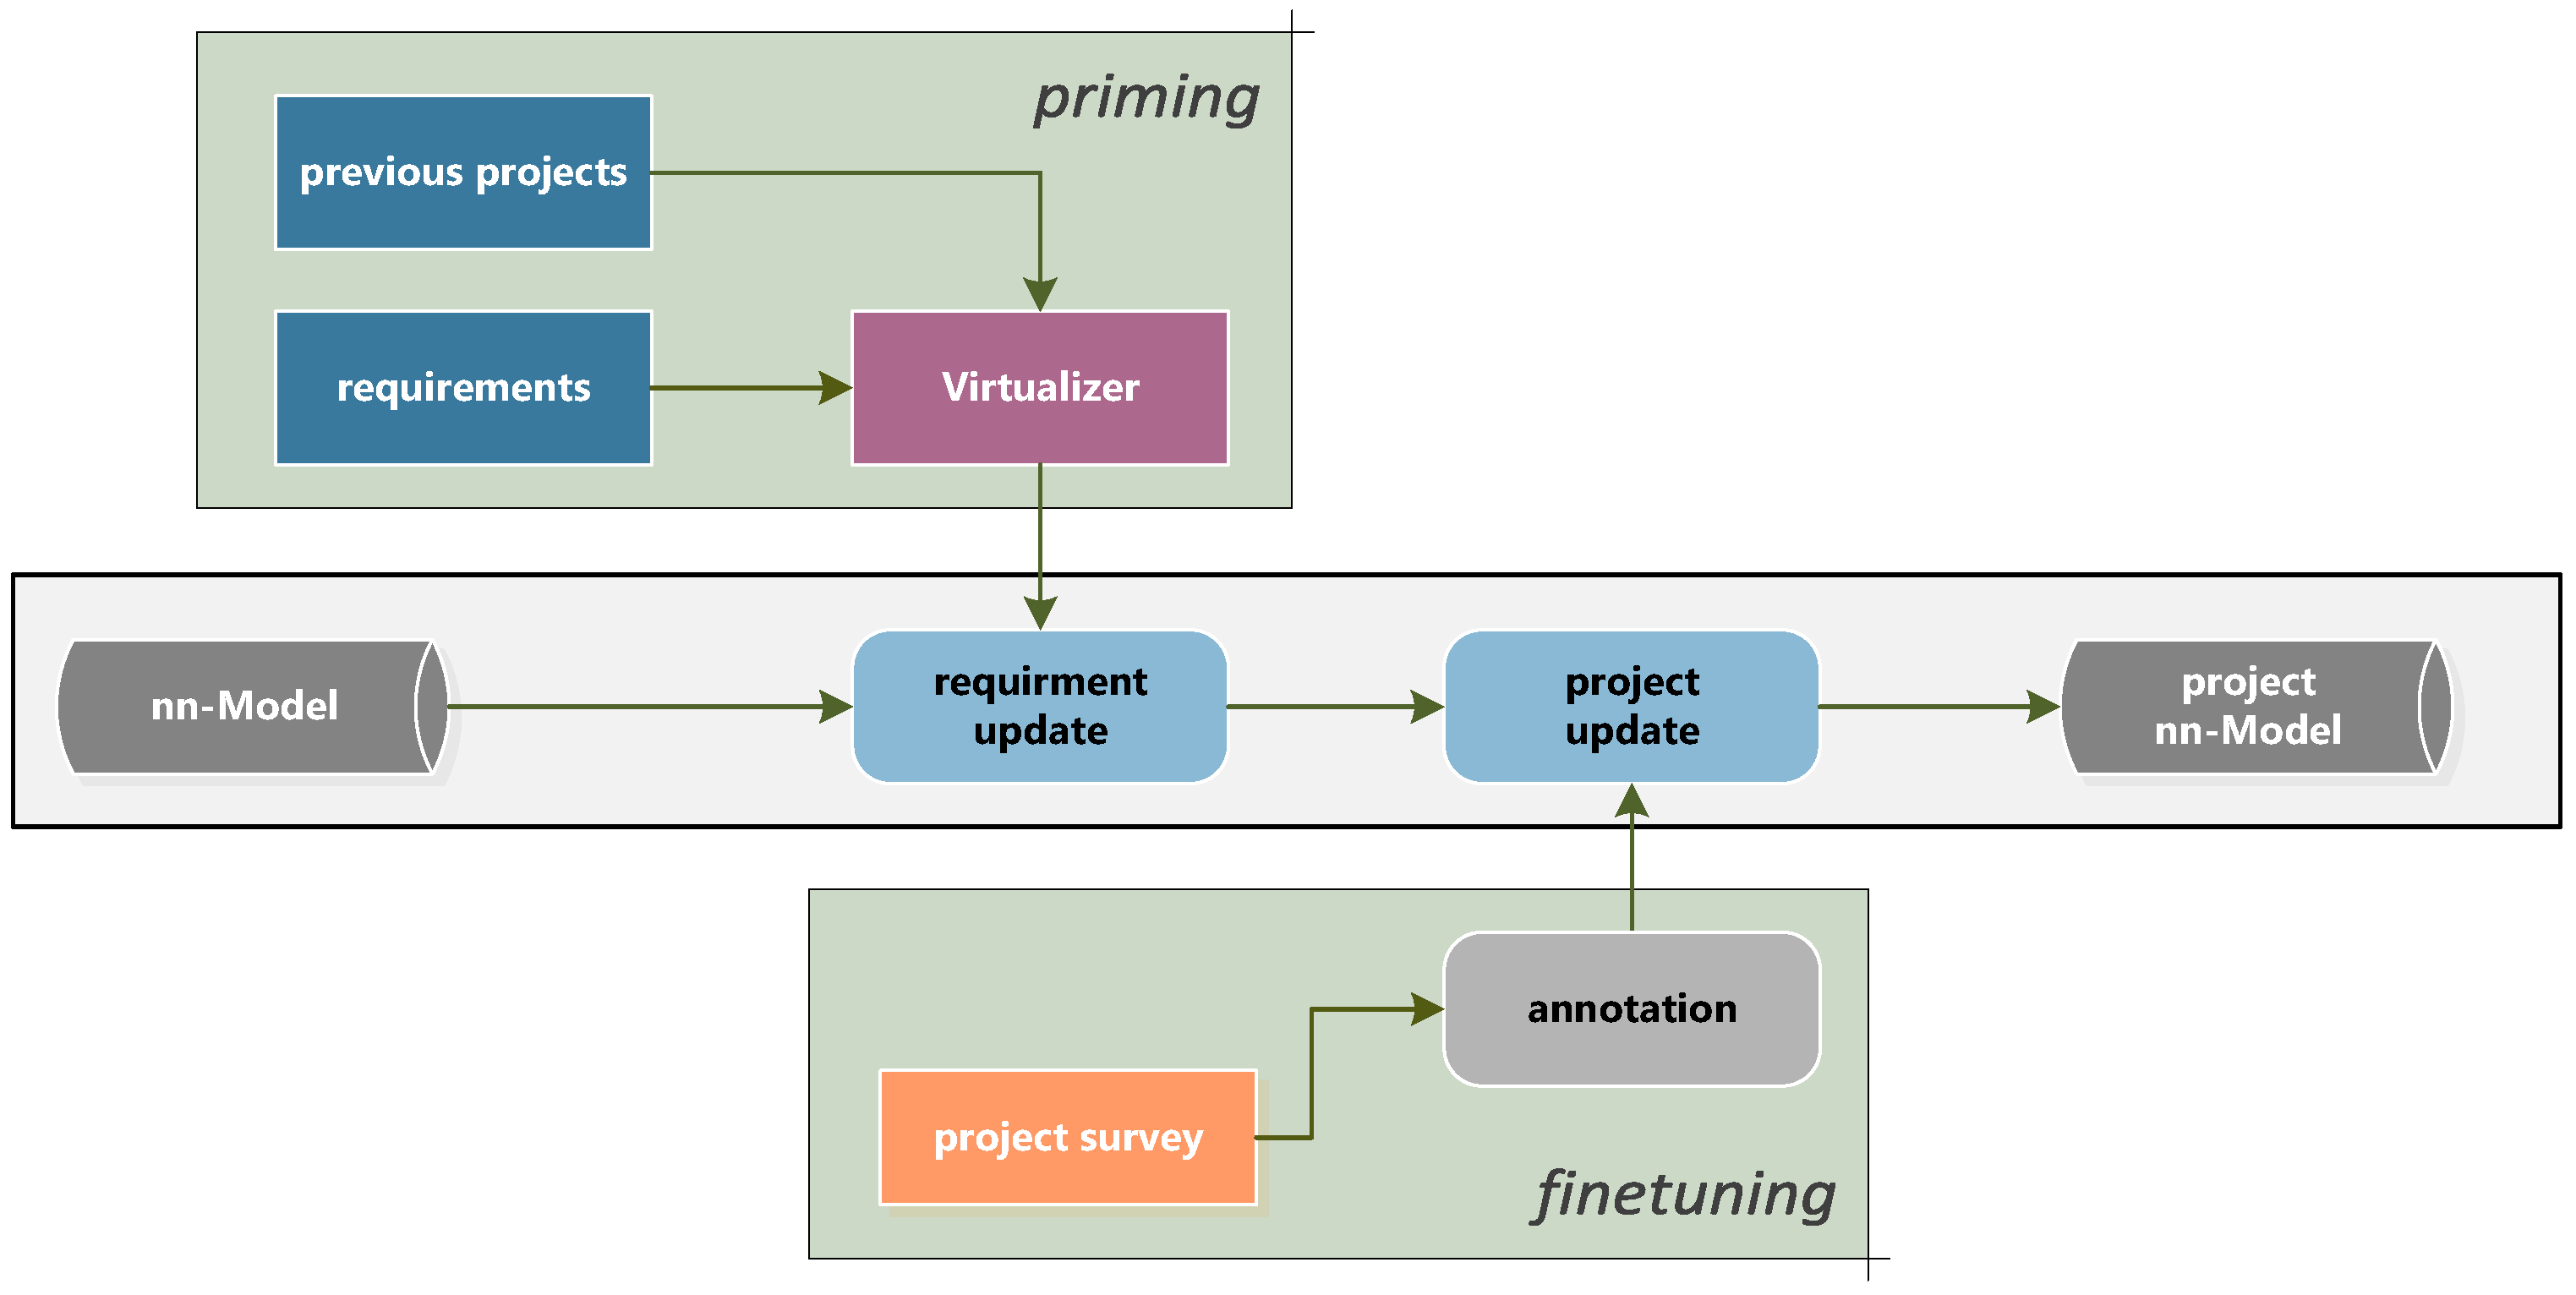
Our methodology, shown in Figure 1, combines the reuse of existing CAD models from previous projects with an improved two-stage training methodology. The two training stages are: a first priming stage, during which synthetic data from the CAD models are used, and a second finetuning stage, during which physically recorded point clouds improve the detection performance.
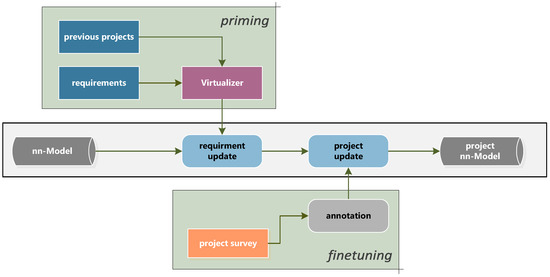
Figure 1.
Overview of priming methodology. In case of a new survey, the Virtualizer will convert the CAD models into synthetic point clouds based on the new project requirements. These point clouds are used to update and preconfigure the nn-Model, reducing the data and training requirements on the second survey-driven updating step. The result is a project-specific neural network.
For the initial priming stage, the CAD models are always processed to fit the training data requirements of the current project. This guarantees an optimal starting position and reduces the errors originating from and partly . For the subsequent finetuning, the physical training data are projected to the required class space, and after finetuning, an optimised neural network is obtained. With ongoing project cycles, the repository of CAD models will grow, and the priming will capture more and more stakeholder-specific requirements.
3.1. Requirements for Priming
During priming, it is essential to abstract the requirements of the current project as best as possible. Aside from the target recording setups, the object types need to be considered in the neural network architecture. Grouping objects by their geometric shapes in such a way that these same groups also translate into functional groups is called objectification. This objectification is driven by the mitigation of contradicting classifications. Rail-bound examples for geometrically close but functionally different components are catenary and supply wires, signals and generic signs or luggage and rubbish bins. As the physical surface relates geometric and functional groups, the objectifications of the groups share resemblance. However, the structure cannot be perfect, and trade-offs must be made. All trade-offs are closely related to the project requirements. If, for example, the project requires the advanced monitoring of the functional catenary systems, this requirement must be reflected in the objectification. This means that the functional groups might consist of many different geometries, shapes or locations. A poor selection will directly affect the adaption speed and the final network performance.
In our priming concept, this adaptation process needs explicit care since many existing CAD files were not modelled with the classification required by the project’s objectification. Original CAD files often state the exact object name, not the type, class, or function. This makes rearranging them into the context of the current project’s objectification a definite requirement.
In the implementation of our approach, we provide a generic tree hierarchy in which the lowest leaf represents the actual object type. Each upper vertex comprises a selective grouping. Based on the project requirements, each vertex can be reattached at a different location to create a project-specific tree. This project-specific tree is then directly used in the priming process. The first, e.g., primary vertices of such a project tree, are shown in Figure 4.
The instructions to translate the generic tree to the project-specific tree represent a formal description of objectification. Examples of such configuration files are provided with the source code in Eickeler [4].
Addressing , the requirements also need to reflect different recording setups. The data generated from digital railways have the advantage that boundary conditions and parameters can be exchanged for every project. We identified the following recording parameters that directly affect our priming method: (1) the type of sensor; (2) the number of sensors; (3) the platform definition; (4) front- or back-facing setups; (4) speed profile of the vessel; (5) augmentation; and (6) material and (7) surface selections.
3.2. Virtualizer
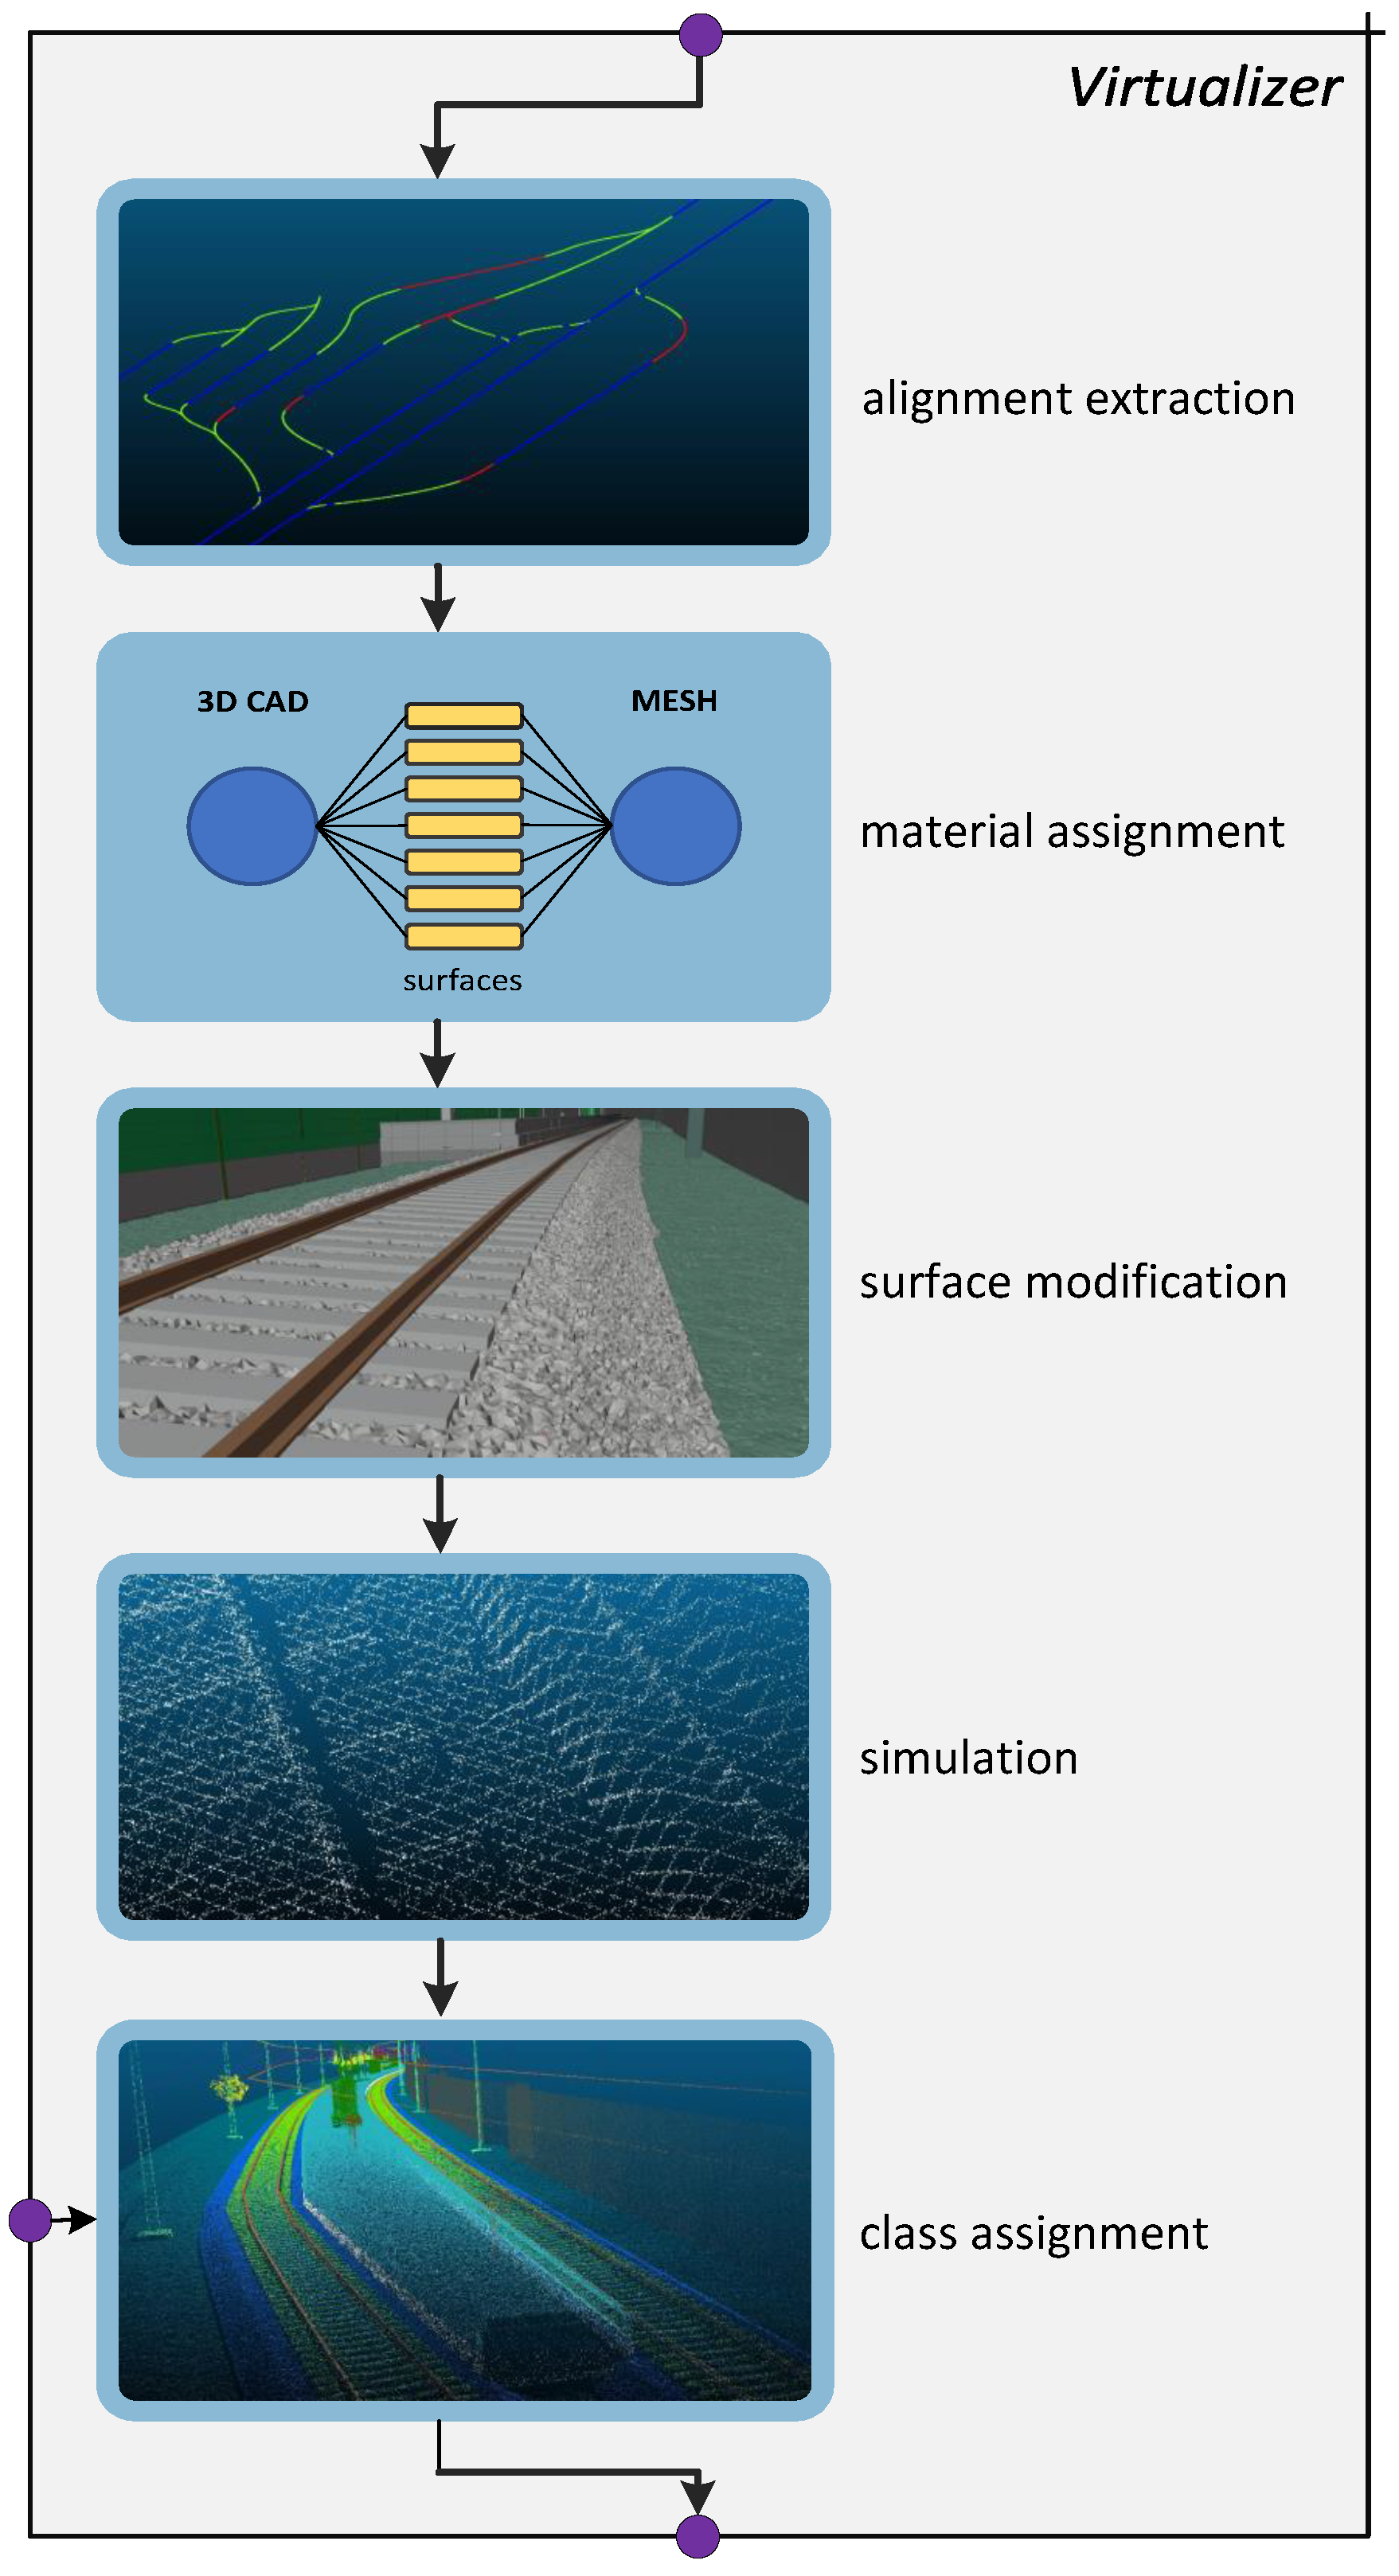
The translation scheme of the semantic CAD model into artificial training data is shown in Figure 2. The Virtualizer concept can be understood as the digital summary of railway construction, surveying and annotation.
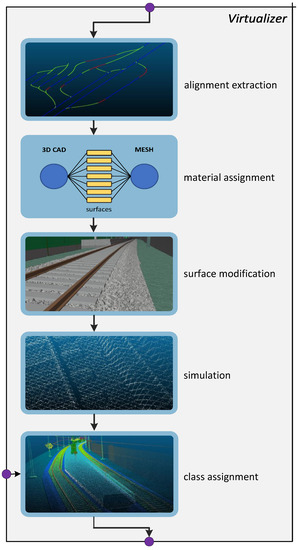
Figure 2.
Conceptual overview of the Virtualizer. Based on the alignment definitions of the CAD files, a virtual rail cart will convert the models into suitable point clouds. Prior to the simulation with helios++, materials and surfaces are updated. In the last step, the classes are assigned to the points based on the new project requirements.
The first step in generating the artificial training data is extracting the alignment, as it is the essential design element of any railway (alignment extraction). The extracted alignment is needed as the path of the rail cart and to identify overlaps between different CAD files and regions. Identifying and removing these overlaps is vital as the objects in such regions would be overrepresented in the training data, and, therefore, the priming process.
In the second step, the geometry is processed into simpler triangulated surfaces (material assignment). Aside from material properties, which are extracted or updated with predefined sources such as the ECOSTRESS library (see Fisher et al. [30]), each surface is assigned a unique identifier. The unique identifier unambiguously binds the surface to the specific CAD entity from which it was generated. Special care is needed to process the often globally defined coordinate systems. We shift the CAD model to a local coordinate system for processing, thus preserving the original alignment.
Original CAD geometries consist of extruded surfaces and need to be enhanced for realism (surface modification). This is particularly important for rough components, where the roughness is not represented in the mesh. The usual suspects are grass, gravel or rail beds. Based on the material definitions, we modify the set of surfaces by projecting augmented textures onto the respective surfaces. A surface modifier uses this UV-mapping to update the surface with a close-to-realistic, explicit mesh. The surface modification concludes the digital construction, resulting in a realistic triangulated mesh of explicitly formulated geometries, advanced material definitions and a semantic lookup table that links surfaces to the original entities.
The digital surveying (simulation) consists of a virtual rail cart, modelled in helios++ [31]. In a ray tracing-based simulation, the rail cart moves along the alignments and records a 3D laser scan similarly to an original train. Due to the ray tracing, the simulation diversifies the synthetic dataset by incorporating density variations, shadowing, and noise. The speed and settings of the platform are randomly changed within sensible boundaries derived from the project requirements. Each surface hit by the virtual laser scanners generates a point with properties. The property represents the previously defined unique entity id attached to the surface. The semantic link extends each point with the base object type defined by the CAD model. Since the virtual survey accurately models the data acquisition, the real-world parity is almost entirely defined by the quality of the 3D model.
The assignment process (class assignment) converts this entity-based point cloud into actual training data. As additional point cloud features, further information is extracted. In our concept, we differentiate between two types of additional properties, ones that can be directly extracted from the point cloud and ones that are bound to supplementary information. The directly extractable set consists of classic features such as normals, curvature, density, patch size, or the actual height. Since height is defined globally, a local definition is needed to improve the abstraction quality. One possible definition for height could be the DTM height defined by Elberink et al. [9]. In the group of supplementary features, the properties relate to specific objects or concepts. In railway detection, the relation of the objects to the alignment might be the most important as the rail is built around this concept. Some alignment-related features are the recording distance, sagittal distance, scan angle, and horizontal distance. Lastly, the objectification is applied to the point cloud, resulting in a set of project-specific, synthetic points that can directly be used for priming.
3.3. Split Training
The final piece of our approach is an intelligent update scheme. In succession, we first train the model with the synthetic training data generated by the Virtualizer and then finetune the model with actual data. Finetuning is a form of transfer learning using previously learned abstractions to increase generalisation and performance in new environments. For both training stages, priming and finetuning, we progressively unlock the gradients. This idea was tested and reported by Chronopoulou et al. [25] for language transformer networks. In the case of our railway model, the gradients for each functional block are gradually unlocked after the newly configured layer has reached convergence. Because of , the first gradients to be enabled are the fully connected layers. Secondly, the encoder and the decoder are unlocked. The expectation is that adjusting the decoder and encoder will help reduce the error. Based on the quality and planned training effort, the decoder and encoder unlocking can be unnecessary and might even be harmful in the priming stage. This effect depends on the datasets and the initial neural network model provided.
4. Overview
There are mainly two complications when using neural networks for detection in rail infrastructure projects. The first complication () occurs when the premise of the construction project changes. The requirements of each project differ slightly from another. As a result, the recognition task needs to be redefined with the new requirements in mind. These changes invalidate the previously validated ML models. The second complication () materialises when the model’s performance cannot be guaranteed because of certain external factors. Such factors could be unusual recording conditions or unknown surroundings.
For , the need to adapt the outputs of the neural network arises. Such complications could happen if a new project also needs to include a new object type, which might not be present in the old ML model. This description resembles the notion of a class mismatch in homogenous TL. Consecutively, the architecture of the model needs to be adapted and the layers updated. As the latent space of most well-trained networks will rarely be affected, simple requirement changes will only trigger a reconfiguration of the output.
The second complication, , is present when the recorded environment does not have sufficient similarity to previous surveys. In this case, the abstraction capabilities of the existing ML model are not sufficient to compensate. Such missing abstraction capabilities can be noticed when evaluating the model on a small part of the new survey. If the score regresses for individual object types, the asset might be of a different shape or presented in a different context. If the performance regresses equally over all classes, one can assume different recording conditions. Addressing is more complicated as multiple possible error sources exist: uniform original training data, inherent feature differences or domain mismatches.
Two possible solutions to counter both complication types are evident: (1) retrain the whole model with a more diverse dataset, including parts from the new survey; or (2) use transfer learning to adapt the current model to the new project. While transfer learning might promise good results with lower effort, it also bears the risk of less flexibility. Nevertheless, with a limited, repetitive survey environment, the trade-off accuracy might be more important than generalisation. Whether it be retraining or transfer learning, essential layers of the current ML model must be fitted. In conclusion, parts of the new project’s survey need to be annotated, which results in considerable effort and cost. The subsequent inherent training of the Ml model adds additional time and complexity.
5. Datasets
Both the real-world and the synthetic survey are based on a train-mounted Riegl Rail-VMX platform [32]. The rRail-VMX platform is a triple laser-scanner setup with a yaw angle of and a flat pitch of approximately . The system is capable of recording high-density point clouds with over 1.5 million points per metre track. The used point properties for this setup are and .
5.1. Synthetic Datasets
For the priming, we created 11 CAD models representing 3 scenarios: free track, train stops and stations. All models were designed as parametric descriptions in ProVI 6.3 and exported as IFC 4.1. The length of each of these models was restricted to 1 km, and overall 58 object types were used. Aside from pure manual modelling, we used an unofficial automatic track generator for the initial generation of diverse tracks. The generator randomly generates the horizontal and vertical alignment based on speed profiles but can only generate 11 basic object types.
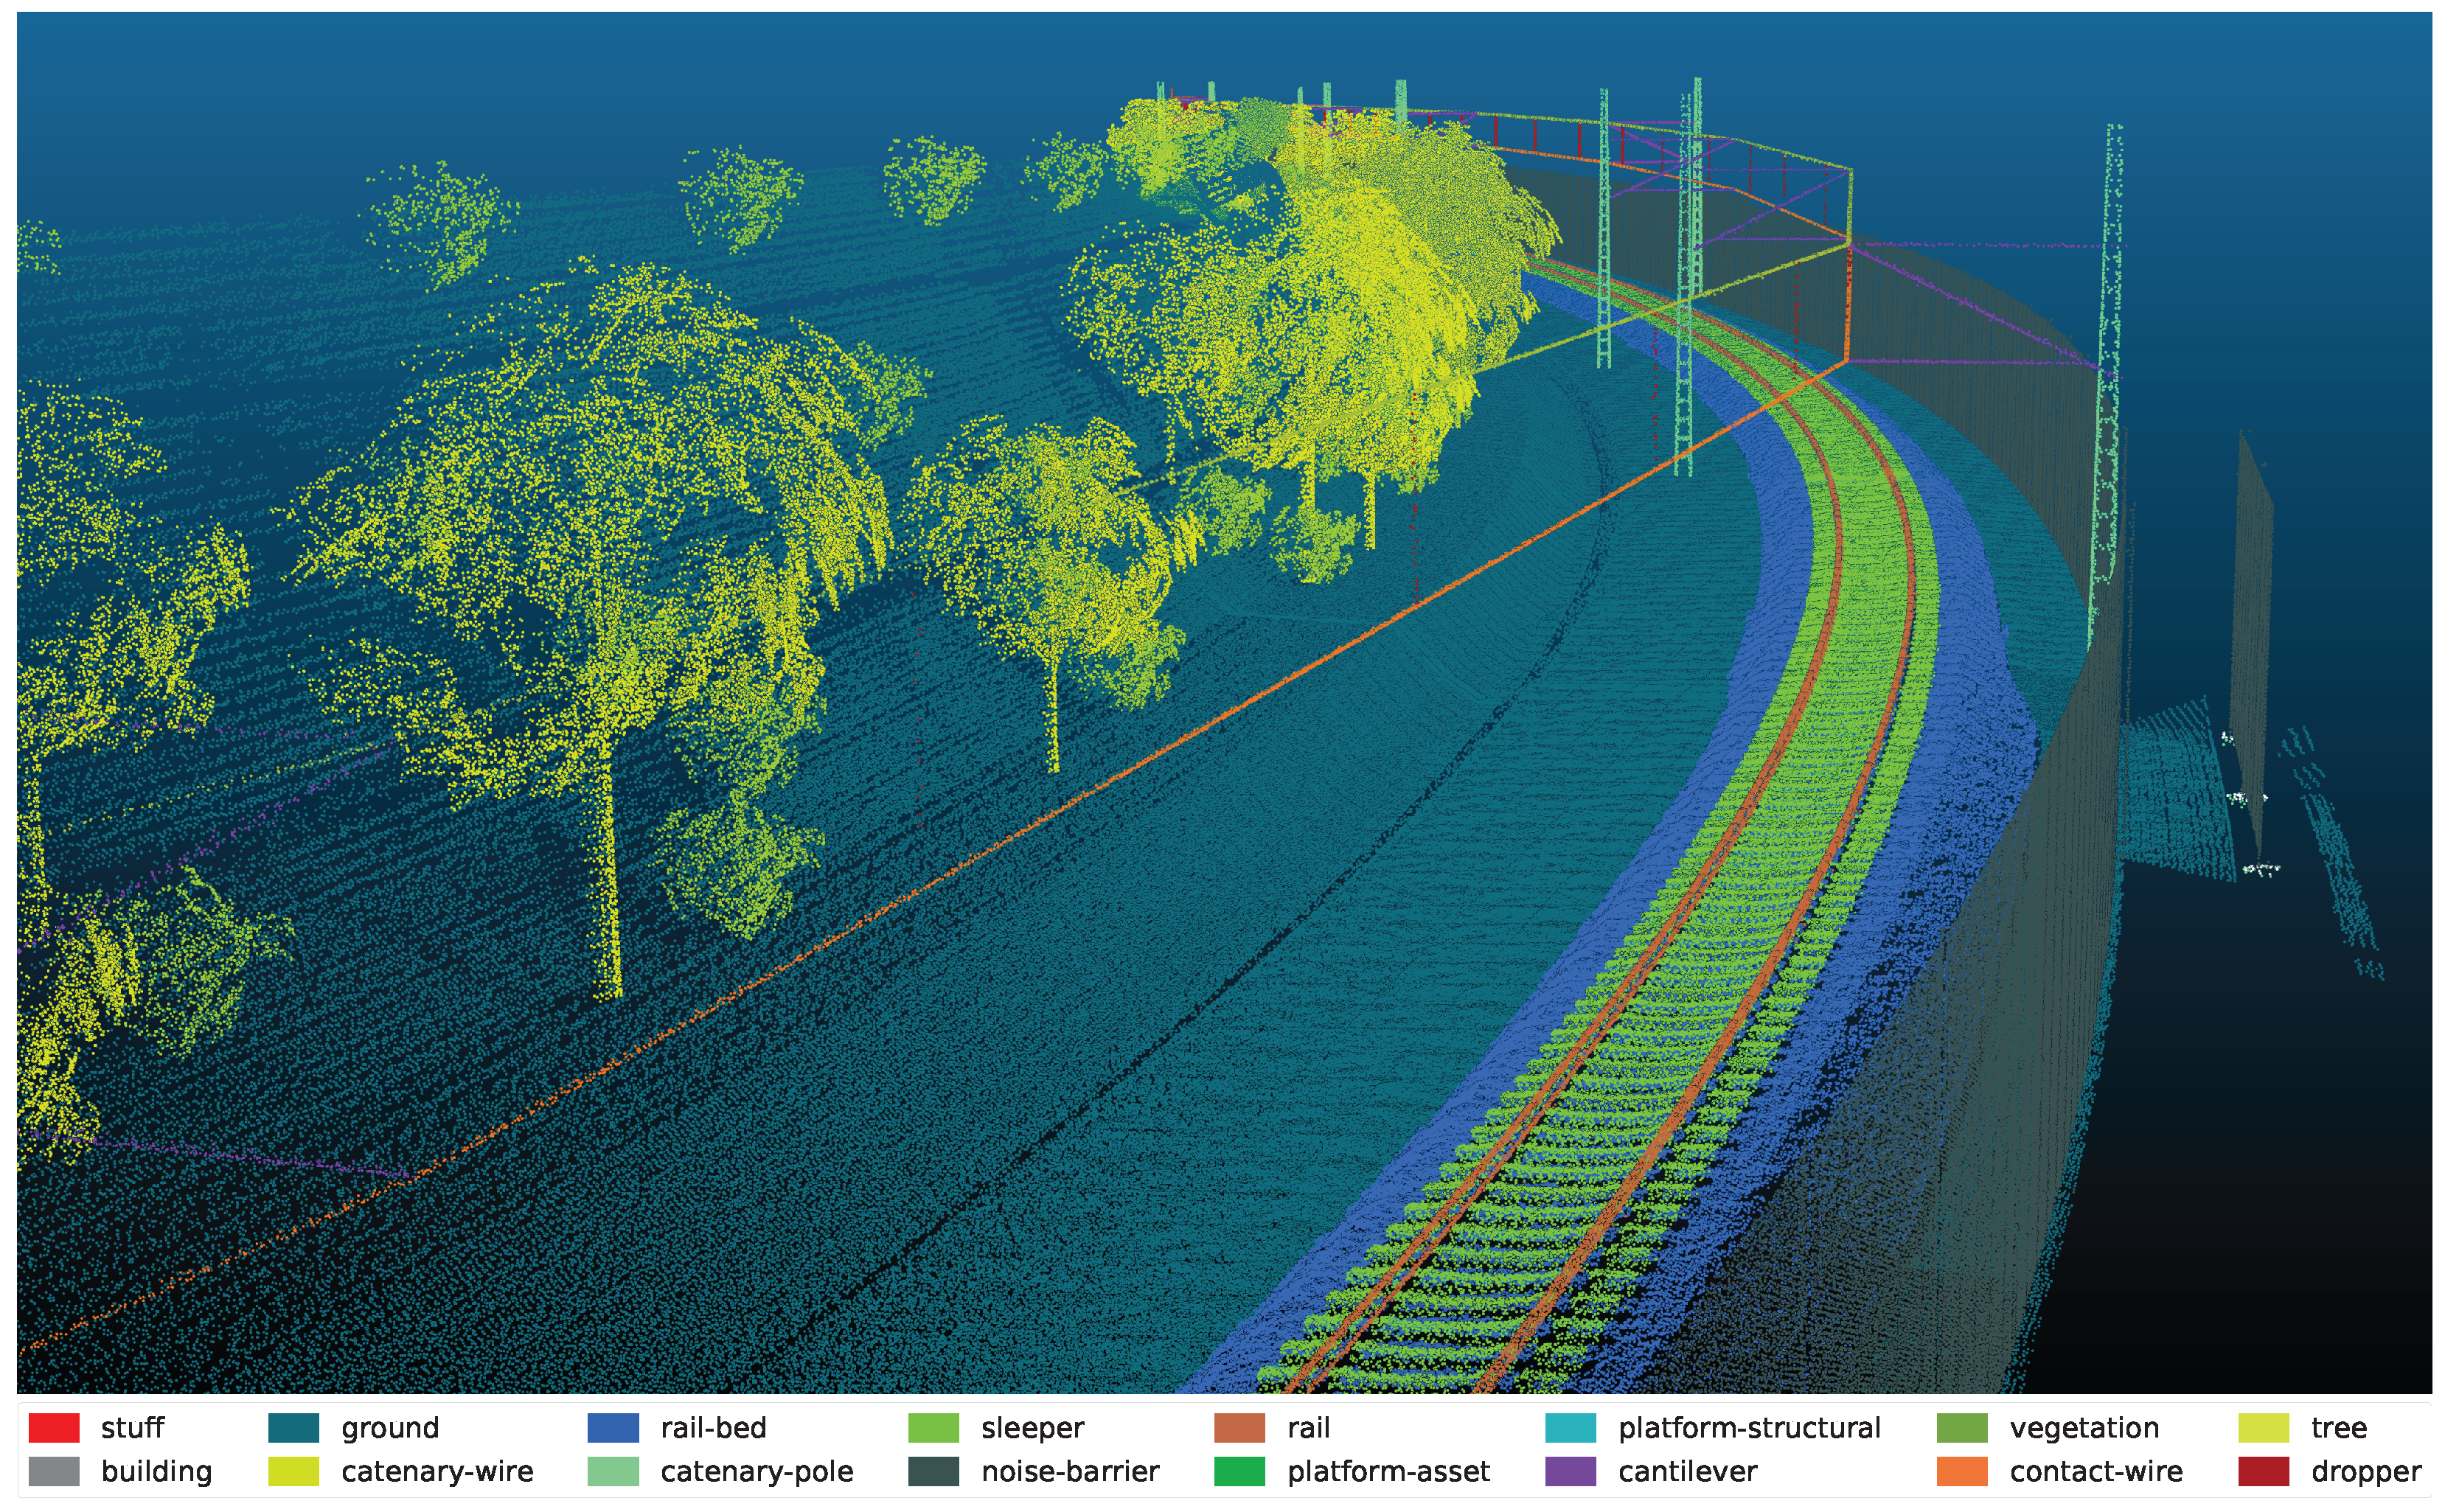
We reworked the initial 11 models to reflect a broader range of classes: 5 are free tracks, 5 are train stops including platforms and assets, and 1 is a complete station. The station was modelled after an actual station using satellite imagery. All models are publicly available and can be downloaded from Eickeler [33]. In all cases, the 3D models do not include all asset types () but do include inherently different asset designs, level of detail and lack of the surrounding environment compared to the physical dataset (). After applying our implementation of the Virtualizer, the resulting dataset has 75,104 instances represented in over 300 million points. A sample of these data is shown in Figure 3.
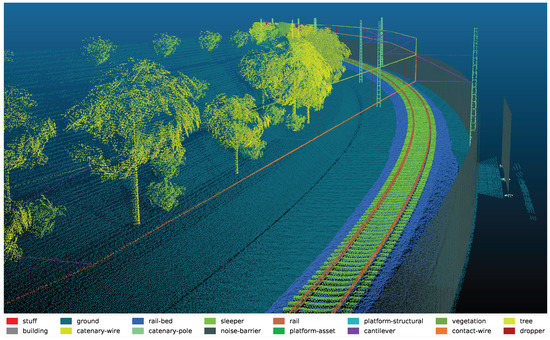
Figure 3.
Example of the synthetic data generated from a 3D CAD Model. The simulation includes typical systematic and random noise and adheres to the chosen objectification.
Since the height of the points is defined by z, but the actual height is relative to the landscape, an additional height property, called above_ground, was provided as an additional feature. The creation followed the original approach of Elberink et al. [9] and is a median-based version of the DTM Height. For the priming update, an 80% training–20% validation split was used.
5.2. Physical Datasets
In addition to this synthetic source, we curated a small dataset from a real-world project. The real-world dataset was recorded preliminarily to a construction project of the Deutsche Bahn and was manually annotated using CloudCompare into 53 classes [34]. Only the west rail was used for this dataset with 86 million points. The track length is km, and the dataset contains only one rail with one medium-sized train stop. The annotation time was initially 52 h plus 6–9 h for correction, changes and post-processing. We applied the same algorithm to determine the DTM Height. For the finetuning, a 60% training–40% test split was formed by cutting the whole track into 50 m partitions and recombining them.
Due to the scanning hardware used and the task given, no special care was needed to remove typical artefacts caused by moving objects. One reason is the low tolerance of the admission of the surveying method. Due to the accuracy requirements, a separate recording for each track needed to be conducted. This removes all artefacts caused by trains running on the other tracks. The other reason is the high recording speed of the setup. With a travelling speed of 16–20 m/s, most objects move too slow to cause significant distortion. All areas for motorised vehicles are usually outside of the scope of railway recognition (bridge pavement). A visual example is shown on the left side of Figure 8, where two moving people, one with a large backpack, are recorded.
In our physical dataset, some of the classes describe singular objects. In the excerpt of the survey used, the system building only has three entities, the station building, a detached house and a roof behind a noise barrier. Since the splits will not be affected by the objectification, some of the splits will not include any buildings. For this reason, the first 20 piece contained only a slice of a building, roughly 39 droppers, basically no ground and close to no platform–assets. A list of objects which are contained in the partitions can be seen in Table A1.
5.3. Objectification
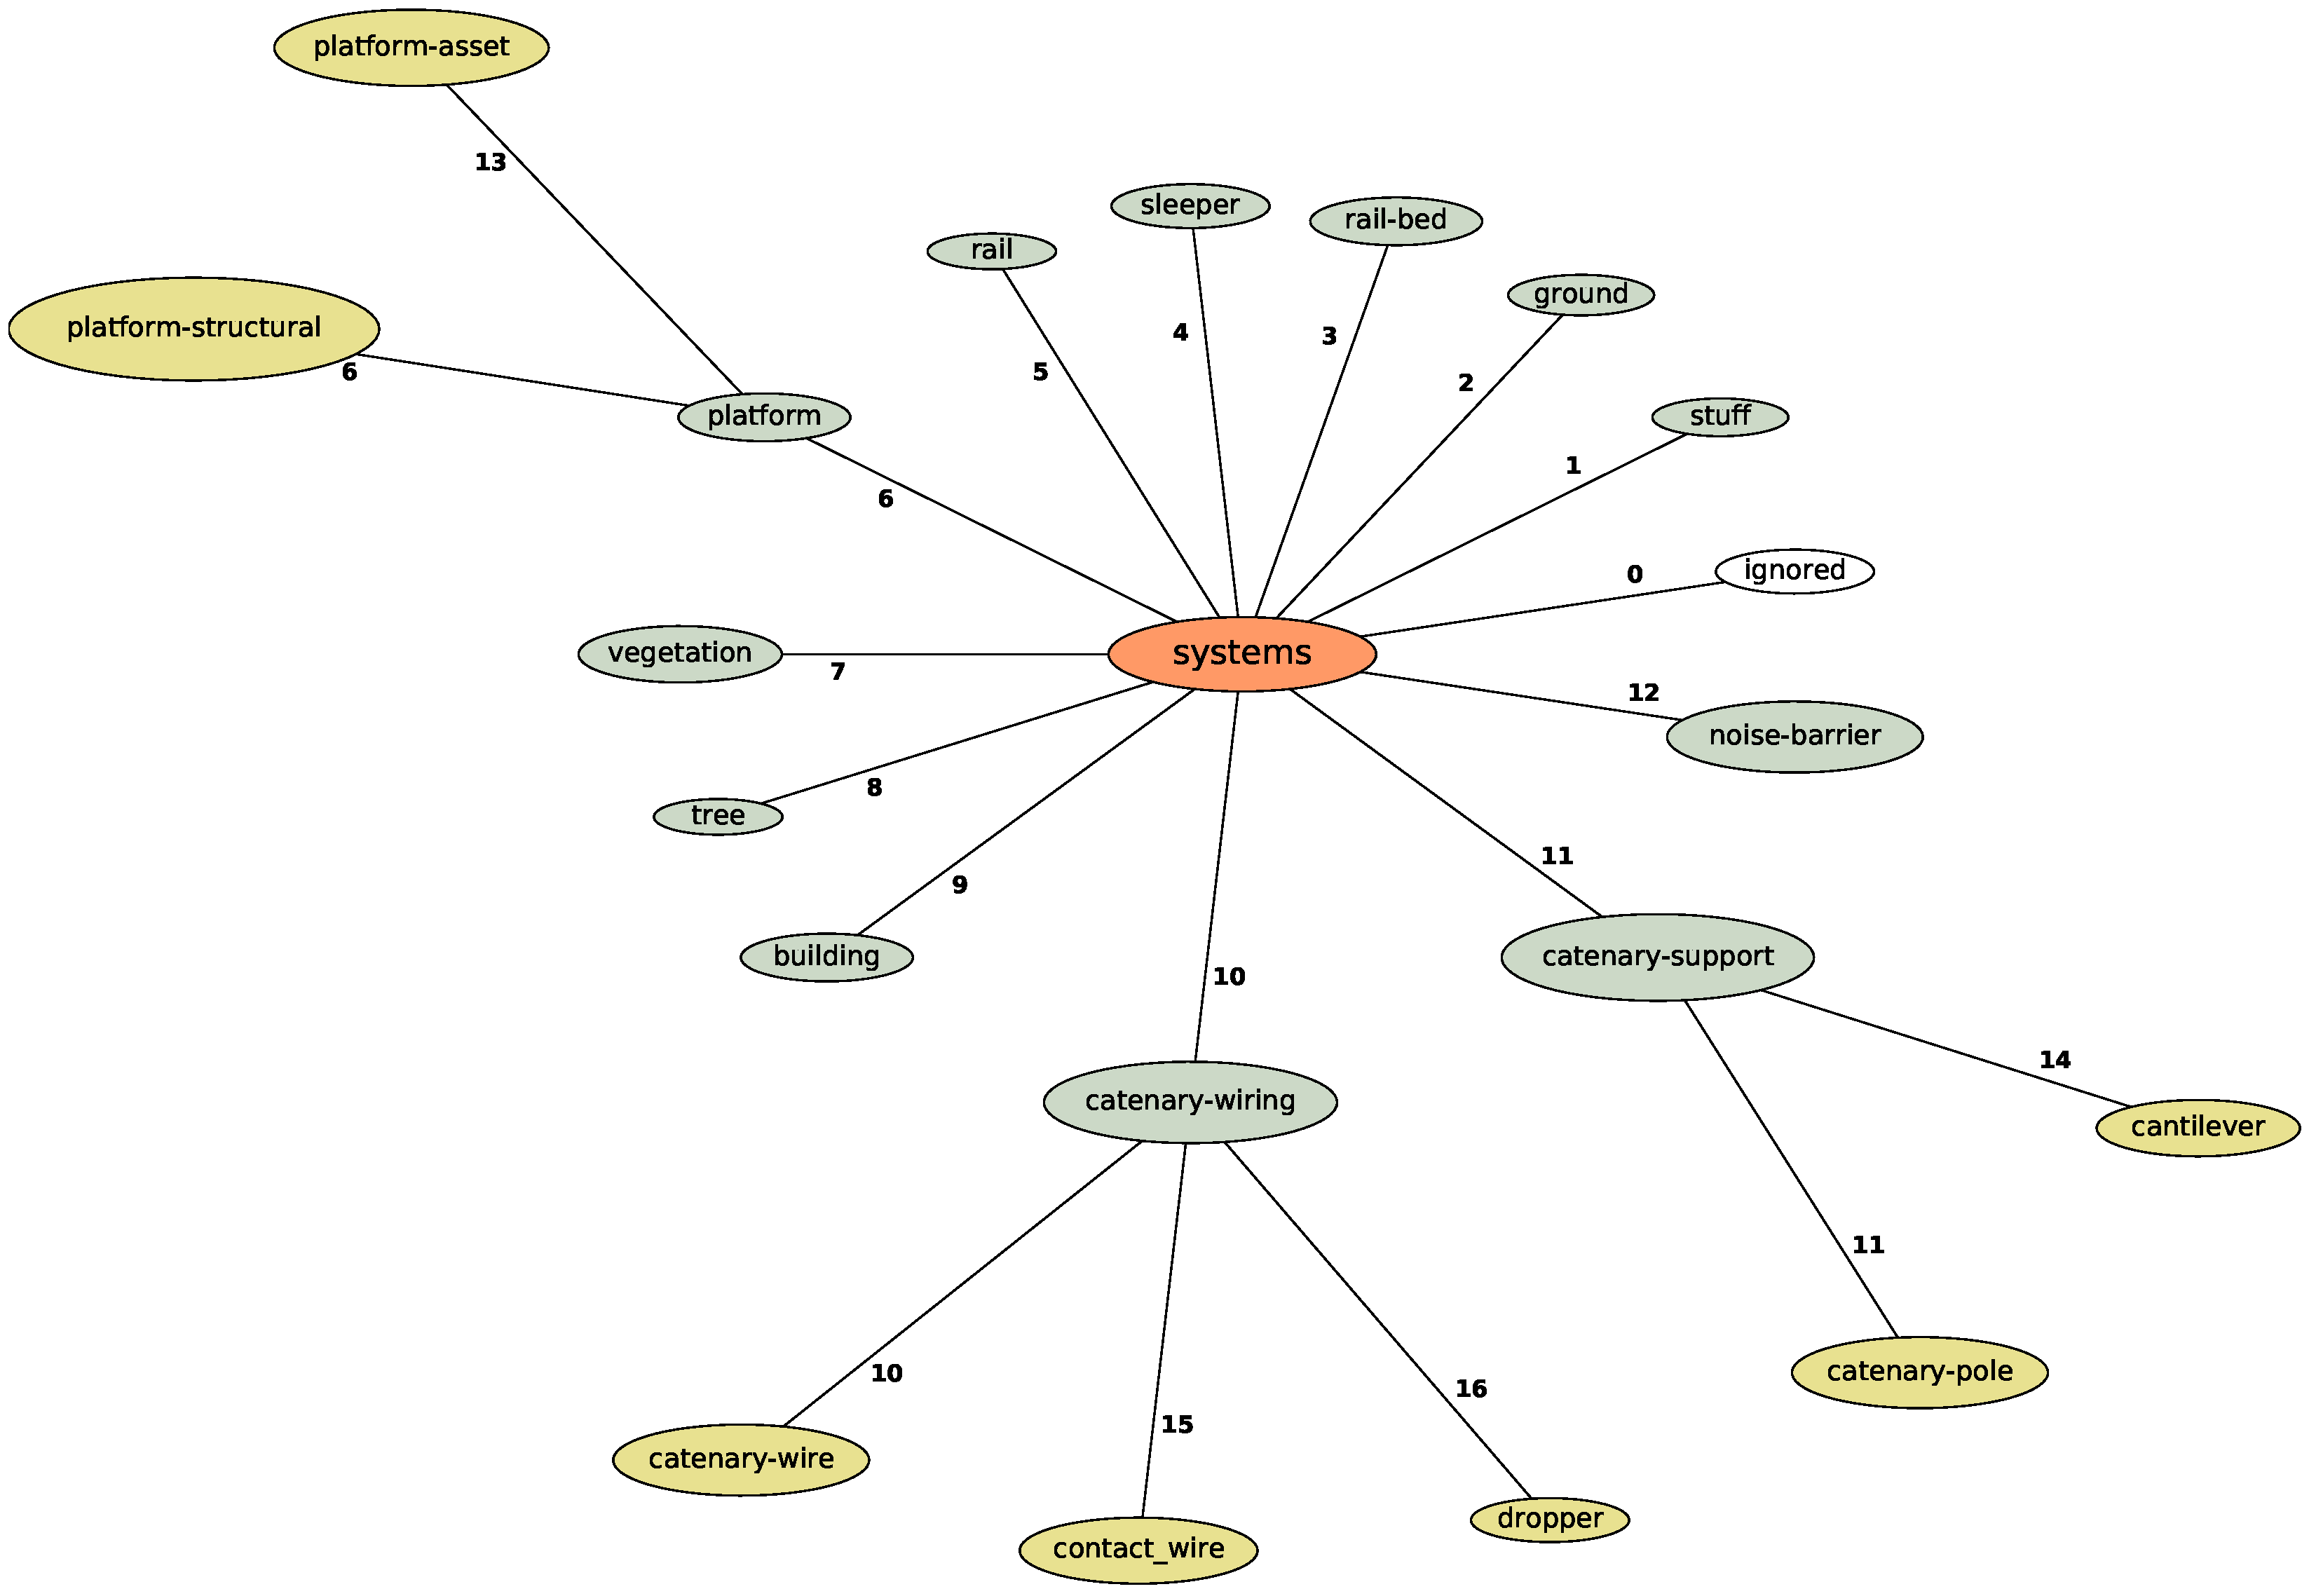
To showcase the capabilities of our priming approach in the context of , two different experimental requirements were used to generate two class hierarchies. The first hierarchy uses 12 systems, while the second one has a total of 16 systems (shown in Figure 4). The original lexicon containing 58 object types for the synthetic and 53 for the real dataset was condensed into their respective parent systems. Things that did not fit in any category are assigned to stuff. Only a few points were ignored, as three objects placed in the CAD model were not correctly exported by ProVI.
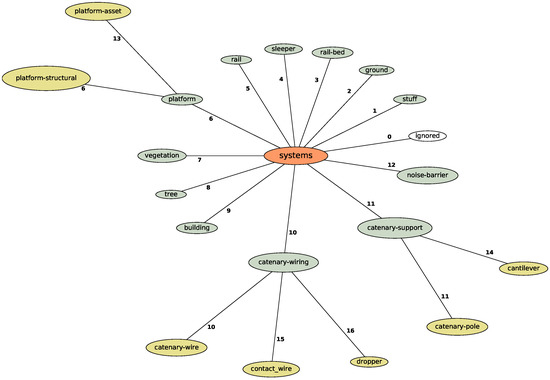
Figure 4.
Overview of the experiment-specific objectification. The 12-system hierarchy is represented in green; the breakdown of the extended 16 systems is represented in yellow.
The four additional categories introduced in the 16-system hierarchy mostly refine the catenary. This breaks the catenary–wiring down into catenary–wire, contact–wire and dropper and catenary–support into catenary–pole and cantileve. Additionally, in the 16-systems variant the system platform is separated into platform–structural objects such as stairs, cornerstones or a deck and platform–assets such as speakers, seats and rubbish bins. We reused the unchanged class numbering to make the data as comparable as possible.
6. Experiments
We designed two experiments to show the viability of our concept. The first experiment is a baseline performance analysis to reflect the quality of the priming and digitalisation. The second experiment consists of a complete model update. Here, annotated data are added sequentially. This highlights the viability of our priming since the network deliberately presents insufficient data. In all experiments, a state-of-the-art neural network (KPConv) is trained to study the influence on the training process, structure, and detection quality.
6.1. KPConv Setup
We used KPConv as a state-of-the-art neural network for cloud segmentation. The architecture is by design similar to ResNet, and all hyperparameters were adapted for use in railways and selected on prior experiments and experience: the smallest entities to be captured are overhead wires, with a diameter of 3–5 cm. Since the overhead lines are separated from most other classes, the primary downsampling can be set to a larger grid size than half this distance. We noticed that with our chosen class hierarchy, the better contouring of a higher resolution would only slightly increase the accuracy. These findings were also reported by Soilán et al. [26]. As a result, the grid size of was chosen as a balance between computational effort and reward.
We experienced several minor errors with the default convolution radius of 3 m as some of the elements span larger contexts. Based on the mast size of 7–9 m, the radius of considered points was set to . This is a trade-off between object generalisation and specialisation. The overall performance is degraded by choosing such a vast influence radius, but prior experiments showed that a better separation of catenary-related objects could be achieved. Consecutively, the convolution radius was increased to cells and the influence of the kernel points was raised to . Based on the author’s recommendation in the KPConv community, we only used rigid convolutions [35].
The selected architecture is defined by four sets of ResNet blocks, which consist of three subblocks and 128 input dimensions. The explicit network architecture is shown in Figure A6 and is similar to the published architecture for S3DIS and NPM3D. These architectural decisions influence the number of free parameters compared to Soilán et al. [26]. Their architecture is visualised in Figure A7. Additionally, to the selected configuration, we reduced the validation time during training by quadrupling the number of steps per epoch. To maintain comparability with the previously published papers using KPConv, the epoch counter needs to be related 1:4. All specific training configurations used are present in Eickeler [36] in the results folder.
6.2. Baseline Benchmark
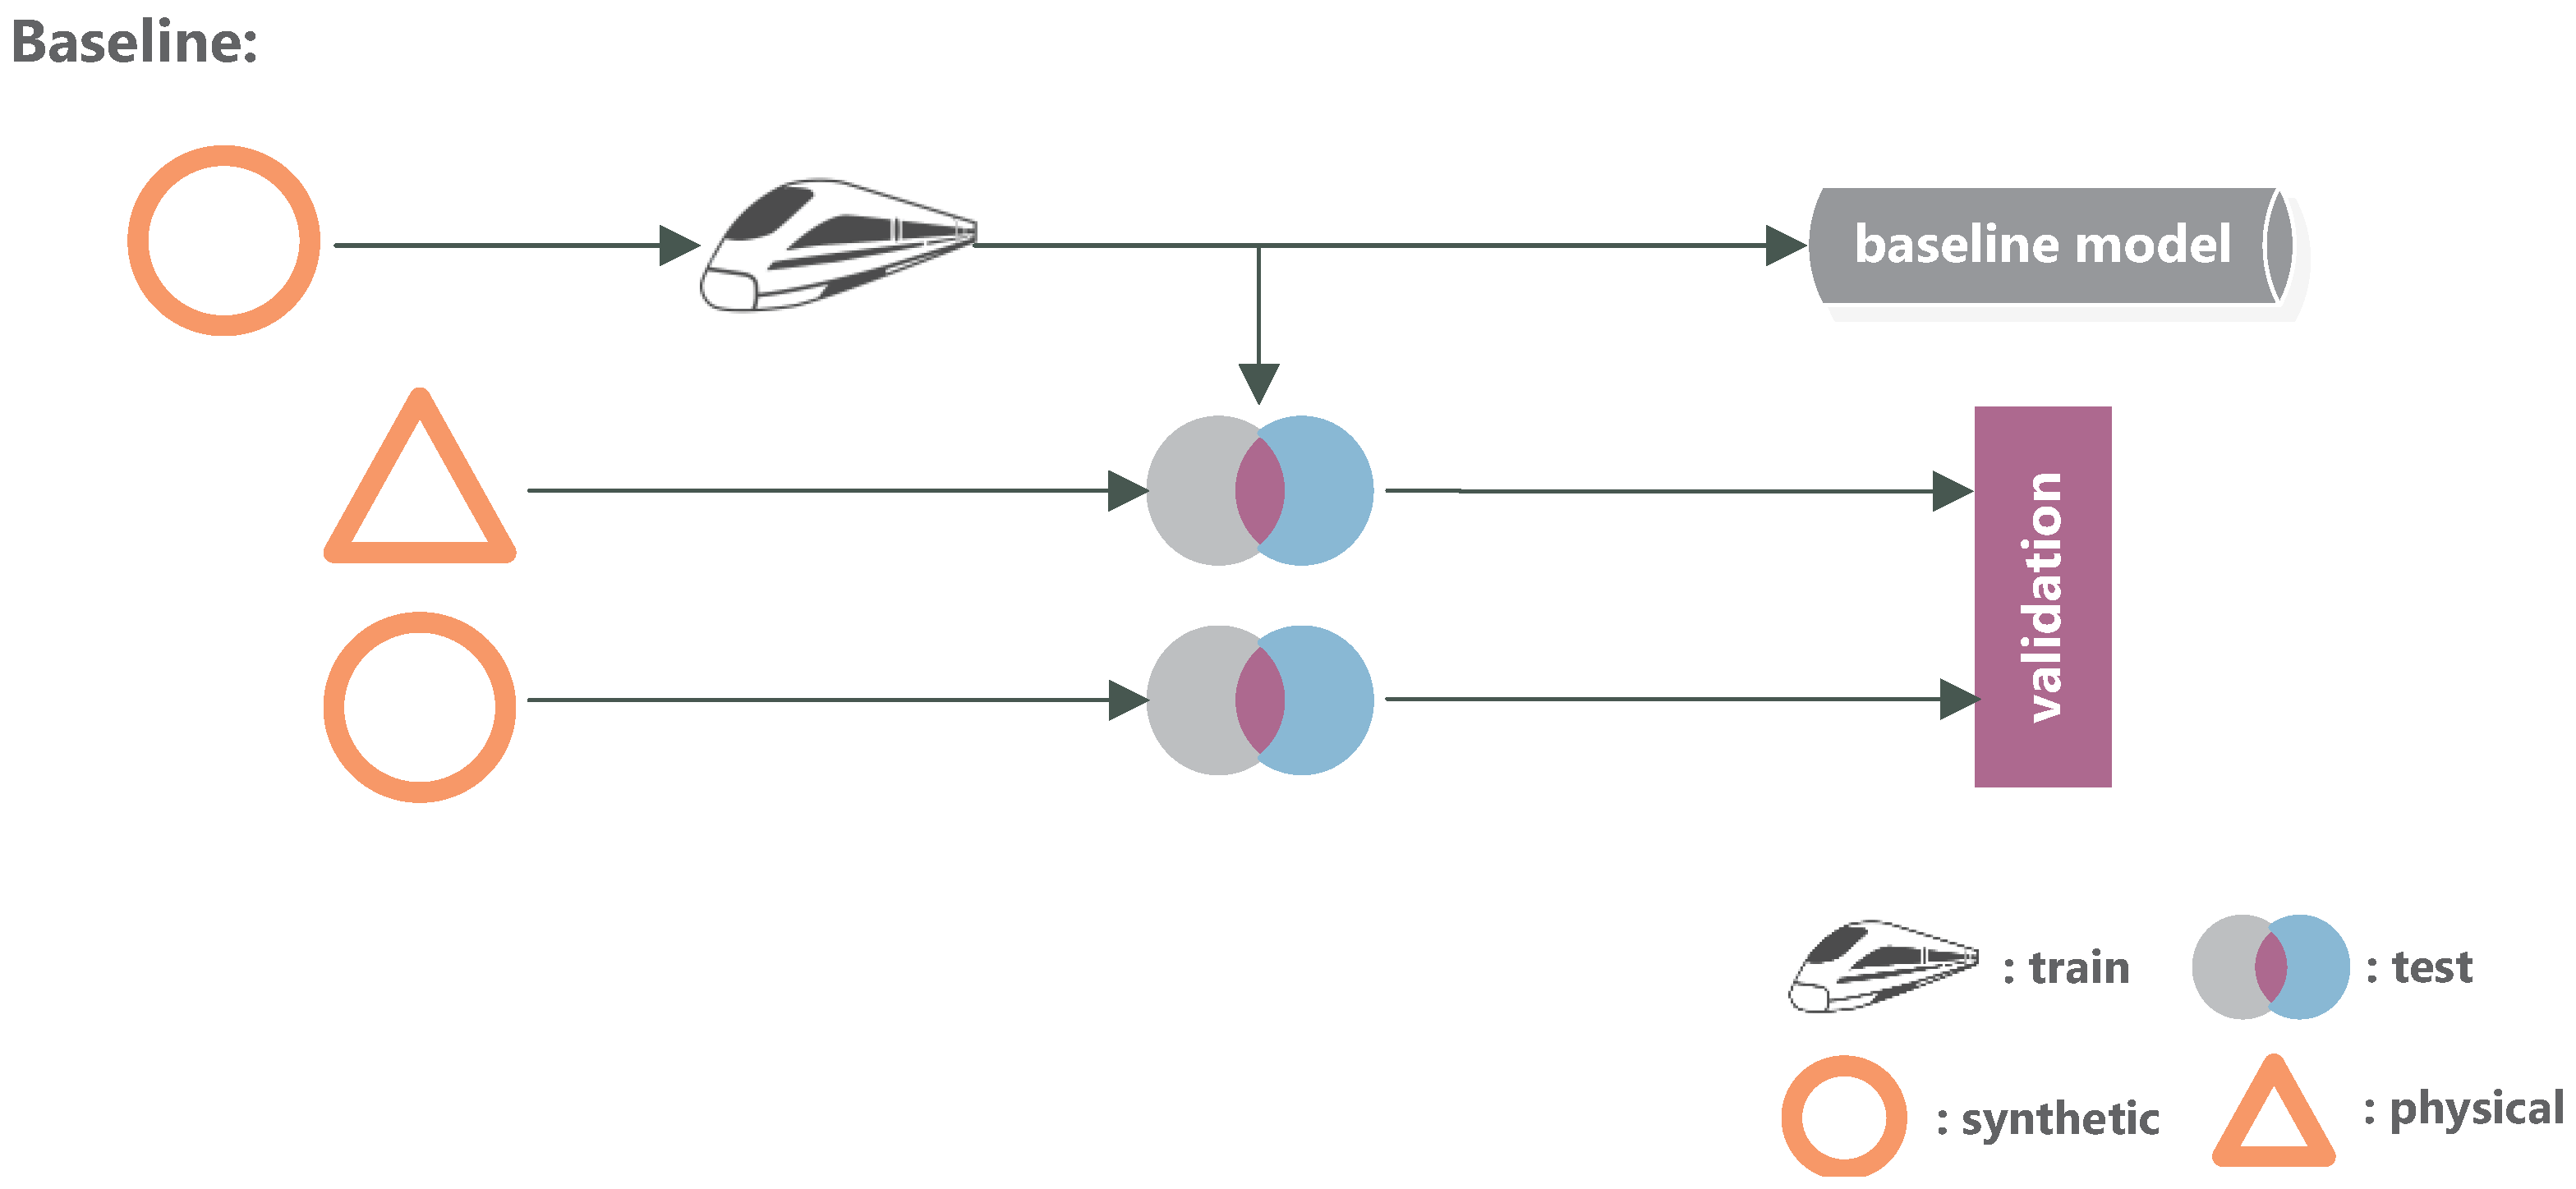
The first investigation is designed as a baseline, which sets the expectations. The model is exclusively trained on synthetic data, leading to a maximum discrepancy () between the ML model and the project setting. The physical data functions as the project, while the synthetic part functions as a previously primed model. In our dataflow (Figure 1), this validation would be a tapping point between the requirement update and the project update and shows the quality of model adaption priming in general. As shown in Figure 5, we validate the model using holdout data from the synthetic part and the real dataset.
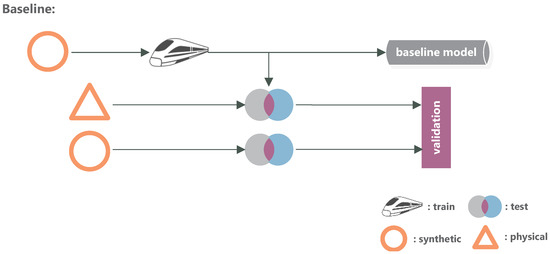
Figure 5.
Baseline benchmark. The networks are trained on synthetic data and validated on both a synthetic and physical test set. This experiment shows the base function and the quality of training with synthetic data.
While the mean intersection over union () is still provided, it is not recommended to use as a benchmark for these recognition problems. This is due to the fact that the classes are very unbalanced, with a railbed having approximately 40% of the points and wires or catenary masts <1%. From an engineering perspective, these components might be even more critical than the railbed. When possible, the and the () are used in this paper.
We see that the model adapts well to the priming dataset, with a greater than 96% for the 12-system model and 90% for the 16-system model. The difference between the 12-system model and the 16-system model is governed by the breakdown of the catenary systems (see Figure 4; class ).
Comparing the class confusion for each system, the most class confusion occurs in the volume between the intersection of the contact–wire and dropper, and the volume of the upper intersection between the dropper and catenary–wire. It seems that the exact border between the classes cannot be accurately determined. In addition to this minor issue, both models achieve extremely low losses in the synthetic holdout data, with a slightly lower loss for the 16-system model.
In the training process, the and the remain around zero until a late epoch, when the neural network starts differentiating low-represented classes. The timing for this differentiation seems dependent on the learning rate and the previously archived adaption. In our case, we saw a gradual improvement in the low-performing systems after roughly 50 epochs (current learning rate ). In all cases, a 98% accuracy was reached at the 140th epoch, after which only minor improvements can be noticed.
Baseline Results on Real-World Data
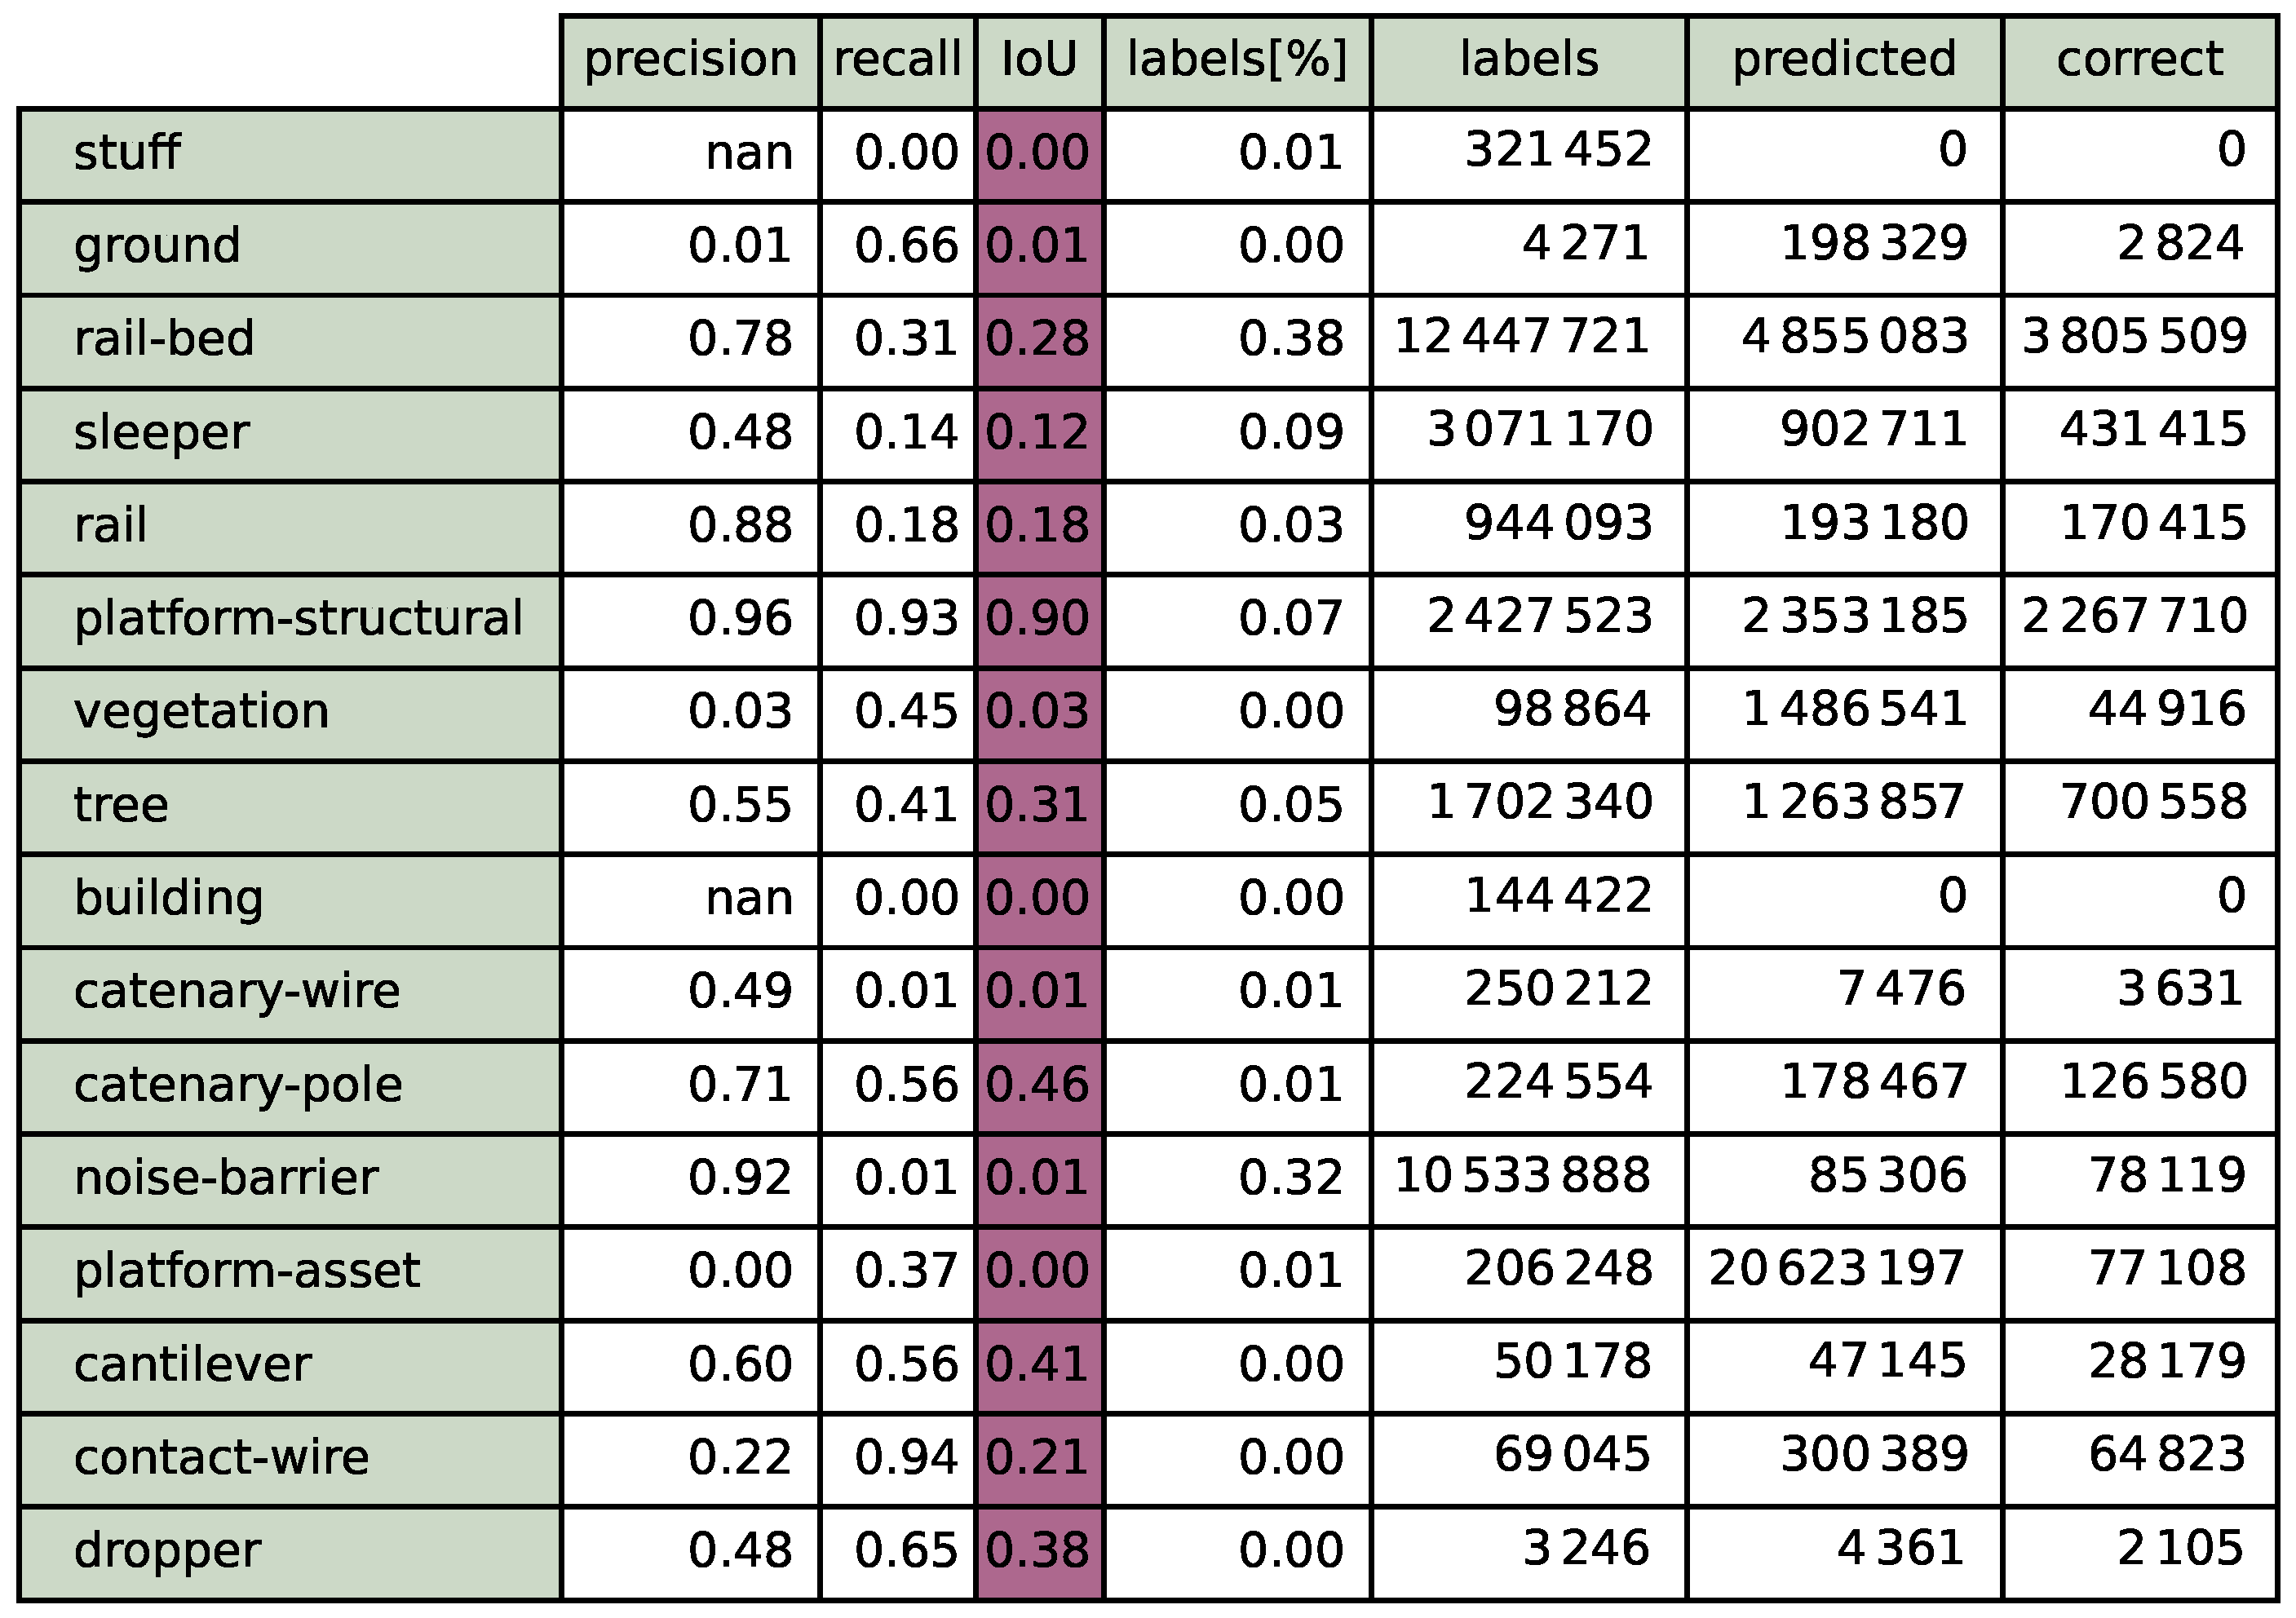
After the training and validation on synthetic data, the models were applied to our real-world dataset. As we configured the 16-system model matching the physical holdout data, the results reflect the worst possible adaptation. The measured results can be interpreted in two different aspects. The first aspect is the quality of our priming implementation. The second aspect is the specificity of the descriptors learned in the priming phase.
The results of the 16-system testing are shown in Figure 6. Similarly to the 12-system testing, the best values can be observed in the grouped systems: platform, catenary–support and catenary–wiring. Only looking at the class instead of the grouped (as shown in Figure 6), it can be observed that the subsystem platform–structural outperforms the combined system (see Figure 7). The opposite is true for vegetation and trees. A new grouped system named flora, combining trees and vegetation, would perform exceptionally well (grouped accuracy over 95%). While visually examining the real dataset, we see that most of the tree trunks are blocked by the noise barriers, which leaves an optically identical partial point cloud.
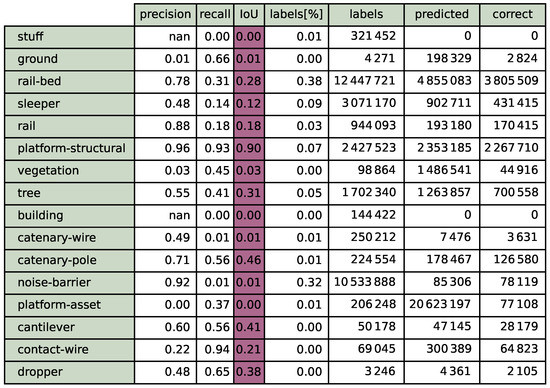
Figure 6.
Results for the baseline experiment. The 16-system nn-model was solely trained on synthetic excerpts. The summary shows the test results on the holdout data of the physical dataset.
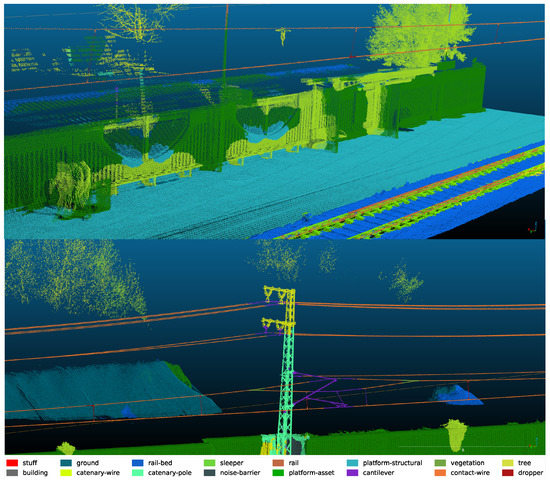
Figure 7.
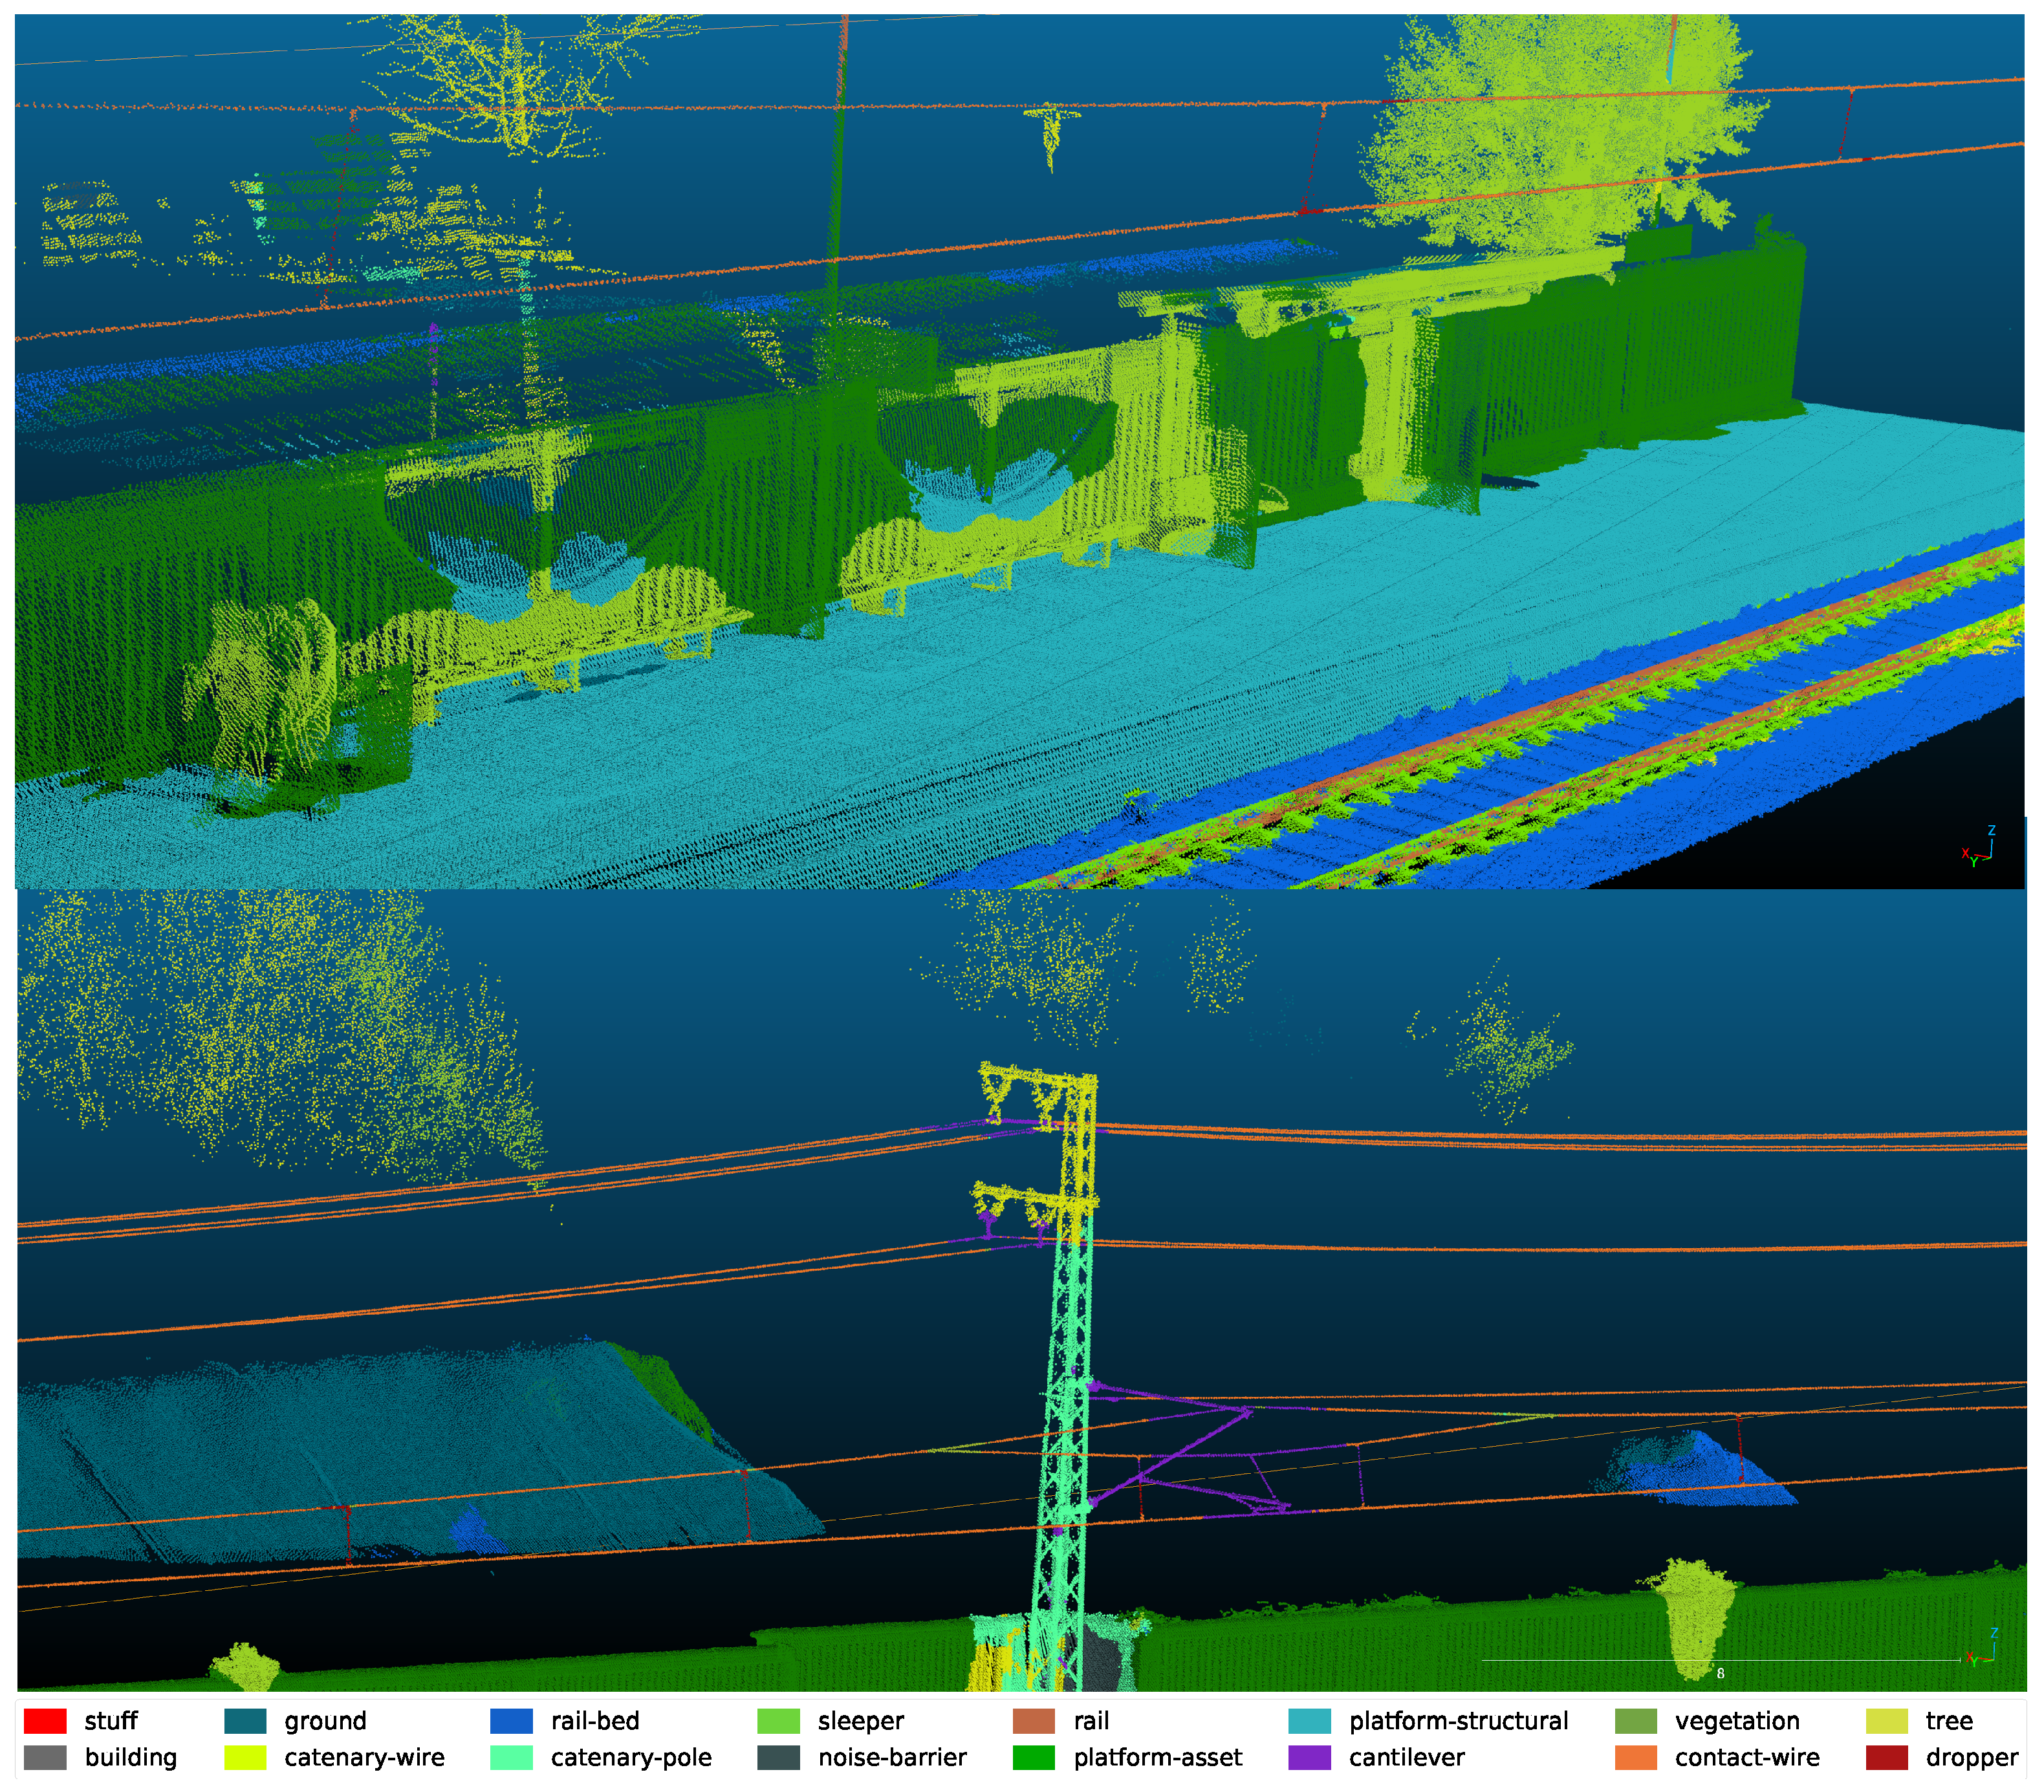
Detection quality after priming and before finetuning. Some classes such as platform–structural or contact–wires are well-detected. In contrast, rails and sound barriers are detected with very low confidence. A version after finetuning (second experiment) is shown in Figure A1.
A second look at the catenary–support wiring systems shows that the split between contact–wire and catenary–wire did not translate from the synthetic training into the real world. The systems catenary–masts and cantilever both perform relatively well and can be seen as equal. An example of the catenary–wiring and the catenary–support can be seen in Figure 7.
Real-World Discussion
The presented results indicate that the priming methodology works best if the systems can be related to specific geometrical classes. In these systems, priming will work if the 3D CAD model has sufficient detailing. Promising performance can be achieved if the objectification is close to the geometric base shape. Since minor adjustments happen late in the training process (such as the differentiation between catenary–wires and contact–wires) they did not translate to added benefits. Based on the measured point of differentiation, the authors believe that priming might lead to a leap in the initial training and earlier context differentiation. This would lead to a reduced training time or, in the context of sparse data, better overall performance in low-data environments. Summarising this experiment, priming the model to the point of differentiation of the last layer seems to provide additional benefits for low and under-represented systems.
6.3. Priming Benchmark
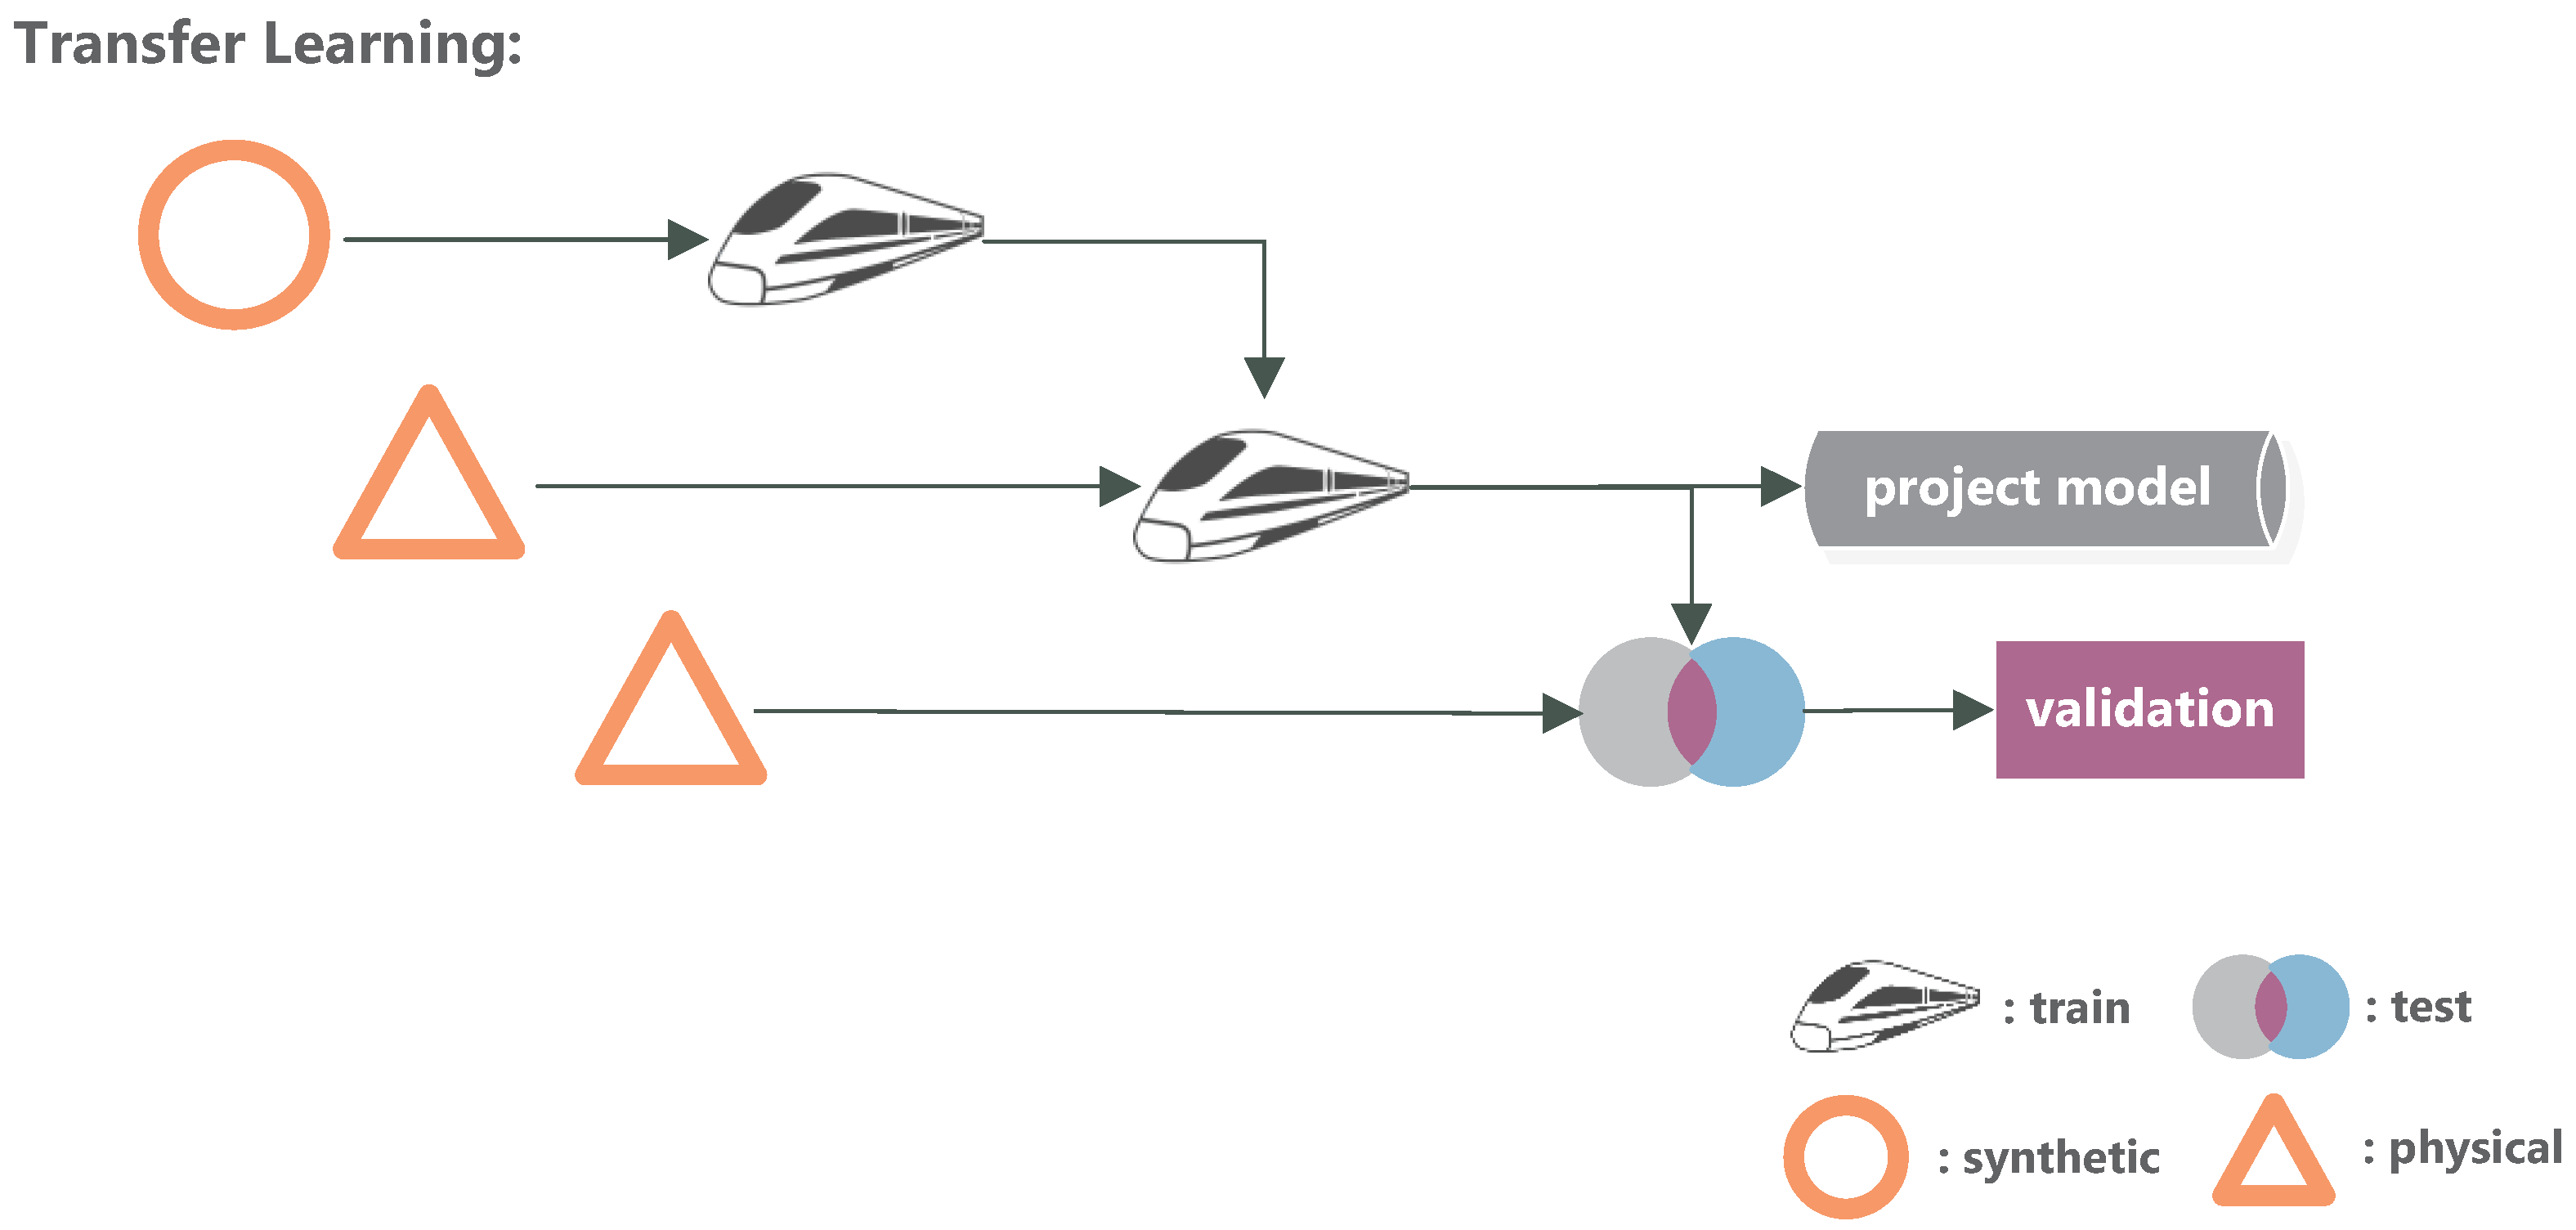
In our second investigation (see Figure 8), the adaption of the neural network is forced due to solely finetuning on real-world data. Instead of adding all the available training data at once, we use three configurations: 20%, 40% and 60%. For this, the original physical dataset is divided into 5 parts, 2 of which are used for testing, while the remaining 3 parts are additively added to each configuration (see Section 5.2). The previously trained 16-system model represents the primed model, which uses the same objectification, and the induced error can be observed independently.
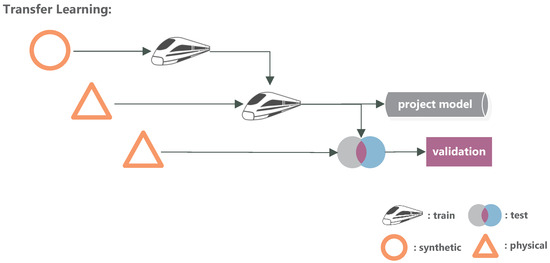
Figure 8.
Combined benchmark. A network is firstly primed with the synthetic data extracted from the 3D CAD files. Afterwards, the model is updated with parts from real-world surveys and validated on holdout data. For this benchmark, various amounts of real-world data are used for training.
The updating process follows the concept presented in Section 3.3. A non-zero gradient is introduced in the following order: 10 epochs for the softmax layer, 20 epochs for the mlp layer, 20 epochs for the decoder and the rest of the training on the whole network (including the encoder). The initial learning rate is reduced by 30% to .
Because KPConv will adjust the number of samples per evaluation based on the influence radius and the layer structure in a process called calibration, the batch size of the physical dataset needed to be reduced by 2 compared to the synthetic training. This is needed as the physical dataset has denser regions than the synthetic dataset. Since calibration is repeated for all three configurations, the number of points processed by the network within one epoch is roughly the same. This means that the 20% run will have roughly three times the turnover rate compared to the 60% run configuration.
Priming Results
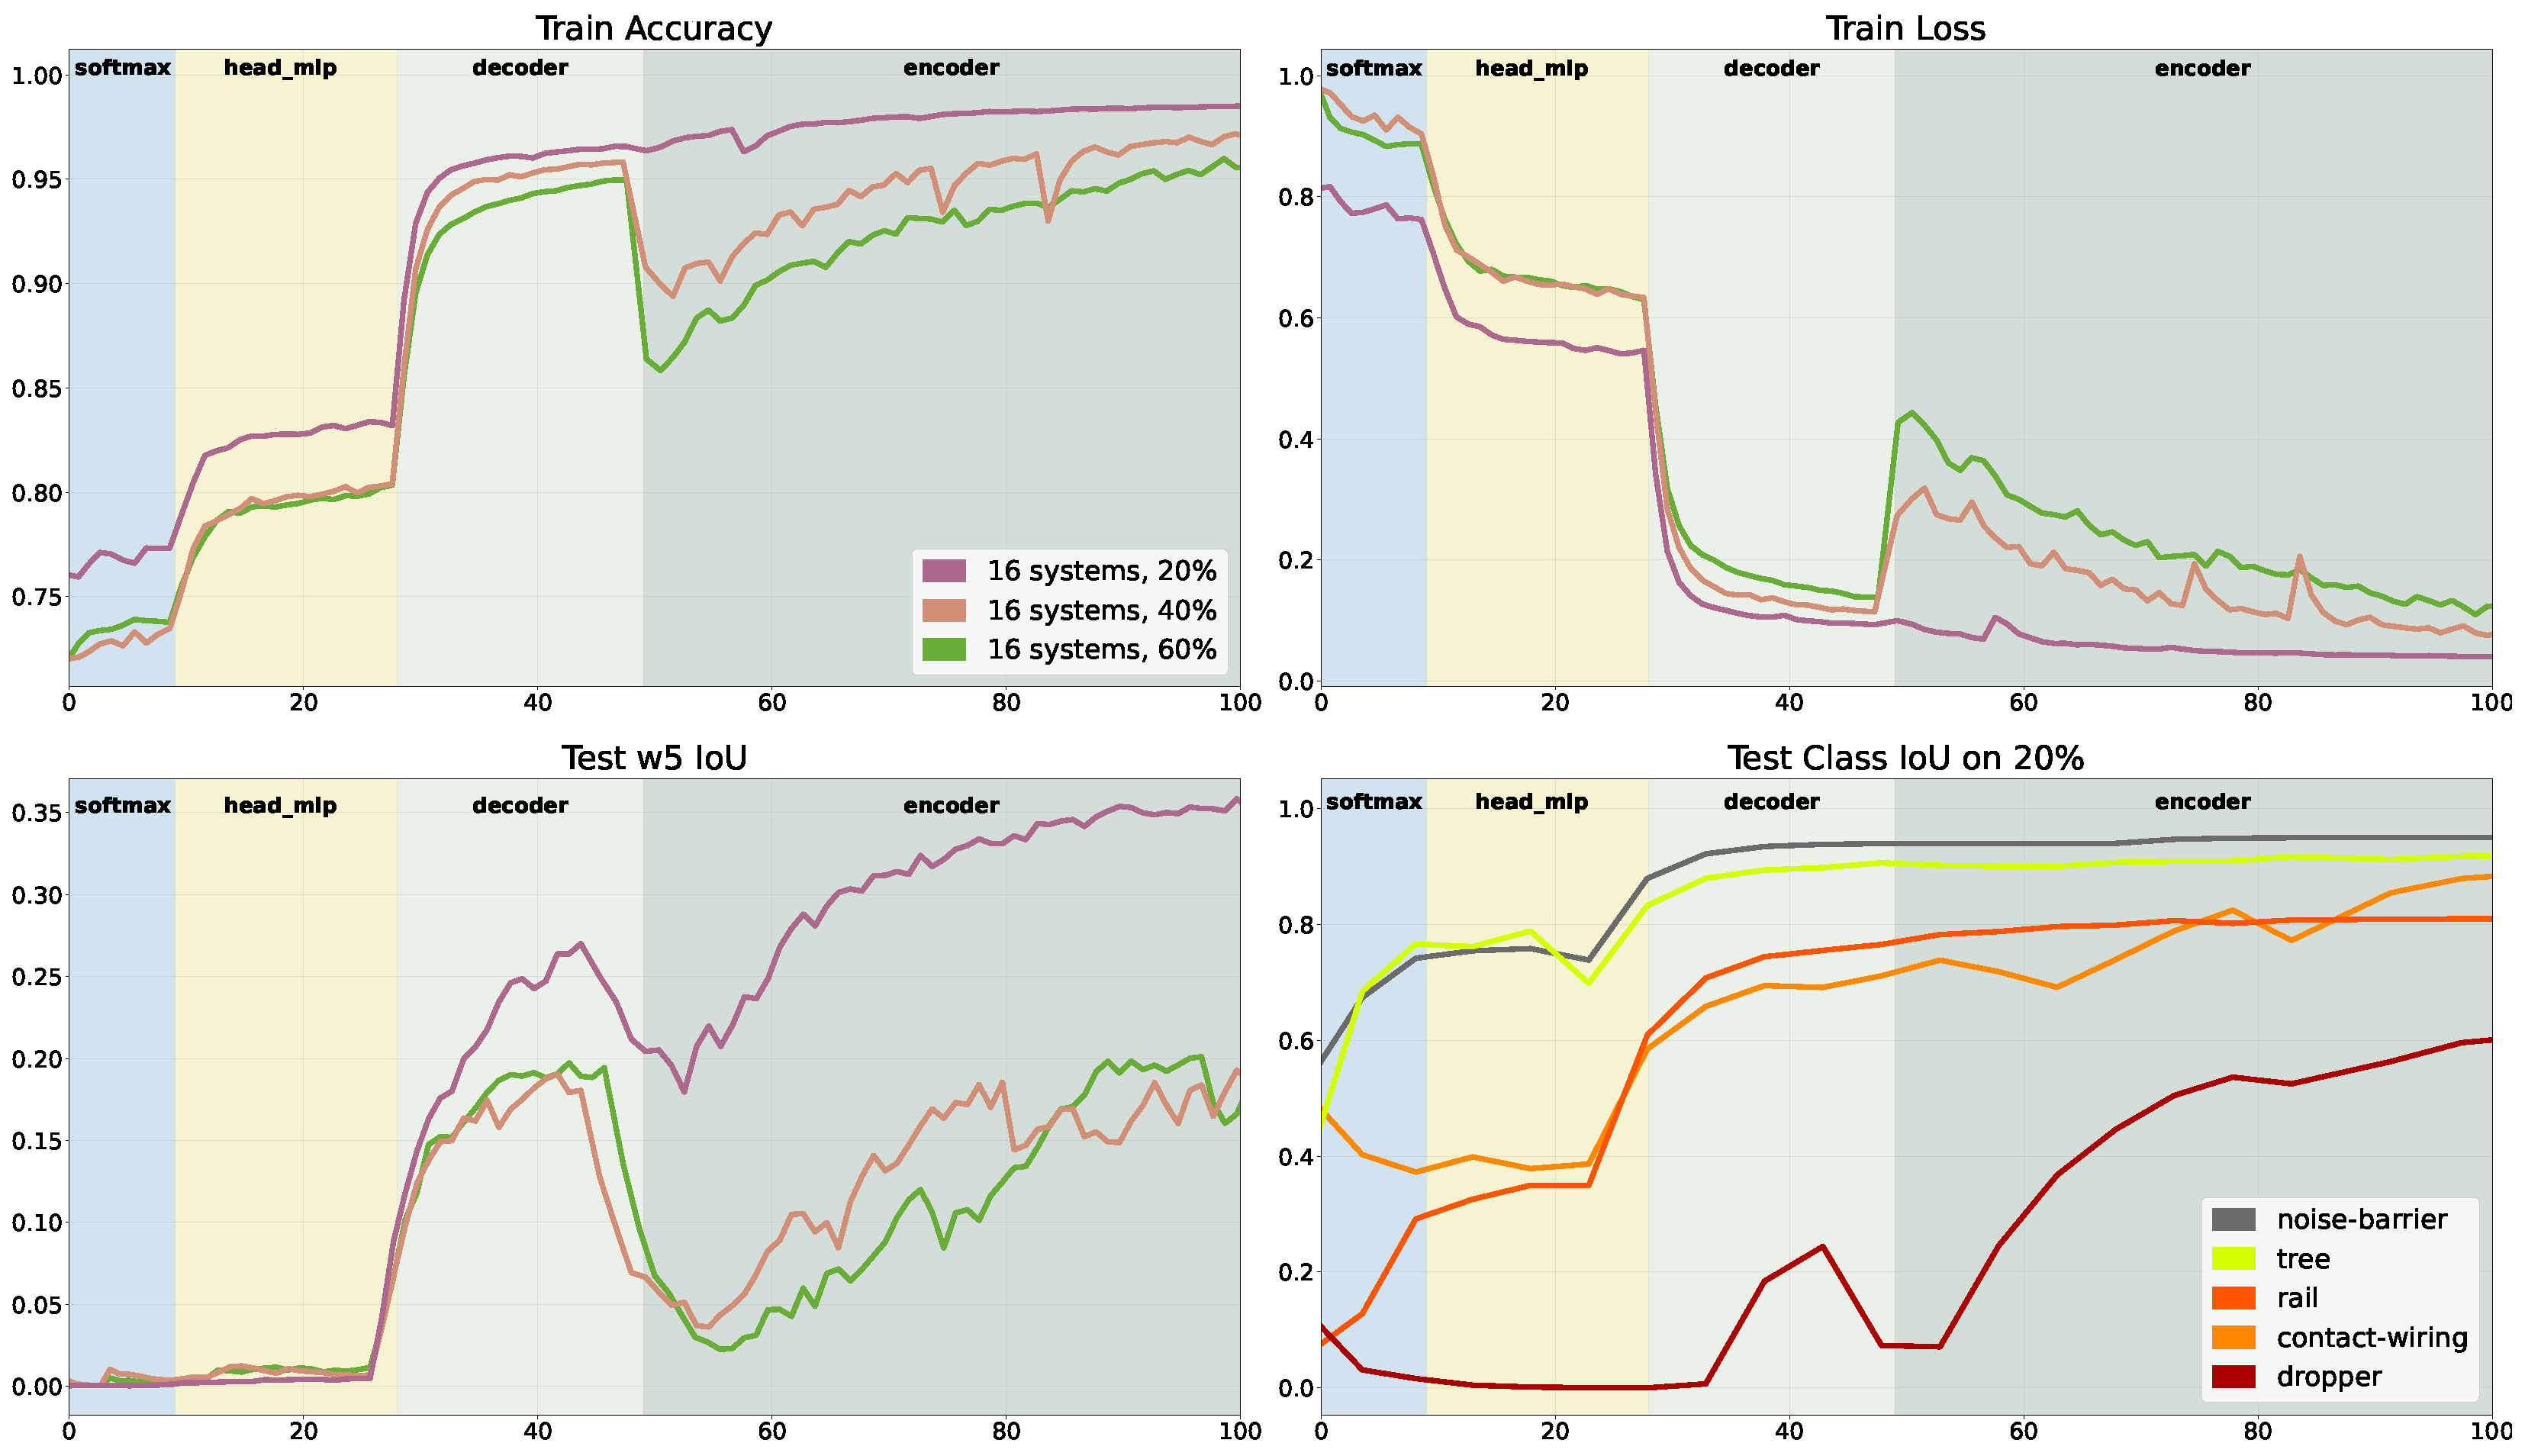
During training, we observed a very stable adaptation, in which the different update paradigms are visible (see Figure 9). When all gradients of the network are unlocked, some instabilities can be observed in the 20% run. Much stronger responses can be seen looking at the 40% run and the 60% run, which both degenerate to an unstable state. Aside from the stability, the transitions are the most remarkable observation. Every time the next block of gradients is unlocked, the adaption skyrockets in the first 1–3 epochs. This effect levels out over the course of the training. All three configurations perform similarly with a slight performance bonus for the 20%-run. It also seems as if the slope for the 20% run is shallower. The transitions are comparable until the entire network is unlocked. In this case, we see a slight regression for the 20% run and a steep drop of 8–9% for the 40%-run and 60% run. The curves follow a more natural initial training in the following epochs of the 40% run and the 60% run.
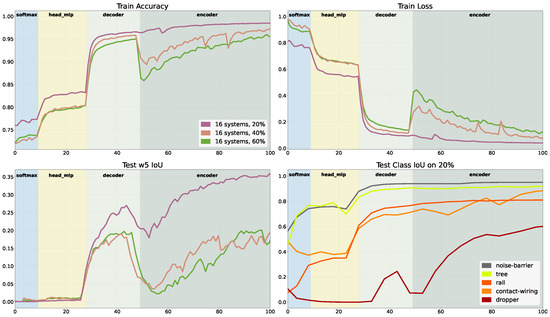
Figure 9.
Detection results after finetuning. The background colour change indicates the unlocking of the gradient. The 20% run set slightly outperforms the 40% run. Enabling the gradient for the encoder block needed roughly 15/30 epochs to be compensated.
The statistics show similar results. The adaptation is reduced by 10% for the small training set, while the results plummet to approximately zero for the larger training set. This means that at least 5 systems score an close to zero. The systems, dropper, contact–wire, vegetation, building, platform–assets and stuff were completely reset. If all points of these classes are summed up, the overall count only share 3% of the whole point cloud. Looking closely at these underrepresented classes, we can observe that their accuracy is reduced in the first few steps of finetuning. This effect can also be seen while looking at the worst system . The stays at zero for the whole part of 100 training epochs in our scope but starts to improve after epoch 106.
Additional summaries and confusion matrices for the 20%-run and the 40%-run are provided in Appendix A: Figure A2, Figure A3, Figure A4 and Figure A5. For further visualisation, the same data snippets shown in Figure 7 were recreated for the 20% run of our methodology, as shown in Figure A1.
Priming Discussion
Compared to clean retraining, we see a much more stable convergence of the model. As the batch size needs to be reduced to support our large input sphere, the training tends to be erratic and requires more updates per epoch; with priming, these are non-issues. Additionally, we see that the adaptation is faster, and the network can reach over 90% accuracy in less than 40 epochs. At first glance, these results seem counterintuitive. How can a dataset perform worse if the point count is doubled and further entities are added? The number of points used during each epoch is roughly constant and picked from a set of unrepresented regions. Therefore, the 40% and the 60% training will see more aberrant sections in one epoch while only having the chance to adapt once. These additional epochs lead to a reconfiguration of already recognised classes in favour of highly represented classes. This behaviour is present in all datasets but is significantly worse for larger training sets. One can estimate that the number of epochs between unlocking the subsequent gradients is set to a sufficient value or slightly too low. Based on our findings, we assume that the optimal point for the next gradient unlocking during the update is when the learning outcome regresses. At least the transition between the full network training can be improved by adding additional epochs and locally reducing the learning rate.
Interestingly, none of the networks surpassed the 20% run after initial reconfiguration. Both the 40% run and the 60% run reach convergence between epochs 160 and 170 at a similar accuracy as the 20% run, but with more highly . We conclude that some of the information is lost in the erratic training, and due to the low object count (see Table A1), the higher trained networks will not reach the same level of abstraction. At the same time, the increased indicates that the object count is too low in the first quintile used for the 20% run.
As a general observation, even the 20% data are enough to obtain good results in finetuning with prior priming. Due to the small batch size and the reduced epoch count, the entire training took less than 24 h. This dramatically differs from the initial training, which took 4 days.
7. Conclusions and Future Work
In this paper, we introduced the concept of reusing older railway projects to boost the detection performance of future railway projects. We showed that including a priming stage in the training process helps in sparse data environments and fragmented systems. In two experiments designed to highlight the characteristics of transfer learning in railway projects, we analysed the improvements provided by our approach. Priming reduces the class mismatch and significantly lowers the adaption stability and training time. As a dividend, the actual training time and the stability of the model training is enhanced, which improves the overall performance in sparse data environments.
The use of the priming methodology shifts the operation and validation to an earlier project phase. As a consequence, the dead time between the project phases of establishing requirements and the surveying, as well as the time before model validation, can be avoided. As CAD models are part of the modern workflow, the training data from CAD models can be prepared in advance. These changes lower the time needed for evaluating the surveys and enable cheaper, more complete monitoring solutions.
Synthetic data can also help to design new workflows and other developments. For each project requirement, the workflow can be optimised down to the design parameters, as they are part of the model generation.
The implementation of this concept also shows room for further improvements. On the one hand, the updated methodology should be refined to reflect different facets of the training data better. For example, the regression in underrepresented classes needs to be addressed in the cost function for the finetuning update. Initial work was invested by Thomas Hugues [37] and a class metric-based cost function. On the other hand, the first experiment points to further additions that could improve the Virtualizer.
Out of all objects, the most intriguing defect is that a rail modelled in CAD does not translate into any usable result. This does not seem to be an issue with the CAD model as these parts are highly standardised, but with the augmentation used in the Virtualizer and the model update. Further research in improving the interactions between the CAD model, the point cloud and augmentation would help reduce the error. Advances would directly enhance the performance of the presented priming approach.
The authors also want to point out that additional features will improve the detection quality. For example, by adding as a feature, rails can be detected due to their stand-out values. Such benefits have less to do with the principle of priming but with its independence from data sparsity.
If, for example, an additional feature to better distinguish surfaces or features to increase the detection for catenary are added, the number of parameters of the neural network will rise proportionally. More parameters will result in more required training. As priming is an infinite source, it will provide an improved neural network as it is unaffected. The addition of features in the railway context is an under-researched topic. As railways are built to specific standards, the authors of this paper believe that some alternative features might help better characterise the point cloud. However, until now, none of the research even incorporates different intensity distributions or discusses adding other features.
Perhaps the most neglected topic in the research on detecting railways seems to be objectification itself. As neural networks continue to achieve better results, an elaborate way of describing functional systems and components on a geometric level is needed. Currently, objects are selected by discretion: if switches need to be detected, networks are trained on switches. With evolving methods, and the ability to recognise multiple systems with reasonable accuracy, one might want to detect switches and rails. This is an oxymoron.
Author Contributions
Conceptualization, F.E.; methodology, F.E.; software, F.E.; validation, F.E.; investigation, F.E.; resources, F.E. and A.B.; data curation, F.E.; writing—original draft preparation, F.E.; writing—review and editing, F.E. and A.B.; supervision, A.B.; project administration, F.E.; funding acquisition, F.E. and A.B.; All authors have read and agreed to the published version of the manuscript.
Funding
This work was funded by the Bavarian State Ministry of Economic Affairs, Regional Development and Energy as part of the Bavarian Joint Funding Programme (BayVFP)—Funding Line Digitalisation—Funding Area Information and Communication Technology. This research was funded by the IUK grant number DIK0100/03.
Data Availability Statement
The code for all shown experiments is published under the GPL 3 liscense. The programs can be found under https://github.com/stars/FelixEickeler/lists/railtwin (accessed on 25 July 2022).
Acknowledgments
Special thanks to the students Abdulrahman Ashmawi, Hannah Kramer and Alicia Knauer for supporting the preparation of the dataset.
Conflicts of Interest
The authors declare no conflict of interest.
Appendix A
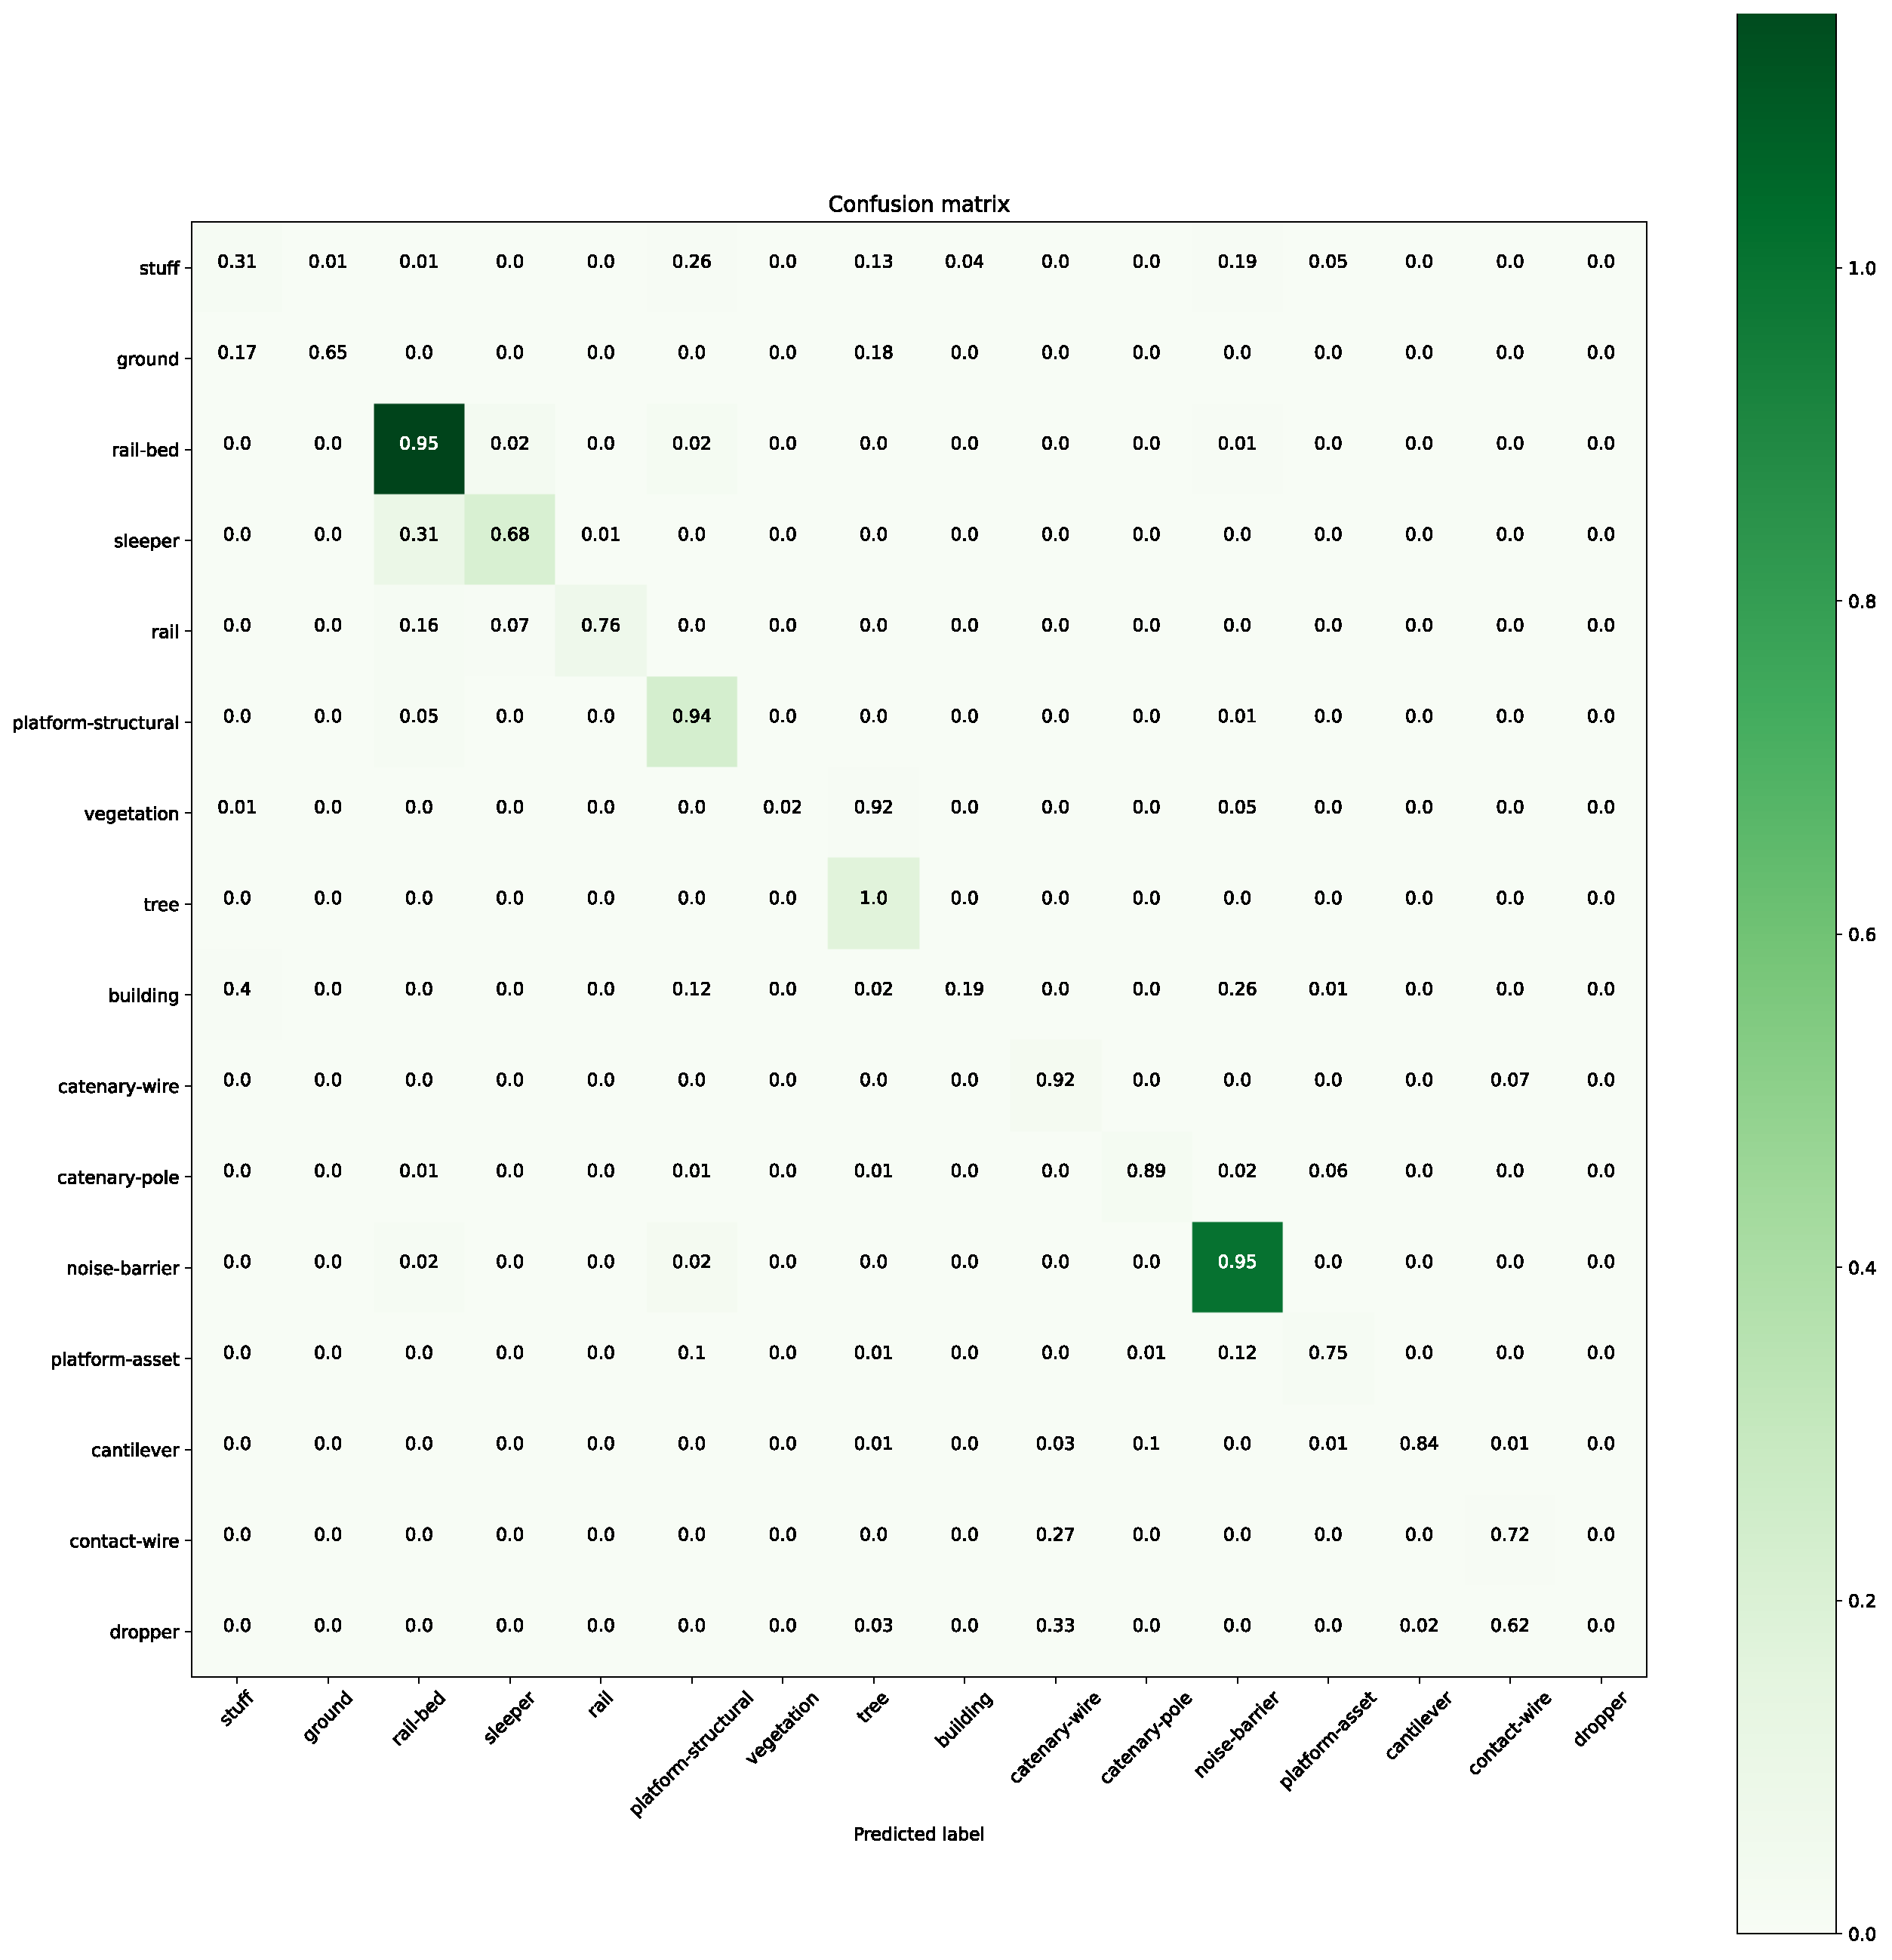
Additional results for the TL benchmark. Results are shown for the 20% and the 40% dataset. The summarised data were extracted from the validation results for step 70. Step 70 was chosen to reflect the maximum. Even more detailed results, containing the results after each gradient unlock, are provided with the source code in the GitHub [4] under results.

Table A1.
Object count for the experiments. Objects might span adjacent sets.
Table A1.
Object count for the experiments. Objects might span adjacent sets.
| # | System | Train 1 | Train 2 | Train 3 | Testing 1 | Testing 2 |
|---|---|---|---|---|---|---|
| 1 | Stuff | 1 | 2 | 3 | 1 | 2 |
| 2 | Ground | 1 | 2 | 2 | 2 | 0 |
| 3 | Rail-bed | 7 | 2 | 1 | 1 | 2 |
| 4 | Sleeper | 404 | 341 | 401 | 335 | 346 |
| 5 | Rail | 14 | 14 | 14 | 14 | 14 |
| 6 | Platform–structural | 1 | 1 | 1 | 1 | 1 |
| 7 | Vegetation | 15 | 13 | 7 | 11 | 11 |
| 8 | Tree | 21 | 9 | 32 | 22 | 23 |
| 9 | Building | 1 | 2 | 1 | 2 | 0 |
| 10 | Catenary–wire | 3 | 11 | 1 | 15 | 1 |
| 11 | Catenary–pole | 5 | 4 | 3 | 5 | 3 |
| 12 | Noise–barrier | 1 | 8 | 9 | 7 | 7 |
| 13 | Platform–asset | 1 | 2 | 2 | 3 | 0 |
| 14 | Cantilever | 10 | 6 | 4 | 9 | 2 |
| 15 | Contact–wire | 9 | 7 | 9 | 9 | 8 |
| 16 | Dropper | 39 | 29 | 34 | 29 | 28 |
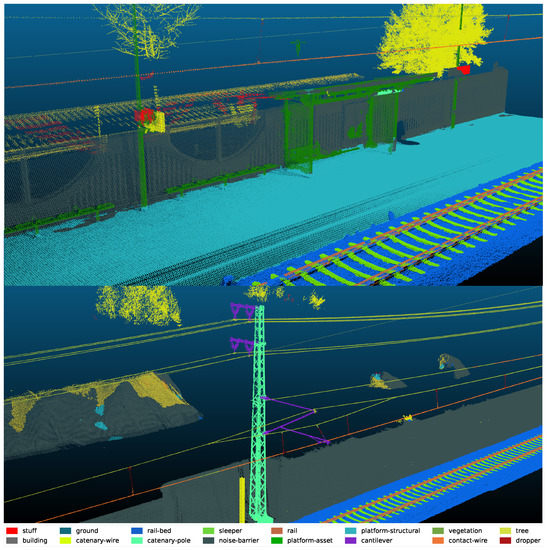
Figure A1.
Results of the finetuned model on the real dataset. Considering the neural model has not seen any “real’’ shelters, the results are remarkable.
Figure A1.
Results of the finetuned model on the real dataset. Considering the neural model has not seen any “real’’ shelters, the results are remarkable.
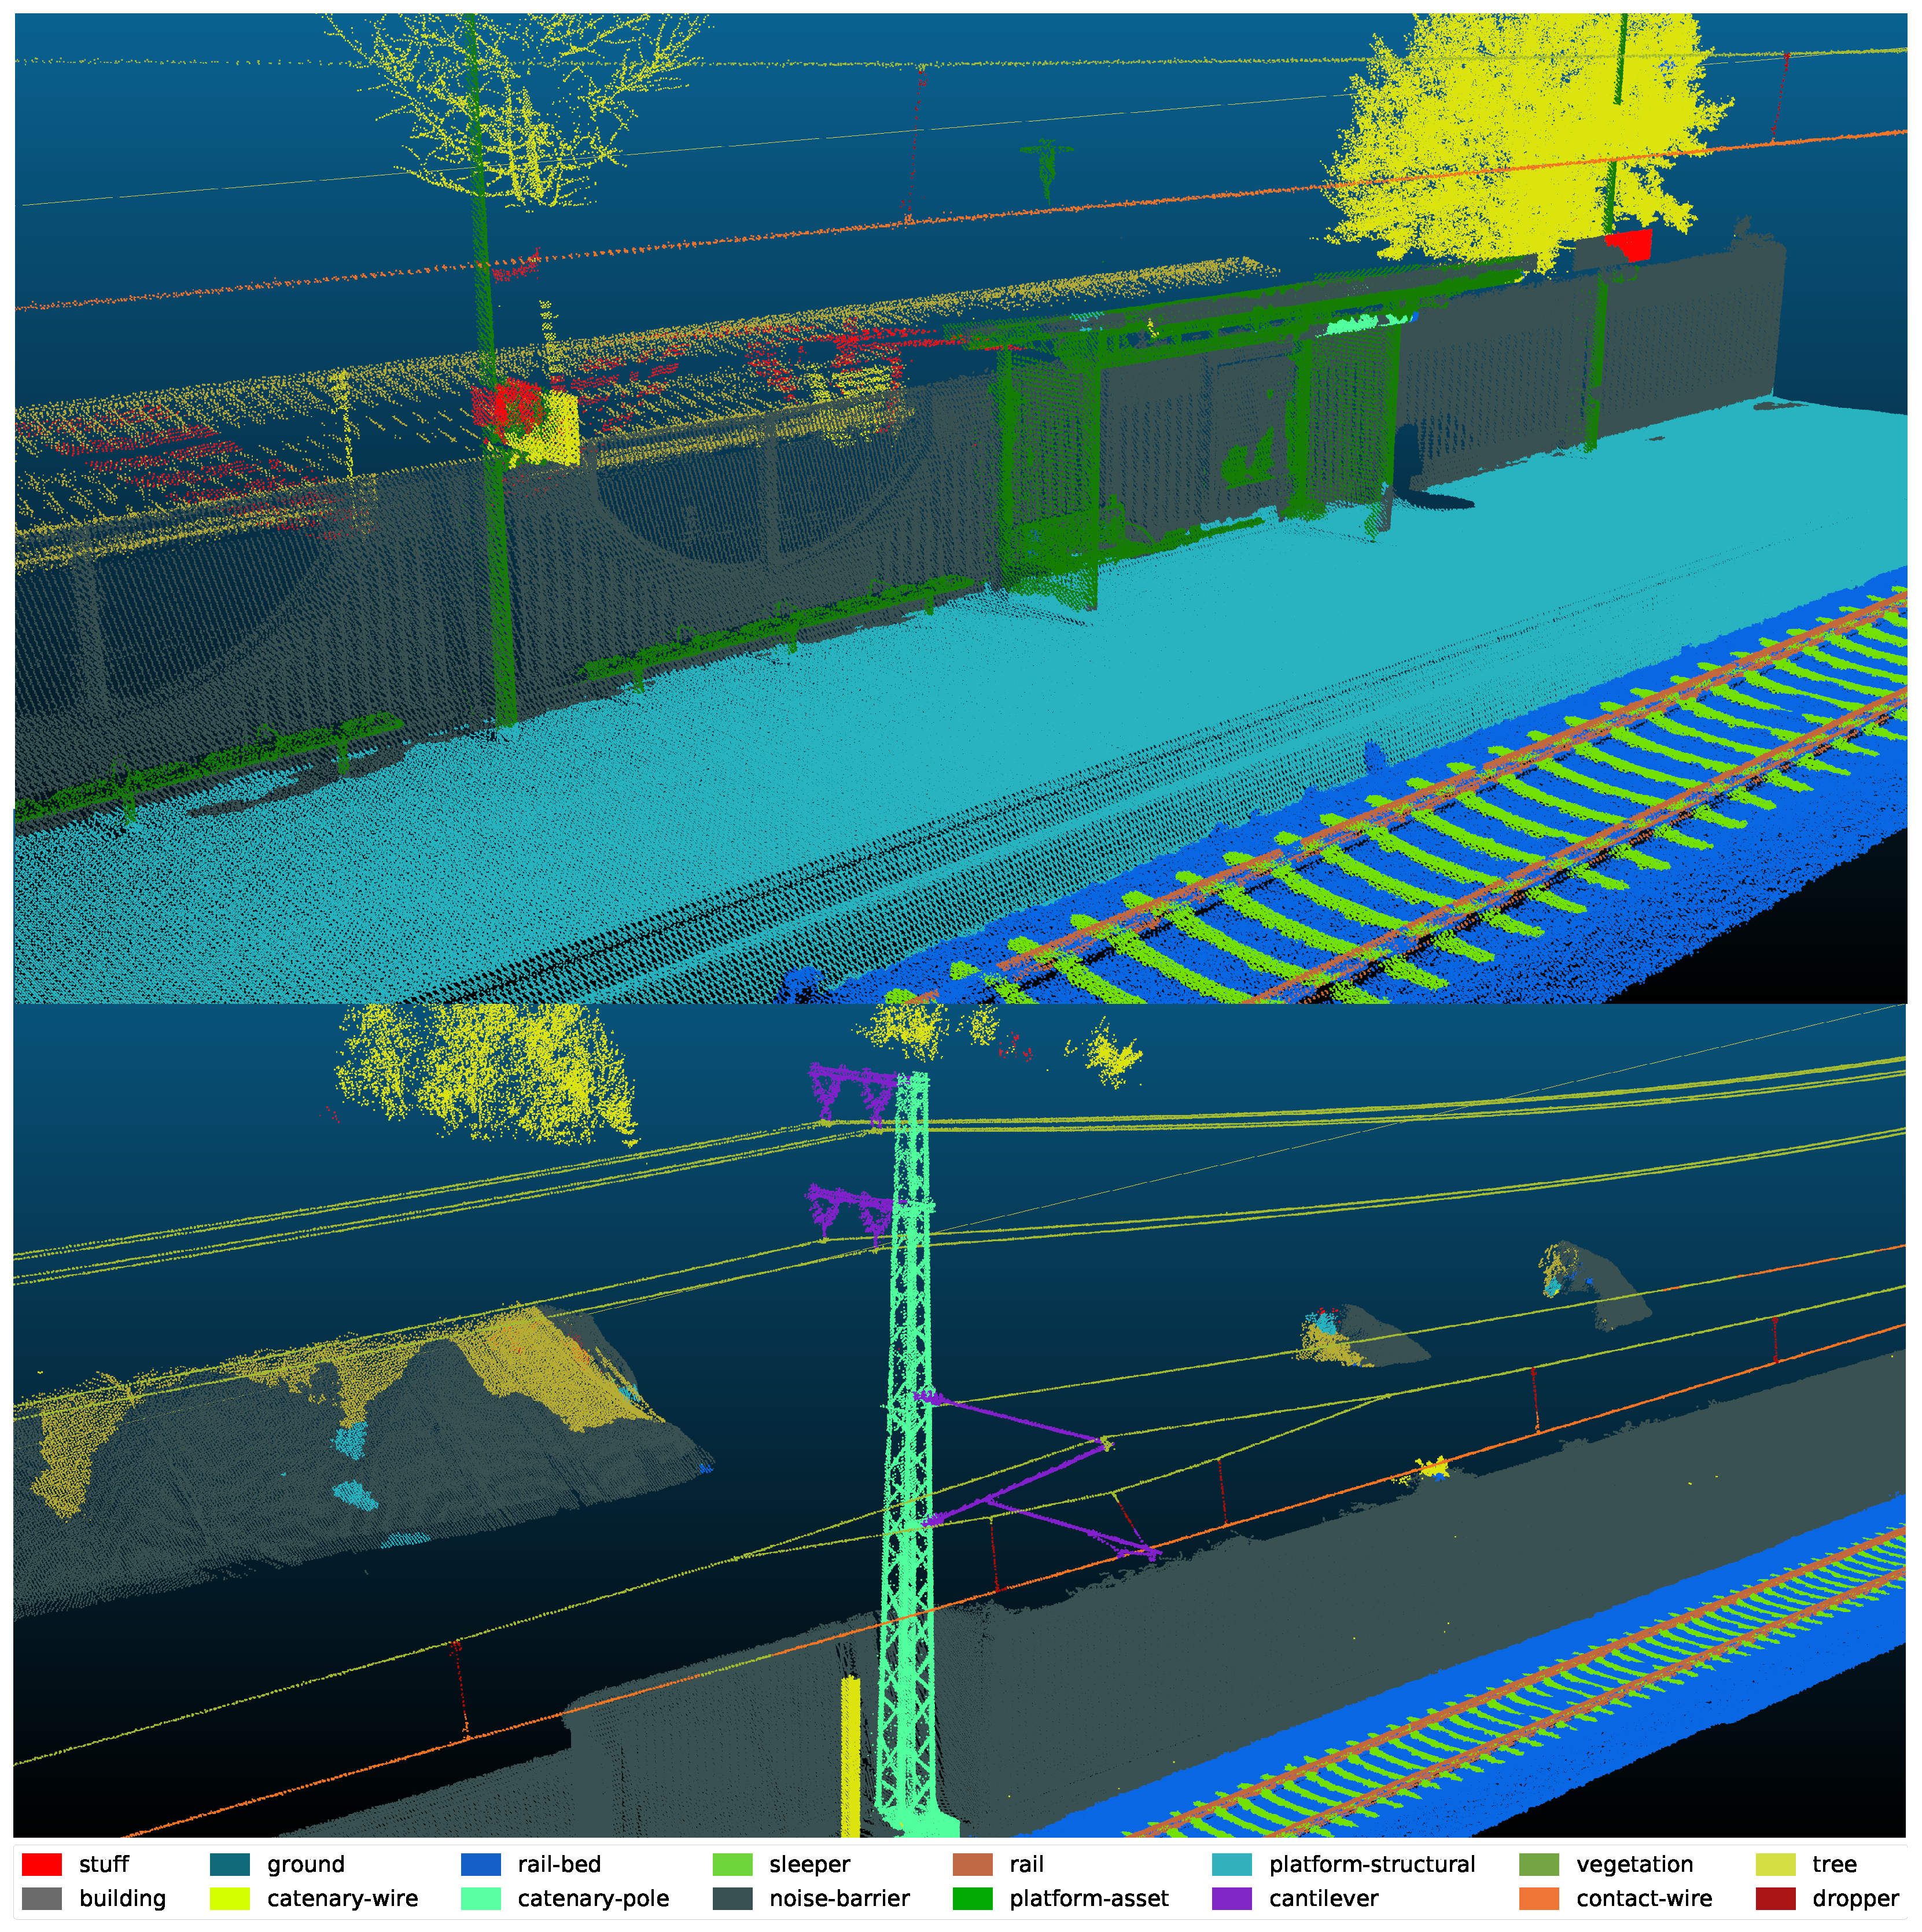
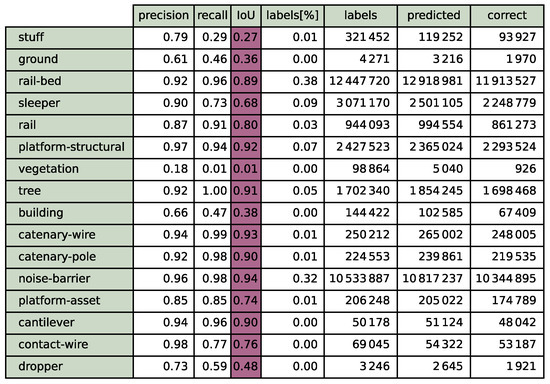
Figure A2.
Summary for the 20% validation for step 70. Validation points are picked with means to spatial coverage (KPconv).
Figure A2.
Summary for the 20% validation for step 70. Validation points are picked with means to spatial coverage (KPconv).
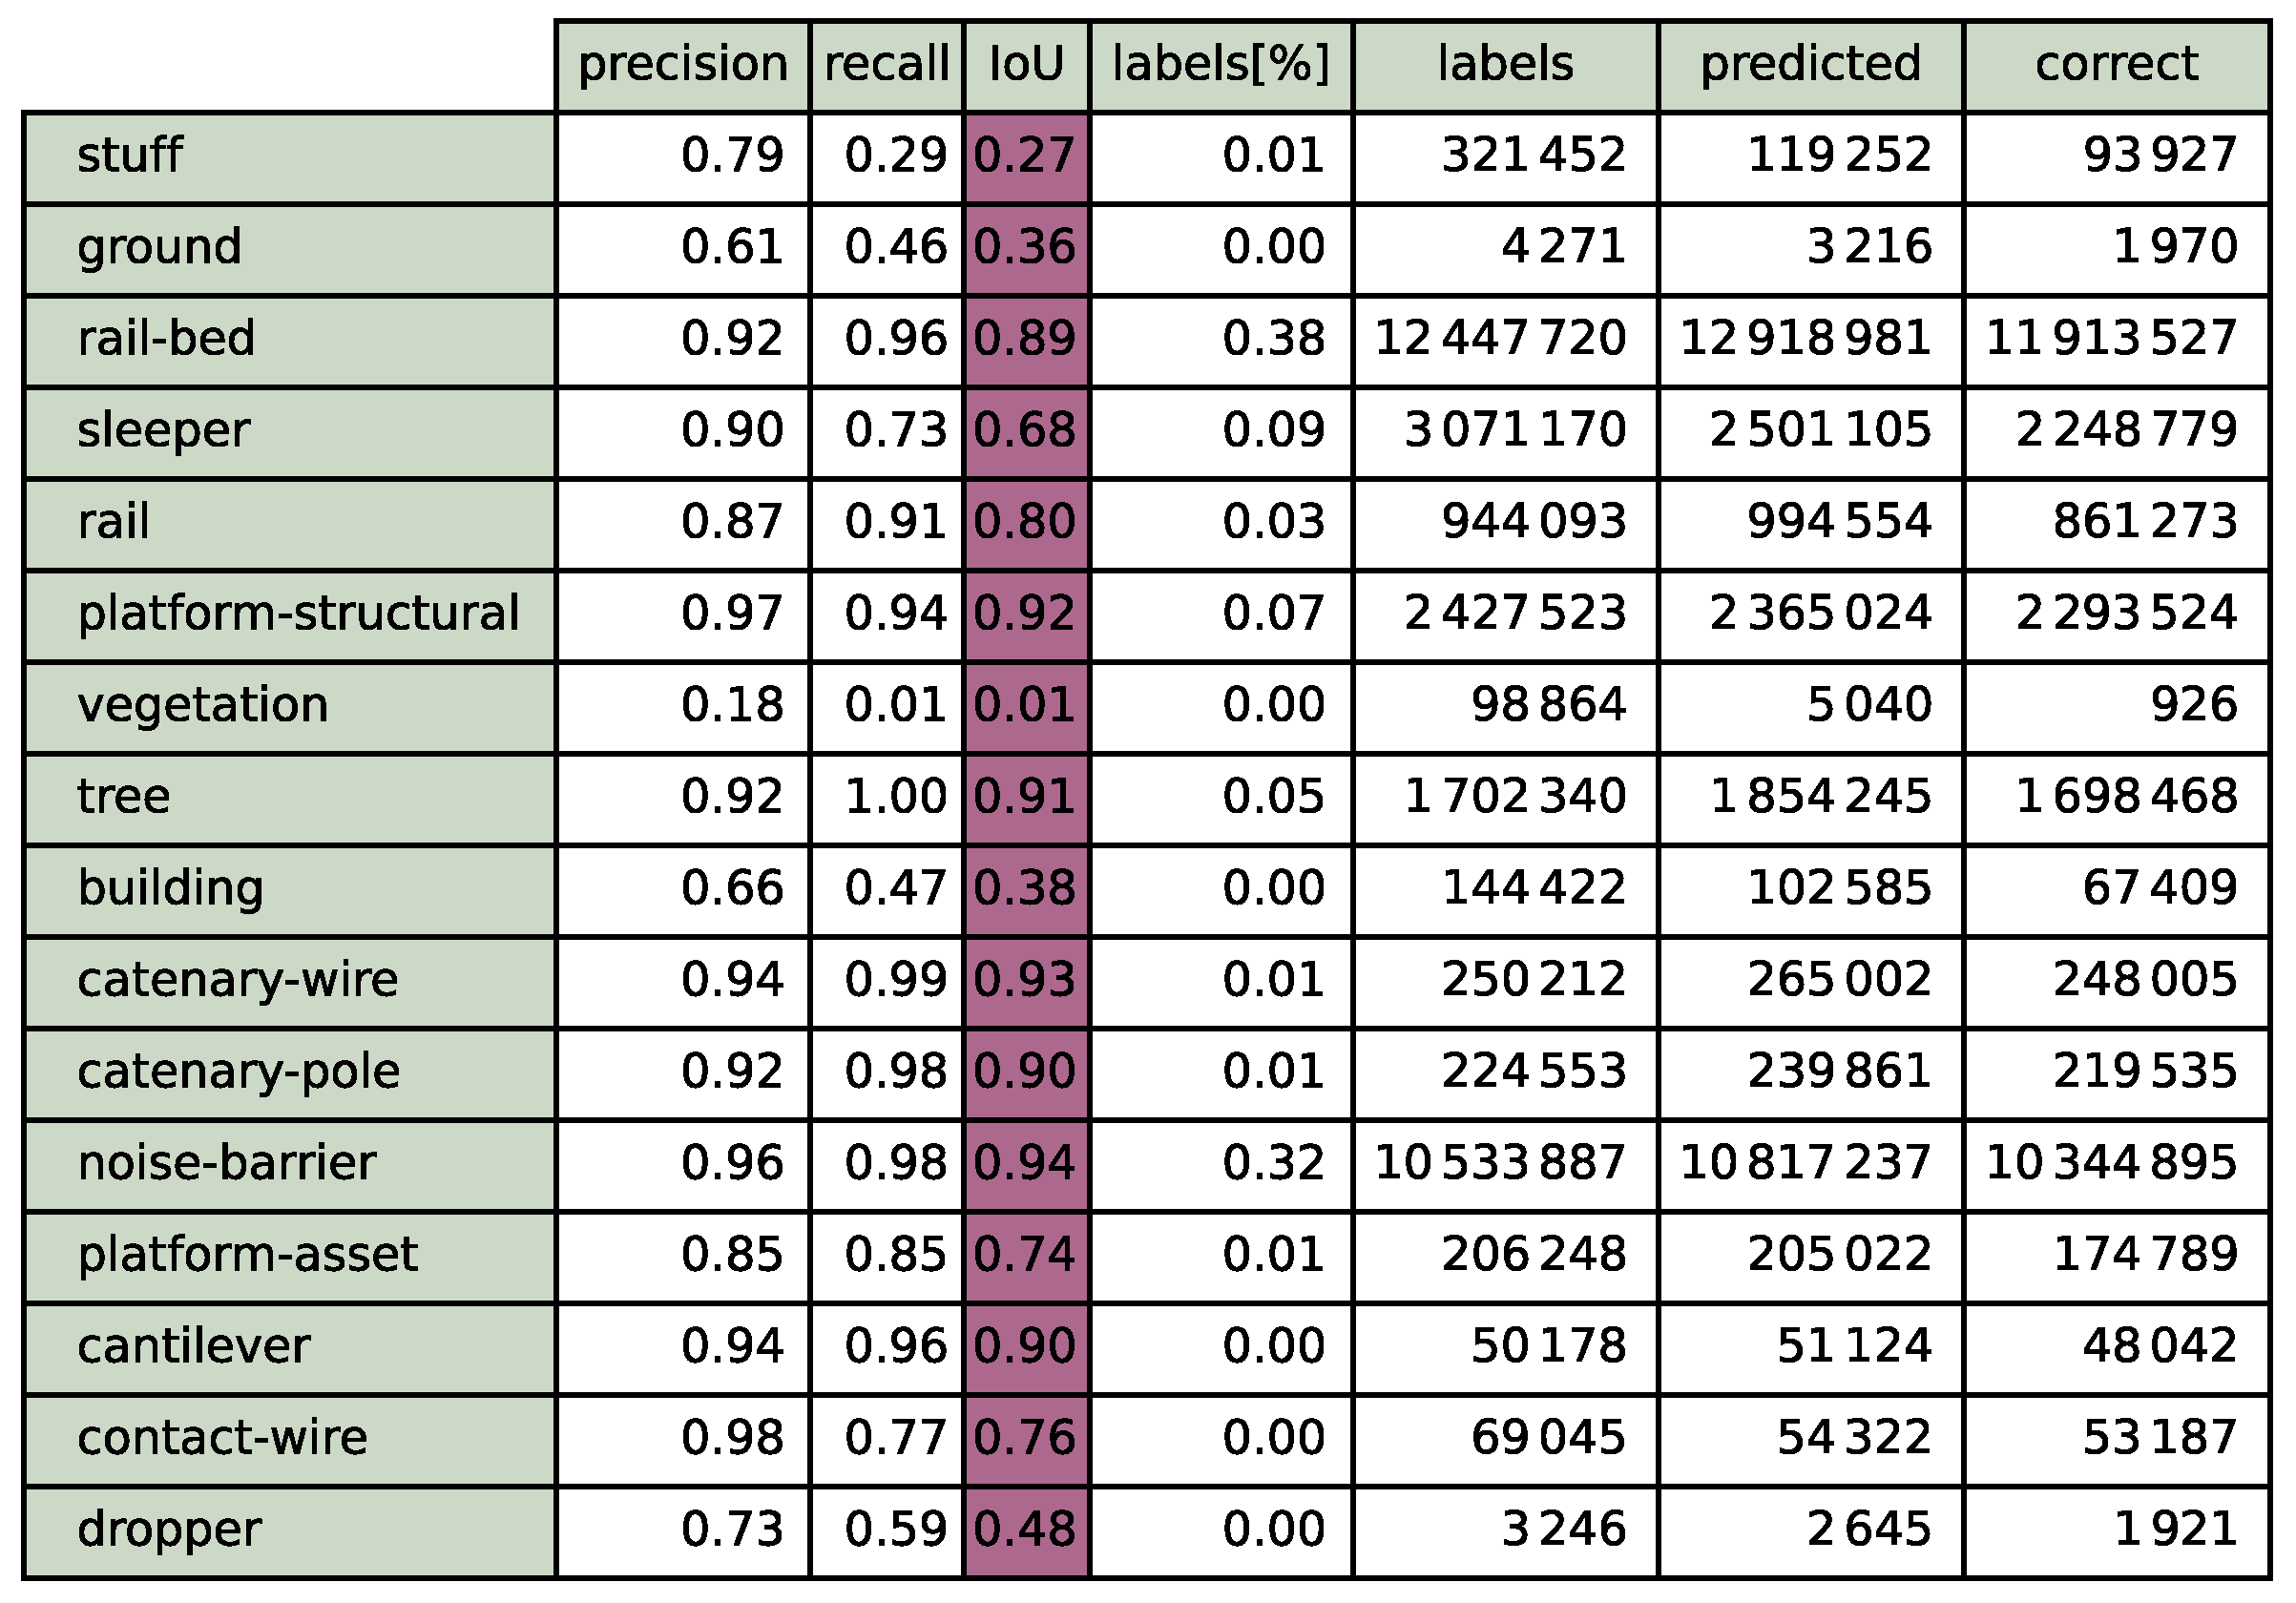
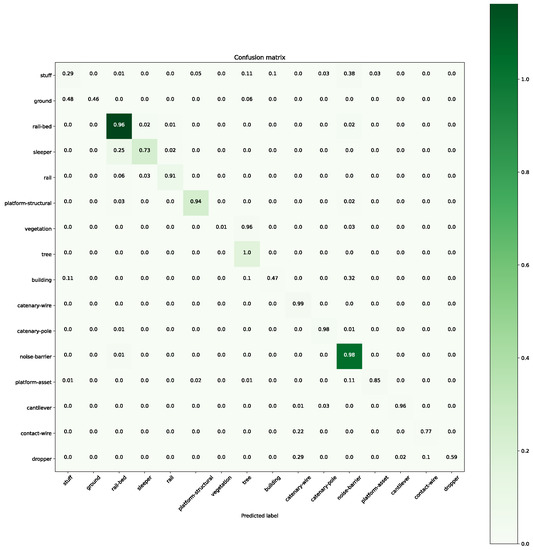
Figure A3.
Confusion matrix for the 20% validation for step 70. The colour depicts the actual number of points in the validation set.
Figure A3.
Confusion matrix for the 20% validation for step 70. The colour depicts the actual number of points in the validation set.
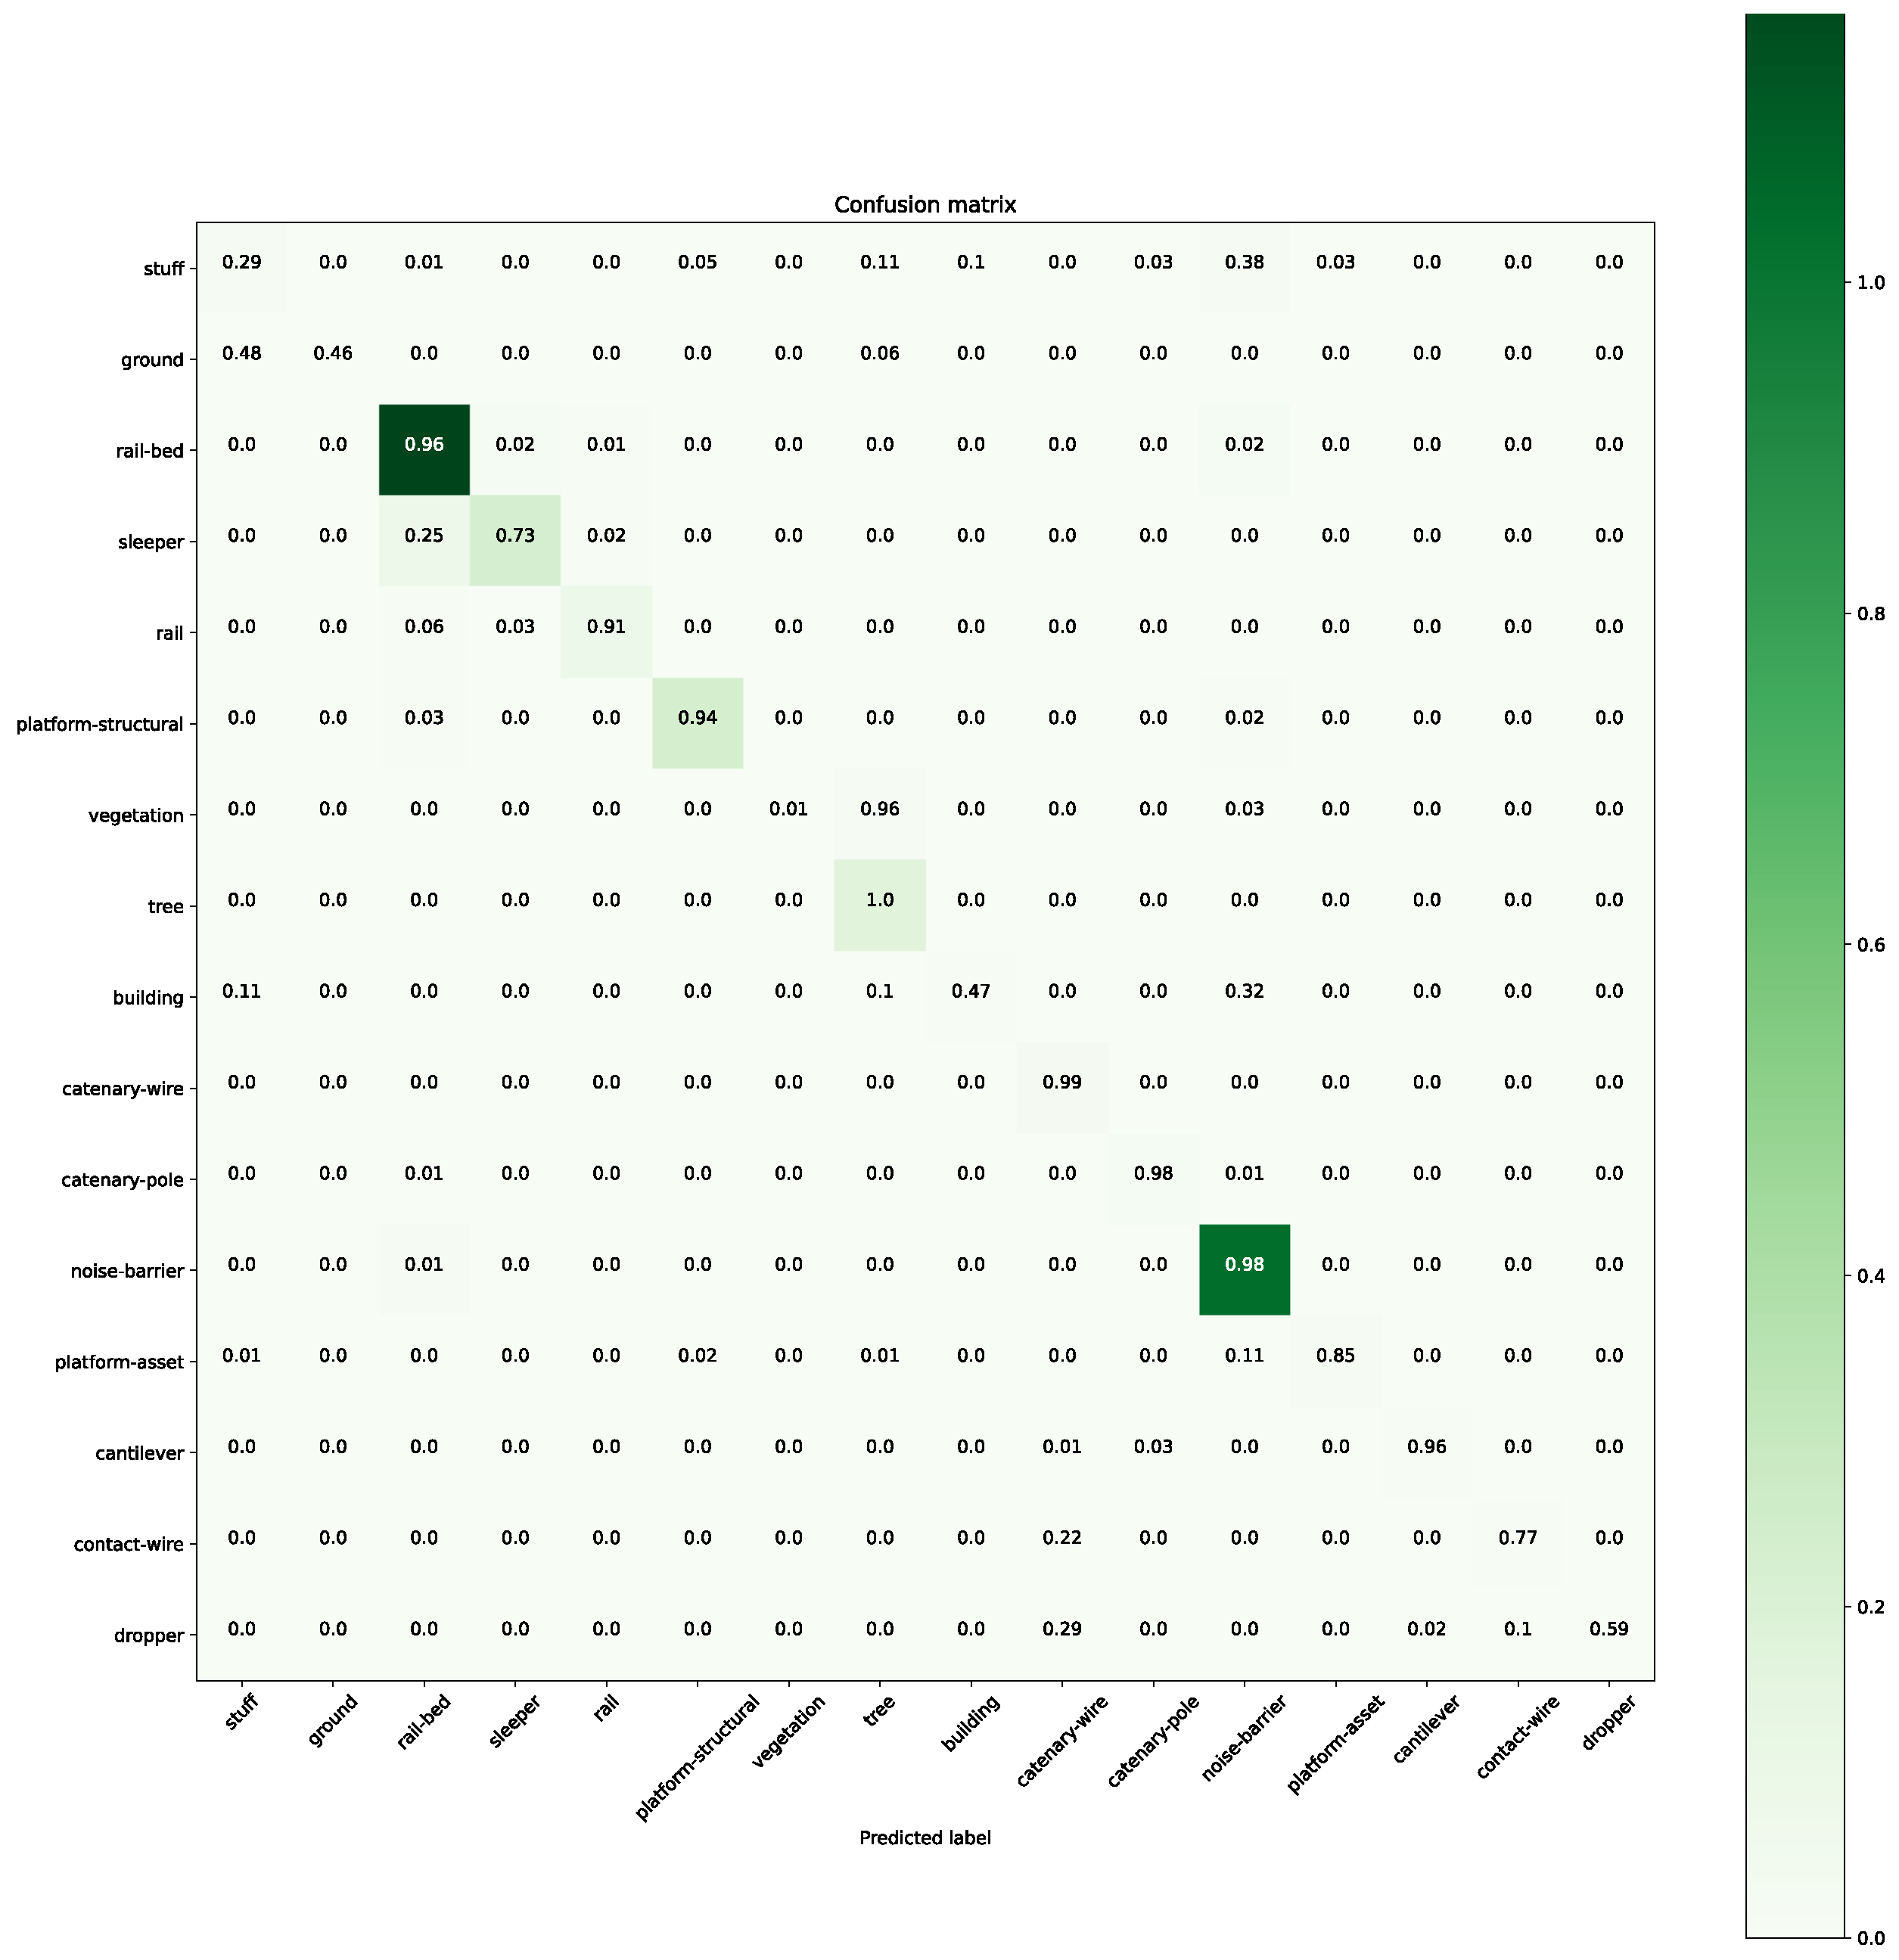
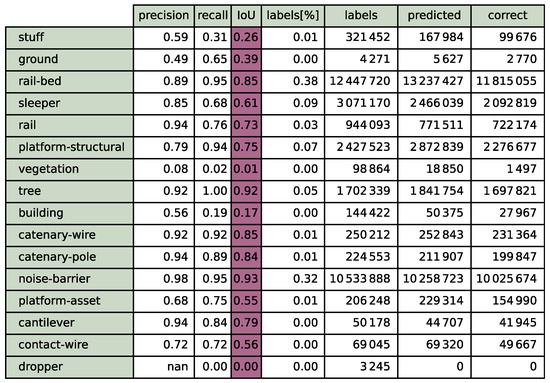
Figure A4.
Summary for the 40% validation for step 70. Validation points are picked with means to spacial coverage (KPconv).
Figure A4.
Summary for the 40% validation for step 70. Validation points are picked with means to spacial coverage (KPconv).
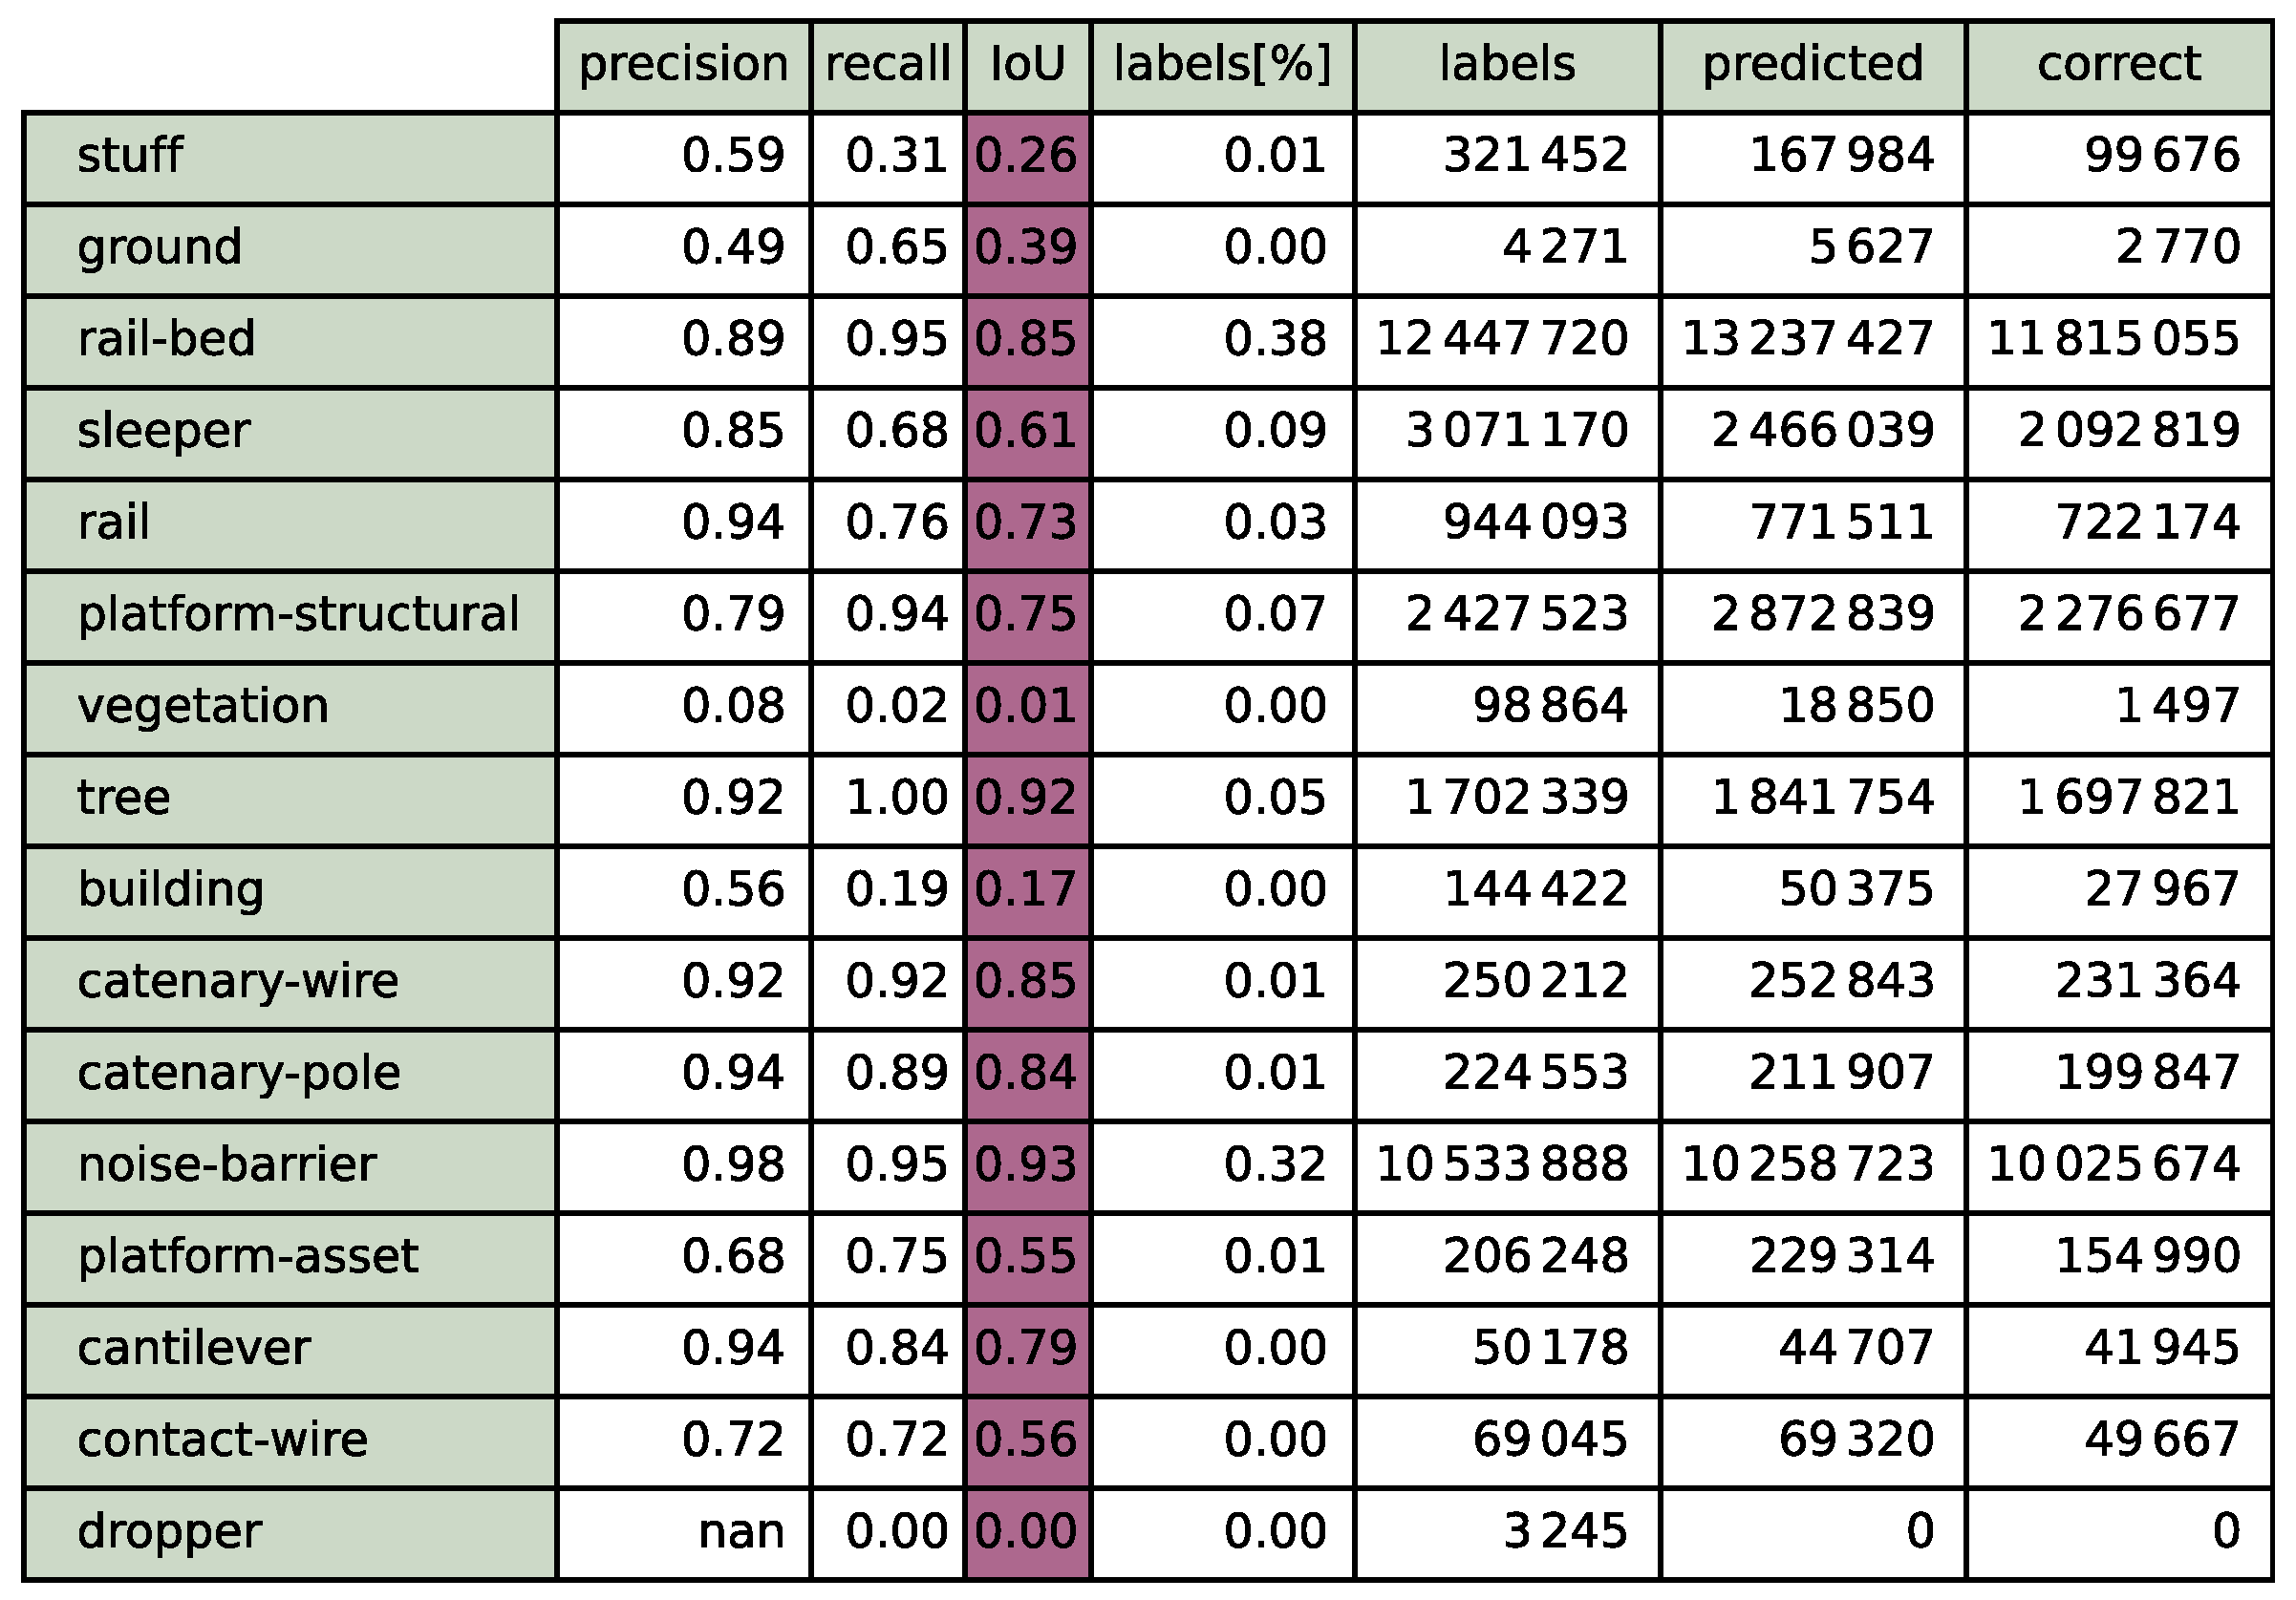
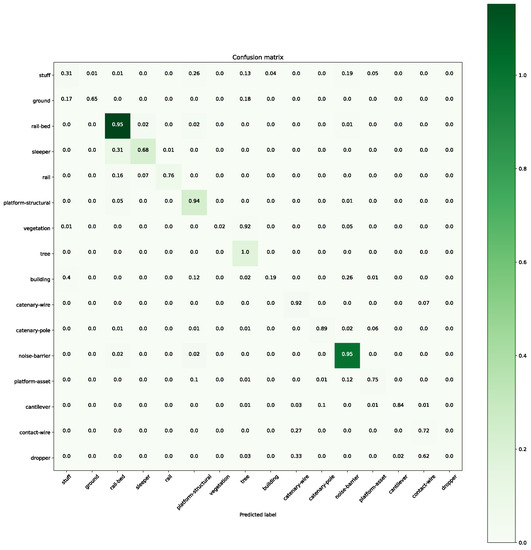
Figure A5.
Confusion matrix for the 40% validation for step 70. The colour depicts the actual number of points in the validation set.
Figure A5.
Confusion matrix for the 40% validation for step 70. The colour depicts the actual number of points in the validation set.
Appendix B
Visualised network architectures of the used variants of the KPConv architecture. The input length of the vector, , is defined by the training methodology, as the data is sampled, and a certain percentile is used. This guarantees a sufficient neighbourhood influence for low-density objects [29] (pp. 123–126).

Figure A6.
Network architecture used in the investigations in this paper. The base structure is similar to the original publication [29]. The input vector size equals roughly 120,000–150,000 based on the input data.
Figure A6.
Network architecture used in the investigations in this paper. The base structure is similar to the original publication [29]. The input vector size equals roughly 120,000–150,000 based on the input data.


Figure A7.
Discussed architecture used by Soilán et al. [26] for their TL approach. The most notable differences are the reduced encoder block, the initial feature count of 64 and the reduced class output of 4.
Figure A7.
Discussed architecture used by Soilán et al. [26] for their TL approach. The most notable differences are the reduced encoder block, the initial feature count of 64 and the reduced class output of 4.

References
- EU.Stat. EU Transport in Figures: Statistis Passenger Transport, 2020. Data Extracted on 19 Jul 2022 08:50 UTC (GMT) from OECD.Stat. Available online: https://stats.oecd.org/Index.aspx?&datasetcode=ITF_PASSENGER_TRANSPORT# (accessed on 25 July 2022).
- Union, E. EU Transport in Figures: Statistical Pocketbook 2020; Transport in Figures; Publications Office of the European Union: Luxembourg, 2020; Volume 2020. [Google Scholar]
- Direct, E. The Journey Begins—2021 is the European Year of Rail! Technical Report; European Commission: Brussels, Belgium, 2021. [Google Scholar]
- Eickeler, F. RailTwin-Supplementary. 2022. Available online: https://github.com/FelixEickeler/RailTwin-Supplementary (accessed on 25 July 2022).
- Kalvoda, P.; Nosek, J.; Kuruc, M.; Volarik, T.; Kalvodova, P. Accuracy Evaluation and Comparison of Mobile Laser Scanning and Mobile Photogrammetry Data. IOP Conf. Ser. Earth Environ. Sci. 2020, 609, 012091. [Google Scholar] [CrossRef]
- Giben, X.; Patel, V.M.; Chellappa, R. Material classification and semantic segmentation of railway track images with deep convolutional neural networks. In Proceedings of the 2015 IEEE International Conference on Image Processing (ICIP), Quebec City, QC, Canada, 27–30 September 2015; IEEE: Piscataway, NJ, USA, 2015. [Google Scholar] [CrossRef]
- Han, Y.; Liu, Z.; Lee, D.; Liu, W.; Chen, J.; Han, Z. Computer vision–based automatic rod-insulator defect detection in high-speed railway catenary system. Int. J. Adv. Robot. Syst. 2018, 15, 172988141877394. [Google Scholar] [CrossRef]
- Loktev, D.A.; Loktev, A.A. Diagnostics of External Defects of Railway Infrastructure by Analysis of its Images. In Proceedings of the 2018 Global Smart Industry Conference (GloSIC), Chelyabinsk, Russia, 13–15 November 2018; IEEE: Piscataway, NJ, USA, 2018. [Google Scholar] [CrossRef]
- Elberink, S.O.; Khoshelham, K.; Arastounia, M.; Benito, D.D. Rail Track Detection and Modelling in Mobile Laser Scanner Data. ISPRS Ann. Photogramm. Remote Sens. Spat. Inf. Sci. 2013, II-5/W2, 223–228. [Google Scholar] [CrossRef]
- Arastounia, M. Automated Recognition of Railroad Infrastructure in Rural Areas from LIDAR Data. Remote Sens. 2015, 7, 14916–14938. [Google Scholar] [CrossRef]
- Chen, C.; Zhang, T.; Kan, Y.; LI, S.; Jin, G. A rail extraction algorithm based on the generalized neighborhood height difference from mobile laser scanning data. In Proceedings of the SPIE Future Sensing Technologies, Online, 9–13 November 2020; Valenta, C.R., Shaw, J.A., Kimata, M., Eds.; SPIE: Bellingham, WA, USA, 2020. [Google Scholar] [CrossRef]
- Wilk, A.; Koc, W.; Specht, C.; Judek, S.; Karwowski, K.; Chrostowski, P.; Czaplewski, K.; Dabrowski, P.S.; Grulkowski, S.; Licow, R.; et al. Digital Filtering of Railway Track Coordinates in Mobile Multi–Receiver GNSS Measurements. Sensors 2020, 20, 5018. [Google Scholar] [CrossRef] [PubMed]
- Ariyachandra, M.R.M.F.; Brilakis, I. Detection of Railway Masts in Airborne LiDAR Data. J. Constr. Eng. Manag. 2020, 146, 04020105. [Google Scholar] [CrossRef]
- Elberink, S.; Khoshelham, K. Automatic Extraction of Railroad Centerlines from Mobile Laser Scanning Data. Remote Sens. 2015, 7, 5565–5583. [Google Scholar] [CrossRef]
- Ariyachandra, M.R.M.F.; Brilakis, I. Generating Railway Geometric Digital Twins from Airborne LiDAR Data. In Proceedings of the 2021 European Conference on Computing in Construction, Online, 26–28 July 2021; University College Dublin: Dublin, Ireland, 2021. [Google Scholar] [CrossRef]
- Justo, A.; Soilán, M.; Sánchez-Rodríguez, A.; Riveiro, B. Scan-to-BIM for the infrastructure domain: Generation of IFC-compliant models of road infrastructure assets and semantics using 3D point cloud data. Autom. Constr. 2021, 127, 103703. [Google Scholar] [CrossRef]
- Gézero, L.; Antunes, C. Automated Three-Dimensional Linear Elements Extraction from Mobile LiDAR Point Clouds in Railway Environments. Infrastructures 2019, 4, 46. [Google Scholar] [CrossRef]
- Sánchez-Rodríguez, A.; Soilán, M.; Cabaleiro, M.; Arias, P. Automated Inspection of Railway Tunnels’ Power Line Using LiDAR Point Clouds. Remote Sens. 2019, 11, 2567. [Google Scholar] [CrossRef]
- Corongiu, M.; Masiero, A.; Tucci, G. Classification of Railway Assets in Mobile Mapping Point Clouds. Int. Arch. Photogramm. Remote Sens. Spat. Inf. Sci. 2020, XLIII-B1-2020, 219–225. [Google Scholar] [CrossRef]
- Chen, X.; Chen, Z.; Liu, G.; Chen, K.; Wang, L.; Xiang, W.; Zhang, R. Railway Overhead Contact System Point Cloud Classification. Sensors 2021, 21, 4961. [Google Scholar] [CrossRef] [PubMed]
- Guinard, S.A.; Riant, J.P.; Michelin, J.C.; D’Aguiar, S.C. Fast Weakly Supervised Detection of Railway-Related Infrastructures in Lidar Acquisitions. ISPRS Ann. Photogramm. Remote Sens. Spat. Inf. Sci. 2021, V-2-2021, 27–34. [Google Scholar] [CrossRef]
- Grandio, J.; Riveiro, B.; Soilán, M.; Arias, P. Point cloud semantic segmentation of complex railway environments using deep learning. Autom. Constr. 2022, 141, 104425. [Google Scholar] [CrossRef]
- Manier, A.; Moras, J.; Michelin, J.C.; Piet-Lahanier, H. Railway Lidar Semantic Segmentation with Axially Symmetrical Convolutional Learning. ISPRS Ann. Photogramm. Remote Sens. Spat. Inf. Sci. 2022, V-2-2022, 135–142. [Google Scholar] [CrossRef]
- Weiss, K.; Khoshgoftaar, T.M.; Wang, D. A survey of transfer learning. J. Big Data 2016, 3, 9. [Google Scholar] [CrossRef]
- Chronopoulou, A.; Baziotis, C.; Potamianos, A. An Embarrassingly Simple Approach for Transfer Learning from Pretrained Language Models. In Proceedings of the 2019 Annual Conference of the North American Chapter of the Association for Computational Linguistics, Minneapolis, MN, USA, 3–5 June 2019; Association for Computational Linguistics: Stroudsburg, PA, USA, 2019. [Google Scholar] [CrossRef]
- Soilán, M.; Nóvoa, A.; Sánchez-Rodríguez, A.; Riveiro, B.; Arias, P. Semantic Segmentation of Point Clouds with Pointnet And Kpconv Architectures Applied to Railway Tunnels. ISPRS Ann. Photogramm. Remote Sens. Spat. Inf. Sci. 2020, V-2-2020, 281–288. [Google Scholar] [CrossRef]
- He, K.; Zhang, X.; Ren, S.; Sun, J. Deep Residual Learning for Image Recognition. In Proceedings of the 2016 IEEE Conference on Computer Vision and Pattern Recognition (CVPR), Las Vegas, NV, USA, 27–30 June 2016; IEEE: Piscataway, NJ, USA, 2016. [Google Scholar] [CrossRef]
- Thomas, H.; Qi, C.R.; Deschaud, J.E.; Marcotegui, B.; Goulette, F.; Guibas, L. KPConv: Flexible and Deformable Convolution for Point Clouds. In Proceedings of the 2019 IEEE/CVF International Conference on Computer Vision (ICCV), Seoul, Korea, 27 October–2 November 2019; IEEE: Piscataway, NJ, USA, 2019. [Google Scholar] [CrossRef]
- Hugues, T. Learning New Representations for 3D Point Cloud Semantic Segmentation. Ph.D. Thesis, Université Paris Sciences et Lettres, Paris, France, 2019. [Google Scholar]
- Fisher, J.B.; Lee, B.; Purdy, A.J.; Halverson, G.H.; Dohlen, M.B.; Cawse-Nicholson, K.; Wang, A.; Anderson, R.G.; Aragon, B.; Arain, M.A.; et al. ECOSTRESS: NASA’s Next Generation Mission to Measure Evapotranspiration From the International Space Station. Water Resour. Res. 2020, 56, e2019WR026058. [Google Scholar] [CrossRef]
- Winiwarter, L.; Esmorís Pena, A.M.; Weiser, H.; Anders, K.; Martínez Sánchez, J.; Searle, M.; Höfle, B. Virtual laser scanning with HELIOS++: A novel take on ray tracing-based simulation of topographic full-waveform 3D laser scanning. Remote Sens. Environ. 2022, 269, 112772. [Google Scholar] [CrossRef]
- RIEGL VMX-RAIL. 2022. Available online: http://www.riegl.com/nc/products/mobile-scanning/produktdetail/product/scanner/67 (accessed on 25 September 2022).
- Eickeler, F. RailTwin Track Models 2022. 2022. Available online: https://filedn.eu/l4hiESSdAeuuEoSLE7Uolr4/boosting_paper/2022-08-16_boosting-trackmodels.zip (accessed on 25 July 2022).
- Girardeau-Montaut, D. CloudCompare [GPL Software]. 2022. Available online: https://github.com/CloudCompare/CloudCompare (accessed on 25 July 2022).
- Hugues, T. KPConv parameters for large outdoor scene with low point density. 2021. Available online: https://github.com/HuguesTHOMAS/KPConv-PyTorch/issues/90#issuecomment-808756261 (accessed on 25 July 2022).
- Eickeler, F. RailTwin-KPCopv. 2022. Available online: https://github.com/FelixEickeler/RailTwin-KPConv (accessed on 25 July 2022).
- Thomas Hugues, L.H. KPConv-PyTorch. 2022. Available online: https://github.com/HuguesTHOMAS/KPConv-PyTorch (accessed on 25 July 2022).
Publisher’s Note: MDPI stays neutral with regard to jurisdictional claims in published maps and institutional affiliations. |
© 2022 by the authors. Licensee MDPI, Basel, Switzerland. This article is an open access article distributed under the terms and conditions of the Creative Commons Attribution (CC BY) license (https://creativecommons.org/licenses/by/4.0/).

