Abstract
The offshore China (OC) region is a significant sea area in the Western Pacific and many researchers have been interested in the distribution of sea surface temperature (SST) fronts in this area. In this study, the Cayula and Cornillon single image edge detection algorithm was used to detect SST fronts using the Daily Optimum Interpolation Sea Surface Temperature data from 1982 to 2021. The results revealed that there are eighteen SST fronts in OC— three in the Bohai Sea, seven in the Yellow Sea, two in the East China Sea, five in the South China Sea, one in the Pacific Ocean east of Taiwan province, China—and among them a new front was detected in the Yellow Sea and named the Yellow Sea Ring Front. The frequency of most fronts showed a tendency of initially increasing and then decreasing from January to September, followed by a trend of growing steadily from October to December. The frequency of a few fronts showed a decreasing tendency from January to September and an increasing tendency from October to December. The frequency of most fronts is highest in winter and lowest in summer. In spring and autumn, the frequency of most fronts is lower than that in winter and higher than that in summer. The annual average frontal probability of five-ninths of the fronts showed an upward trend, and the annual average frontal probability value of one-third of the fronts showed a downward trend. The rest of the fronts showed a stable trend. The results of this paper also showed that the Liaodong Bay Front and the Bohai-Laizhou Bay Front did not form a complete front, as previously reported. In addition, the frontal probability of the Bohai Front to the north of 39° N was in the tendency of decreasing.
1. Introduction
Oceanic fronts are defined as narrow zones with intense horizontal gradients [1]. These fronts are formed when two water masses with different physical, chemical, and/or biological qualities, such as temperature, salinity, nutrients, and so on, come together [2,3]. Different physical processes in the ocean will form different types of ocean fronts, such as river outflows forming estuary fronts, tidal mixing forming shelf-break fronts, coastal and open ocean upwellings forming coastal upwelling fronts, and surface water conversion forming boundary current fronts [4]. In the offshore China (OC) region, all the above types of fronts appear. For example, the formation of some strong fronts in the northern part of the South China Sea is mainly affected by intense upwelling, which is mainly caused by the Kuroshio intrusion and interactions with the South China Sea water [5]. Owing to tidal mixing and freshwater river flow, there is an estuary front along the Yangtze River [6]. At the western boundary current of the North Pacific Ocean, the Kuroshio has formed a boundary current front in this area [7]. The identification of fronts can provide basic support for other studies. The fronts are crucial indexes in climate and ocean science studies and are important for ocean–atmosphere interactions and ocean ecosystem research [8,9,10]. The fronts also play a key role as principal biogeographical boundaries, and primary and secondary biological productivity is enhanced at fronts, attracting fish, birds, and mammals, including whales [11]. Sea surface temperature (SST) fronts that were traditional and typical oceanic fronts, for example, have received increased attention in terms of predicting fish distribution and ocean hydrodynamics [12]. Therefore, studying and understanding the properties of oceanic fronts is important for studying the processes of ocean ecosystems and ocean hydrodynamics.
With the development of remote sensing technology, SST data can be easily obtained and SST data from satellites have been widely used in front detection studies since the 1970s [10]. Legeckis first examined the global distribution of SST fronts using an environmental satellite and infrared scanners and believed that satellite remote sensing can improve the ability to detect oceanic fronts [13]. The quality of SST products has improved over the last 40 years as remote sensing technology has advanced. Large-scale and long-term observation of fronts is now possible because satellite remote sensors are more and more advanced and related algorithms have been developed [8,14], and most researchers conducted their research on SST fronts. Some studies focus on the construction of frontal detection algorithms, such as the Canny algorithm [15], Cayula and Cornillon algorithm [16,17], Belkin and O’Reilly algorithm [18], Nieto algorithm [19], and so on. With the maturity of frontal detection algorithms, some researchers have begun to pay attention to the spatial and temporal distribution of fronts [20,21]. Some studies have analyzed the atmospheric and oceanic driving factors of the front [22,23,24]. In recent years, many global daily or weekly frequency SST products are being delivered on the internet for free and can easily be used for the detection of SST fronts.
In the early 20th century, some researchers noticed the SST fronts in OC and focused on the spatial and temporal distribution of the fronts. Hickox et al. [25] identified ten fronts in the China Sea. Ping et al. [12] also discovered a new front in the Bohai Sea, which they named the Liaodong Bay, Bohai Bay, and Laizhou Bay front. In addition, some researchers studied the variety and dynamics of fronts in OC. Liu and Hou found that the Kuroshio Front in the East China Sea exists between the Kuroshio and continental shelf waters, and the front disappears in summer because of surface heating [26]. He et al. [27] found a double coastal front system near the Zhejiang and Fujian provinces in the East China Sea. Cao et al. [28] pointed out that the fronts in the East China Sea have obvious seasonal cycles, and they also found that the driving factor of the fronts in the south of Hangzhou Bay along the coast of Zhejiang is river discharge, and the driving factor of the fronts near and in the north of Hangzhou Bay is wind. Lin et al. [29] found that there was a continuous double front along the Yellow Sea coast in summer, and further analysis found that the double front model was caused by the topographic slope and tidal mixing. In recent years, some studies have analyzed the distribution of fronts and the pattern of fronts in the South China Sea. For example, some researchers identify and analyze the distribution of fronts in the South China Sea [21,30,31]. Other scholars analyzed the driving factors of the fronts in the South China Sea [32].
These studies were very important for us to study SST fronts in OC. However, previous studies mainly focus on the distribution of fronts in various relatively smaller sea areas with relatively short periods, such as the Bohai Sea and the East China Sea with time series of no more than 20 years. In the paper, interannual, monthly, and seasonal variability of SST fronts in OC were studied with time series of more than 40 years (1982–2021), and some new SST fronts were discovered and named (e.g., Yellow Sea Ring Front, Liaodong Bay Front, and Bohai-Laizhou Bay Front). At the same time, this paper also summarized the high-frequency, medium-frequency, and low-frequency fronts in different months, different seasons, and different years. Finally, the change in fronts in the Bohai Sea and the front pattern of the Yellow Sea Ring Front were analyzed. The results of the paper can be used for further studying ecosystem variations, fish distribution, and other climate factors.
2. Materials and Methods
2.1. Study Area and Location of SST Fronts
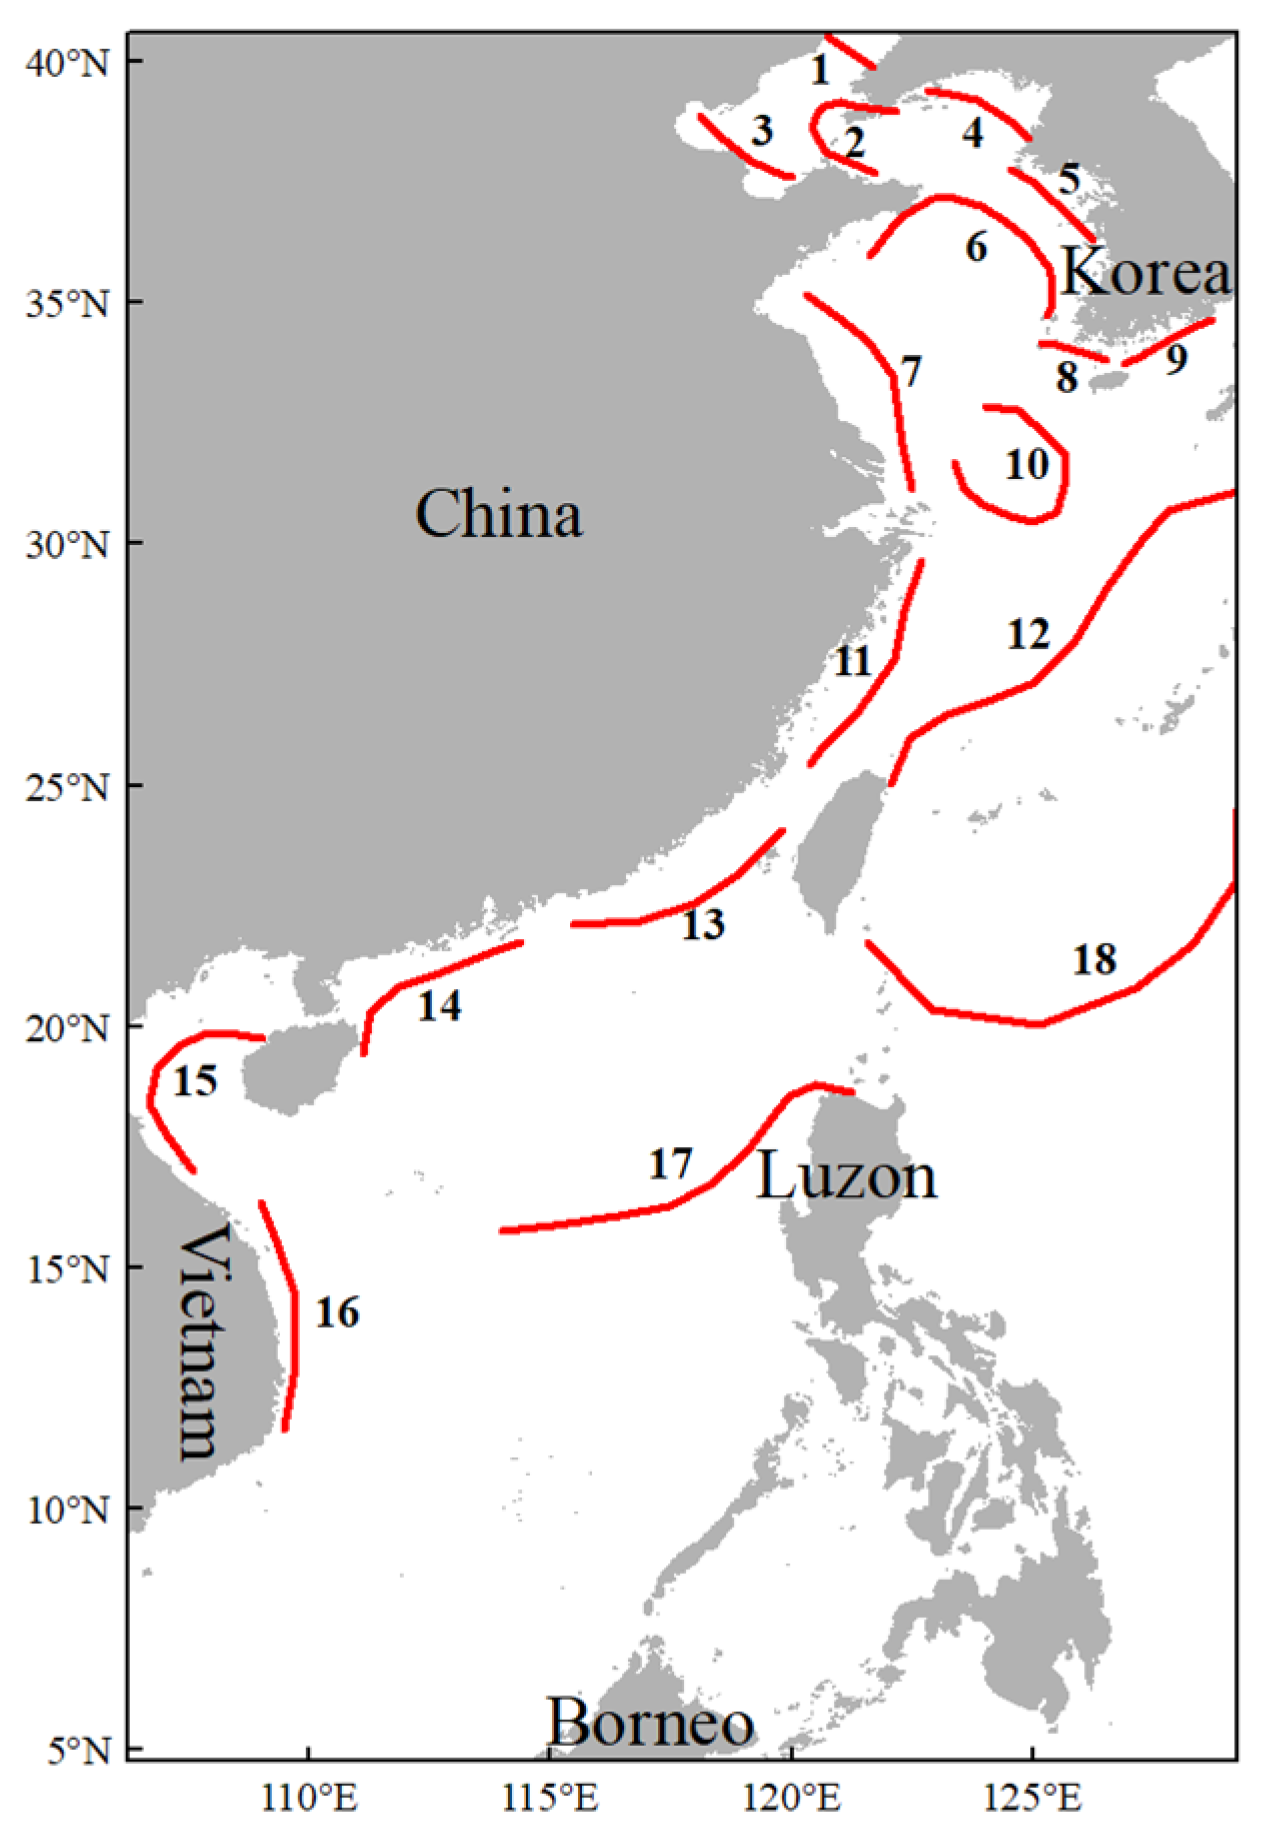
OC is from 0° to 41° N latitude and 105° to 130° E longitude. It includes the Bohai Sea (BS), Yellow Sea (YS), East China Sea (ECS), South China Sea (SCS), and part of the Pacific Ocean east of Taiwan province, China (POET). Figure 1 shows the positions of the 18 SST fronts detected in this paper. The Yellow Sea Ring Front (YSRF), Vietnam Front (VF), and Pacific Ocean east of Taiwan Front (POETF) are named by the authors. The names of these fronts (e.g., Bohai Front (BHF), Seohan Bay Front (SBF), Kyunggi Bay Front (KBF), Jiangsu Front (JSF), Western Chejudo Front (WCF), Eastern Chejudo Front (ECF), Yangtze Bank Ring Front (YBRF), Zhejiang-Fujian Front (ZFF), Kuroshio Front (KF), South China Coastal Front (SCCF), Bakbo Bay Front (BBF)) are based on previous research [10,12,25]. The Liaodong Bay Front (LDBF), Bohai-Laizhou Bay Front (BLBF), Taiwan Strait Front (TWST), and Luzon Front (LF) have had their names changed in reference to previous studies [10,12].
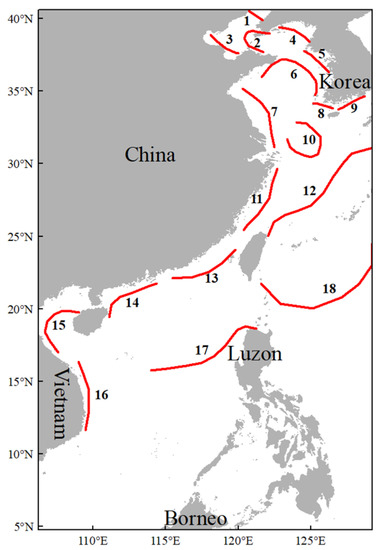
Figure 1.
SST fronts in OC. The red line indicates the approximate position of the center line of the fronts. The names of fronts are: 1. Liaodong Bay Front (LDBF); 2. Bohai Front (BHF); 3. Bohai-Laizhou Bay Front (BLBF); 4. Seohan Bay Front (SBF); 5. Kyunggi Bay Front (KBF); 6. Yellow Sea Ring Front (YSRF); 7. Jiangsu Front (JSF); 8. Western Chejudo Front (WCF); 9. Eastern Chejudo Front (ECF); 10. Yangtze Bank Ring Front (YBRF); 11. Zhejiang-Fujian Front (ZFF); 12. Kuroshio Front (KF); 13. Taiwan Strait Front (TWSF); 14. South China Coastal Front (SCCF); 15. Bakbo Bay Front (BBF); 16. Vietnam Front (VF); 17. Luzon Front (LF); 18. Pacific Ocean east Of Taiwan Front (POETF).
These 18 fronts are distributed in different sea areas. The LDBF, BHF, and BLBF are in the BS. The SBF, KBF, YSRF, JSF, WCF, ECF, and YBRF are in the YS. The YS had the most fronts compared to the other three sea areas. These fronts were distributed along the coasts of the Chinese mainland and the Korean Peninsula. The KF and ZFF are in the ECS. The former extended from the northeast of the Chinese Taiwan Island to the south of the Japan archipelago, whereas the latter was distributed along the coast of the Chinese mainland. The TWSF, SCCF, BBF, VF, and LF are in the SCS. The POETF is in the POET.
2.2. SST Data
This study utilized Daily Optimum Interpolation Sea Surface Temperature (DOISST) data from 1982 to 2021. These data products were obtained from the National Oceanic and Atmospheric Administration (NOAA) DOISST, version 2.1 datasets. In this version, the spatial grid resolution was 0.25° × 0.25° and the temporal resolution was 1 day [33,34].
A long-term Climate Data Record, the NOAA 1/4°DOISST, combines measurements from many platforms (satellites, ships, buoys, and Argo floats) into a regular worldwide grid. To build a geographically accurate map of sea surface temperature, the information is interpolated to fill in any blank spaces in the grid. In order to account for platform differences and sensor biases, satellite and ship data are compared to buoys [34].
2.3. Frontal Detection Algorithm
This study used the Cayula and Cornillon single image edge detection (CCA-SIED) algorithm [16] to detect SST fronts. The CCA could detect not only strong but also weak fronts using the histogram approach [25]. This feature allowed us to analyze the variability of SST fronts in the paper. The CCA worked at three levels: picture, window, and local pixel. The first step was to detect and remove clouds at the picture level, followed by segmenting the image into overlapping windows. Second, at the window level, the possible front is mostly determined by analyzing the SST statistical histogram in each window. Finally, the contours are extracted at the local level using the region-based algorithm [16,35]. The DOISST data products used in this paper are not cloud-influenced. Therefore, cloud detection and cloud removal are not required.
The CCA algorithm is included in the Marine Geospatial Ecology Tools (MGET) [36]. The MGET was developed by Duke University’s Marine Geospatial Ecology Laboratory. This tool can be downloaded from the Duke University website for free [36]. This tool, as an ArcGIS extension toolbox, could batch-process DOISST data. In this study, the front detection tool was applied to each of the 14610 DOISST images in the 40-year sequence.
2.4. Parameter Used for Describing Fronts
The frontal probability (FP) is given by F:
F = (N/C) × 100%
In Equation (1), N indicates the number of images in which a pixel was detected as a front and C indicates the number of images in which the same pixel was cloud-free in the same interval [1,21,25]. In the front raster data calculated by the CCA-SIED algorithm, the pixels identified as fronts are assigned a value of 1, and the pixels that are not fronts are assigned a value of 0. Based on these frontal data for each day in the OC region from 1982 to 2021, the FP for every year, every month, and every season was calculated. The annual FP calculation takes 1982 as an example, superimposes the front raster data of every day in 1982, and then divides the data obtained by the superposition calculation by the total number of days in the year (365 days in 1982), finally obtaining the FP value for 1982. The monthly FP calculation takes January as an example. The front raster data of all January fronts from 1982 to 2021 are superimposed and then divided by the total number of days (January has 1240 days), finally obtaining the FP value for January. The seasonal FP takes spring as an example, superimposes all the front raster data of April, May, and June from 1982 to 2021, and then divides them by the total number of days (the total number of days in spring in the study period is 3640 days), and finally obtains the FP value in spring. The FP value of a pixel represents the frequency of the pixel being identified as a front during the study period. If the value of the FP is higher, the pixel is more likely to be a high-frequency front. Conversely, when the FP value is low and not equal to 0, the pixel was more likely to be a low-frequency front. For example, when the FP value of a pixel is 100, it indicates that the pixel has frontal information in the whole study period, and the pixel must be a high-frequency front. When the FP value of a pixel is nearly 0, it means that the pixel has little frontal information across the whole study period, and the pixel may be a low-frequency front. This study calculated the FP value of each year from 1982 to 2021, the FP value of climatological months (all the same months in the research interval taken together), and the FP value of climatological seasons. In this paper, the spring climatology included all of April, May, and June; the summer climatology included all of July, August, and September; the autumn climatology included all of October, November, and December; and the winter climatology included all of January, February, and March [25].
After calculating the FP value at different time scales, the OC region was divided into 18 frontal areas according to the annual, monthly, and seasonal distributions of the fronts. Annual FP averages, monthly FP averages, and seasonal FP averages were calculated separately for each frontal area. For example, to calculate the average annual FP, it is necessary to superimpose all the raster data in one frontal area and then divide them by the total raster data to obtain the FP average of the front area.
3. Results
3.1. Monthly Variability of SST Front in OC
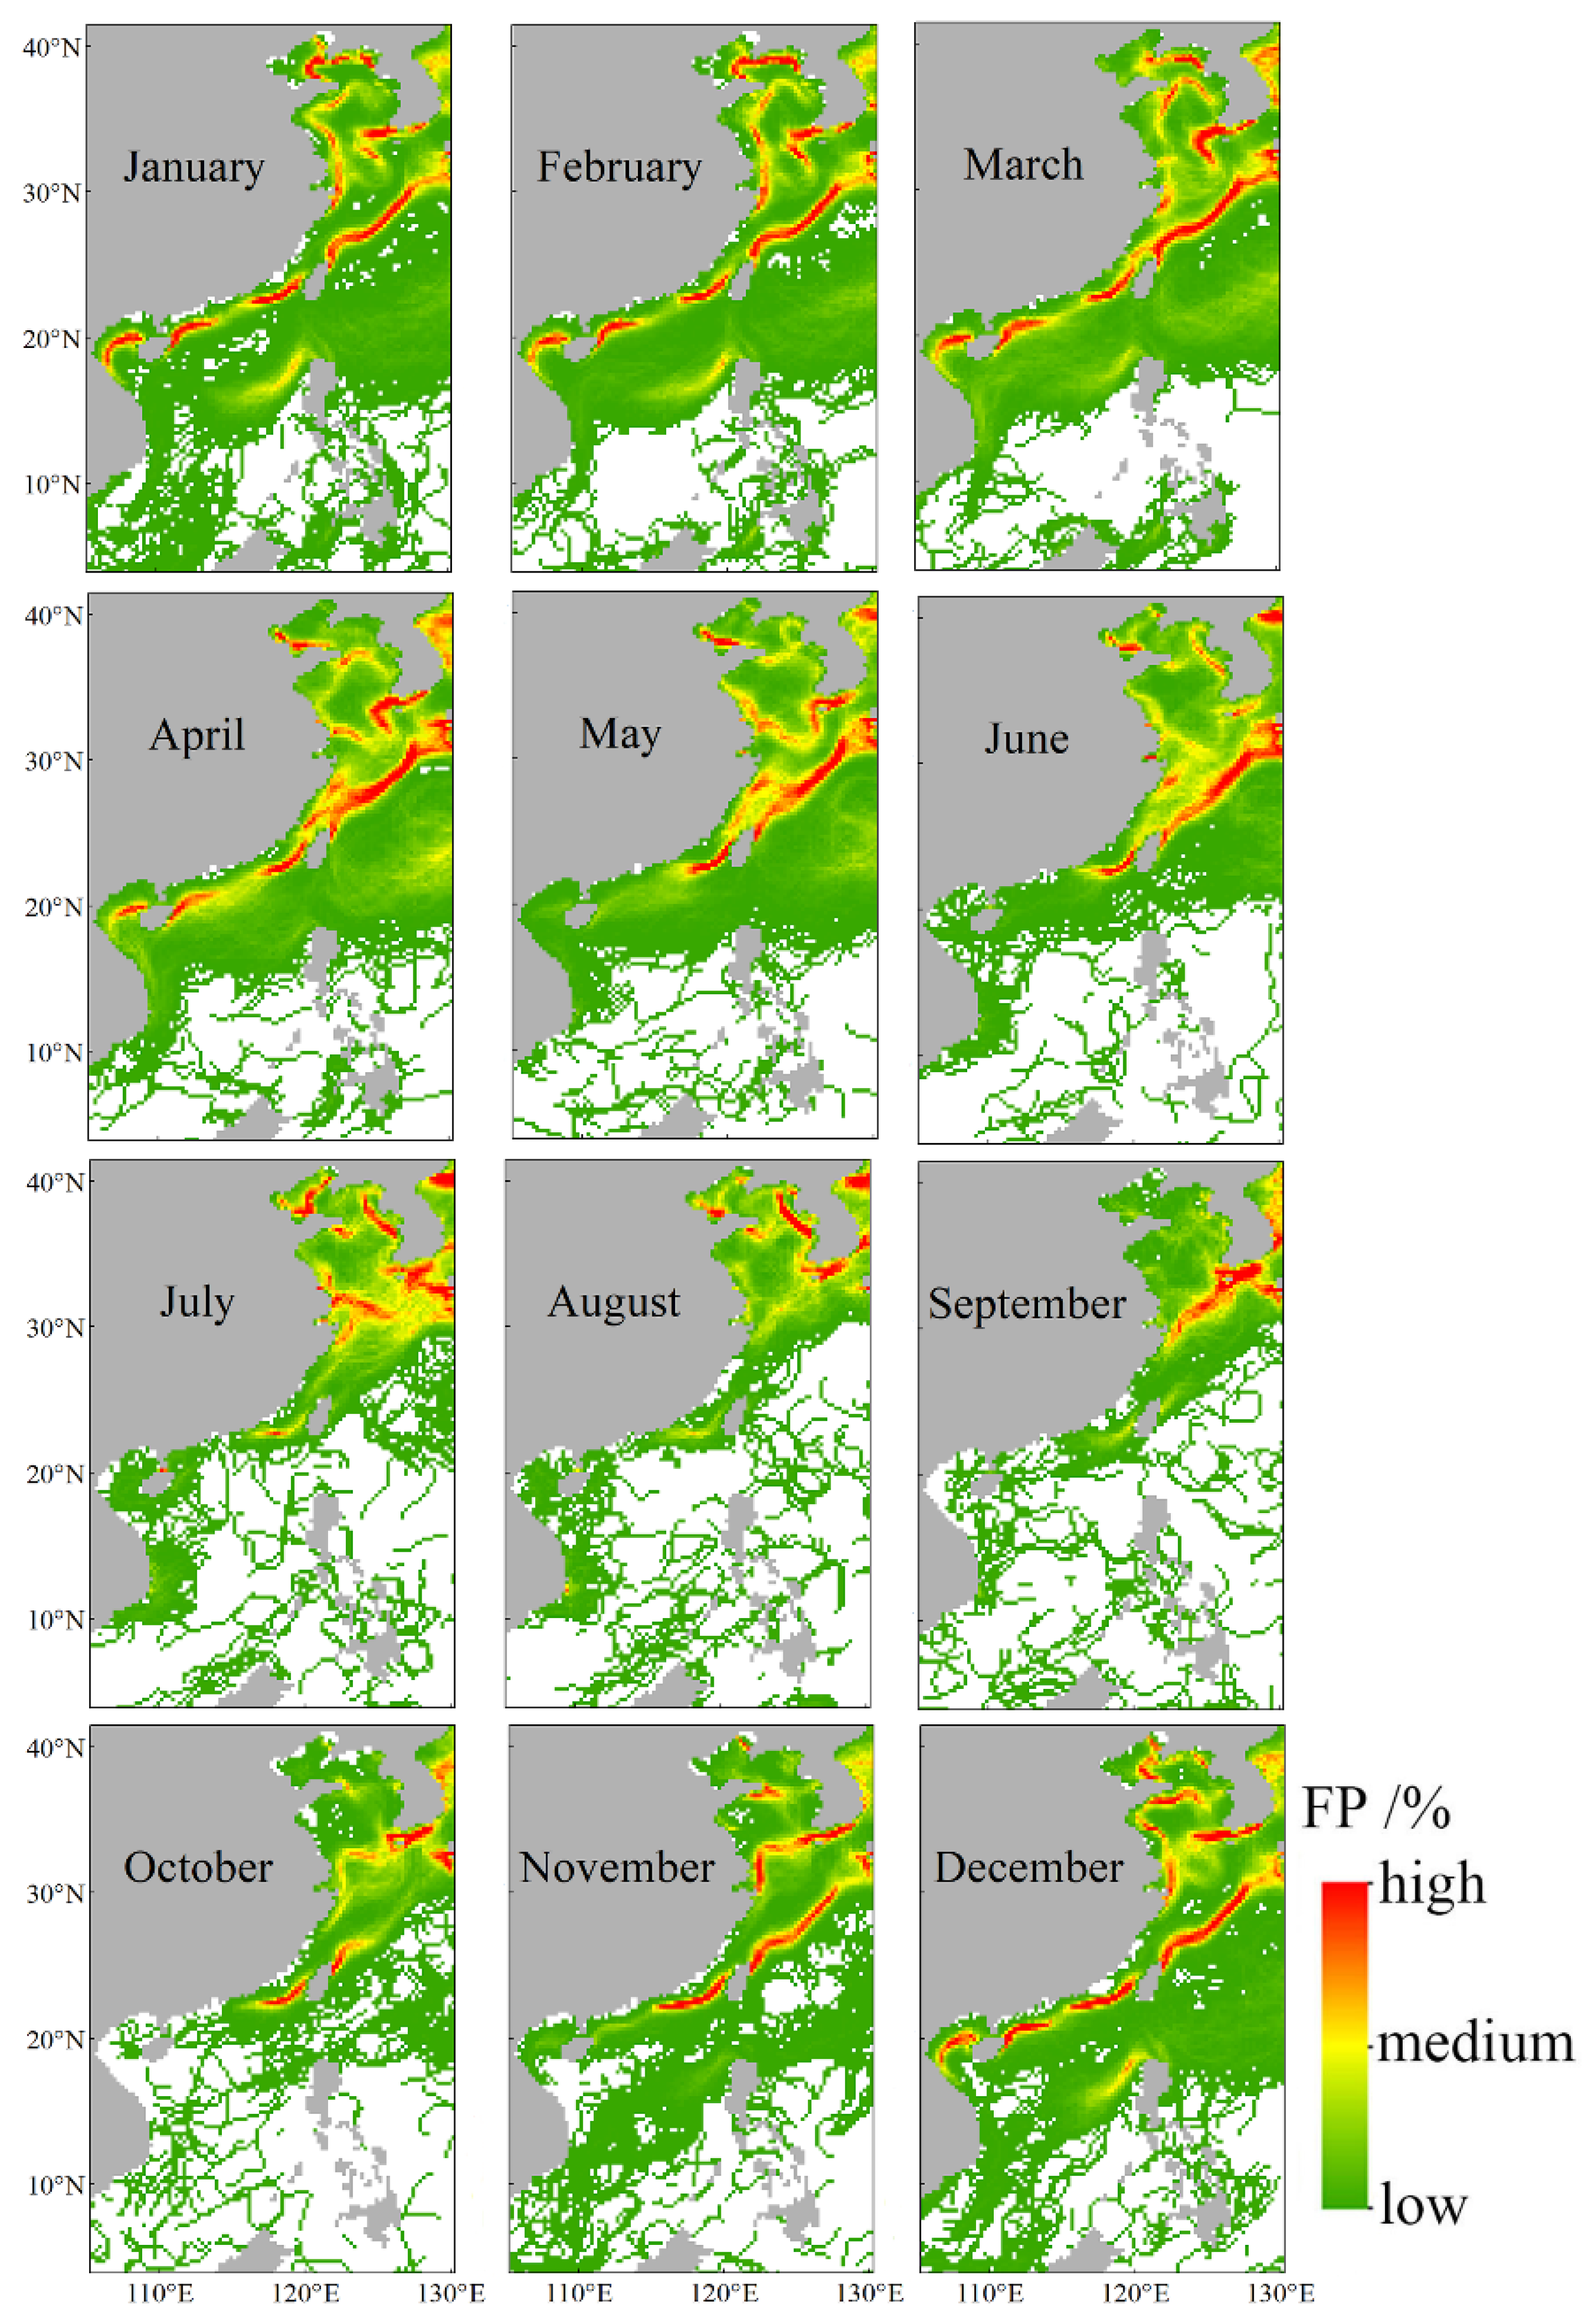
Figure 2 shows the monthly variation in frontal frequency in which the red zone indicates the high-frequency front, the yellow zone indicates the medium-frequency front, and the green zone indicates the low-frequency front. Table 1 summarizes the high-, medium-, and low-frequency fronts for each of the 12 months. The statistical results show that nearly half of the fronts in January–April and December are high-frequency, about one-third are low-frequency, and about one-sixth are medium-frequency. From May to July, the number of high-frequency fronts is roughly the same as the number of low-frequency fronts. From September to November, the frequency of the fronts in the coastal waters of China is dominated by low-frequency fronts, and these fronts account for about two-thirds of the total number of fronts. In addition, the number of high-frequency fronts and medium-frequency fronts each account for one-sixth of the total number of fronts.
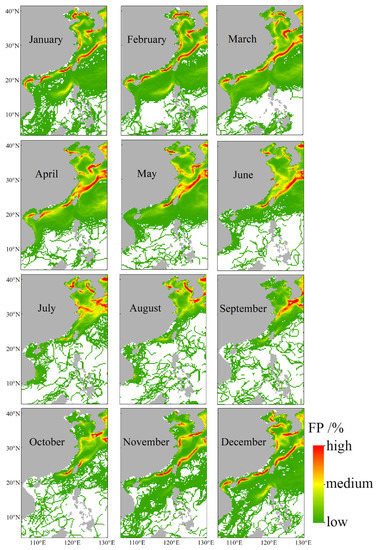
Figure 2.
Monthly frontal probability maps for 1982–2021.

Table 1.
Monthly high-, medium-, and low-frequency fronts.
As shown in Figure 2, the distribution of fronts with frequencies is different in each month. In January–April and December, high-, medium-, and low-frequency fronts appear in the BS, YS, ECS, and SCS. However, the frequency of fronts in these seas is still dominated by high-frequency fronts. From May to June, high-frequency fronts are concentrated in the southern Yellow Sea and the ECS, low-frequency fronts are distributed in the BS and the SCS, and medium-frequency fronts are distributed in the northern part of the YS. In July, high-frequency fronts are distributed in the BS and YS, while the location of medium-frequency and low-frequency fronts are mostly in the ECS and SCS. In August, high-frequency and medium-frequency fronts are mainly distributed in the BS and YS. From September to November, high-frequency and medium-frequency fronts are mainly distributed in the southern Yellow Sea and the ECS.
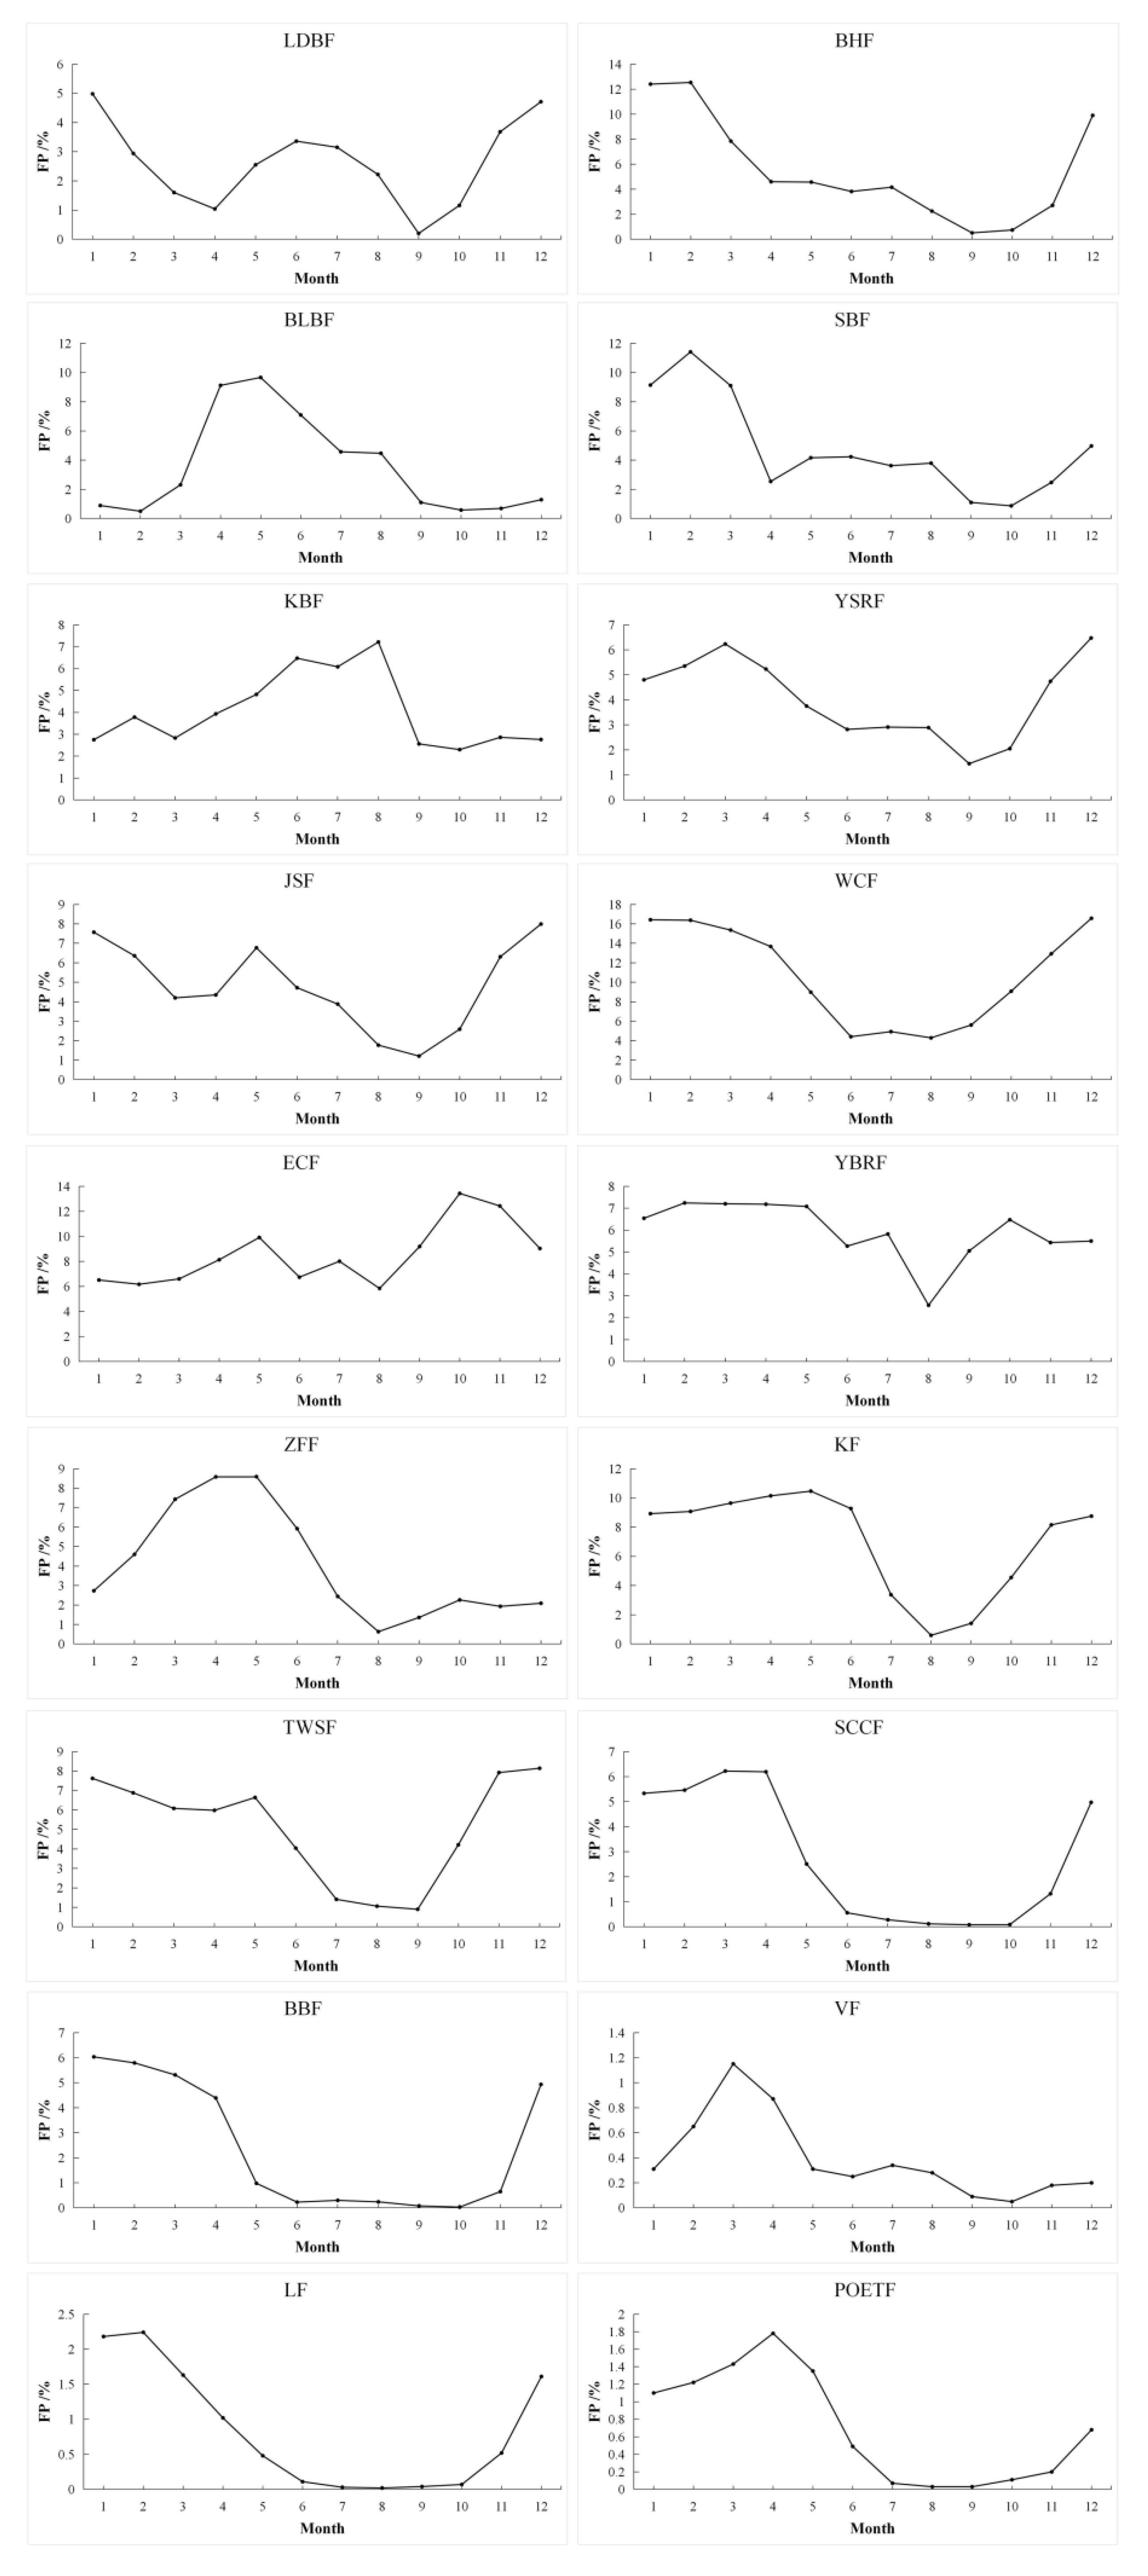
As shown in Figure 3, the frequency of most fronts, including the BHF, BLBF, SBF, YSRF, ZFF, KF, SCCF, LF, VF, and POETF, shows a tendency to initially rise and then decline from January to September, followed by a trend of growing steadily from October to December. There was a decreasing tendency in the frequencies of four fronts, the JSF, WCF, TWSF, and BBF, from January to September, and an increasing trend from October to December. Compared with the changing trends of these four frontal frequencies, the KBF and ECF show opposite changing trends. The fluctuation trend of the LDBF frequency is as follows: first decrease, then rise, then decrease again, and lastly increase again. The frequency of the YBRF is basically maintained at a high-frequency value of about 7% from January to May. Then, from May to August, the frequency of fronts mainly decreases and begins to rise from August to December.
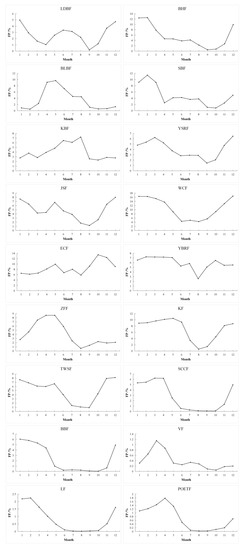
Figure 3.
The line chart of monthly change in frontal frequency in 18 frontal areas.
3.2. Seasonal Variability of SST Front in OC
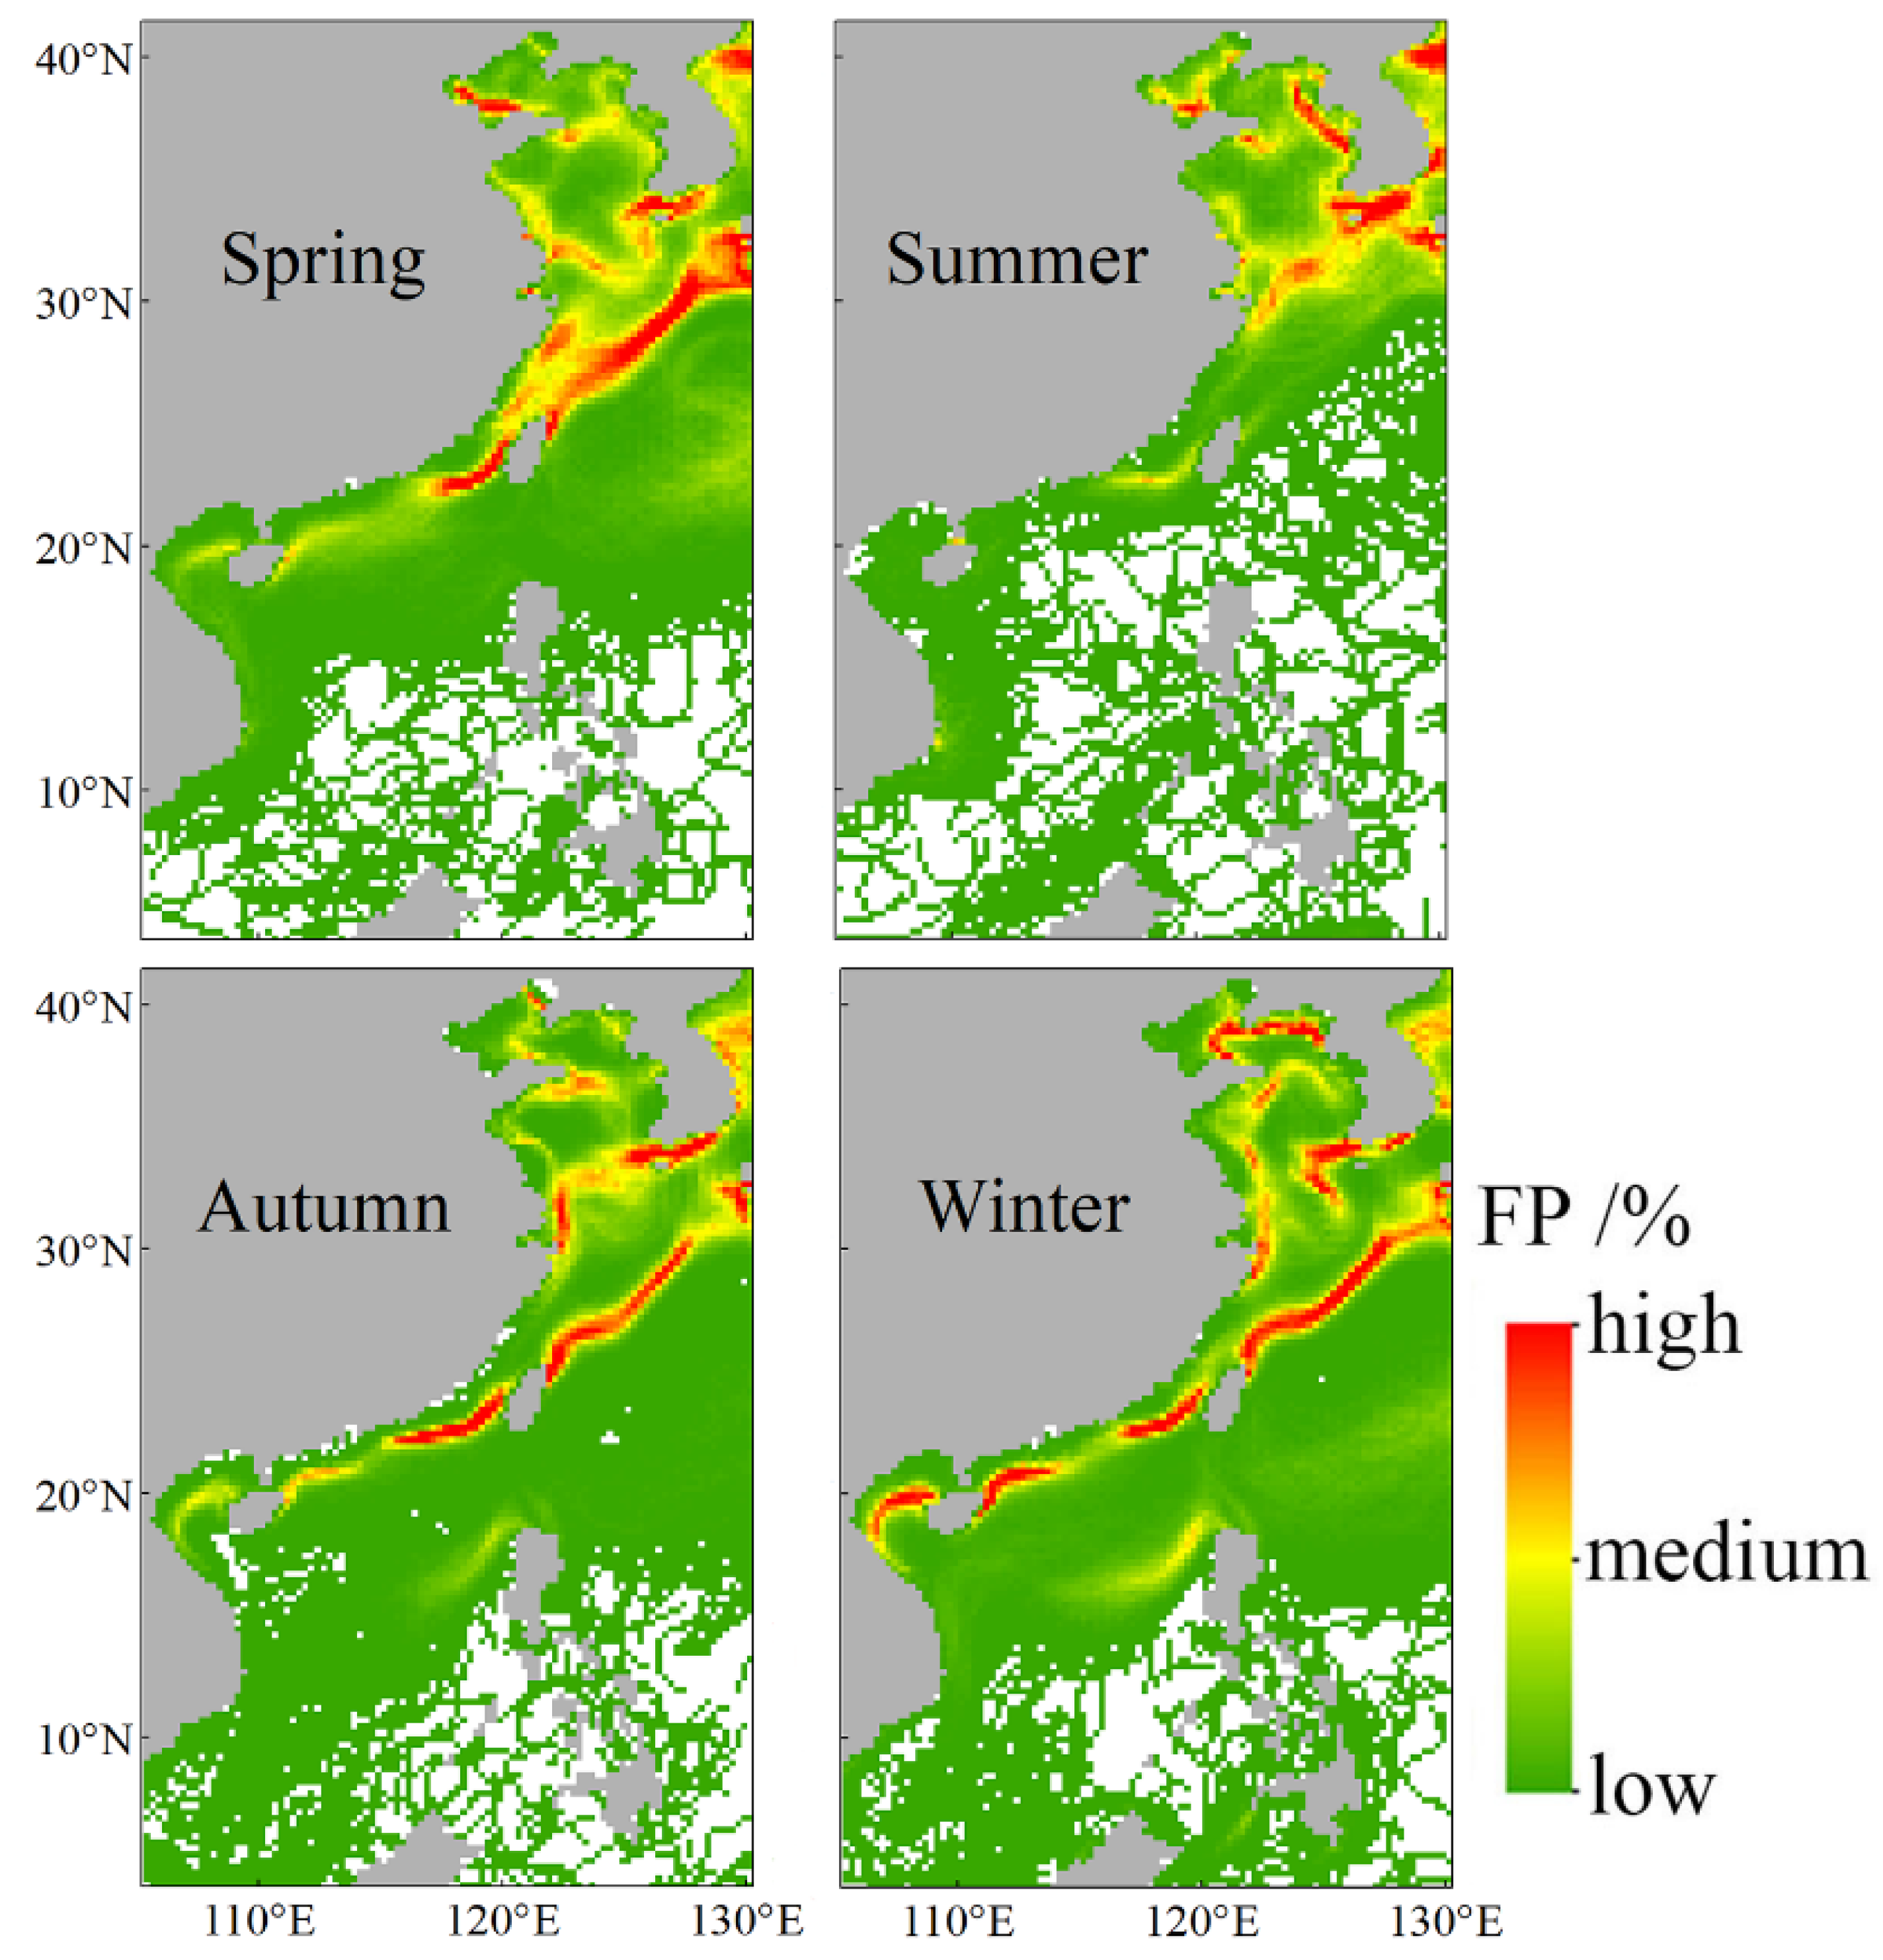
As shown in Figure 4, the frequency of fronts in OC varies in different seasons. Table 2 summarizes the information for high-, medium-, and low-frequency fronts in different seasons. In spring, high-frequency fronts are mainly distributed in the southern Bohai Sea, the southern Yellow Sea, the ECS, and the northeastern part of the SCS. The medium-frequency fronts are mainly distributed in the northern Bohai Sea, the northern Yellow Sea, and the northern South China Sea. Low-frequency fronts are distributed in the central Bohai Sea and the southern South China Sea. In summer, high-frequency fronts are mainly distributed along the coast of the Korean Peninsula in the YS. The YS near the coast of China and the BS are medium-frequency frontal zones in summer. The low-frequency fronts are mainly distributed in the ECS and the SCS in summer. In autumn, the high-frequency fronts and the medium-frequency fronts are mainly distributed in the BS, the YS, and the northern part of the SCS. In winter, most of the fronts belong to high-frequency and medium-frequency fronts, and only five fronts are low-frequency fronts.
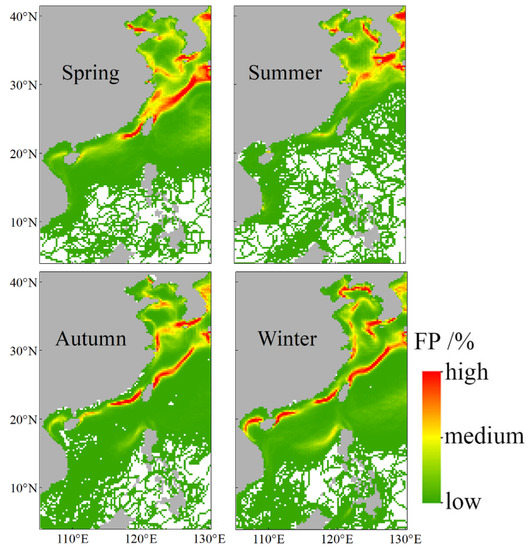
Figure 4.
Seasonal frontal probability maps for 1982–2021.

Table 2.
Seasonal high-, medium-, and low-frequency fronts.
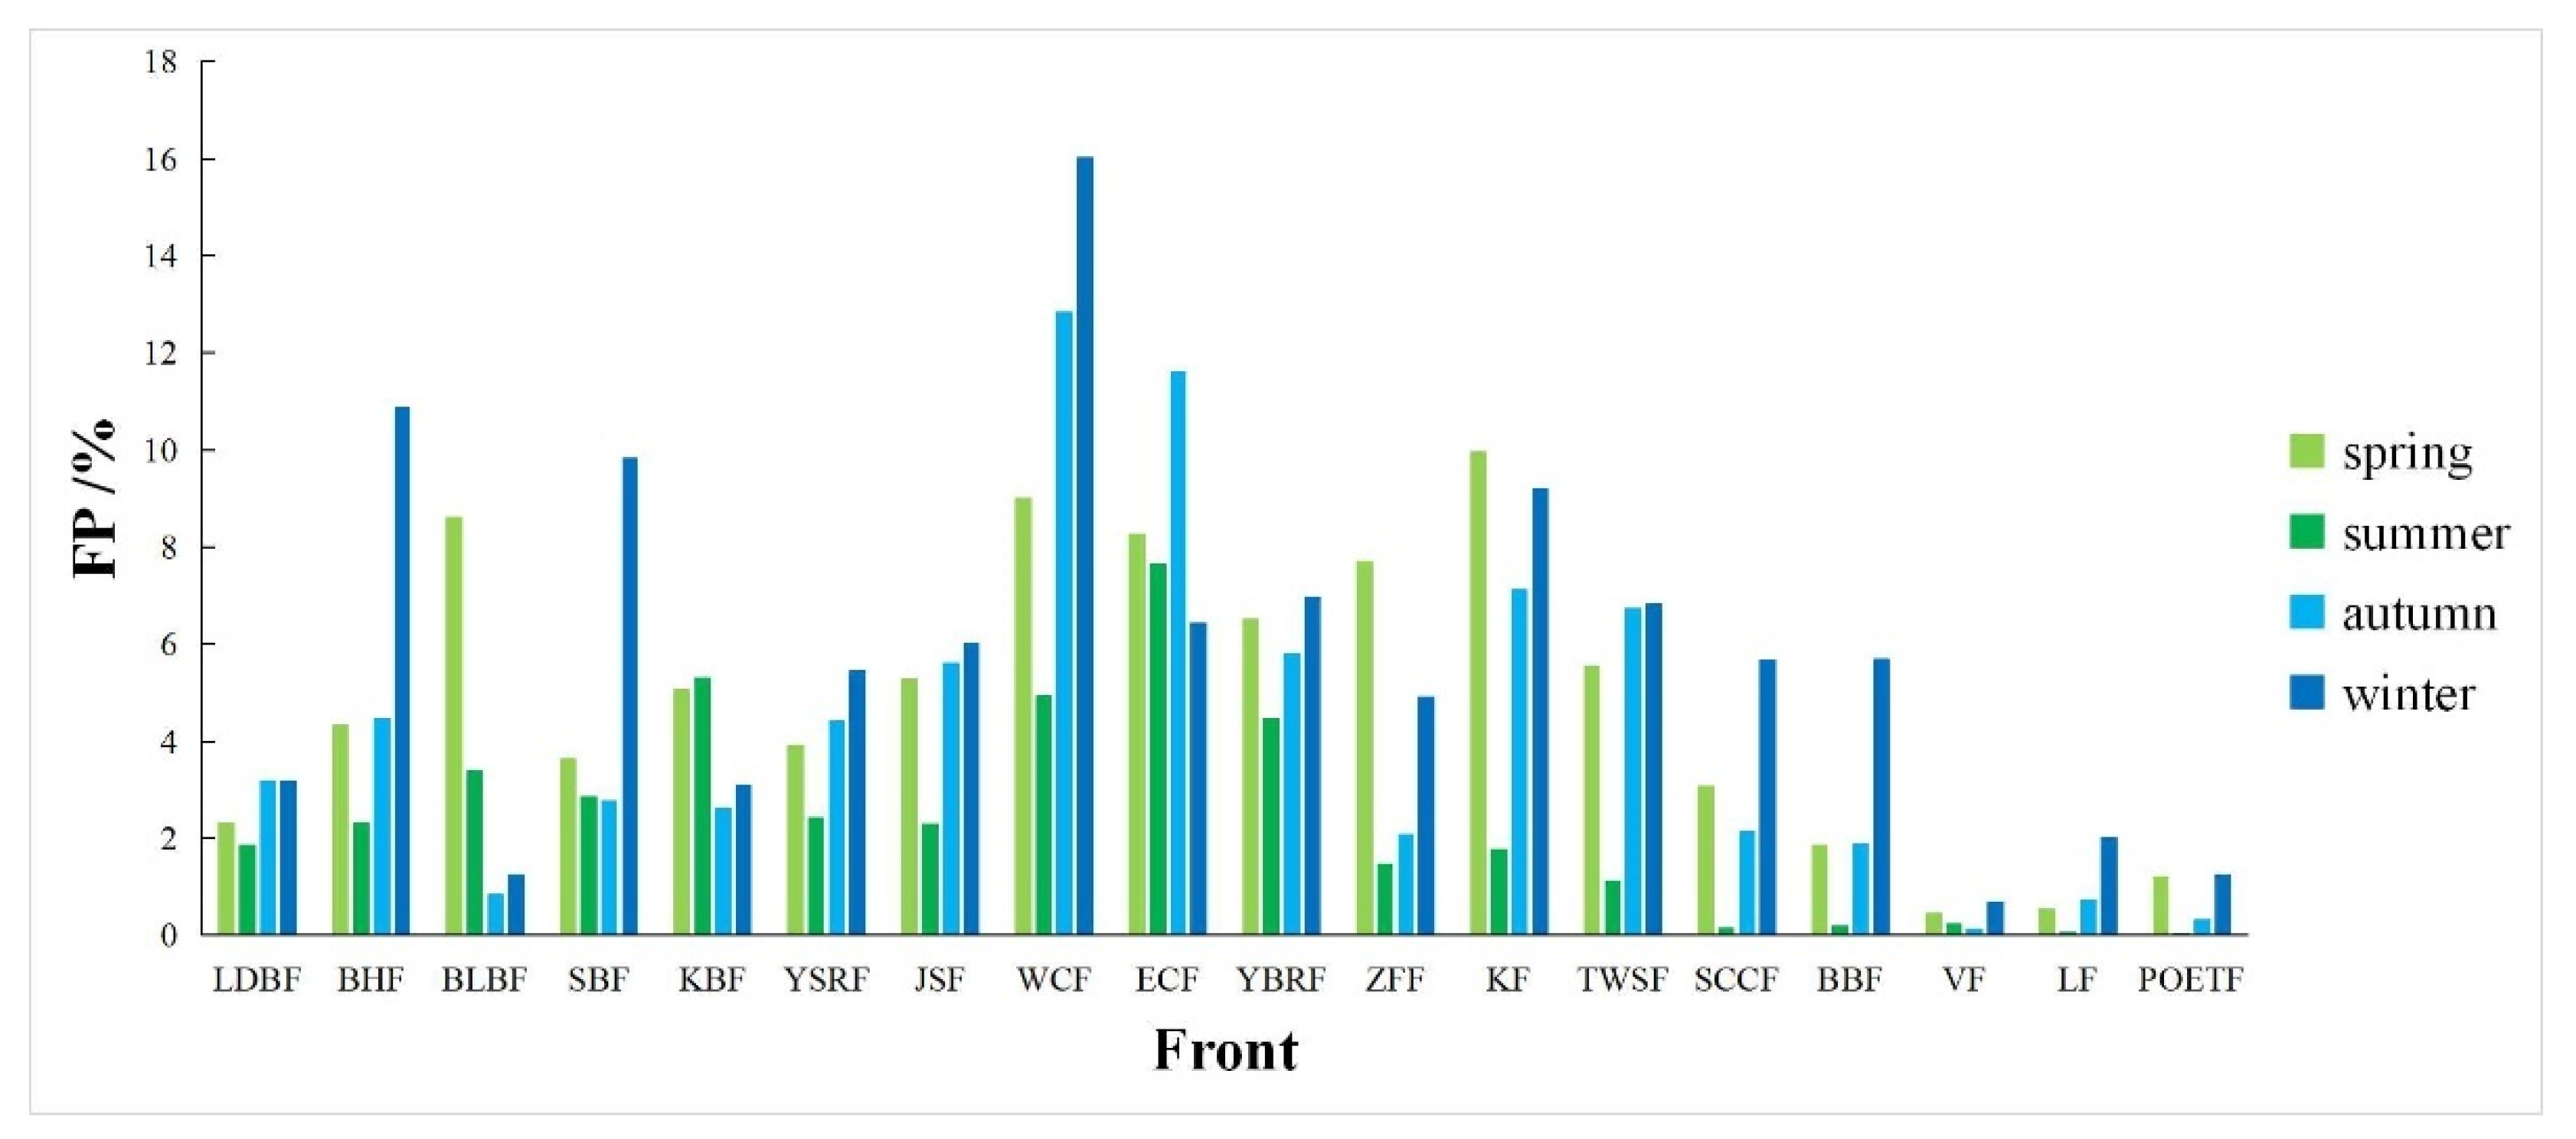
Figure 5 shows the seasonal variation in each front. The results show that the frequency of most fronts is highest in winter and lowest in summer. In spring and autumn, the frequency is lower than in winter and higher than in summer. However, the BLBF and KBF are different. These two fronts occur with a high frequency in spring and summer, and with a low frequency in autumn and winter. The season with the highest frequency of the ZFF and KF is spring. According to the analysis of the sea area where the fronts are located, it is found that fronts in the YS appear more frequently, followed by fronts in the BS and the ECS. Fronts in the SCS appear more often in winter, but they are still less frequent than in the other three seas.
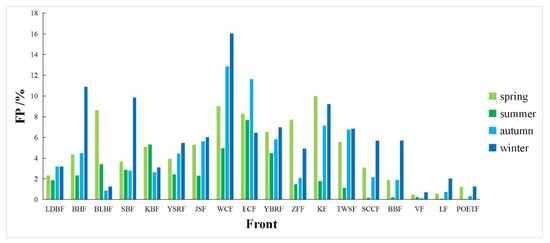
Figure 5.
Histogram of frontal frequency of 18 fronts in different seasons.
3.3. Interannual Variability of SST Front in OC
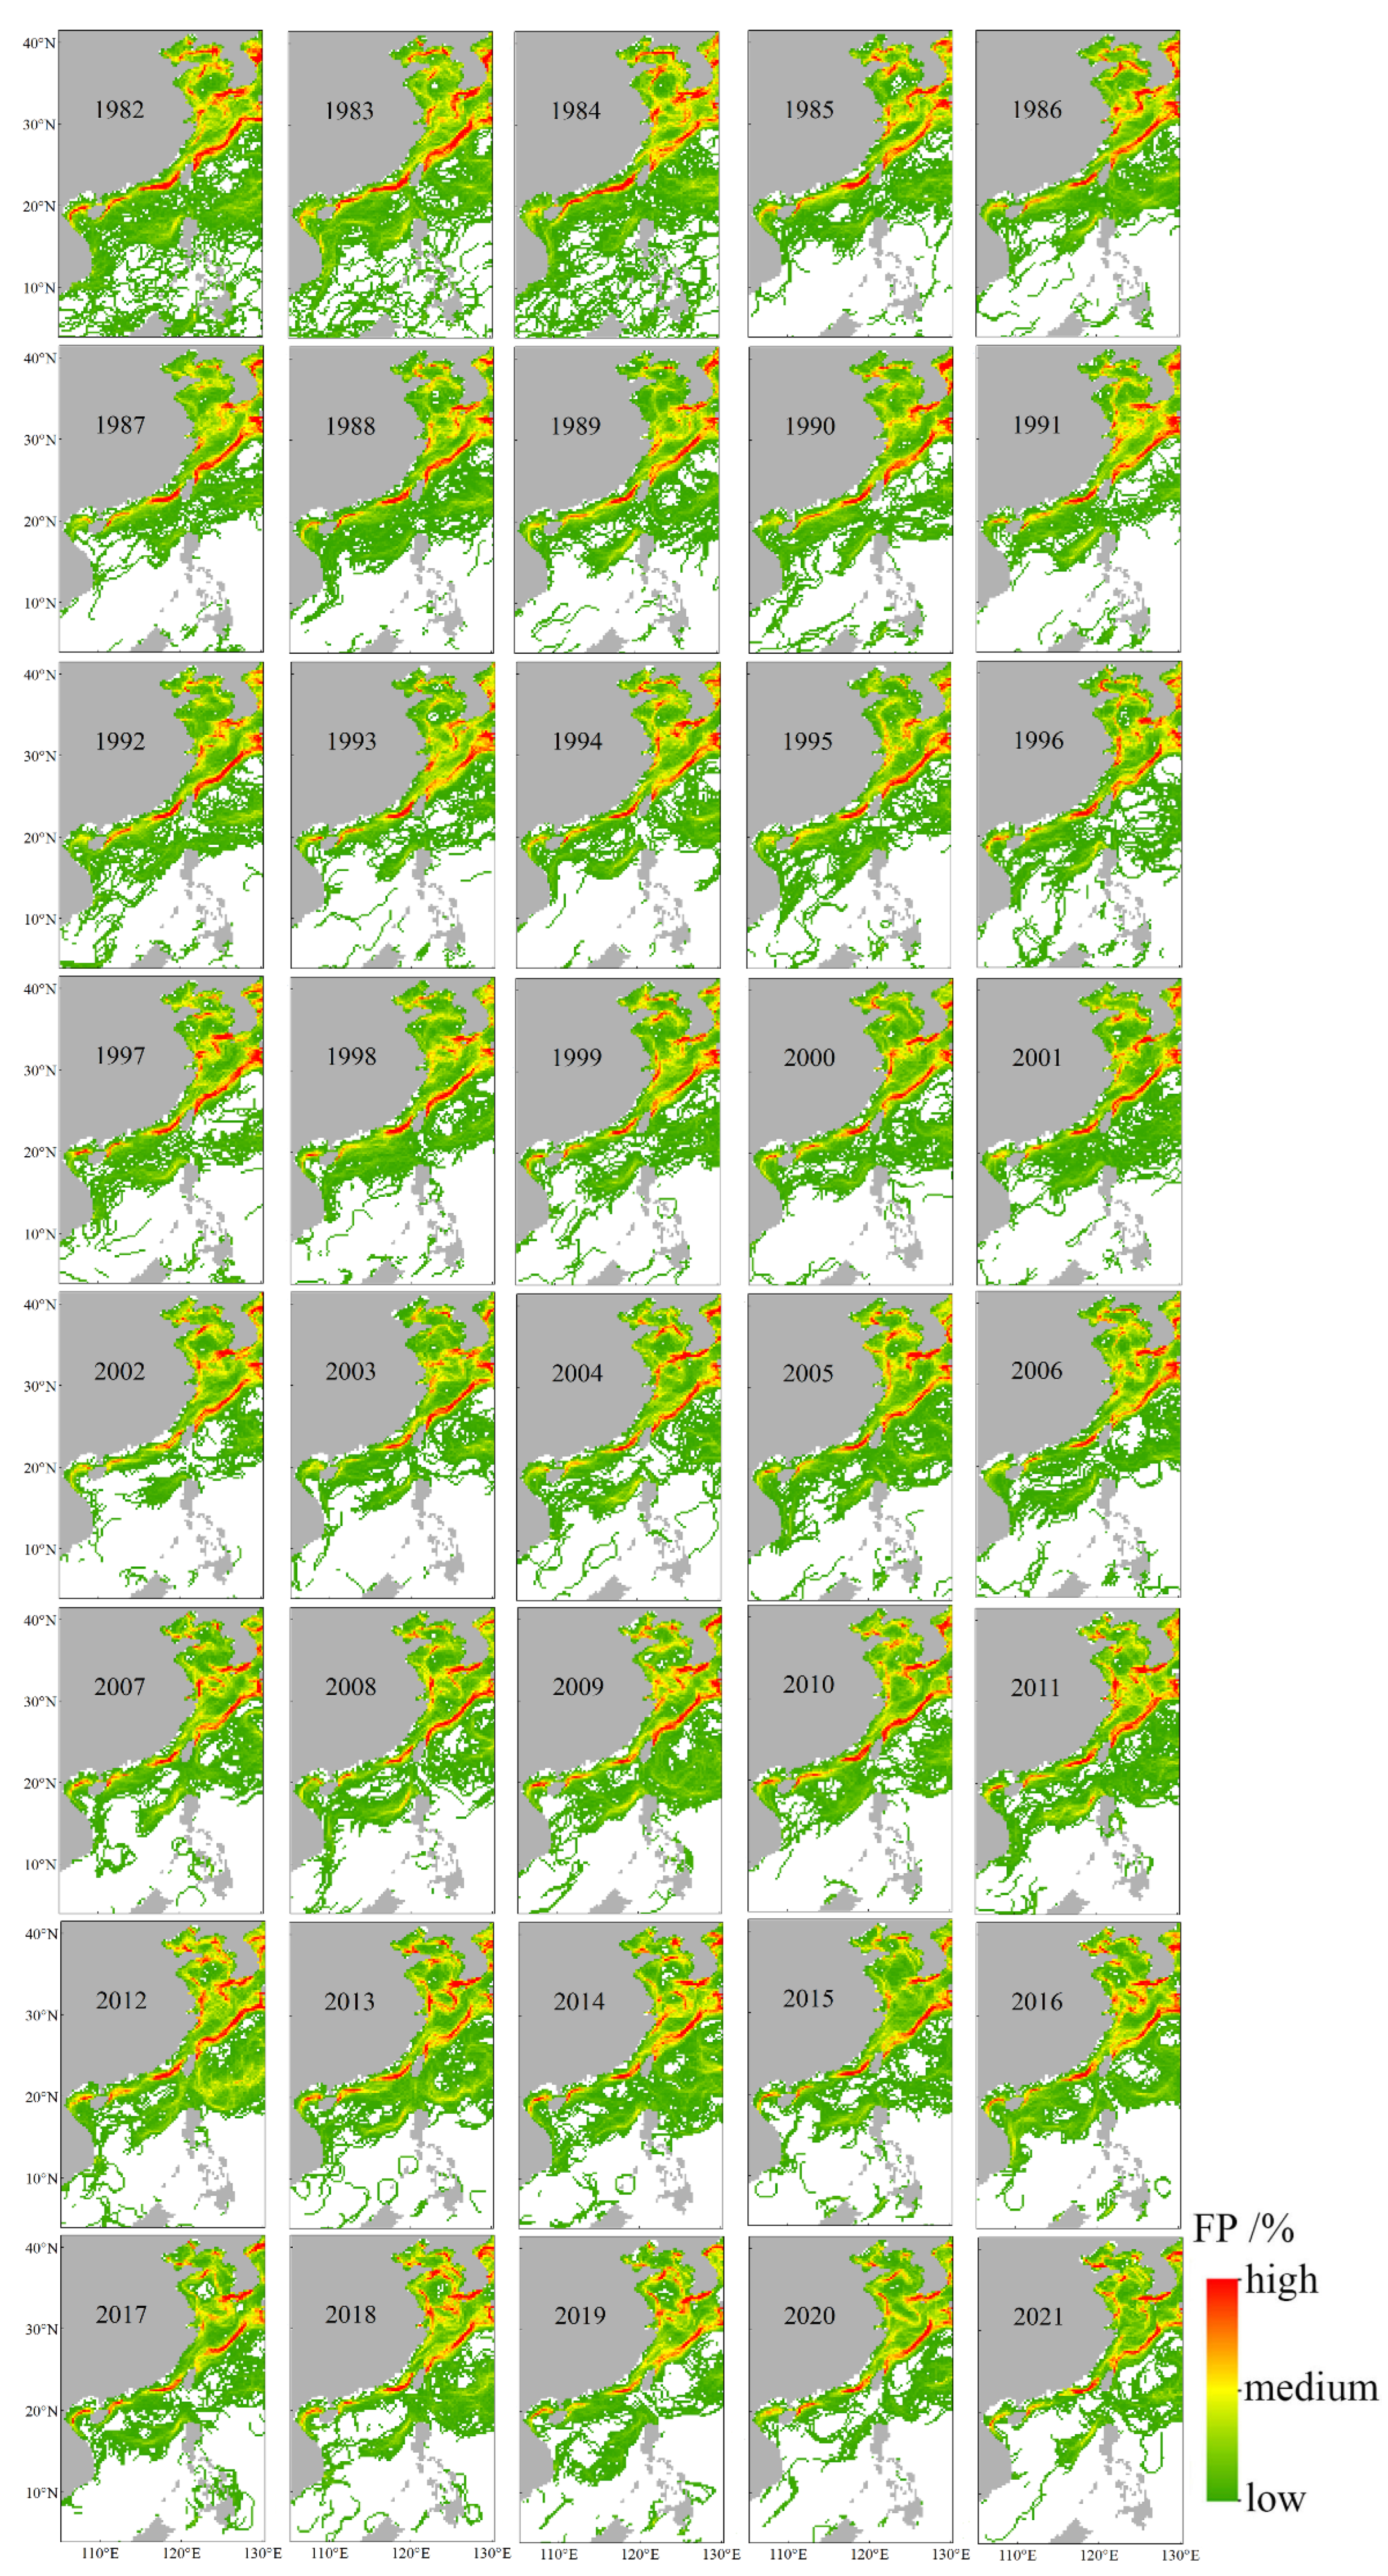
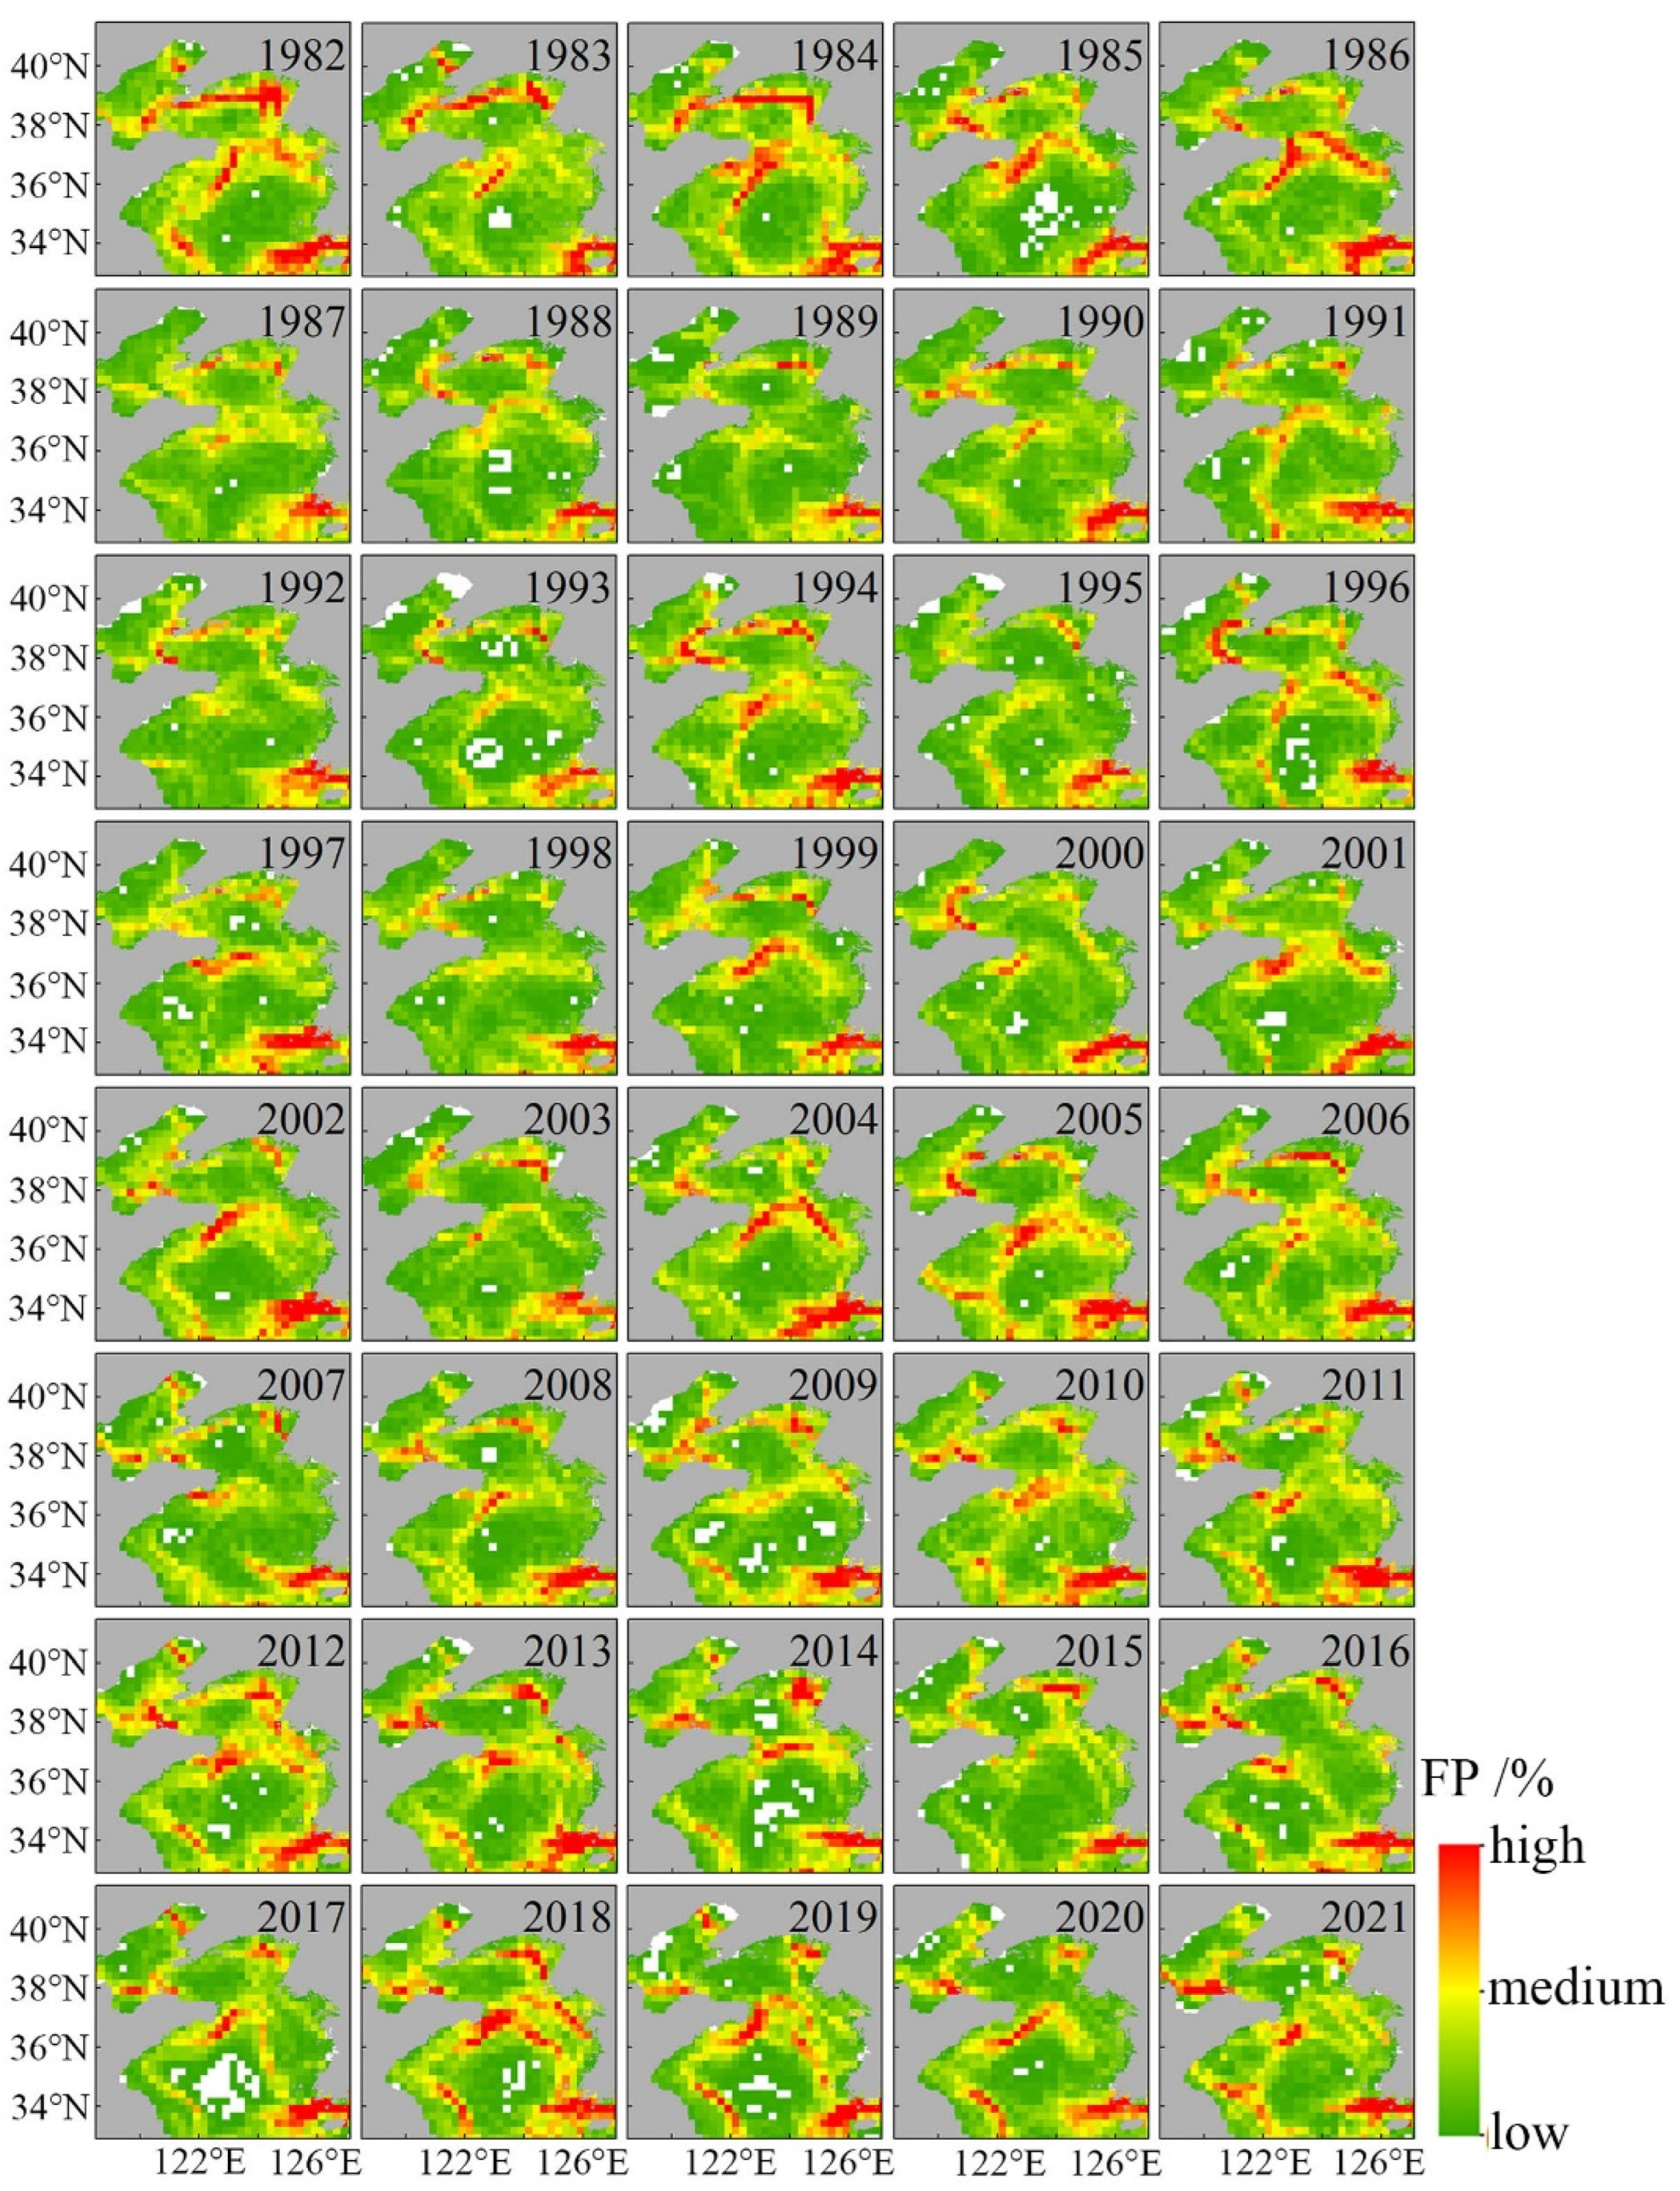
Figure 6 shows the FP value for each year from 1982 to 2021. Based on the average value of FP of each front in each year, the total average value of FP of each front is calculated and the results are shown in the last line of Table 3. According to the total average value of FP, the frontal frequency is divided into three grades which are low (<3%), medium (3–6%), and high (>7%). The results showed that there are three high-frequency fronts, which are the WCF (10.69%), ECF (8.51%), and KF (7.01%). Nine medium-frequency fronts, which are the YBRF (5.94%), BHF (5.48%), TWSF (5.06%), JSF (4.80%), SBF (4.76%), YSRF (4.05%), ZFF (4.04%), KBF (4.03%), and BLBF (3.54%). Six low-frequency fronts, which are the SCCF (2.75%), LDBF (2.64%), BBF (2.40%), LF (0.82%), POETF (0.70%), and VF (0.39%).
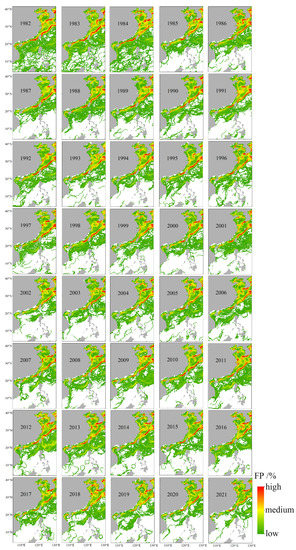
Figure 6.
Interannual frontal probability maps for 1982–2021.

Table 3.
The mean FP value of each frontal area and the frequency of each front.
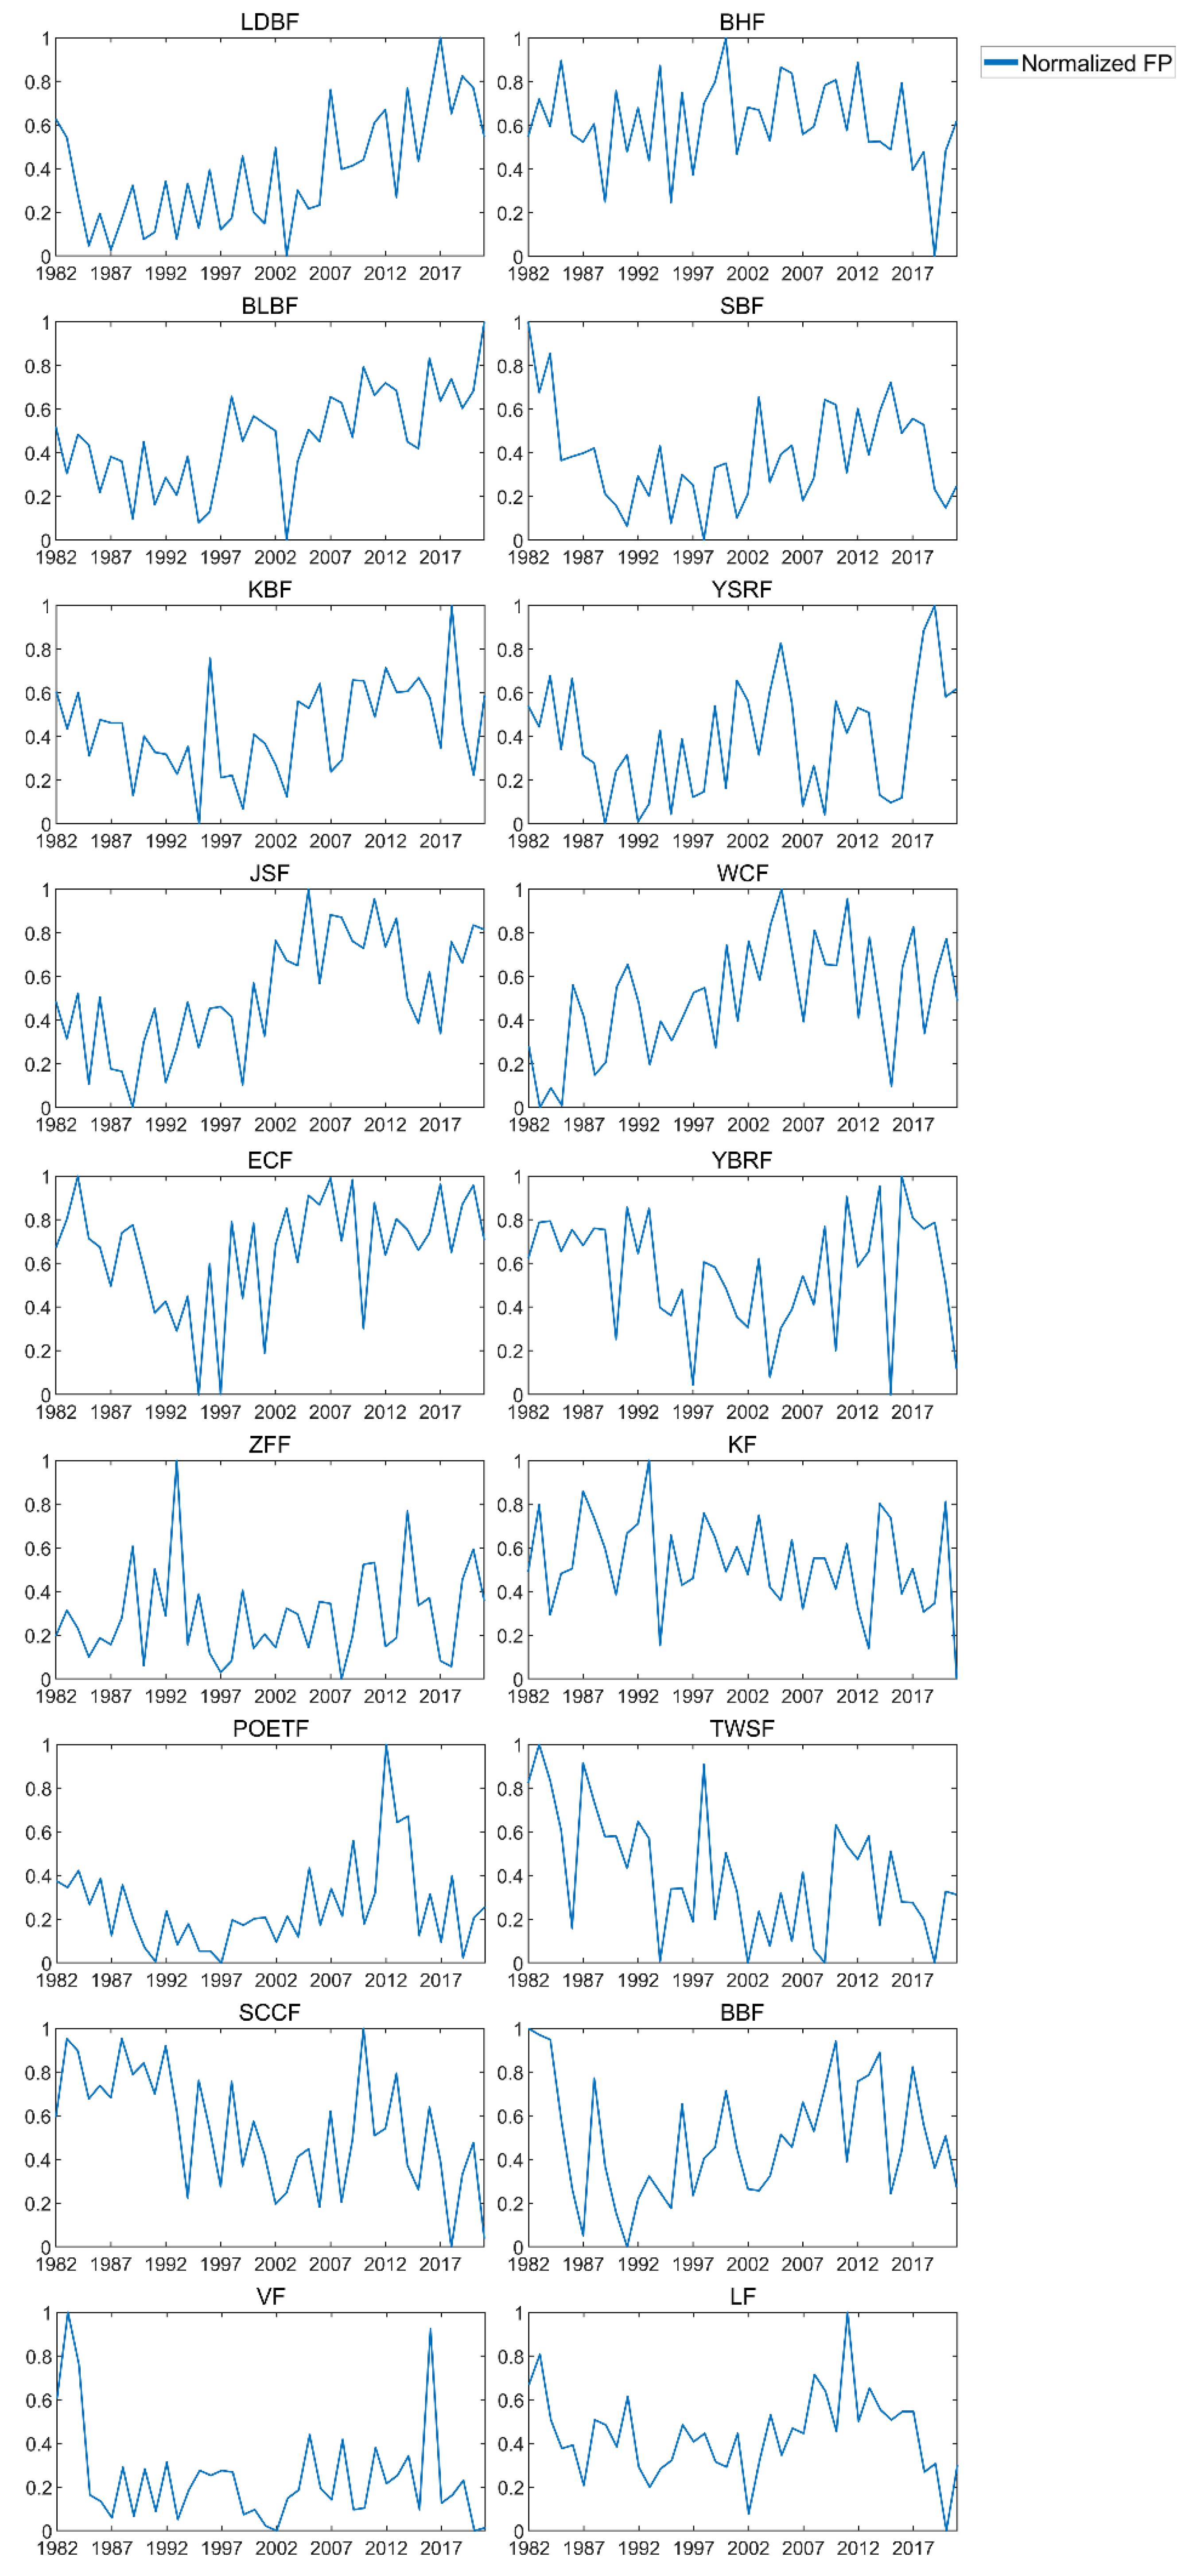
In order to analyze the long-term change trends of the 18 frontal regions, we calculated the average FP value of each frontal region and performed normalization processing. The results are shown in Figure 7. According to the annual trend of the normalized FP value of each front, we found that fronts may be divided into three categories. The first type of front has a mainly upward trend, and the fronts belonging to this type are: LDBF, BLBF, JSF, WCF, KBF, YSRF, ECF, ZFF, POETF, and BBF. Among them, the fluctuation range of the front frequency of the LDBF, BLBF, JSF, WCF, KBF, ECF, and POETF after 2002 is higher than that before 2002. From 1996 to 2006, the frequency of the YSRF was dominated by an upward trend. From 2006 to 2016, the volatility trend on this front first decreased, then increased, and then decreased again. However, following 2016, the volatility trend of the YSRF increased once more. The upward trend of the fluctuations of the two fronts ZFF and BBF is gentler than that of the eight fronts mentioned above. The second type of front has a mainly downward trend, and the fronts belonging to this type are: TWSF, SCCF, BHF, YBRF, KF, and SBF. In comparison to the other three fronts, the lowering tendency of the frequency fluctuation of the TWSF and SCCF is more pronounced. After 2013, the downward trend in the frontal fluctuation of the BHF is more obvious. The YBRF fluctuated greatly after 1997. The downward trend in the KF volatility is moderate. The variability of the SBF was mostly characterized by a declining tendency between 1982 and 1991. After 1991, the volatility was dominated by a slow upward trend. The third type of front has neither an obvious upward trend nor a significant downward trend. There are two main types of fronts: VF and LF.
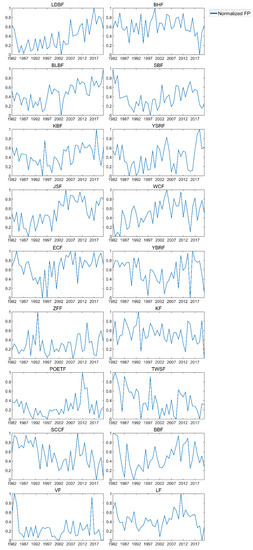
Figure 7.
Line chart of long-term changes in 18 frontal regions (the blue line indicates the interannual variation trend of the frontal normalized FP value).
4. Discussion
4.1. Fronts in the Bohai
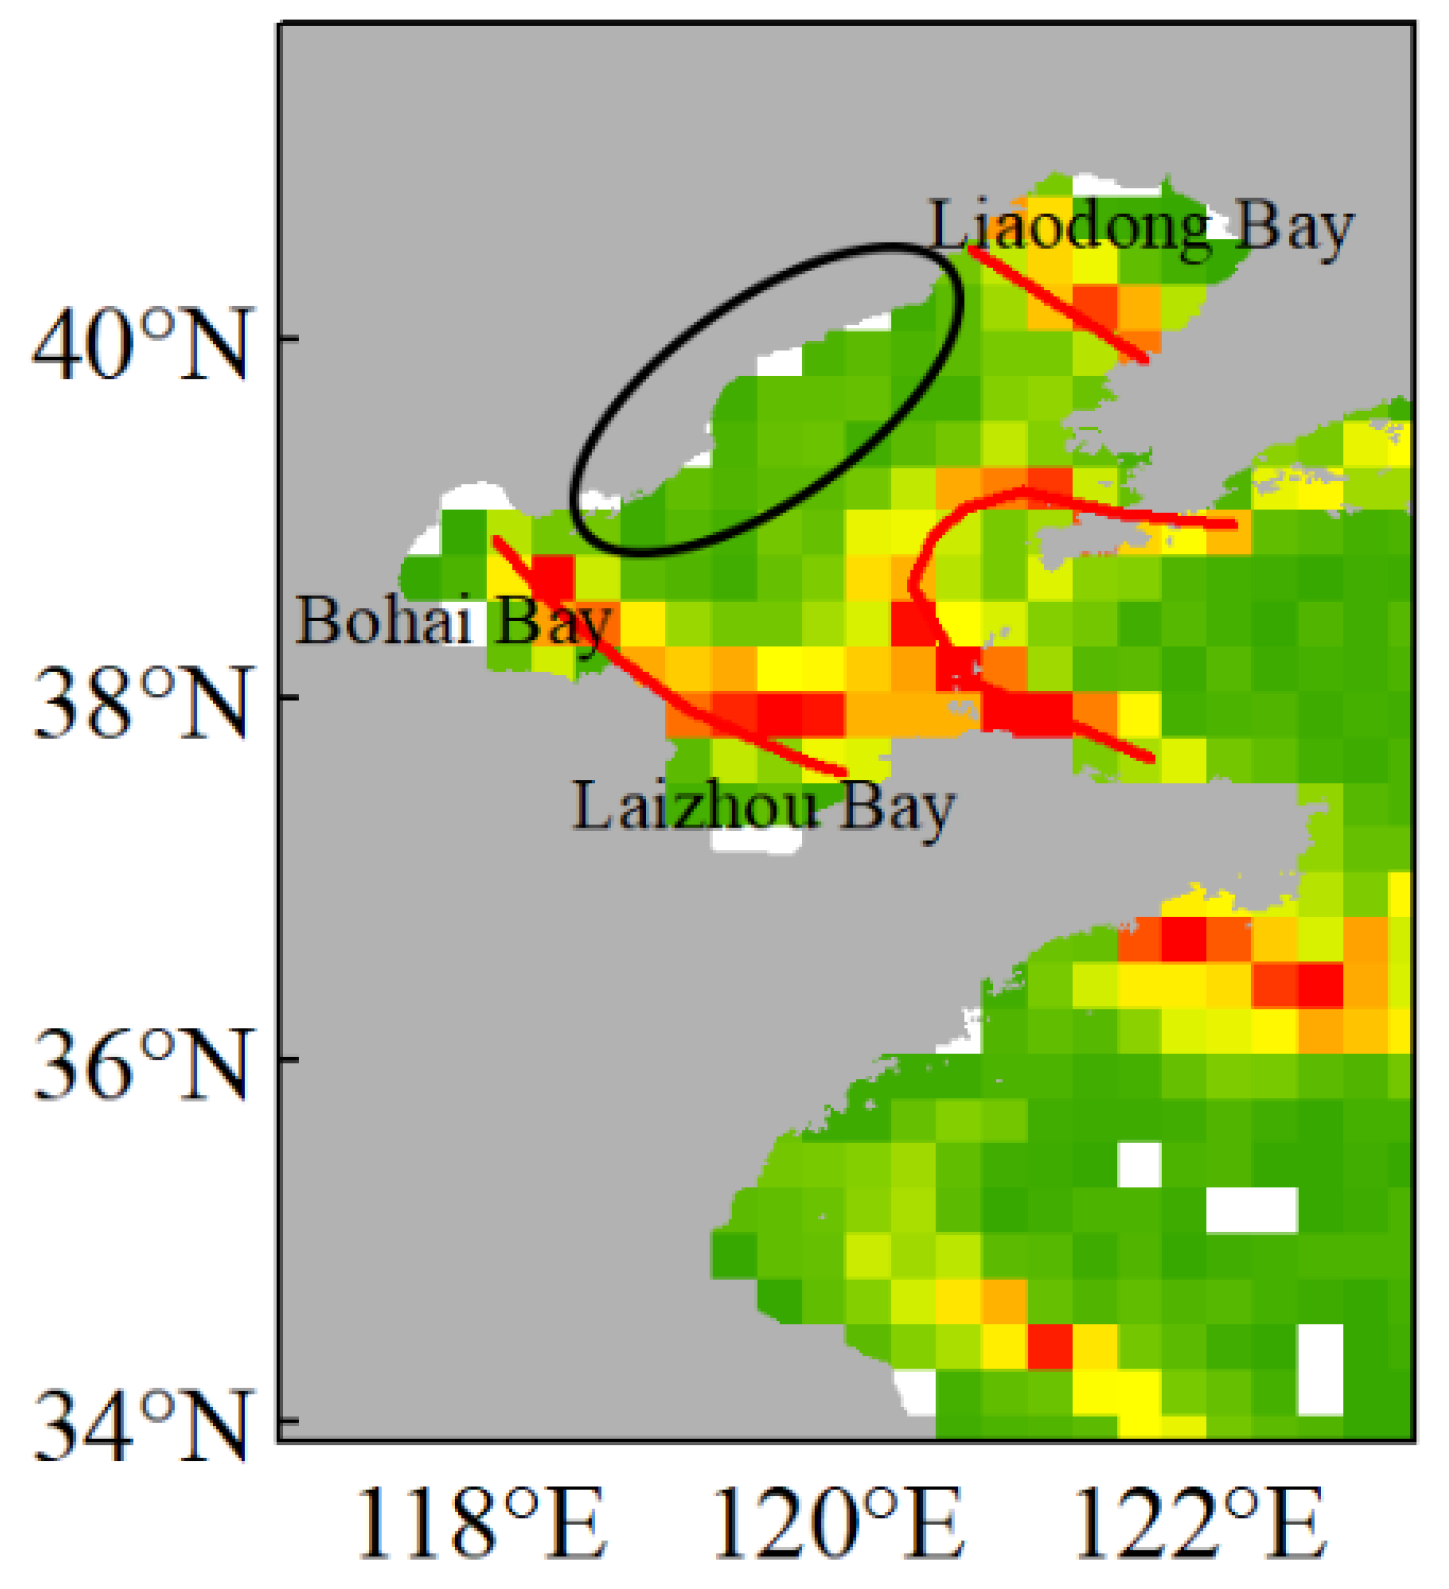
When studying the fronts in the BS, some scholars found that there are two main fronts, namely the Liaodong Bay, Bohai Bay, and Laizhou Bay front (LBLF), and the Bohai Strait front (BSF) [7]. The LBLF is a front surrounding the coast of the BS. However, we found that the front in Liaodong Bay is not connected with the front in Bohai Bay and Laizhou Bay. As shown in Figure 8, the frequency of fronts in the sea area within the black circle is very low. As a result, most of the time the fronts in Liaodong Bay cannot be related to the fronts in Bohai Bay. Therefore, the LBLF is divided into two fronts in this paper and named LDBF and BLBF.
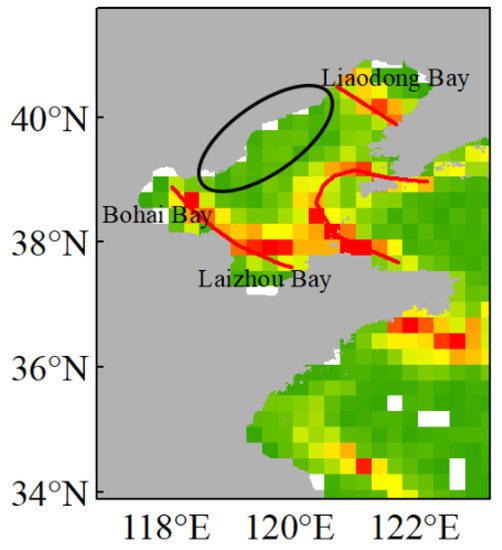
Figure 8.
Three fronts in the BS (red line, the location of fronts; black ellipse, compared with previous study [7] the frequency in this region is very low).
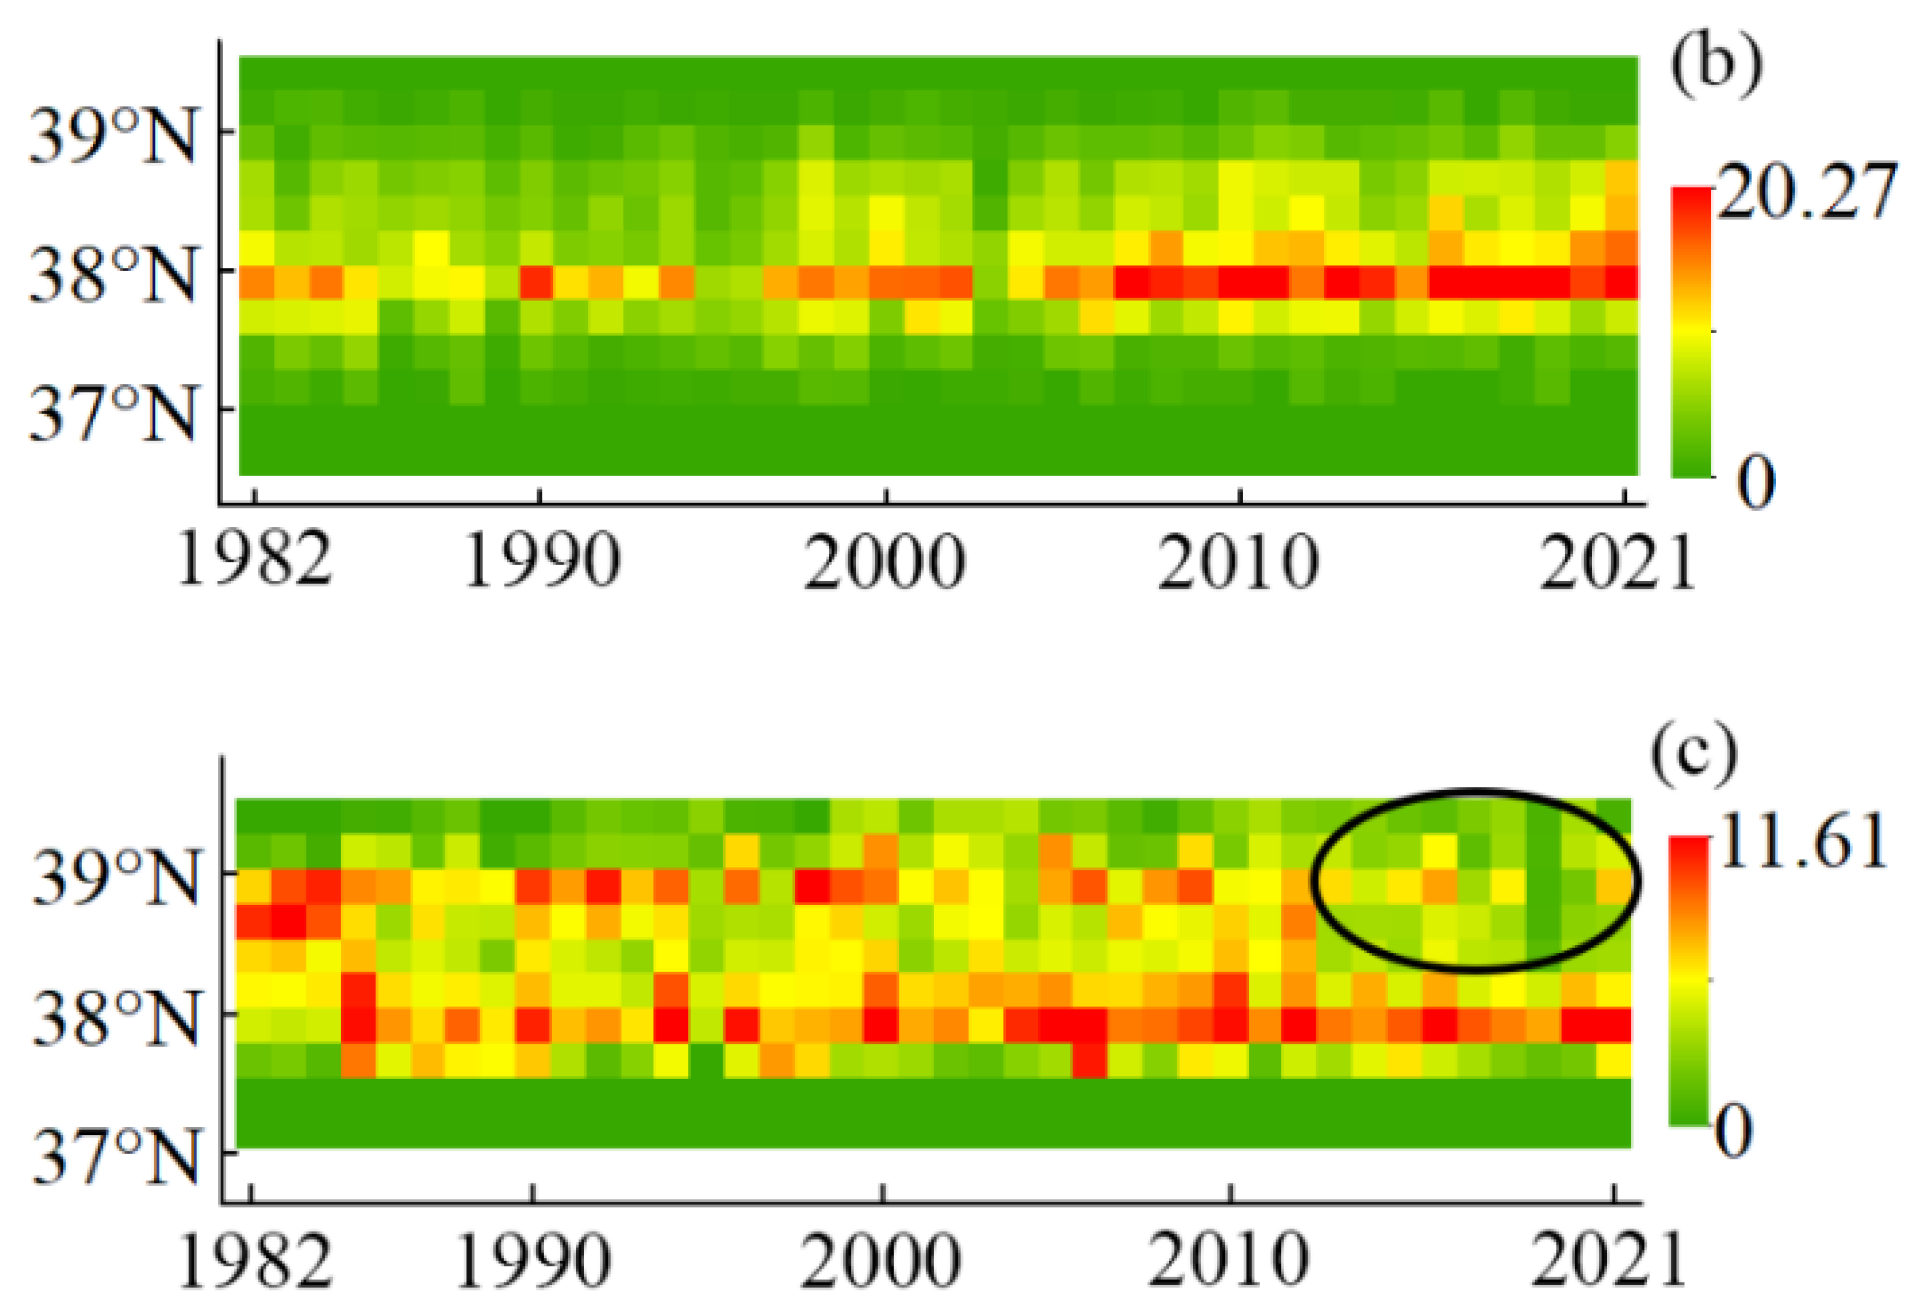
Figure 9 shows the Hovmöller diagram of the LDBF, BLBF, and BHF. Since 2011, the frequency of the LDBF between 40° and 41° N has been increasing. Since 2016, the LDBF has appeared almost every year (Figure 9a). The high-frequency region of the BLBF is mainly concentrated near 38° N. From 2007 to 2021, the frequency of the BLBF around 38° N also increased (Figure 9b). The average FP value of the BHF is higher than that of the LDBF and BLBF (Table 4). That means the frequency of the BHF is highest in the BS. However, its annual average FP value shows a slight decline (Figure 7). As shown in Figure 9c, after 2013 the frontal frequency north of 39° N decreases. As a result, the frequency of the BHF decreases.

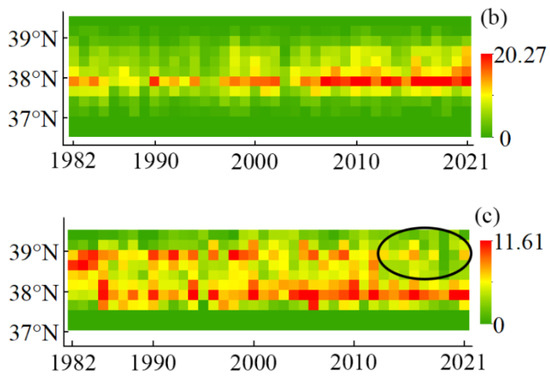
Figure 9.
Hovmöller diagram of the annual averaged FP of front in the BS ((a) LDBF; (b) BLBF; (c) BHF; black ellipse, areas of reduced front frequency).

Table 4.
The frontal frequency patterns in the west and east of YSRF.
4.2. New Front in the Yellow Sea
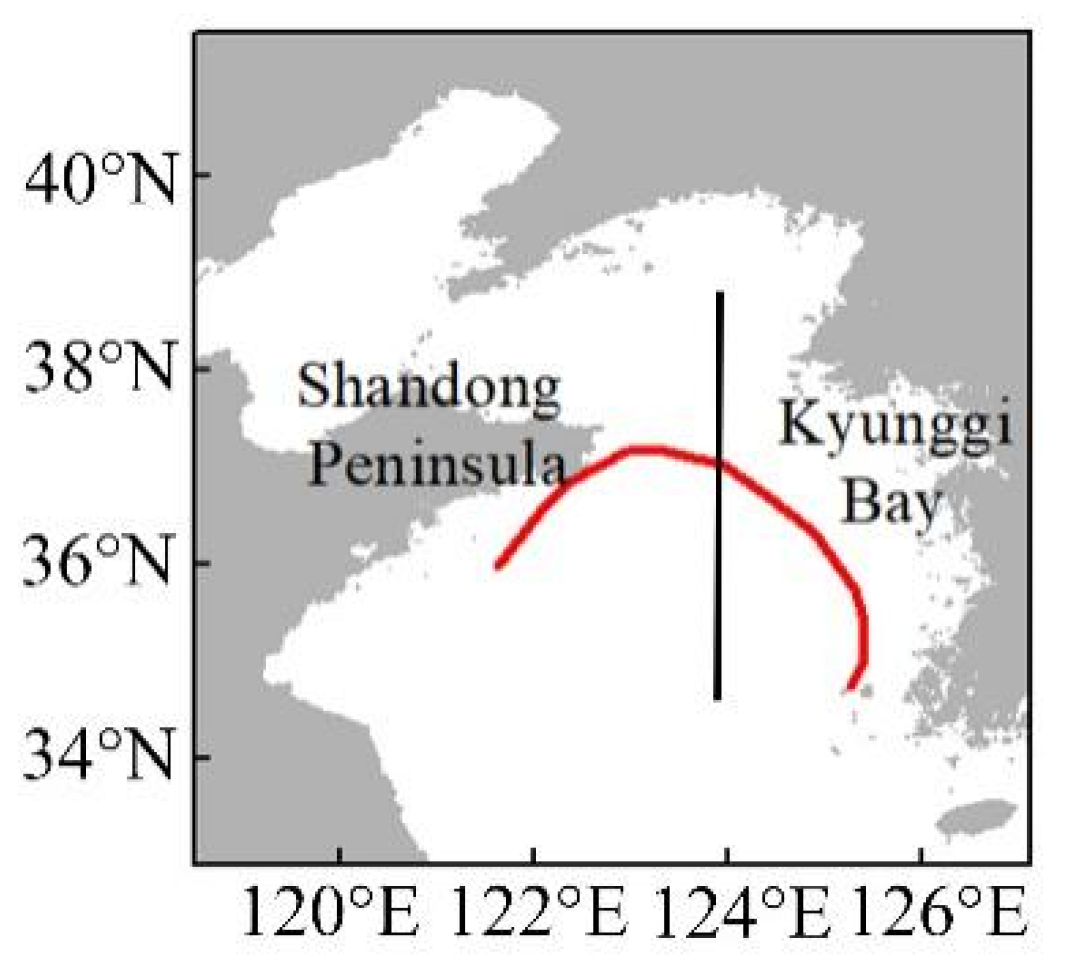
In this paper, a front around the Shandong Peninsula and Kyunggi Bay was detected in the YS and named the Yellow Sea Ring Front (YSRF). This front is semicircular along the southern Shandong Peninsula and Kyunggi Bay. Taking the middle line between the Shandong Peninsula and the Korean Peninsula as the dividing line, the YSRF is divided into two parts: the eastern front (near Kyunggi Bay) and the western front (near the Shandong Peninsula) (Figure 10).
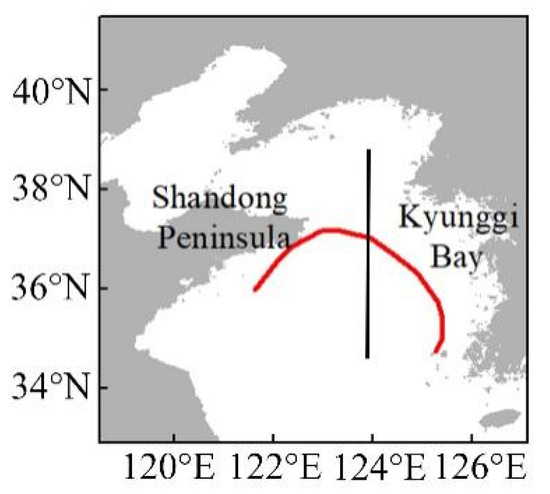
Figure 10.
Red line, the location of the YSRF; black line, demarcation line between the eastern frontal area and the western frontal area of the YSRF.
According to Figure 11, the frontal frequency patterns in the west and east of the YSRF are obtained. The statistical results are shown in Table 4. There are four models: west high–east high; west high–east medium; west medium–east medium; and west medium–east low. For example, the west high–east medium pattern means that the western zone of the YSRF has a high-frequency, and the eastern zone has a medium frequency. The frequency of the western front of the YSRF in 24 years is higher than that of the eastern YSRF, and the frequency of the eastern and western fronts of the YSRF in 16 years is the same. This means that the YSRF is more likely to occur near the Shandong Peninsula. The frequency of the east of the YSRF (near Kyunggi Bay) in 24 years was medium-frequency (Table 4). The YSRF at Kyunggi Bay was essentially connected to the KBF from 1982 to 2012. However, after 2012 the YSRF at Kyunggi Bay gradually moved to the southwest. Kyunggi Bay has formed a double front pattern. Even in 2019 and 2021, the distribution pattern of the three fronts appears (Figure 11).
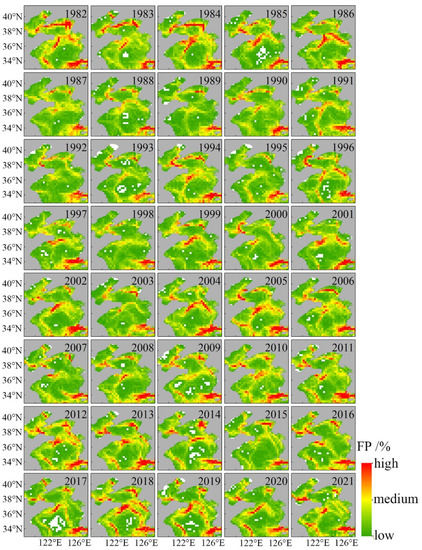
Figure 11.
Interannual frontal probability maps of YSRF for 1982–2021.
5. Conclusions
In this study, we chose DOISST data and used the CCA-SIED-MGET to identify fronts in OC. In addition, this study calculated the interannual FP value, monthly FP value, and seasonal FP value of fronts. We examined the changes in the fronts at various timescales using these data. The main conclusions can be drawn as follows:
(1) There are 18 SST fronts in OC. The LDBF, BLBF, and BHF are found in the BS. The SBF, KBF, YSRF, JSF, WCF, ECF, and YBRF are found in the YS. The ZFF and KF are found in the ECS. The TWSF, SCCF, BBF, VF, and LF are found in the SCS. The POETF is found in the POET.
(2) The number of high-frequency fronts, medium-frequency fronts, and low-frequency fronts varies from month to month. In January–April and December, the quantitative relationship of the three types of front frequencies is: high-frequency > low-frequency > medium-frequency. From May to July, the relationship is: high-frequency ≥ low-frequency > medium-frequency. From September to November, the relationship is: low-frequency > high-frequency ≥ medium-frequency. Analyzing the monthly variation in each front shows that the BHF, BLBF, SBF, YSRF, ZFF, KF, SCCF, LF, VF, and POETF show a tendency to initially rise and then decline from January to September, followed by a trend of growing steadily from October to December. The JSF, WCF, TWSF, and BBF show a decreased tendency from January to September and an increasing tendency from October to December. Compared with the changing trends of these four frontal frequencies, the KBF and ECF show opposite changing trends. The monthly variations in the LDBF and YBRF are relatively special.
(3) The distribution of fronts in OC has an obvious seasonal change. In spring, from north to south, the fronts’ frequency distribution is generally medium–high–low-frequency. In summer, the medium-frequency fronts are located in the BS and the western part of the YS, and the high-frequency fronts are located in the eastern part of the YS. In autumn, the high-frequency fronts and the medium-frequency fronts are mainly distributed in the BS, the YS, and the northern part of the SCS. In winter, most of the fronts are high-frequency and medium-frequency. Analyzing the seasonal variation in each front shows that the frequency of most fronts is highest in winter and lowest in summer. In spring and autumn, the frequency is lower than in winter and higher than in summer. However, the BLBF and KBF occur with a high frequency in spring and summer, and with a low frequency in autumn and winter. The season with the highest frequency of the ZFF and KF is spring.
(4) According to the total average value of FP, we concluded that the WCF, ECF, and KF were high-frequency fronts. The YBRF, BHF, TWSF, JSF, SBF, YSRF, ZFF, KBF, and BLBF were medium-frequency fronts. The SCCF, LDBF, BBF, LF, POETF, and VF were low-frequency fronts. In addition, we also counted the average FP value for each frontal area from 1982 to 2021. The results show that the change in the FP value of the fronts LDBF, BLBF, JSF, WCF, KBF, YSRF, ECF, ZFF, POETF, and BBF has mainly an upward trend. The change in the FP value of the fronts TWSF, SCCF, BHF, YBRF, KF, and VF has mainly a decreasing tendency. The frequency of the SBF and LF generally showed a stable trend.
(5) In the BS, we detect three fronts, namely the LDBF, BLBF, and BHF. The frequency of fronts in the sea close to Hebei Province is extremely low. So, the LDBF and BLBF do not form a complete front. In autumn and winter, the frontal frequency of the northern BS is higher than that of the southern BS. However, in summer, the frontal frequency in the southern BS is higher than that in the northern BS. We also discovered that after 2013, the frontal frequency north of 39° N decreased. As a result, the frequency of the BHF decreased.
(6) The YSRF was detected in the YS. This front is around the Shandong Peninsula and Kyunggi Bay. The YSRF was more likely to occur near the Shandong Peninsula. In Kyunggi Bay, the YSRF was essentially connected to the KBF from 1982 to 2012. However, after 2012, the eastern part of the YSRF gradually moved to the southwest. The YSRF and the KBF have formed a double front pattern. Even in 2019 and 2021, the distribution pattern of three fronts emerged.
Author Contributions
Formal analysis, L.Z.; data curation, L.Z., R.Z. and X.Y.; writing—original draft preparation, L.Z.; writing—review and editing, D.Y.; supervision, D.Y.; project administration, D.Y.; funding acquisition, D.Y. All authors have read and agreed to the published version of the manuscript.
Funding
This research is jointly supported by the National Key R&D Program of China (grant no. 2018YFD0900901), and the Southern Marine Science and Engineering Guangdong Laboratory (Guangzhou) (grant no. GML2019ZD0602).
Data Availability Statement
The DOISST datasets can be accessed at https://psl.noaa.gov/thredds/catalog/Datasets/noaa.oisst.v2.highres/catalog.html (accessed on 5 May 2022). The MGET can be accessed in http://mgel.env.duke.edu/tools (accessed on 5 May 2022).
Conflicts of Interest
The authors declare no conflict of interest.
References
- Belkin, I.M.; Cornillon, P.C.; Sherman, K. Fronts in large marine ecosystems. Prog. Oceanogr. 2009, 81, 223–236. [Google Scholar] [CrossRef]
- Bava, J.; Gagliardini, D.A.; Dogliotti, A.I.; Lasta, C.A. Annual distribution and variability of remotely sensed sea surface temperature fronts in the Southwestern Atlantic Ocean. In Proceedings of the 29th International Symposium on Remote Sensing of Environment, Buenos Aires, Argentina, 8–12 April 2002. [Google Scholar]
- Hopkins, J.; Challenor, P.; Shaw, A.G.P. A new statistical modeling approach to ocean front detection from SST satellite images. J. Atmos. Ocean. Technol. 2010, 27, 173–191. [Google Scholar] [CrossRef]
- Chen, H.H.; Qi, Y.; Wang, Y.; Chai, F. Seasonal variability of SST fronts and winds on the southeastern continental shelf of Brazil. Ocean. Dyn. 2019, 69, 1387–1399. [Google Scholar] [CrossRef]
- Guo, L.; Xiu, P.; Chai, F.; Xue, H.; Wang, D.; Sun, J. Enhanced chlorophyll concentrations induced by Kuroshio intrusion fronts in the northern South China Sea. Geophys. Res. Lett. 2017, 44, 11565–11572. [Google Scholar] [CrossRef]
- Lü, X.; Qiao, F.; Xia, C.; Zhu, J.; Yuan, Y. Upwelling off Yangtze River estuary in summer. J. Geophys. Res. Ocean. 2006, 111. [Google Scholar] [CrossRef]
- Tsopouridis, L.; Spensberger, C.; Spengler, T. Cyclone intensification in the Kuroshio region and its relation to the sea surface temperature front and upper-level forcing. Q. J. R. Meteorol. Soc. 2021, 147, 485–500. [Google Scholar] [CrossRef]
- Belkin, I.M. Remote sensing of ocean fronts in marine ecology and fisheries. Remote Sens. 2021, 13, 883. [Google Scholar] [CrossRef]
- Tseng, C.T.; Sun, C.L.; Belkin, I.M.; Yeh, S.-Z.; Kuo, C.-L.; Liu, D.-C. Sea surface temperature fronts affect distribution of Pacific saury (Cololabis saira) in the Northwestern Pacific Ocean. Deep. Sea Res. Part II Top. Stud. Oceanogr. 2014, 107, 15–21. [Google Scholar] [CrossRef]
- Belkin, I.; Cornillon, P. SST fronts of the Pacific coastal and marginal seas. Pacifific Oceanogr. 2003, 1, 90–113. [Google Scholar]
- Belkin, I.M.; Cornillon, P.C. Bering Sea thermal fronts from Pathfifinder data: Seasonal and interannual variability. Pacifific Oceanogr. 2005, 3, 6–20. [Google Scholar]
- Ping, B.; Su, F.; Meng, Y.; Du, Y.; Fang, S. Application of a sea surface temperature front composite algorithm in the Bohai, Yellow, and East China Seas. Chin. J. Oceanol. Limnol. 2016, 34, 597–607. [Google Scholar] [CrossRef]
- Legeckis, R. A survey of worldwide sea surface temperature fronts detected by environmental satellites. J. Geophys. Res. Ocean. 1978, 83, 4501–4522. [Google Scholar] [CrossRef]
- Wang, Y.; Castelao, R.M.; Yuan, Y. Seasonal variability of alongshore winds and sea surface temperature fronts in Eastern Boundary Current Systems. J. Geophys. Res. Ocean. 2015, 120, 2385–2400. [Google Scholar] [CrossRef]
- Canny, J. A computational approach to edge detection. IEEE Trans. Pattern Anal. Mach. Intell. 1986, 6, 679–698. [Google Scholar] [CrossRef]
- Cayula, J.F.; Cornillon, P. Edge detection algorithm for SST images. J. Atmos. Ocean. Technol. 1992, 9, 67–80. [Google Scholar] [CrossRef]
- Cayula, J.F.; Cornillon, P. Multi-image edge detection for SST images. J. Atmos. Ocean. Technol. 1995, 12, 821–829. [Google Scholar] [CrossRef]
- Belkin, I.M.; O’Reilly, J.E. An algorithm for oceanic front detection in chlorophyll and SST satellite imagery. J. Mar. Syst. 2009, 78, 319–326. [Google Scholar] [CrossRef]
- Nieto, K.; Demarcq, H.; McClatchie, S. Mesoscale frontal structures in the Canary Upwelling System: New front and filament detection algorithms applied to spatial and temporal patterns. Remote Sens. Environ. 2012, 123, 339–346. [Google Scholar] [CrossRef]
- Mauzole, Y.L. Objective delineation of persistent SST fronts based on global satellite observations. Remote Sens. Environ. 2022, 269, 112798. [Google Scholar] [CrossRef]
- Wang, Y.; Yu, Y.; Zhang, Y.; Zhang, H.R.; Chai, F. Distribution and variability of sea surface temperature fronts in the South China Sea. Estuar. Coast. Shelf Sci. 2020, 240, 106793. [Google Scholar] [CrossRef]
- Zeng, X.; Belkin, I.M.; Peng, S.; Li, Y. East Hainan upwelling fronts detected by remote sensing and modelled in summer. Int. J. Remote Sens. 2014, 35, 4441–4451. [Google Scholar] [CrossRef]
- Castelao, R.M.; Wang, Y. Wind—driven variability in sea surface temperature front distribution in the California Current System. J. Geophys. Res. Ocean. 2014, 119, 1861–1875. [Google Scholar] [CrossRef]
- Bai, H.; Hu, H.; Yang, X.Q.; Ren, X.; Xu, H.; Liu, G. Modeled MABL responses to the winter Kuroshio SST front in the East China Sea and Yellow Sea. J. Geophys. Res. Atmos. 2019, 124, 6069–6092. [Google Scholar] [CrossRef]
- Hickox, R.; Belkin, I.; Cornillon, P.; Shan, Z. Climatology and seasonal variability of ocean fronts in the East China, Yellow and Bohai Seas from satellite SST data. Geophys. Res. Lett. 2000, 27, 2945–2948. [Google Scholar] [CrossRef]
- Liu, Z.; Hou, Y. Kuroshio Front in the East China sea from satellite SST and remote sensing data. IEEE Geosci. Remote Sens. Letters 2011, 9, 517–520. [Google Scholar] [CrossRef]
- He, S.; Huang, D.; Zeng, D. Double SST fronts observed from MODIS data in the East China Sea off the Zhejiang–Fujian coast, China. J. Mar. Syst. 2016, 154, 93–102. [Google Scholar] [CrossRef]
- Cao, L.; Tang, R.; Huang, W.; Wang, Y. Seasonal variability and dynamics of coastal sea surface temperature fronts in the East China Sea. Ocean. Dyn. 2021, 71, 237–249. [Google Scholar] [CrossRef]
- Lin, L.; Liu, D.; Luo, C.; Xie, L. Double fronts in the Yellow Sea in summertime identified using sea surface temperature data of multi-scale ultra-high resolution analysis. Cont. Shelf Res. 2019, 175, 76–86. [Google Scholar] [CrossRef]
- Ren, S.; Zhu, X.; Drevillon, M.; Wang, H.; Zhang, Y.; Zu, Z.; Li, A. Detection of SST Fronts from a High-Resolution Model and Its Preliminary Results in the South China Sea. J. Atmos. Ocean. Technol. 2021, 38, 387–403. [Google Scholar] [CrossRef]
- Jing, Z.; Qi, Y.; Fox-Kemper, B.; Du, Y.; Lian, S. Seasonal thermal fronts on the northern South China Sea shelf: Satellite measurements and three repeated field surveys. J. Geophys. Res. Ocean. 2016, 121, 1914–1930. [Google Scholar] [CrossRef]
- Shi, R.; Guo, X.; Wang, D.; Zeng, L.; Chen, J. Seasonal variability in coastal fronts and its influence on sea surface wind in the northern South China Sea. Deep. Sea Res. Part II Top. Stud. Oceanogr. 2015, 119, 30–39. [Google Scholar] [CrossRef]
- Reynolds, R.W.; Smith, T.M.; Liu, C.; Chelton, D.B.; Casey, K.S.; Schlax, M.G. Daily high-resolution-blended analyses for sea surface temperature. J. Clim. 2007, 20, 5473–5496. [Google Scholar] [CrossRef]
- Huang, B.; Liu, C.; Freeman, E.; Graham, G.; Smith, T.; Zhang, H.M. Assessment and intercomparison of NOAA daily optimum interpolation sea surface temperature (DOISST) version 2.1. J. Clim. 2021, 34, 7421–7441. [Google Scholar] [CrossRef]
- Suhadha, A.G.; Ibrahim, A. Association study between thermal front phenomena and Bali sardinella fishing areas in Bali Strait. Indones. J. Geogr. 2020, 52, 154–162. [Google Scholar] [CrossRef]
- Roberts, J.J.; Best, B.D.; Dunn, D.C.; Treml, E.A.; Halpin, P.N. Marine Geospatial Ecology Tools: An integrated framework for ecological geoprocessing with ArcGIS, Python, R, MATLAB, and C++. Environ. Model. Softw. 2010, 25, 1197–1207. [Google Scholar] [CrossRef]
Publisher’s Note: MDPI stays neutral with regard to jurisdictional claims in published maps and institutional affiliations. |
© 2022 by the authors. Licensee MDPI, Basel, Switzerland. This article is an open access article distributed under the terms and conditions of the Creative Commons Attribution (CC BY) license (https://creativecommons.org/licenses/by/4.0/).

