Abstract
In this study, we describe new advances in the multiscale methodology to allow a more realistic interpretation of volcanic deformation fields by investigating geometrically irregular bodies and multi-source scenarios. We propose an integrated approach to be applied to InSAR measurements, employing the Multiridge and ScalFun methods and the Total Horizontal Derivative (THD) technique: this strategy provides unconstrained information on the source geometrical parameters, such as the depth, position, shape, and horizontal extent. To do this, we start from conditions where the biharmonic deformation field satisfies Laplace’s equation and homogeneity law. We test the use of the multiscale procedures to model single and multisource scenarios with irregular geometries by retrieving satisfactory results for a set of simulated sources. Finally, we employ the proposed approach to the 2004–2009 uplift episode at the Yellowstone Caldera (U.S.) measured by ENVISAT InSAR to provide information about the volcanic plumbing system. Our results indicate a single km2 extended source lying beneath the caldera at around km b.s.l. (depth to the center), which is shallower below both the resurgent domes (6–7 km b.s.l. depth to the top).
1. Introduction
The imaging of volcanic sources is generally performed by detecting physical parameters responsible for observed anomalous fields and their variations in space and time (e.g., [1,2,3,4,5]). For complex scenarios, such as resurgent calderas, the measured datasets could combine the effects of different sources, in which case the characterization of the geometrical irregularities of one or more active volcanic bodies becomes crucial to understanding the dynamics and the evolution of the plumbing system (e.g., [6,7,8]).
A commonly adopted strategy for volcanic source modeling involves the retrieval of the ground deformation field, employing Interferometric Synthetic Aperture Radar (InSAR) [9,10]. In this framework, the most used approach is based on parametric optimization procedures (e.g., [11]) for which a priori information is assumed, i.e., an Analytical Model (AM) (e.g., [12,13,14,15,16,17,18,19]) used to approximate the volcanic rheology with the elasticity theory and the deformation source with a regular shaped body. Many authors also model the sources by detecting differential openings to take into account the geometrical irregularities of volcanic bodies (e.g., [20,21]). However, this approach leads to not-quite-realistic results for the volcanic plumbing system. Tomographic inversion methods could be a good strategy to model sources with any shape, and in this context, Camacho et al. [22] subdivide an assumed source volume into blocks and find the best-fit parameters of a geometrically simple AM for each block. However, as for the optimization procedures, using a priori information can lead to an ambiguous interpretation of the representative scenario [23,24,25].
The multiscale approach represents an alternative strategy employing non-iterative interpretation tools based on the validity of Laplace’s equation [26] and the homogeneity law [27] that yield unconstrained estimates of source geometrical parameters, overcoming some aspects of the ambiguity related to the interpretation of ground deformations [23,24,25]. This approach is based on techniques developed to explain potential field data such as gravity and magnetic data (i.e., [28,29]). Specifically, the Multiridge method [28] provides information on the source location by analyzing the intersections of the so-called ridges at different scales , i.e., different distances between the source and the measurement surface. In contrast, the ScalFun method [29] allows the characterization of the morphological features of the source through the retrieval of integer values of the Structural Index parameter . The multiscale approach easily detects the geometrical features of ideal sources, i.e., source distributions having their support in just one point, but it can also provide information on geometrically irregular bodies [30].
Another helpful technique to evaluate the source geometrical irregularities is the Total Horizontal Derivative (THD) (e.g., [26]), which has already been effectively applied to volcanic deformation cases [7]. It allows the evaluation of the horizontal extent of multipolar field sources, such as the sill-like one.
In this work, we deepen the potentialities of multiscale strategies to perform more realistic imaging of volcanic plumbing systems. Indeed, with respect to previous works on this item [23,24,25], we model deformation data through the investigation of geometrically irregular source models by using an integrated multiscale approach that consists of Multiridge and ScalFun methods and boundary analysis techniques, such as the THD: the methodology provides unconstrained information such as the source depth, horizontal position, morphological features, and horizontal extent. This strategy is efficient for our purposes as the multiscale solutions do not depend on a priori information about the source geometry/model. In the case of the AM physical approximations, it also works without assuming the physical elastic parameters of the model, such as Young’s modulus , the Poisson coefficient , and pressure variation (. However, it does not provide information about these parameters. This approach is suitable for analyzing any deformation components and discriminating from single to multi-source scenarios. At the same time, the THD technique enables the detection of the irregularities of the source horizontal boundaries, but it proves useless for monopole models, such as the Mogi source [7,26].
We start by describing the conditions such that the biharmonic deformation field [31] can be expressed by harmonic and homogeneous functions, which occur for ideal sources characterized by hydrostatic and embedded in homogeneous and elastic half-spaces [23]. To study a general source, i.e., ideal or non-ideal, we follow Gerovska et al. [32], showing through empirical tests that the multiscale solutions help analyze sources with irregular geometry, because can also take on fractional values.
Then, we test the soundness of the proposed methodology by considering numerical models with irregular source geometry to reproduce the deformation field satisfying Laplace’s equation. We evaluate the flexibility of this approach in dealing with single and multi-source cases, employing both the vertical component of the ground deformation field and its order vertical differentiation [26].
Finally, we process a set of SAR ENVISAT satellite images using InSAR to retrieve the time history of vertical surface deformation at the Yellowstone caldera. For this site, the geodetic modeling of the 2004–2009 uplift episode has been associated with a magma intrusion of tabular shape at a depth of 8–10 km [21,33,34]. However, other authors [6,35] have modeled the deformations at the resurgent domes by involving two different geodetic sources. Therefore, we use the integrated multiscale approach to investigate the irregular morphology of the deformation bodies, providing a more realistic view of the caldera plumbing system. We discuss our interpretation regarding the observed uplift episode, considering the available geophysical information and point out the proposed approach’s advantages, limitations, and prospects.
2. Materials and Methods
In this section, we start with the harmonic and homogeneous deformation field describing the Multiridge, ScalFun methods, and THD techniques in the framework of the modeling of geometrically irregular sources in the volcanic environment. We then give details of the simulated deformation fields and the processed InSAR data at Yellowstone caldera, both used to show the advantages of the proposed integrated multiscale approach.
2.1. Harmonic Deformation Field
The biharmonic components of a deformation field are harmonic functions if they satisfy Laplace’s equation [23]:
where is the Laplacian operator. Starting from Navier’s equation for equilibrium under surface traction (i.e., [31,36]),
where and are the Lamè’s constants, and are the gradient and the divergence operators, respectively, it follows that [25]:
By considering the following strain–stress relation (i.e., [31,36]),
and inserting it into Equation (3), we can state that satisfies Equation (1) when [25]:
where and are Poisson coefficient and Young’s modulus, respectively, while is the sum of the normal stresses. In particular, Equation (5) is satisfied if is constant and , that is satisfies Laplace’s equation in case of [25]:
or when the field is produced by hydrostatic within sources embedded in homogeneous elastic half-spaces. Moreover, when the physical parameters of the medium do not remarkably change, the multiscale requirements are still satisfied [25]. More details of the steps leading from Equation (1) to (6) are reported in Section S1 of the Supplementary Information.
Field transformations in the wavenumber domain [26] can be applied to harmonic functions, such as upward continuation and vertical differentiation, both of which are crucial to a multiscale analysis.
The upward continuation provides the multiscale deformation 3-D dataset starting from the 2-D observed data ; it allows the computation of the deformation field that would have been generated by the same source in a medium extended upward by the vertical distance corresponding to the chosen continuation step [23]. Specifically, is retrieved by anti-transforming into space–domain using the following relation [26]:
where: and are the Fourier transforms of and , respectively, and is the wavenumber.
The vertical differentiation of order is calculated with the aim of improving the high wavenumber contributions of the deformation signal, to investigate shallow volcanic sources better and/or their shallowest parts [24]; also, is provided by anti-transforming the following relation [26]:
2.2. Homogeneous Deformation Field
is homogeneous of degree in the region R if the following scaling law is satisfied (e.g., [27,30]):
where . In the case of continuously differentiable , Euler’s theorem describes the homogeneity law, as follows (e.g., [3,27]):
with the field source position. often expresses the falloff rate of the anomaly with the scale and reflects the type of field source; for ideal deformation ones, , passing from 3-D extended to 3-D concentrated sources [23]. Specifically, in the case of the first-order derivative of a Newtonian potential, e.g., the harmonic deformation field, we receive the source homogeneity degree ,
and, in turn, the parameter Structural Index ,
which is a parameter depending on the source geometry (e.g., [29]). For example, characterizes 3-D concentrated sources or their equivalent generating homogeneous fields, with ; and instead related to pipe-like sources, which are concentrated bodies along two directions and extended along the third one; and characterizes sources concentrated along only one direction, such as the sill-like source producing homogeneous fields with [23,25].
2.3. Multiridge Method
The Multiridge [28] method is a geometric and multiscale procedure providing constraints on the location (depth and horizontal position) of sources of different characteristics [23,24,25,37,38]. It is based on the analysis of the so-called ridges, which are lines joining the zeros of the field or its derivatives at different scales. The method is applied according to the following steps:
Creation of a multiscale deformation dataset using a draped-to-flat upward continuation filter (e.g., [39]), to transform the data from an uneven measurement surface (the topography) to a flat one, and then a flat-to-flat upward continuation to a set of scales (e.g., [26]);
Determining the zeros of the vertical (Multiridge subset I) and horizontal (Multiridge subset II) derivatives of the deformation field at different scales;
Performing a linear regression of the Multiridge subsets to create ridges and study their intersections, which occur at the source regions;
Assessment of the solution uncertainties: (1) computation of the linear regression R2 coefficient for each Multiridge subset; (2) retrieval of the bounds parameters (intercept and slope constants) for each ridge by considering the 95% confidence interval of the best-fit linear regression; (3) representation of the best-fit and bounds ridges, and (4) identification of the multiple intersections, which represent the source parameters (East and North positions, depth ) and their uncertainties.
The working of the Multiridge method can be easily shown by considering the case of a point–spherical source at and the related vertical deformation component at different scale [22]:
where: , is the source radius, is the hydrostatic pressure change within the source, is the Poisson coefficient and the shear modulus. Without any loss of generality, we can consider , and compute the field derivatives, as follows:
We therefore individuate the Multiridge subsets by setting Equations (14) and (15) equal to zero, and remembering that , we have the following ridges equations:
which are simple straight lines, intersecting at the source’s center [25].
2.4. ScalFun Method
The ScalFun method [29] is suited to analyzing multiscale datasets, to provide information on the source geometry through the estimation of ; it is based on the properties of the scaling function, , of the homogeneous deformation field, defined as follows:
where is the deformation field component at the Multiridge subset II and is its vertical derivative of order . Specifically, when we express as a function of , it follows that
Therefore, we can use , estimated by the Multiridge method, in Equation (20), then study the intercepts of since the latter tends to when . Finally, we estimate from Equations (11) and (12) to identify the geometry of the source.
The bounds on the depth solutions previously calculated with the Multiridge method are used to assess the uncertainties in .
2.5. Multiridge and ScalFun Methods for General Deformation Sources
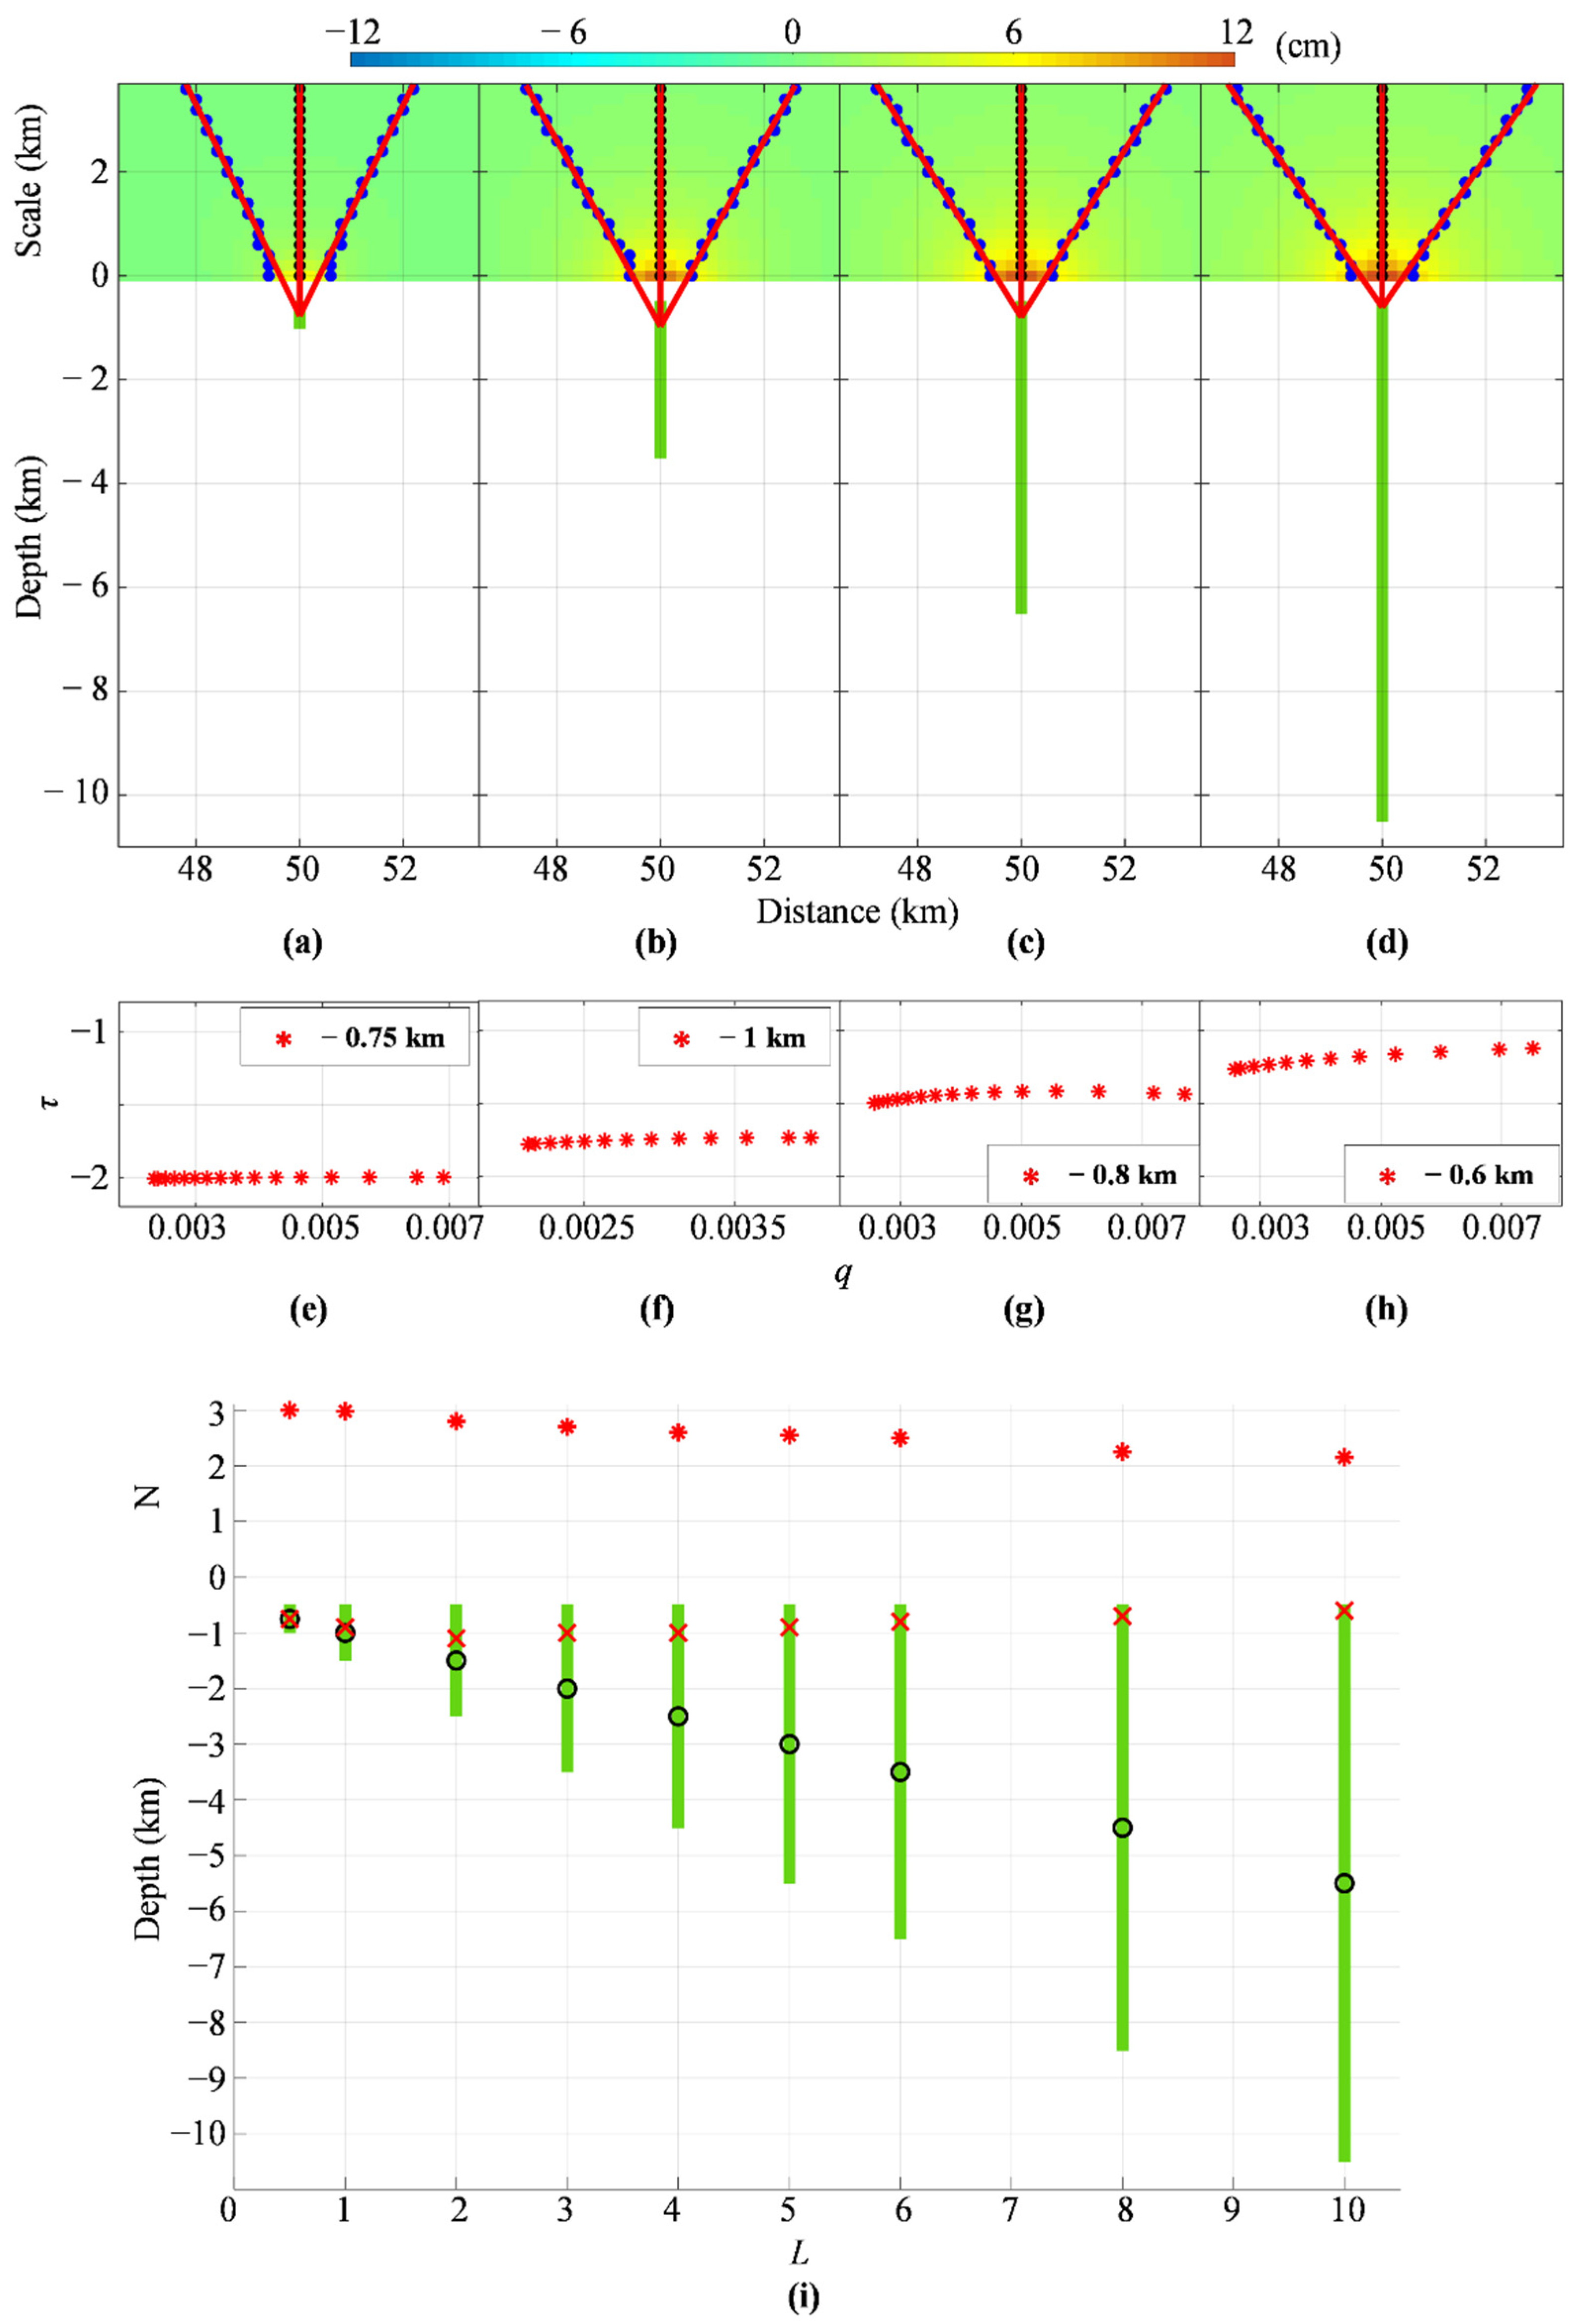
To analyze the deformation field of general sources (i.e., both ideal and non-ideal) using the Multiridge and ScalFun methods, harmonic and homogeneous properties can still be considered. However, these cases should be dealt with using the multi-homogeneity theory [30]. To this purpose, we employ the same approach of Gerovska et al. [32] by performing simulations based on deformation fields generated by vertical cylinders with the same radius, km, and different heights, . We apply the Multiridge and ScalFun methods to the vertical component of these different cases. All the results and the model parameters of this simulation are shown in Figure 1 and listed in Table S1 of the Supplementary Information. In the first case, the cylinder can be considered to be a 3-D concentrated body since km and it has the ideal source properties; indeed, the multiscale analysis provide information on the source center with , according to Equations (11), (12) and (20) (Figure 1a,e). When increases, we instead observe ridges with intersections along the cylinder top and with fractional values . Specifically, in the cases of km and km, values that are neither so small nor so large as to consider the source to be ideal, ridge intersections occur within the analyzed bodies with and according to Equations (11), (12) and (20) (Figure 1b,c,f,g). Therefore, even though these bodies do not have ideal source properties, we could still use a multiscale approach to obtain information on their geometries. Finally, in the km case, the Multiridge method provides the depth to the cylinder top and the ScalFun method characterizes the retrieved solution with (Figure 1d,h), as expected for a pipe-like source, i.e., another ideal source. These results are summarized in Figure 1i.
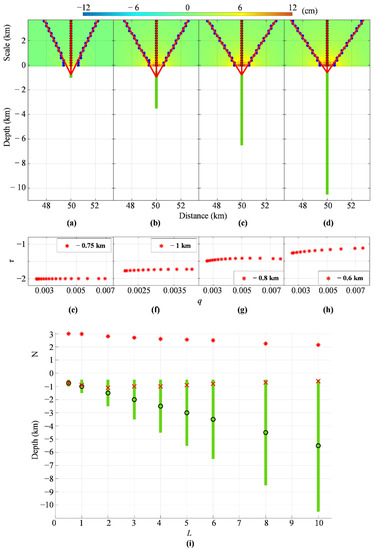
Figure 1.
Vertical cylinder test. Multiscale methods applied to the vertical deformation generated by vertical cylinders with heights (a,e) L = 0.5 km, (b,f) L = 3 km, (c,g) L = 6 km, and (d,h) L = 10 km; vertical deformations are also shown at different scales z; blue and black dots point out the zeros of vertical (subset I) and horizontal (subset II) derivatives of the analyzed dataset, respectively, while the red solid lines are the best fit regression lines; the vertical sections of the sources are represented in green; red stars indicate τ = ∂ log (w)/∂ log (z) [−] in function of q = 1/z [km−1] using the source depth estimated by the Multiridge method, where w is the analyzed vertical deformation at the ridge subset II. (i) Multiscale results vs. L; the black circles point out the source centers, while the red crosses and stars indicate the estimates obtained through the Multiridge and ScalFun methods, respectively.
2.6. Total Horizontal Derivative Technique
The Total Horizontal Derivative (THD) is an edge detection technique widely employed for constraining the horizontal extent of multipolar field sources (e.g., [7,8,26,40,41]). Specifically, we analyze the distribution of the field’s horizontal gradient magnitude because the greatest variations of the physical property in the subsoil match the maxima of the THD distribution at the surface and the boundaries of the field sources or the strong physical discontinuities. In the case of the deformation field, we can write [7]:
where is the vertical deformation sampled at and the horizontal derivatives are computed through finite difference formulas.
2.7. Simulated Ground Deformation Fields
We here describe the simulated deformation patterns to which the integrated multiscale approach is applied. In particular, we simulate the vertical component of the deformation field considering scenarios based on either single or multi-source with irregular geometry. The patterns are computed through Finite Element (FE) models by using COMSOL Multiphysics software (https://www.comsol.com/ (accessed on 1 November 2021)) to reproduce the deformation field satisfying Laplace’s equation. Specifically, in the first simulation, we consider a horizontal body extending 20 km and 10 km along the and -directions, respectively, and at depth from −4 km to −7 km, while, in the second simulation, the multisource case consists of two separate bodies, replicating the previous geometry without the central flat portion. The parameters and the boundary conditions used to set the FE models are listed in Table 1.

Table 1.
Parameters of FE simulated deformation models.
2.8. SAR Data at Yellowstone Caldera
Yellowstone caldera is an km2 silicic volcanic system that has experienced three giant caldera-forming eruptions, which occurred 2.1, 1.3, and 0.63 million years ago. Volcanic activity has happened in the Sour Creek (SC) and Mallard Lake (ML) resurgent domes for the past 0.164 million years (e.g., [42]). Yellowstone has the most extensive hydrothermal system in the world, hosting thermally active areas such as the Norris Geyser Basin (NGB) and the Hot Spring Basin (HSB) group (e.g., [43]). Besides widespread seismicity and extraordinarily high heat flow, Yellowstone has exhibited many episodes of ground deformation. Accordingly, we studied one of these episodes through SAR images, which have been processed as follows.
Two independent sets of SAR images are processed using the Small Baseline Subset (SBAS) technique [44] to preliminarily obtain LOS-projected ground displacement time series for a set of well-processed, coherent targets distributed on the ground. Specifically, the used SAR datasets consist of 32 SAR images acquired by the ENVISAT sensor between September 2003 and February 2010 on ascending orbits (Track 48, Frame 891), and 27 SAR images collected by the ENVISAT sensor from July 2003 to October 2009 on descending orbits (Track 41, Frame 2709). Note that the processed descending data track is the same as adopted in the work shown in Tizzani et al. [6].
To apply the SBAS method, two groups of short baseline differential SAR interferograms are independently selected for the two ascending/descending data tracks. In particular, a maximum perpendicular baseline of 400 m and a maximum time separation between orbits of 500 days are considered. The differential SAR interferograms are flattened by synthesizing the topographic phase components using precise satellite orbital information and the three-arc sec Shuttle Radar Topography Mission (SRTM) [45] of the Yellowstone Caldera. Furthermore, a complex multi-look operation with four and twenty looks in the range and azimuth directions, respectively [46], is also applied. Considering that conventional SBAS processing in areas such as Yellowstone, characterized by heterogeneous sources of noise and significant ground deformation dynamics, reveals critical, we apply some improvements with respect to the “strict” SBAS processing. Specifically, the ascending and descending sets of conventional multi-look SAR interferograms are filtered out using the well-known space-time Enhanced Multi-Temporal noise filtered (E-MtInSAR) method [47,48], which allows for mitigating the decorrelation noise artefacts in sets of multiple multi-looked interferograms by applying a pixel-dependent process that aims to obtain a set of optimized phases associated to every single SAR image. The E-MtInSAR method has been used in several contexts [49,50,51], and it is integrated within the Extended Minimum Cost Flow (EMCF)-oriented InSAR processing chain, fully detailed in [49] and now implemented for the processing of Sentinel-1 SAR data within the parallel P-SBAS tool [52]. As a result, the Line-of-Sight (LOS)-projected ground displacement time series along the ascending and descending orbits over the 2003–2009 interval are independently derived. To determine a group of well-processed SAR pixels for both orbits, we also compute the values of the temporal coherence factor [53], which is mainly sensitive to phase unwrapping errors and time-inconsistent decorrelation phase artefacts in the sequence of used multi-looked interferograms. Only SAR pixels with a temporal coherence greater than 0.6 for both the ascending and descending data tracks are considered reliable and used for the subsequent analyses.
Furthermore, the low spatial frequency phase signal components associated with the movement of the North American Plate are derived [6] using measurements from sparsely distributed Global Positioning System (GPS) stations over the area under investigation. These signals are then removed from the obtained ground displacement time series. Eventually, spurious Atmospheric Phase Screen (APS) components are estimated and compensated for.
Subsequently, the LOS-projected ascending/descending ground displacement time-series are appropriately combined [54,55] to compute the East–West and vertical components of the ground deformation field. To this purpose, the ascending/descending LOS-projected time series are first geocoded to a common reference geometry, then ascending/descending well-processed coherent SAR pixels are located on such a common geocoded grid. Specifically, the 2-D (East-West and Up-Down) ground displacement time series are obtained using the Minimum Acceleration combination (MinA) technique. It consists of a straightforward post-processing stage that involves the analysis of sequences of independently processed multi-platform LOS ground displacement time series. This is completed by solving an underdetermined system of independent linear equations in the Least-Squares sense using the singular value decomposition method. A peculiarity of the method is that the linear equations representing the LOS-projected displacements are regularized by imposing the additional constraint that the 2-D displacement components are with minimum acceleration, which means that the difference between ground deformation velocities in consecutive time intervals is minimal. The choice of a proper regularization weighting factor also leads to an additional filter of the high-pass time noise components, such as the residual uncompensated APS, still present in the LOS-projected ground displacement time series. Interested readers can refer to [54,55] for additional details on the used method.
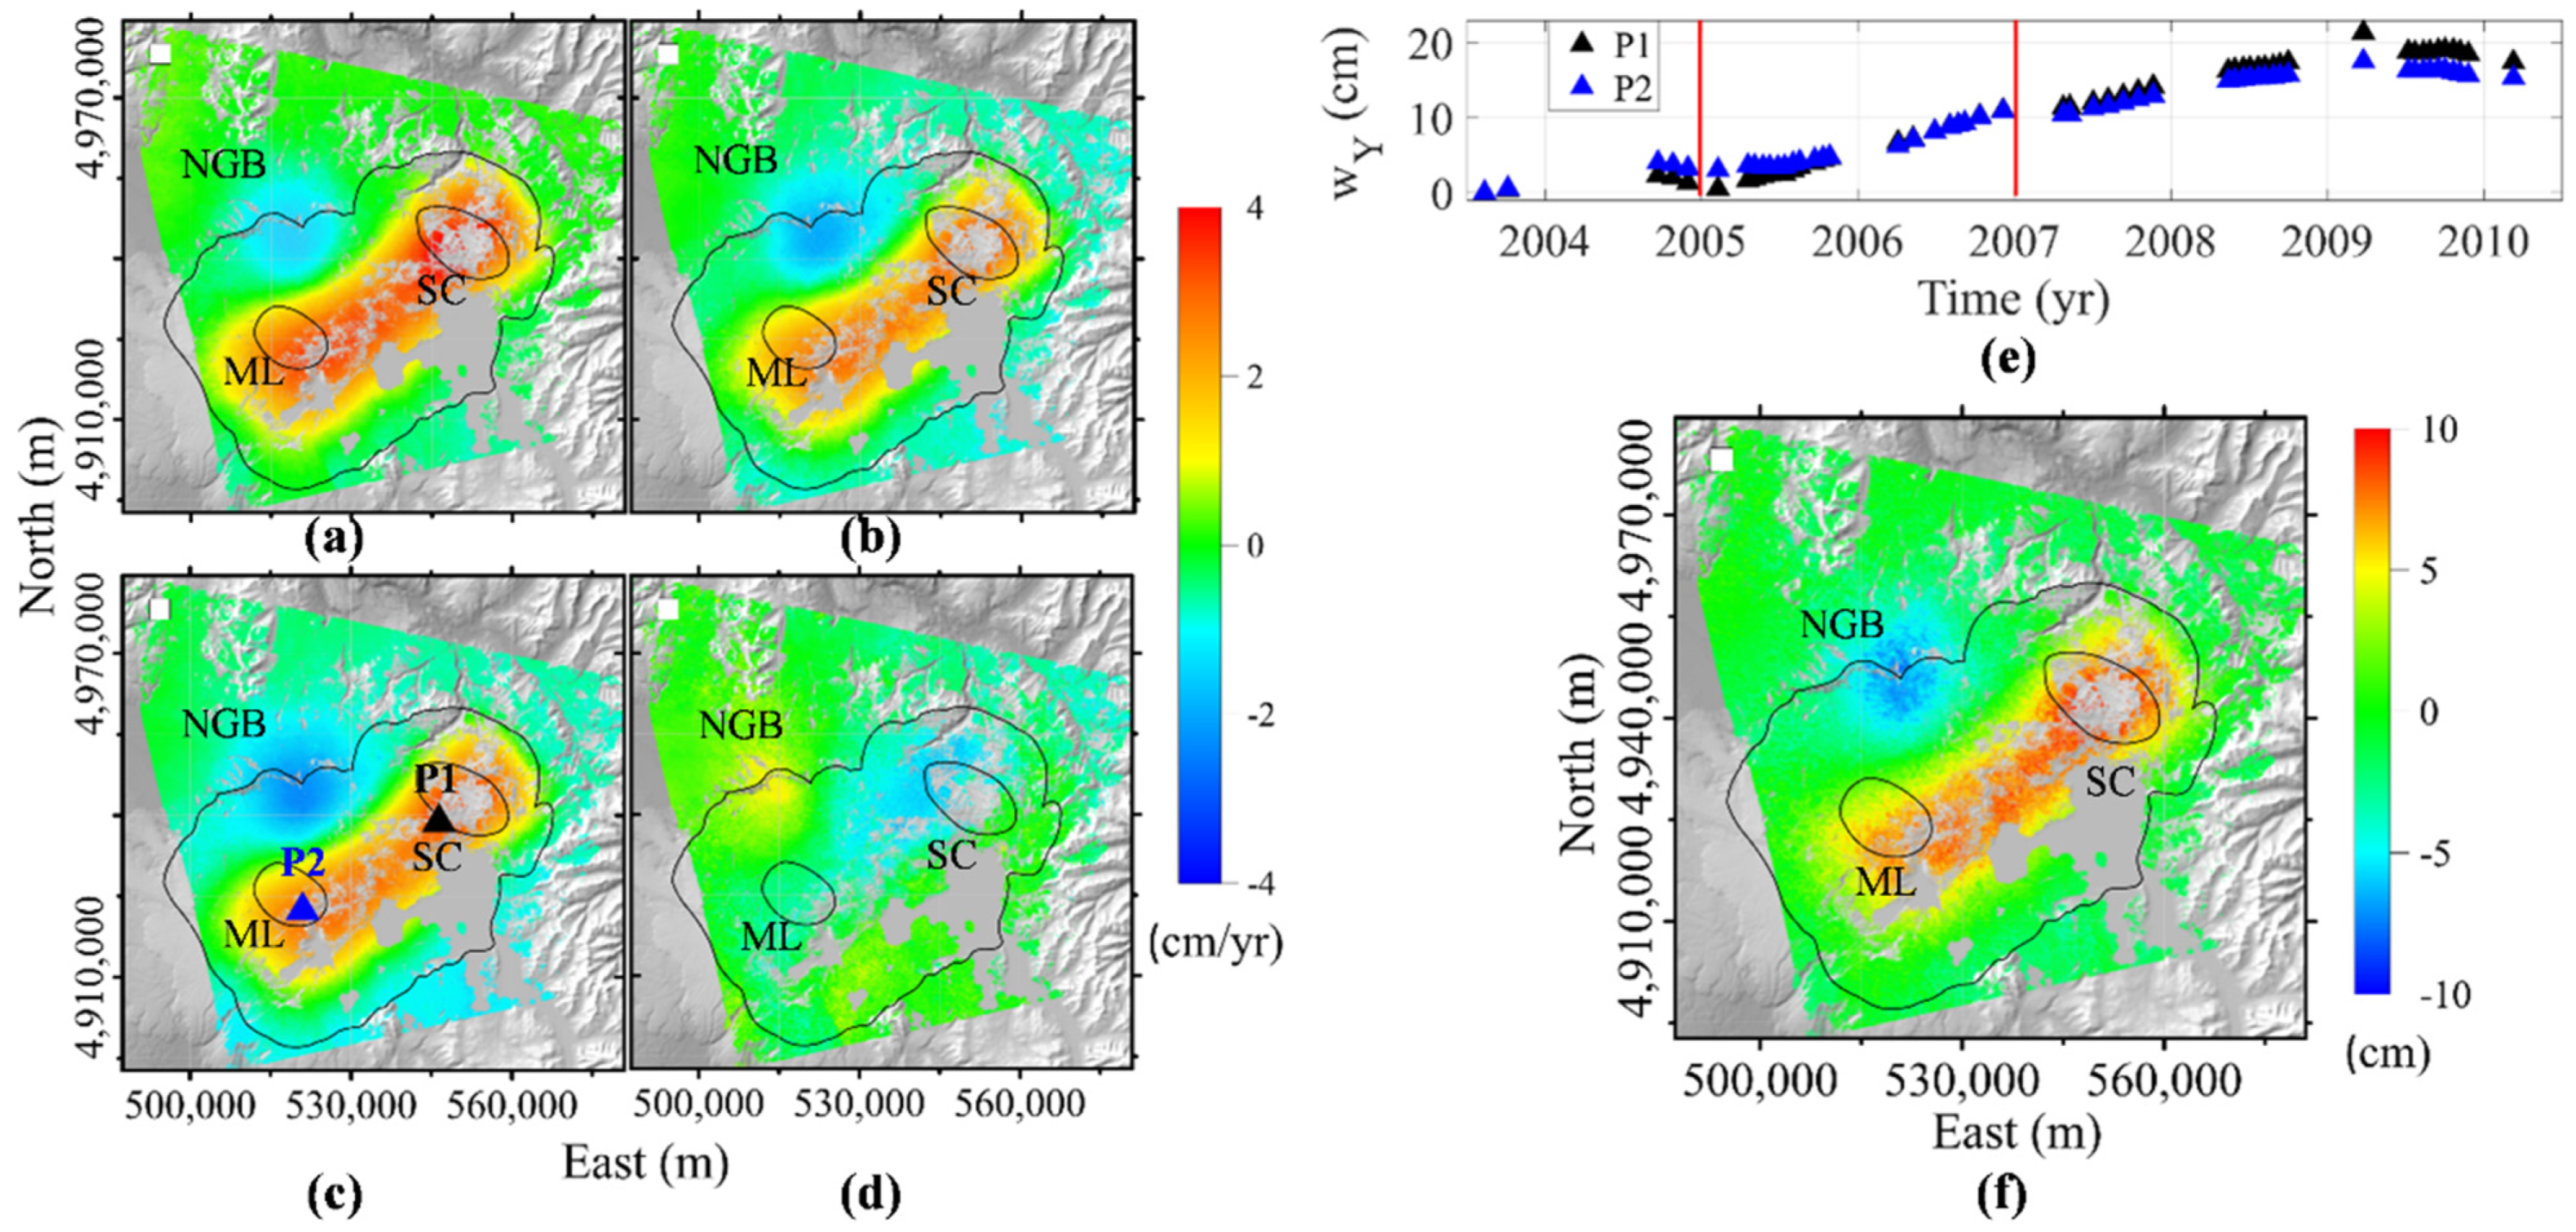
We analyze the ascending (Figure 2a) and descending (Figure 2b) LOS-projected mean deformation velocity maps, in which the deformation is referenced to a pixel in a stable north-western area (white square in Figure 2). Both orbits show that NGB moves away from the satellite, whereas SC and ML move closer to it, with a maximum deformation rate of cm/yr (Figure 2a,b). Subsequently, we derive the mean vertical (Figure 2c) and E-W (Figure 2d) velocity maps, highlighting a cm/yr deformation rate. The uplift episode affects SC and ML (Figure 2c), which move toward the east (Figure 2d), while NGB shows subsidence (Figure 2c) moving westward (Figure 2d). We focus our attention on the uplift of the resurgent domes and show the vertical deformation over time at P1 and P2 pixels (Figure 2e), which are nearby SC (black triangle in Figure 2c) and ML (blue triangle in Figure 2c). The uplift trend characterizes both these areas with different temporal rates, reaching vertical deformations greater than 20 cm at the beginning of 2009. Within the investigated period, we select a time interval characterized by a linear trend and higher velocity (red lines in Figure 2e), conditions that occur in the area of the resurgent dome during 2005–2007, where we observe a cm cumulative vertical deformation in two years (Figure 2f).
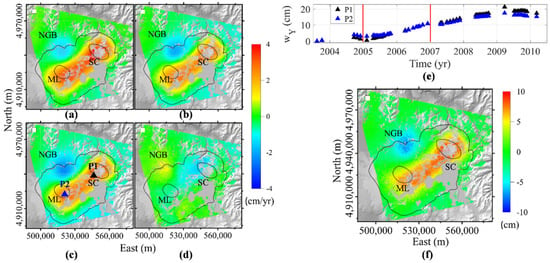
Figure 2.
ENVISAT InSAR measurements at Yellowstone caldera. Maps of the mean (a) ascending, (b) descending, (c) vertical, and (d) E−W velocity component of deformation between 2003.5 and 2010. Black and blue triangles indicate the positions of P1 and P2 pixels. (e) Time series of vertical deformation (wY) at P1 and P2 pixels; the red lines point out the selected period for analysis, 2005−2007. (f) Cumulative vertical deformation during the 2005−2007 interval. The black lines delineate the boundaries of the caldera, Mallard Lake (ML), and Sour Creek (SC) resurgent domes, whereas NGB is the Norris Geyser Basin; the white square represents the InSAR reference pixel location. The maps are plotted on top of the SRTM-DEM of the area. UTM-WGS84 projection zone: 12N. All the maps are generated by using software Surfer® 16 (http://www.goldensoftware.com/products/surfer (accessed on 1 November 2021)).
3. Results
3.1. Application to Simulated Deformation Fields
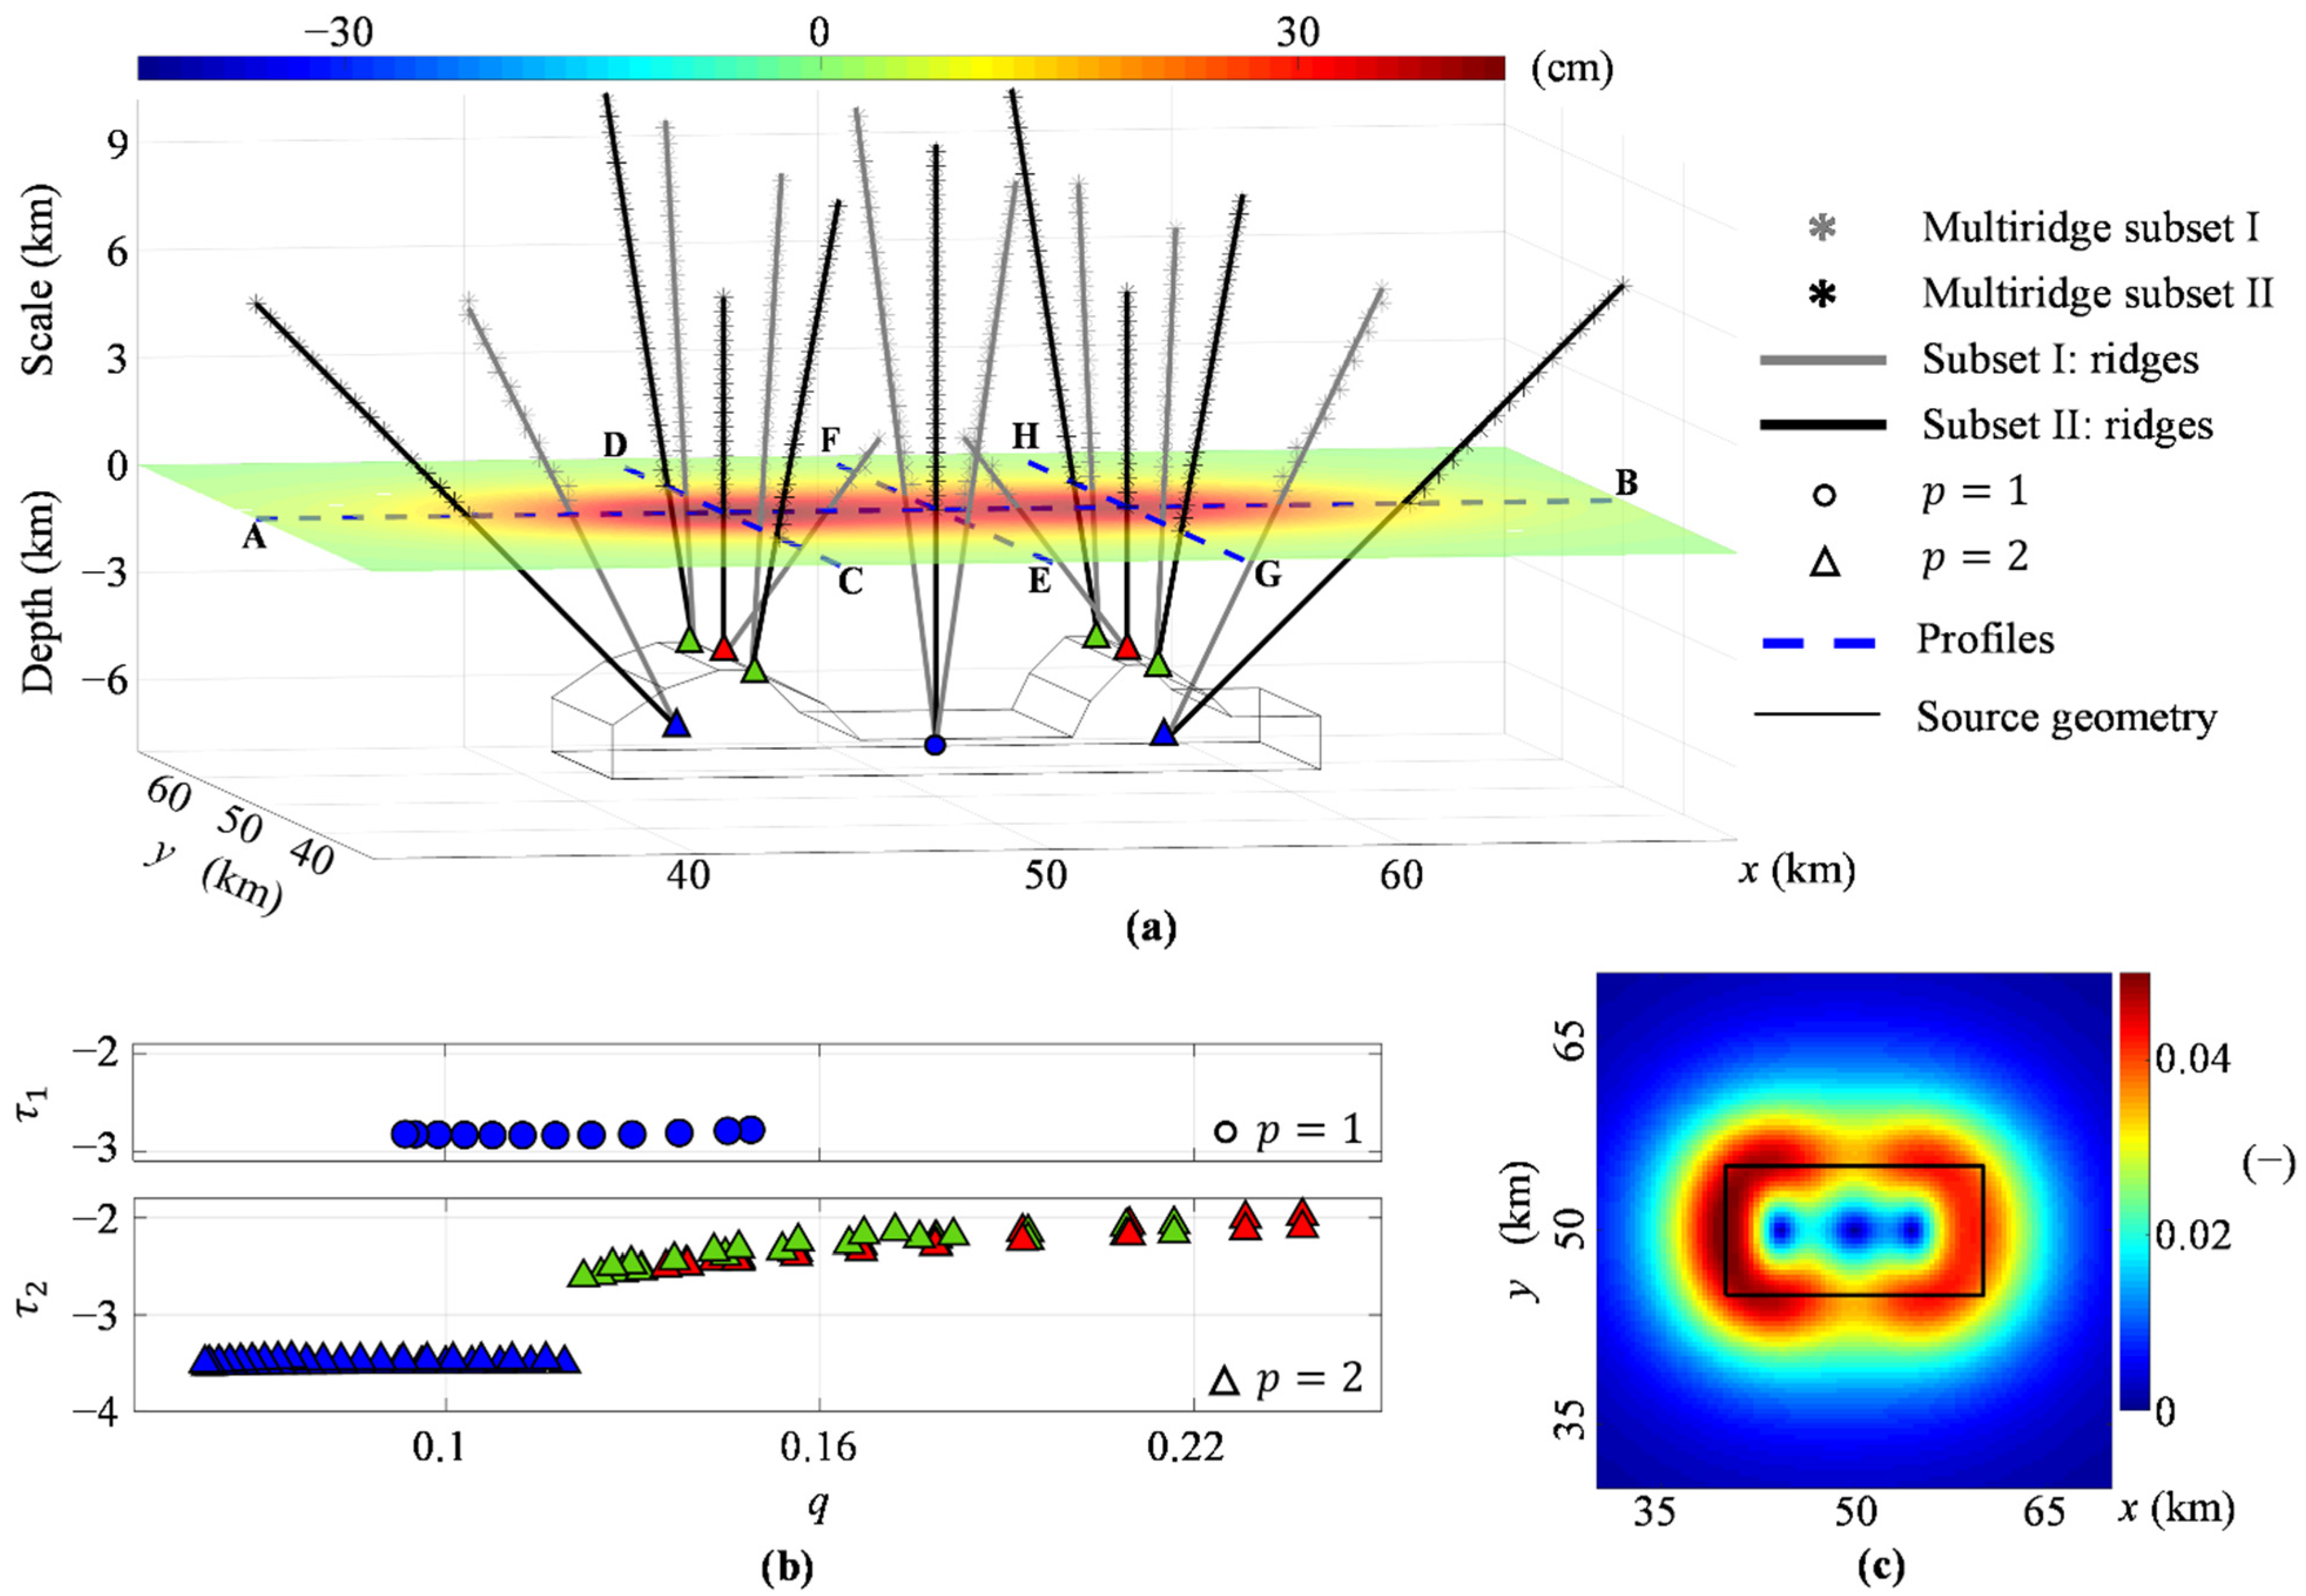
For the first simulation, we start from the calculated vertical deformation component (Figure 3a) and show the Multiridge and ScalFun results along four sections (blue dashed lines in Figure 3a). Analyzing the second-order vertical derivative () along the E-W profile (AB), crossing the highest morphological portions of the source, we retrieve four ridge intersections. The first and second intersections are localized near the centers of the highest morphological zones of the source, at −6 km depth (blue triangles in Figure 3a). In both cases, the scaling function (blue triangles in Figure 3b) and according to Equation (20), and for (11) and (12), since . The third and fourth intersections indicate the shallowest points of the source at −4 km depth (red triangles in Figure 3a), for which (red triangles in Figure 3b) and , which corresponds to . The CD profile is North-South oriented and crosses the first morphological high of the source. We analyze the second-order vertical derivative () and retrieve two ridge intersections occurring at the source boundaries, at −4 km depth (green triangles in Figure 3a), with , , , and , , , respectively (green triangles in Figure 3b). The N-S profile (EF) crosses the central flat morphological portion of the source. We retrieve an intersection by analyzing the first-order vertical derivative (), which indicates the local center of the source at −6.5 km depth (blue dot in Figure 3a), with (blue dots in Figure 3b), and , since . The last profile (GH) is oriented N-S and crosses the second morphological high. We analyze the second-order vertical derivative () and retrieve two ridge intersections occurring at the source boundaries, at −4 km depth (green triangles in Figure 3a), with , , , and , , , since (green triangles in Figure 3b). Finally, we apply the THD technique to the vertical deformation component (Figure 3a). We calculate the , whose maxima define a single source; we observe that the intensity decreases from the western to the eastern boundaries (Figure 3c).
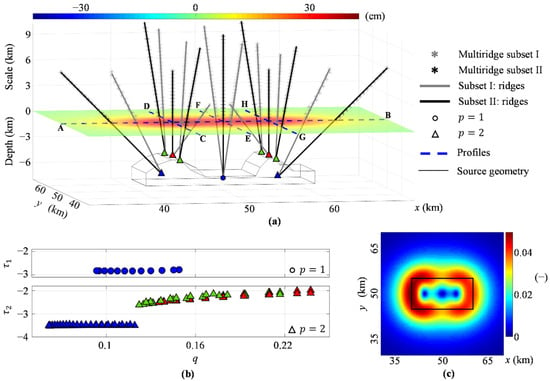
Figure 3.
Single source case. (a) Multiridge method applied to the vertical derivatives of orders 1, 2 of the simulated vertical deformation (horizontal slice). The results are displayed along with the AB (p = 2), CD (p = 2), EF (p = 1), and GH (p = 2) profiles with different symbols (see legend). (b) ScalFun method applied to the ridge subset II (fp) for both p = 1 (up) and p = 2 (down) cases; colored symbols indicate τp = ∂ log (fp)/∂ log (z) as a function of q = 1/z using the source depth estimated by the Multiridge method; z is the vertical scale. (c) THDw calculated on the simulated vertical deformation in (a); the black lines indicate the source boundary. The map is generated by using Matlab R2018b software (https://it.mathworks.com/products/matlab (accessed on 1 November 2021)).
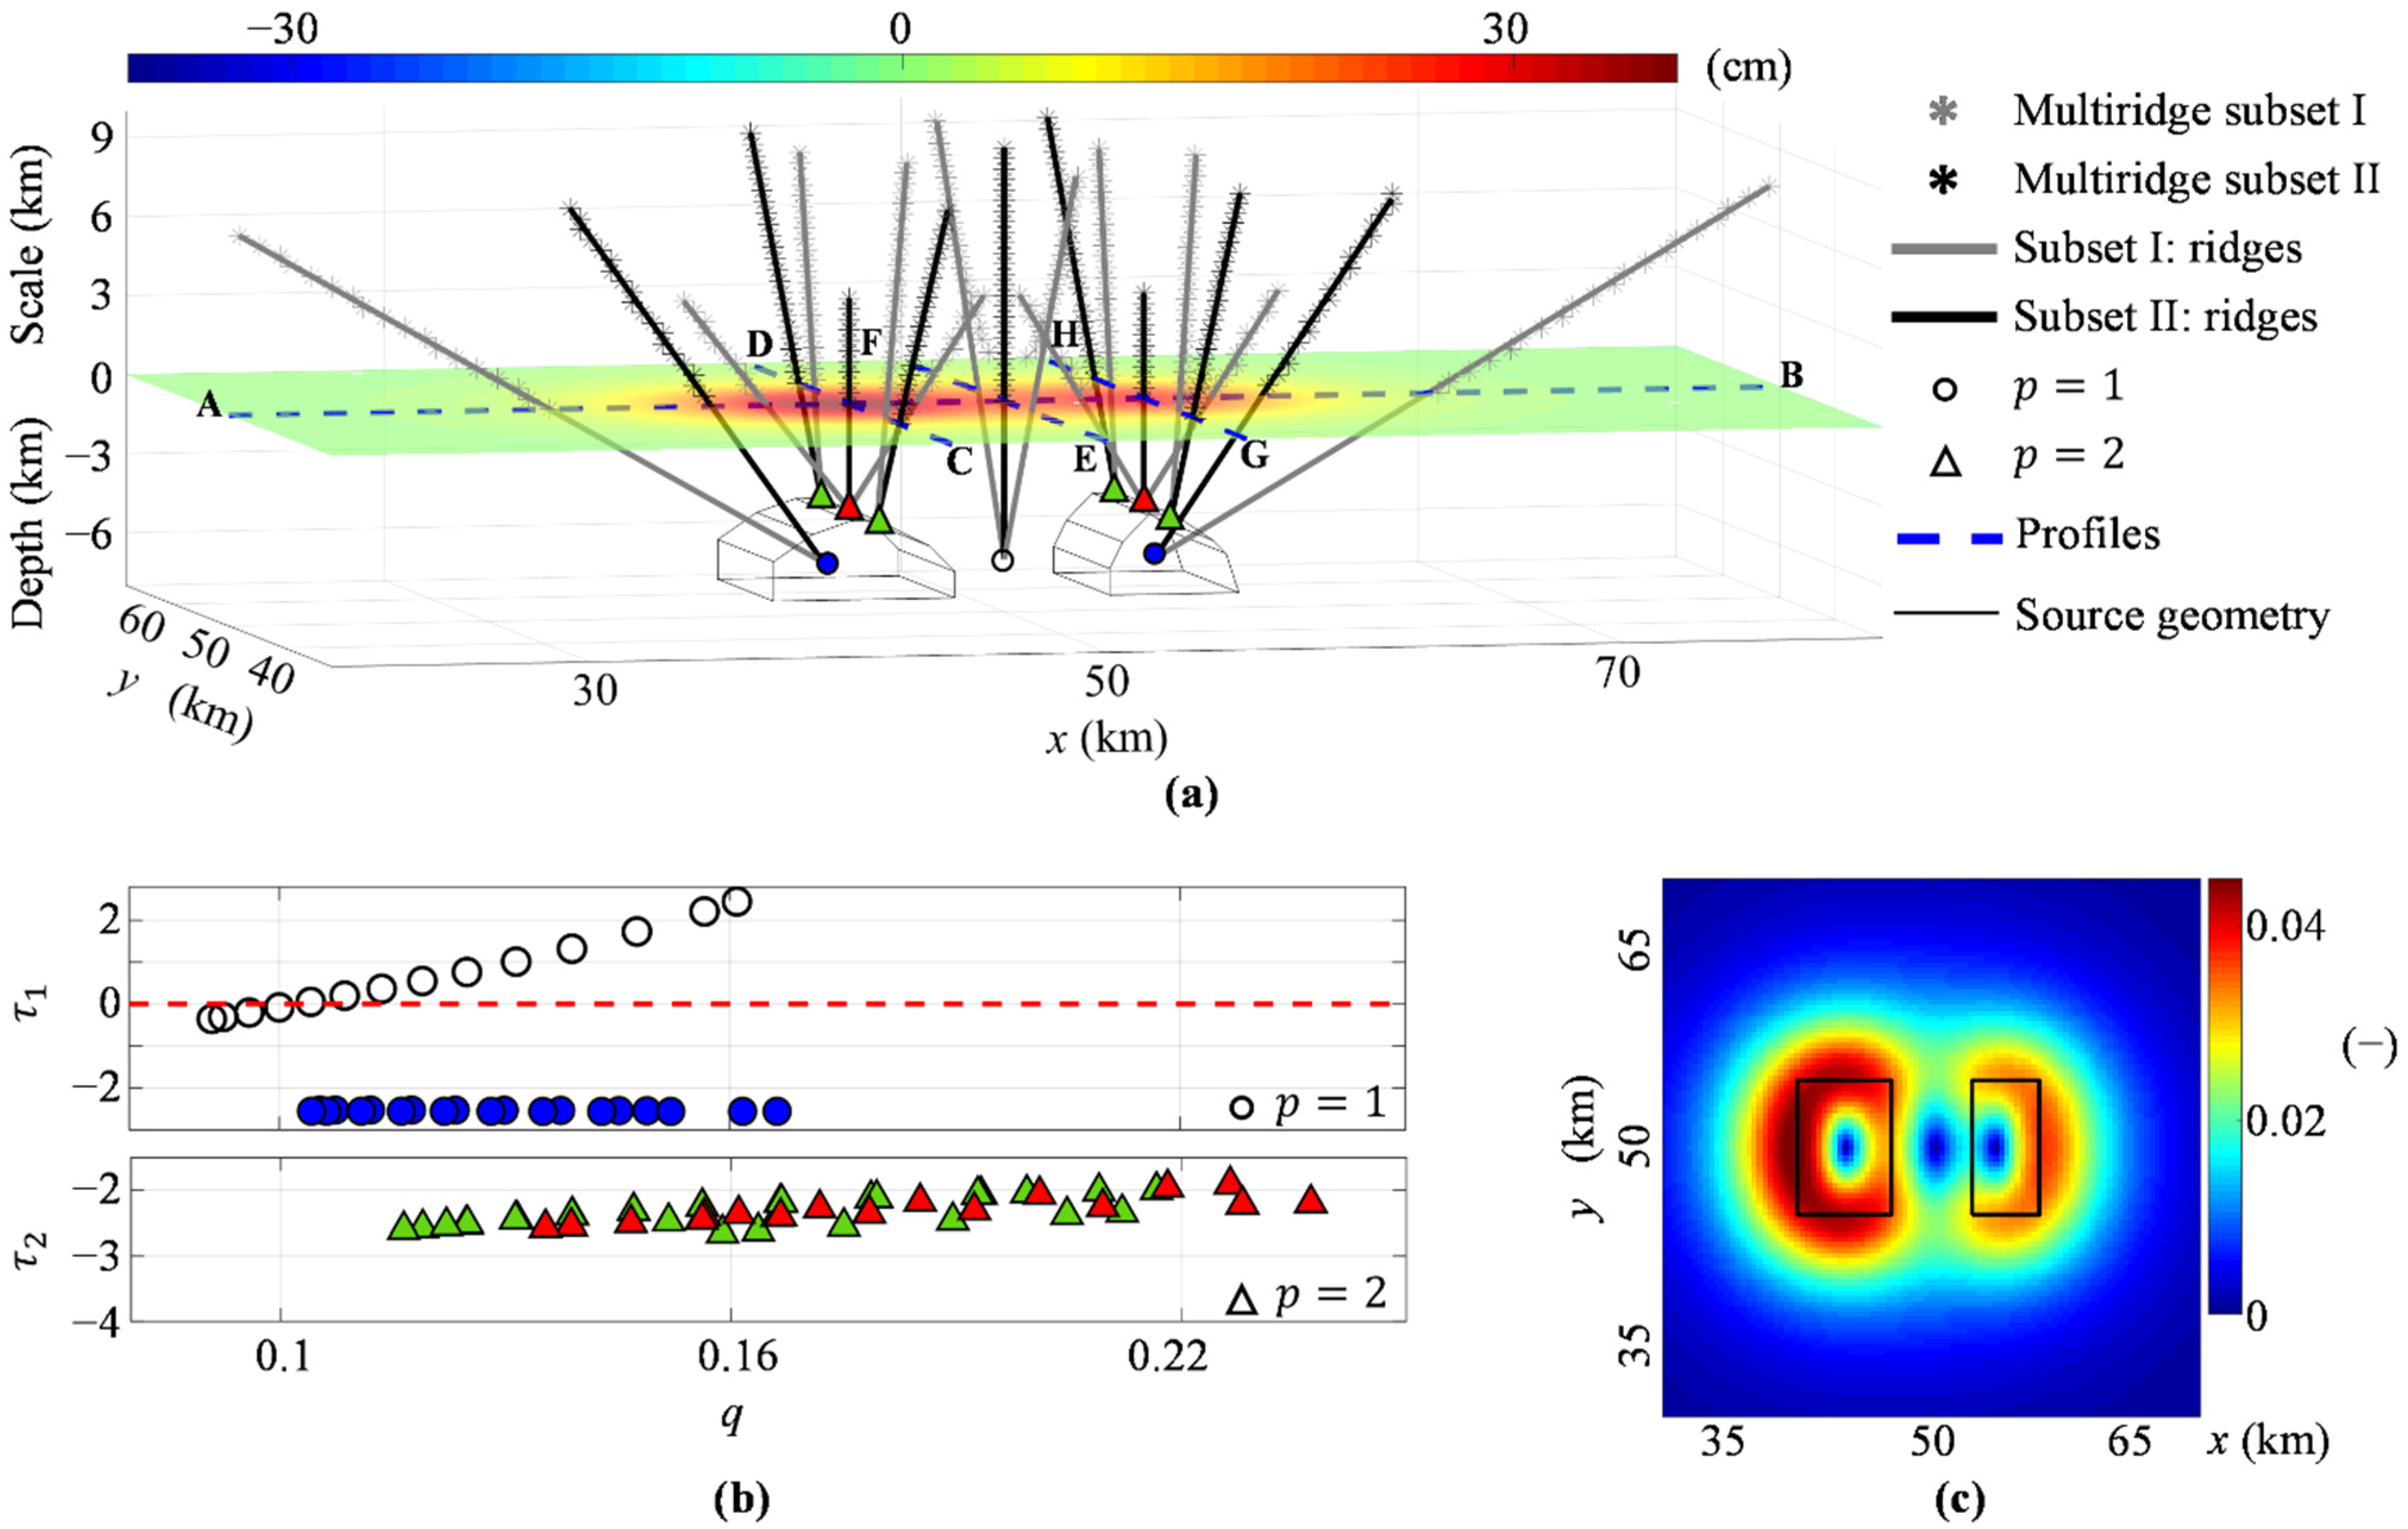
In the second simulation, we start from the computed vertical deformation component (Figure 4a) and show the Multiridge and ScalFun results along the same sections of the previous case (blue dashed lines in Figure 4a). The AB profile crosses both the sources, and we retrieve two ridge intersections by analyzing the first-order vertical derivative (); they occur near the local centers of the bodies at −6 km depth (blue dots in Figure 4a), with (blue dots in Figure 4b), and according to Equation (20), and for (11) and (12), since . We also analyze the second-order vertical derivative () and retrieve two ridge intersections indicating the shallowest points of the sources is at −4 km depth (red triangles in Figure 4a), with , , and , , , since (red triangles in Figure 4b). The CD profile crosses only the first source; we analyze the second-order vertical derivative () and retrieve two ridge intersections occurring at the source boundaries at −4 km depth (green triangles in Figure 4a), with (green triangles in Figure 4b), and . The EF profile crosses a region without sources (blue dashed lines in Figure 4a), and we analyze the first-order vertical derivative () and retrieve a single intersection at −6 km depth (black dot in Figure 4a), characterized by values (black dots in Figure 4b) that yield a value of outside the allowed range [0, …, 3] [30]. Strong interference effects between nearby anomalies are the cause of these values. The last GH profile crosses only the second source. We analyze the second-order vertical derivative () and retrieve two ridge intersections lying on the source boundaries at −4 km depth (green triangles in Figure 4a), with (green triangles in Figure 4b), and , since . Finally, we apply the THD technique to the vertical deformation (Figure 4a). We calculate the , whose maxima clearly define the boundaries of two different bodies. We observe a greater intensity at the western part of the map, that is, at the western body (Figure 4c).
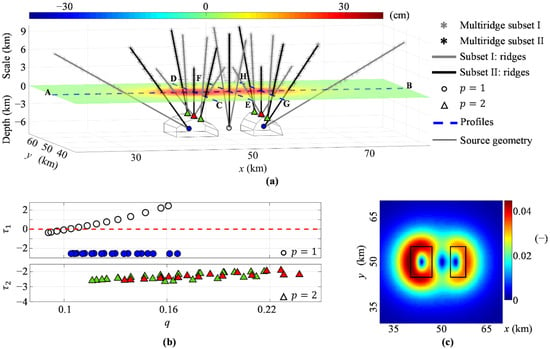
Figure 4.
Multisource case. (a) Multiridge method applied to the vertical derivatives of orders 1, 2 of the simulated vertical deformation (horizontal slice). The results are displayed along with the AB (p = 1 and p = 2), CD (p = 2), EF (p = 1), and GH (p = 2) profiles with different symbols (see legend). (b) ScalFun method applied to the ridge subset II (fp) for both p = 1 (up) and p = 2 (down) cases; colored symbols indicate τp = ∂ log (fp)/∂ log (z) as a function of q = 1/z using the source depth estimated by the Multiridge method; z is the vertical scale. The red dashed line represents the value τ1 = 0. (c) THDw calculated on the simulated vertical deformation in (a); the black lines indicate the boundary of the sources. The map is generated by using Matlab R2018b software (https://it.mathworks.com/products/matlab (accessed on 1 November 2021)).
3.2. Application to Real Case: 2005–2007 Uplift Episode at Yellowstone Caldera
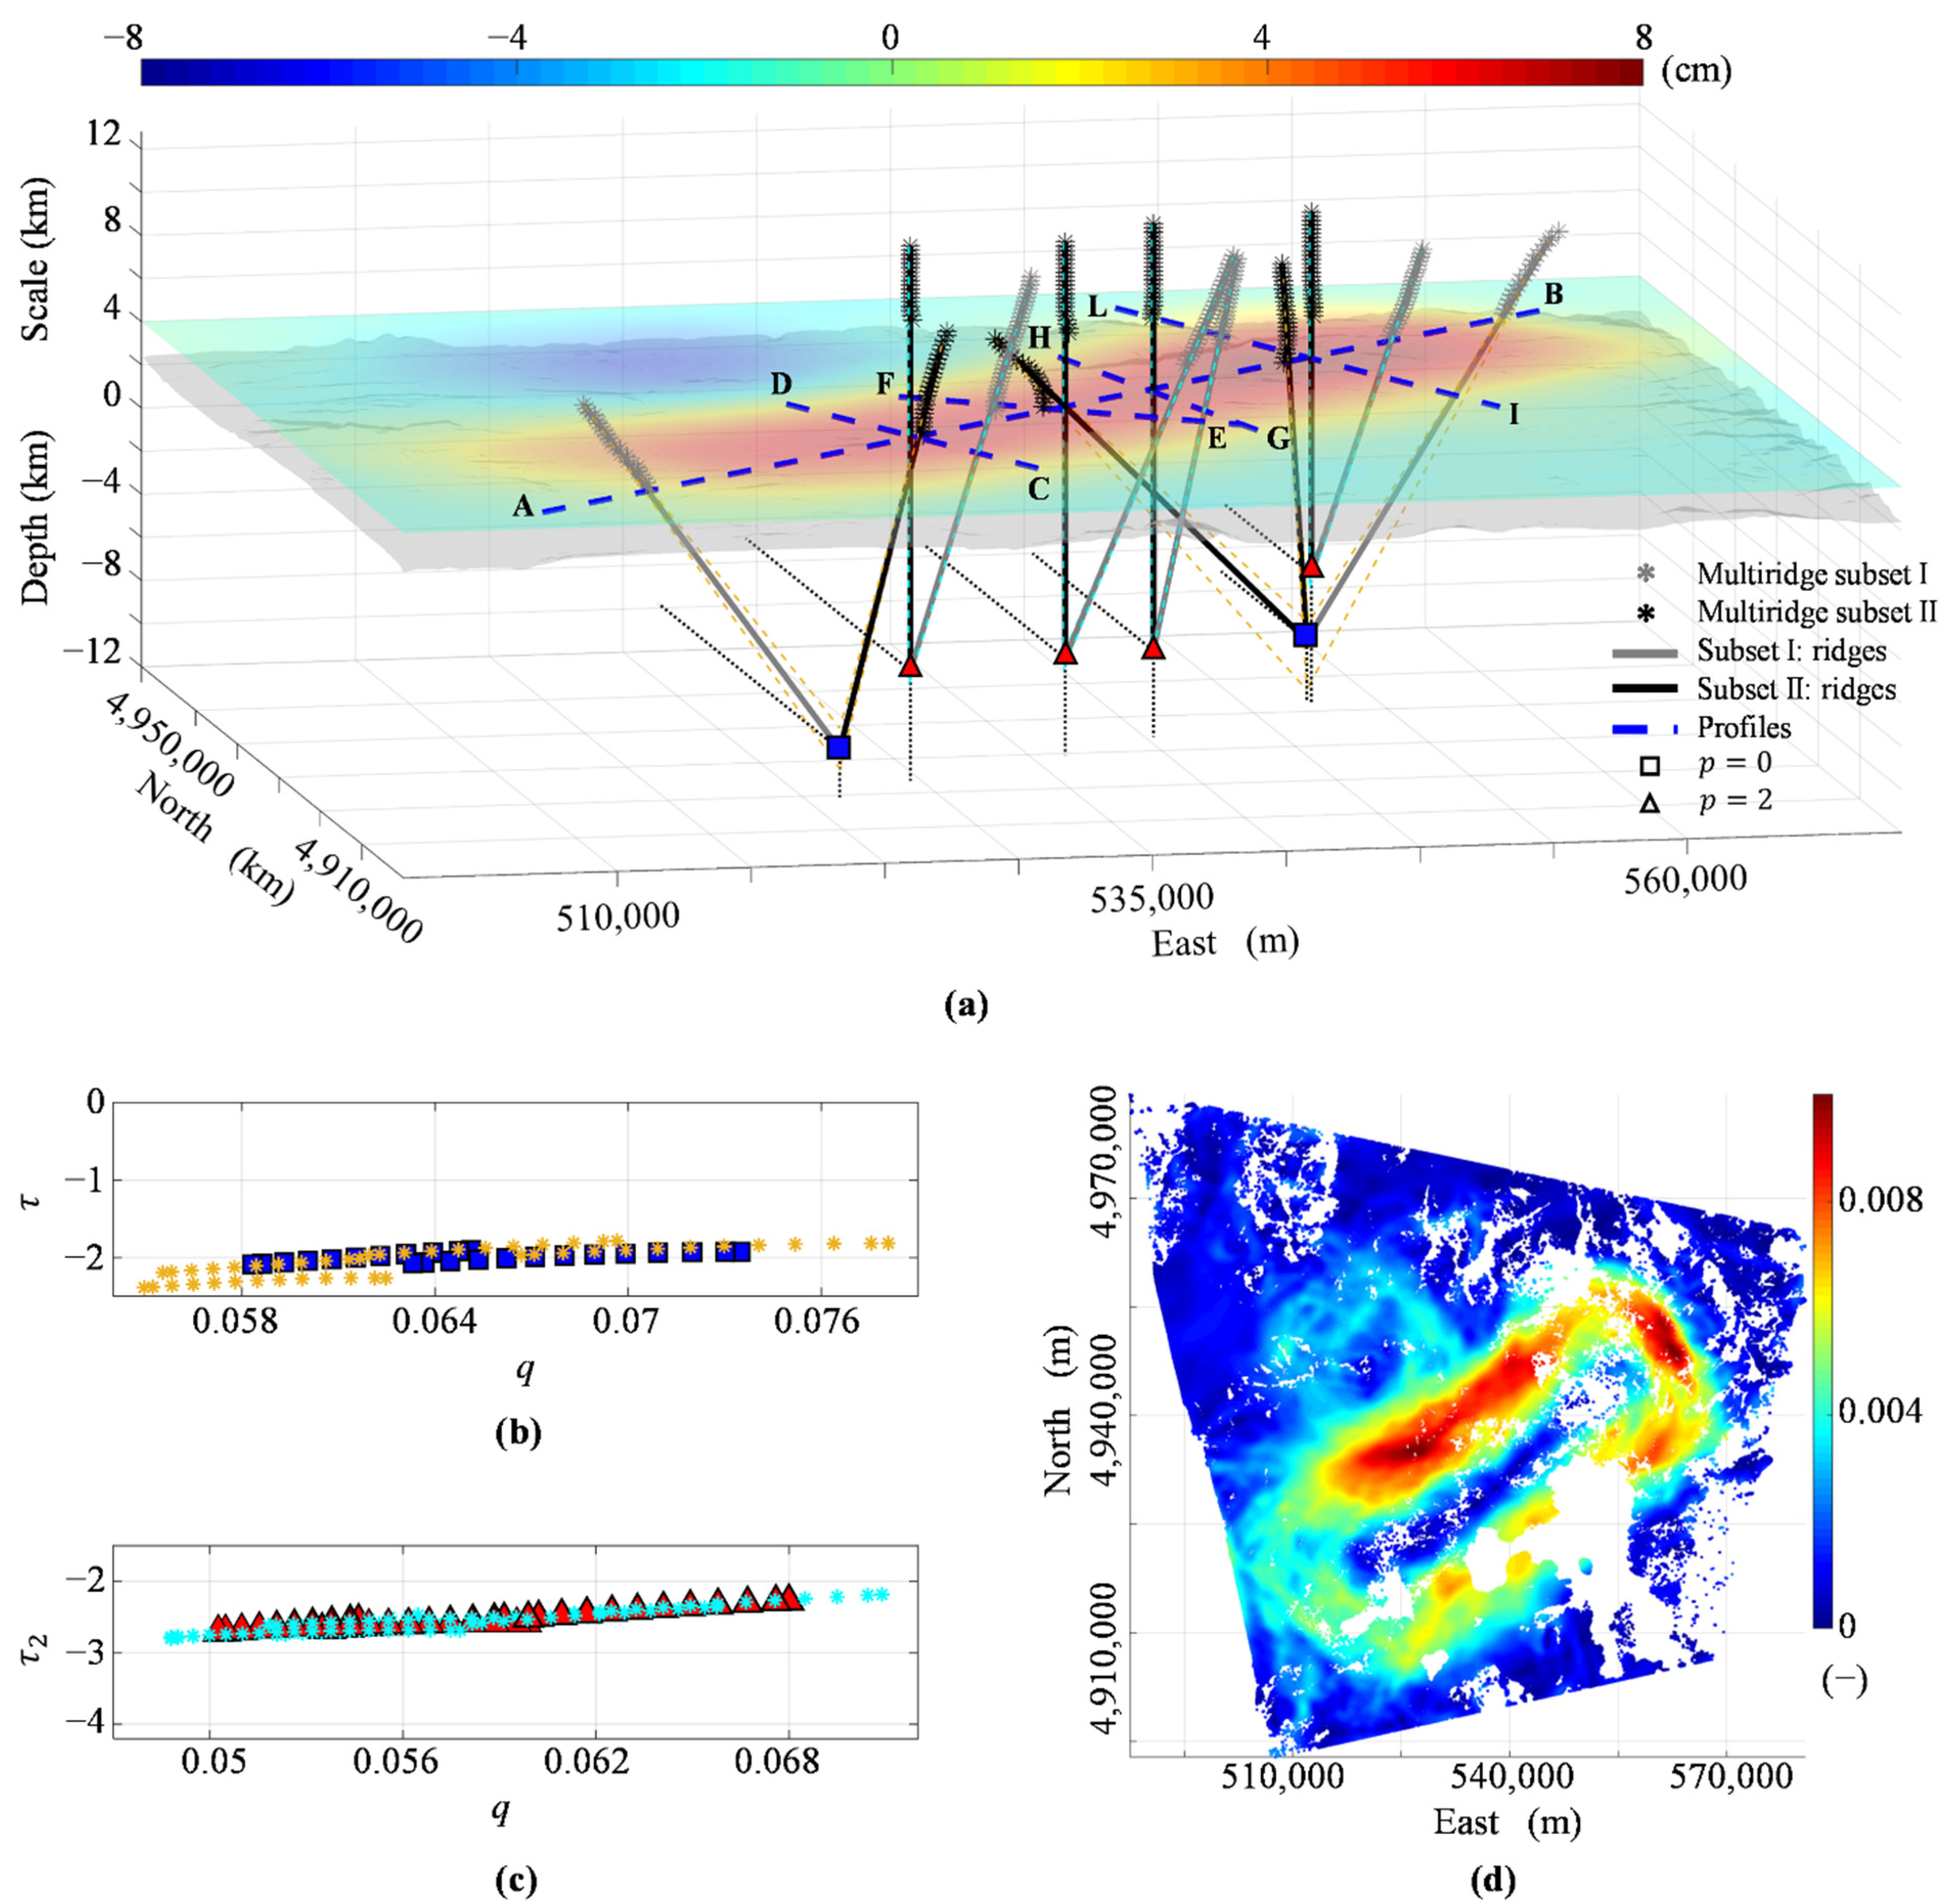
We apply the integrated multiscale approach to the above-mentioned cumulative 2005–2007 vertical deformation, focusing our analysis on the SC and ML resurgent domes area. We start from the vertical deformation (Figure 2f) and calculate a regular grid, using a natural neighbor interpolator and a sampling step of 100 m. We then apply the draped-to-flat continuation procedure [39] and evaluate the vertical deformation to +4 km scale (horizontal slice in Figure 5a). We show the Multiridge and ScalFun results and their uncertainties along five profiles by excluding from our multiscale dataset the scales at which we note a very high wavenumber noise. The SW-NE-oriented AB profile crosses both the SC and ML resurgent domes (blue dashed line in Figure 5a); we compute a multiscale dataset [26] with 200 m continuation sampling and 9 km a.s.l. maximum scale. We analyze the field component () and retrieve two ridge intersections: the first is at km b.s.l. depth beneath ML at [524,200 E ± 500 m, 4,919,400 N ± 500 m] (blue square in Figure 5a); the second is placed beneath SC at [550,600 E ± 1000 m, 4,942,500 N ± 1000 m], with km b.s.l. depth (blue square in Figure 5a). The following parameters characterize these intersections: (blue squares in Figure 5b) and according to Equation (20), and for Equations (11) and (12) since . We consider the second-order vertical derivative (), and we fix the maximum scale at 12 km a.s.l. for the other profiles, which transversely cross the AB profile (blue dashed lines in Figure 5a). The CD profile crosses ML; we observe one ridge intersection at [528,250 E ± 200 m; 4,923,500 N ± 200 m], with km b.s.l. depth (red triangle in Figure 5a), (red triangles in Figure 5c), , and since . The EF profile is between SC and ML, and here we retrieve one ridge intersection at [536,600 E ± 200 m; 4,929,500 N ± 200 m], with km b.s.l. depth (red triangle in Figure 5a), (red triangles in Figure 5c), , and . The GH profile is also placed between SC and ML; we identify one ridge intersection at [541,600 E ± 200 m, 4,933,950 N ± 200 m], with km b.s.l. depth (red triangle in Figure 5a), (red triangles in Figure 5c), , and . The last IL profile crosses the SC, and here there is one ridge intersection at [550,600 E ± 200 m, 4,942,200 N ± 200 m], with km b.s.l. depth (red triangle in Figure 5a), (red triangles in Figure 5c), , and . We summarize the results of the multiscale method in Table 2. Finally, we apply the THD technique to the vertical deformation component (Figure 5a). We calculate the and analyze its intensity distribution: the maxima define only one extended body beneath both SC and ML (Figure 5d). We observe an increasing intensity of in the northeastern part of the caldera.
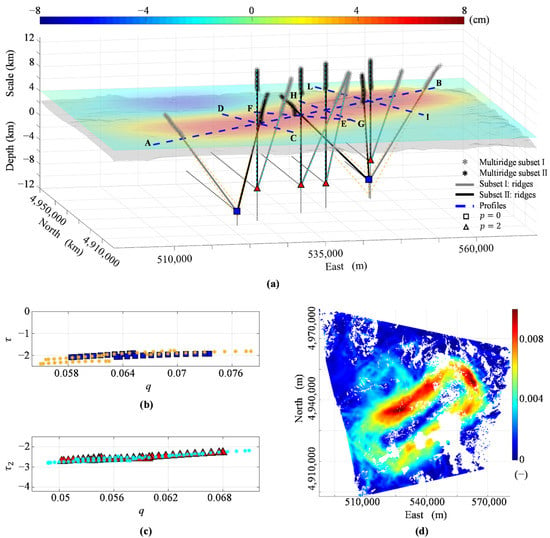
Figure 5.
Yellowstone caldera case study. (a) Multiridge method applied to the 2005−2007 vertical deformation (p = 0) and its vertical derivative (p = 2). The horizontal slice shows the draped-to-flat continued field to a +4 km scale; the SRTM-DEM is also shown. The results are displayed along with the AB (p = 0), CD (p = 2), EF (p = 2), GH (p = 2), and IL (p = 2) profiles with different symbols (see legend); the orange and cyan dashed lines point out the range solutions, whereas the black dotted lines represent the projection of the ridges intersections. (b,c) ScalFun method applied to the ridge subsets II (fp) of p = 0 and p = 2 cases, respectively; colored symbols indicate τp = ∂ log (fp)/∂ log (z) as a function of q = 1/z using the estimate of source depth (squares and triangles) and its bound solutions (asterisks) by the Multiridge method; z is the vertical scale. (d) THDw calculated on the vertical deformation in (a). The map is generated by using Matlab R2018b software (https://it.mathworks.com/products/matlab (accessed on 1 November 2021)).

Table 2.
Results of multiscale methods at Yellowstone caldera.
4. Discussion
We have proposed an integrated multiscale approach to analyze the deformation fields, taking advantage of the potentialities of the multiscale strategy for a more realistic modeling of volcanic bodies. This has allowed us to retrieve unconstrained information on the source geometrical parameters for different irregular geometry scenarios through the use of the Multiridge [28] and ScalFun [29] methods and boundary analysis techniques, for example the THD [26]. In particular, while the THD technique provides information on the horizontal extent of the source, or its horizontal boundaries, the multiscale procedures enable estimation in a more objective way of the source depth, horizontal position, and Structural Index parameter , which defines the sources’ morphological features. This is a remarkable advantage over classical approaches: the source depth does not depend on a priori selection of model parameters and especially of a specific AM. Previous experiments have also shown that the Multiridge and ScalFun methods are suitable for analyzing any deformation components [23,24,25]. However, some limitations could affect the integrated multiscale approach. As with all the interpretation methods, the quality of the results depends on the accuracy of the analyzed data and its spatial sampling and distribution; for example, it is not suitable for analyzing datasets retrieved by Leveling and Global Navigation Satellite System (GNSS) techniques, for which the spatial distribution of the measurements is not usually sufficiently dense. We also note that our methodology does not provide information about source pressure or volume change parameters. As final remark, the THD technique can be applied to the vertical deformation, giving reliable results only in the case of multipolar field sources, such as the sill-like one.
We have started with the applicability of the multiscale methods, which are based on assuming that the ground deformation field is expressed by harmonic and homogeneous functions. This is satisfied in the case of ideal sources with hydrostatic and embedded in a homogeneous half-space [25]; furthermore, Barone et al. [25] have shown that scenarios based on sources embedded in layered media, whose and parameters do not substantially change between layers, also satisfy the multiscale requirements. Within these conditions, ridge intersections occur at the source center with for 3-D concentrated bodies, at the top of a vertical pipe with , and at the sill boundary with .
In the case of general deformation sources (i.e., also non-ideal), we have here shown that the multiscale approach can still be used to analyze sources with irregular geometry; indeed, according to results found by Gerovska et al. [32] for gravity and magnetic anomalies, synthetic tests have shown that the Multiridge method yields intersections between the center and the top/boundaries of the source. At the same time, the ScalFun method characterizes these depth solutions also with fractional values (Figure 1, Figure 3 and Figure 4).
We have demonstrated the soundness of the proposed methodology by applying the integrated multiscale approach to simulated deformation cases: it has provided reliable constraints on the geometrical parameters of sources with irregular geometry, also allowing the discrimination of a single source scenario from the multisource one. These tests have shown that the Multiridge method provided intersections within the geometrically irregular bodies, and the ScalFun method has characterized these depth solutions with non-integer values. In the case of the single irregular body, we have analyzed the large scales by retrieving at least three intersections nearby the source local centers with . Then, the analysis at low scales provided intersections near the top/boundaries of the body with . Finally, the THD technique has highlighted the projection on the - plane of a single source: the maxima match well with the horizontal extent of the modeled body (black lines in Figure 3c); moreover, the distribution of intensity suggests that the western source portion is shallower than the eastern portion or that the body volume increases from E to W. In the multisource case, we have estimated the depth of points nearby the centers of both the bodies by considering a large-scale interval and estimating , while we have analyzed the low-scale interval, characterizing the top/boundaries of both the sources with . We have also investigated a central region without sources achieving a value out of the allowed range. This has suggested that, unlike the previous case, we have met a multisource scenario and that different solutions with and are related to two distinct bodies. Finally, the THD technique has confirmed the multisource hypothesis: the maxima delineate the boundaries of two separate bodies, which match the horizontal extent of both the sources (black lines in Figure 4c). The distribution of intensity may suggest that the western body is shallower and/or greater than the eastern one. However, the intensity may also indicate the different distribution of the and parameters of the medium with respect to the embedded source.
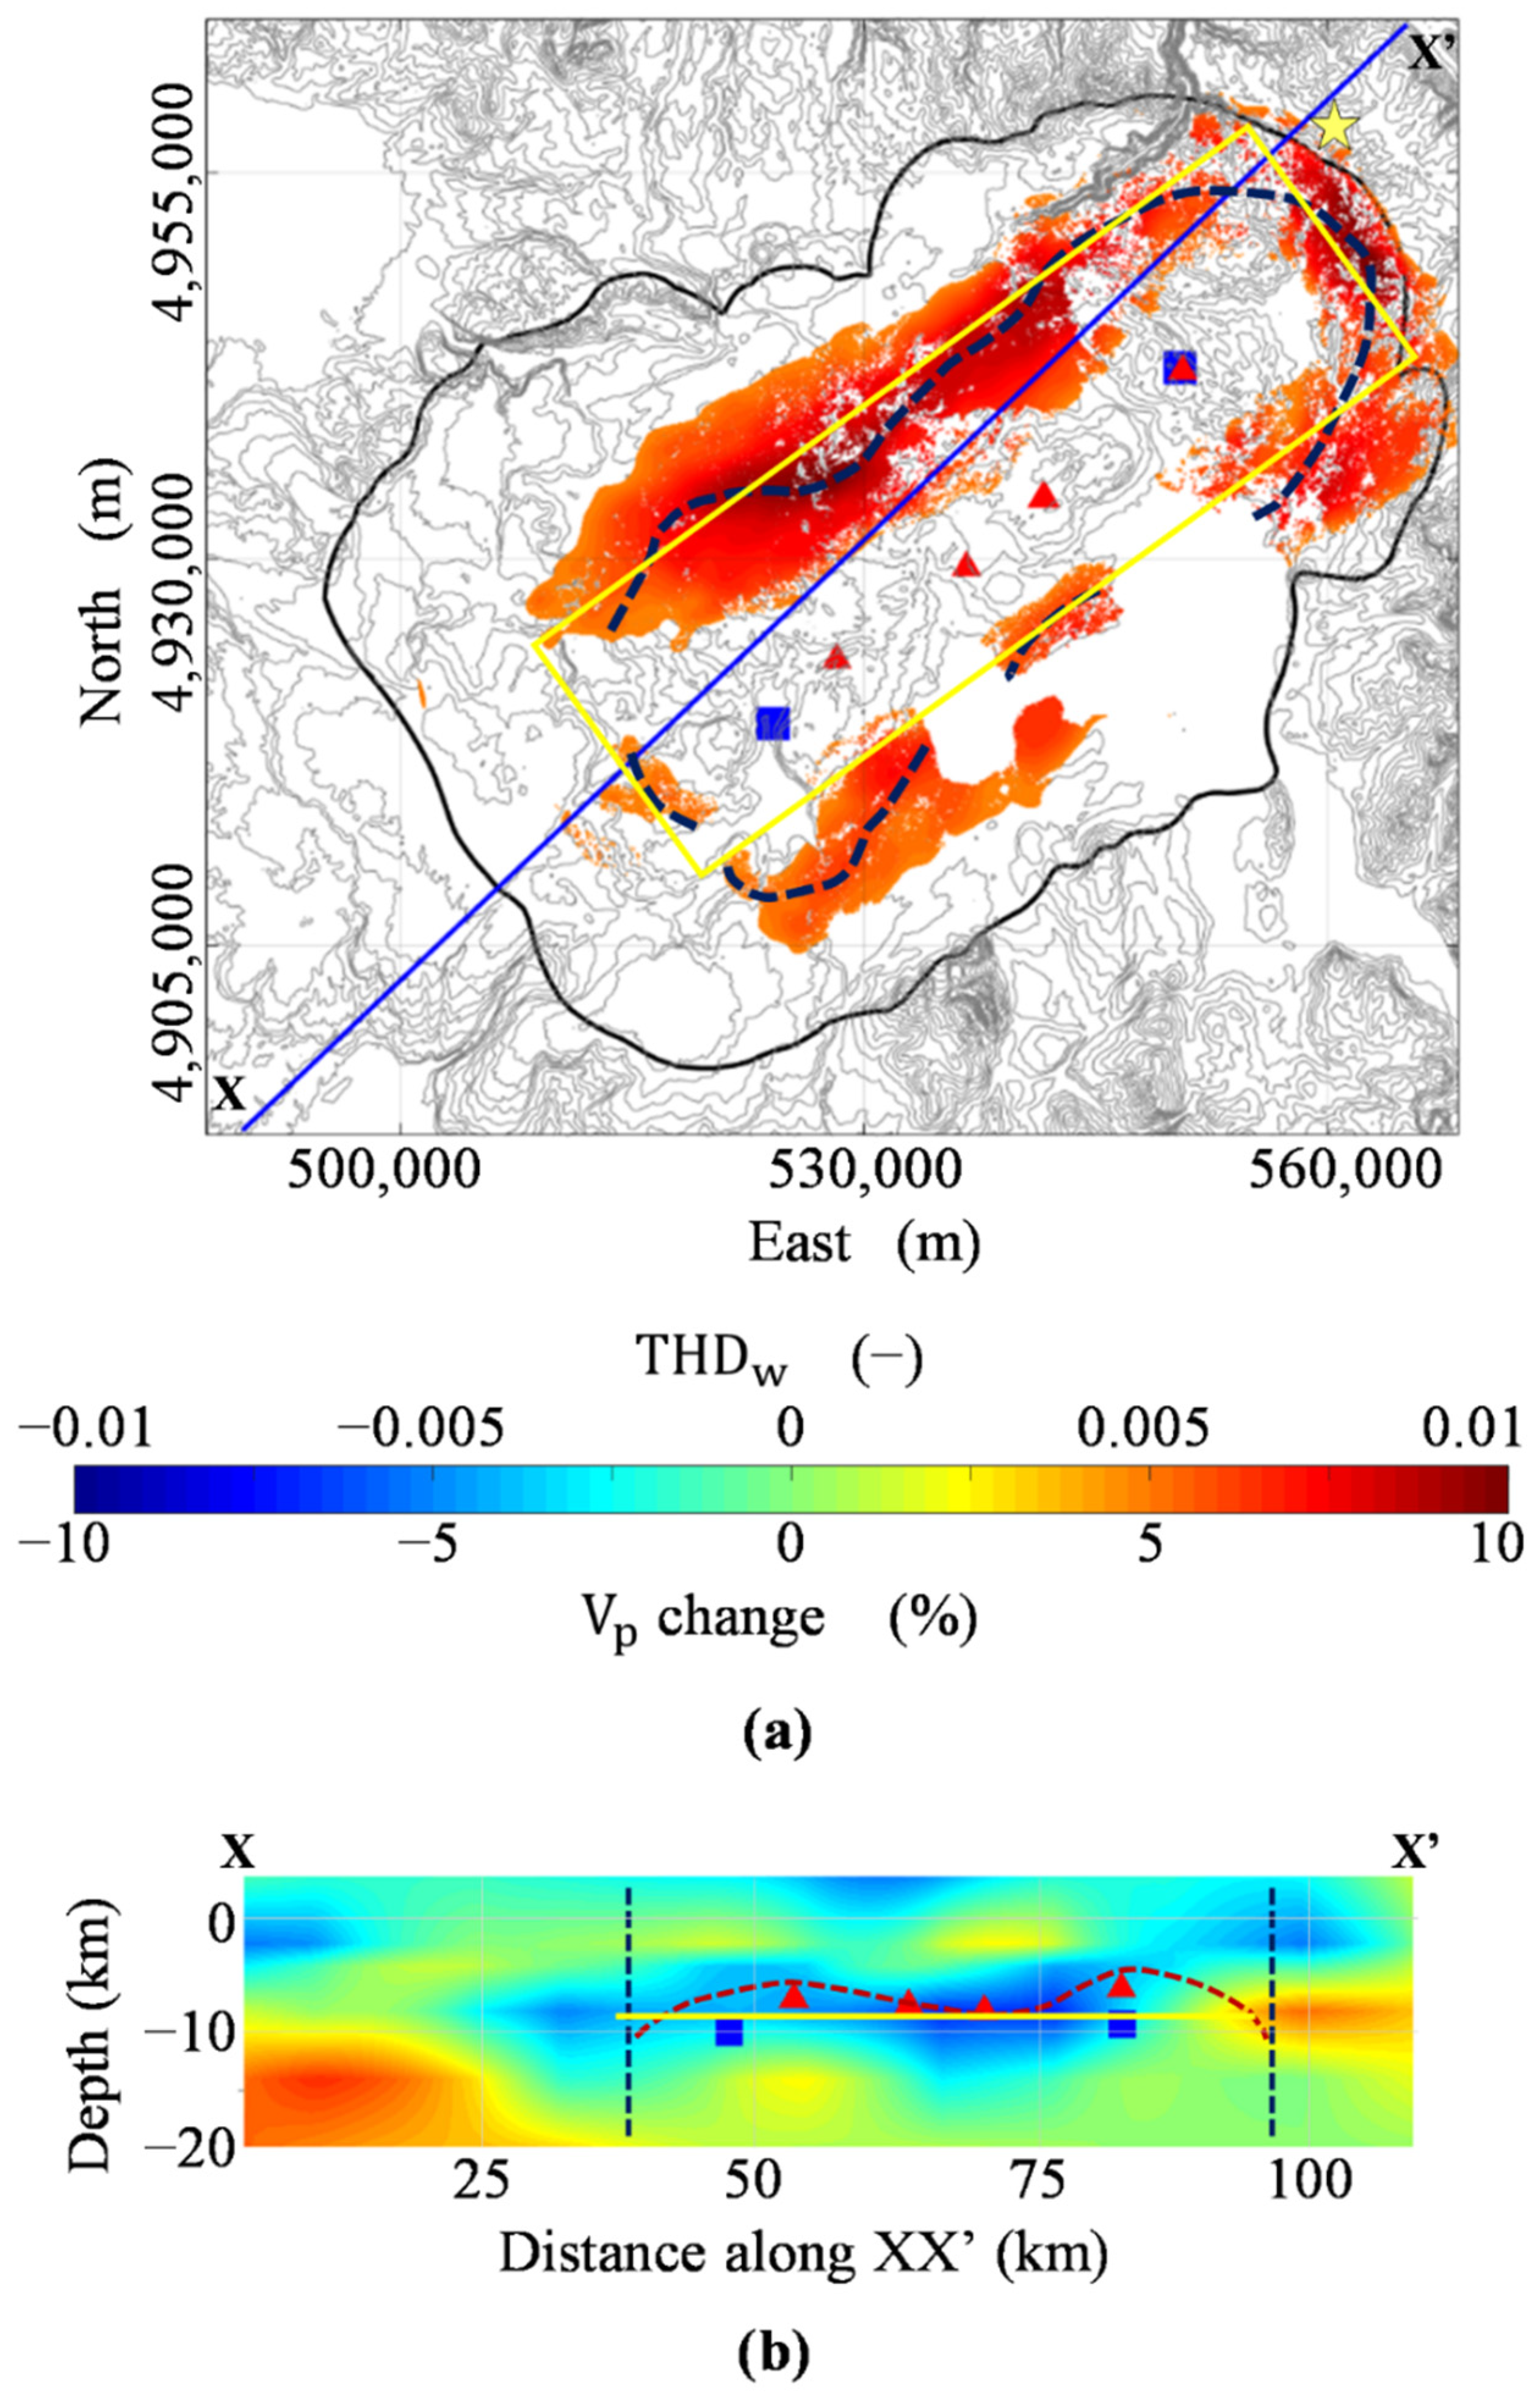
We have processed a set of SAR ENVISAT satellite images of the Yellowstone caldera to obtain the vertical and E-W components of InSAR-derived ground displacement measurements. In particular, we have studied the uplift episode at the resurgent domes area of Yellowstone caldera during the 2005–2007 interval by employing the integrated multiscale approach to model the source responsible for cumulative vertical deformation. The use of the proposed approach has allowed us to investigate the sources’ geometrical irregularities at this complex volcanic site, providing additional information regarding the volcanic plumbing system beyond that known from previous geodetic models, based on optimization/inverse procedures [6,21,33,34,35]. The results of the Multiridge and ScalFun methods along five profiles have provided two depth solutions with (blue squares in Figure 6) and four with (red triangles in Figure 6). We associate the solutions with to a single source and model this as a body with and km b.s.l. depth to the center, passing from ML to SC, respectively (blue squares in Figure 6b). We have also investigated the top of the source using the solutions, which show depth values of km b.s.l below ML, km between the domes, and km below SC (red triangles and dashed line in Figure 6b). The THD technique has supported the single source scenario and has provided information about its extent: the maxima distribution (Figure 6a,b) highlights the presence of a km2 extended body (dark blue dashed lines in Figure 6a,b). Although the depends on the spatial data distribution, its intensity is more significant at the northeastern boundaries. We may associate this finding to a shallower or larger volume source distribution beneath the eastern part of Yellowstone caldera; however, we cannot exclude the role of the upper crust heterogeneities associated with the quaternary HSB faults [33] (yellow star in Figure 6a) in modulating the distribution. This has already been highlighted by Pepe et al. [7] for the analysis of the ground deformation field at Campi Flegrei caldera. Therefore, we have interpreted the 2005–2007 event as produced by a single km2 horizontally extended sill-like source at 9–10 km b.s.l. of depth to the center and with a top that is shallower beneath ML (7 km b.s.l.) and SC (6 km b.s.l.), and deeper between them (8 km b.s.l.).
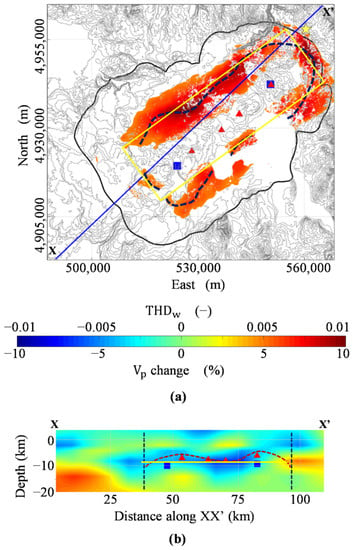
Figure 6.
Yellowstone caldera source interpretation. (a) Boundaries and depth solutions of this study superimposed on the topography of the investigated area (grey contour lines). The blue line represents the P-wave velocity model’s XX’ trace, while the black line points out the caldera boundaries. The yellow star indicates the position of the HSB, and the dark blue dashed lines stand for the maxima alignments of THDw. The yellow rectangle points out the sill source solution redrawn from Delgado and Grandin [21]. (b) P-wave velocity model along the XX’ section (redrawn from Farrell et al. [1]) on which the boundaries and depth solutions of this study are projected. The dark blue and red dashed lines indicate the projection of the THDw maxima on the XX’ section and the interpretation of the top of the deformation source, respectively, while the yellow line is the projection along the same section of the sill source solution redrawn from Delgado and Grandin [21]. Blue squares and red triangles characterize Multiridge solutions with N~3 and 1 < N < 2, respectively. Figures are generated by using Matlab R2018b software (https://it.mathworks.com/products/matlab (accessed on 1 November 2021)).
Our interpretative model of the deformation source is compatible with the P-wave velocity model presented by Farrell et al. [1], in which the authors have highlighted a magmatic system from 5 to 20 km depth. The proposed sill top (red dashed lines in Figure 6b) agrees with the negative anomaly of the P-wave velocity change (from −6 to −4%), which is shallower beneath SC and ML, and deeper between the domes (Figure 6b). Moreover, the sill center, projected along the X-X’ velocity model section, matches with the −2% of Vp iso-surface (blue squares in Figure 6b), which the authors use to image the magmatic body (see Figure 3 from Farrell et al. [1]); our sill seems to be shallower beneath the north-eastern part of the caldera, where the distribution has increasing intensity (see Figure 2 and Figure 3 from Farrell et al. [1]). We specify that the match with this velocity model is imperfect, as the X-X’ section does not overlap with the maximum deformation area, where the multiscale analysis has been performed. The retrieved findings also agree with results achieved by joint modeling of P-wave travel time, gravity, and magneto-telluric data [56,57], where the investigated physical properties distribution images a single deep body similar to the proposed one. Unlike some studies [1,56,57], our model does not find source upwelling beneath the eastern part of the caldera, mainly associated with fluid migration at HSB, since we do not detect anomalous distributions of the physical parameters of the crust.
We make other comments about the proposed source modeling at the area of the resurgent domes, which is consistent with other geodetic studies analyzing the same uplift episode [21,33,34]. For instance, Delgado and Grandin [21] have highlighted a deformation source consisting of about 50 20 km2 distributed rectangular opening, whose magnitude increases up to 40 cm, at a depth of 8.7 km b.s.l. (Figure 6). This model [21] is retrieved through parametric inverse methods applied to a down-sampled dataset and by a priori fixing the source type, its strike and dip, and subsequently its depth and extent, while our modeling strategy has provided similar results but without involving a priori and constraining information. The proposed model agrees with the work of Delgado and Grandin [21] except for the sill opening distribution, whose figure deviates from the shallower morphology of our retrieved source. Specifically, while the previously published model [21] has highlighted zones between the domes and between SC and HSB as the areas of more intense uplift, our approach has imaged a magmatic deformation source with irregular geometry that is shallower just beneath the domes. We remark that our results better approximate the volcanic body, entailing a more realistic estimate of the source volume with respect to previous geodetic solutions consisting either of two different bodies beneath the resurgent domes (e.g., [6]) or one planar sill-like source with differential opening (e.g., [21]). The imaged morphology of the deformation source at Yellowstone caldera indicates that the magmatic body is shallower beneath SC, representing the area of more intense uplift.
5. Conclusions
We conclude that the method flexibility makes it ideal for modeling InSAR data in any volcanic area. Further studies can show the crucial role of the proposed approach in providing information that constrains parameters during optimization procedures, allowing the retrieval of a more reliable geodetic model.
Finally, we remark that the integrated multiscale approach is fast and not overly computationally expensive to be used for monitoring purposes. We intend, as the next step, to use multiscale methods to evaluate the evolution in the space and time of deformation sources during volcanic unrest.
Supplementary Materials
The following supporting information can be downloaded at: https://www.mdpi.com/article/10.3390/rs14215328/s1.
Author Contributions
A.B.: conceptualization, validation, writing the original draft. A.P.: data curation, review and editing; P.T.: conceptualization, supervision, review and editing; M.F.: conceptualization, supervision, review and editing. R.C.: conceptualization, supervision, review and editing. All authors have read and agreed to the published version of the manuscript.
Funding
This work has been supported by the project DTA.AD003.433–PRIN 2017–FLUIDs and DTA.AD004.065 “Sviluppo e applicazioni di metodi geofisici basati sull’uso di dati di telerilevamento ambientale”.
Data Availability Statement
Datasets can be accessed by contacting the corresponding author.
Acknowledgments
The authors would like to thank Jamie Farrell, who has provided the data of the P-wave velocity model of Yellowstone caldera. We would like also to thank three anonymous reviewers for their interesting suggestions and comments.
Conflicts of Interest
The authors declare no conflict of interest.
References
- Farrell, J.; Smith, R.B.; Husen, S.; Diehl, T. Tomography from 26 years of seismicity revealing that the spatial extent of the Yellowstone crustal magma reservoir extends well beyond the Yellowstone caldera. Geophys. Res. Lett. 2014, 41, 3068–3073. [Google Scholar] [CrossRef]
- Fedi, M.; Cella, F.; D’Antonio, M.; Florio, G.; Paoletti, V.; Morra, V. Gravity modeling finds a large magma body in the deep crust below the Gulf of Naples, Italy. Sci. Rep. 2018, 8, 8229. [Google Scholar] [CrossRef] [PubMed]
- Vitale, A.; Fedi, M. Self-constrained inversion of potential fields through a 3D depth weighting. Geophysics 2020, 85, G143–G156. [Google Scholar] [CrossRef]
- Castaldo, R.; Tizzani, P.; Solaro, G. Inflating Source Imaging and Stress/Strain Field Analysis at Campi Flegrei Caldera: The 2009–2013 Unrest Episode. Remote Sens. 2021, 13, 2298. [Google Scholar] [CrossRef]
- Rodríguez-Molina, S.; González, P.J.; Charco, M.; Negredo, A.M.; Schmidt, D.A. Time-Scales of Inter-Eruptive Volcano Uplift Signals: Three Sisters Volcanic Center, Oregon (United States). Front. Earth Sci. 2021, 8, 577588. [Google Scholar] [CrossRef]
- Tizzani, P.; Battaglia, M.; Castaldo, R.; Pepe, A.; Zeni, G.; Lanari, R. Magma and fluid migration at Yellowstone Caldera in the last three decades inferred from InSAR, leveling, and gravity measurements. J. Geophys. Res. Solid Earth 2015, 120, 2627–2647. [Google Scholar] [CrossRef]
- Pepe, S.; De Siena, L.; Barone, A.; Castaldo, R.; D’Auria, L.; Manzo, M.; Casu, F.; Fedi, M.; Lanari, R.; Bianco, F.; et al. Volcanic structures investigation through SAR and seismic interferometric methods: The 2011–2013 Campi Flegrei unrest episode. Remote Sens. Environ. 2019, 234, 111440. [Google Scholar] [CrossRef]
- Gola, G.; Barone, A.; Castaldo, R.; Chiodini, G.; D’Auria, L.; García-Hernández, R.; Pepe, S.; Solaro, G.; Tizzani, P. A Novel Multidisciplinary Approach for the Thermo-Rheological Study of Volcanic Areas: The Case Study of Long Valley Caldera. J. Geophys. Res. Solid Earth 2021, 126, e2020JB020331. [Google Scholar] [CrossRef]
- Gabriel, A.K.; Goldstein, R.M.; Zebker, H.A. Mapping small elevation changes over large areas: Differential radar interferometry. J. Geophys. Res. Earth Surf. 1989, 94, 9183–9191. [Google Scholar] [CrossRef]
- Massonnet, D.; Rossi, M.; Carmona, C.; Adragna, F.; Peltzer, G.; Feigl, K.; Rabaute, T. The displacement field of the Landers earthquake mapped by radar interferometry. Nature 1993, 364, 138–142. [Google Scholar] [CrossRef]
- Battaglia, M.; Cervelli, P.F.; Murray, J.R. dMODELS: A MATLAB software package for modeling crustal deformation near active faults and volcanic centers. J. Volcanol. Geotherm. Res. 2013, 254, 1–4. [Google Scholar] [CrossRef]
- Mogi, K. Relation between eruptions of various volcanoes and the deformations of ground surfaces around them. Bull. Earthq. Res. Institute Univ. Tokio 1958, 36, 99–134. [Google Scholar]
- Sun, R.J. Theoretical size of hydraulically induced horizontal fractures and corresponding surface uplift in an idealized medium. J. Geophys. Res. Earth Surf. 1969, 74, 5995–6011. [Google Scholar] [CrossRef]
- Geerstma, J.; van Opstal, K. A numerical technique for predicting subsidence above compacting reservoirs, based on the nucleus of strain concept. Verhandelingen Kon. Ned. Geol. Mijnbouwk. Gen. 1973, 28, 63–78. [Google Scholar]
- Okada, Y. Surface deformation due to shear and tensile faults in a half-space. Bull. Seismol. Soc. Am. 1985, 75, 1135–1154. [Google Scholar] [CrossRef]
- McTigue, D.F. Elastic stress and deformation near a finite spherical magma body: Resolution of the point source paradox. J. Geophys. Res. Earth Surf. 1987, 92, 12931–12940. [Google Scholar] [CrossRef]
- Yang, X.-M.; Davis, P.M.; Dieterich, J.H. Deformation from inflation of a dipping finite prolate spheroid in an elastic half-space as a model for volcanic stressing. J. Geophys. Res. Earth Surf. 1988, 93, 4249–4257. [Google Scholar] [CrossRef]
- Bonaccorso, A.; Davis, P.M. Models of ground deformation from vertical volcanic conduits with application to eruptions of Mount St. Helens and Mount Etna. J. Geophys. Res. Earth Surf. 1999, 104, 10531–10542. [Google Scholar] [CrossRef]
- Fialko, Y.; Khazan, Y.; Simons, M. Deformation due to a pressurized horizontal circular crack in an elastic half-space, with applications to volcano geodesy. Geophys. J. Int. 2001, 146, 181–190. [Google Scholar] [CrossRef]
- D’Auria, L.; Pepe, S.; Castaldo, R.; Giudicepietro, F.; Macedonio, G.; Ricciolino, P.; Tizzani, P.; Casu, F.; Lanari, R.; Manzo, M.; et al. Magma injection beneath the urban area of Naples: A new mechanism for the 2012–2013 volcanic unrest at Campi Flegrei caldera. Sci. Rep. 2015, 5, 13100. [Google Scholar] [CrossRef]
- Delgado, F.; Grandin, R. Dynamics of Episodic Magma Injection and Migration at Yellowstone Caldera: Revisiting the 2004–2009 Episode of Caldera Uplift with InSAR and GPS Data. J. Geophys. Res. Solid Earth 2021, 126, e2021JB022341. [Google Scholar] [CrossRef]
- Camacho, A.G.; Fernández, J.; Samsonov, S.V.; Tiampo, K.F.; Palano, M. 3D multi-source model of elastic volcanic ground deformation. Earth Planet. Sci. Lett. 2020, 547, 116445. [Google Scholar] [CrossRef]
- Castaldo, R.; Barone, A.; Fedi, M.; Tizzani, P. Multiridge Method for Studying Ground-Deformation Sources: Application to Volcanic Environments. Sci. Rep. 2018, 8, 13420. [Google Scholar] [CrossRef]
- Barone, A.; Fedi, M.; Tizzani, P.; Castaldo, R. Multiscale Analysis of DInSAR Measurements for Multi-Source Investigation at Uturuncu Volcano (Bolivia). Remote Sens. 2019, 11, 703. [Google Scholar] [CrossRef]
- Barone, A.; Fedi, M.; Pepe, S.; Solaro, G.; Tizzani, P.; Castaldo, R. Modeling the Deformation Sources in Volcanic Environments Through Multi-Scale Analysis of DInSAR Measurements. Front. Earth Sci. 2022, 10, 859479. [Google Scholar] [CrossRef]
- Blakely, J.R. The potential, Consequences of the Potential, Transformations. In Potential Theory in Gravity and Magnetic Applications; Cambridge University Press: Cambridge, UK, 1996. [Google Scholar]
- Olmsted, J.M.A. Advanced Calculus, 1st ed.; Prentice-Hall: Hoboken, NJ, USA, 1961. [Google Scholar]
- Fedi, M.; Florio, G.; Quarta, T.A. Multiridge analysis of potential fields: Geometric method and reduced Euler deconvolution. Geophysics 2009, 74, L53–L65. [Google Scholar] [CrossRef]
- Fedi, M. DEXP: A fast method to determine the depth and the structural index of potential fields sources. Geophysics 2007, 72, I1–I11. [Google Scholar] [CrossRef]
- Fedi, M.; Florio, G.; Paoletti, V. MHODE: A local-homogeneity theory for improved source-parameter estimation of potential fields. Geophys. J. Int. 2015, 202, 887–900. [Google Scholar] [CrossRef]
- Love, A.E.H. A Treatise on the Mathematical Theory of Elasticity, 2nd ed.; Cambridge University Press: Cambridge, UK, 1906. [Google Scholar]
- Gerovska, D.; Stavrev, P. Finite-difference Euler Deconvolution Algorithm Applied to the Interpretation of Magnetic Data from Northern Bulgaria. Pure Appl. Geophys. 2005, 162, 591–608. [Google Scholar] [CrossRef]
- Chang, W.-L.; Smith, R.B.; Wicks, C.; Farrell, J.M.; Puskas, C.M. Accelerated Uplift and Magmatic Intrusion of the Yellowstone Caldera, 2004 to 2006. Science 2007, 318, 952–956. [Google Scholar] [CrossRef]
- Chang, W.-L.; Smith, R.B.; Farrell, J.; Puskas, C.M. An extraordinary episode of Yellowstone caldera uplift, 2004-2010, from GPS and InSAR observations. Geophys. Res. Lett. 2010, 37, L23302. [Google Scholar] [CrossRef]
- Aly, M.H.; Cochran, E.S. Spatio-temporal evolution of Yellowstone deformation between 1992 and 2009 from InSAR and GPS observations. Bull. Volcanol. 2011, 73, 1407–1419. [Google Scholar] [CrossRef]
- Sadd, M.H. Elasticity Theory, Applications, and Numerics; Elsevier: Berkeley, CA, USA, 2005. [Google Scholar]
- Milano, M.; Fedi, M.; Fairhead, J.D. The deep crust beneath the Trans-European Suture Zone from a multiscale magnetic model. J. Geophys. Res. Solid Earth 2016, 121, 6276–6292. [Google Scholar] [CrossRef]
- Paoletti, V.; Milano, M.; Baniamerian, J.; Fedi, M. Magnetic Field Imaging of Salt Structures at Nordkapp Basin, Barents Sea. Geophys. Res. Lett. 2020, 47, e2020GL089026. [Google Scholar] [CrossRef]
- Ridsdill-Smith, T.A.; Dentith, M. The wavelet transform in aeromagnetic processing. Geophysics 1999, 64, 1003–1013. [Google Scholar] [CrossRef]
- Cella, F.; Fedi, M. High-Resolution Geophysical 3D Imaging for Archaeology by Magnetic and EM data: The Case of the Iron Age Settlement of Torre Galli, Southern Italy. Surv. Geophys. 2015, 36, 831–850. [Google Scholar] [CrossRef]
- Paoletti, V.; Fedi, M.; Florio, G. Magnetic Structure of the Ischia volcanic island, Southern Italy. Ann. Geophys. 2017, 60, 674. [Google Scholar] [CrossRef]
- Christiansen, R.L. The Quaternary and Pliocene Yellowstone Plateau Volcanic Field of Wyoming, Idaho, and Montana; USGS: Reston, VA, USA, 2001. [Google Scholar]
- Fournier, R.O. Geochemistry and Dynamics of the Yellowstone National Park Hydrothermal System. Annu. Rev. Earth Planet. Sci. 1989, 17, 13–53. [Google Scholar] [CrossRef]
- Berardino, P.; Fornaro, G.; Lanari, R.; Sansosti, E. A new algorithm for surface deformation monitoring based on small baseline differential SAR interferograms. IEEE Trans. Geosci. Remote Sens. 2002, 40, 2375–2383. [Google Scholar] [CrossRef]
- Rosen, P.A.; Hensley, S.; Gurrola, E.; Rogez, F.; Chan, S.; Martin, J.; Rodriguez, E. SRTM C-band topographic data: Quality assessments and calibration activities. In Proceedings of the IEEE 2001 International Geoscience and Remote Sensing Symposium (Cat. No.01CH37217), Sydney, NSW, Australia, 9–13 July 2001. [Google Scholar] [CrossRef]
- Rosen, P.A.; Hensley, S.; Joughin, I.R.; Li, F.K.; Madsen, S.N.; Rodriguez, E.; Goldstein, R.M. Synthetic aperture radar interferometry. Proc. IEEE 2000, 88, 333–382. [Google Scholar] [CrossRef]
- Yang, Y.; Pepe, A.; Manzo, M.; Bonano, M.; Liang, D.N.; Lanari, R. A simple solution to mitigate noise effects in time-redundant sequences of small baseline multi-look DInSAR interferograms. Remote Sens. Lett. 2013, 4, 609–618. [Google Scholar] [CrossRef]
- Pepe, A. Theory and Statistical Description of the Enhanced Multi-Temporal InSAR (E-MTInSAR) Noise-Filtering Algorithm. Remote Sens. 2019, 11, 363. [Google Scholar] [CrossRef]
- Pepe, A.; Yang, Y.; Manzo, M.; Lanari, R. Improved EMCF-SBAS Processing Chain Based on Advanced Techniques for the Noise-Filtering and Selection of Small Baseline Multi-Look DInSAR Interferograms. IEEE Trans. Geosci. Remote Sens. 2015, 53, 4394–4417. [Google Scholar] [CrossRef]
- Festa, D.; Bonano, M.; Casagli, N.; Confuorto, P.; De Luca, C.; Del Soldato, M.; Lanari, R.; Lu, P.; Manunta, M.; Manzo, M.; et al. Nation-wide mapping and classification of ground deformation phenomena through the spatial clustering of P-SBAS InSAR measurements: Italy case study. ISPRS J. Photogramm. Remote Sens. 2022, 189, 1–22. [Google Scholar] [CrossRef]
- Monterroso, F.; Antonioli, A.; Atzori, S.; de Luca, C.; Lanari, R.; Manunta, M.; Valerio, E.; Casu, F. New advances of the P-SBAS based automatic and unsupervised tool for the co-seismic Sentinel-1 DInSAR products generation. In Proceedings of the EGU General Assembly 2022, Vienna, Austria, 23–27 May 2022. [Google Scholar] [CrossRef]
- Manunta, M.; De Luca, C.; Zinno, I.; Casu, F.; Manzo, M.; Bonano, M.; Fusco, A.; Pepe, A.; Onorato, G.; Berardino, P.; et al. The Parallel SBAS Approach for Sentinel-1 Interferometric Wide Swath Deformation Time-Series Generation: Algorithm Description and Products Quality Assessment. IEEE Trans. Geosci. Remote Sens. 2019, 57, 6259–6281. [Google Scholar] [CrossRef]
- Pepe, A.; Lanari, R. On the Extension of the Minimum Cost Flow Algorithm for Phase Unwrapping of Multitemporal Differential SAR Interferograms. IEEE Trans. Geosci. Remote Sens. 2006, 44, 2374–2383. [Google Scholar] [CrossRef]
- Pepe, A.; Solaro, G.; Calo, F.; Dema, C. A Minimum Acceleration Approach for the Retrieval of Multiplatform InSAR Deformation Time Series. IEEE J. Sel. Top. Appl. Earth Obs. Remote Sens. 2016, 9, 3883–3898. [Google Scholar] [CrossRef]
- Pepe, A.; Calò, F. A Review of Interferometric Synthetic Aperture RADAR (InSAR) Multi-Track Approaches for the Retrieval of Earth’s Surface Displacements. Appl. Sci. 2017, 7, 1264. [Google Scholar] [CrossRef]
- Jorgensen, M.; Zhdanov, M. Imaging Yellowstone magmatic system by the joint Gramian inversion of gravity and magnetotelluric data. Phys. Earth Planet. Inter. 2019, 292, 12–20. [Google Scholar] [CrossRef]
- Tu, X.; Zhdanov, M.S. Joint Gramian inversion of geophysical data with different resolution capabilities: Case study in Yellowstone. Geophys. J. Int. 2021, 226, 1058–1085. [Google Scholar] [CrossRef]
Publisher’s Note: MDPI stays neutral with regard to jurisdictional claims in published maps and institutional affiliations. |
© 2022 by the authors. Licensee MDPI, Basel, Switzerland. This article is an open access article distributed under the terms and conditions of the Creative Commons Attribution (CC BY) license (https://creativecommons.org/licenses/by/4.0/).

